Article

Study on VIV Behavior of Two 5:1 Rectangular Cylinders in Tandem Based on Correlation Analysis

1
Department of Bridge Engineering, Tongji University, 1239 Siping Road, Shanghai 200092, China
2
Shandong Provincial Communications Planning and Design Institute Group Co., Ltd., 2177 Tianchen Road, Jinan 250031, China
3
Suzhou Tongyao Civil Technology Co., Ltd., 2 Hushan Road, Changshu 215533, China
*
Author to whom correspondence should be addressed.
Buildings 2024, 14(1), 85; https://doi.org/10.3390/buildings14010085
Submission received: 7 March 2023 / Revised: 11 December 2023 / Accepted: 25 December 2023 / Published: 28 December 2023
(This article belongs to the Special Issue Improvement Technology on Building Seismic Toughness)

Abstract

:
To investigate the vortex-induced vibration (VIV) characteristics of two rectangular cylinders with a width-to-depth ratio of 5:1 in a tandem arrangement, sectional model wind tunnel tests that measure vibration responses and pressure distributions simultaneously were adopted. The ratio of the spacing between the cylinders to its width is 1.2. The analyses were performed considering VIV responses as well as the distribution characteristics of mean and rms pressure coefficients. Additionally, the time-frequency domain statistical parameters like correlation and contribution coefficients, phase lags between distributed and general vortex excited forces (VEFs), and amplitudes of VEF coefficients at predominant frequencies were calculated to analyze the physical VIV mechanism of two 5:1 rectangular cylinders in tandem. This study indicates that the influence of incidence angles on the dynamic responses is notable; the contribution of the distributed VEFs acting on the trailing surface of the upstream cylinder and the leading surface of the downstream one is significant to VIVs of the cylinders from wind pressure distribution characteristics and correlation analyses.

1. Introduction

The aerodynamic interference of square and rectangular columns has attracted considerable scientific interest in the wind engineering field since the sections are very common in sharp-edged bluff bodies. Therefore, a lot of research was carried out to investigate the mean force coefficients, surface pressure coefficients, and Strouhal numbers, as well as the surface pressure coherence and cross-spectrum of square or rectangular columns [1,2,3]. In addition, Shimada and Ishihara (2002) analyzed the aerodynamic characteristics of rectangular cylinders with aspect ratios varying from 0.8 to 8.0 using a modified two-layer k-ε model in CFD simulations, and the results indicate that aspect ratios play an important role in the flow regime of rectangular cylinders [4]. Furthermore, to deeply investigate the aerodynamic performance of the bluff bodies, a benchmark on the aerodynamics of a rectangular 5:1 cylinder (BARC) was launched in 2008. The span-wise correlation of the pressure and aerodynamic forces on BARC and the impact of incidence angles, Reynolds-number sensitivity, as well as turbulence intensity of free-flow were analyzed using numerical simulations and wind tunnel tests [5,6,7,8,9,10,11,12,13,14,15]. Additionally, a very detailed overview of previous research was presented by Bruno et al. (2014) [16]. These studies can provide useful information on the aerodynamic behavior of rectangular cylinders in tandem with the present paper.
However, the above pieces of research were confined to single rectangular cylinders. As we know, the aerodynamic performance of twin rectangular cylinders plays an important guiding role in the analysis of wind-induced behavior of twin-deck sections in bridge aerodynamics. The studies of a group of rectangular (or square) cylinders in a tandem arrangement have been carried out in a lot of studies, that is, through wind tunnel experiments [17,18,19,20,21] and numerical simulations [22,23,24,25,26,27,28,29]. Moreover, the research on vortex dynamics of square cylinders placed in a staggered arrangement was carried out by Chatterjee and Biswas (2015) [30]. However, less research is focused on the vortex-induced vibration (VIV) behavior of twin rectangular cylinders, though this type of wind-induced phenomenon of twin-deck sections is of extensive concern in the wind engineering field, especially in bridge aerodynamics. In previous research [31], we analyzed the pressure and force distribution on a twin in-line arrangement of twin 5:1 rectangular sections at different gaps. A proper orthogonal decomposition (POD) technique was adopted to analyze the fluctuating wind pressure field around the cylinders under wind velocities corresponding to the maximum VIV amplitudes; the results indicated that the gap distance has a critically important impact on the VIV behavior of twin rectangular cylinders. In addition, POD analysis indicates that the first mode is dominant to the VIVs of the downstream cylinder, while the second mode is closely related to the VIVs of the upstream one.
In the present study, the VIV behavior of two 5:1 rectangular cylinders in tandem is further studied. The VIV responses, mean and rms pressure distributions, as well as the correlation between distributed and general vortex-excited forces (VEFs) are analyzed. This study can provide some useful information on the analysis of aerodynamic interference of parallel bridges.

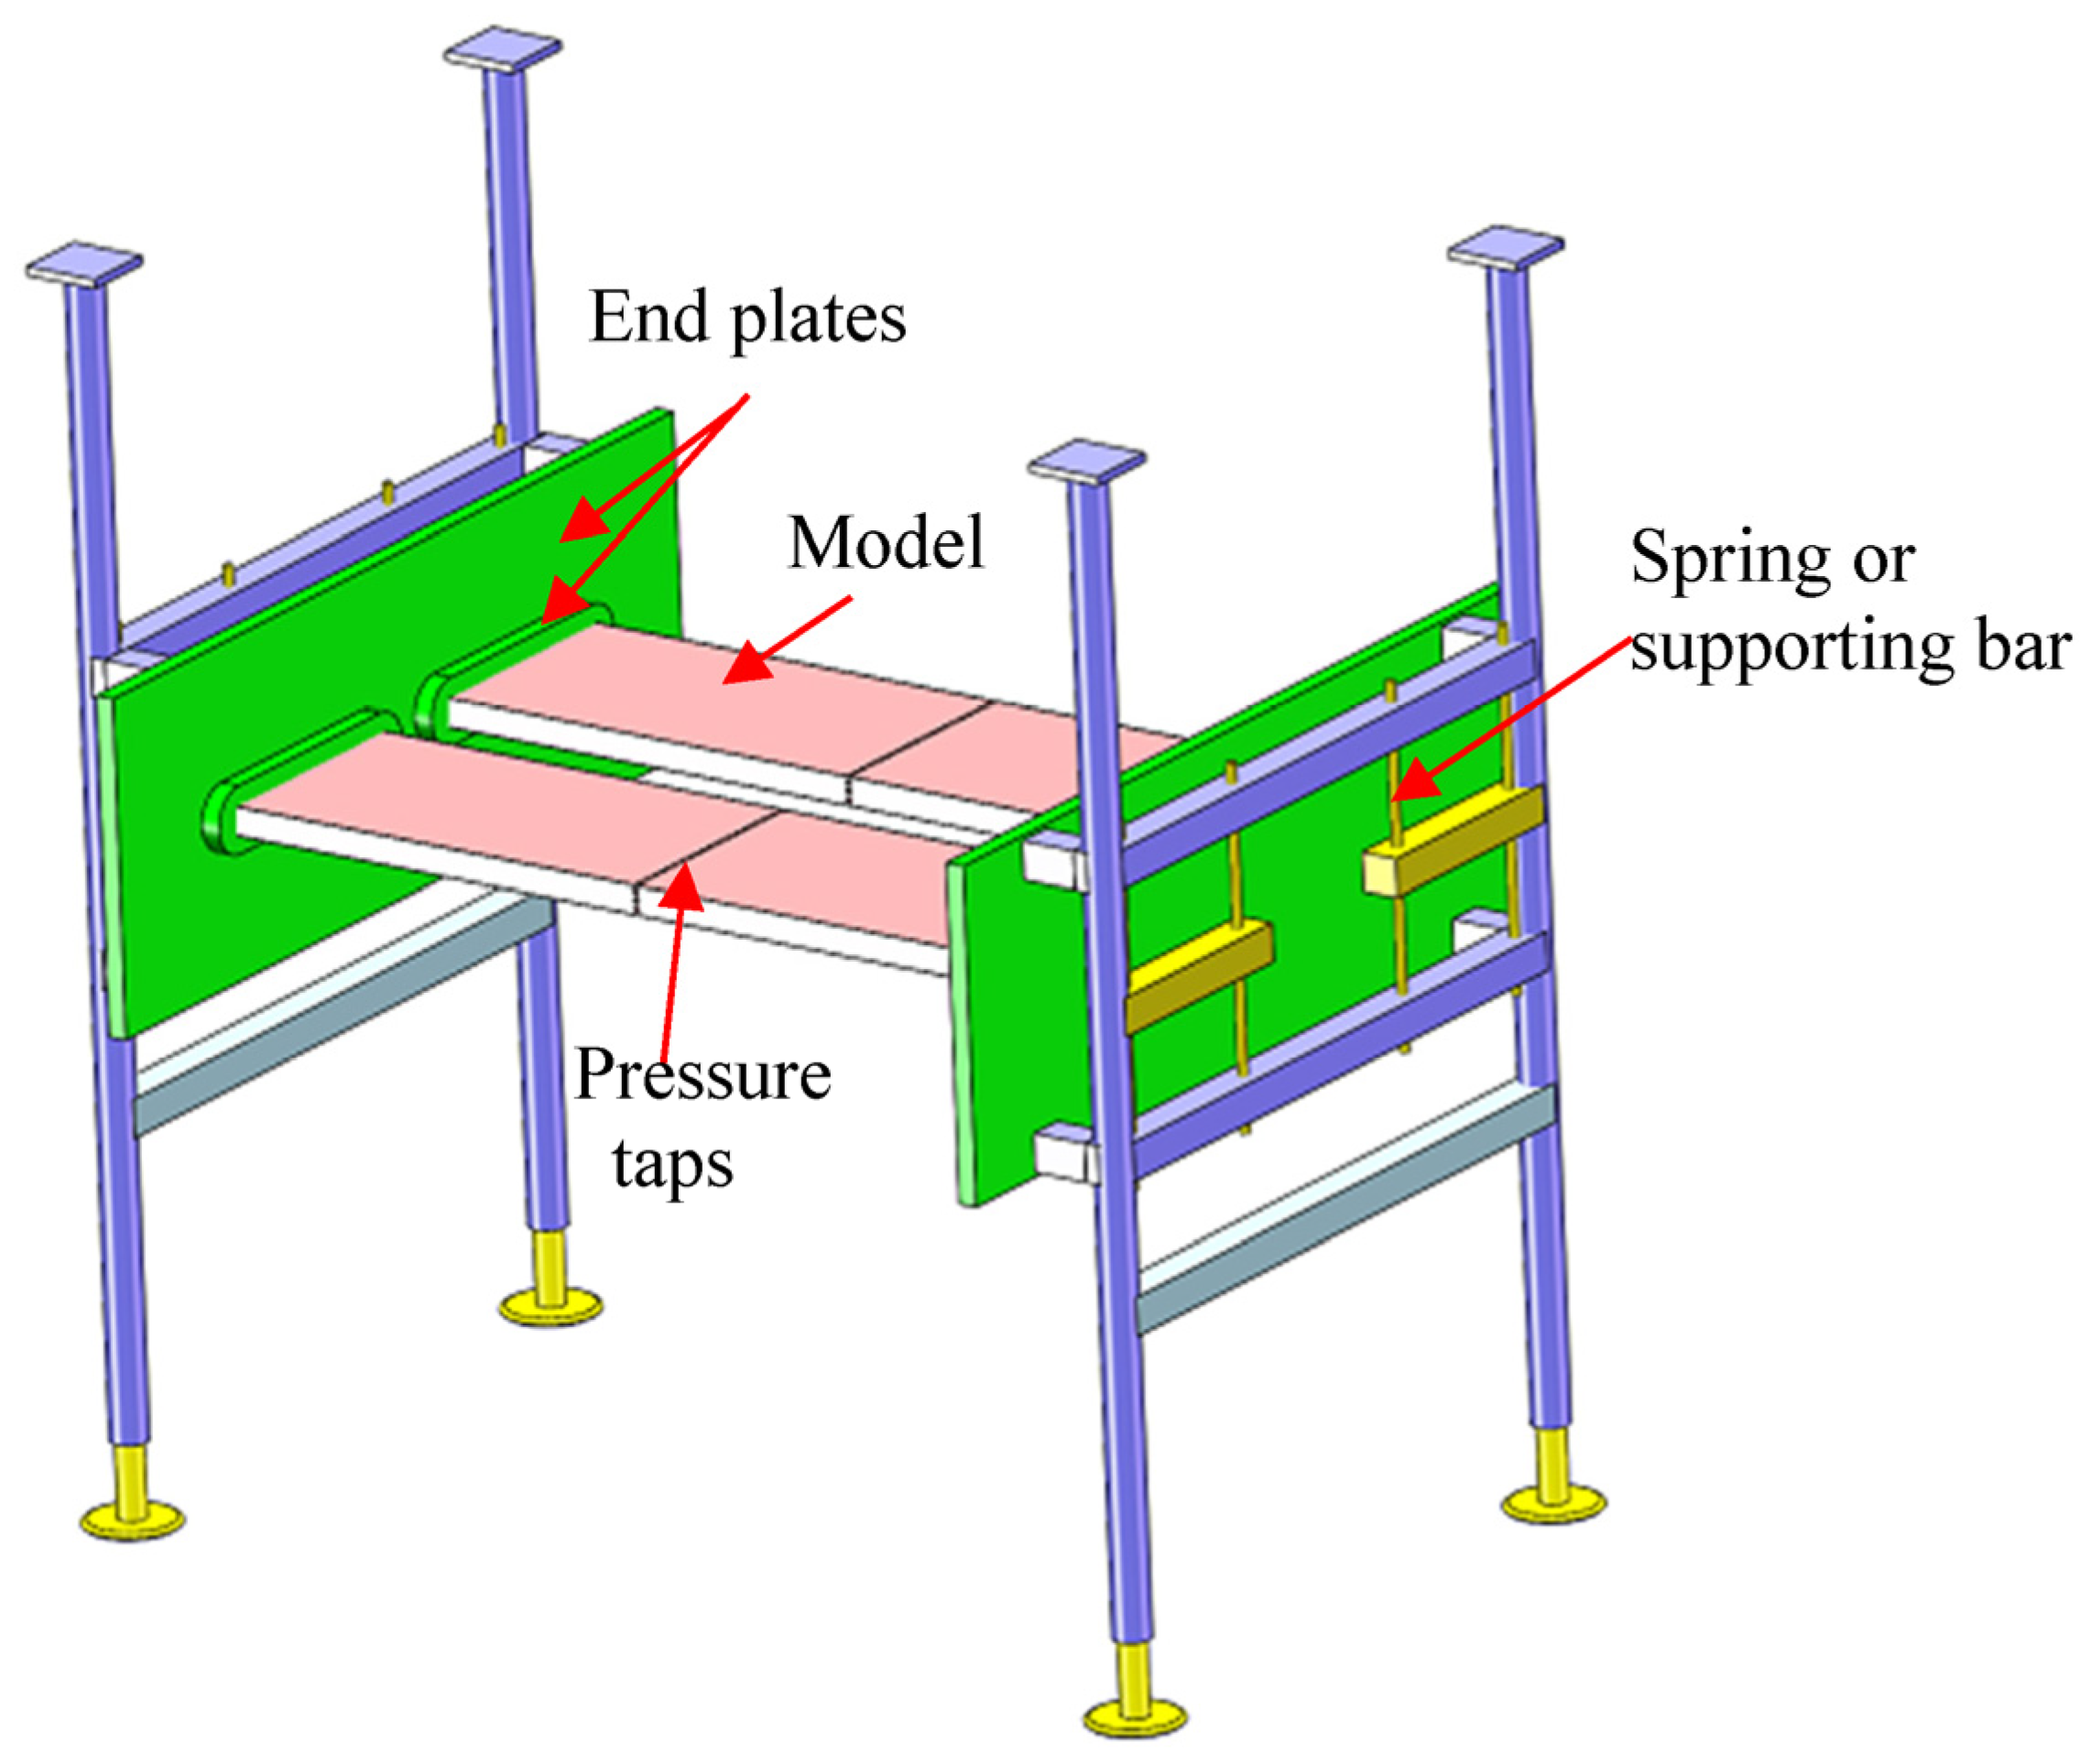
2. Wind Tunnel Tests

The sectional model vibration and pressure measurement tests were conducted in uniform flow, and the turbulence intensity was less than 0.4% without turbulence-generating devices. Each cylinder was supported separately by eight coil springs that permit both heaving and torsional oscillations, and the stiffness of the springs as well as their spacings were designed to simulate the natural frequencies of vibration. The sketch of the testing model is depicted in Figure 1. The VIV responses were obtained through vibration measurement tests within a certain inflow velocity range. Pressures around the cylinders were measured using the DSM3000 Scanivalve system (Scanivalve Corporation, Washington, DC, USA). A sampling frequency of 300 Hz and a sampling interval of 40 s was adopted to collect data.
In the tests, each cylinder is 1.7 m in length; the width-to-depth ratio (W/D) of each model is 5:1, that is, W equals 300 mm and D equals 60 mm. The Reynolds numbers are defined as Re = UB/ν, where U is the wind velocity and ν is the kinematic viscosity. The Reynolds numbers are 5.9 × 10⁴ (U = 2.9 m/s), 7.3 × 10⁴ (U = 3.6 m/s), and 1.0 × 10⁵ (U = 5.0 m/s), respectively. Since the blockage ratio defined by the ratio between the height of the model to that of the wind tunnel test section is only 2.4%, no blockage correction was applied. The stiffness of the models is provided by longitudinal and transverse beams, which are covered by plate skins to simulate the appearance. The cylinders are characterized by sharp edges and smooth surfaces. For each model, 54 pressure taps were installed along the middle line to collect the pressure of its position. The fundamental bending and torsional natural frequencies are 3.997 and 8.221 Hz, and the corresponding damping ratios are 0.42% and 0.38%, respectively. The distributions of pressure taps and internal constitutions of each model are depicted in Figure 2.

3. Results of Wind Tunnel Tests

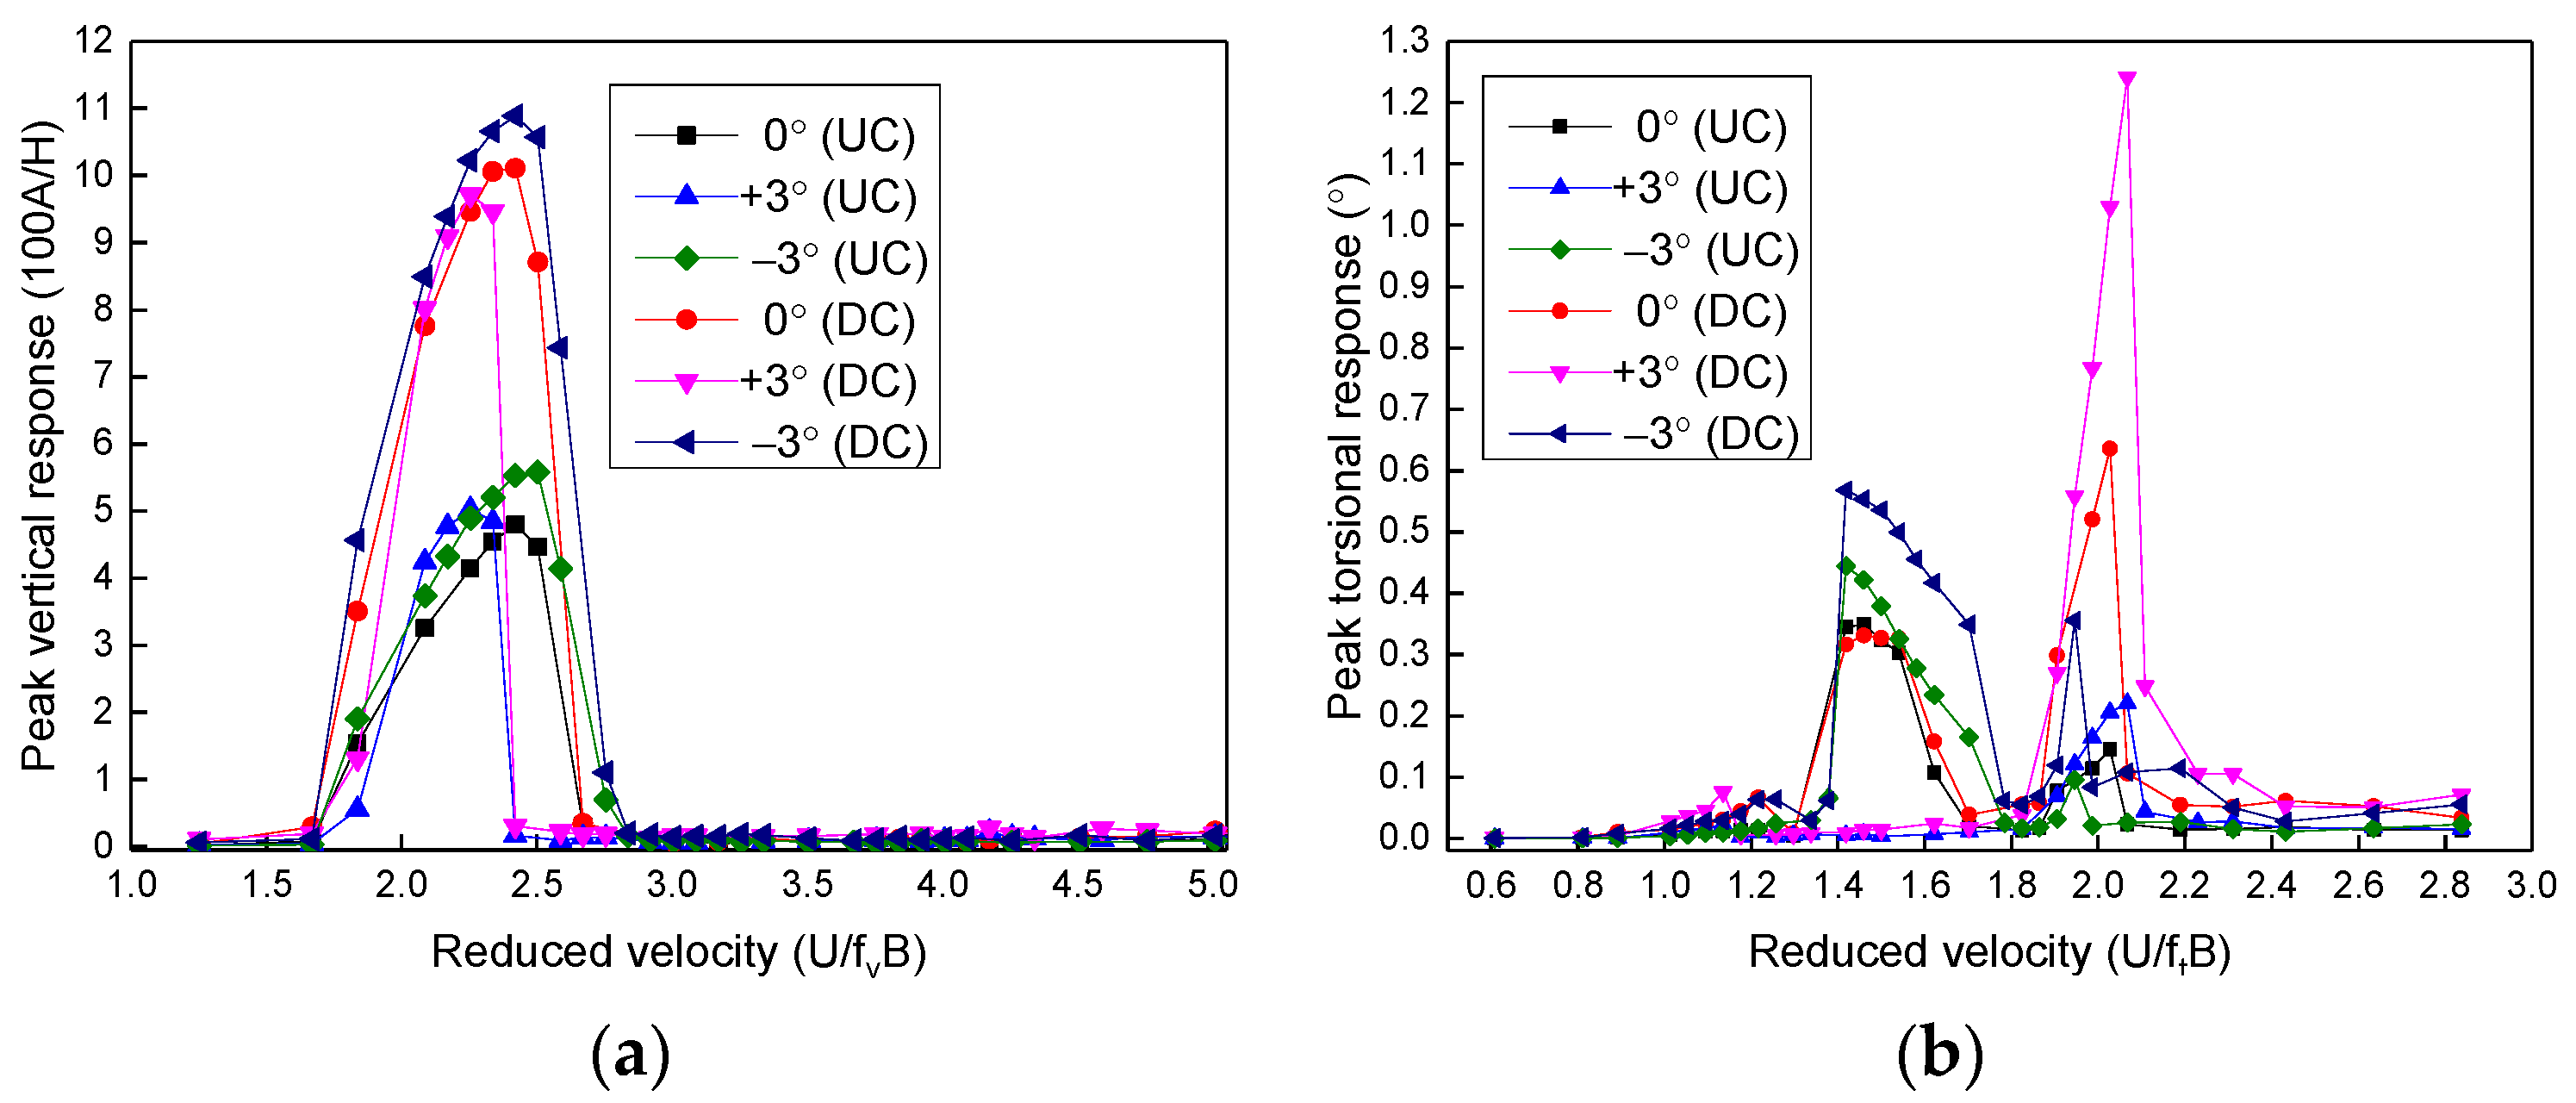
3.1. VIV Responses under Different Angles of Incidence

The dynamic tests of twin rectangular cylinders were conducted at three angles of incidence, that is, 0°, +3°, and −3°. The positive angle of incidence is defined as the inflow pointing at the bottom surface of the cylinder and vice versa. The spacing between them is 1.2 times the section width, which is the most unfavorable case according to our previous wind tunnel tests with various spacings [31]. The results of bending and torsional VIV responses are taken as the square root two times the rms values and are presented in Figure 3. The reduced wind velocities are defined as U/fvB and U/ftB for heaving and torsional VIVs, where U is the wind velocity and fv and ft are the natural frequency for heaving and torsional vibrations, respectively.
As shown from the heaving VIV responses of both cylinders, the starting wind velocities of both cylinders are identical for 0°, +3°, and −3° angles of incidence. The vibration amplitude is the largest at −3° for both cylinders. For the upstream cylinder (abbreviated as UC), the length of the lock-in region, the vibration amplitude, and the wind speed with the maximum response are the smallest at the null angle of incidence. The maximum amplitude decreases by 14% compared with that at −3°. For the downstream cylinder (abbreviated as DC), the lock-in region and the wind speed with the maximum response are identical for 0° and −3°. However, the velocities become lower for +3°, and the VIV amplitude reaches the minimum value, which decreases by 11% compared with that at −3°.
The lock-in regions for torsional VIVs are identical for both cylinders. There are two lock-in regions at 0° and −3°, that is, the range of U/ftB = 1.30–1.70 (the first lock-in region) and U/ftB = 1.86–2.07 (the second lock-in region). However, only a single lock-in region occurs at the +3° angle of incidence, which corresponds to the second one of the other two angles of incidence. For UC, the maximum VIV amplitudes reached in the first lock-in region are 0.35° and 0.44° at 0° and −3° angles of incidence, respectively, which are larger than that at +3°. The maximum VIV amplitudes reached in the second lock-in region are 0.14°, 0.1°, and 0.22° at 0°, −3°, and +3° angles of incidence, respectively. For DC, the peak amplitude in the first VIV region is 0.57° at the −3° incidence angle, which is approximately 1.7 times the value at the null angle of incidence (0.33°). However, for the second lock-in region, the maximum vibration amplitude of 0.64° is reached at 0° and is approximately 1.8 times the value of the −3° angle of incidence (0.36°), while it is only half the value of the +3° angle of incidence (1.24°).
As the results indicate, the effect of the incidence angle on VIV performance is complex. Generally, the bending VIV response is unfavorable at −3° for both UC and DC. The torsional VIV response for UC is larger at 0° and −3°, while a general trend can hardly be observed for DC.

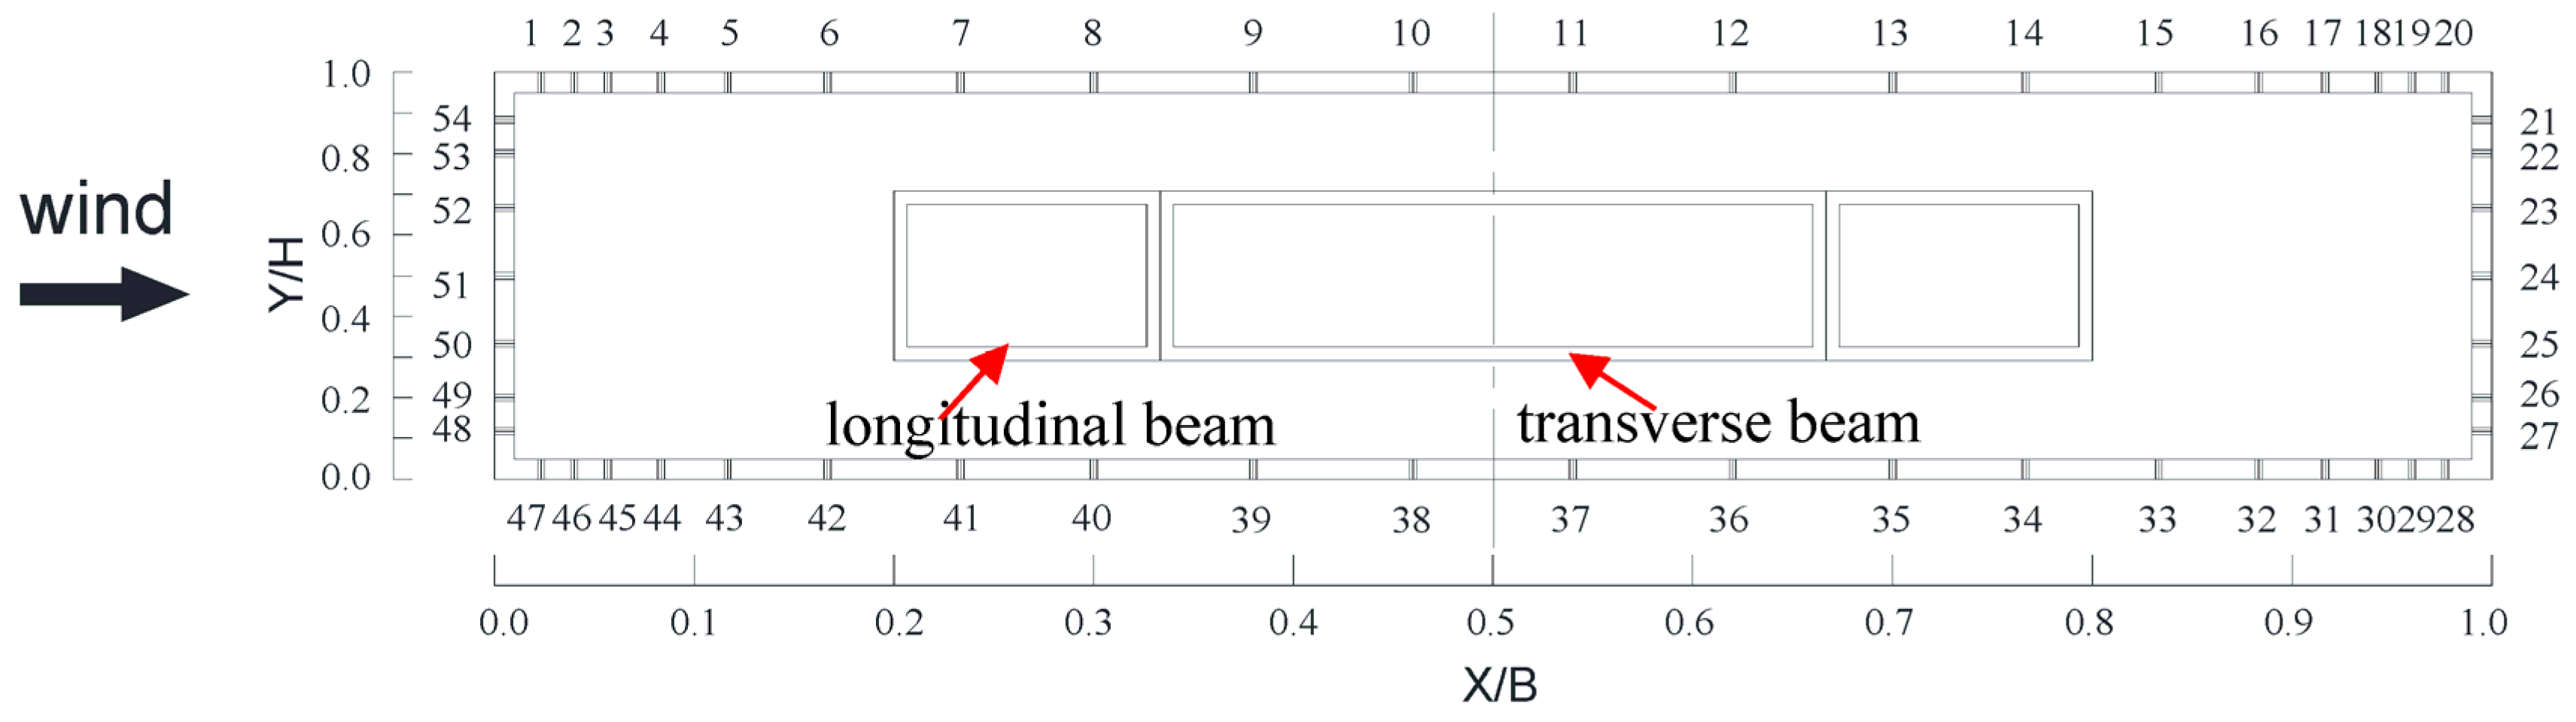
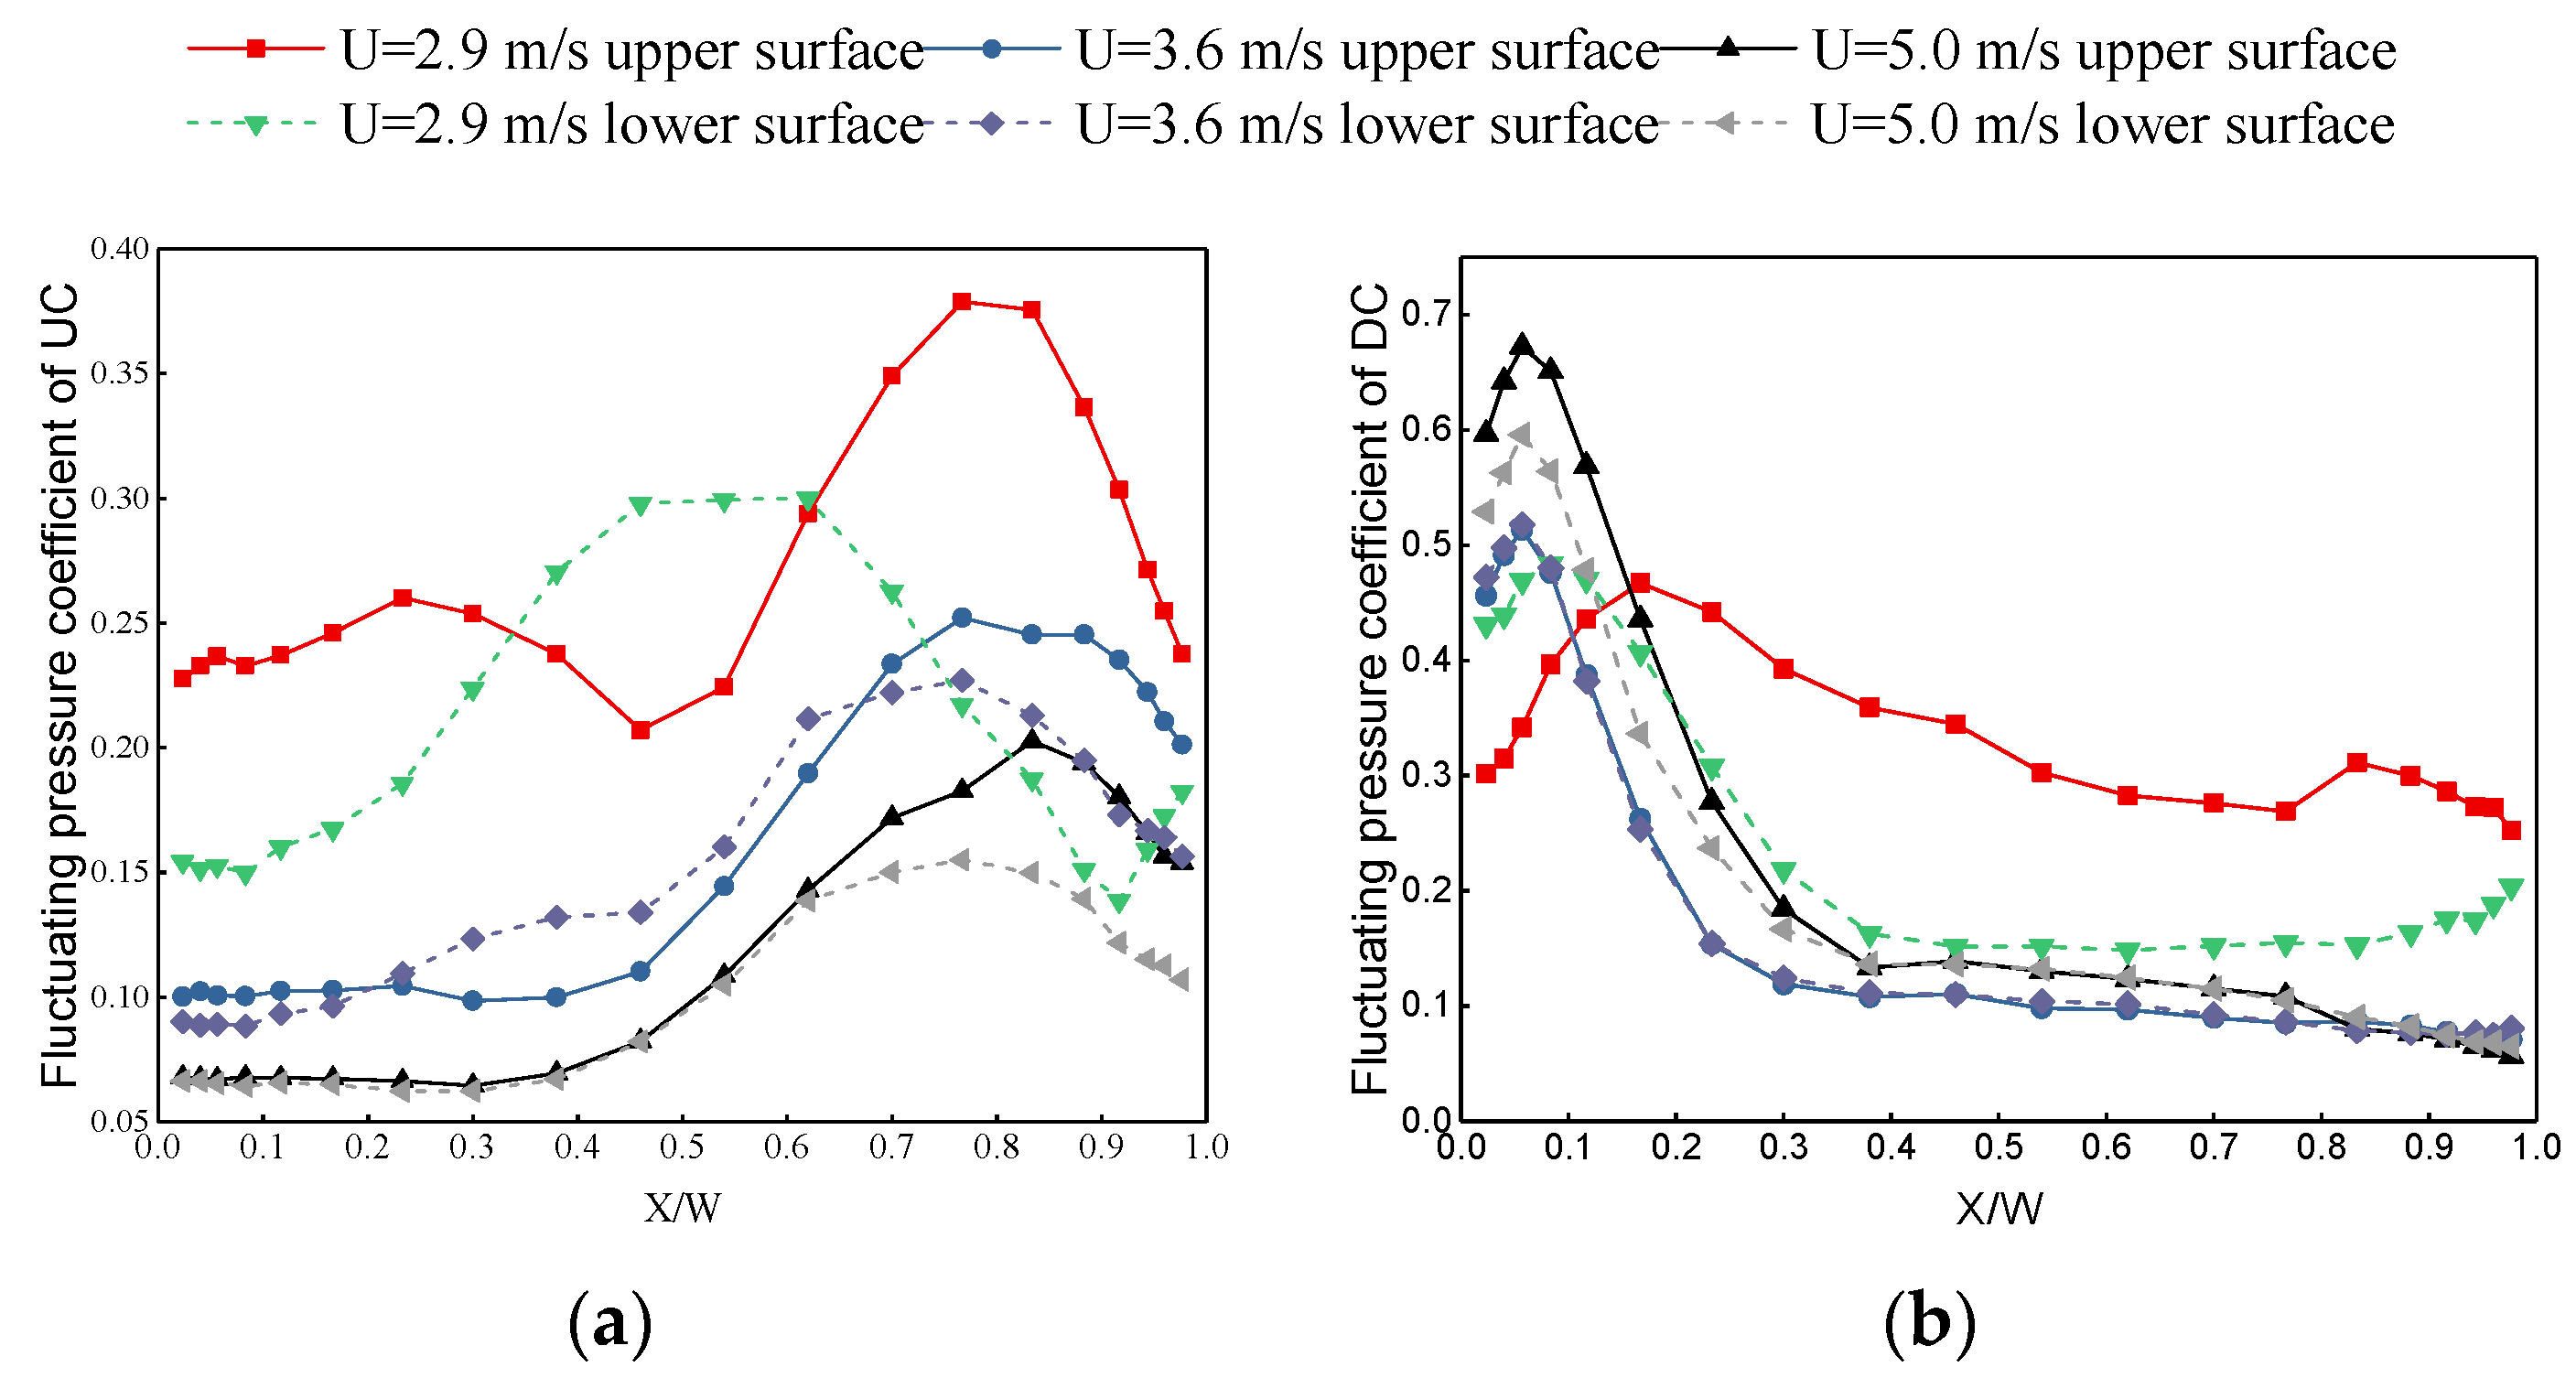
3.2. Results of Pressure Measurement

The pressure data are measured at the steady-state flow, and the turbulence intensity is less than 0.4%. During the pressure measurement testing, both upstream and downstream cylinders are free to oscillate in the flow. The tests were performed at the null angle of incidence and under discrete wind velocities corresponding to different VIVs. Three typical wind velocities were set during pressure measurement, that is, the wind speed of 2.9 m/s (U/fvB = 2.42) with the maximum bending VIVs and 3.6 m/s (U/ftB = 1.46) and 5.0 m/s (U/ftB = 2.03) with the peak torsional VIVs of the first and second lock-in regions. The mean and fluctuating pressure coefficients are defined as the time-average and rms values of the pressure data, respectively. The mean pressure coefficient distributions around the upstream and downstream cylinders are shown in Figure 4. According to our research, the pressure on the windward and leeward side faces has a minor effect on both bending and torsional VIVs. Therefore, the results only present the pressure distributions along the upper and lower surfaces of UC and DC; they are shown in Figure 4 and Figure 5. The pressure measurements of the present study have been validated by comparing the aerostatic coefficients with the results from previous researchers [31,32].
As the results show, the mean pressure coefficient (Cp) distributions along the upper surface are similar to those on the lower surface for both cylinders, whereas the absolute Cp values on the lower surface are smaller than the upper surface. Since the pressure was measured when the cylinders were experiencing vortex-induced vibrations, the reason why the upper and lower surface pressures obtained at the null angle of incidence took different values is explained. For UC, the Cp values remain constant in the position X/W ≤ 0.5, while the absolute values decrease steeply in the position X/W > 0.5 on both upper and lower surfaces. Additionally, the values in the region of X/W < 0.4 decreases as the wind speed increases; however, the trend is the opposite in the region of X/W > 0.4. Comparing the results under three wind velocities, the absolute value of Cp on the upper surface is smaller in the range of X/W < 0.54 for U = 5.0 m/s, while for X/W > 0.62, the value is at a minimum for U = 2.9 m/s. For DC, the difference between the Cp values is relatively minor and can be neglected compared with that of UC.
As for the fluctuating pressure coefficients ( C p ) on the upper and lower surfaces of the cylinders, the distributions are similar for U = 3.6 and 5.0 m/s. However, the values are larger under U = 3.6 m/s for UC, while the results are larger under U = 5.0 m/s for DC. The C p distributions under U = 2.9 m/s are dramatically different from that of U = 3.6 and 5.0 m/s. For UC, the values along the upper surface and in the range of X/W ≤ 0.7 along the lower surface are larger for U = 2.9 m/s compared with the other two velocities. The C p distributions on the upper surface show symmetry about the centerline for U = 2.9 m/s. However, the values along the lower surface increase in the range of 0.46 ≤ X/W < 0.8 and decrease in 0.8 ≤ X/W ≤ 1.0, which is similar to the trend under U = 3.6 and 5.0 m/s. Nevertheless, there still exists some difference between them; for U = 2.9 m/s, the values first increase steadily and then experience a comparatively sharp decrease in the leading region, and the maximum value is observed at the location of X/W ≈ 0.46; meanwhile, the C p values remain steady in this region for U = 3.6 and 5.0 m/s.
For DC, the C p values decline on the lower surface for U = 2.9 m/s, and the maximum value moves in the flow direction as compared with that of U = 3.6 and 5.0 m/s. The C p values decrease steadily along the trailing surface for all three velocities. The distributions on the lower surfaces at U = 2.9 m/s show some similarity with the results under the other two velocities; meanwhile, the values for U = 2.9 m/s are relatively larger in most regions. Above all, the results indicate that the dynamic pressure measurements should be carried out under corresponding wind velocities in order to investigate the pressure field when rectangular cylinders in tandem undergo different types of VIVs.

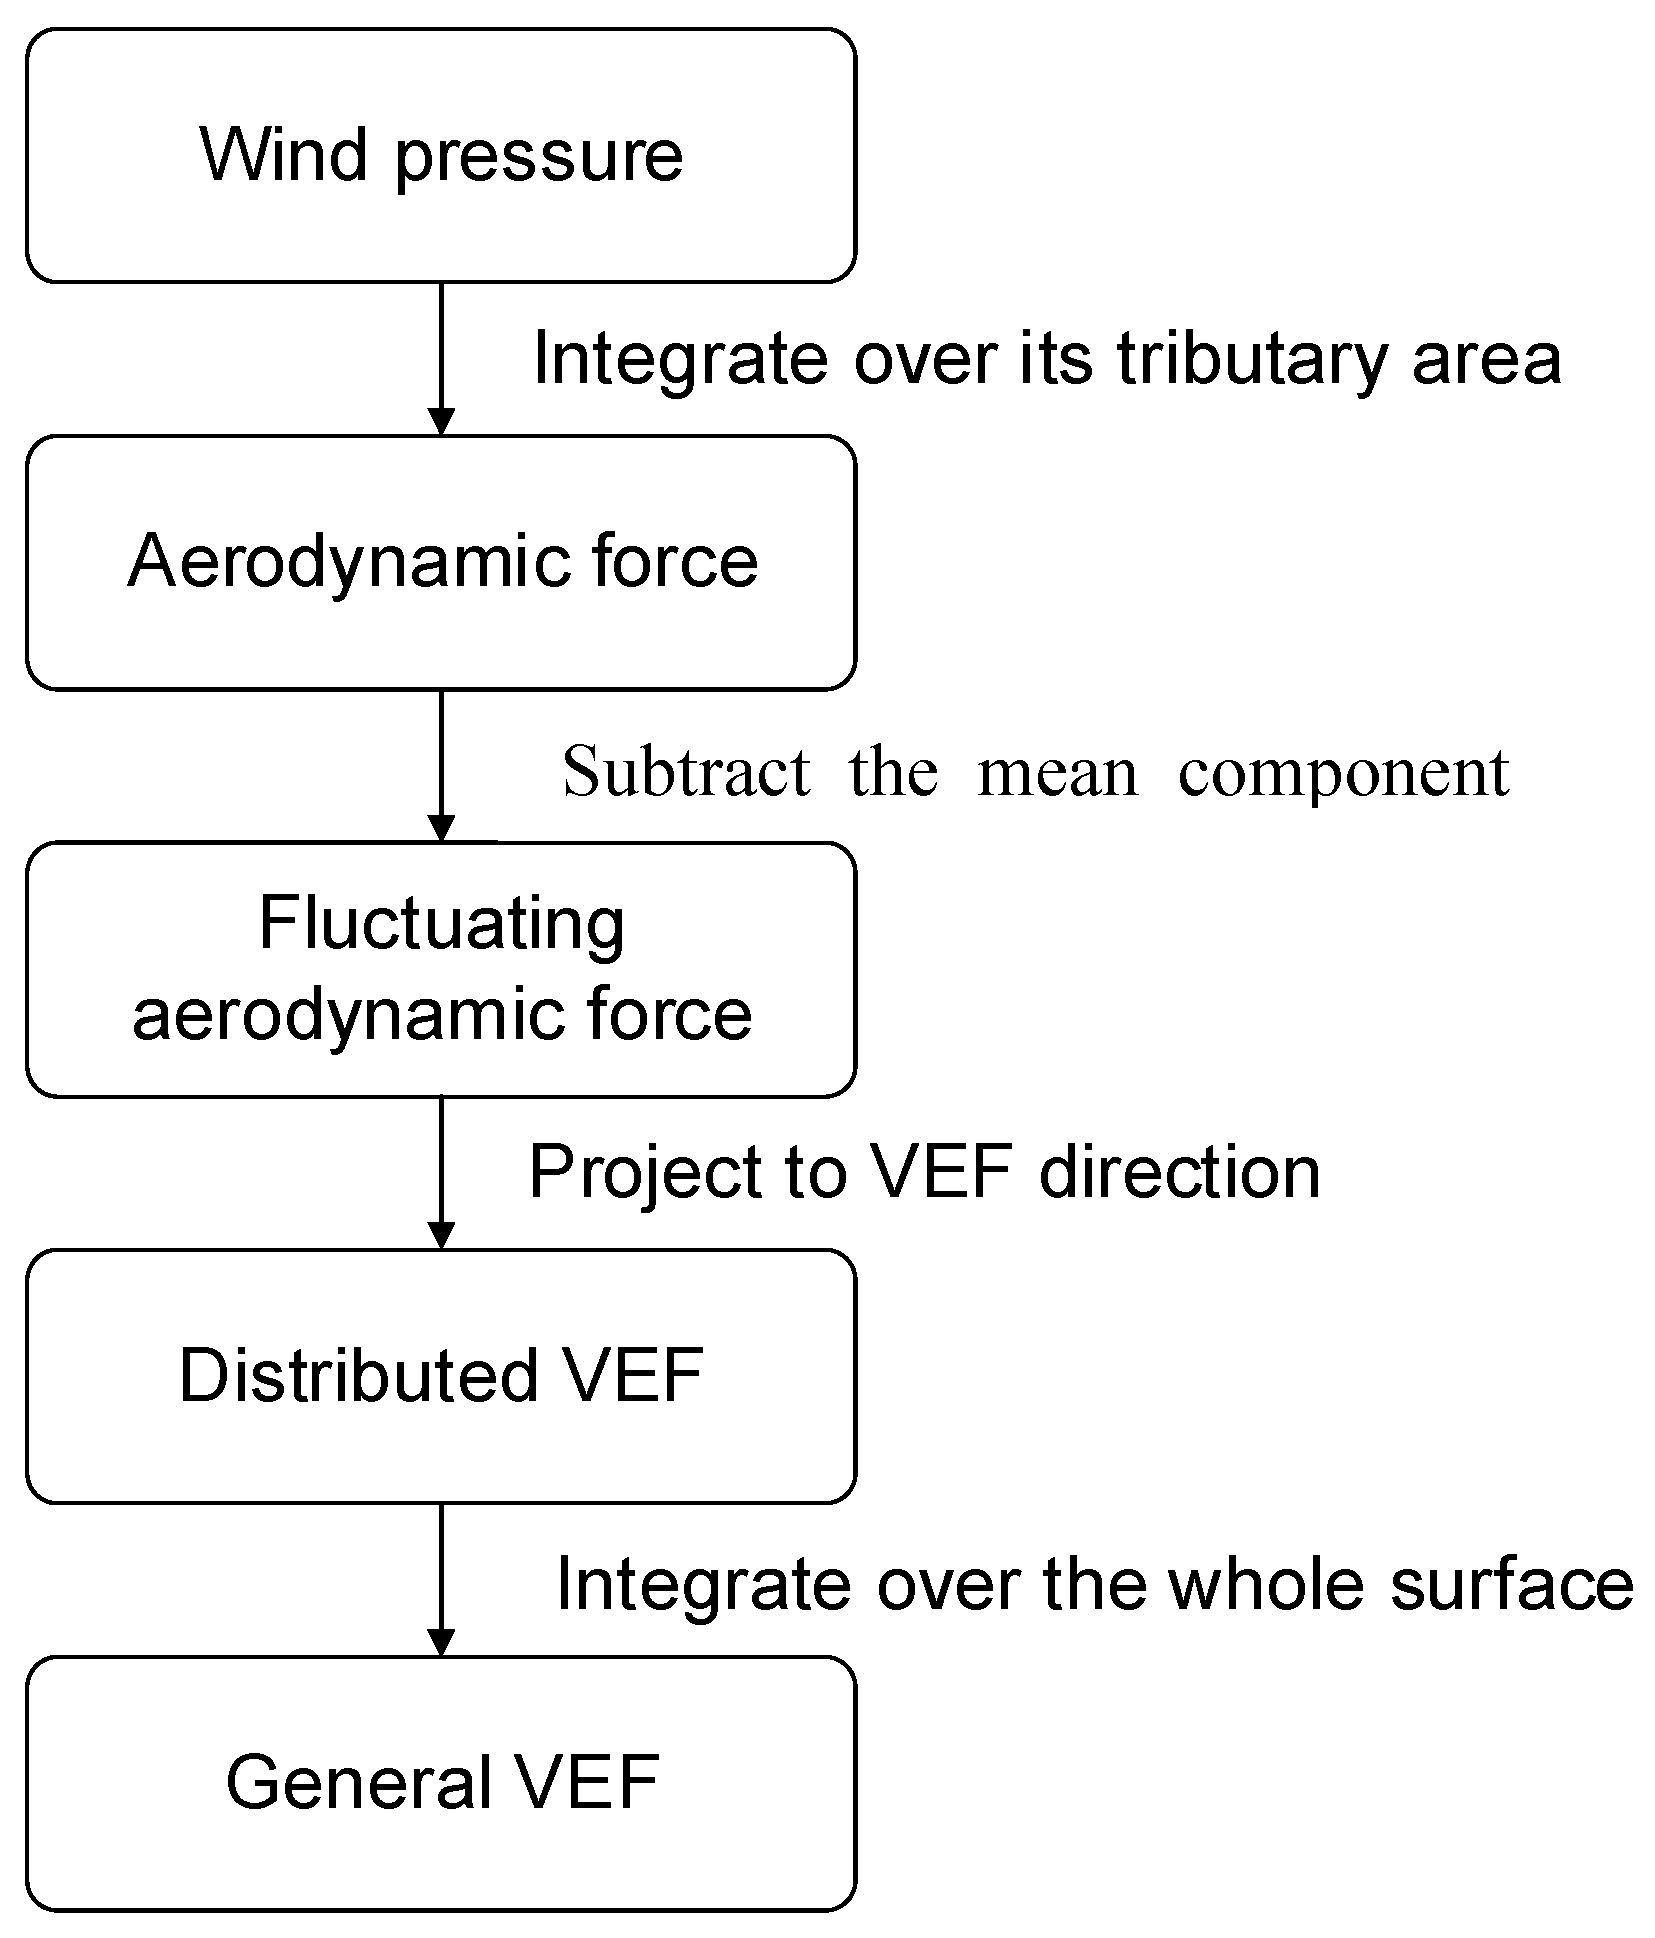
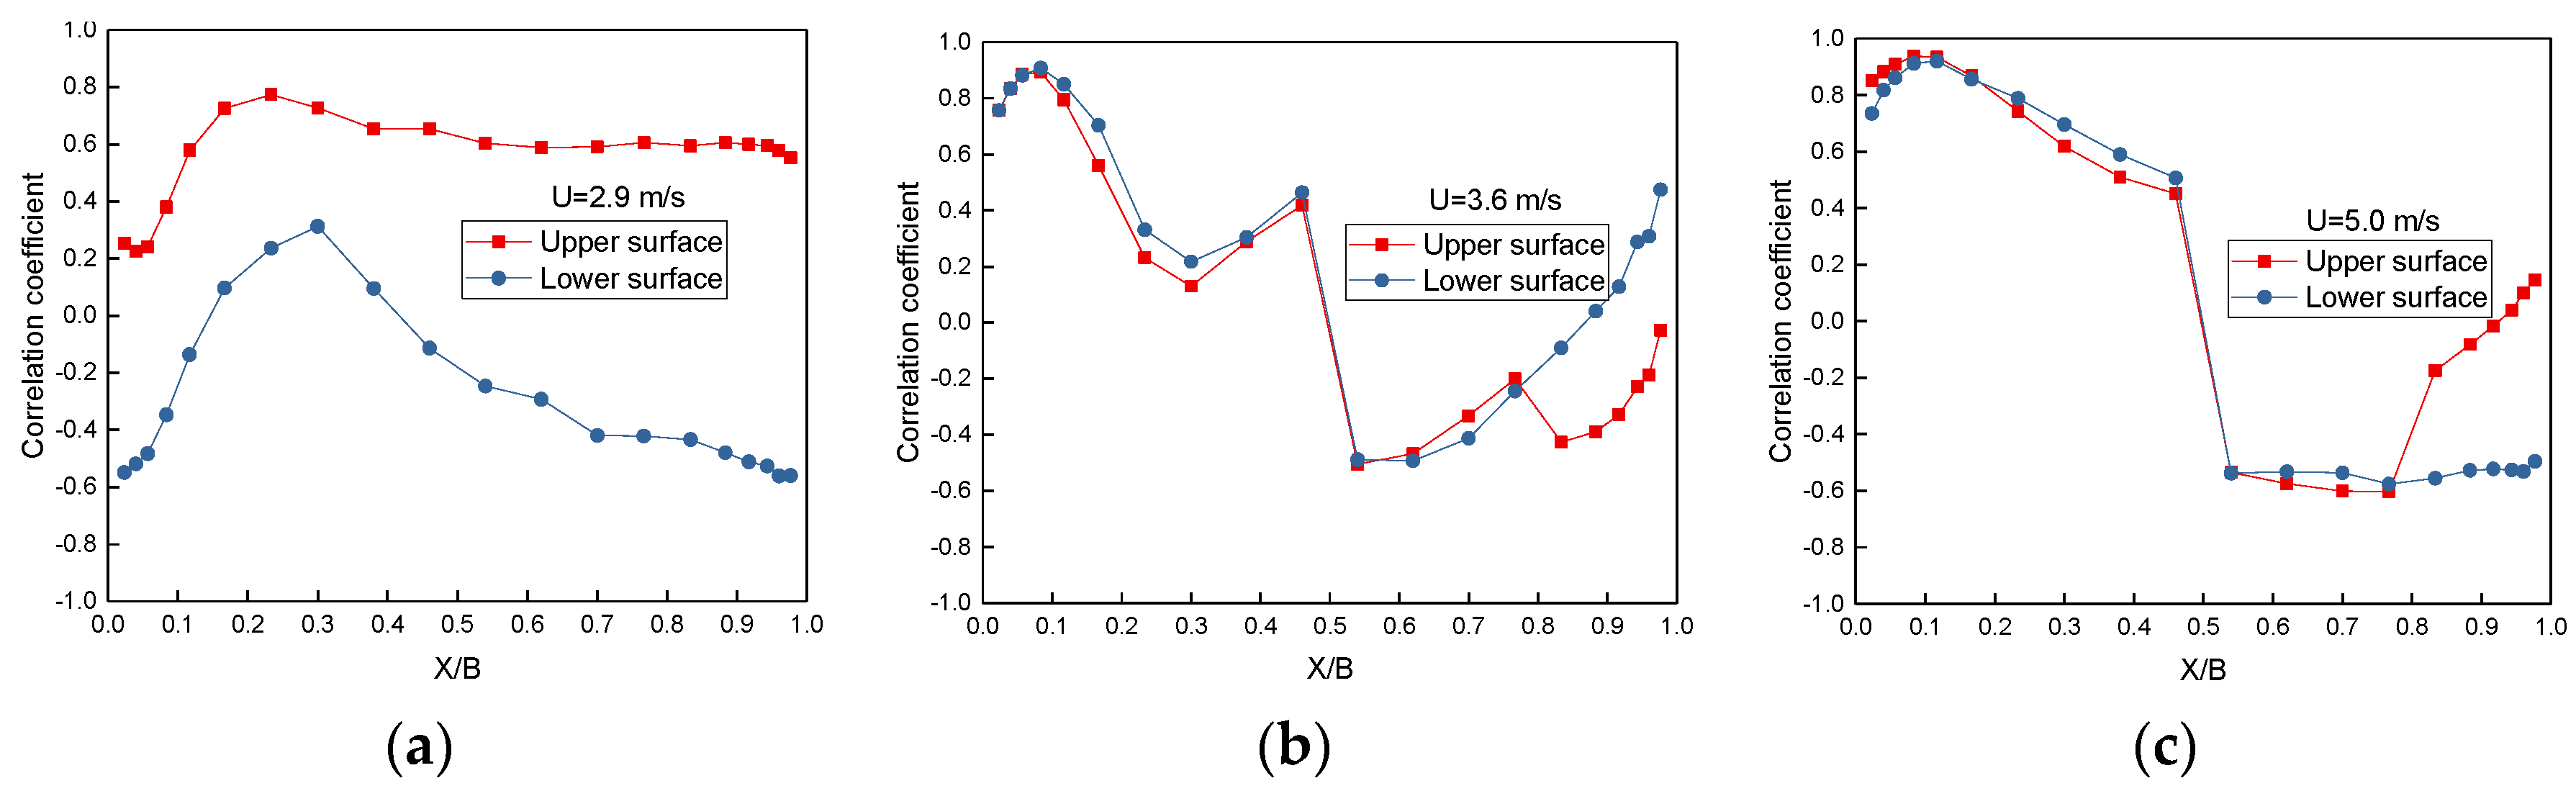
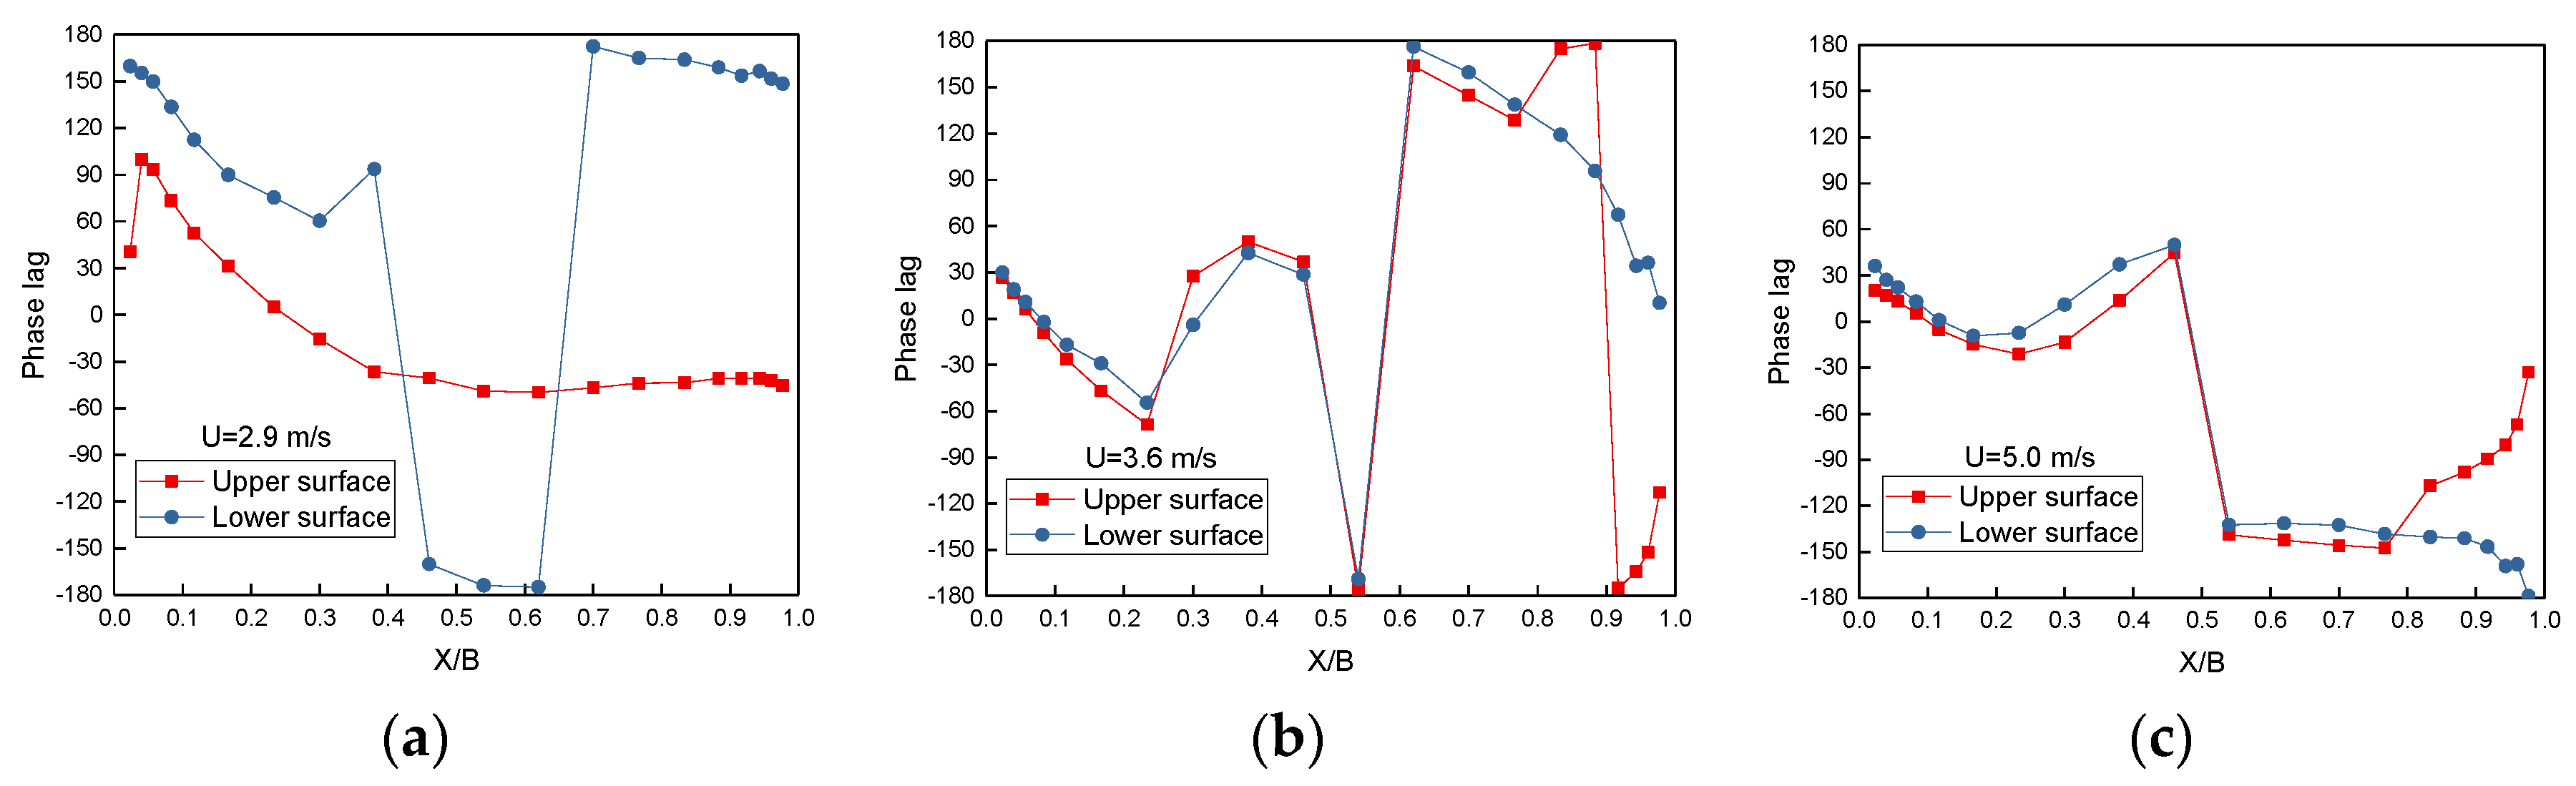
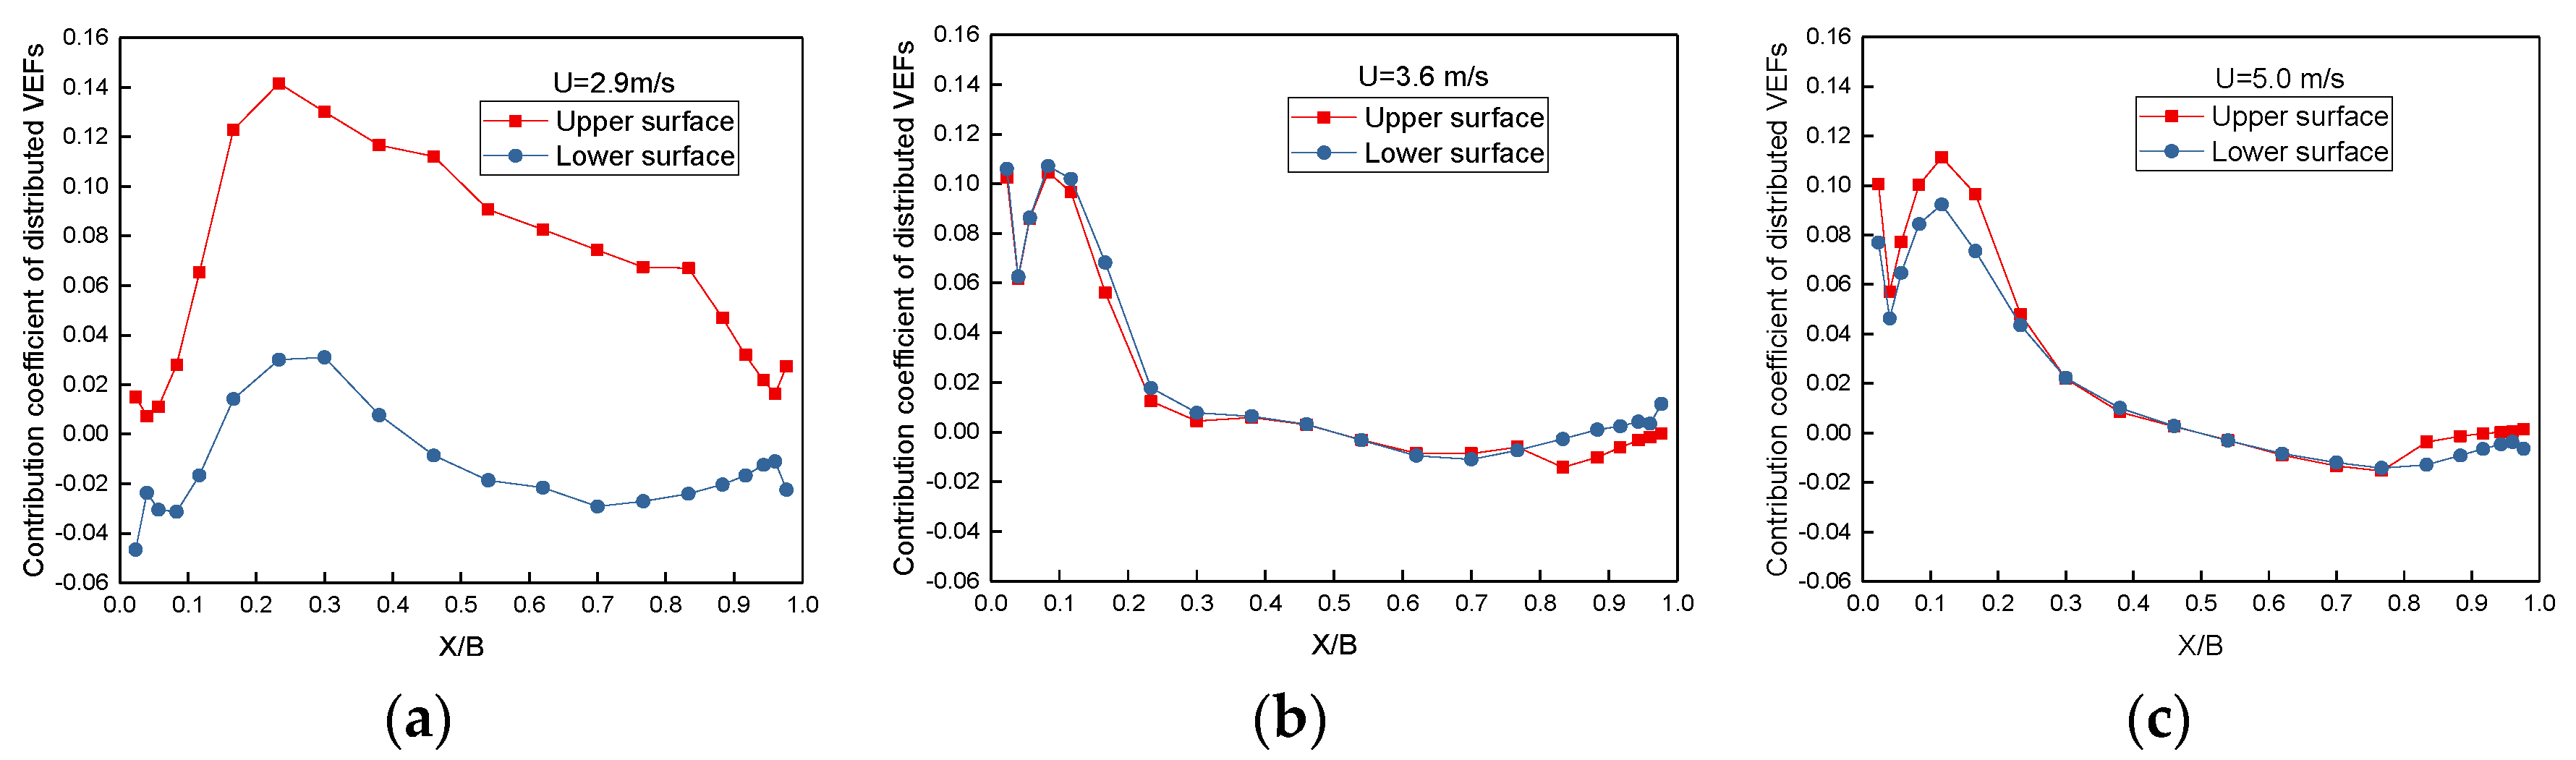
4. Correlation Analysis

In the analysis of the VIV mechanism of a streamlined closed-box girder section, Hu et al. (2018) carried out synchronized measurements of dynamic responses, pressure, and force of the girder section and probed the correlation between the distributed aerodynamic forces and the general vortex-excited forces (VEFs) [33]. In that research, the distributed aerodynamic forces were directly obtained, without subtracting the mean components and projecting to the VEF direction (as depicted in the following flowchart in Figure 6). The same procedure is also employed in the pieces of research by Guo et al. (2012) and Guan et al. (2014) [34,35]. However, the correlation analyses ignored the fact that the aerodynamic forces are vectors in nature, and the results cannot reflect the contribution of the distributed pressure directly. For instance, the pressure on the side surfaces of rectangular cylinders has no contribution to the fluctuating lift acting on the cylinder when it is subjected to vertical VIVs, while the correlation values between them are not null obviously. To solve this problem, the distributed and general VEFs, which actually excite the VIVs of the cylinders, are directly obtained in the present study. The general and distributed VEFs are defined as follows: the pressure of each sampling point is multiplied by its tributary area to obtain the distributed aerodynamic forces. According to many previous pieces of research, the mean components contribute to the static wind forces acting on the cylinders. However, the VIVs are caused by the fluctuating wind pressure acting on the cylinders. Therefore, the mean components should not be involved in the analysis. Since the mean values are not related to the motion of the cylinders, the fluctuating aerodynamic forces are obtained after the mean components are subtracted from the original ones. After that, the modified aerodynamic forces are projected to the lift force direction to obtain the distributed vortex-excited lift time histories. Similarly, the procedure is applied to the fluctuating pressure data to obtain the distributed vortex-excited moment time histories. Furthermore, the general VEFs are defined by integrating the distributed VEFs over the whole surface. A flowchart of the calculation process of the distributed and general VEFs is shown in Figure 6.
The correlation between the distributed and general VEFs is analyzed using time-frequency domain statistical parameters as correlation and contribution coefficients and phase lags between the distributed and general VEFs, which are amplitudes of VEF coefficients at predominant frequencies. The correlation between the distributed VEFs acting on the ith pressure tap and the general VEFs on the whole cylinder is defined as follows:
C o r ( F i ( t ) , F ( t ) ) = C o v ( F i ( t ) , F ( t ) ) σ ( F i ( t ) ) σ ( F ( t ) )
where σ ( F i ( t ) ) and σ ( F ( t ) ) denote the standard deviation of the distributed VEF at the ith pressure tap ( F i ( t ) ) and the general VEF ( F ( t ) ), respectively. C o v ( F i ( t ) , F ( t ) ) is the covariance between them. The values of | C o r ( F i ( t ) , F ( t ) ) | satisfy 0 | C o r ( F i ( t ) , F ( t ) ) | 1 ; in particular, a value of unity represents perfect coherence, and the value of zero indicates two completely unrelated VEFs. For a non-null value, it means a certain level of coherence. The phase lags between distributed and general VEFs are obtained from the cross-spectrum analysis. The phase lag of zero degrees represents a perfect in-phase relation, and 90 degrees indicates no correlation, while 180 degrees means out-of-phase [36,37]. The results of the correlation coefficients for UC and DC are presented in Figure 7 and Figure 8, respectively, and the results of the phase lags between the distributed and general VEFs are shown in Figure 9 and Figure 10.
As the results indicate, the correlation coefficients of UC are the largest in the trailing half region on both upper and lower surfaces, and the observation is more apparent for U = 3.6 and 5.0 m/s. For DC, the positive correlation between the distributed and general VEFs is more pronounced in the leading region for U = 3.6 and 5.0 m/s. However, for U = 2.9 m/s, the correlation coefficient of the upper surface is positive for DC, while the values are mainly negative in most regions of the lower surface.
For the phase lags between the distributed and general VEFs, the values are relatively smaller on the trailing surface of UC. The results at U = 2.9 and 3.6 m/s are similar in distributions, with the exception of some local regions. For DC, the values of phase lags on the leading surface are relatively smaller compared with other regions, and this observation is apparent, especially for U = 3.6 and 5.0 m/s. However, it needs to be pointed out that some exception exists in the phase lags on the upper surface for U = 2.9 m/s. Above all, the results further validate the conclusion that the distributed VEFs on the trailing surface of UC and the leading surface of DC are more closely related to the VIVs of the cylinders. In addition, this conclusion is also in line with our previous POD analysis [31].
The contribution of distributed VEFs on the general one depends not only on the amplitude of distributed VEFs but the correlation coefficient between them. The ratio between the rms values of the distributed VEFs and the general VEFs reflects the amplitude contribution of local VEF at each pressure tap, while the correlation coefficient reflects the correlation levels between them. The contribution coefficient is defined as the product of these parameters and expressed as follows:
C ( F i ( t ) ) = C o r ( F i ( t ) , F ( t ) ) σ ( F i ( t ) ) σ ( F ( t ) )
The results of VEF contribution coefficients for upstream and downstream cylinders are presented in Figure 11 and Figure 12, respectively.
As depicted in the figures, the contribution coefficient distributions of UC and DC are basically similar for the correlation coefficients, and the values are the maximum in the trailing half surface of UC and the leading half surface of DC. However, the distributions of the contribution coefficients are more smooth compared with Figure 8 and Figure 9. Furthermore, the contributions of the distributed VEFs acting on the upper surface are more pronounced than those on the lower surface for most cases. This indicates that some difference in the flow structure on the upper and lower surfaces during VIVs of the cylinders exists. This conclusion is in line with the fluctuating pressure distributions (Figure 5) and our previous POD analysis [31].
The VEF coefficient amplitude at a predominant frequency (or natural vibration frequency) can be obtained from Fourier transformation, and it corresponds to the self-excited component in VEFs.
F i D = 2 N { F i ( t ) }
where FiD is the amplitude of the distributed VEFs at predominant frequency, N is the signal length of the distributed VEFs, and { } is the operation of Fourier transformation.
The results of VEF coefficient amplitudes at predominant frequencies for upstream and downstream cylinders are depicted in Figure 13 and Figure 14, respectively.
As shown in the figures, the distributions of VEF coefficient amplitudes at predominant frequencies (FD) show similarities to Figure 12 and Figure 13 for U = 3.6 and 5.0 m/s. Also, the values are relatively larger on the trailing half surface of UC and the leading half surface of DC. However, for U = 2.9 m/s, the difference between the distributions of FD and Figure 12 and Figure 13 is great. That is, for UC, the FD distributions are symmetric around the centerline of the lower surface; there are two bumps on the upper surface, and the largest values are observed around the position of X/W = [0.54, 0.88]. For DC, the FD values on the lower surface are smaller than that on the upper surface. The variation of FD in the region of X/W = 0.23~0.83 on the upper surface is not that significant as compared with other regions, while the variation of FD in the range of 0.38 ≤ X/W ≤ 1.0 on the lower surface remains stable. The following observations can be reached from the comparison as follows: the vortex-excited forces in torsional VIVs of twin rectangular cylinders are mainly predominant by the self-excited components, while the contribution of the self-excited components is relatively smaller for the bending VIVs of the twin rectangular cylinders.

5. Conclusions

The vortex-induced vibration performance, the pressure distributions, and the VIV mechanism for twin rectangular cylinders with a width-to-depth ratio of 5:1 in tandem arrangement are analyzed in this paper. The spacing between them is 1.2 times the width of one section. The main conclusions can be reached as follows:
(1)
The results of dynamic tests indicate that the VIV performance of two 5:1 rectangular cylinders in tandem is different at three incidence angles. Generally, the vertical VIV response is unfavorable at the −3° angle of incidence. However, the torsional VIVs of the upstream body are more significant at 0° and −3°, while the general trend for the torsional VIV behavior of the downstream cylinder can hardly be obtained.
(2)
The pressure measurements show that the mean and fluctuating pressure distributions of the cylinders under vertical VIVs are different from the results under torsional VIVs. Pressure measurements should be conducted under corresponding wind velocities to analyze the pressure field of twin rectangular cylinders when they undergo VIVs.
(3)
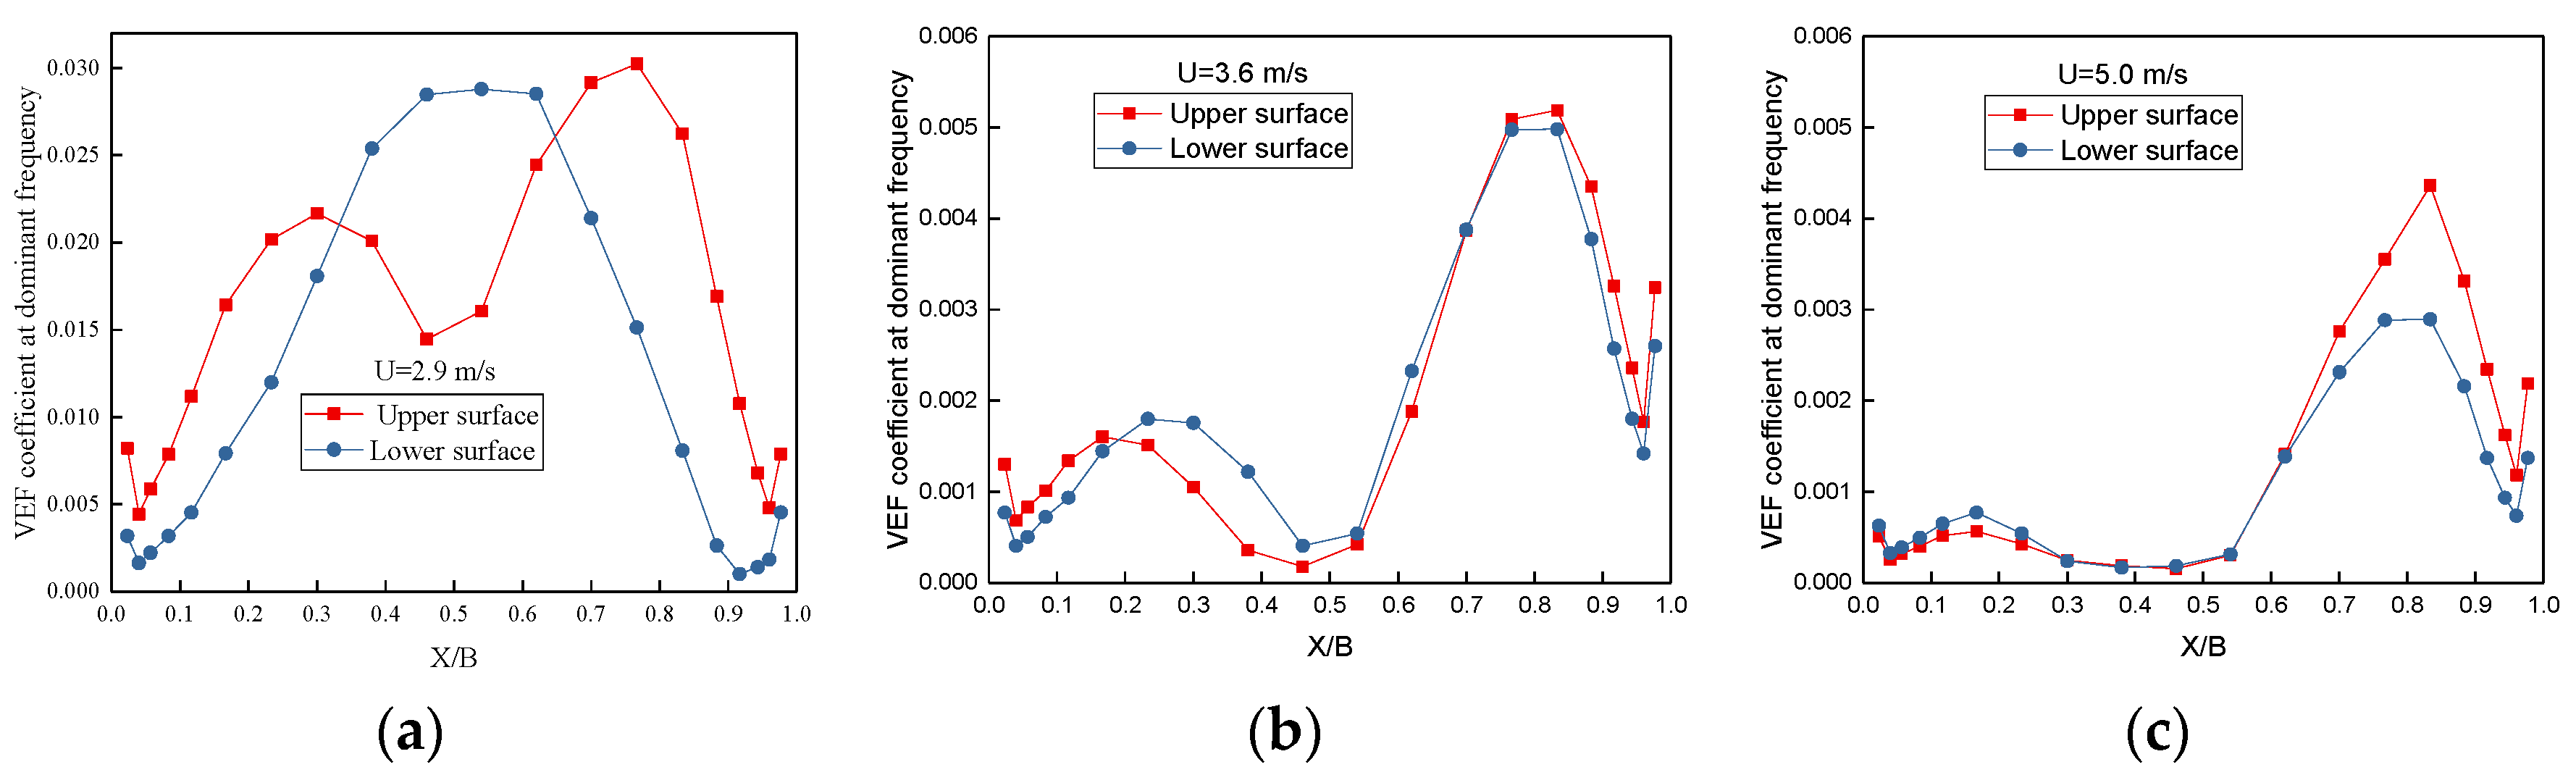
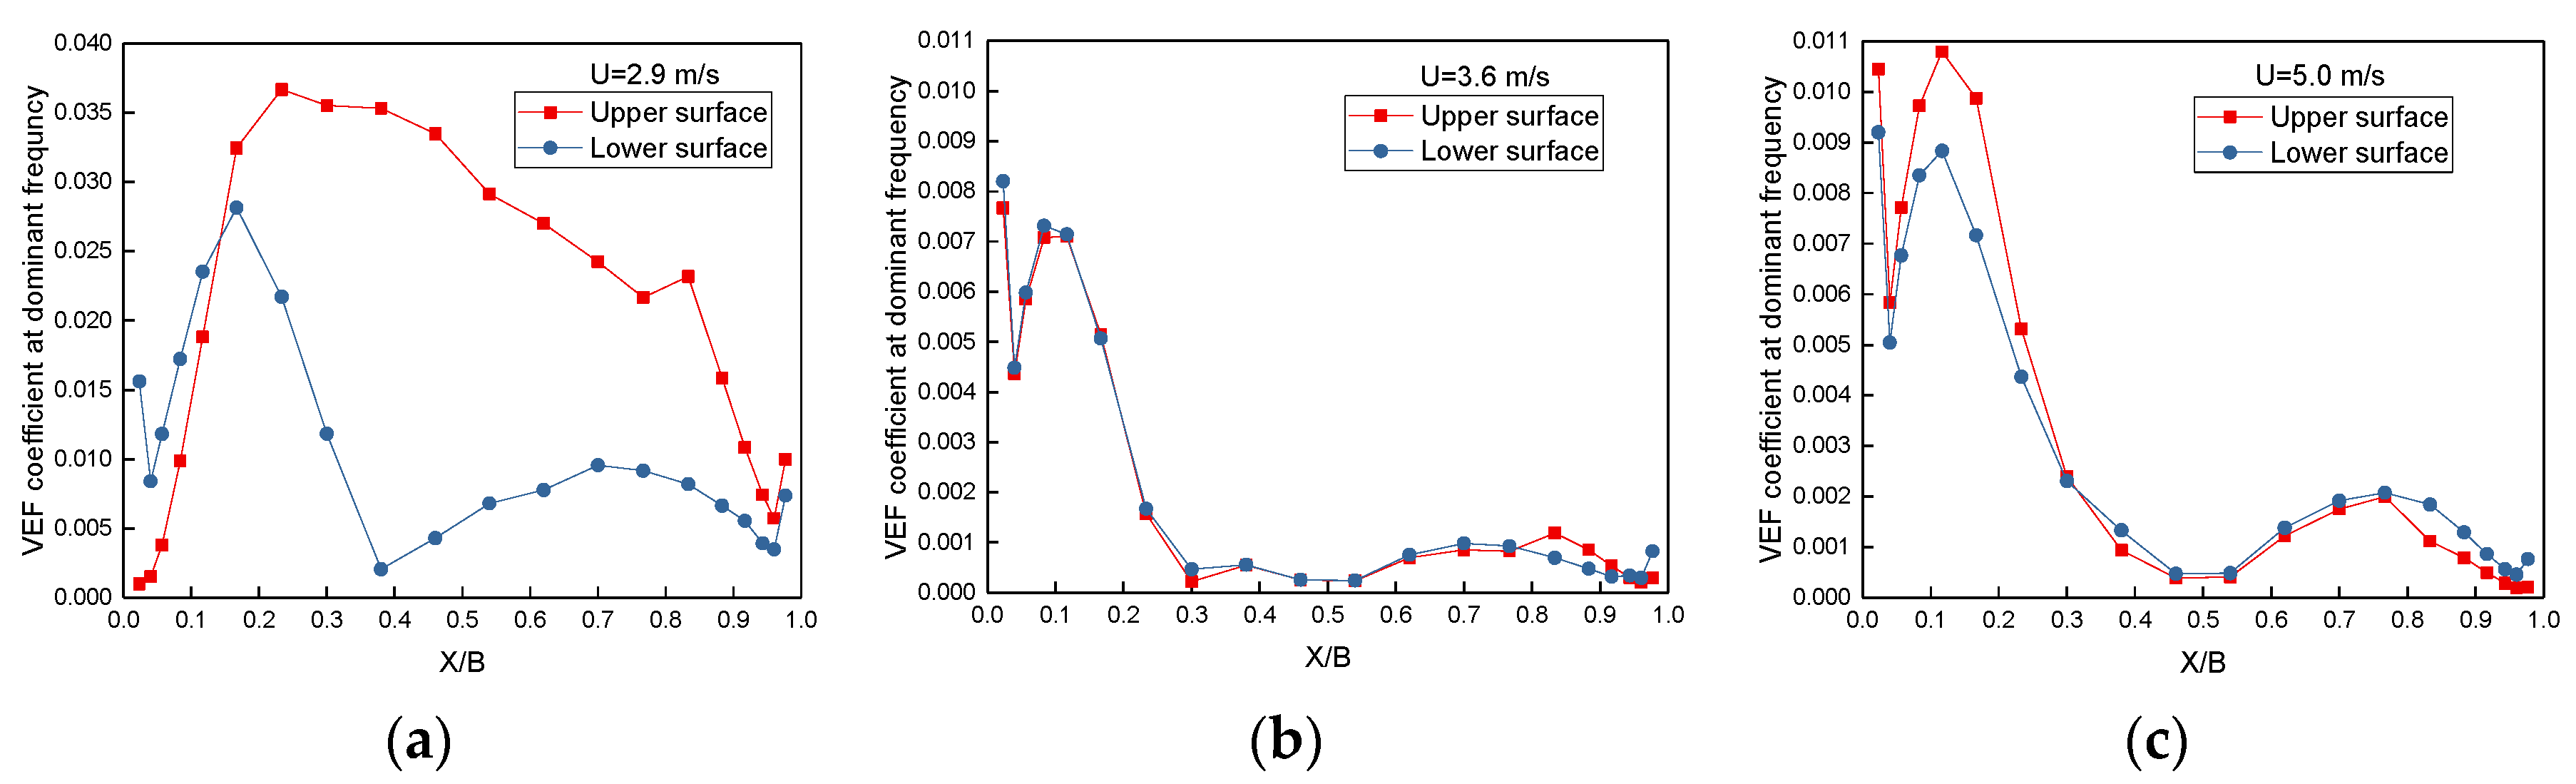
The correlation analysis using time-frequency domain statistical parameters indicates that the contribution of distributed vortex-excited forces is significant in the region of the trailing surface of the upstream cylinder and the leading surface of the downstream cylinder.

Author Contributions

Conceptualization, K.M., C.Z., X.D. and G.Z.; methodology, K.M. and C.Z.; investigation, X.D. and G.Z.; writing-original draft preparation, K.M. and C.Z.; writing–review and editing, X.D. and G.Z.; supervision, G.Z. formal analysis, K.M. and C.Z.; validation, X.D. and G.Z. All authors have read and agreed to the published version of the manuscript.

Funding

This research was funded by the National Key Research and Development Program of China (2019YFE0112300); the National Natural Science Foundation of China (51978512); and the Transportation science and technology plan of Shandong province (2020B74); the Shanghai Science and Technology Plan Project (220H1179800).

Data Availability Statement

The data presented in this study are available on request from the corresponding author. The data are not publicly available due to privacy.

Conflicts of Interest

Changyong Zhang was employed by the company Shandong Provincial Communications Planning and Design Institute Group Co., Ltd. Author Xinzhi Dang was employed by the company Suzhou Tongyao Civil Technology Co., Ltd. The remaining authors declare that the research was conducted in the absence of any commercial or financial relationships that could be construed as a potential conflict of interest.

References

  1. Taylor, I.; Vezza, M. Prediction of unsteady flow around square and rectangular section cylinders using a discrete vortex method. J. Wind. Eng. Ind. Aerodyn. 1999, 82, 247–269. [Google Scholar] [CrossRef]
  2. Murakami, S.; Mochida, A. On turbulent vortex shedding flow past 2D square cylinder predicted by CFD. J. Wind. Eng. Ind. Aerodyn. 1995, 54–55, 191–211. [Google Scholar] [CrossRef]
  3. Matsumoto, M.; Shirato, H.; Araki, K.; Haramura, T.; Hashimoto, T. Spanwise coherence characteristics of surface pressure field on 2-D bluff bodies. J. Wind. Eng. Ind. Aerodyn. 2003, 91, 155–163. [Google Scholar] [CrossRef]
  4. Shimada, K.; Ishihara, T. Application of a modified k–ε model to the prediction of aerodynamic characteristics of rectangular cross-section cylinders. J. Fluids Struct. 2002, 16, 465–485. [Google Scholar] [CrossRef]
  5. Bruno, L.; Coste, N.; Fransos, D. Simulated flow around a rectangular 5: 1 cylinder: Spanwise discretisation effects and emerging flow features. J. Wind. Eng. Ind. Aerodyn. 2012, 104–106, 203–215. [Google Scholar] [CrossRef]
  6. Ricciardelli, F. Effects of the vibration regime on the spanwise correlation of the aerodynamic forces on a 5:1 rectangular cylinder. J. Wind. Eng. Ind. Aerodyn. 2010, 98, 215–225. [Google Scholar] [CrossRef]
  7. Mariotti, A.; Salvetti, M.V.; Omrani, P.S.; Witteveen, J.A.S. Stochastic analysis of the impact of freestream conditions on the aerodynamics of a rectangular 5:1 cylinder. Comput. Fluids 2016, 136, 170–192. [Google Scholar] [CrossRef]
  8. Mannini, C.; Weinman, K.; Soda, A.; Schewe, G. Three-dimensional numerical simulation of flow around a 1:5 rectangular cylinder. In Proceedings of the 5th European and African Conference on Wind Engineering, Florence, Italy, 19–23 July 2009. [Google Scholar]
  9. Mannini, C.; Šoda, A.; Schewe, G. Numerical investigation on the three-dimensional unsteady flow past a 5:1 rectangular cylinder. J. Wind. Eng. Ind. Aerodyn. 2011, 99, 469–482. [Google Scholar] [CrossRef]
  10. Mannini, C.; Šoda, A.; Schewe, G. Unsteady RANS modelling of flow past a rectangular cylinder: Investigation of Reynolds number effects. Comput. Fluids 2010, 39, 1609–1624. [Google Scholar] [CrossRef]
  11. Bruno, L.; Fransos, D.; Coste, N.; Bosco, A. 3D flow around a rectangular cylinder: A computational study. J. Wind. Eng. Ind. Aerodyn. 2010, 98, 263–276. [Google Scholar] [CrossRef]
  12. Berrone, S.; Garbero, V.; Marro, M. Numerical simulation of low-Reynolds number flows past rectangular cylinders based on adaptive finite element and finite volume methods. Comput. Fluids 2011, 40, 92–112. [Google Scholar] [CrossRef]
  13. Mannini, C.; Marra, A.M.; Pigolotti, L.; Bartoli, G. The effects of free-stream turbulence and angle of attack on the aerodynamics of a cylinder with rectangular 5:1 cross section. J. Wind. Eng. Ind. Aerodyn. 2017, 161, 42–58. [Google Scholar] [CrossRef]
  14. Schewe, G. Reynolds-number-effects in flow around a rectangular cylinder with aspect ratio 1:5. J. Fluids Struct. 2013, 39, 15–26. [Google Scholar] [CrossRef]
  15. Schewe, G. Influence of the Reynolds-Number on Flow Induced Vibrations of Generic Bridge Sections. In Proceedings of the International Conference on Bridges, SECON HDGK, Dubrovnik, Croatia, 21–24 May 2006; pp. 351–358. [Google Scholar]
  16. Bruno, L.; Salvetti, M.V.; Ricciardelli, F. Benchmark on the aerodynamics of a rectangular 5:1 cylinder: An overview after the first four years of activity. J. Wind. Eng. Ind. Aerodyn. 2014, 126, 87–106. [Google Scholar] [CrossRef]
  17. Gnatowska, R. Aerodynamic characteristics of two-dimensional sharp-edged objects in tandem arrangement. Arch. Mech. 2008, 60, 475–490. [Google Scholar]
  18. Havel, B.; Hangan, H.; Martinuzzi, R. Buffeting for 2D and 3D sharp-edged bluff bodies. J. Wind. Eng. Ind. Aerodyn. 2001, 89, 1369–1381. [Google Scholar] [CrossRef]
  19. Liu, C.H.; Chen, J.M. Observations of hysteresis in flow around two square cylinders in a tandem arrangement. J. Wind. Eng. Ind. Aerodyn. 2002, 90, 1019–1050. [Google Scholar] [CrossRef]
  20. Kolar, V.; Lyn, D.A.; Rodi, W. Ensemble-averaged measurements in the turbulent near wake of two side-by-side square cylinders. J. Fluid Mech. 1997, 346, 201–237. [Google Scholar] [CrossRef]
  21. Chatterjee, D.; Biswas, G.; Amiroudine, S. Numerical simulation of flow past row of square cylinders for various separation ratios. Comput. Fluids 2010, 39, 49–59. [Google Scholar] [CrossRef]
  22. Edamoto, K.; Kawahara, M. Finite element analysis of two- and three-dimensional flows around square columns in tandem arrangement. Int. J. Numer. Methods Fluids 1998, 28, 95–112. [Google Scholar] [CrossRef]
  23. Bhattacharyya, S.; Dhinakaran, S. Vortex shedding in shear flow past tandem square cylinders in the vicinity of a plane wall. J. Fluids Struct. 2008, 24, 400–417. [Google Scholar] [CrossRef]
  24. Bao, Y.; Wu, Q.; Zhou, D. Numerical investigation of flow around an inline square cylinder array with different spacing ratios. Comput. Fluids 2012, 55, 118–131. [Google Scholar] [CrossRef]
  25. Kondo, N. Numerical Simulation of Aerodynamic Characteristics of Two Rectangular Cylinders in Side-by-side Arrangement. Int. J. Comput. Fluid Dyn. 2004, 18, 367–379. [Google Scholar] [CrossRef]
  26. Agarwal, A.; Djenidi, L.; Antonia, R.A. Investigation of flow around a pair of side-by-side square cylinders using the lattice Boltzmann method. Comput. Fluids 2006, 35, 1093–1107. [Google Scholar] [CrossRef]
  27. Kumar, S.R.; Sharma, A.; Agrawal, A. Simulation of flow around a row of square cylinders. J. Fluid Mech. 2008, 606, 369–397. [Google Scholar] [CrossRef]
  28. UI Islam, S.; Rahman, H.; Zhou, C.Y. Effect of gap spacings on flow past row of rectangular cylinders with aspect ratio 1.5. Ocean. Eng. 2016, 119, 1–15. [Google Scholar] [CrossRef]
  29. Burattini, P.; Agrawal, A. Wake interaction between two side-by-side square cylinders in channel flow. Comput. Fluids 2013, 77, 134–142. [Google Scholar] [CrossRef]
  30. Chatterjee, D.; Biswas, G. Dynamic behavior of flow around rows of square cylinders kept in staggered arrangement. J. Wind. Eng. Ind. Aerodyn. 2015, 136, 1–11. [Google Scholar] [CrossRef]
  31. Ma, K.; Hu, C.X.; Zhou, Z.Y. Investigation of vortex-induced vibration of twin rectangular 5:1 cylinders through wind tunnel tests and POD analysis. J. Wind. Eng. Ind. Aerodyn. 2019, 187, 97–107. [Google Scholar] [CrossRef]
  32. Liu, X.B. Study on Aerodynamic Interference of Long-Span Bridges with Twin Separate Parallel Decks; Hunan University: Changsha, China, 2010. (In Chinese) [Google Scholar]
  33. Hu, C.X.; Zhao, L.; Ge, Y.J. Time-frequency Evolutionary Characteristics of Aerodynamic Forces around a Streamlined Closed-box Girder during Vortex-induced Vibration. J. Wind. Eng. Ind. Aerodyn. 2018, 182, 330–343. [Google Scholar] [CrossRef]
  34. Guo, Z.W.; Zhao, L.; Ge, Y.J.; Chen, H.X. Mechanism analysis for vortex-induced vibration reduction of a flat streamlined steel box-shaped girder with airflow-suppressing board based on statistical property of surface pressure. J. Vib. Shock. 2012, 31, 89–94. (In Chinese) [Google Scholar]
  35. Guan, Q.H.; Li, J.W.; Hu, Z.T.; Liu, J.X. Effects of railings on vortex induced vibration of a bridge deck section. J. Vib. Shock. 2014, 33, 150–156. (In Chinese) [Google Scholar]
  36. Zhu, Z.W. LES prediction of aerodynamics and coherence analysis of fluctuating pressure on box girders of long-span bridges. Comput. Fluids 2015, 110, 169–180. [Google Scholar] [CrossRef]
  37. Zhu, Z.W. Feasibility investigation on prediction of vortex shedding of flat box girder based on a 2D RANS model. China J. Highw. Transp. 2015, 28, 24–33. (In Chinese) [Google Scholar]
Figure 1. Sketch of testing apparatus.
Buildings 14 00085 g001
Figure 2. Model configuration and internal constitutions.
Buildings 14 00085 g002
Figure 3. VIV responses of the twin rectangular cylinders under different angles of incidence. (a) vertical VIV responses; (b) torsional VIV responses.
Buildings 14 00085 g003
Figure 4. Mean pressure distributions of UC and DC. (a) the results of UC; (b) the results of DC.
Buildings 14 00085 g004
Figure 5. Fluctuating pressure distributions of UC and DC. (a) the results of UC; (b) the results of DC.
Buildings 14 00085 g005
Figure 6. Flowchart of the calculation process of distributed and general VEFs.
Buildings 14 00085 g006
Figure 7. Correlation coefficients between distributed and general VEFs for UC. (a) U = 2.9 m/s; (b) U = 3.6 m/s; (c) U = 5.0 m/s.
Buildings 14 00085 g007
Figure 8. Correlation coefficients between distributed and general VEFs for DC. (a) U = 2.9 m/s; (b) U = 3.6 m/s; (c) U = 5.0 m/s.
Buildings 14 00085 g008
Figure 9. Phase lags between the distributed and general VEFs for UC. (a) U = 2.9 m/s; (b) U = 3.6 m/s; (c) U = 5.0 m/s.
Buildings 14 00085 g009
Figure 10. Phase lags between the distributed and general VEFs for DC. (a) U = 2.9 m/s; (b) U = 3.6 m/s; (c) U = 5.0 m/s.
Buildings 14 00085 g010
Figure 11. VEF contribution coefficient for testing point of UC. (a) U = 2.9 m/s; (b) U = 3.6 m/s; (c) U = 5.0 m/s.
Buildings 14 00085 g011
Figure 12. VEF contribution coefficient for testing point of DC. (a) U = 2.9 m/s; (b) U = 3.6 m/s; (c) U = 5.0 m/s.
Buildings 14 00085 g012
Figure 13. VEF coefficient amplitudes at a predominant frequency for UC. (a) U = 2.9 m/s; (b) U = 3.6 m/s; (c) U = 5.0 m/s.
Buildings 14 00085 g013
Figure 14. VEF coefficient amplitudes at a predominant frequency for DC. (a) U = 2.9 m/s; (b) U = 3.6 m/s; (c) U = 5.0 m/s.
Buildings 14 00085 g014
Disclaimer/Publisher’s Note: The statements, opinions and data contained in all publications are solely those of the individual author(s) and contributor(s) and not of MDPI and/or the editor(s). MDPI and/or the editor(s) disclaim responsibility for any injury to people or property resulting from any ideas, methods, instructions or products referred to in the content.

