Abstract
Abstract: This study addresses the current difficulties in accurately controlling the indoor temperature of double-skin facades (DSFs), and its optimization, with a focus on the window opening angles of double-skin facades. The Spearman correlation coefficient method was used to select the main meteorological factors, including outdoor temperature, dew point temperature, scattered radiation, direct radiation, and window opening angle. A modified random forest algorithm was used to construct the optimization model and 80% of the data were used for model training. In the experiments, the average accuracy of the optimization model was as high as 93.5% for all window opening angles. This study provides a data-driven method for application to double-skin facades, which can effectively determine and control the window opening angles of double-skin facades to achieve energy saving and emission reduction, reduce indoor temperature, improve comfort, and provide a practical basis for decision-making. Future research will further explore the applicability and accuracy of the model under different climatic conditions.
1. Introduction
China set strategic goals of limiting carbon dioxide emissions and achieving carbon neutrality by 2020, so as to promote a low-carbon, environmentally friendly lifestyle [1,2]. The construction industry has actively developed new technologies for energy saving and emission reduction in order to accomplish these goals. Among these, facade renovation has emerged as a direct and efficient method. In recent years, double-skin facades (DSFs) have gained recognition as a promising high-performance building envelope system. Employed in new construction and gradually implemented in existing buildings, the DSF system consists of installing a second layer of a curtain wall structure in front of the existing façade, thus creating a cavity in the middle of the curtain wall. This system functions as a thermal buffer zone, a ventilation channel, or both [3].
The effectiveness of DSF systems has been demonstrated in various studies, improving energy efficiency in office building renovations, saving heating energy in existing apartments, and reducing heating demands in small standalone houses [4]. Yoon et al. installed DSF systems in existing apartments in South Korea, replacing inefficient balcony windows, and achieved a 30% reduction in maximum heating energy consumption on the 21st floor [5]. However, it is important to consider the potential challenges of hot summers, such as insufficient cavity ventilation or excessive solar radiation, which can lead to overheating of the cavity and thus increase the cooling load [6]. Javad integrated DSF to improve the performance of buildings with photovoltaic systems. The approach integrates Soltrace3 with computational fluid dynamics (CFD) models to investigate the effect of the DSF location and its depth, and the power generation potential of a photovoltaic (PV)-integrated DSF can be increased by 169 per cent compared to a conventional DSF approach [7]. Thus, it is necessary to account for factors that include building orientation, transparency ratios, building form, components, and materials that influence the energy-saving performance of DSF systems. Targeted research on different energy-saving strategies is crucial [8].
Accurately determining the optimum window opening angle relative to different room temperatures has a significant impact on achieving optimum DSF performance. Accurate determination of these angles is crucial to enhance energy efficiency and indoor comfort, and has practical implications in architectural design, energy management, and environmental sustainability.
A more efficient, comfortable, and sustainable building environment can be achieved by precisely identifying and controlling window opening angles [9]. Conventional research on DSFs has focused on thermal conductivity, structural materials, and DSF cavity structures [10]. Traditional experiential-based methods often fail to accurately explore the relationship between window opening angles and indoor temperature. Therefore, a data-driven predictive model is needed to assist in the design and decision-making process. In this context, this study adopts the random forest (RF) algorithm, aiming to develop an accurate and reliable model to optimize the window opening angles of DSF.
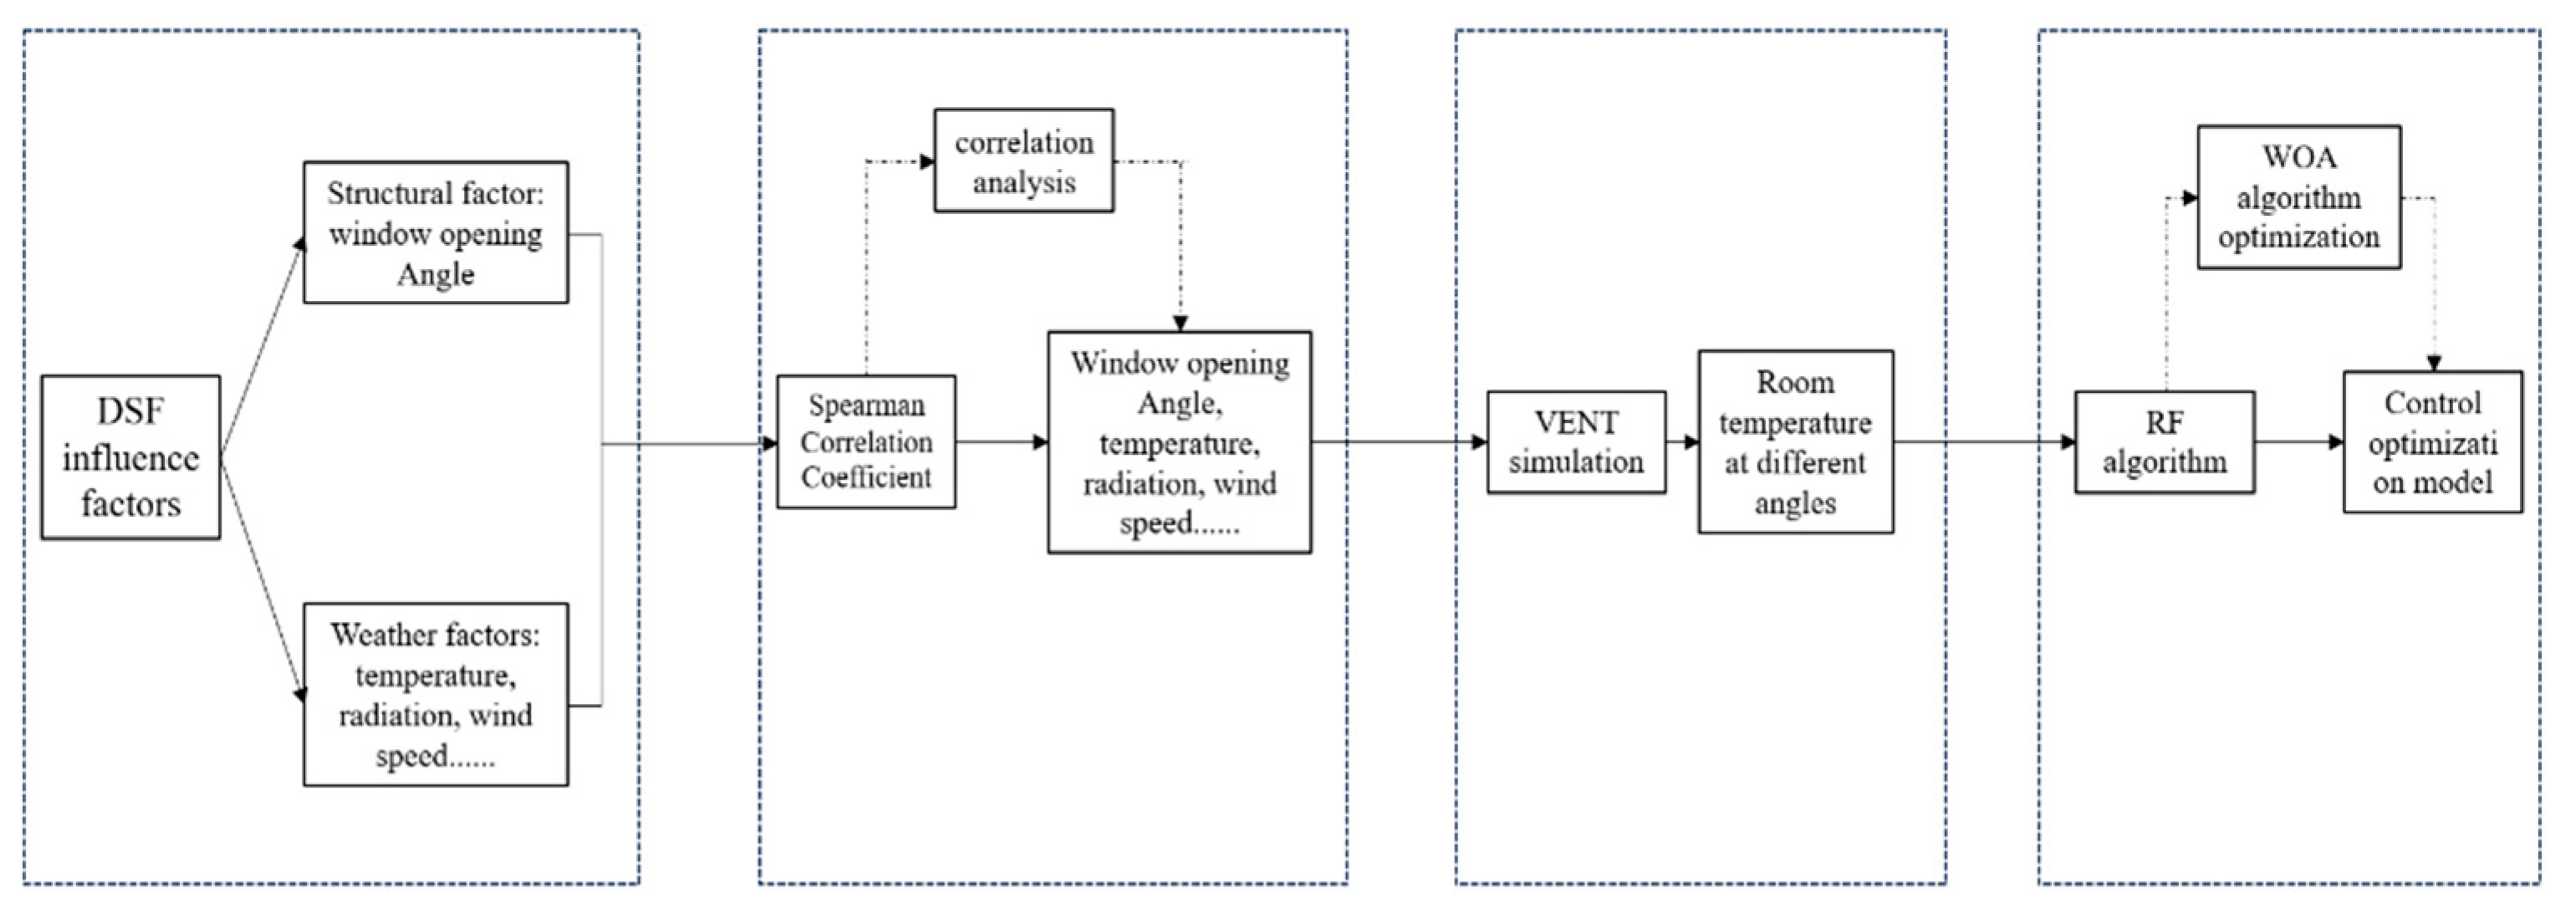
This study presents a data-driven approach for the construction industry [11]. The objectives of regulating indoor temperature, achieving energy savings, and enhancing indoor comfort can be effectively achieved through precise identification and control of window opening angles. This experiment demonstrates the potential application of machine learning in the realm of building energy efficiency, introducing novel ideas and methodologies for intelligent building design and energy management. Different from the previous traditional DSF research directions, DSFs are explored from the perspectives of different window opening angles and algorithmic prediction, and the improved RF algorithm is applied to establish a prediction model to explore the scientific design and operation of DSFs. This can promote the sustainable development of buildings, but the setting of the angle of the DSFs can still be optimized and the algorithm can be improved. The research methodology and flowchart are shown in Figure 1.
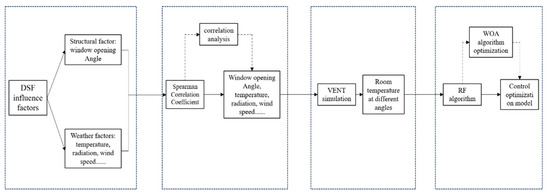
Figure 1.
Research methodology and flowchart.
2. Double-Skin Facade System
The DSF serves as the external enclosure of a building, encompassing factors such as radiative, convective, and conductive heat transfer [3]. The heat transfer of the DSF is influenced by its structure, material, and external natural factors, so the structural factors of the DSF also have an important influence on its performance.
Given the lower thermal resistance of a DSF in comparison to traditional solid walls, and its transparency, an external circulation mode is implemented during the cooling season. Only the upper and lower ventilation openings of the outer facade are opened, facilitating the entry and exit of outdoor air through the suspended windows of the outer facade. This circulation helps dissipate the absorbed heat in the cavity, thus reducing the building’s cooling load and energy consumption [12]. Therefore, the structure under study in this paper is designed to be opened both inside and outside.
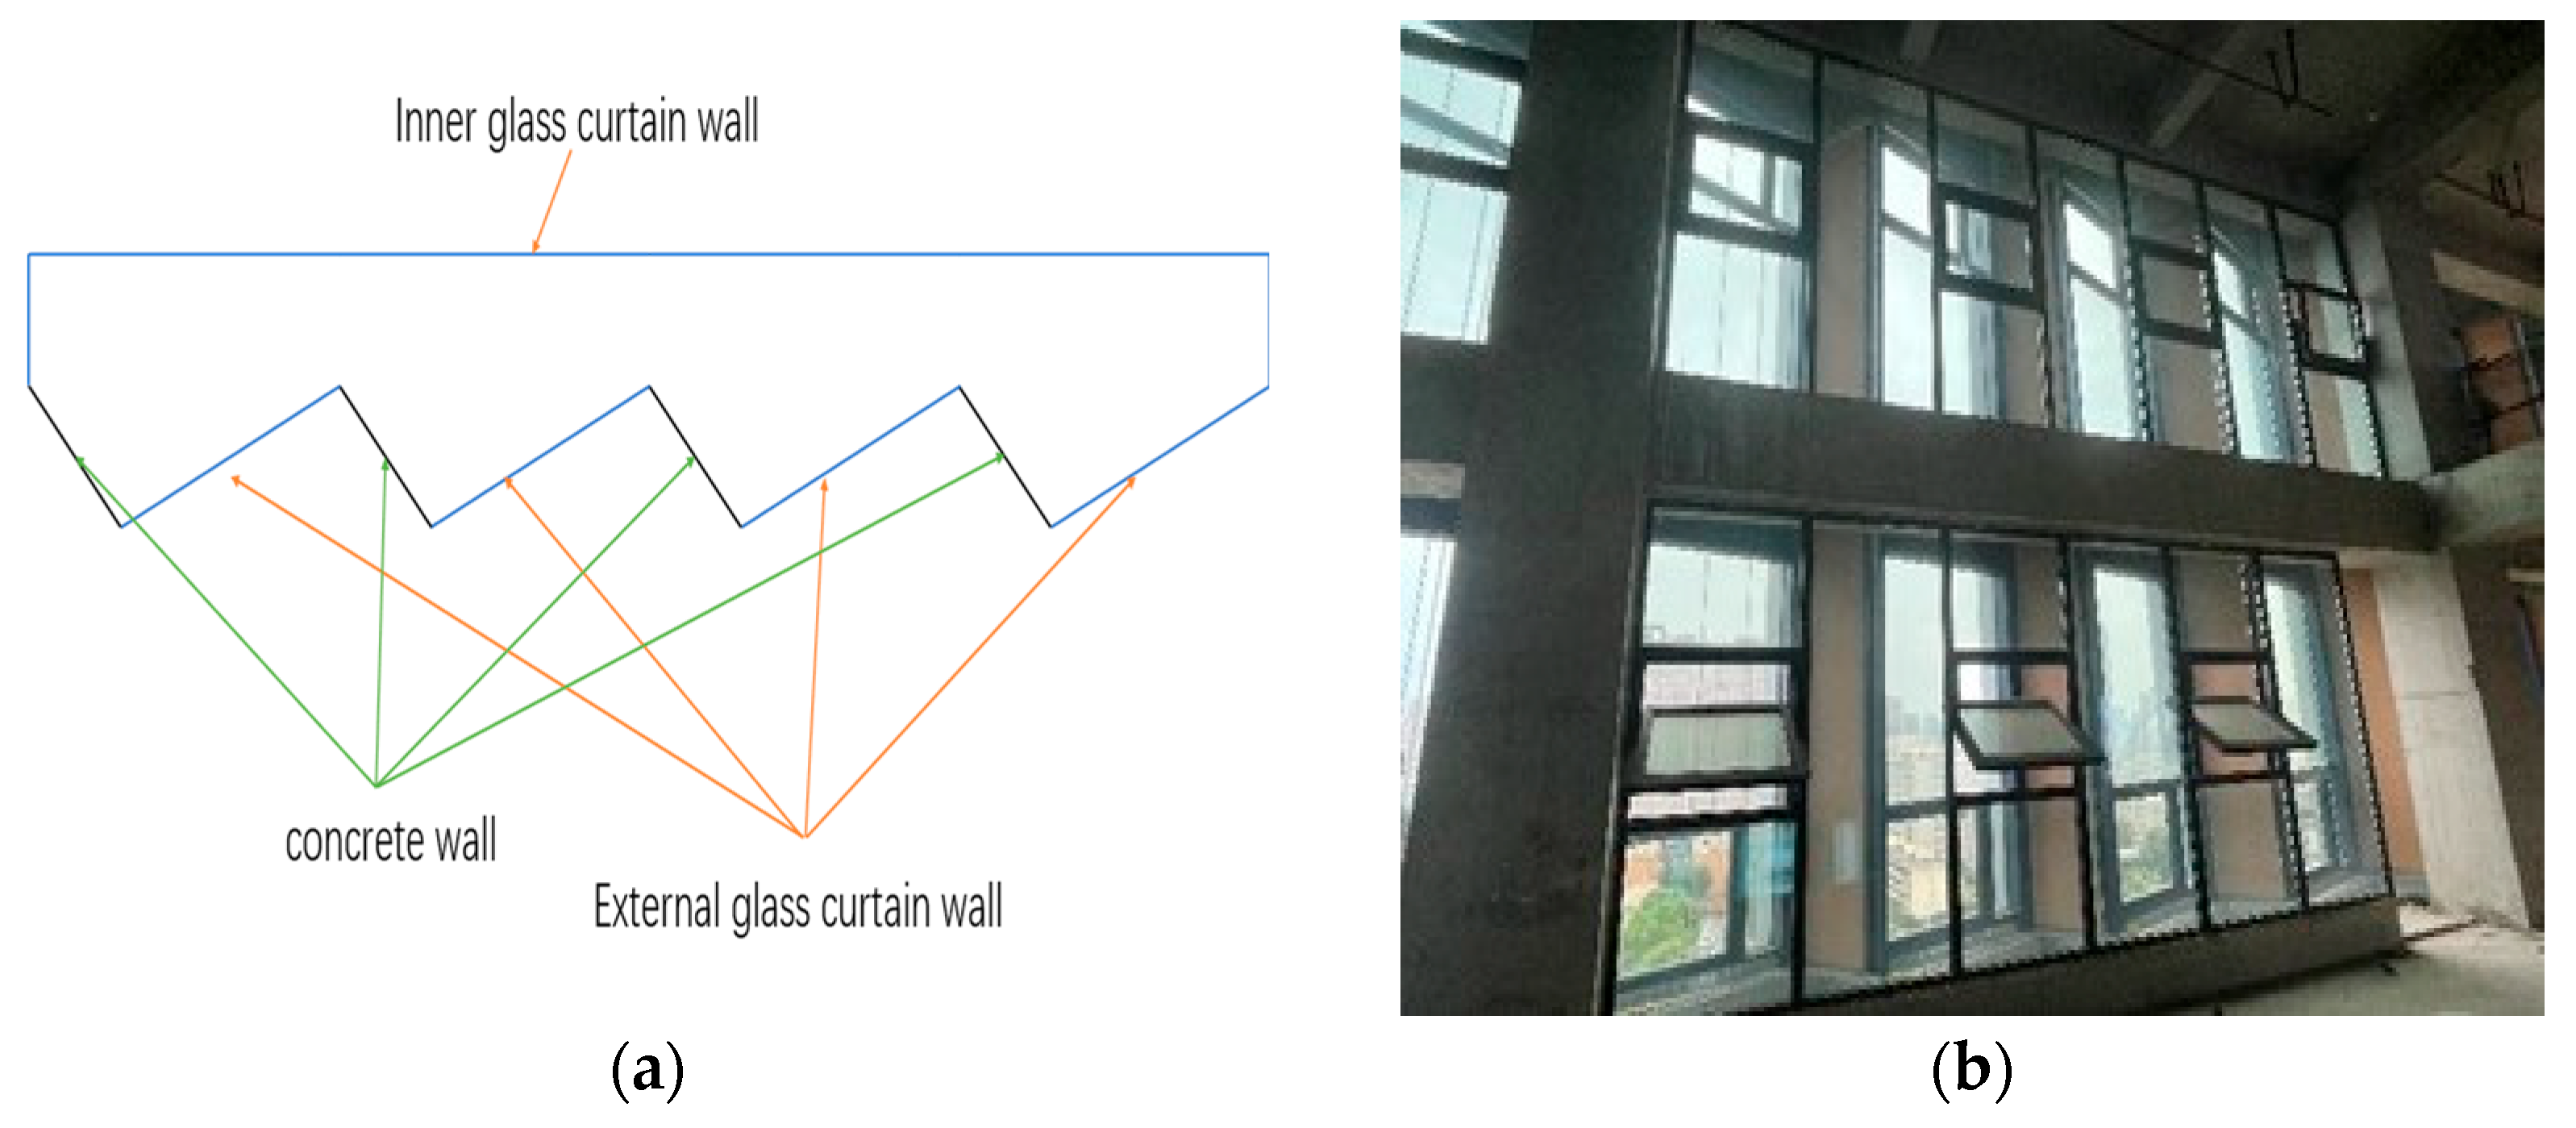
Our research focused on a U-shaped room located on the 14th floor, facing west, in the Training Building of Xi’an University of Architecture and Technology. The room is 7.6 m high, with an area of 1251.42 square meters. In the center is a square area measuring 8.4 m × 8 m, whose entire western façade is constructed with a DSF, as illustrated in Figure 2. The glass facade comprises a serrated outer facade with alternating walls and hollow glass panels, as detailed in Table 1. All of the parameters adhere to the national standard of China for architectural daylighting design [13].
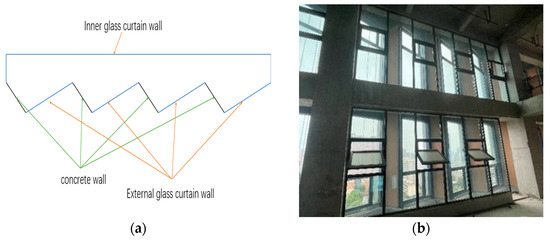
Figure 2.
Structure and physical representation of DSF: (a) sawtooth-shaped DSF (downward view); (b) interior photo of DSF.

Table 1.
DSF parameters.
Table 1 shows the parameters associated with the DSF, including the window-to-wall ratio, visible light transmittance, visible light reflectance, heat transfer coefficient, shading coefficient, and solar heat gain coefficient. These serve to characterize and evaluate its performance in terms of window design, including the proportion of windows to walls, percentage of light transmission and reflection, heat transfer capacity, and ability to provide shading against solar radiation. These parameters hold significance in the realms of architectural design and energy management, as they offer valuable guidance toward achieving a comfortable indoor environment and meeting energy-saving objectives.
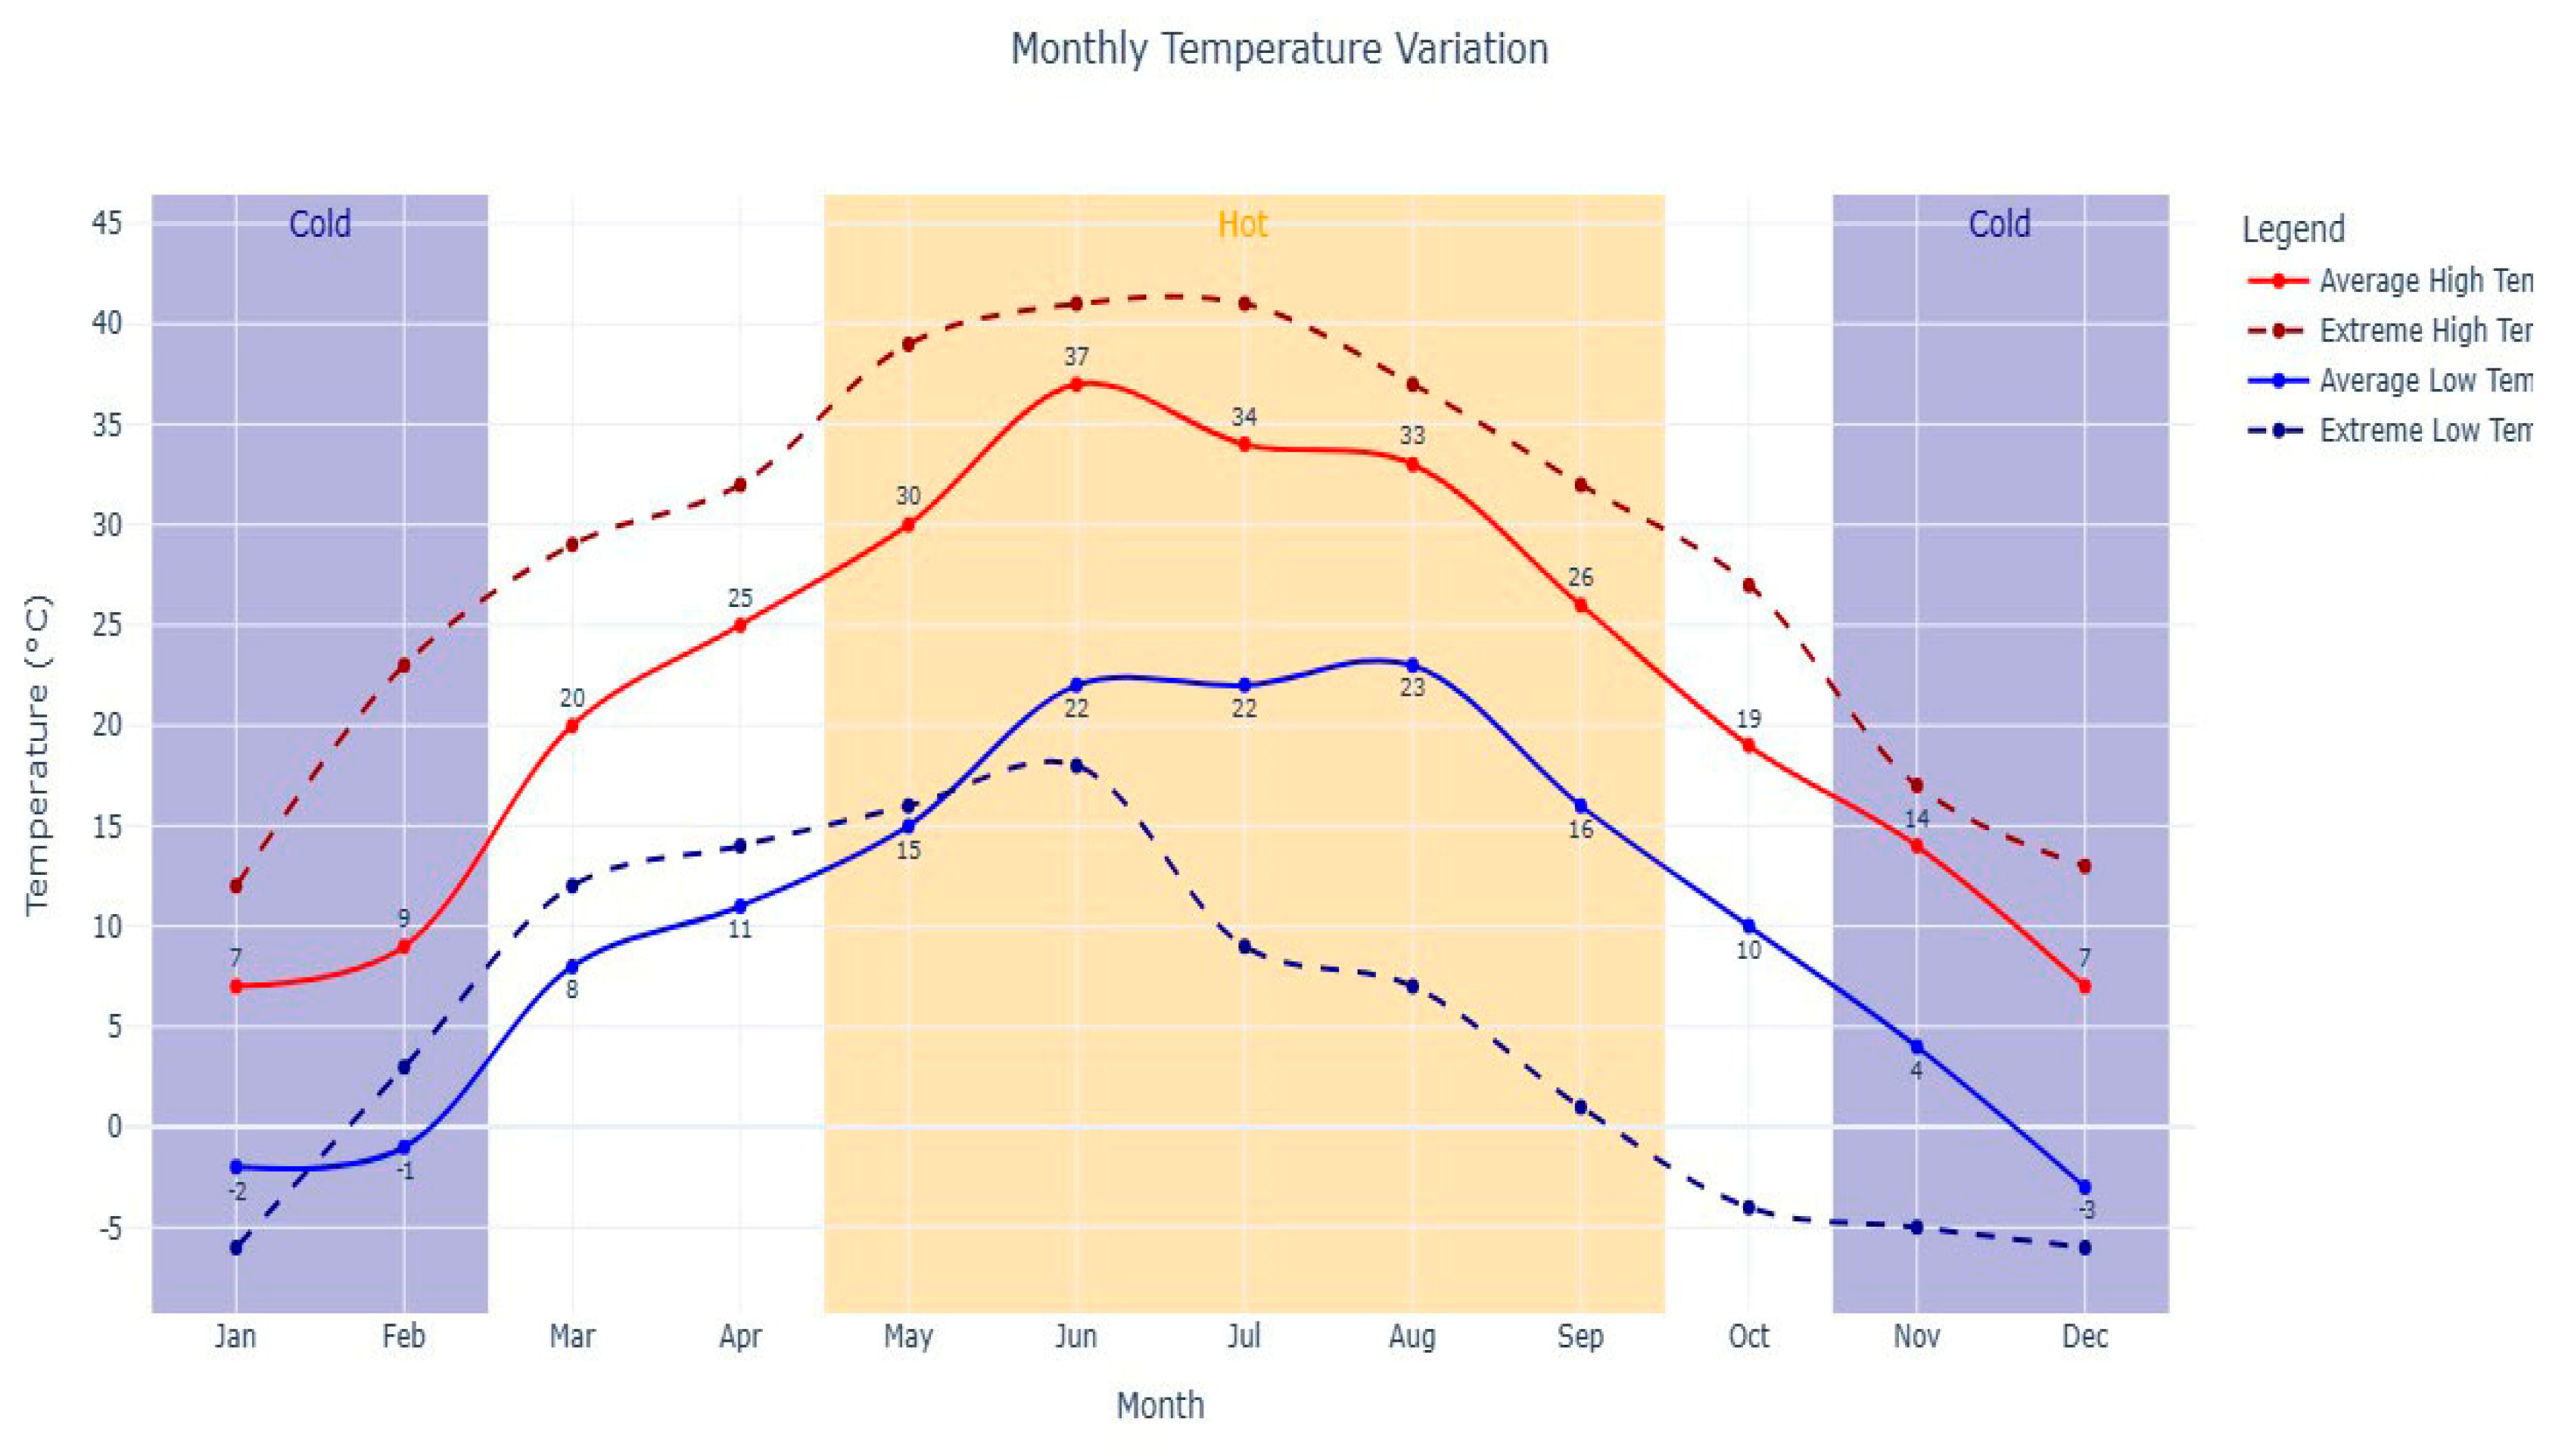
A series of experiments were conducted in Xi’an, a city located at approximately 108° E longitude and 34° N latitude in northern China. As shown in Figure 2, Xi’an has a typical climate of hot summers and cold winters. Based on the classification of building climate zones, Xi’an falls in the cold climate zone, characterized by hot and rainy summers, and cold and dry winters. The summer season (June to September) experiences the highest temperatures, frequently exceeding 30 degrees Celsius, and occasionally surpassing 35 degrees during the day. The average temperature at night is between 20 and 25 degrees Celsius. Figure 3 shows the annual temperature profile in Xi’an, with the average high and low temperatures labeled in the curve.
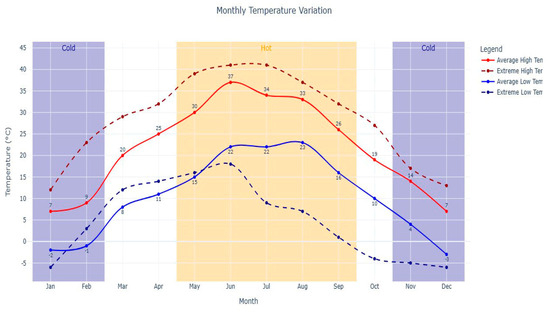
Figure 3.
Average high and low temperature in Xi’an.
3. Methodology
3.1. Spearman Correlation Coefficient
The Spearman correlation coefficient is employed to assess the monotonic relationship between two variables [14]. Unlike the traditional Pearson correlation coefficient, it does not assume a linear relationship between variables, and it can be applied to any form of monotonic relationship. Utilizing the Spearman method, it becomes possible to generate a correlation factor heatmap, enabling visual examination of the relationships among different factors. The heatmap utilizes distinct colors to indicate the strength of the correlation coefficient, facilitating swift identification of variable relationships.
The basic principles and steps of the Spearman correlation coefficient method to generate correlation coefficient thermal maps are as follows:
- Data preparation: First collect the data to be analyzed to calculate the correlation coefficient.
- The value of each variable is converted to a rank, and then the Spearman correlation coefficient between grades is calculated for each pair of variables. The calculation formula of the Spearman correlation coefficient is as follows [15]:
In the equations, is the difference between the grades of each pair of variables, and n is the sample size.
- 3.
- The correlation coefficient matrix is visualized as a heatmap, which shows the intensity of correlation between different variables by color.
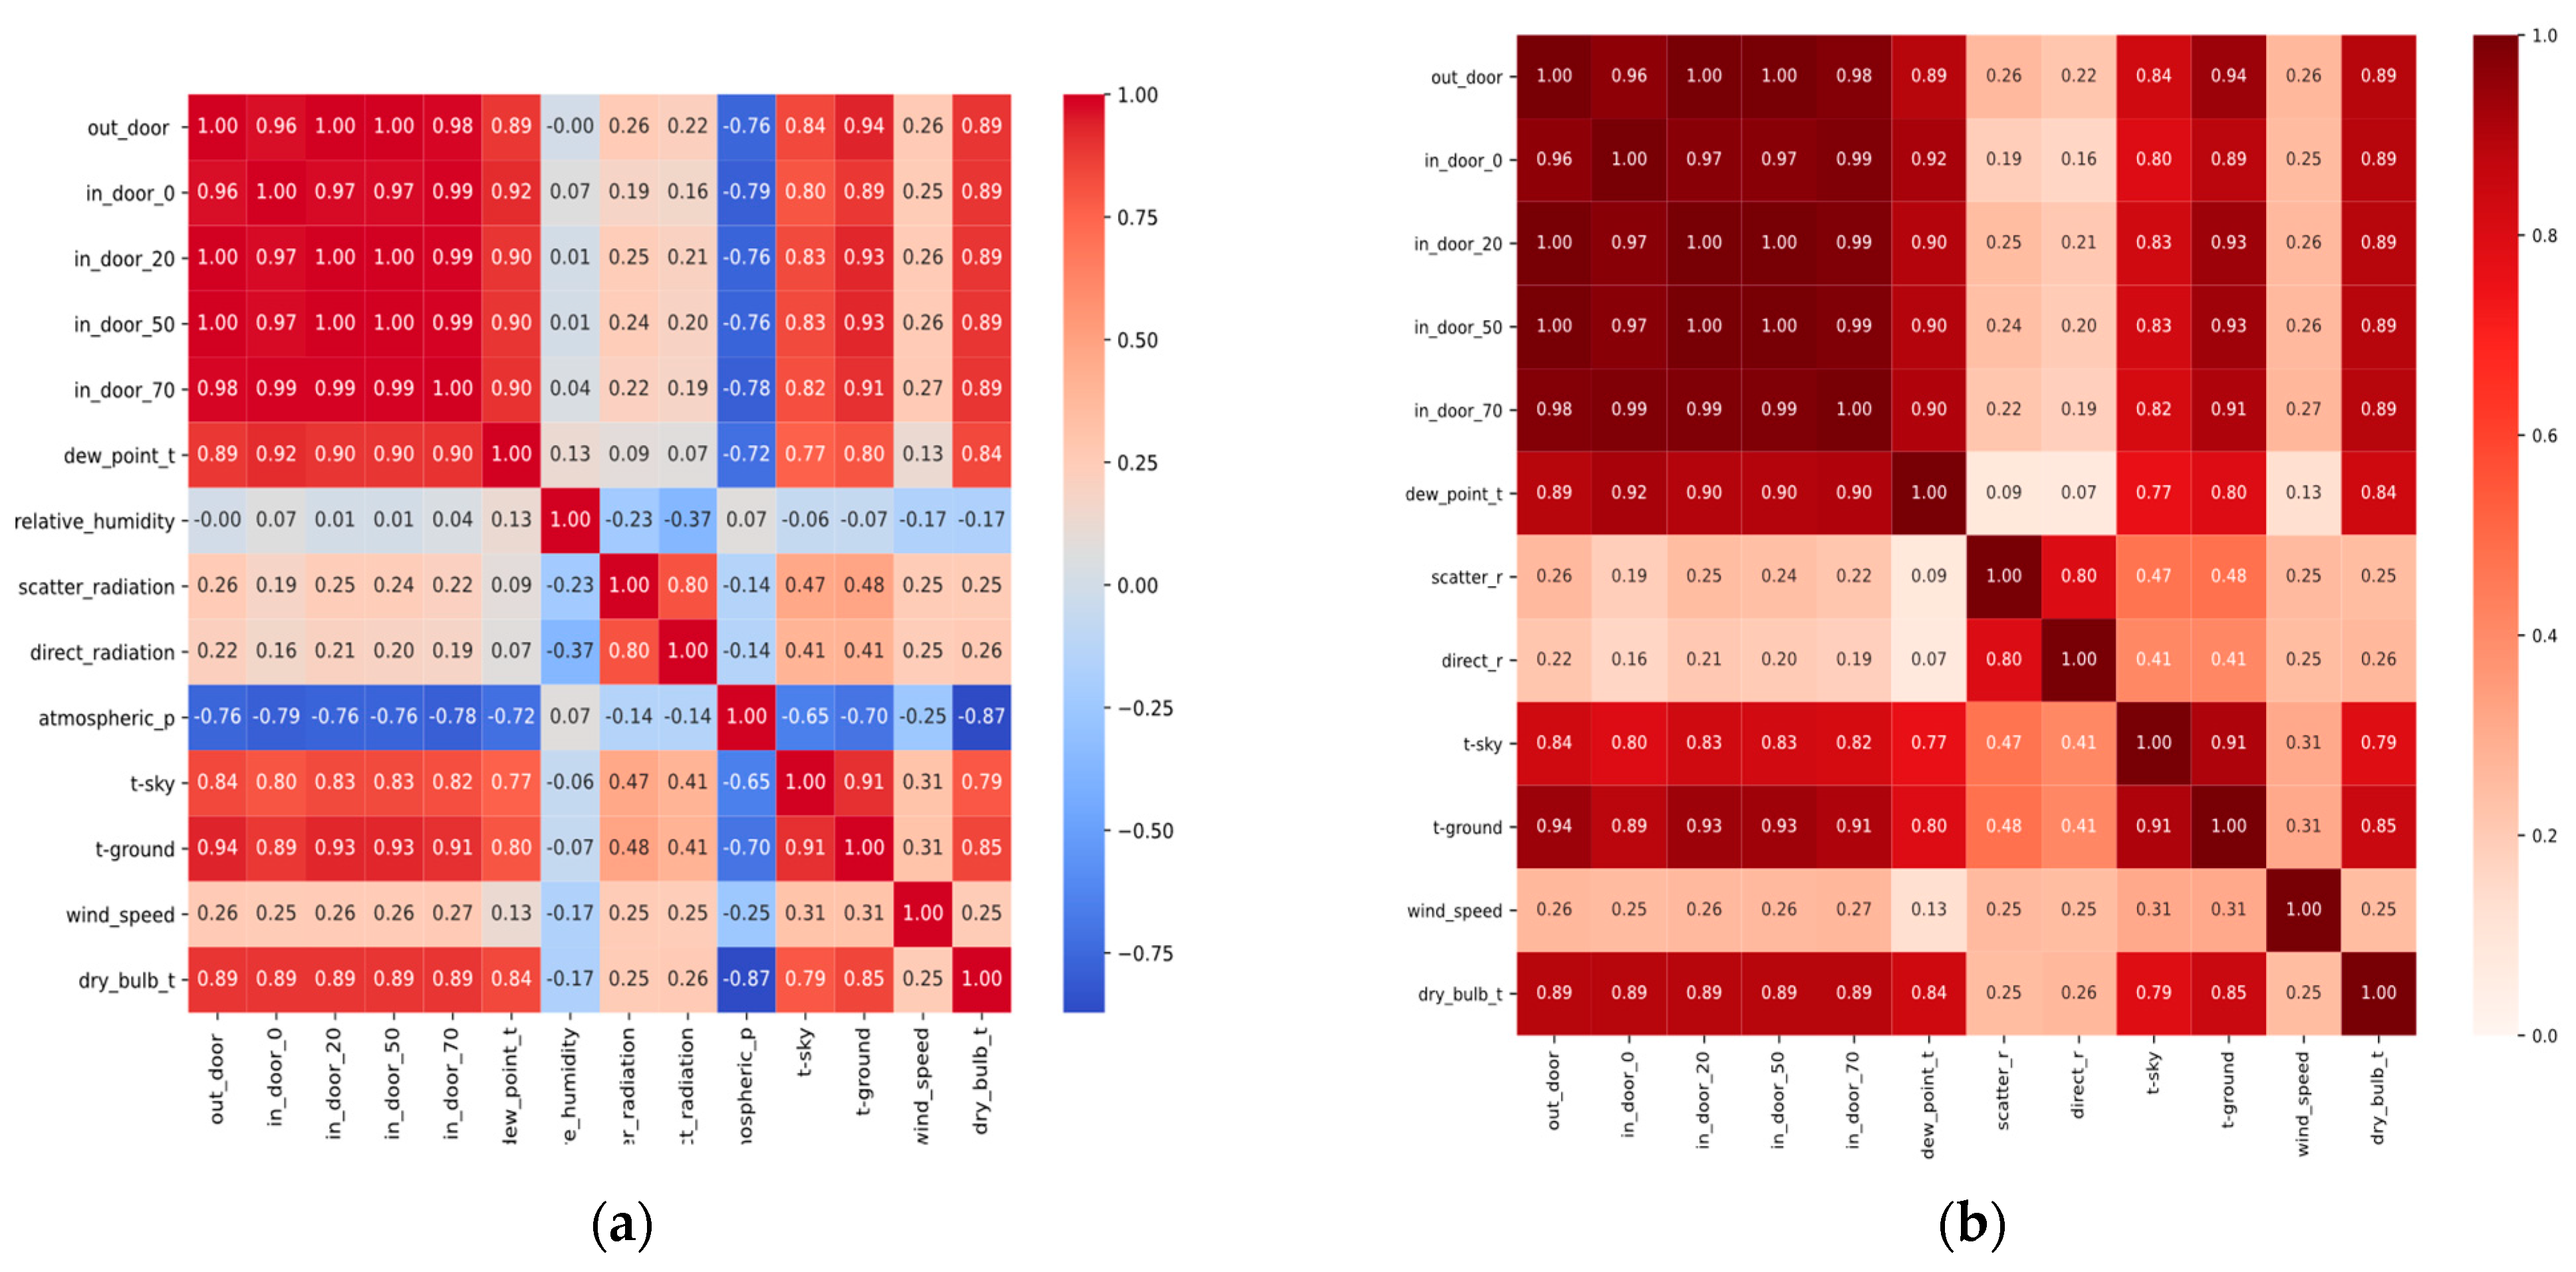
Climate data in Xi’an were collected and organized through weather stations to directly obtain comprehensive and relevant data, which were filtered and analyzed using the Spearman’s correlation coefficient method implemented in Python. As depicted in Figure 4, the heatmap of weather-related factors enables us to visualize the correlations among various factors. First, a negative correlation is observed between atmospheric pressure and indoor temperature. However, since atmospheric pressure tends to remain relatively stable, its impact on indoor temperature will not be further examined in this study. Second, relative humidity demonstrates little to no significant correlation with other factors, suggesting a lack of association with other variables. Wind speed variations and fluctuations in solar radiation are found to be linked to indoor temperature, depending on the window opening angles employed. Notably, dry bulb temperature, sky temperature, and ground surface temperature display a strong correlation, indicating a close relationship among these factors. The research object is close to the ground, the atmospheric pressure is stable, the relationship with the temperature is not direct, and the relative humidity changes in rare rainy weather, so the influence of atmospheric pressure and relative humidity can be excluded in order to study other major factors.
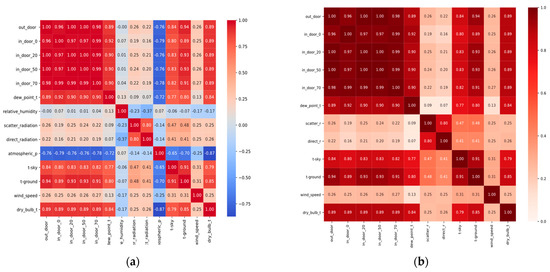
Figure 4.
Heatmaps of weather factors: (a) pre-screening weather factor heatmap; (b) heatmap of selected weather factors after screening.
Following a thorough screening and analysis process, the heatmap was reconfigured to include nine weather factors: outdoor temperature, indoor temperature at different opening degrees, dew point temperature, scattered radiation, direct radiation, sky temperature, ground temperature, wind speed, and dry bulb temperature. The outcomes in Figure 4 highlight varying degrees of correlation between these weather factors and indoor temperature, and hence they emerge as the primary influencers of fluctuations in indoor temperature.
Table 2 presents the key weather factors along with their correlations with variations in indoor temperature. Strong or moderate correlations are observed between outdoor temperature (T_out_door), dew point temperature (dew_point_t), scatter radiation (scatter_r), direct radiation (direct_r), sky temperature (t-sky), ground temperature (t-ground), wind speed (wind_speed), dry bulb temperature (dry_bulb_t), window opening angle, and indoor temperature variations. These findings underscore the significance of weather factors in influencing indoor temperature, and serve as a foundation for advancing our understanding and control of indoor temperature.
Table 2.
Main weather factors that influence indoor temperature changes.
3.2. Improved Random Forest
RF is a robust machine learning approach capable of handling nonlinear relationships among multiple features, with exceptional predictive accuracy [16]. By gathering building parameters and environmental data as features, an RF model can be trained to determine the optimal window opening angle to enhance indoor temperature and minimize energy consumption. This algorithm employs multiple randomly generated trees for decision-making, and combines their outputs to yield the final outcome. The application of RF offers decision support grounded in actual data and models, helping architects and managers to make well-informed decisions regarding window opening angles, and to further enhance the energy efficiency of buildings.
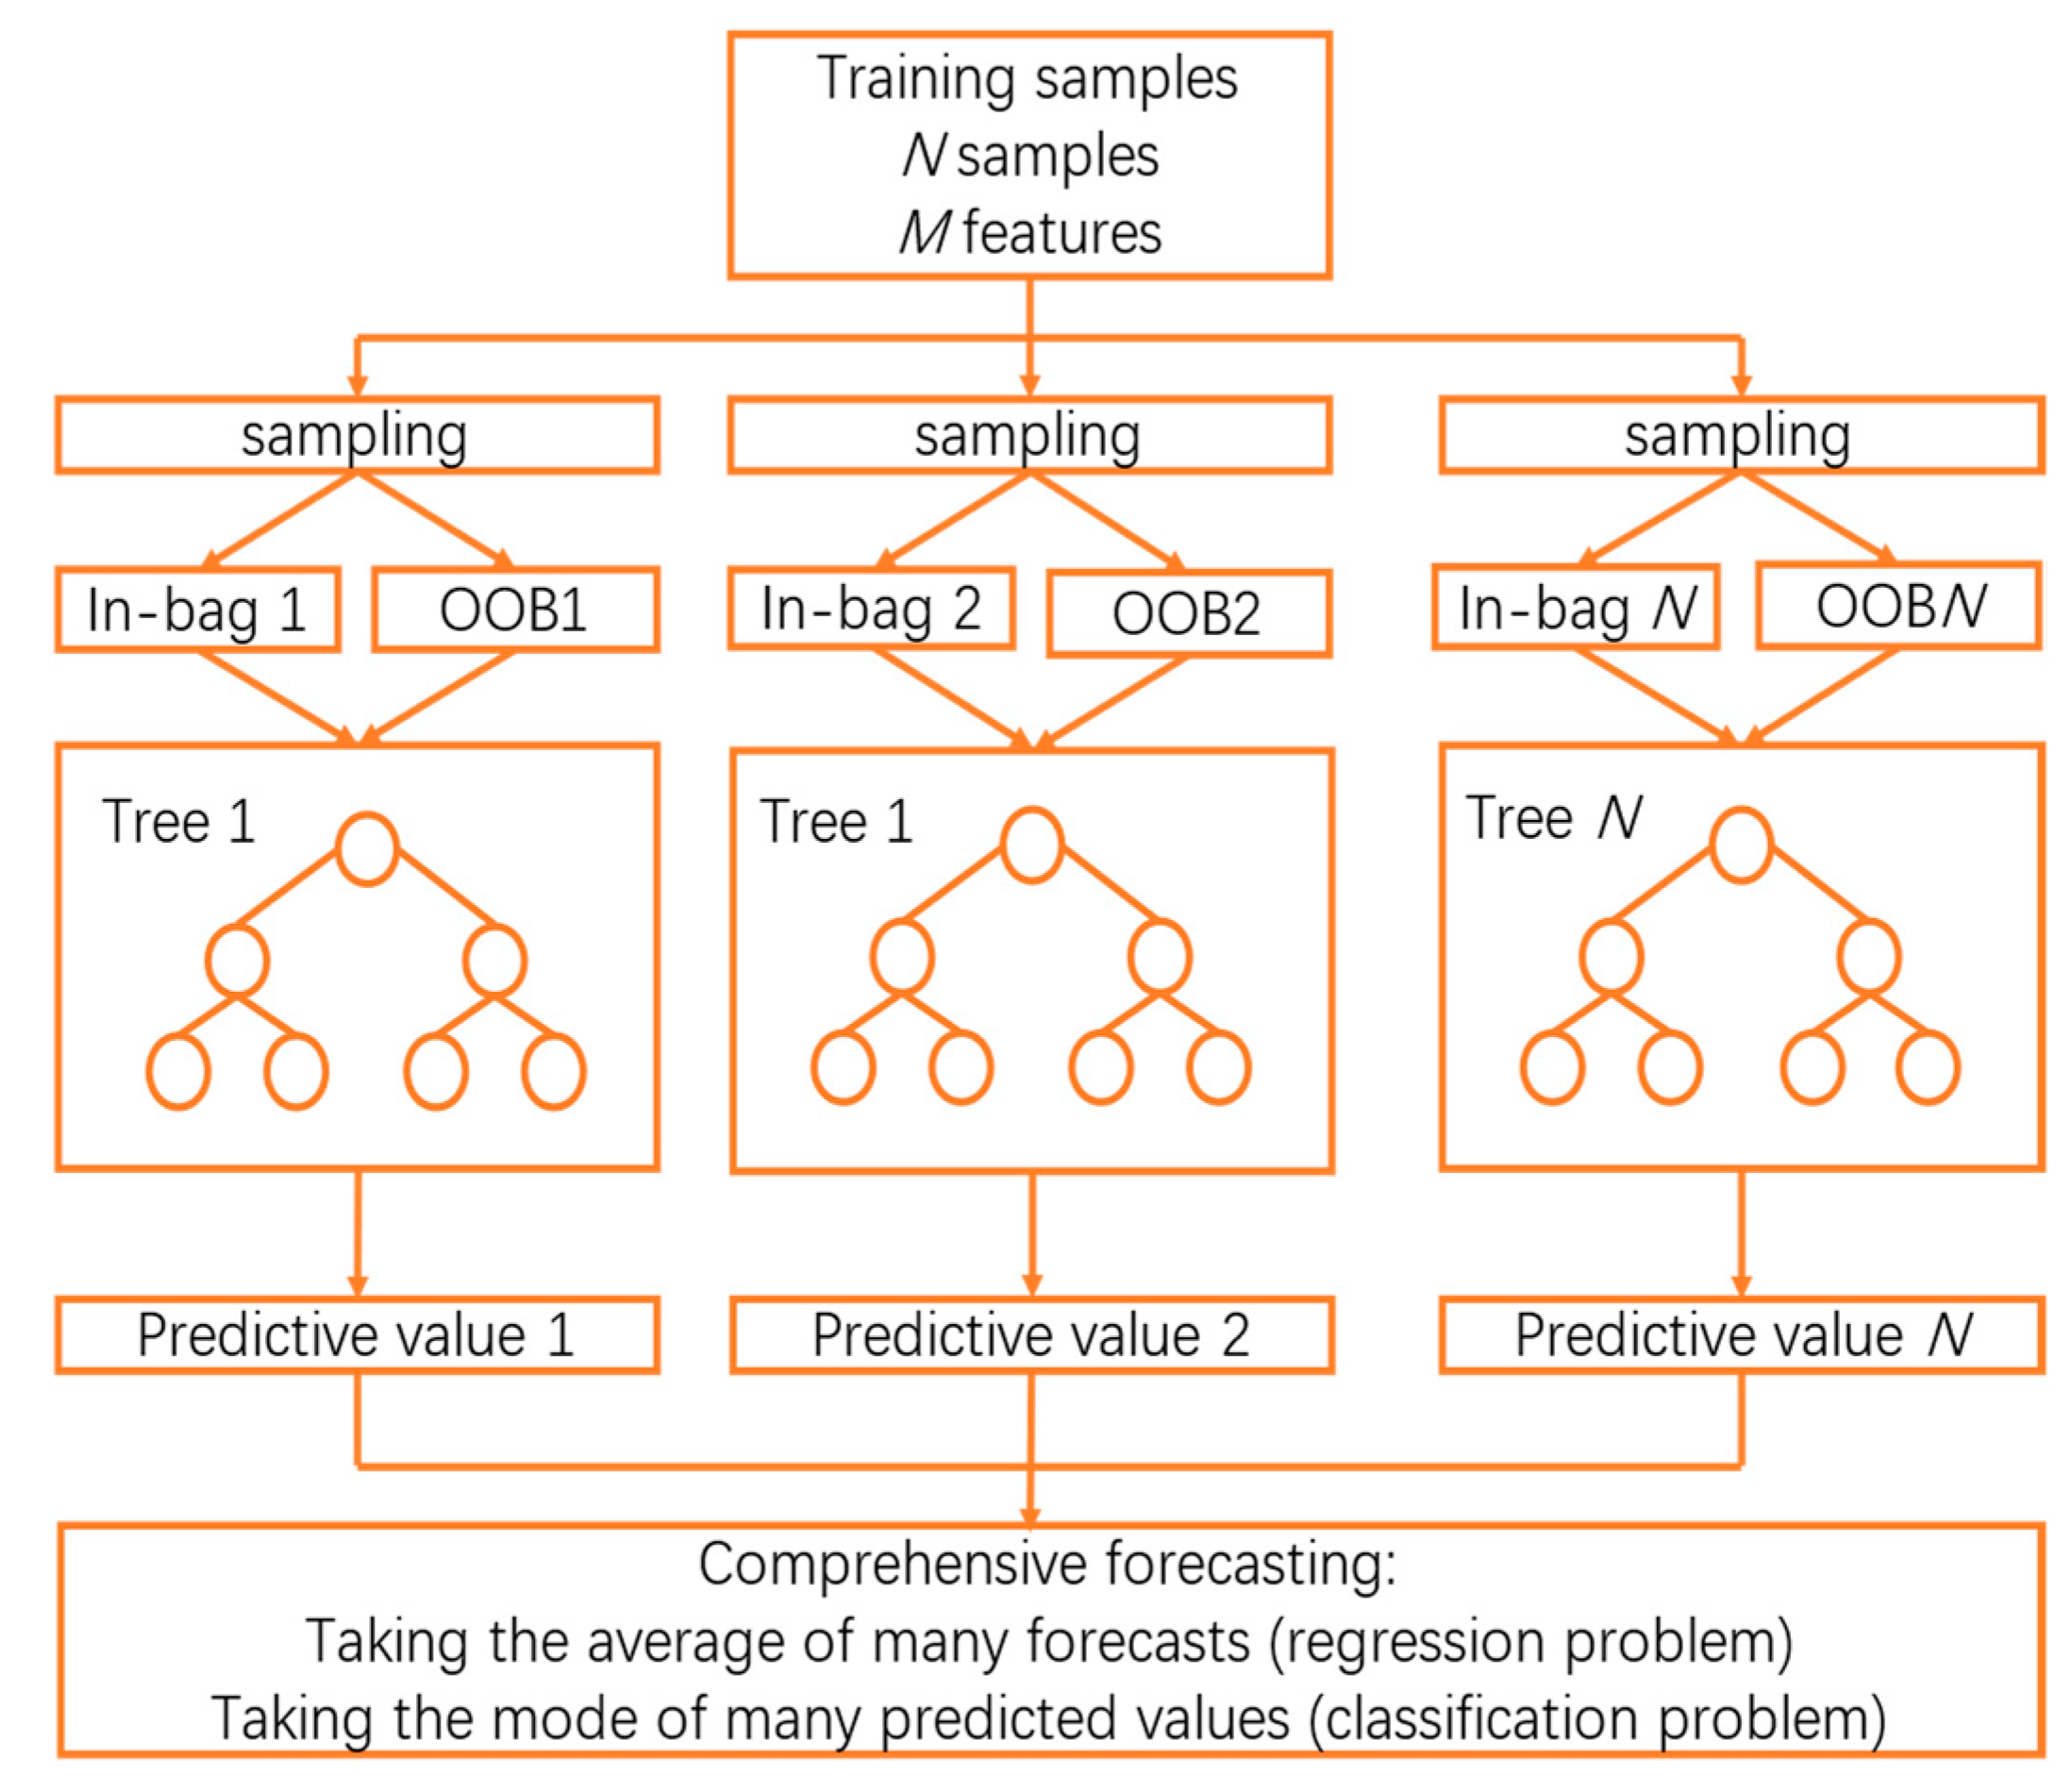
Figure 5 depicts the process of the RF algorithm.
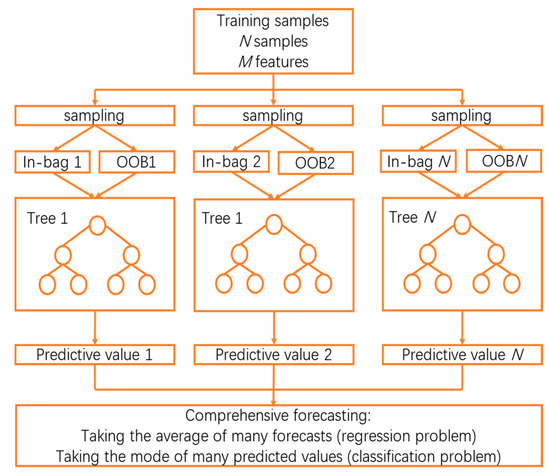
Figure 5.
Process flow diagram of random forest algorithm.
N training samples are randomly chosen from the original dataset using bootstrap sampling, with each training set approximately 2/3 the size of the original dataset. The unselected data are known as out-of-bag (OOB) data, which are not utilized to train the regression trees. Subsequently, a classification regression tree is constructed for each training set, creating a forest comprising N decision trees. During the growth phase of each tree, m (m ≤ M) feature variables are randomly selected from the total M variables, and the optimal attribute is determined based on the minimum Gini coefficient to split the internal nodes. Finally, the predictions from the ensemble of N decision trees are combined. For classification problems, the mode of the voting results serves as the ultimate classification outcome. The optimal number of classification regression trees is determined through trial and error; the specific calculation formula is as follows [17]:
In the equations, is the mean squared error; and are the respective true and predicted values of the OOB data, respectively; and and are the variance and correlation coefficient, respectively, of the predicted values of the OOB data.
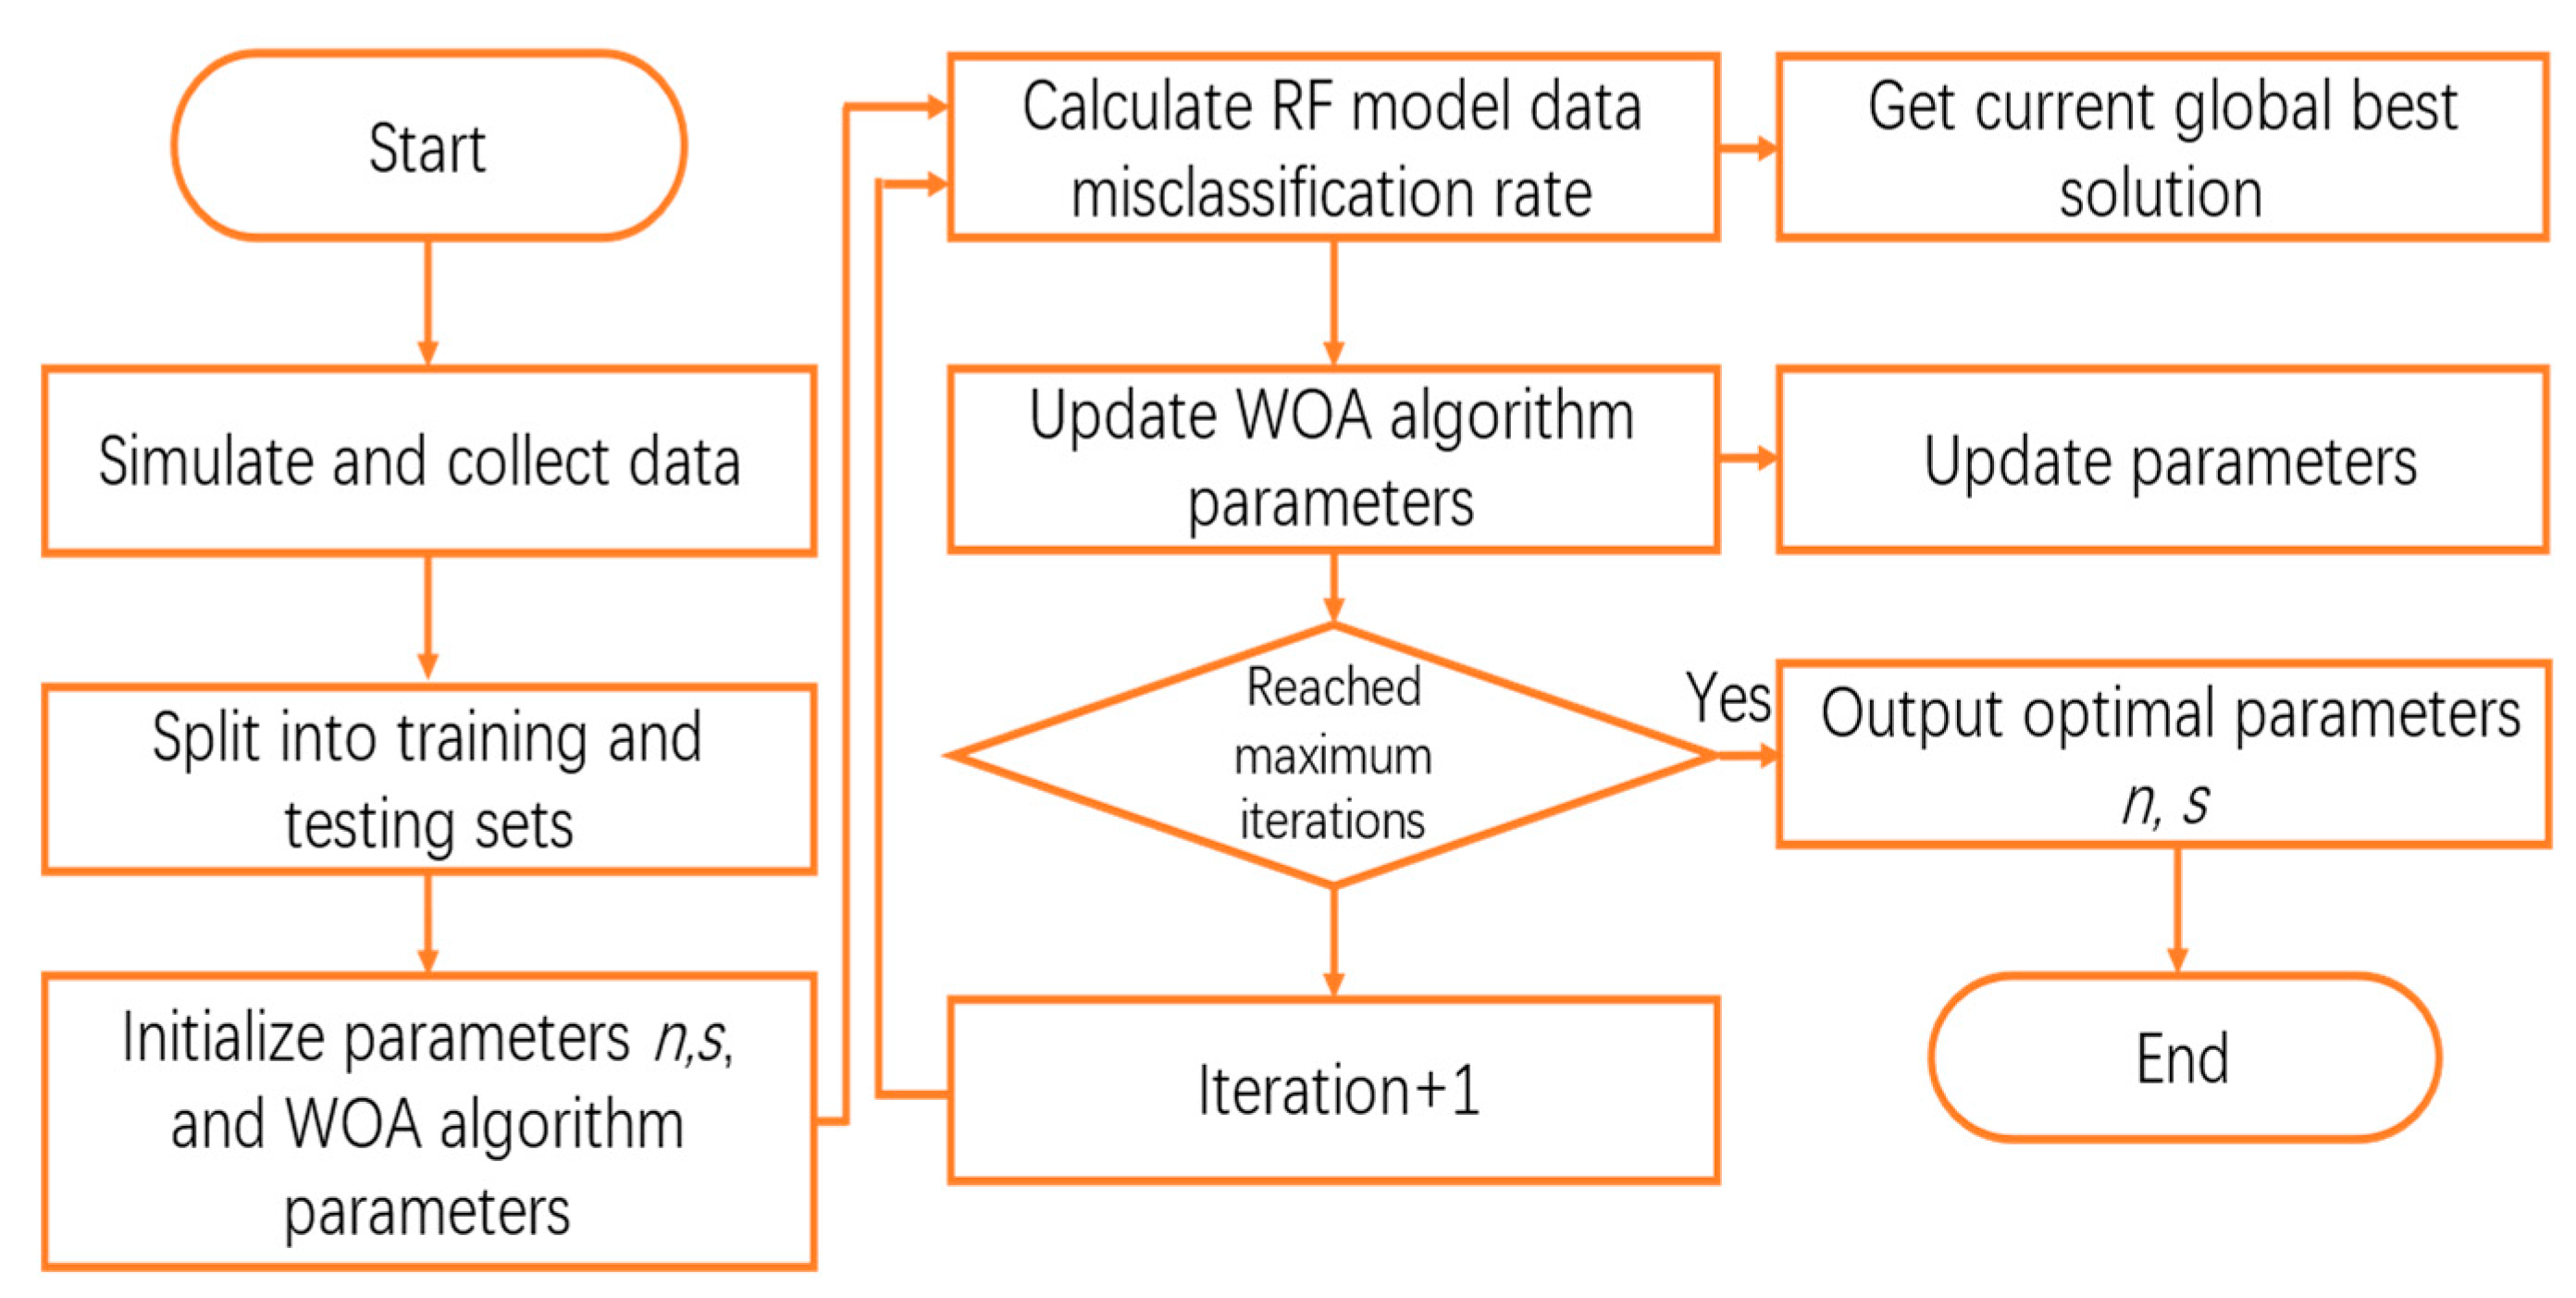
The selection of the scale s and number of feature subsets n for the decision tree-based classifiers in the RF algorithm have a significant impact on the results. To improve the accuracy of the window opening angle for the curtain wall, a whale optimization algorithm (WOA) is used to find the optimal parameter combination of the diagnostic model within a certain time and space complexity [18], as shown in Figure 6. WOA is inspired by the predatory behavior of whale groups and was proposed by Mirjalili et al. in 2016 to solve optimization problems by simulating the predatory behavior of whales in whale groups. Its basic principle is divided into three stages: initialization stage, iterative optimization stage, and convergence judgment stage, which has the characteristics of global optimization, simplicity, efficiency, and strong adaptability.

Figure 6.
Flowchart of WOA-RF process.
Approximately 20% of the feature parameters were not included in the training of each decision tree-based classifier in the RF model. These were treated as OOB data, and the OOB error rate served as the objective function for optimization using the WOA. The objective function was as follows:
where and are the respective numbers of correctly and incorrectly classified samples in the OOB data, respectively, is the number of feature attributes in the original samples, and is the upper limit of the size of the base classifier (decision tree).
4. Experimental Analysis
4.1. Simulation and Analysis of Indoor Temperature
VENT engineering 2018 software was utilized to simulate the scenario, as follows:
- Set up the project in the software;
- Calculate the wind pressures for both indoor and outdoor environments;
- Apply the calculated wind pressures to the doors and windows;
- Adhere to the Code for Design of Heating, Ventilation, and Air conditioning in Civil Buildings [19] by setting the air exchange rate to 0.5 times per hour, and conduct the simulation accordingly;
- Extend the window sashes, and establish four positions based on the window type and opening angle: 0°, 20°, 50°, and 70°; since the subject’s opening angle was limited, the DSF opening angle was chosen for these four options.
- Import the data into the thermal comfort software, and define the ventilation rate for each room type;
- Perform the necessary calculations;
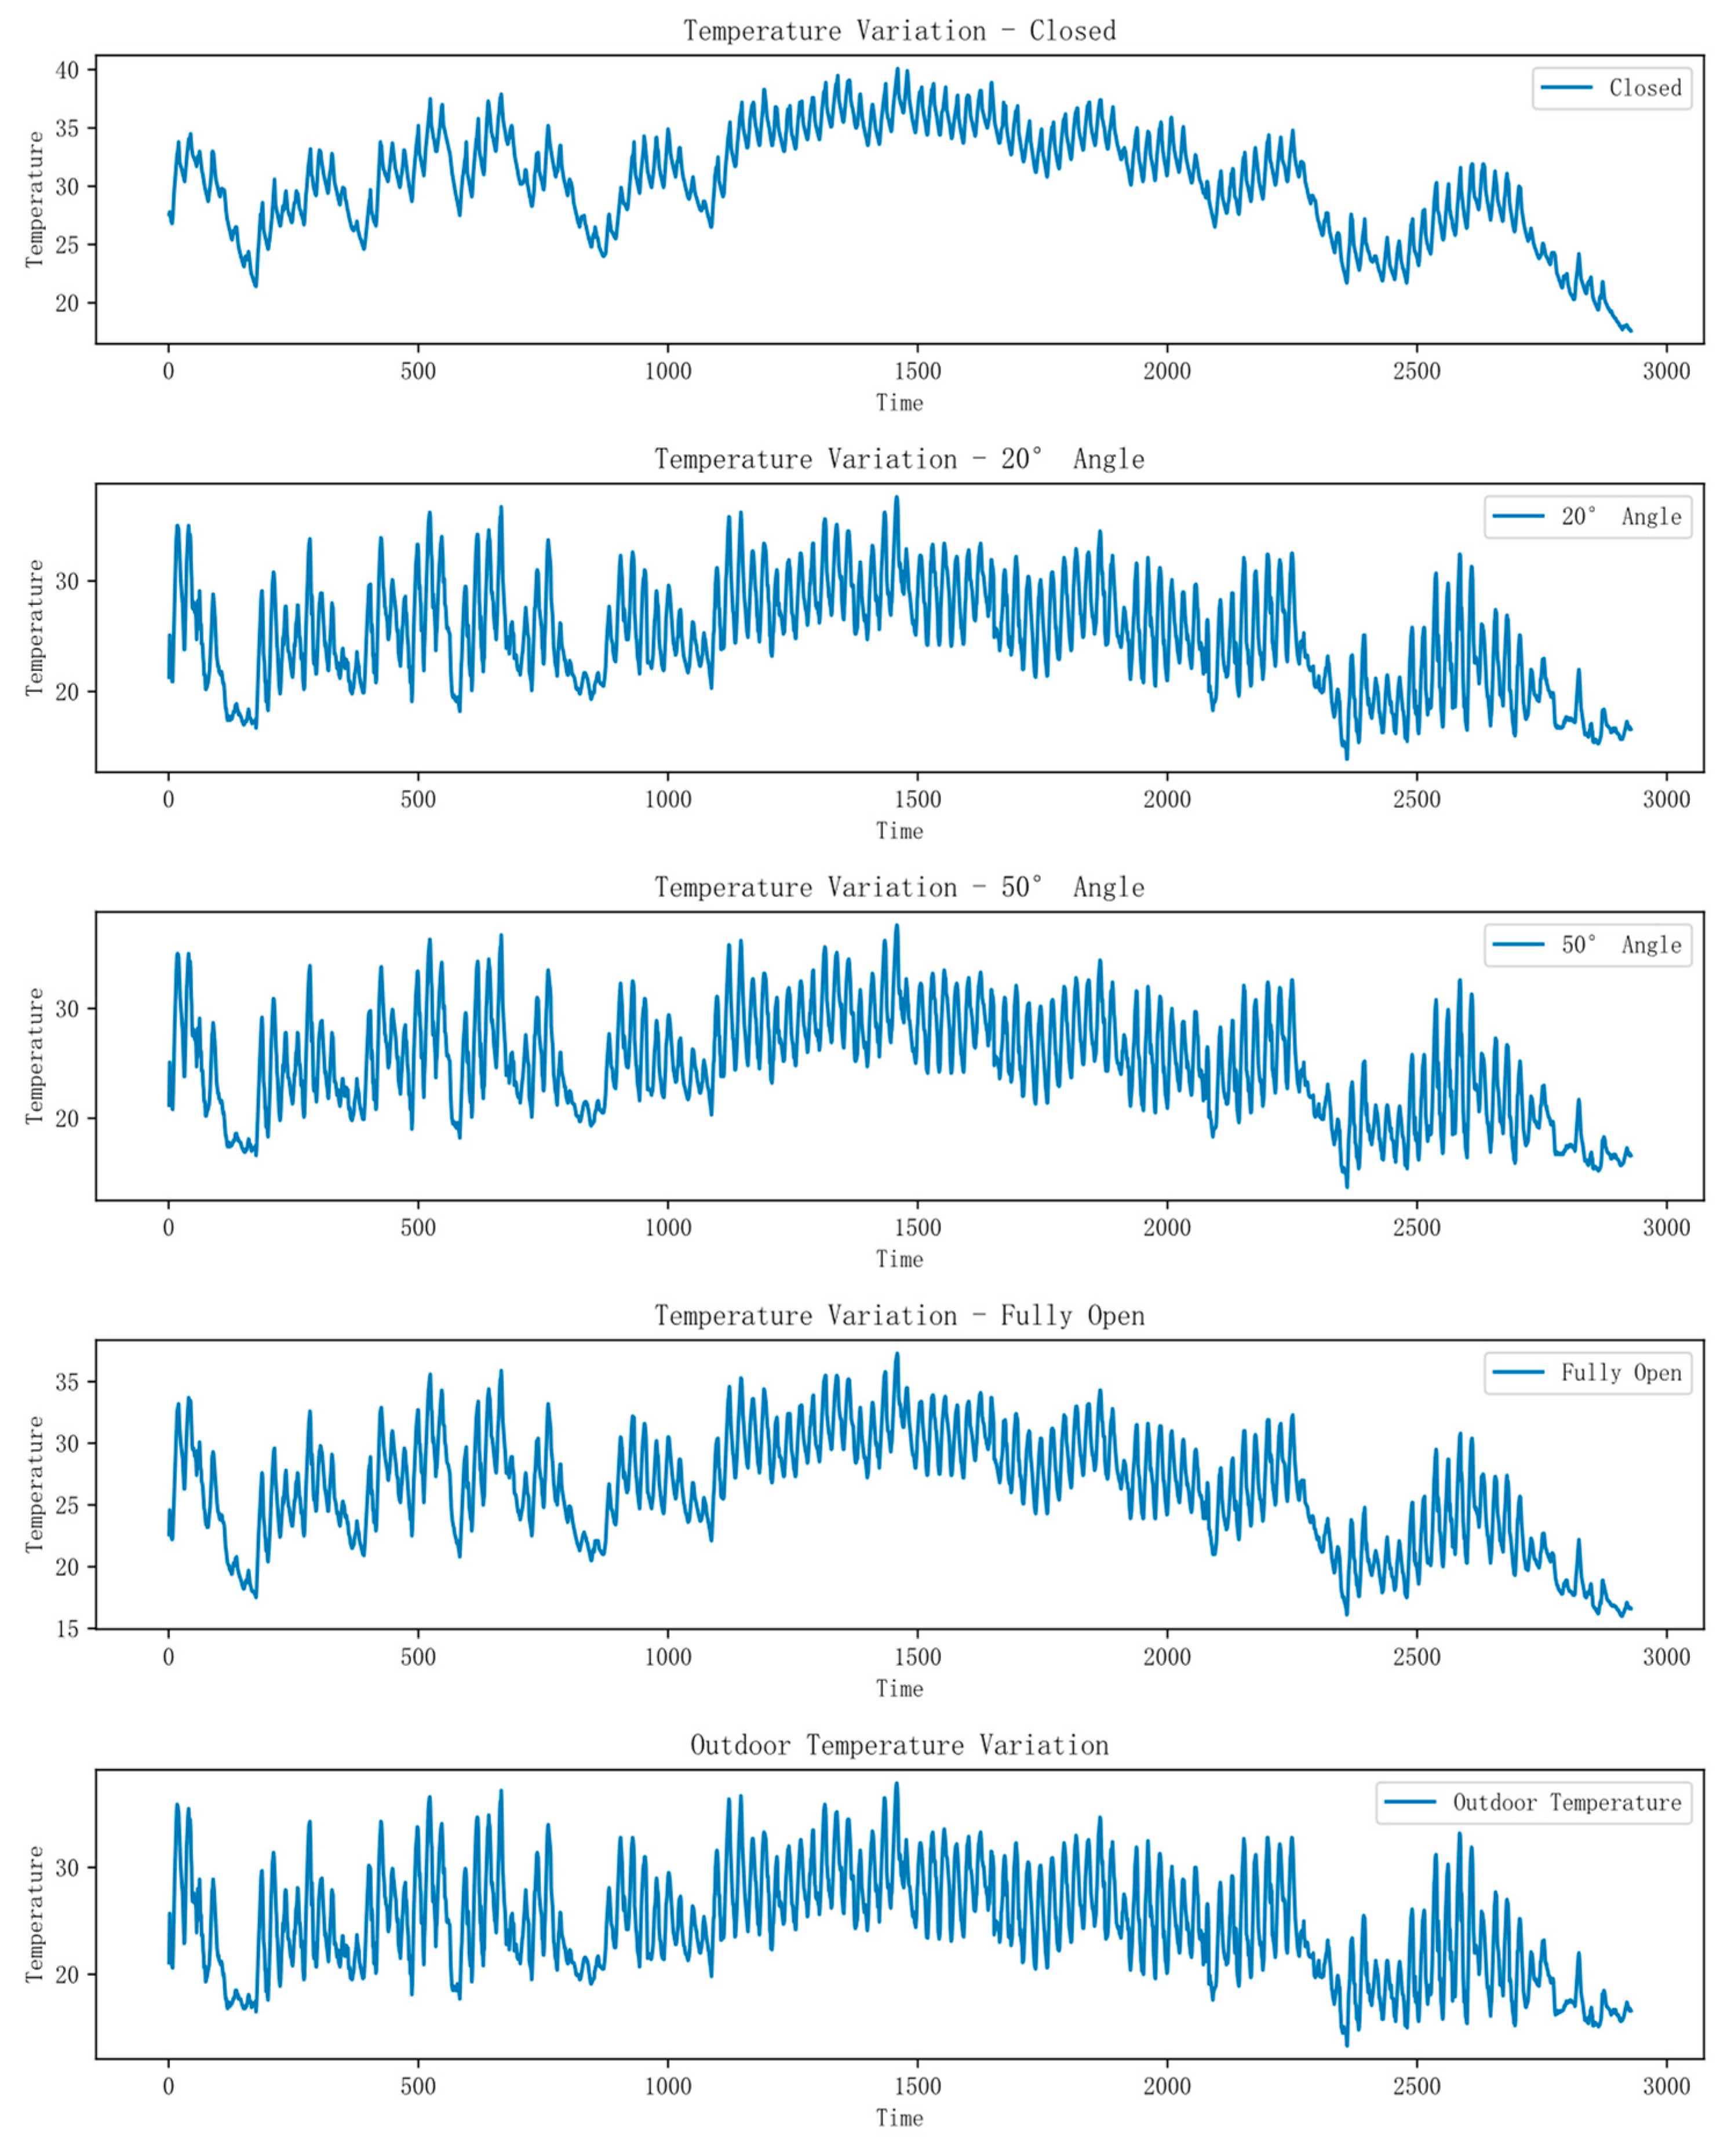
- Obtain the indoor temperature corresponding to different opening angles under the same climatic conditions, with outcomes shown in Figure 7.
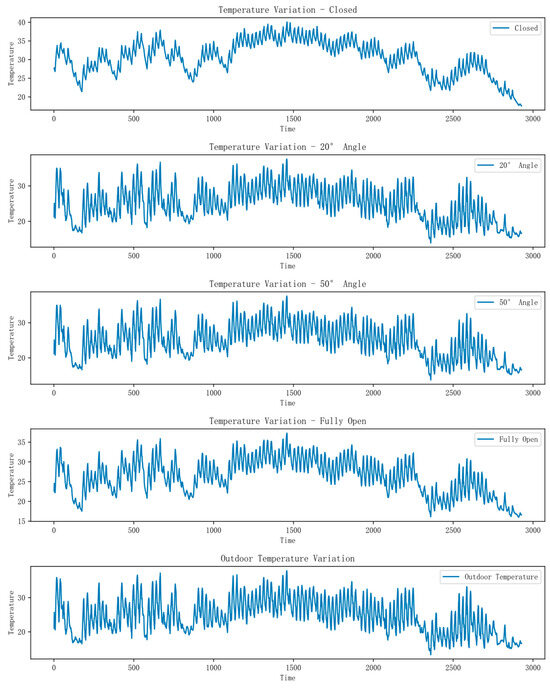 Figure 7. Comparison of indoor and outdoor temperatures in summer.
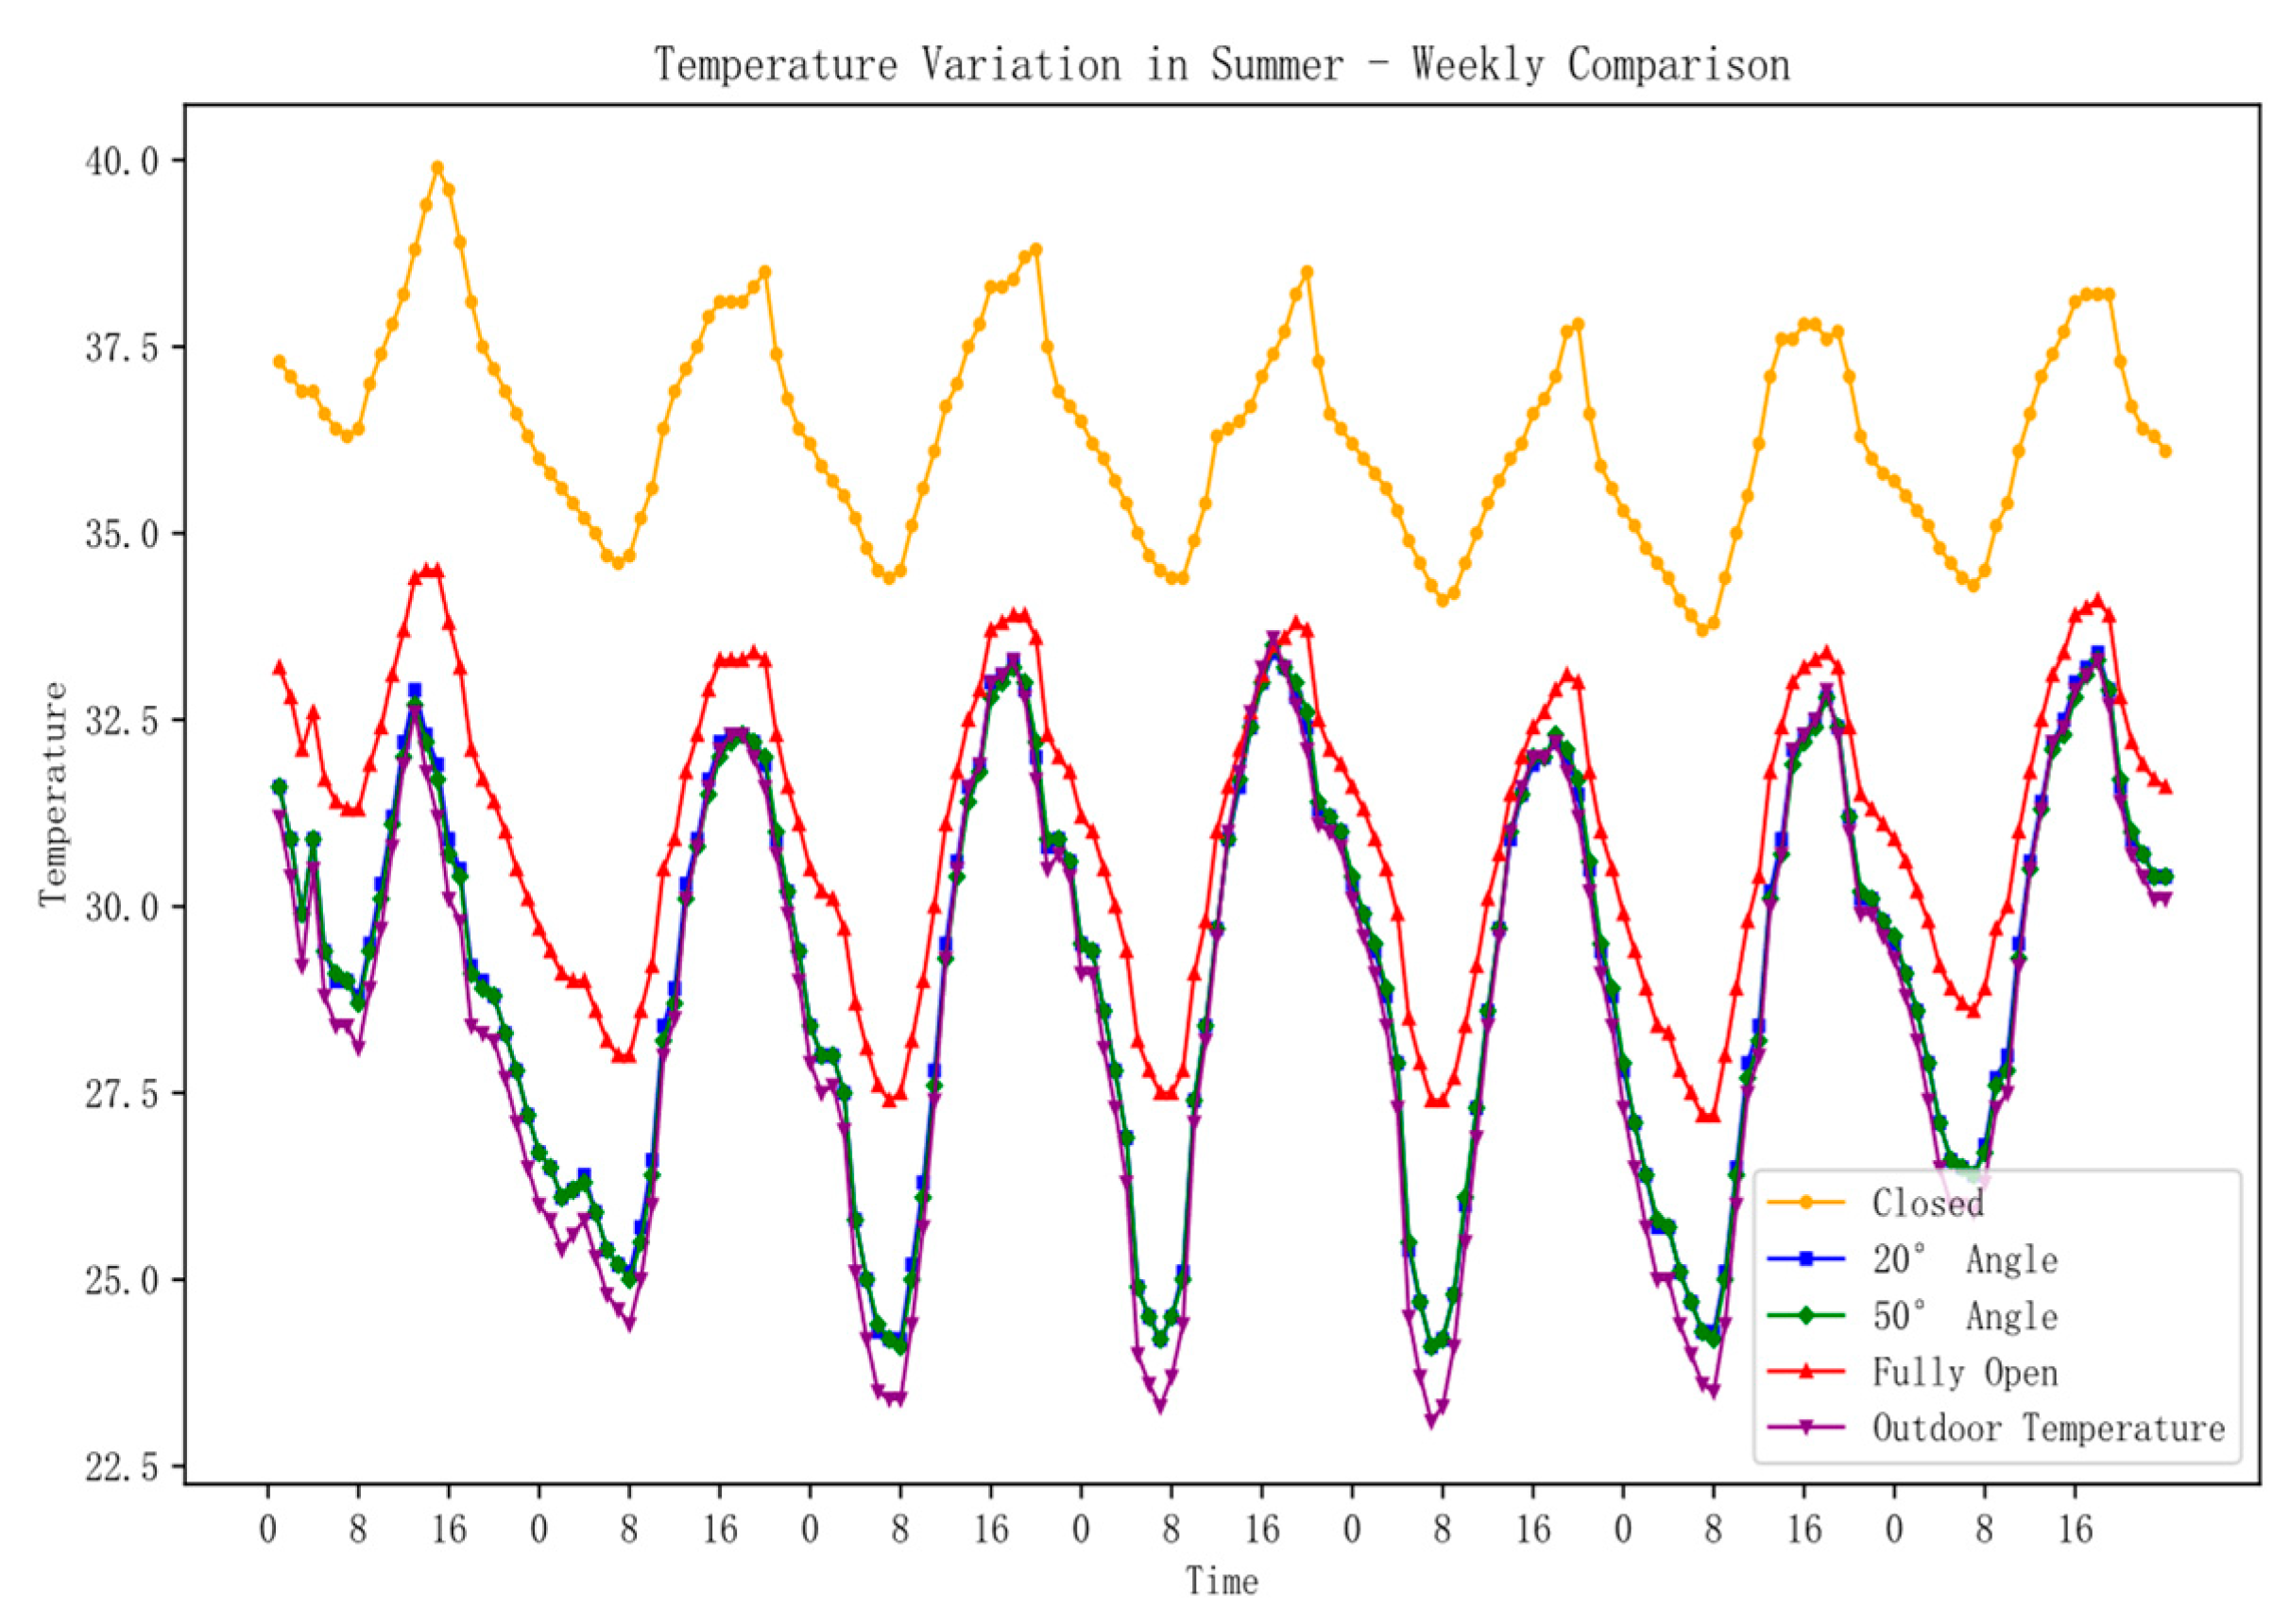
Data were selected for 1–7 August 2023, a mid-summer period in August when daily weather is generally representative, in order to comprehensively compare temperature differences among various opening angles. Figure 8 visualizes the effects of different opening angles on indoor temperature under typical hot weather conditions throughout this week.
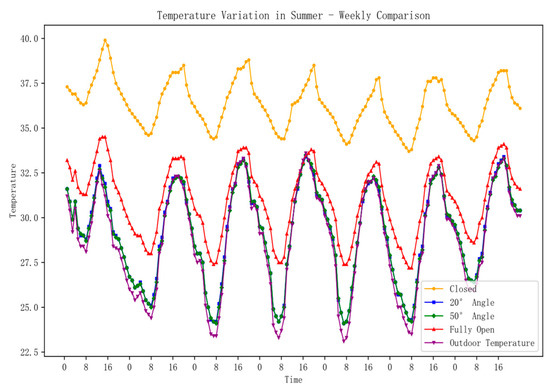
Figure 8.
Comparison of indoor and outdoor temperatures in a typical week in summer.
When the opening angle is set to 0 degrees, indicating that all of the ventilation openings are closed, the indoor temperature may rise significantly above 30 degrees Celsius, because, without ventilation, solar radiation can penetrate the facade and enter the indoor space, while the accumulated heat cannot be effectively expelled.
When the opening angle is set to 20 degrees or 50 degrees, a reduction in indoor temperature is observed. This is because an appropriate opening angle allows outdoor air to enter the ventilated cavity of the facade, facilitating the removal of some absorbed heat and reducing the indoor heat load. However, at these opening angles, the air in the ventilated cavity is influenced by solar radiation, causing it to warm up. Nevertheless, due to the high thermal resistance of the ventilated cavity, the dissipation of heat is limited. Consequently, it effectively decreases heat dissipation from the building envelope and reduces the demand for a cooling load.
When the opening angle reaches 70 degrees, an increase in indoor temperature can be observed. This is because fully opened ventilation openings allow outdoor air to enter the indoor space directly, bypassing the ventilated cavity. Consequently, solar radiation heat can directly penetrate the indoor space, leading to an elevation in the indoor heat load.
During daytime in the summer, adjusting the opening angle of the DSF’s ventilation openings proves beneficial in regulating indoor temperature. Optimal opening angles, such as 20 degrees or 50 degrees, contribute to lowering the indoor temperature, reducing reliance on air conditioning, and consequently decreasing the building’s energy consumption. By selecting suitable opening angles for the ventilation openings, the DSF system can effectively achieve passive energy-saving effects. However, during nighttime, the influence of different opening angles on indoor temperature is relatively minimal. Nighttime temperatures are typically lower, and solar radiation is weaker, resulting in a limited impact on indoor temperature. During this period, the primary objective of the DSF is to regulate indoor air quality and eliminate the need for mechanical ventilation, thereby attaining energy savings.
During nighttime, the degree of ventilation can be controlled by adjusting the opening angle of the ventilation openings. Generally, both the inner and outer facade ventilation openings remain closed, creating a solar room effect. The choice of the opening angle during nighttime depends on the desired indoor air quality. Appropriate opening angles facilitate the convection of indoor and outdoor air, support the metabolic process of indoor air, and mitigate humidity and accumulation of harmful substances, thereby enhancing indoor air quality.
By appropriately adjusting the opening angle during nighttime, it becomes possible to regulate indoor air quality without relying on mechanical ventilation systems, thereby achieving energy savings. Although nighttime ventilation has a relatively minor impact on indoor temperature, it is a passive method that contributes to improved indoor environmental comfort and reduces reliance on mechanical ventilation. By considering adjustment strategies for both nighttime and daytime, the energy-saving potential of the DSF can be maximized.
4.2. Optimization of Window Opening Angle
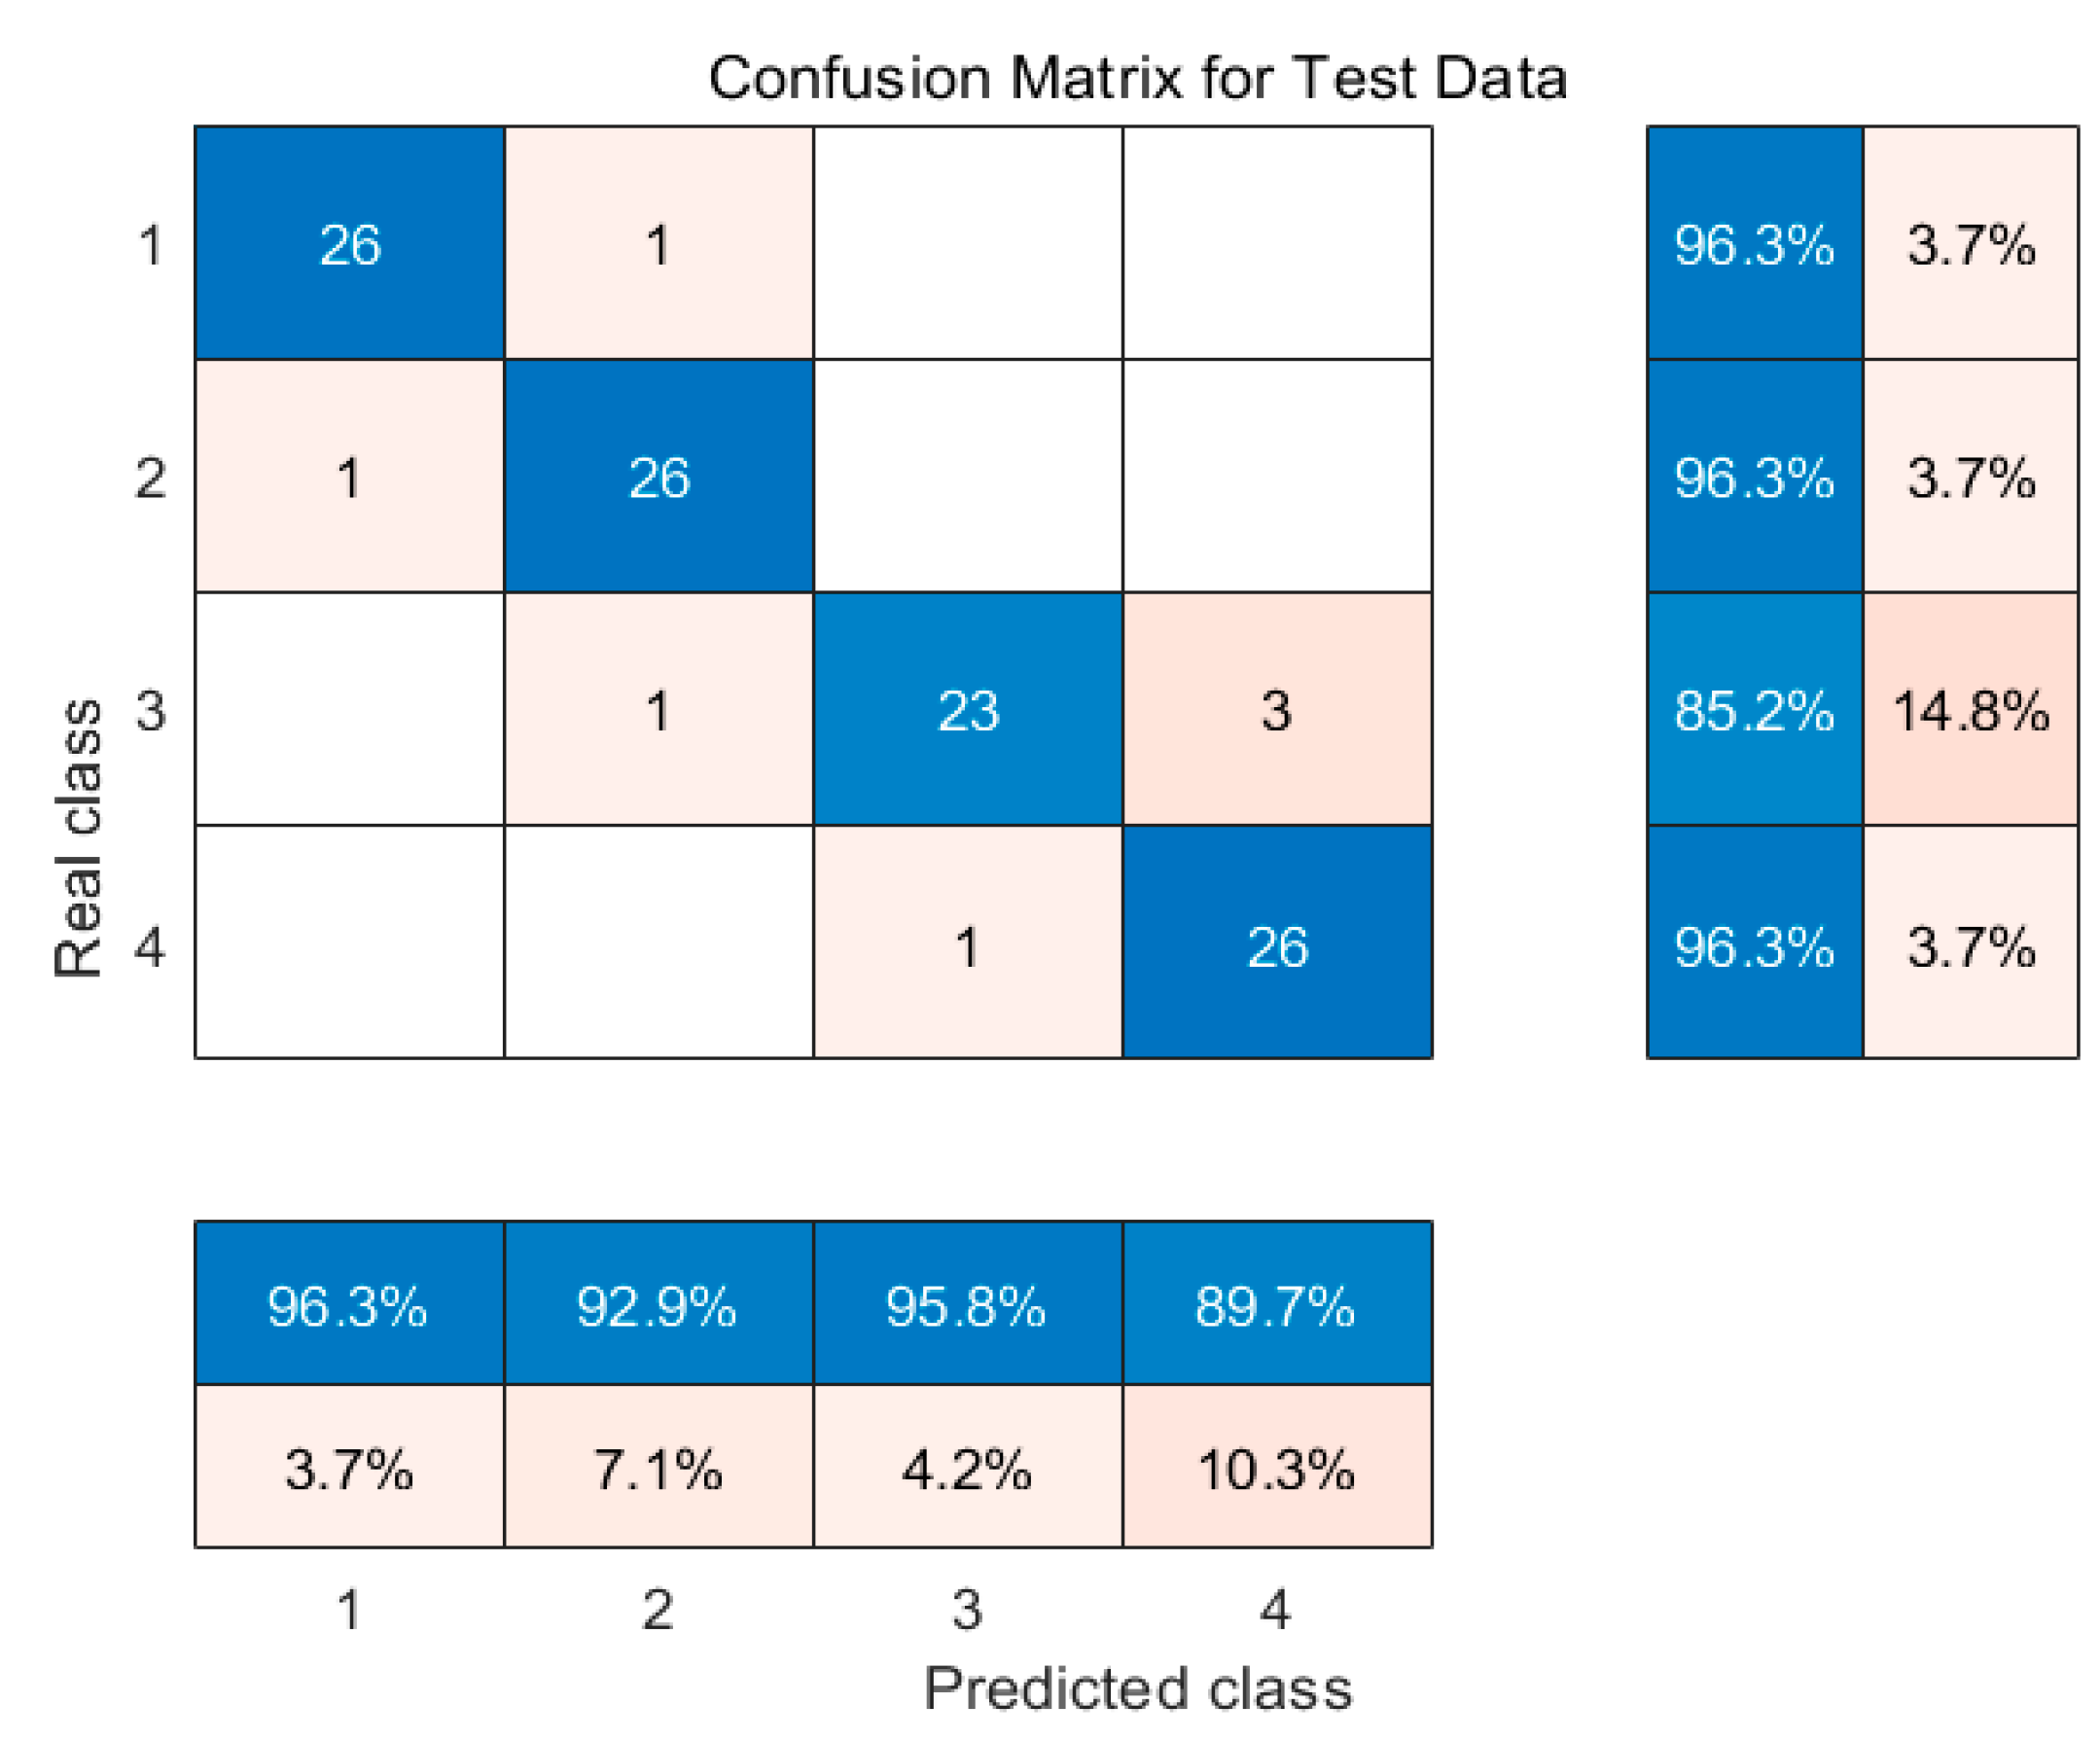
Utilizing the data in Table 2, in conjunction with the corresponding indoor temperature data, the WOA-RF model was employed to identify the optimal opening angles for different configurations. The accuracy of various opening angles was assessed, and the results indicate that the WOA-RF model exhibited high accuracy in the experimental setup. Specifically, the fully open angle was set at 70 degrees, the fully closed angle at 0 degrees, and the adjustable angles at 20 degrees and 50 degrees, as depicted in Figure 9.

Figure 9.
Matrix of optimization results of the WOA-RF model.
The model achieved an accuracy of 96.3% when the opening angle was set to 0 degrees, demonstrating its capability to effectively determine the suitable opening angle by considering variations in indoor temperature. As a result, the model provides precise temperature control for the building interior.
Moreover, when the opening angle was set to 20 degrees, the model achieved a prediction accuracy of 92.9%. This indicates that by allowing a moderate degree of window opening, outdoor air can effectively enter the ventilated cavity of the facade. Consequently, it assists in reducing the indoor heat load by absorbing a portion of the heat.
When the opening angle was set to 50 degrees, the model achieved a prediction accuracy of 95.8%. In this scenario, adjusting the opening angle allows for improved circulation between the indoor and outdoor air, leading to a reduction in heat dissipation from the building envelop, and consequently decreasing the demand for cooling.
As the opening angle reached 70 degrees, the model’s prediction accuracy slightly decreased, to 89.7%, which can be attributed to the fact that with fully open ventilation openings, outdoor air directly enters the indoor space without passing through the ventilated cavity. As a result, the indoor heat load increases, subsequently affecting the accuracy of the model’s predictions.
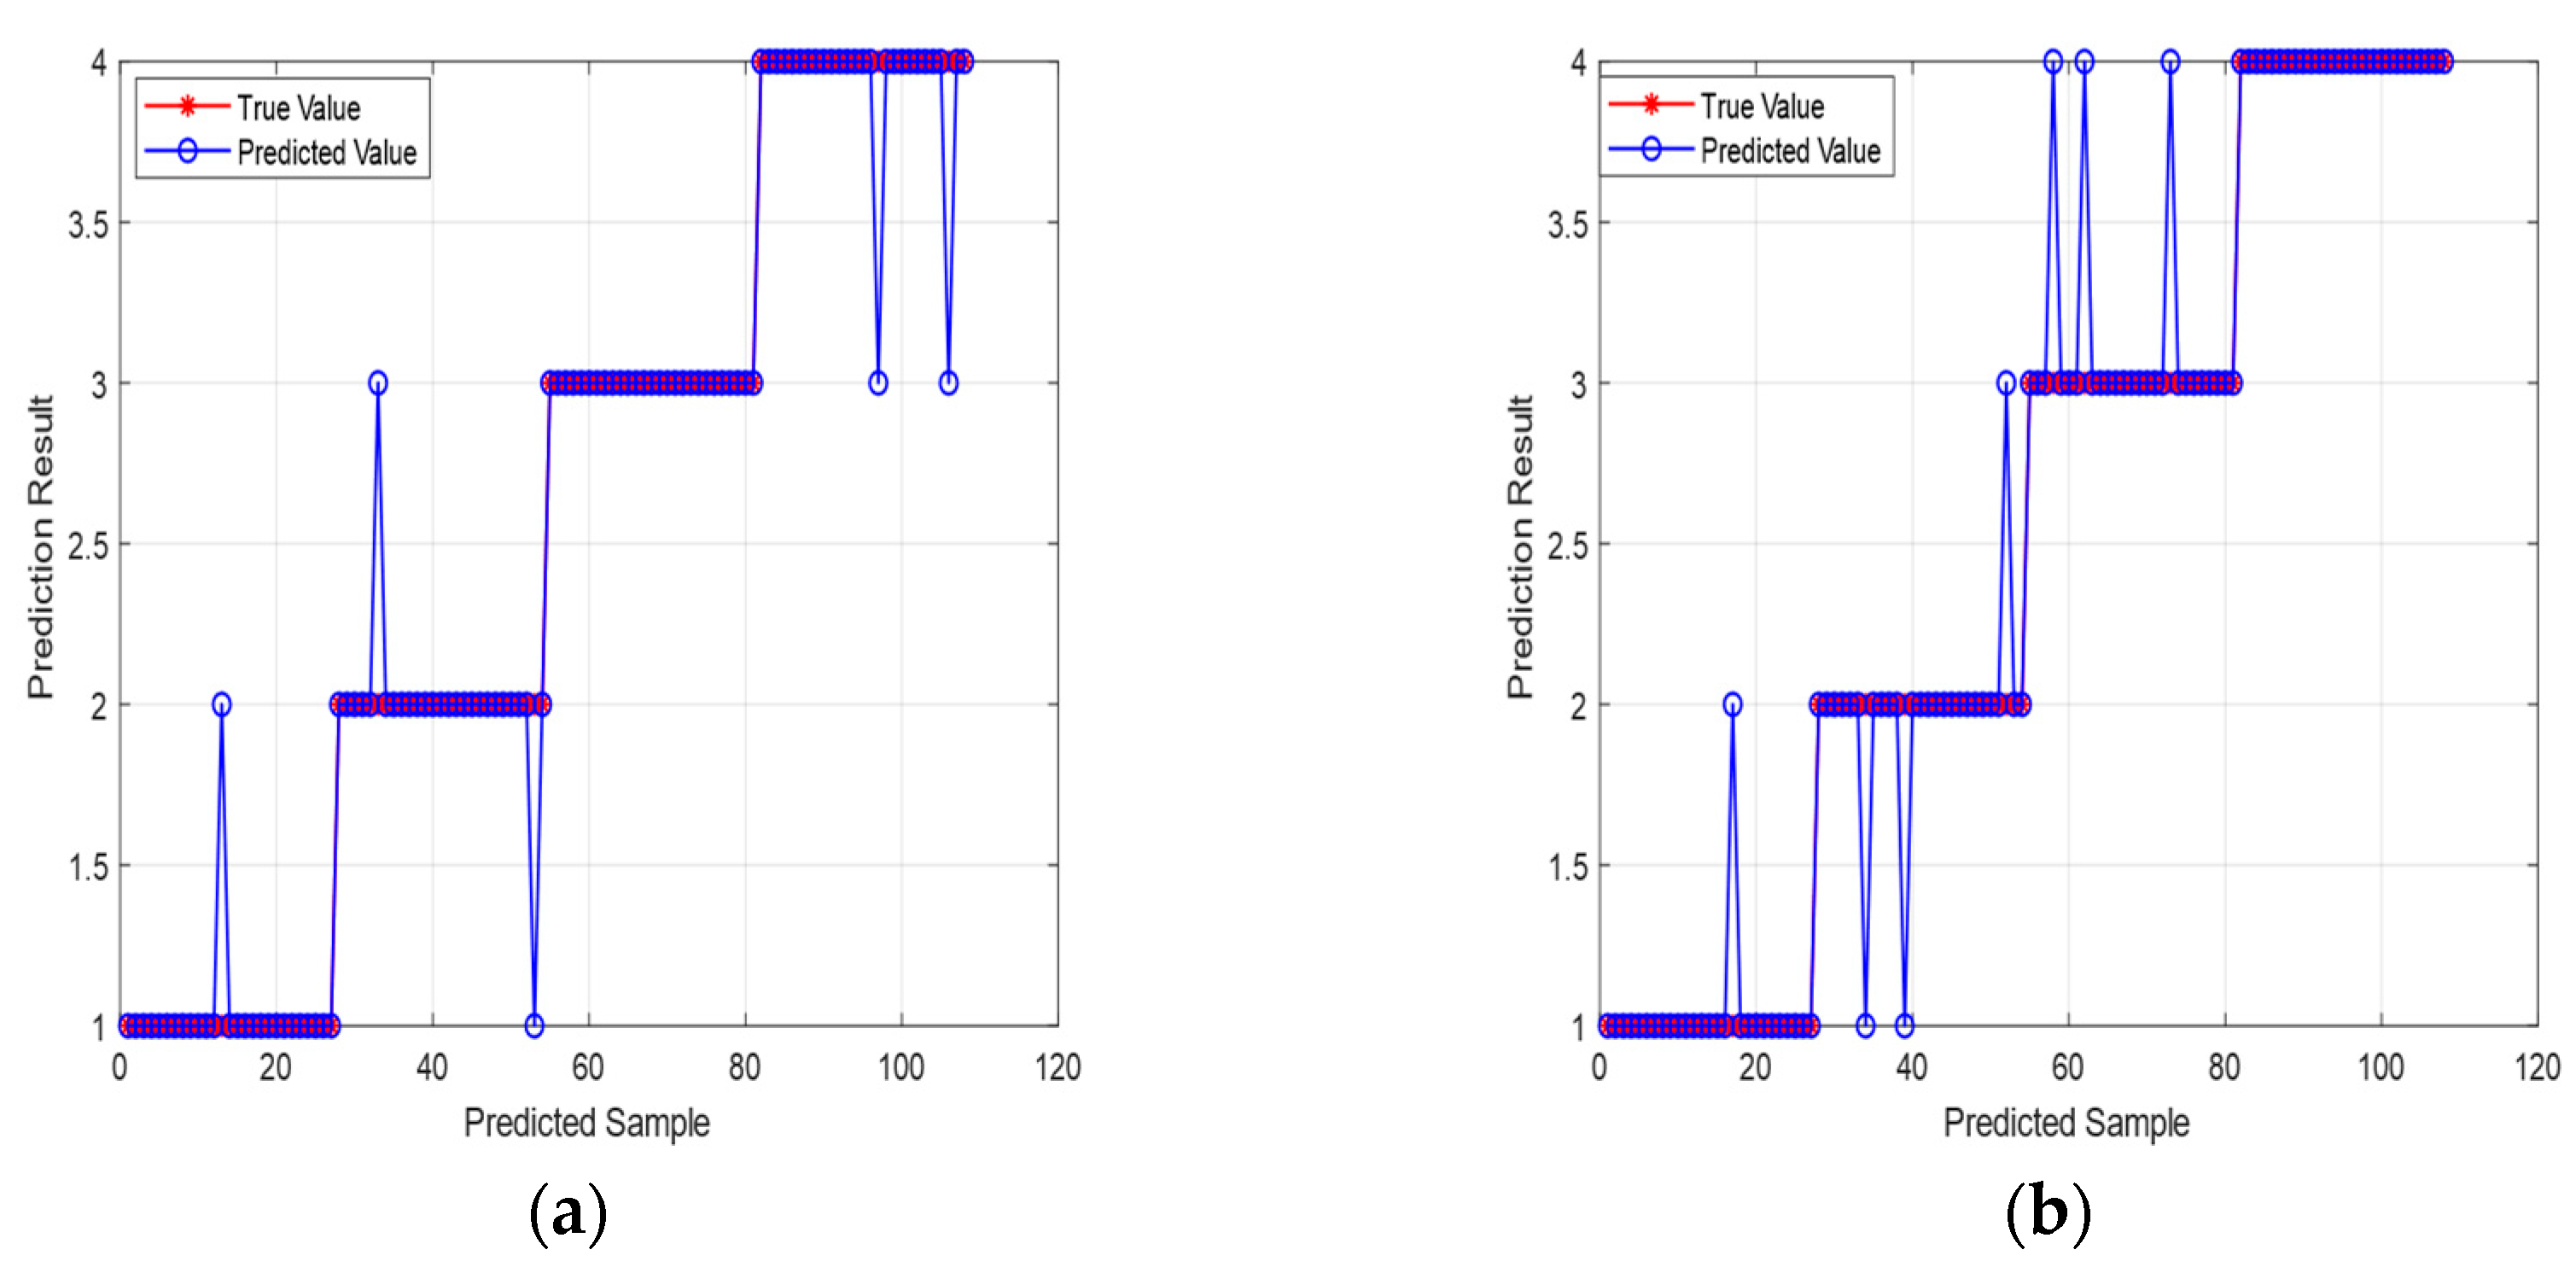
Figure 10 provides a visual comparison of the prediction results; the WOA-RF model achieves an average accuracy of 93.5%, compared to 30.23% for the traditional RF model. This 3.27% enhancement in accuracy showcases the effectiveness of the WOA-RF model in optimizing the predictive capability of the RF algorithm. Specifically, when determining the optimal opening angle for the DSF, WOA-RF surpasses the traditional RF model in terms of accuracy and reliability.
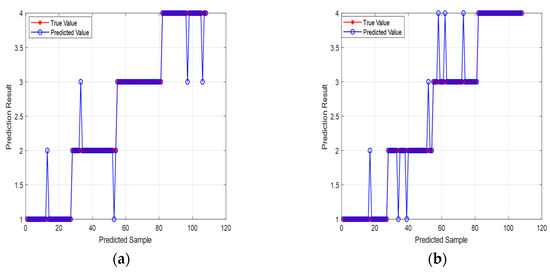
Figure 10.
Comparison of model prediction results: (a) WOA-RF; (b) random forest.
In conclusion, the WOA-RF model showcases favorable accuracy across different opening angles, with an average accuracy of 93.5%, which shows that the model is reliable and practical in the prediction of indoor temperatures, thereby providing valuable decision support for temperature control in DSF systems. The model’s capability to accurately identify the optimal opening angle, based on building parameters and environmental data, allows for the optimization of indoor temperature and energy consumption. Training the model with 80% of the data, it effectively captures the relationship between opening angles and indoor temperatures, enabling accurate optimization of test data. The WOA-RF model introduces new insights and methods for intelligent building design and energy management, facilitating sustainable building development while reducing dependence on traditional energy sources.
5. Conclusions
The experimental results highlight the substantial performance advantages and potential applications of DSF systems, particularly under summer climatic conditions. By carefully selecting the opening angle, DSFs can effectively optimize thermal comfort. Notably, during hot summers, closing the facade proves effective at controlling indoor temperatures and mitigating overheating. These findings underscore the potential of DSFs to enhance energy efficiency and optimize indoor comfort.
During daytime in the summer, adjusting the opening angle to an appropriate value, such as 20 degrees or 50 degrees, can effectively reduce indoor temperatures and minimize reliance on air conditioning. Moreover, adjusting the opening angle enhances convection between indoor and outdoor air, thereby improving indoor air quality, reducing humidity, minimizing the accumulation of harmful substances, and ultimately enhancing indoor environmental comfort.
During nighttime, adjusting the opening angle appropriately enables the regulation of indoor air quality without mechanical ventilation, which leads to energy savings. Particularly at night, the influence of window opening on indoor temperature is relatively minimal. However, it offers a passive ventilation method that enhances indoor environmental comfort and reduces reliance on mechanical ventilation.
By incorporating both nighttime and daytime control strategies, the energy-saving potential of the DSF system can be maximized. Through the integration of the WOA-RF model, which utilizes the RF algorithm, opening angles can be intelligently adjusted based on real-time weather data and the temperature differential between the indoor and outdoor environments. This data-driven strategy allows for precise control of indoor temperature, which enhances the energy efficiency of the building and reduces energy consumption, and hence promotes a comfortable indoor environment, thereby improving quality of life. By learning from data in different buildings, the model will achieve predictive accuracy across various building types and climates.
Currently, most of the research focus is on the effects of DSF system materials, structures, and related components on heat transfer, ventilation and energy saving, and there is less emphasis on the control and optimization of the DSF itself. Therefore, research on the DSF opening angle is necessary. Unlike traditional research and methods used to determine opening angles, in this study the performance of DSFs under different opening angles is revealed through a data-driven approach, and a prediction model is used to accurately predict the room temperature and opening angle based on the relevant parameters. This is an important reference for the practical application of DSFs and ideas regarding the control of openings.
However, the application of this model has certain limitations, including the reliance on data availability and the accuracy of the model itself. Further research can be directed toward enhancing the precision and reliability of the optimization model, and expanding its applicability to various climatic conditions. The following points can be considered:
- Expand the experimental scope: Conduct experiments under a wider range of climatic conditions to further validate the performance and applicability of DSF systems, providing insights into optimization strategies under different climatic conditions and serving as a reference for broader applications.
- Optimize the optimization model: Continuously improve the algorithm and data input of the model to enhance accuracy. Comprehensively analyze other influencing factors by incorporating more meteorological data, building parameters, and indoor activity data as inputs. This will further enhance the optimization capability of the model.
- Comprehensive evaluation metrics: In addition to thermal comfort and heating performance, consider building performance metrics such as indoor air quality and energy consumption. This will provide a more holistic measurement of the performance of DSF systems, and offer additional decision support for building design and energy management.
Author Contributions
Conceptualization, Q.S. and Y.D.; methodology, Y.D.; software, Y.D.; validation, L.Z., X.Y. and Q.S.; formal analysis, J.S.; investigation, L.Z.; resources, Q.S.; data curation, J.S.; writing—original draft preparation, Y.D.; writing—review and editing, X.Y.; visualization, X.Y.; supervision, Y.D.; project administration, Q.S.; funding acquisition, X.Y. All authors have read and agreed to the published version of the manuscript.
Funding
This research was funded by [Xi’an Science and Technology Department] grant number [The Xi’an “Scientist + Engineer” Project (24KGDW0028)].
Data Availability Statement
The raw data supporting the conclusions of this article will be made available by the authors on request.
Conflicts of Interest
The authors declare no conflict of interest.
References
- Lin, Z.; Song, Y.; Chu, Y. Summer performance of a naturally ventilated double-skin facade with adjustable glazed louvers for building energy retrofitting. Energy Build. 2022, 267, 112163. [Google Scholar] [CrossRef]
- Wang, J.; Huang, Y.; Teng, Y.; Yu, B.; Wang, J.; Zhang, H.; Duan, H. Can buildings sector achieve the carbon mitigation ambitious goal: Case study for a lowcarbon demonstration city in China? Environ. Impact Assess. Rev. 2021, 90, 106633. [Google Scholar] [CrossRef]
- Pomponi, F.; Piroozfar, P.A.E.; Southall, R.; Ashton, P.; Farr, E.R.P. Life cycle energyand carbon assessment of double skin façades for office refurbishments. Energy Build. 2015, 109, 143–156. [Google Scholar] [CrossRef]
- Pomponi, F.; Piroozfar, P.A.E.; Southall, R.; Ashton, P.; Farr, E.R.P. Energy performance of Double-Skin Façades in temperate climates: A systematic review and meta-analysis. Renew. Sustain. Energy Rev. 2016, 54, 1525–1536. [Google Scholar] [CrossRef]
- Yoon, Y.B.; Seo, B.; Koh, B.B.; Cho, S. Performance analysis of a double-skin façade system installed at different floor levels of high-rise apartment building. J. Build. Eng. 2019, 26, 100900. [Google Scholar] [CrossRef]
- Baldinelli, G. Double skin facades for warm climate regions: Analysis of a solution with an integrated movable shading system. Build. Environ. 2009, 44, 1107–1118. [Google Scholar] [CrossRef]
- Ahmadi, J.; Mahdavinejad, M.; Larsen, O.K.; Zhang, C.; Asadi, S. Naturally ventilated folded double-skin façade (DSF) for PV integration—Geometry evaluation via thermal performance investigation. Therm. Sci. Eng. Prog. 2023, 45, 102136. [Google Scholar] [CrossRef]
- Alibaba, H.Z.; Ozdeniz, M.B. Energy performance and thermal comfort of double-skin and single-skin facades in warm-climate offices. J. Asian Archit. Build. Eng. 2016, 15, 635–642. [Google Scholar] [CrossRef]
- Andreeva, D.; Nemova, D.; Kotov, E. Multi-Skin Adaptive Ventilated Facade: A Review. Energies 2022, 15, 3447. [Google Scholar] [CrossRef]
- Sahar, K.; Roza, V. Energy and thermal analysis of DSF in the retrofit design of office buildings in hot climates. Archit. Eng. Des. Manag. 2023, 19, 642–664. [Google Scholar]
- Ahmad, T.; Madonski, R.; Zhang, D.; Huang, C.; Mujeeb, A. Data-driven probabilistic machine learning in sustainable smart energy/smart energy systems: Key developments, challenges, and future research opportunities in the context of smart grid paradigm. Renew. Sustain. Energy Rev. 2022, 160, 112128. [Google Scholar] [CrossRef]
- Al-awag, E.A.N.; Wahab, I.A. Perspectives in double-skin façade (DSF) advantages and disadvantages. IOP Conf. Ser. Earth Environ. Sci. 2022, 1022, 012003. [Google Scholar] [CrossRef]
- GB 50033-2013; Ministry of Housing and Urban-Rural Development of the People’s Republic of China. Standard for Daylighting Design of Buildings. China Architecture & Building Press: Beijing, China, 2013.
- Ali Abd Al-Hameed, K. Spearman’s correlation coefficient in statistical analysis. Int. J. Nonlinear Anal. Appl. 2022, 13, 3249–3255. [Google Scholar]
- Sedgwick, P.M. Spearman’s rank correlation coefficient. Br. Med. J. 2018, 349, g7327. [Google Scholar] [CrossRef] [PubMed]
- Bai, J.; Li, Y.; Li, J.; Yang, X.; Jiang, Y.; Xia, S.T. Multinomial random forest. Pattern Recognit. 2022, 122, 108331. [Google Scholar] [CrossRef]
- Rodriguez-Galiano, V.F.; Ghimire, B.; Rogan, J.; Chica-Olmo, M.; Rigol-Sanchez, J.P. An assessment of the effectiveness of a random forest classifier for land-cover classification. ISPRS J. Photogramm. Remote Sens. 2012, 67, 93–104. [Google Scholar] [CrossRef]
- Mirjalili, S.; Lewis, A. The whale optimization algorithm. Adv. Eng. Softw. 2016, 95, 51–67. [Google Scholar] [CrossRef]
- GB50736-2012; Design Code for Heating Ventilation and Air Conditioning of Civil Buildings. Ministry of Housing and Urban-Rural Development of the People’s Republic of China: Beijing, China, 2012.
Disclaimer/Publisher’s Note: The statements, opinions and data contained in all publications are solely those of the individual author(s) and contributor(s) and not of MDPI and/or the editor(s). MDPI and/or the editor(s) disclaim responsibility for any injury to people or property resulting from any ideas, methods, instructions or products referred to in the content. |
© 2024 by the authors. Licensee MDPI, Basel, Switzerland. This article is an open access article distributed under the terms and conditions of the Creative Commons Attribution (CC BY) license (https://creativecommons.org/licenses/by/4.0/).