Article

Multi-Criteria Decision-Making Framework (AHP-TOPSIS): Pavement Preventive Maintenance Case Study for Ordinary National Trunk Highways

1
School of Highway, Chang’an University, South 2nd Ring Road Middle Section, Xi’an 710064, China
2
Key Laboratory for Special Area Highway Engineering of Ministry of Education, Chang’an University, South 2nd Ring Road Middle Section, Xi’an 710064, China
3
Jiangxi Provincial Highway Engineering Inspection Center, Nanchang 330199, China
4
Shaanxi Transportation Planning and Design Institute Co., Ltd., Xi’an 710075, China
*
Authors to whom correspondence should be addressed.
Buildings 2024, 14(10), 3048; https://doi.org/10.3390/buildings14103048
Submission received: 20 August 2024 / Revised: 18 September 2024 / Accepted: 20 September 2024 / Published: 24 September 2024
(This article belongs to the Special Issue Carbon-Neutral Infrastructure: 2nd Edition)

Abstract

:
Pavement maintenance and rehabilitation decision-making needs to weigh multiple strategic goals to achieve sustainable development through the pavement maintenance management system. Making decisions regarding pavement preventive maintenance is both intricate and costly. This study introduces a multi-criteria decision-making framework aimed at enhancing the scientific basis of such decisions. The framework first establishes an evaluation system for preventive maintenance strategies by considering three primary evaluation criteria—service functionality, pavement performance, and economic benefits, and then identifies nine specific evaluation indicators to influence these criteria, with a comparison matrix constructed to determine the weight of each indicator in relation to the maintenance decision hierarchy. Following this, the technique for order preference by similarity to ideal solution (TOPSIS) is employed to prioritize four commonly utilized preventive maintenance strategies. The results reveal that pavement condition and maintenance costs are the most influential factors in determining the appropriate preventive maintenance strategies for national highways. The priority rankings for the four strategies—slurry seal, micro-surfacing, chip seal, and ultra-thin overlays—are found to be 56.12%, 63.86%, 12.12%, and 83.52%, respectively, with ultra-thin overlays identified as the optimal choice for second-class highways. The decision-making model utilized in this study enables a multi-dimensional analysis, reducing the subjectivity inherent in expert evaluations and facilitating the prompt identification of the most suitable maintenance strategy.

1. Introduction

The determination of reasonable maintenance timing and scheme for pavement plays a crucial role in the normal performance of the service level during the design life of road. According to relevant data from China’s Ministry of Transport, by the end of 2023, the total mileage of roads in China had reached 5,441,000 km, of which maintenance mileage accounted for more than 99 percent [1]. China, as the country with the longest total mileage of traffic, possesses units in the structural design of highways that are expected to have a service life of more than 15 years, but due to overloading, environmental impacts, and improper maintenance measures, most of the road sections will require overhauling within only 5–10 years of use [2,3]. The performance of pavement presents certain regular changes with the change in service life, as shown in Figure 1. If no intervention is made when functional damage occurs on the pavement, the bearing capacity of the pavement rapidly decreases under the repeated action of environment and traffic load, and the functional damage develops into structural damage, which results in the need for heavy and intermediate maintenance of pavement before reaching the specified service life, which not only seriously shortens the service life but also results in the wastage of maintenance funds [4,5,6].
Preventive maintenance refers to the structurally intact pavement or appurtenant facilities under the premise of not increasing the structural bearing capacity of the pavement, the structurally intact pavement or appurtenant facilities are planned to take some kind of cost-effective measures in order to achieve the purpose of maintaining the pavement system, delaying the damage, and maintaining and improving the functional condition of the pavement, etc. [7,8,9,10]. As one of the important components of PMMS, preventive maintenance plays an important role in the maintenance decision-making for asphalt pavements [11].
The current preventive maintenance measures applicable to highways include fog seal, chip seal, fiber chip sealer, micro-surfacing, composite seal, and ultra-thin overlays [12]. According to the recommendation of the “Technical Specifications for Preventive Maintenance of Highway Asphalt Pavement” (JTG/T 5142-01—2021) [13], all the above preventive maintenance techniques are applicable to national trunk highways. In practice, when a variety of conservation techniques are applied simultaneously and the lack of experience does not allow for an informed evaluation of the relative merits of each, it is necessary to select the conservation scheme that best aligns with the desired outcome. At present, the primary determinant of decision-making on maintenance schemes is the technical condition of the pavement, with minimal consideration given to the combined impact of the various schemes on a multitude of factors, including anticipated outcomes and economic considerations. Decision-making on road maintenance usually involves a number of subjective and objective factors, such as maintenance technology, pavement performance, budgetary constraints, the choice of materials and equipment, and other considerations. Simultaneously, the selection of a maintenance scheme is an intricate decision-making process. The implementation of an irrational preventive maintenance scheme not only fails to impede the deterioration of pavement performance, but also fails to maintain the level of road service. Furthermore, it results in the squandering of maintenance funds, thereby reducing the comprehensive benefits of maintenance. It is thus imperative that a reasonable method for evaluating maintenance schemes be adopted in the decision-making process.
Multi-criteria decision analysis (MCDM) has garnered considerable interest as a pivotal decision-theoretic methodology, with successful applications in diverse domains such as road operation and maintenance [14], environmental assessment [15,16], and project planning [17,18]. MCDM prioritizes a series of alternatives by considering multiple criteria through the use of decision data and related methods to ascertain the relative influence of each factor on the alternatives under consideration. Decision-making for scientific maintenance scheme of pavements is a multi-criteria decision analysis problem, which can be carried out by the best–worst method (BWM) [19], hierarchical analysis (AHP) [20], multi-criteria compromised solution ranking method (VKM) [21], and technique for order of preference by similarity to an ideal solution (TOPSIS) [22].
Among the numerous multi-criteria decision analysis techniques applied to pavement maintenance decisions, AHP has emerged as the most prevalent approach [23,24,25,26]. AHP was proposed by Saaty as a systematic and comprehensive evaluation method based on experience and knowledge [20]. It is designed to assess the importance of factors involved in a pairwise manner, with the objective of clarifying the relative importance among the factors. Ramadhan R.H. [27] applied AHP to ascertain the relative importance of various factors influencing pavement maintenance, including road type, pavement condition, traffic volume, road travelling quality, safety, maintenance cost, and overall importance of the road to the community. Ahmed S. [28] put forth an optimized AHP method for the prioritization of maintenance road sections. This method assigns pairwise comparison values based on field data collected from a road network consisting of 28 road sections in the city of Mumbai. The final ranked list of candidate road sections takes into account the priority weights of the alternatives, reflecting the pavement conditions.
From the existing studies, it can be found that the hierarchical analysis method generally requires the use of expert ratings as the basis for judgment, which inherently involves a degree of subjectivity. The objective of the present research is to enhance the scientific rigor and accuracy of these empirical data in order to facilitate more informed decision-making regarding the prioritization of options. The technique for order of preference by similarity to an ideal solution (TOPSIS) [29] is based on distance in order to measure the degree of importance of each factor of the decision-making objective. This approach has the potential to weaken the influence of the human factor in the AHP, and therefore, it has been highly valued, applied, and adopted in various decision-making contexts. Chang J.R. [30] employed MCDM to ascertain the cost-effectiveness of 14 pavement-specific maintenance schemes (thin overlays, slurry seal, crack seal, and chip seal) in Texas. This was achieved by utilizing the Defective Score (DS), the International Roughness Index (IRI), and treatment costs through a sequential prioritization technique that bears resemblance to the ideal solution. The cost-effectiveness of these treatments can be quantified through TOPSIS, thereby reducing the impact of subjective judgments on the results. In a comparative study of the fuzzy AHP and fuzzy TOPSIS techniques for pavement maintenance prioritization, Ouma Y. [26] observed that the former method yielded higher maintenance priority rankings than the latter. Relatively few studies have been conducted using a combined AHP-TOPSIS approach for pavement preventive maintenance decision-making.
In order to achieve this objective, this study puts forward a novel approach to decision-making for the development of pavement preventive maintenance schemes. This approach draws upon a synthesis of two techniques, namely the AHP and TOPSIS. The remainder of this paper is structured as follows: Section 2 introduces the fundamental principles of the AHP and TOPSIS research methods. The AHP-TOPSIS method is employed to calculate the weights of the indicators, and a comprehensive evaluation model of the AHP-TOPSIS pavement preventive maintenance scheme is established. Section 3 establishes a decision-making evaluation system for pavement preventive maintenance schemes, with the typical road sections in Jiangxi Province, China, serving as an illustrative example. Section 4 evaluates the priority of four types of preventive maintenance schemes: thin slurry sealer, micro-surface treatment, gravel sealer, and ultra-thin overlay. It then recommends the optimal scheme for the preventive maintenance of pavements on national trunk highways.

2. Methodology

This section defines the decision objectives, the main criteria influencing their achievement, and the breakdown of the indicators, thereby establishing the objective, criterion, and indicator layers of the model. This study evaluates the preventive maintenance schemes of national trunk highways by first determining the evaluation criteria and scoring principles. Hierarchical analysis is then used to determine the weights and scores of index elements, followed by prioritizing the schemes using the TOPSIS method [20,22]. The operational flow of the proposed AHP-TOPSIS method is illustrated in Figure 2.

2.1. Definition of Evaluation Indicators and Scoring Principles

An evaluation system for preventive maintenance schemes for national trunk highways has been established with reference to the industry’s standards and the accumulated experience of experts in the field (O). In order to ascertain the indicators of the criterion layer, it is essential to elucidate the factors that influence the selection of a pavement maintenance scheme. These factors are typically considered to encompass, but are not limited to, pavement condition, traffic load, environmental conditions, cost budget, road class and function, maintenance history, and so forth. Accordingly, the evaluation system of the preventive maintenance scheme for national trunk highways comprises three criterion layers. The first of these is the service function layer (C1), which encompasses three indicators: driving comfort (X1), appearance (X2), and noise (X3). The second is the pavement performance layer (C2), which includes three indicators: quality index (X4), pavement damage (X5), and skid resistance (X6). Finally, the economic effectiveness layer (C3) incorporates three indicators: traffic interference (X7), cost (X8), and service life (X9). The fundamental definitions of the criterion layer C and the indicator layer X are presented in Table 1.
The qualitative indicators X1, X2, and X3 pertain to the functionality of the road service, whereas X7, X8, and X9 relate to the economic benefits of pavement maintenance. The quantitative indicators X4, X5, and X6 concern the technical condition of the pavement, and their specific calculation formulas are introduced subsequently.
The Road Travelling Quality Index X4 (RQI) is defined by the deviation value of the amount of concavity and convexity in the longitudinal direction of the road surface. This is shown in Equation (1):
RQI = 100 1 + a 0 e a 1 IRI
where IRI is the international flatness index (m/km); a0 is the model parameter, 0.026 is used for motorways and first-class highways, and 0.0185 is used for other class highways; a1 is the model parameter, 0.65 is used for motorways and first-class highways, and 0.58 is used for other class highways.
The Pavement Condition Index (PCI) is a quantitative scoring and rating system that considers the type and severity of pavement distress. A score of 0–100 is assigned, with higher scores indicating a superior condition. The PCI is calculated according to Equations (2) and (3):
PCI = 100 a 0 DR a 1
DR = 100 × i = 1 i 0 w i A i A
where DR represents the pavement damage rate (%), the parameter a0 is equal to 15.00; a1 is 0.412, Ai denotes the cumulative area of pavement damage in category i (m2); A is the area of pavement detection or investigation (m2); wi is the weight or conversion coefficient of the pavement damage in category i, as shown in Table 2; and i is the type of pavement damage, including the degree of damage (light-L, medium-M, and heavy-H); i0 is the total number of damage types.
The road surface skid resistance index (SRI) X6 is the amount of friction generated by the vehicle and tires during the sliding process and can be calculated according to Equation (4):
SRI = 100 SRI min 1 + a 0 e a 1 SFC + SRI min
where SFC is the transverse force coefficient, the calibration parameter SRImin is 35.0, the model parameter a0 is 28.6; the model parameter a1 is −0.105.

2.2. Calculation of Evaluation Criteria Weights

This subsection presents the relative importance and assigned weights of the evaluation criteria. The research team comprised two experts from a provincial road testing center, one graduate supervisor in road engineering, and three master’s and doctoral researchers in road engineering. A 1 km road section is selected as the evaluation unit. The extent to which different factors influence the selection of preventive scheme varies. This paper describes the influence of each indicator on the specified criteria by establishing a pairwise comparison matrix through AHP and comparing and scoring the importance of each criterion in the evaluation system by the members of the research group. The weights of criteria and indicator are determined through a literature research combined with the opinions provided by all the experts in the research group. The consistency of the experts’ opinions on the weights of the criteria obtained is verified, and calculations are conducted to ascertain the final average weight of the criteria for which consistency is achieved.
  • Step 1: Constructing a comparison matrix
In this study, a comparison scale is employed to evaluate the relative importance of two decision-making schemes. The fuzzy mathematical method is used to establish guidelines for a two-by-two comparison scale. The definition of the comparison scale is presented in Table 3.
The values of the comparison matrix are determined by an expert survey [31,32], and the comparison matrix A is obtained, as shown in Equation (5):
A = a i j m × n = y 1 y 2 y n x 1 a 11 a 12 a 1 n x 2 a 12 a 22 a 2 n x m a n 1 a n 2 a mn
  • Step 2: Calculation of weighting factors
The normalized matrix is weighted and averaged to obtain the eigenvector. Each element of the eigenvector represents the weight of the corresponding criterion and is calculated as follows.
  • Normalize the comparison matrix A by columns as in Equation (6).
a ¯ i j = a i j j = 1 n a i j i , j = 1 , 2 , n
2.
As in Equation (2), the column means of matrix A are normalized by columns and summed by rows to obtain the sum. This sum is then normalized to obtain the weight coefficients of Equation (3).
The weighting coefficients of the factors are calculated by the above steps, where the weighting coefficient of the evaluation indicators of the criterion layer in relation to the target layer is W = w 1 w 2 w 3 .
  • Step 3: Consistency test
A threshold is established by the consistency ratio (CR) in order to ascertain whether the results are valid or not, with the aim of eliminating inaccurate responses and evaluating the decision-maker’s decision-making ability [33,34]. The test steps are illustrated in Equations (7)–(9).
  • Compute the largest characteristic root λ max of the comparison matrix A:
    λ max = 1 n i = 1 n ( A W ) i w i
  • Calculation of consistency indicators:
C I = λ max n n 1
When C I = 0 , A is a consistency matrix, and the smaller the value, the better the consistency of A.
3.
Calculation of the consistency ratio:
C R = C I R I
R I is a stochastic consistency indicator, the values of which are determined through Table 4.
4.
The accuracy of the judgment of the comparison matrix and the applicability of the weighting coefficients are determined based on the results of the consistency ratio calculation. If C R < 0.1 , the judgment is accepted, the comparison matrix is deemed to be within the preset tolerance range. Otherwise, the comparison matrix is considered to be out of the preset tolerance range, and the matrix must be adjusted and recalculated.

2.3. Comprehensive Scheme Evaluation and Ranking

The third step of the methodology presented in this paper is used to prioritize the scheme. This subsection synthesizes the weights of the indicators determined by AHP-TOPSIS. Specifically, the weights of each computational attribute are determined by AHP, the decision matrix is weighted, and the selected alternatives are prioritized using TOPSIS. The method calculates the similarity distance of the alternatives to the positive and negative ideal solutions and is optimal when the object is closest to the positive ideal solution and furthest from the negative ideal solution, and vice versa. Multiple alternatives are directly evaluated and ranked by the method to determine the optimal solution. The main implementation steps of the method are as follows.
  • Step 1: Create an initial decision matrix
Let the scheme set be A = A 1 , A 2 , , A m , the set of all scheme evaluations X = X 1 , X 2 , X 3 , , X n , and the evaluation index X i j denotes the jth evaluation index of the ith program, where i 1 , m , j 1 , m , and the initial decision matrix can be expressed as Equation (10).
A = ( X i j ) m × n X 11 X 12 X 1 n X 21 X 22 X 2 n X m 1 X n 2 X mn
  • Step 2: Derive a standardized decision matrix
The evaluation indicators of the options can be classified into two categories: positive and negative. Positive indicators are indicative of a favorable outcome, whereas negative indicators are indicative of an unfavorable outcome. In order to eliminate the influence of different scales of evaluation indicators, all evaluation indicators are standardized according to the normalization method.
For the standardized decision matrix B = b i j m × n , the calculation varies depending on the positive and negative characteristics of the indicator.
For the positivity indicators, there are:
b ij = X i j min j ( X i j ) max j ( X i j ) min j ( X i j )
For reverse sex indicators, there are:
b ij = max j ( X i j ) X i j max j ( X i j ) min j ( X i j )
The weighted normalized decision matrix C, as illustrated in Equation (13), is obtained by multiplying the column vectors of matrix B with the total ranking weights nW, which have been determined by the AHP for the indicator stratum layer.
C = ( c ij ) m × n w 1 b 11 w 2 b 12 w n b 1 n w 1 b 21 w 2 b 22 w n b 2 n w 1 b m 1 w 2 b m 2 w n b mn
  • Step 3: Determine the ideal solution
In accordance with the nature of the decision problem, a positive ideal solution and a negative ideal solution are identified. The positive ideal solution represents the combination of optimal values across all evaluation indicators, whereas the negative ideal solution represents the combination of worst values across all evaluation indicators. The positive ideal solution C + of the positive index set J 1 is the maximum value of the row vector in the weighted normalized decision matrix C , the negative ideal value is the minimum value, while the reverse index takes the opposite value, expressed as Equation (14).
C + = ( max c ij | j J 1 ) , j ( min c ij | j J 2 ) j ,   C = ( min c ij | j J 1 ) , j ( max c ij | j J 2 ) j
where C + and C are positive and negative ideal solutions, respectively.
  • Step 4: Calculate the similarity distance
The distance between the judgment object and the ideal solution is calculated as shown in Equation (15).
d i + = j = 1 n ( c ij c j + ) 2 ,   d i = j = 1 n ( c ij c j ) 2
where d i + and d i are the distances of the evaluation object from the positive and negative ideal solutions, respectively; c J + and c J are the corresponding elements in C + and C .
Evaluate the closeness of the object to the positive ideal solution according to Equation (16).
E i + = d i + / d i + + d i , 0 E i + 1
The closeness E i + reflects the degree of proximity of the evaluation object to the positive ideal solution and its distance from the negative ideal solution. When the evaluation object is a positive ideal solution, E i + = 1; conversely, when the evaluation object is a negative ideal solution, E i + = 0. The evaluation object is typically situated between the positive and negative ideal solutions, with a proximity to the positive ideal solution of between 0 and 1. Consequently, only the evaluation objects exhibiting a proximity to the positive ideal solution are generally considered, with those closer to 1 being deemed more favorable.
  • Step 5: Comprehensive scheme evaluation
Calculate the vector of comprehensive judgment results for the judgment object according to Equation (17).
F = W × E
where E is the judgment matrix composed of the closeness of each judgment object to the positive ideal solution; W is the comprehensive weight of each evaluation index calculated by the hierarchical analysis method.

3. Case Study

3.1. Program Overview

In this study, the research section was divided into multiple evaluation units of approximately 1 km in length. This is consistent with the investigation and evaluation units specified in the “Highway Performance Assessment Standard” (JTG 5210—2018) [35]. Simultaneously, it should be noted that the units for section evaluation and scheme selection are not considered to be fixed. This is because, in practical applications, various typical distresses may appear within a 1 km evaluation unit, and the score obtained from the regulations is merely an average value. It can be reasonably argued that the more finely the section units are subdivided, the more accurately the actual condition of the pavement can be represented. However, this would undoubtedly result in an increased workload for the inspection units. Therefore, the length of the evaluation units can be determined based on the specific research requirements. Furthermore, the research team conducted an on-site assessment of the study section and assigned priority scores to the applicability of alternative schemes on this section, according to each decision-making indicator. Ultimately, The AHP-TOPSIS method was employed to integrate the criterion weights derived from AHP with the priority scores derived from TOPSIS, thus facilitating the ranking of preventive maintenance schemes for highway sections. This approach was undertaken to substantiate the efficacy of the method in question.
The present study employed a section of the national highway G353 situated within the Shangrao segment of Jiangxi Province, China, as the subject of its investigation. The pavement type of this section is asphalt concrete, with a technical grade of second-class highway, and the section length is 6 km. The selected pavement surface condition data comprise indicators related to pavement condition evaluation, including PQI, PCI, RQI, and SRI, with an evaluation unit of 1 km. The summary results of the pavement performance are presented in Table 5.

3.2. Identification of Alternative Schemes

A variety of sources are employed in the construction of potential schemes that are capable of achieving the stated objectives and satisfying the specified criteria. These include industry practice, historical data, and expert experience. Subsequently, the aforementioned schemes are integrated into the model as the scenario layer, which serves as a framework and provides guidance for subsequent comparison, assessment, and decision-making.
Preventive maintenance technologies for asphalt pavement can be classified into distinct categories, including seal coating, overlay, and in-place hot recycling. In accordance with the stipulations set forth in the “Technical Specifications for Preventive Maintenance of Highway Asphalt Pavement” (JTG/T 5142-01-2021) [13], the array of common preventive maintenance schemes encompasses the following ten techniques: fog seal, chip seal, fiber-reinforced seal, slurry seal, composite seal, micro-surfacing, thin layer covering, ultra-thin layer covering, seal layer overlay and in-place hot recycling. The applicable highway classifications for these methods are presented in Table 6, and the corresponding road condition level requirements for each class of road are shown in Table 7.
Among these, fog seal, chip seal, slurry seal, micro-surfacing, composite seal, thin overlays, ultra-thin overlays, and seal layer overlay are all applicable for second-class highways and lower-grade highways.
In the survey of the maintenance history of national highways in Jiangxi Province, it was found that slurry seal, micro-surfacing, chip seal, and ultra-thin overlays are relatively common preventive maintenance technologies. Therefore, this study chooses these four commonly used preventive maintenance schemes for prioritization based on local engineering practice verification, extensive application experience, and proven effectiveness in implementation.

3.3. Assessment Framework

In order to gain a deeper understanding of the decision-making processes involved in the implementation of preventive maintenance schemes on national trunk highways, it is essential to apply the AHP to categorize the various scheme criteria. By building upon the identification of the most commonly used preventive maintenance options in Jiangxi Province, a decision-making evaluation hierarchy model for preventive maintenance schemes was established. According to the model depicted in Figure 3, the general target layer is represented by O, the criterion layer by P, and the indicator layer by X.
Scores were assigned to indicators such as traffic disruption during construction, post-maintenance driving comfort, skid resistance, noise levels, and appearance for the four maintenance measures. The results are presented in Table 8.
The study employs a uniform evaluation system based on the scoring criteria, whereby higher scores indicate superior performance in corresponding attributes. This approach is intended to facilitate the consistent assessment of both qualitative and quantitative indicators, with a view to enhancing the decision-making process in the context of pavement preventive maintenance. The selected preventive maintenance schemes, namely slurry seal (Scheme I), micro-surfacing (Scheme II), chip seal (Scheme III), and ultra-thin overlays (Scheme IV), have been categorized according to a four-point scale, with excellent (0.8, 1), good (0.7, 0.8), fair (0.6, 0.7), and poor (0, 0.6) being the assigned values. The objective of this evaluation is to establish a comprehensive assessment framework, as illustrated in Table 9, based on the technical conditions of the example road sections studied through research group discussions and surveys.

4. Results and Discussion

4.1. Comprehensive Evaluation of Indicators

In accordance with the fundamental tenets of AHP, the evaluation of indicators pertaining to the preventive maintenance of national and provincial highways can be represented in a judgment matrix, as illustrated in Figure 4.
Figure 4 illustrates the matrix comparison and calculation process, including the construction of the evaluation matrices and the results of the weighting calculations. When selecting preventive maintenance schemes for national trunk roads, decision-makers should prioritize schemes that minimize costs while maximizing pavement performance, taking into account the pavement performance and service functions of these roads. Pavement performance is therefore considered to be the primary selection criterion, with economic efficiency being somewhat less important. As pavement performance mainly affects high-quality trunk roads and national trunk roads are mainly secondary and lower-quality roads, service functions are considered to be relatively less important. The consistency ratio (CR) of 0.0088 < 0.1 indicates that the matrix meets the requirements of the consistency test. Therefore, the weight vector W = [0.1463, 0.5317, 0.3220] is acceptable.
Similarly, the judgment matrices and weighting coefficients determined by the evaluation of the service functions, pavement performance, and economic efficiency criteria layers are shown in Figure 5a–c. Decision-makers provide criteria for judging the correlation between refined indicators and criteria.
The CR values determined for each criterion are 0.0036, 0.0012, and 0, respectively, all of which are less than 0.1, meeting the consistency judgment requirements. Therefore, the weights of each criterion layer are considered acceptable.
Figure 5a shows the judgment matrix based on technical conditions. It is evident that, on lower-grade roads, drivers prioritize driving comfort, followed by road noise during operation, with less emphasis placed on the aesthetic appearance of the road.
Figure 5b shows the judgment matrix based on usability performance. According to the current “Highways Performance Assessment Standard” (JTG 5210—2018) [35] in China, weights are assigned based on the assessment of pavement conditions. The degree of PCI and RQI are deemed critical factors in assessing pavement conditions on lower-grade roads, with PCI slightly more significant than RQI. The impact of SRI on pavement is nearly negligible in this assessment.
Figure 5c shows the judgment matrix for indicators related to economic effectiveness such as traffic interference, cost, and service life. The service life of the scheme is considered most important because enhancing road longevity is crucial in material design considerations. Following this, the cost of materials and construction is prioritized, while the interference to traffic during construction is deemed least important.
After establishing the comparison matrices for each level and calculating the individual weights, we calculated the overall weights of each indicator for the total objective using Equation (18).
ω c r i t e r i o n = n ω i n d i c a t o r × ω r e g a d i n g   c r i t e r i o n
The overall ranking of the indicator levels is shown in Table 10.
This method can be widely applied and referenced in similar studies, but the selection of decision criteria and calculation of weights should be tailored to specific application contexts.
In this section, the TOPSIS method is used to comprehensively evaluate indicators from three subcriteria layers: technical conditions, usability performance, and overall benefits. First, an initial evaluation matrix was constructed, and the matrix was normalized by weighting using AHP weights. Then, the positive and negative ideal solutions for each system were calculated, along with their proximity to the positive ideal solution, to determine the optimal solutions corresponding to the different indicator levels.
Within the service function criteria layer, indicators such as driving comfort (X1), appearance (X2), and noise (X3) are considered positive indicators. In the technical conditions layer, quality index (X4), pavement damage (X5), and skid resistance (X6) are also positive indicators. Regarding overall benefits, material cost (X8) is a negative indicator, while traffic interference (X7) and service life (X9) are positive indicators. The positive and negative ideal solutions for each indicator are calculated as shown in Table 11.
According to Equation (10), considering service function, pavement performance, and economic effectiveness indicators, establish the initial judgment matrix as shown in Figure 6a,b.
Calculate the weighted normalized decision matrix according to Equations (11)–(13). The calculation results are shown in Figure 7.
According to Equations (14)–(16), calculate the proximity of each solution based on pavement performance. As all pavement performance indicators are positively oriented, the positive ideal solution and negative ideal solution are determined separately. The distance of each solution from the positive ideal solution and negative ideal solution is shown in Figure 8.
Based on the criteria, considering the road service function criteria layer, all indicators corresponding to the service function layer are positive indicators. The proximity indices for the slurry seal, micro-surfacing, chip seal, and ultra-thin overlay are 0.863, 0.578, 0, and 1, respectively. According to the positive and negative judgment criteria, the proximity index of the ultra-thin overlay is closest to 1, determining it as the optimal solution. Considering the usage performance criteria layer, all indicators corresponding to the usage performance layer are positive indicators. The proximity indices for the slurry seal, micro-surfacing, chip seal, and ultra-thin overlays are 0.310, 0.500, 0.228, and 0.690, respectively. According to the positive and negative judgment criteria, the proximity index of the ultra-thin overlay is closest to 1, determining it as the optimal solution. Considering the economic effectiveness criteria layer, where material cost is a negative indicator, the proximity indices for the slurry seal, micro-surfacing, chip seal, and ultra-thin overlays are 0.839, 0.895, 0, and 1, respectively. According to the positive and negative judgment criteria, the proximity index of the ultra-thin overlay is closest to 0, determining it as the optimal solution.

4.2. Ranking Assessment

The AHP was applied to determine the weights of evaluation criteria at the decision-making level for preventive maintenance schemes on ordinary provincial highways. The weights were determined as W = [0.1463, 0.5317, 0.3220]. The judgment matrix constructed from the closeness to the criteria evaluation for each indicator is represented as Equation (19):
E = 0.863 0.578 0 1 0.310 0.500 0.228 0.690 0.839 0.895 0 1
From Equation (19), the computed comprehensive evaluation result vector is (0.5612, 0.6386, 0.1212, 0.8352). This yields the comprehensive superiority percentages of the four maintenance schemes—slurry seal, micro-surfacing, chip seal, and ultra-thin overlays—as 56.12%, 63.86%, 12.12%, and 83.52%, respectively. Therefore, the priority ranking of the schemes is as follows: ultra-thin overlays > micro-surfacing > slurry seal > chip seal. Thus, in the preventive maintenance of second-class highways, when deciding from the perspectives of service function, pavement performance, and economic effectiveness, ultra-thin overlays should be prioritized as the preventive maintenance scheme.

5. Conclusions

This study comprehensively evaluated the applicability and priority ranking of preventive maintenance schemes on national and provincial highways, considering factors such as service function, pavement performance, and economic effectiveness. This research innovatively proposes a pavement preventive maintenance prioritization method based on AHP-TOPSIS. The Analytic Hierarchy Process (AHP) is used to determine the weights of various factors (3 criteria and 9 subcriteria) that influence maintenance decision-making. The technique for order of preference by similarity to ideal solution (TOPSIS) allows quantitative and qualitative assessment of the relative effectiveness of schemes. This approach was applied to a 6 km section of second-class highway in Shangrao City, Jiangxi Province, China, and recommendations are made for the implementation of different preventive maintenance techniques. The following conclusions can be drawn.
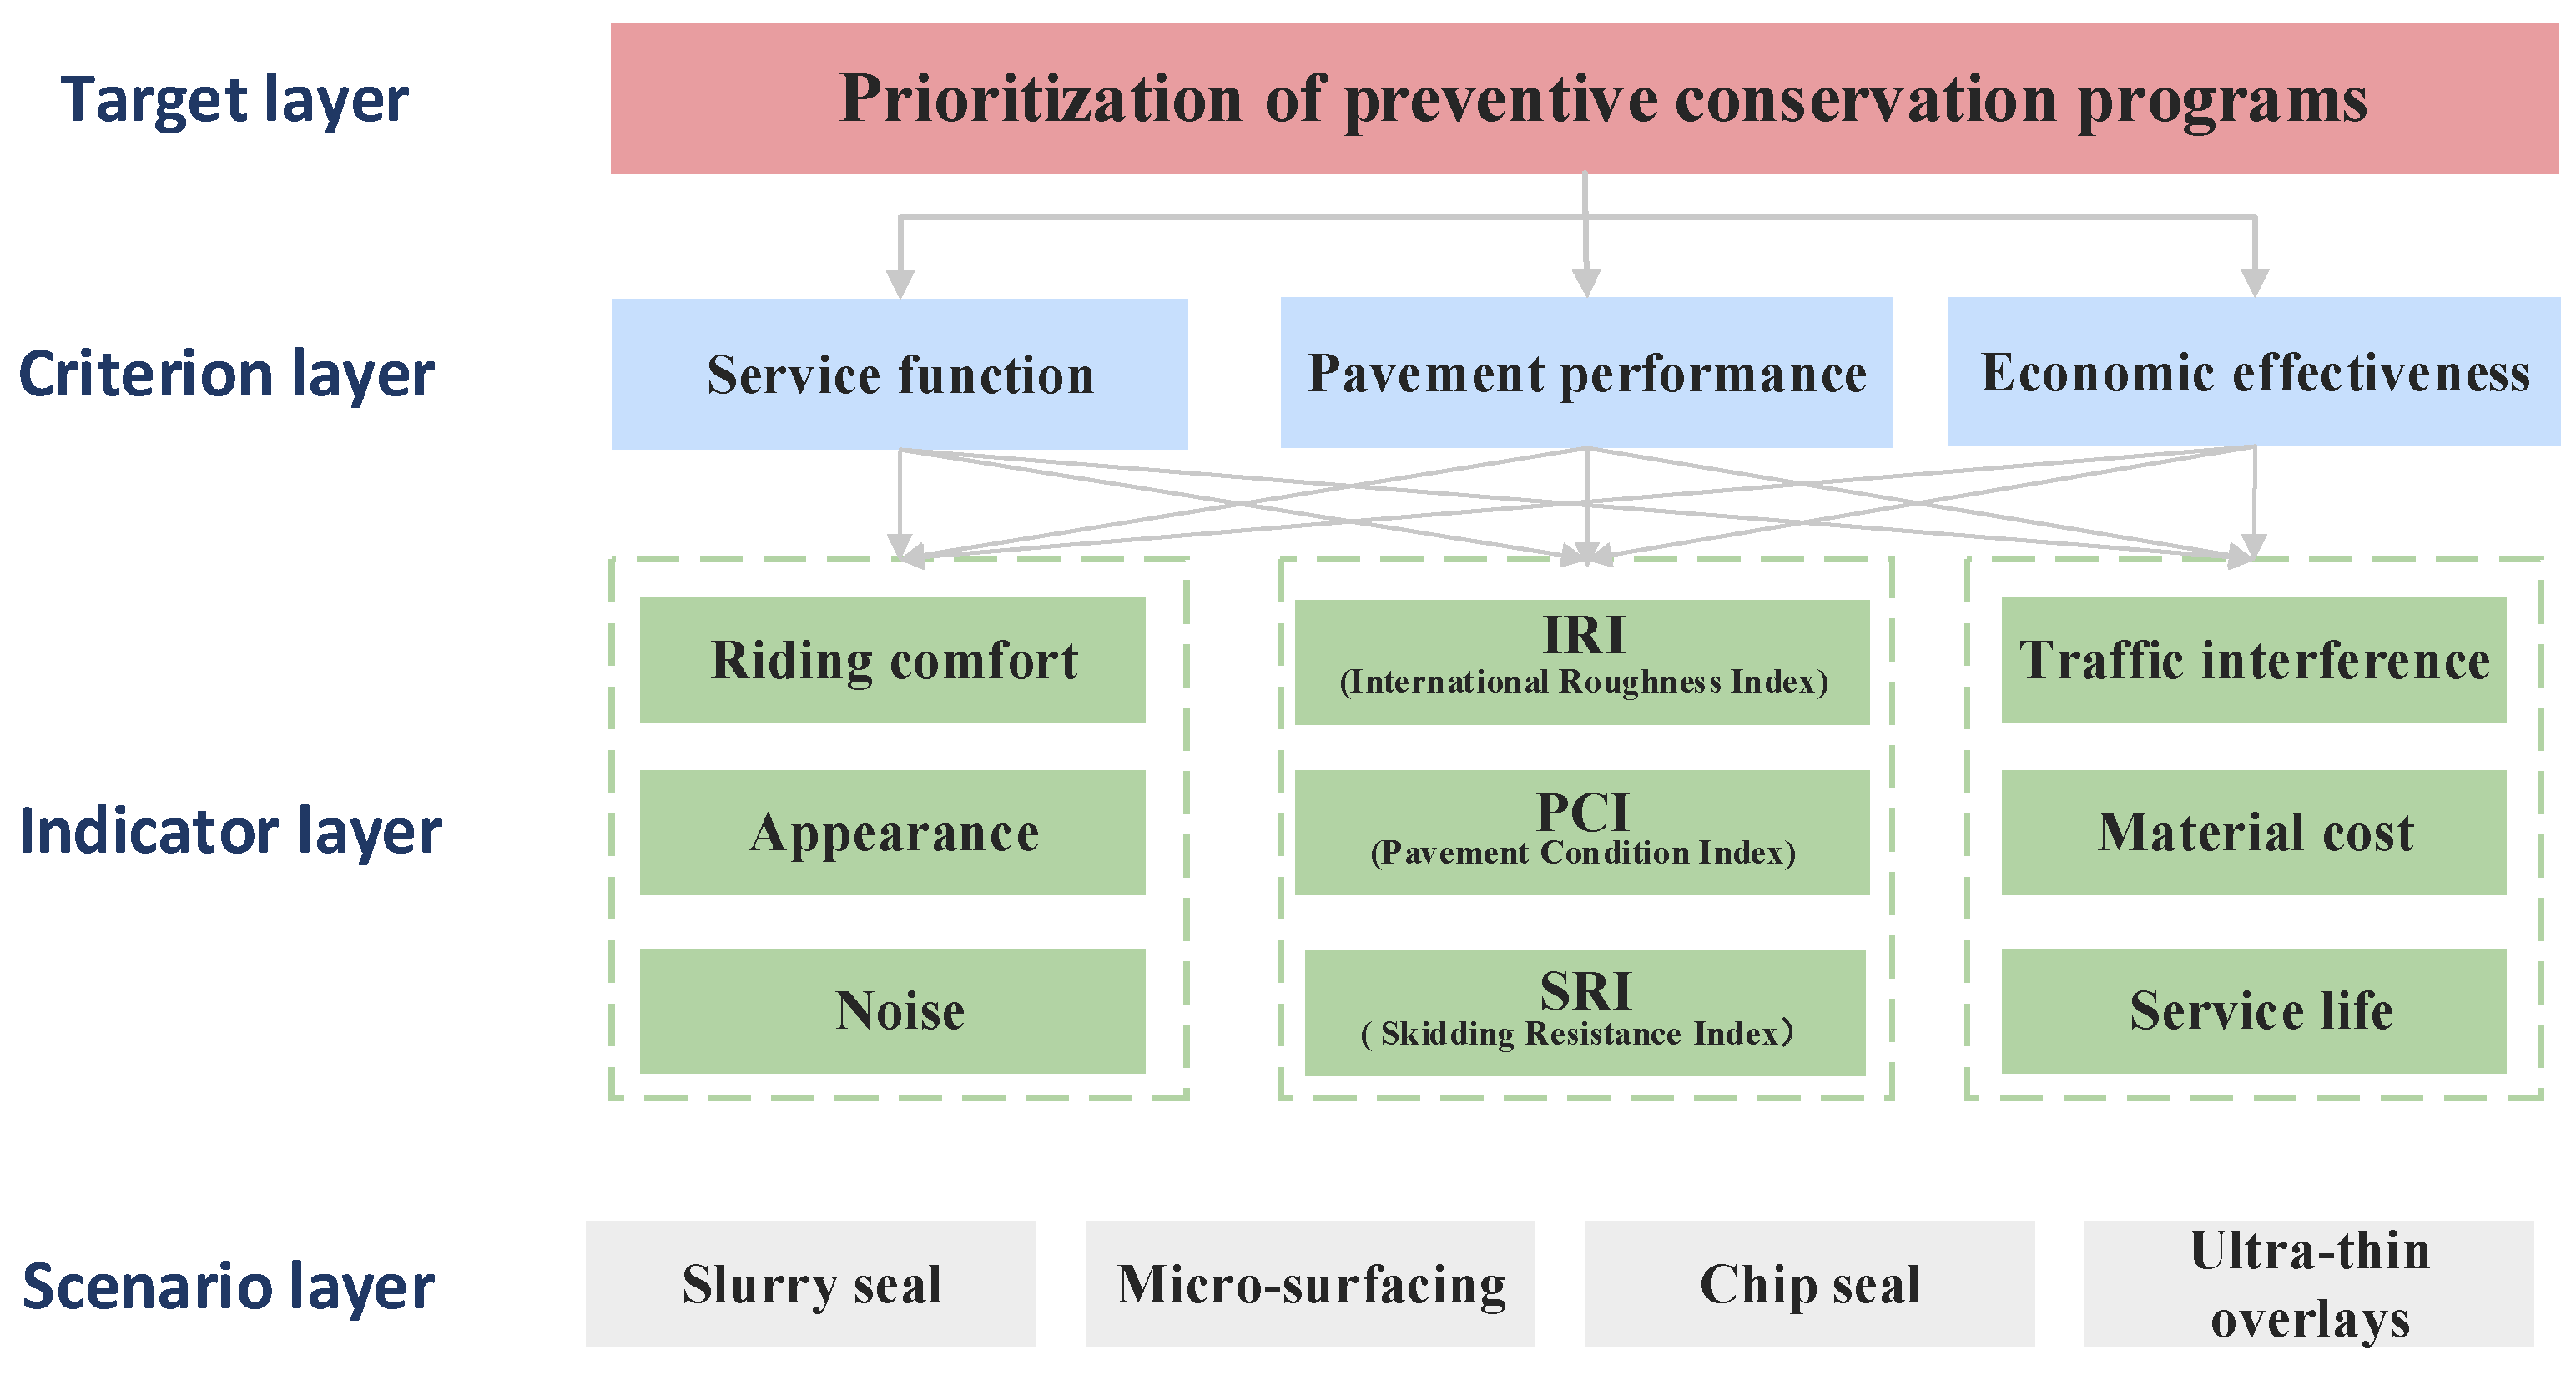
  • Using the AHP method, a comprehensive evaluation system for preventive maintenance scheme decision-making was constructed. Three aspects—service function pavement performance, and economic effectiveness—were identified as influencing factors for maintenance scheme decisions. These factors include driving comfort (X1), appearance (X2), noise (X3), quality index (X4), pavement damage (X5), skid resistance (X6), traffic interference (X7), cost (X8), and service life (X9).
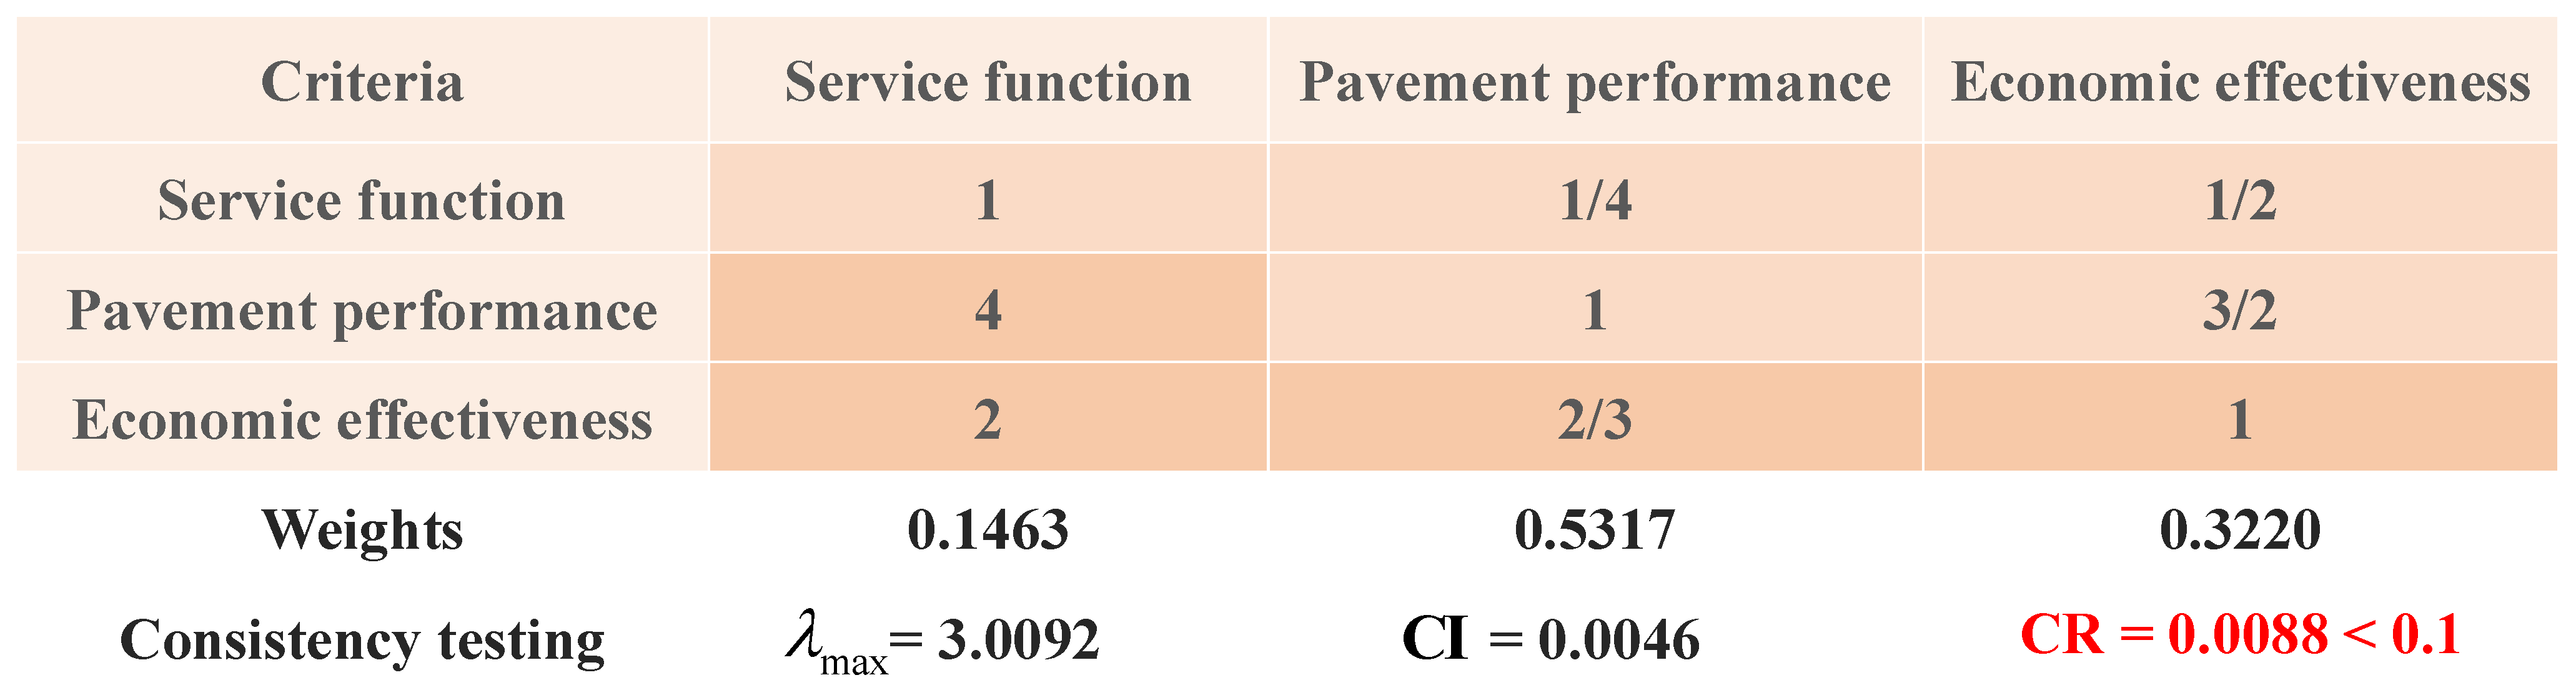
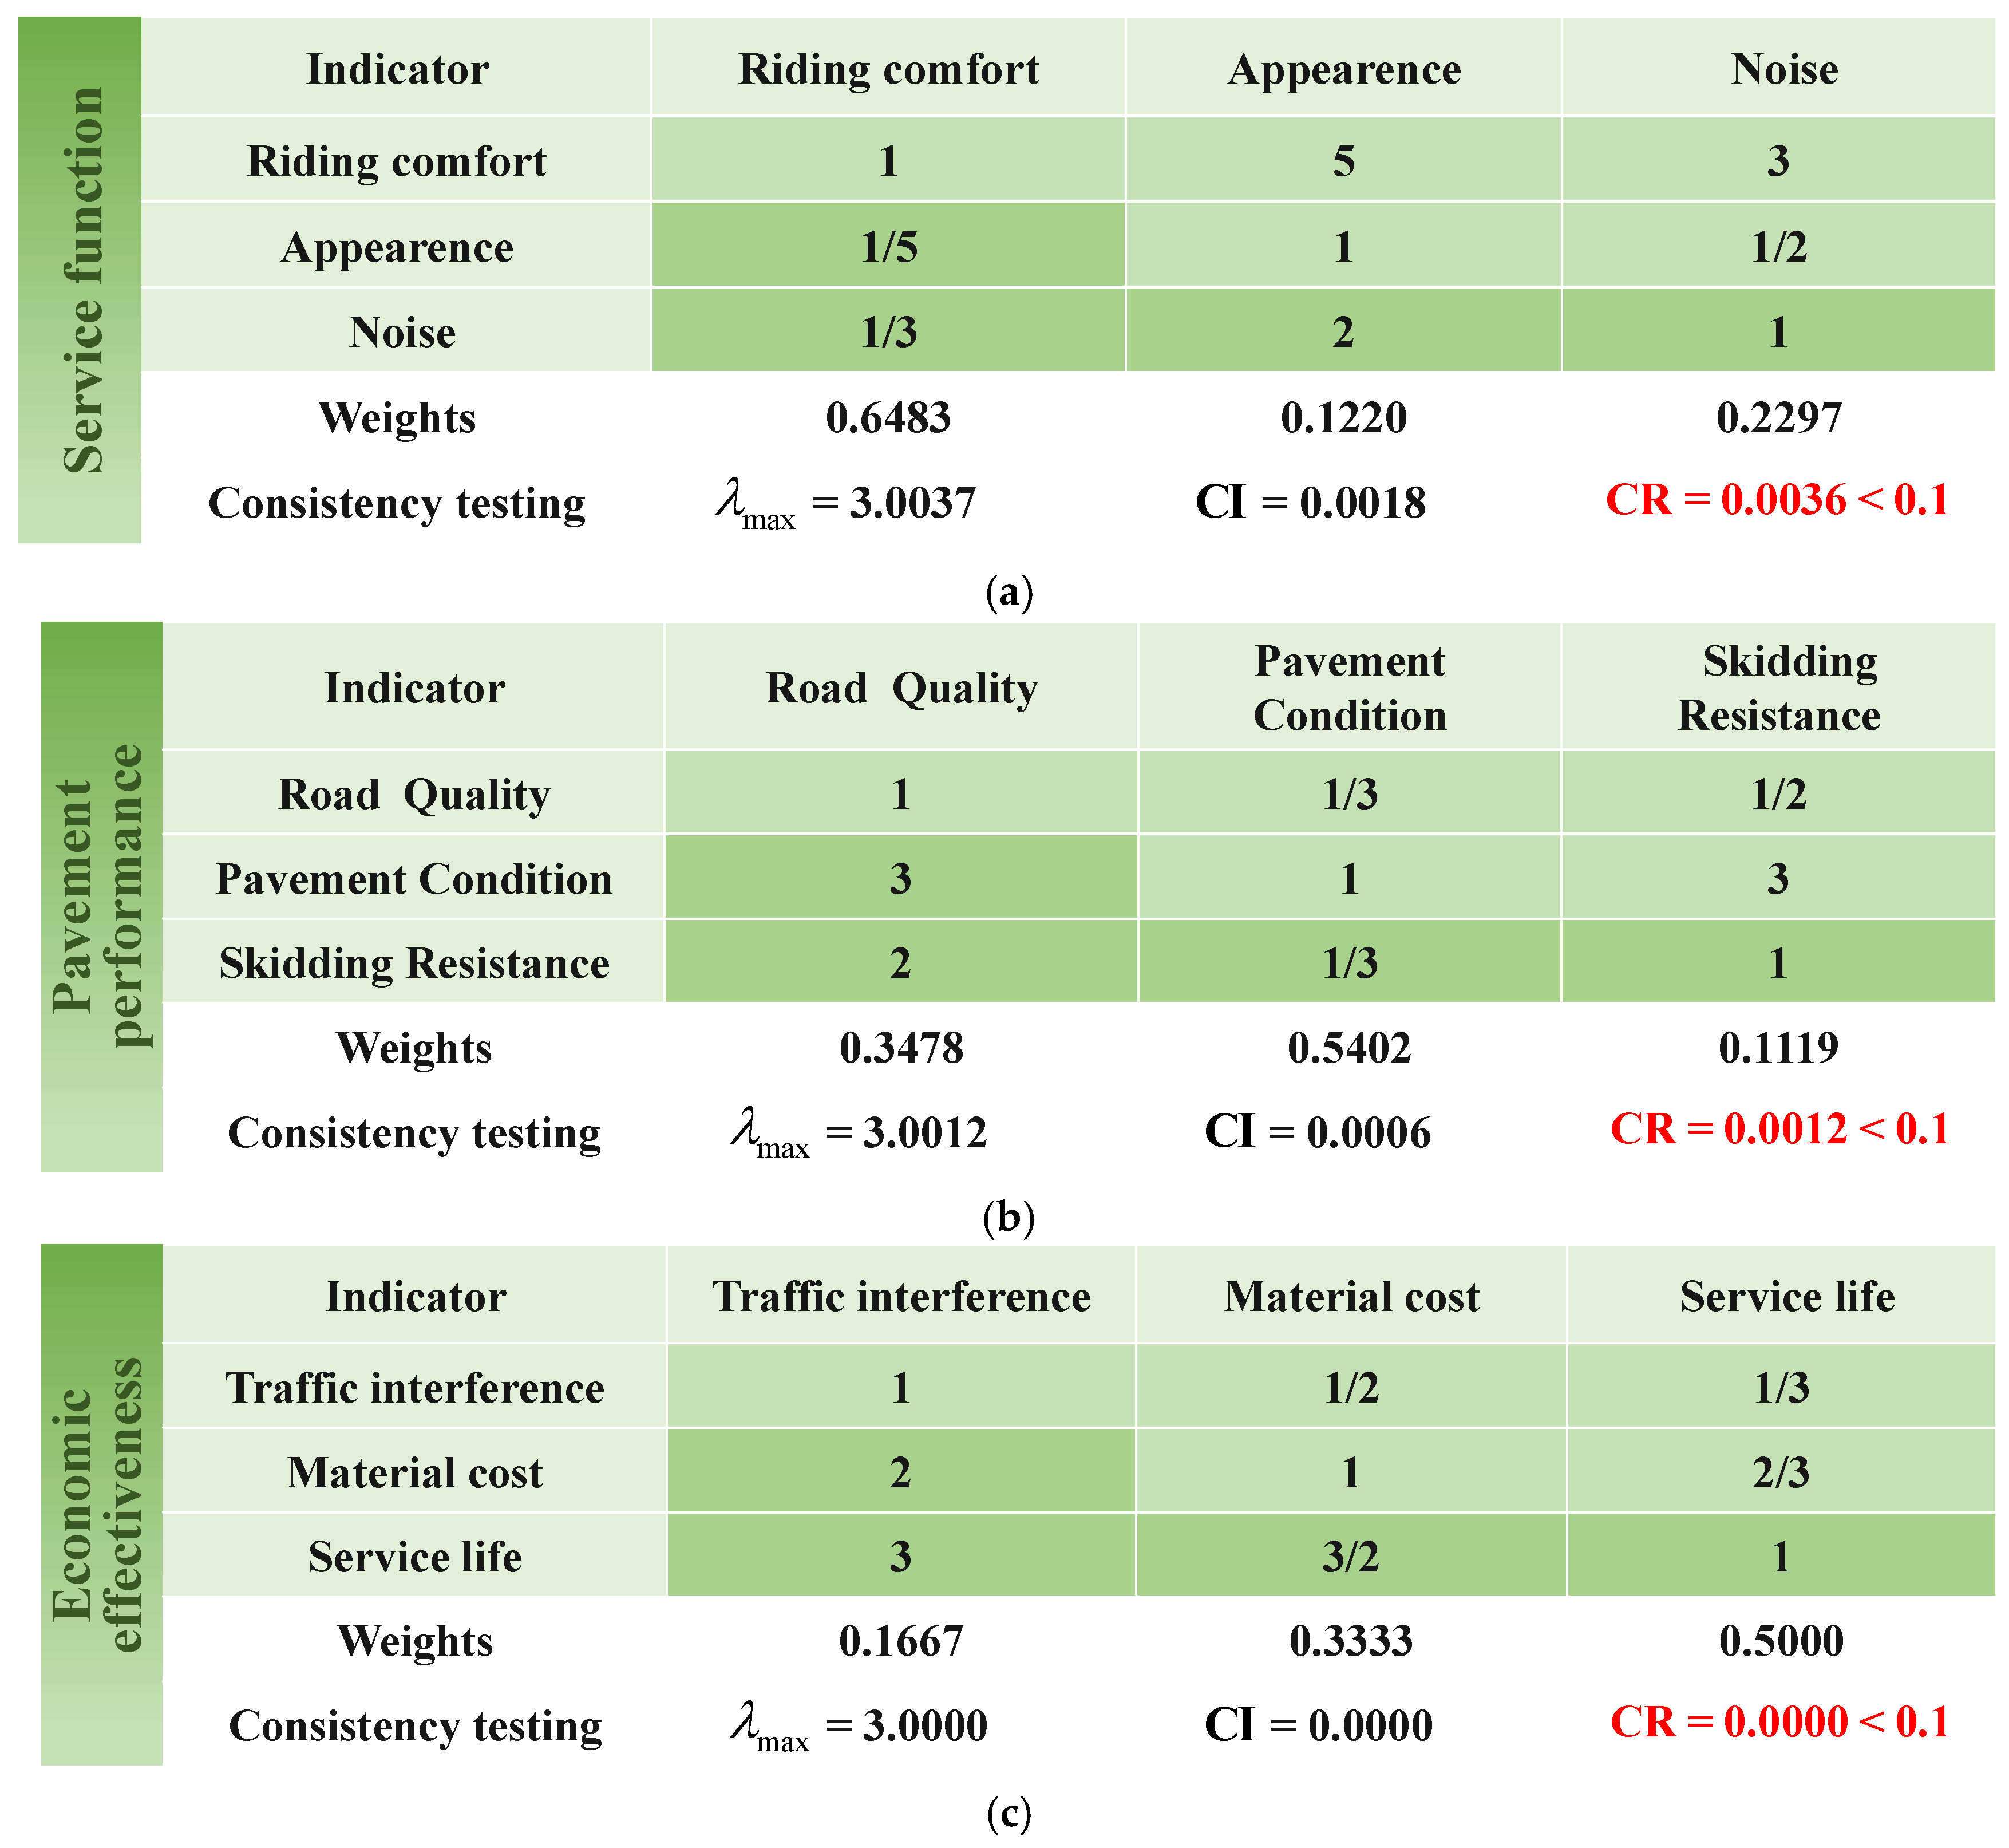
  • By comparing these factors and establishing a comparison matrix, the weights of these nine criteria influencing the schemes were determined as follows: 0.0948, 0.0179, 0.0336, 0.1849, 0.2873, 0.0595, 0.0536, 0.1074, and 0.1610, respectively. The highest weight was assigned to pavement damage condition, considered the most crucial factor affecting maintenance scheme decisions. Next in importance was the service life of the pavement after maintenance. Relatively less significant factors included road aesthetics, noise, and traffic interference during construction.
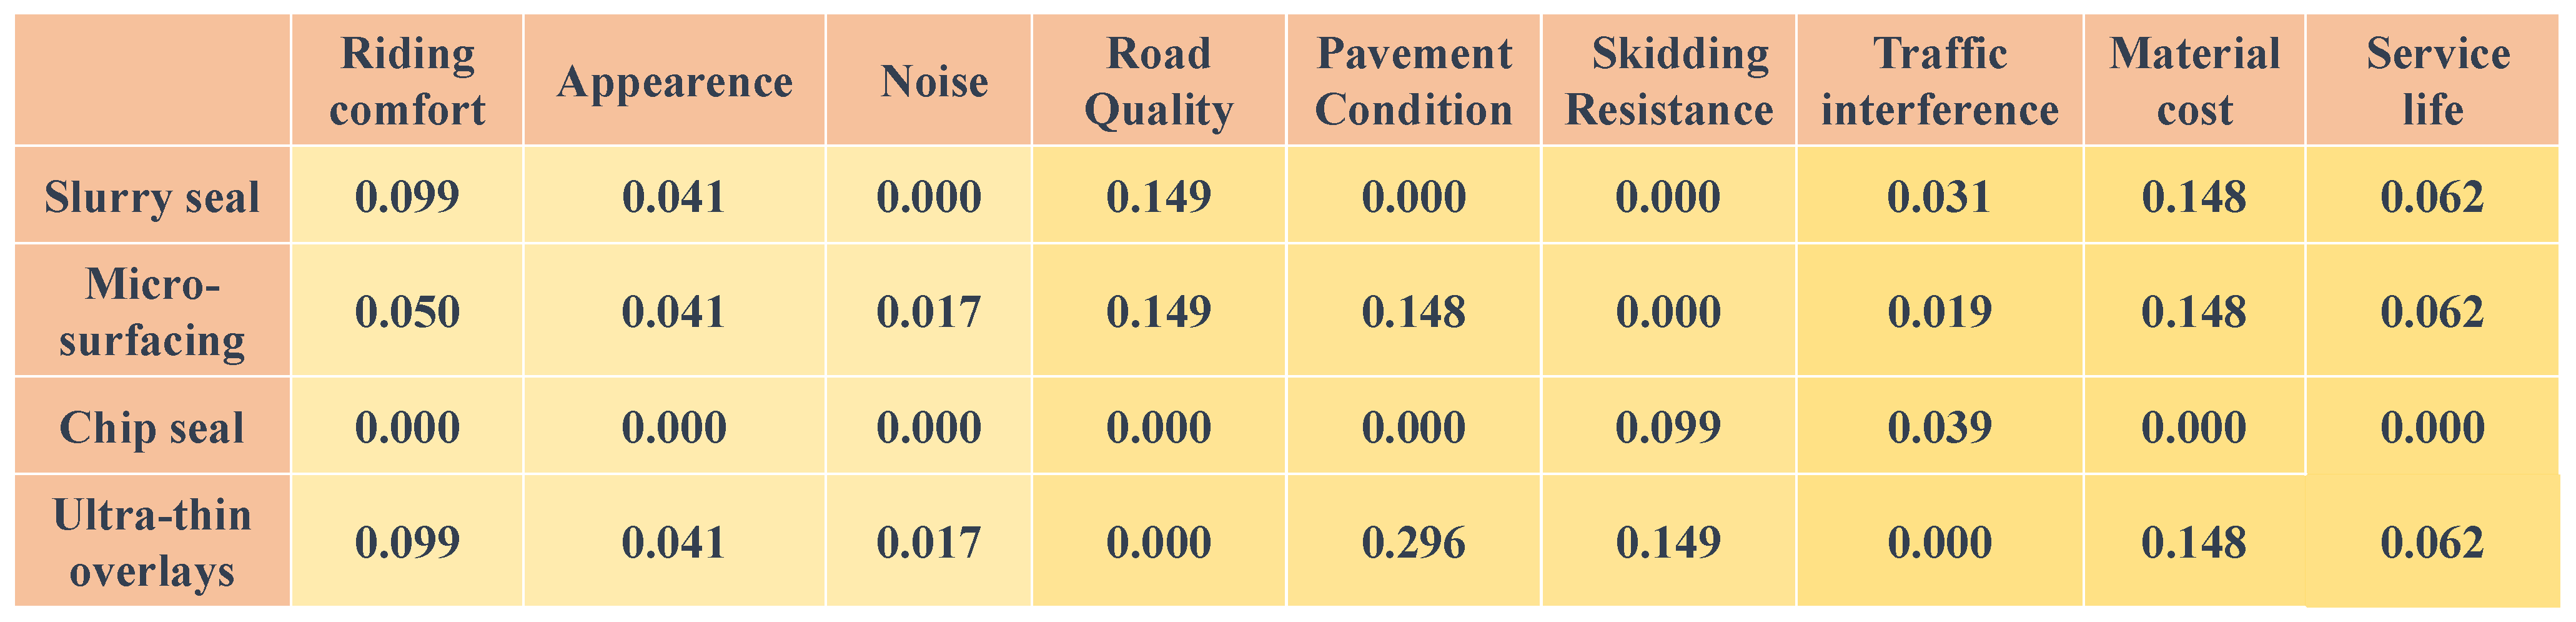
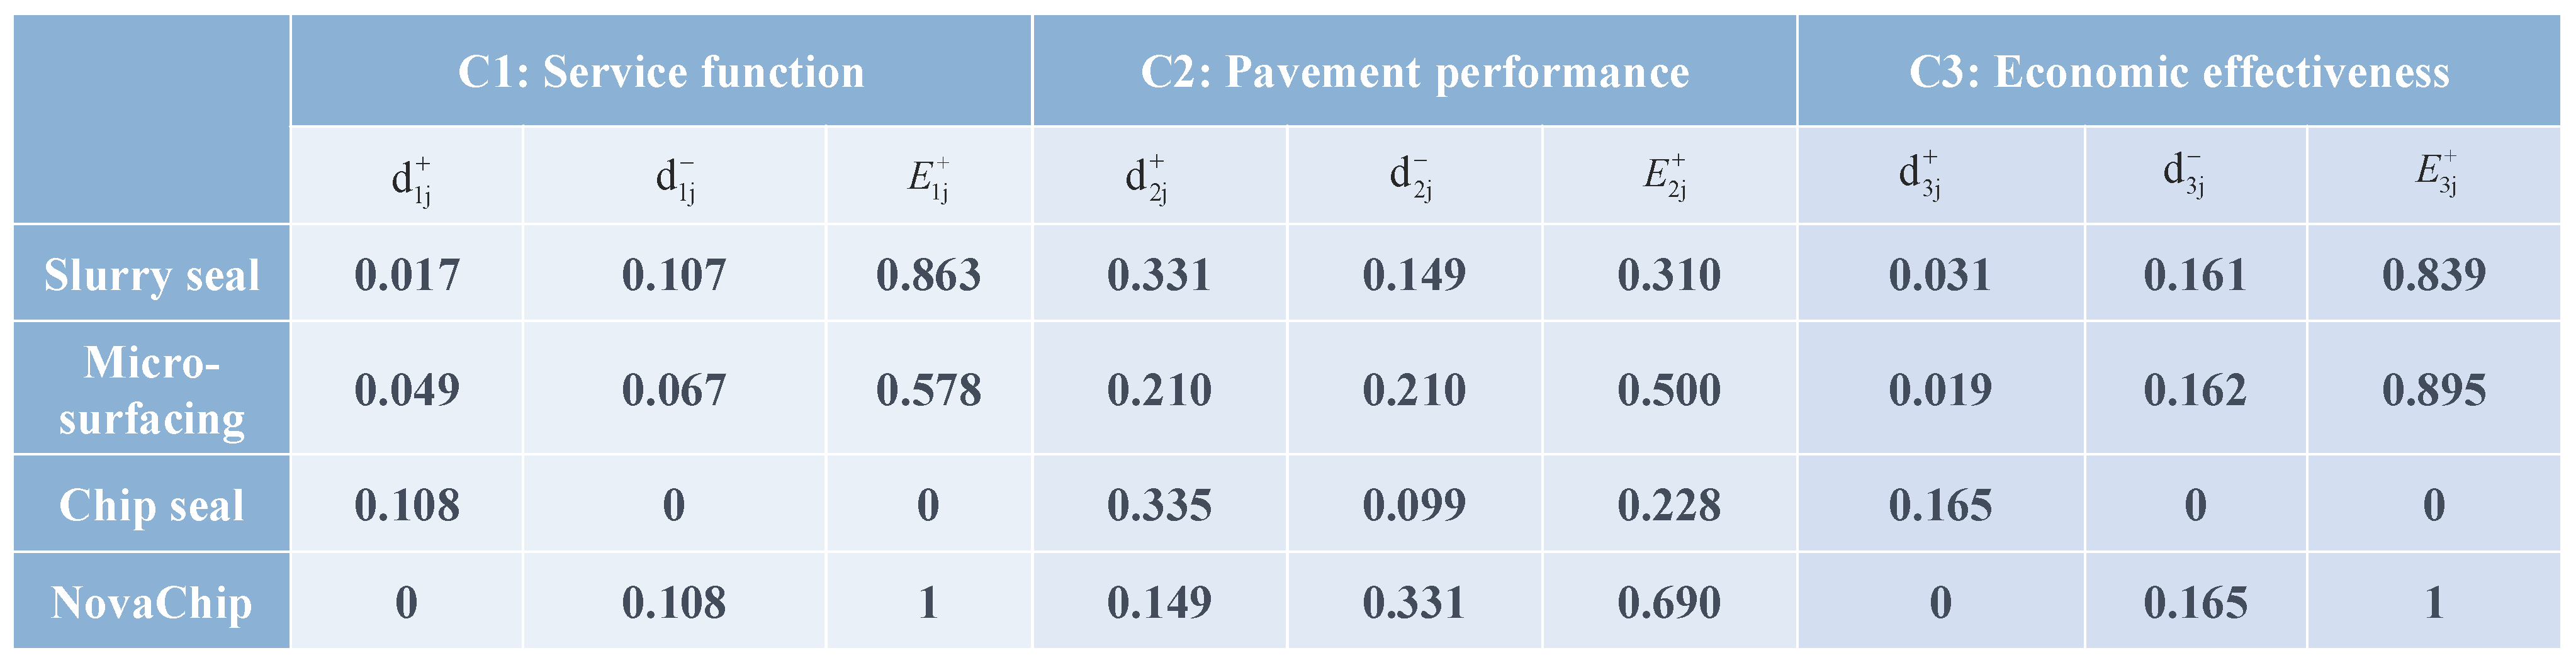
  • Using the TOPSIS method, four common preventive maintenance schemes for national trunk highways in Jiangxi Province—slurry seal, micro-surfacing, chip seal, and ultra-thin overlays—were evaluated. The closeness to the ideal targets for the schemes in terms of service function, pavement performance, and overall benefits was calculated. The closeness values for slurry seal, micro-surfacing, chip seal, and ultra-thin overlays with respect to the three criteria layers were found to be (0.863, 0.310, 0.869), (0.578, 0.500, 0.895), (0, 0.228, 0), and (1, 0.690, 1), respectively. It was observed that ultra-thin overlays exhibited the highest closeness to the ideal targets across the three criteria layers.
  • Establishing an AHP-TOPSIS comprehensive evaluation model for pavement preventive maintenance schemes, the method was applied to a 6 km long second-class highway of Jiangxi Province. The computed comprehensive superiority percentages for preventive maintenance schemes were 56.12%, 63.86%, 12.12%, and 83.52%, identifying ultra-thin overlays as the recommended preventive maintenance scheme for the example road segment.
  • This approach comprehensively addresses the issue of weighting factors from different influences, reducing the subjective biases of maintenance managers and the potential errors of decisions based on single factors. It improves the scientific basis for decisions on preventive maintenance schemes. However, further research is needed to improve its practical applicability. Firstly, the suitability of this method should be evaluated for highways of different technical quality and service life. In addition, the current study did not consider the subsequent effects of different maintenance treatments on pavement performance. Future work should investigate the factors that influence the rate of pavement performance deterioration in order to determine optimal preventive maintenance strategies.

Author Contributions

Conceptualization, T.L. and D.Y.; methodology, Y.L. and F.G.; formal analysis, J.S.; writing—original draft preparation, Y.L.; writing—review and editing, Y.L. and F.G.; investigation, C.Y. and X.Z.; validation, H.P. All authors have read and agreed to the published version of the manuscript.

Funding

This research was funded by the Technology Project of Jiangxi Provincial Department of Transportation (2021H0001), the Technology Project of Shaanxi Provincial Department of Transportation (24-35K), the Shaanxi Transportation Holding Group Technology Development Co., Ltd. Scientific Research Project (KY-2024-03), and the Technology Project of Shaanxi Provincial Department of Transportation (23-77R).

Data Availability Statement

The original contributions presented in the study are included in the article; further inquiries can be directed to the corresponding author.

Acknowledgments

The authors would like to thank the Technology Project of Jiangxi Provincial Department of Transportation.

Conflicts of Interest

Author Chun Yu and author Xin Zhao were employed by the company Jiangxi Provincial Highway Engineering Inspection Center and Shaanxi Transportation Planning and Design Institute Co., Ltd. respectively. The remaining authors declare that the research was conducted in the absence of any commercial or financial relationships that could be construed as a potential conflict of interest.

References

  1. Ministry of Transport. Statistical Bulletin on Transportation Sector Development, 2023. China Transport News, 18 June 2024; 002.
  2. Hu, Y.; Si, W.; Kang, X.; Xue, Y.; Wang, H.; Parry, T.; Airey, G.D. State of the art: Multiscale evaluation of bitumen ageing behaviour. Fuel 2022, 326, 125045. [Google Scholar] [CrossRef]
  3. Hasan, U.; Whyte, A.; AlJassmi, H. A multi-criteria decision-making framework for sustainable road transport systems: Integrating stakeholder-cost-environment-energy for a highway case study in United Arab Emirates. J. Clean. Prod. 2024, 450, 141831. [Google Scholar] [CrossRef]
  4. Wu, W.; Jiang, W.; Xiao, J.; Yuan, D.; Wang, T.; Ling, X. Investigation of LAS-based fatigue evaluation methods for high-viscosity modified asphalt binders with high-content polymers. Constr. Build. Mater. 2024, 422, 135810. [Google Scholar] [CrossRef]
  5. Zihao, G. Research on Highway Asphalt Pavement Service Performance Prediction and Preventive Maintenance Decision-Making. Master’s Thesis, Chang’an University, Xi’an, China, 2019. [Google Scholar]
  6. Lei, S. Research on the Performance Detection Evaluation and Maintenance Countermeasures of Highway Asphalt Pavement in Shaanxi Province. Master’s Thesis, Chang’an University, Xi’an, China, 2019. [Google Scholar]
  7. Wu, W.; Cavalli, M.C.; Jiang, W.; Kringos, N. Differing perspectives on the use of high-content SBS polymer-modified bitumen. Constr. Build. Mater. 2024, 411, 134433. [Google Scholar] [CrossRef]
  8. Li, J.; Yin, G.; Wang, X.; Yan, W. Automated decision making in highway pavement preventive maintenance based on deep learning. Autom. Constr. 2022, 135, 104111. [Google Scholar] [CrossRef]
  9. Li, Z.; Lan, Y.; Lin, W. Footbridge damage detection using smartphone-recorded responses of micromobility and convolutional neural networks. Autom. Constr. 2024, 166, 105587. [Google Scholar] [CrossRef]
  10. Zhang, Z.-T.; Gao, W.-H. Effect of different test methods on the disintegration behaviour of soft rock and the evolution model of disintegration breakage under cyclic wetting and drying. Eng. Geol. 2020, 279, 105888. [Google Scholar] [CrossRef]
  11. Shan, J.; Jiang, W.; Huang, Y.; Yuan, D.; Liu, Y. Unmanned Aerial Vehicle (UAV)-Based Pavement Image Stitching without Occlusion, Crack Semantic Segmentation, and Quantification. IEEE Trans. Intell. Transp. Syst. 2024, 1–16. [Google Scholar] [CrossRef]
  12. Mamlouk, M.S.; Zaniewski, J.P. Pavement preventive maintenance: Description, effectiveness, and treatments. ASTM Spec. Tech. Publ. 1998, 1348, 121–135. [Google Scholar]
  13. JTG/T 5142-01—2021; Technical Specification for Preventive Maintenance of Highway Asphalt Pavement. Ministry of Transport of the People’s Republic of China: Beijing, China, 2021.
  14. Zhan, Y.; Luo, Z.; Lin, X.; Nie, Z.; Deng, Q.; Qiu, Y.; Wang, T. Pavement preventive maintenance decision-making for high antiwear and optimized skid resistance performance. Constr. Build. Mater. 2023, 400, 132757. [Google Scholar] [CrossRef]
  15. Chen, W.; Zheng, M. Multi-objective optimization for pavement maintenance and rehabilitation decision-making: A critical review and future directions. Autom. Constr. 2021, 130, 103840. [Google Scholar] [CrossRef]
  16. Jiang, W.; Wang, T.; Yuan, D.; Sha, A.; Zhang, S.; Zhang, Y.; Xiao, J.; Xing, C. Available solar resources and photovoltaic system planning strategy for highway. Renew. Sustain. Energy Rev. 2024, 203, 114765. [Google Scholar] [CrossRef]
  17. Broniewicz, E.; Ogrodnik, K. Multi-criteria analysis of transport infrastructure projects. Transp. Res. Part. D Transp. Environ. 2020, 83, 102351. [Google Scholar] [CrossRef]
  18. Rojas-Zerpa, J.C.; Yusta, J.M. Application of multicriteria decision methods for electric supply planning in rural and remote areas. Renew. Sustain. Energy Rev. 2015, 52, 557–571. [Google Scholar] [CrossRef]
  19. Ofosu Gyinaye, L. Application of Geographic Information Systems and Multicriteria Decision Analysis in Selecting Suitable sites for Rural Tourism Development. Master’s Thesis, Aalto University, Espoo, Finland, 2017. [Google Scholar]
  20. Rezaei, J. Best-worst multi-criteria decision-making method. Omega 2015, 53, 49–57. [Google Scholar] [CrossRef]
  21. Chu, A.; Kalaba, R.; Spingarn, K. A comparison of two methods for determining the weights of belonging to fuzzy sets. J. Optim. Theory Appl. 1979, 27, 531–538. [Google Scholar] [CrossRef]
  22. Chang, C.-L. A modified VIKOR method for multiple criteria analysis. Environ. Monit. Assess. 2010, 168, 339–344. [Google Scholar] [CrossRef]
  23. Opricovic, S.; Tzeng, G.-H. Compromise solution by MCDM methods: A comparative analysis of VIKOR and TOPSIS. Eur. J. Oper. Res. 2004, 156, 445–455. [Google Scholar] [CrossRef]
  24. Sayadinia, S.; Beheshtinia, M.A. Proposing a new hybrid multi-criteria decision-making approach for road maintenance prioritization. Int. J. Qual. Reliab. Ma 2021, 38, 1661–1679. [Google Scholar] [CrossRef]
  25. Nautiyal, A.; Sharma, S. Scientific approach using AHP to prioritize low volume rural roads for pavement maintenance. J. Qual. Maint. Eng. 2022, 28, 411–429. [Google Scholar] [CrossRef]
  26. Kresnanto, N.C. Prioritizing District Road Maintenance Using AHP Method. In Proceedings of the Second International Conference of Construction, Infrastructure, and Materials: ICCIM 2021, Jakarta, Indonesia, 26 July 2021; Springer Nature Singapore: Singapore, 2022; pp. 363–371. [Google Scholar]
  27. Ouma, Y.O.; Opudo, J.; Nyambenya, S. Comparison of fuzzy AHP and fuzzy TOPSIS for road pavement maintenance prioritization: Methodological exposition and case study. Adv. Civ. Eng. 2015, 2015, 140189. [Google Scholar] [CrossRef]
  28. Ramadhan, R.H.; Al-Abdul Wahhab, H.I.; Duffuaa, S.O. The use of an analytical hierarchy process in pavement maintenance priority ranking. J. Qual. Maint. Eng. 1999, 5, 25–39. [Google Scholar] [CrossRef]
  29. Ahmed, S.; Vedagiri, P.; Rao, K.K. Prioritization of pavement maintenance sections using objective based Analytic Hierarchy Process. Int. J. Pavement Res. Technol. 2017, 10, 158–170. [Google Scholar] [CrossRef]
  30. Shuai, Q.Y.; He, Y.B. Application of Improved TOPSIS Method to the Evaluation on Asphalt Pavement Performance. App. Mech. Mater. 2013, 253, 611–615. [Google Scholar] [CrossRef]
  31. Chang, J.-R.; Chen, D.-H.; Hung, C.-T. Selecting Preventive Maintenance Treatments in Texas: Using the Technique for Order Preference by Similarity to the Ideal Solution for Specific Pavement Study3 Sites. Transp. Res. Rec. 2005, 1933, 62–71. [Google Scholar] [CrossRef]
  32. Mathew, M.; Chakrabortty, R.K.; Ryan, M.J. A novel approach integrating AHP and TOPSIS under spherical fuzzy sets for advanced manufacturing system selection. Eng. Appl. Artif. Intell. 2020, 96, 103988. [Google Scholar] [CrossRef]
  33. Mangla, S.K.; Kumar, P.; Barua, M.K. Risk analysis in green supply chain using fuzzy AHP approach: A case study. Resour. Conserv. Recycl. 2015, 104, 375–390. [Google Scholar] [CrossRef]
  34. Zhang, D.; Hu, J. A novel multi-interval-valued fuzzy set model to solve MADM problems. Expert. Syst. Appl. 2024, 238, 122248. [Google Scholar] [CrossRef]
  35. JTG 5210—2018; Highway Performance Assessment Standards. Ministry of Transport of the People’s Republic of China: Beijing, China, 2018.
Figure 1. Relationship between road service levels, maintenance, and years of operation.
Buildings 14 03048 g001
Figure 2. Operational flow of AHP-TOPSIS method.
Buildings 14 03048 g002
Figure 3. Analytic hierarchy process model.
Buildings 14 03048 g003
Figure 4. Judgment matrix based on target layers.
Buildings 14 03048 g004
Figure 5. (a). Judgment matrix based on service function. (b). Judgment matrix based on pavement performance. (c). Judgment matrix based on economic effectiveness.
Buildings 14 03048 g005
Figure 6. (a) Initial judgment matrix (original value). (b) Initial judgment matrix (normalized value).
Buildings 14 03048 g006
Figure 7. Weighted normalized decision matrix.
Buildings 14 03048 g007
Figure 8. Distance and proximity index of each solution to ideal solution.
Buildings 14 03048 g008
Table 1. Definitions of decision-making indicators and criterions for pavement preventive maintenance schemes.
CriteriaDefinitionIndicatorDefinition
Service functionCriteria evaluate transportation needs and other service requests.Riding comfort (Score)The degree of turbulence of the vehicle
Appearance (Score)The beautification degree of road surface
Noise (Score)Noise generated during construction
Pavement performanceCriteria evaluate the functional characteristics of road surfaces and structures.Road quality index (Score)The cumulative vertical displacement value of a quarter-car at a speed of 80 km/h
Pavement condition index (Score)Pavement damage rate
Skid resistance index (Score)Pavement friction coefficient or roughness.
Economic effectivenessCriteria evaluate the cost and benefits generated by maintenance.Traffic interference (Score)Traffic disruption caused by construction
Material cost
(Yuan/m2)
Purchase cost of materials
Service life
(Year)
Evaluation of material utilization benefits
Table 2. Asphalt pavement damage types, weights, and conversion factors.
Type (i)CategoryDegreeUnit
(m2)
Weights
(wi)
Conversion Factors
(Auto-Detection) (wi)
1Alligator cracksLArea0.61.0
2M0.8
3H1.0
4Massive cracksLArea0.60.8
5H0.8
6Longitudinal cracksLLength × 0.2 m0.62.0
7H1.0
8Transverse cracksLArea × 0.2 m0.62.0
9H1.0
10SettlementLArea0.61.0
11H1.0
12RuttingLLength × 0.4 m0.6
13H1.0
14DistortionLArea0.61.0
15H1.0
16PotholesLArea0.81.0
17H1.0
18RavelingLArea0.61.0
19H1.0
20Flushing Area0.20.2
21Patches Area or Length × 0.2 m0.10.1 (0.2)
Table 3. Scale of comparison.
The Verbal Expression Judgments of the PreferenceNumerical Expression
Absolute importance x i over y i 9
Between absolute and demonstrated importance x i over y i 8
Demonstrated importance over7
Between demonstrated and essential or strong importance over6
Essential or strong importance over5
Between essential or strong and weak importance over4
Weak importance over3
Between weak and equal importance over2
Equal importance over1
Between weak and equal importance over1/2
Weak importance over1/3
Between essential or strong and weak importance over1/4
Essential or strong importance over1/5
Between demonstrated and essential or strong importance over1/6
Demonstrated importance over1/7
Between absolute and demonstrated importance over1/8
Absolute importance over1/9
Table 4. Values of RI.
Determining Matrix Order1234567891011
RI000.580.91.121.241.321.411.451.491.51
Table 5. Pavement performance data.
Starting Stake NumberEnding Stake NumberPQIAssessment GradePCIRQISRI
534534.7392.5Excellent93.59187.5
534.7353696.0Excellent98.492.488.2
53653797.4Excellent99.294.689.5
537537.99792.3Excellent9194.388.6
537.99753996.2Excellent97.793.989.9
53954096.8Excellent98.194.888.7
540541.1595.1Excellent95.694.487.6
Table 6. Highway classifications for preventive maintenance schemes.
Highway ClassificationsPreventive Maintenance Schemes
Fog SealChip Seal and Fiber-Reinforced SealSlurry SealMicro-SurfacingComposite SealThin Layer CoveringUltra-Thin OverlaySeal Layer OverlayIn-Place Hot Recycling
Expressway××
First-class highway××
Second-class highway
Third-class highway×
Fourth-class highway×
Where √ represents applicable, × represents not applicable, and ○ represents optional.
Table 7. Pavement condition levels suitable for maintenance technologies.
Maintenance TechnologiesPavement Condition LevelsSecond-Class HighwayThird- and Fourth-Class Highway
SealFog sealPCI, RQI, RDI≥90≥85
SRI≥80-
Chip seal and Fiber-reinforced sealPCI, RQI, RDI≥82≥80
Slurry sealPCI, RQI, RDI≥85≥80
Micro-surfacingPCI, RQI≥85≥80
Composite sealPCI, RQI, RDI≥80≥75
OverlayThin layer coveringPCI, RQI≥80≥83
Ultra-thin layer coveringPCI, RQI≥80≥80
Seal layer overlayPCI, RQI≥80≥80
Table 8. Ratings of attributes for four maintenance schemes.
Influencing FactorsChip SealSlurry SealMicro-SurfacingUltra-Thin Overlays
Driving Comfort2–42–43–53–5
Appearance3–54–54–54–5
Noise1–23–52–43–5
Smoothness2–43–54–54–5
Damage2–43–53–53–5
Skid Resistance4–53–53–54–5
Traffic Disruption1–23–54–53–5
Table 9. Comprehensive evaluation criteria system for each scheme.
GoalIIIIIIIV
Criterion LayerIndicator Layer
Technical Condition P1X10.750.650.550.75
X20.850.850.750.85
X30.650.750.650.75
Usability Performance P2X40.750.750.650.65
X50.650.750.650.85
X60.550.550.750.85
Comprehensive Benefits P3X70.850.850.750.85
X8/(Year)2.52.522.5
X9/(Yuan/m2)22.526.520.532.5
Table 10. Overall ranking weights of indicator levels.
P-X RankingO-P RankingOverall Ranking Weights
w1 = 0.1463w2 = 0.5317w3 = 0.3220
X10.6483 0.0948
X20.1220 0.0179
X30.2297 0.0336
X4 0.3478 0.1849
X5 0.5402 0.2873
X6 0.1119 0.0595
X7 0.16670.0536
X8 0.33330.1074
X9 0.50000.1610
Table 11. Positive ideal and negative ideal solutions for each indicator.
X1X2X3X4X5X6X7X8X9
c j + 0.0990.0410.0170.1490.2960.14900.1480.062
c j 0000000.03900
Disclaimer/Publisher’s Note: The statements, opinions and data contained in all publications are solely those of the individual author(s) and contributor(s) and not of MDPI and/or the editor(s). MDPI and/or the editor(s) disclaim responsibility for any injury to people or property resulting from any ideas, methods, instructions or products referred to in the content.

