Article

Urban Renewal Potential of Old Urban Areas in Resource-Based Cities in Developing Countries: A Case Study of Dongsheng District, Ordos, China

1
School of Earth and Space Sciences, Peking University, Beijing 100871, China
2
Peking University Planning and Design Institute (Beijing) Co., Ltd., Beijing 100871, China
3
Beijing Tsinghua Tongheng Urban Planning & Design Institute, Beijing 100085, China
4
Faculty of Humanities and Arts, Macau University of Science and Technology, Macau 999078, China
*
Authors to whom correspondence should be addressed.
Buildings 2024, 14(10), 3065; https://doi.org/10.3390/buildings14103065
Submission received: 28 December 2023 / Revised: 14 April 2024 / Accepted: 22 August 2024 / Published: 25 September 2024
(This article belongs to the Section Architectural Design, Urban Science, and Real Estate)

Abstract

:
Many developing countries have experienced or are experiencing periods of rapid urbanization, and the sustainable development of resource-based cities has increasingly come under the spotlight. The extensive mining of resources, which once propelled the economic growth of these cities, has enabled the continuous construction of more urban districts. However, as these new districts become favored, the old districts in these cities tend to be overlooked. This neglect becomes particularly pronounced once the resources start to dwindle, with older districts, which lack contemporary facilities, declining over time. Dongsheng District, in China’s Ordos City, is a prime example of this phenomenon. In this study, we took Dongsheng District as the research subject to explore the urban renewal potential of old urban areas in resource-based cities in developing countries. First, we constructed an assessment system for evaluating the urban renewal potential of old urban areas in resource-based cities in developing countries. Using ArcGIS, we conducted a quantitative evaluation of the spatial distribution of urban renewal potential indicators in the assessment system. Second, we conducted a comparative analysis by juxtaposing the spatial distribution of urban renewal potential derived from the assessment system with the current land use and historical development of the study area to explore potential correlations. Third, we propose the distribution of urban renewal potential in old urban areas of resource-based cities in developing countries by discussing the research results. The research found that in relation to current land use, residential and commercial service areas are more likely to form high-potential plots. Urban villages are often considered to have high potential for urban renewal, but in these urban areas, they do not always exhibit significant urban renewal potential. Regarding the relationship with historical development, urban renewal potential generally shows a negative correlation with historical development, and most other specific indicators of urban renewal also show a correlation with historical development.

1. Introduction

Old urban areas of resource-based cities, especially in developing countries, are facing the problem of declining vitality. Dominated by the exploitation and processing of natural resources, these cities have their own particular methods for development and construction. Resource-based industries cannot always support urbanization in these cities because their leading industries often go through stages of growth, maturity, decline, and diversified regeneration [1]. With regard to urban development, due to its resource-oriented characteristics, the process of urban development can fluctuate greatly, which can lead to soaring growth in certain periods, quickly followed by shrinkage [2,3]. In terms of urban spatial patterns, resource-based cities are often more dispersed than other cities, and the expansion of their urban areas is highly dependent on the distribution of natural resources [4,5,6]. In response to the characteristics of industries, urban development, and urban spatial patterns, certain macro-control measures and detailed planning should be offered to these cities to help them develop sustainably. However, in countries in the early stages of development, due to the lack of professional guidance and master plans, most resource-based cities developed their land rapidly in an extensive and random way, leaving the old urban areas in poor condition.
Based on the development and construction methods of resource-based cities, we compared world-renowned resource-based cities (Table 1) in developed countries—Aberdeen in the UK, Pittsburgh and Houston in the United States, and Calgary in Canada [7,8,9,10]—with those in developing countries—Kursk in Russia, Baku in Azerbaijan, and Daqing in China [11,12,13]. We found that different from cities in developed countries, resource-based cities in developing countries tend to have certain characteristics. First, the urban area structure is easily scattered or split, and second, it is more prone to the problem of industrial transformation. These characteristics have led to the decline of old urban areas in resource-based cities in many developing countries.
Referring to several typical cities in Georgia and China [14,15,16], the decline of old urban areas can be roughly summarized into three stages (Figure 1). The first stage is rapid expansion. Resource-based cities in early developing countries could obtain sufficient construction funds by leveraging their resource advantages, and rapid urban expansion formed large areas as the central parts of these cities. Several scattered urban settlements are established near natural resources, relying on resource exploitation and processing factories. The second stage is the formation of new urban districts or areas. Old urban areas fail to meet the contemplated standards of a modern city, and as a result, new developments and construction are located outside of old urban areas, where more land can be used, and there is better transportation or scenery. Settlements scattered around these cities eventually begin to merge into some advantageous areas or merge with the city. The third stage is the shifting stage, during which the new district takes over the dominant position of the old district. Due to the reduction of natural resource stocks and the lack of alternative industries or technological progress, resource-oriented industries start to decline, and the income of the city cannot continue to support the development of both old and new urban districts. The building environment and infrastructure of the new urban district are more attractive. With increasing investment in all kinds of funding, new districts become the main concern of the whole city. The old urban areas become “forgotten”. At this stage, with less attention to all aspects, these old areas experience urban problems (such as decreased land value, loss of population, low quality of living environment, and damage to the natural environment). It is imperative to take action to renew and revive these old urban areas.
As a typical example, Dongsheng District, which is located in the southwest of the Inner Mongolia Autonomous Region of China, is the old district of Ordos City, famous for its coal and natural gas. Relying on the local mineral resources, Dongsheng District was the first urbanized area in Ordos and underwent rapid urban expansion, growing 10 times bigger in just 25 years. In 2004, to show the city’s ambition, Ordos announced the establishment of Kangbashi New District, which is about 25 km from Dongsheng District. With the relocation of major public facilities from Dongsheng District to Kangbashi New District and a massive injection of funds, the new urban district completed its basic construction in a few years [17]. However, as the development of resource-based industries in Ordos was hindered, the pace of urbanization in Ordos slowed down significantly. Since the municipal government was moved to Kangbashi New District and the construction there is of high quality, Ordos chose to invest more in the construction of Kangbashi New District [18,19]. Under these circumstances, Dongsheng District, the old urban area, is facing various urban issues, affecting the built environment, public services, and residents’ lives. In terms of the built environment, Dongsheng District faces problems such as a high rate of idle urban land, excess commercial land and buildings, a large number of unfinished buildings, and many “urban villages” [20,21] (in China, urban villages refers to rural villages that have lost or nearly lost their cultivated land within urban built-up areas during the process of rapid urbanization, but still maintain villagers’ autonomy and rural collective ownership. The villagers still live in the original villages, which are usually in poor condition). Regarding public services, there is an inadequacy in supporting public service facilities, such as a severe shortage of parking facilities [22]. In terms of residents’ lives, the district is experiencing population loss and insufficient resident retention intentions [23].
Taking Ordos Dongsheng District as the research area and sample, in this study we aimed to identify the renewal potential characteristics of old urban areas in resource-based cities in developing countries and explore feasible urban renewal strategies. After the literature review of what has been studied or summarized in this specific area, Section 3 describes the construction of a renewal potential assessment system, with data collected from multiple sources and the calculation of various indicators to assess the overall urban renewal potential. Section 4 presents the results, and the final section concludes the main points and provides suggestions and future research directions.

2. Literature Review

Urban development inevitably leads to urban renewal at a certain stage; therefore, urban renewal is a research field with a long history. Moreover, it is imperative to acknowledge that the objectives and modalities of urban renewal are intricately intertwined with the developmental phases of urban areas. Thus far, urban renewal remains replete with novel opportunities for deeper academic inquiry [24]. In recent years, most cities in the world have been in the process of rapid urbanization, especially in developing countries, where development is still on the rise. Cities in developed countries, which have already passed or are about to pass the stage of rapid urbanization, are more inclined toward refining their urban renewal tasks. Therefore, research on urban renewal tends to focus on the community, cultural, gentrification, and other directions [25,26,27]. Unlike developed countries, most cities in developing countries are still in the stage of rapid urbanization. While rapid urbanization brings opportunities to these cities, it also brings a series of urban issues. At present, the primary goal of urban renewal in developing countries is still to alleviate the urban issues caused by extensive development [28,29]. The decline of old urban areas in resource-based cities in developing countries is one typical problem.
Recently, scholars have conducted research on urban issues in resource-based cities in developing countries. We searched for related research and found that many studies have explored the sustainable development and transformation of resource-based cities in developing countries from various macro perspectives. Some scholars have constructed sustainability indices for these cities based on macro dimensions such as environment, society, and economy, made classifications, and provided improvement recommendations [30,31]. Tan et al. [32] explored the transformational factors by comparing multiple cities. Yu et al. [33] analyzed the relationship between environmental and economic development during the transformation process and proposed relevant policy recommendations. Fan and Zhang [34] analyzed the impact of China’s sustainability-related policies on the development of resource-based cities and summarized the types and characteristics of these cities.
Other research has also adopted a relatively micro perspective. Yang et al. [35] analyzed the sustainability of these cities from an economic perspective and further classified them based on their regional distribution and life stages. Yang et al. [36] constructed an evaluation system from an ecological and environmental perspective, providing references for improving the ecological carrying capacity of these cities. Song et al. [37] summarized the spatiotemporal evolution mechanism and driving factors of carbon emissions in these cities by observing carbon emission patterns. Song et al. [38] calculated the land-use efficiency of multiple resource-based cities in China and explored their determinants.
These studies can provide experience with and references for urban renewal of resource-based cities in developing countries, but further research is still needed. First, in terms of research scale, most of the relevant research has treated resource-based cities in developing countries as whole regions. However, as urban development and resource depletion occur, new issues and contradictions can arise between different regions within these cities, necessitating more specific and targeted research. Second, in terms of research perspective, most of the relevant research has adopted a relatively macro perspective. Although some scholars have started to pay attention to some micro-level issues in their work, there are still many new issues that have not been covered. A micro-level perspective is the main direction for future related research. However, some scholars have conducted research on the land issues of resource-based cities in developing countries, and their research methods focus on land use efficiency in cities. As land is the primary carrier of urban activities and is a comprehensive and complex system, factors such as land use patterns, the built environment, urban population activities, and residents’ preferences will interact with it. Currently, there is a lack of in-depth research systematically examining the urban land system in resource-based cities in developing countries.
In Ordos, China, the study area of this research, the urban issues arising from resource dominance have also caught the attention of other scholars. Some scholars have conducted research on the urban issues caused by rapid expansion in the region. Woodworth [39] analyzed a series of challenges faced by Ordos during its rapid expansion facilitated by mineral resources. Yin et al. [40] conducted research on the issue of “ghost cities” resulting from the rapid expansion of the Kangbashi New Area. Yin et al. [41] also explored the issue of farmers losing their land due to rapid urbanization, and Liu et al. [42] explored the coordination among various urban regions in Ordos. These studies primarily focused on the challenges faced by the early development of the new urban areas in Ordos. However, as policies shifted and the new urban areas became more refined, they gradually overcame the challenges of inadequate vitality. Instead, the decline of the Dongsheng District, which is the old urban area, became a new issue. This new issue is also a typical one that arises during the development process of resource-based cities in developing countries. Further targeted research is needed to address these issues.

3. Materials and Methods

3.1. Study Area

Dongsheng District, under the jurisdiction of Ordos City, is located in the southwest of the Inner Mongolia (Neimenggu) Autonomous Region of China, situated deep within the Ordos Plateau. It is the oldest district of Ordos. The research area of this study is the main urban area of Dongsheng District, covering an area of approximately 79.5 square kilometers. The Baoshen Railway runs north–south through the city, dividing Dongsheng District into two parts: Tiedong, east of the railway, and Tiexi, west of the railway (see Figure 2). The Tiedong area is older and was established earlier, while the urban construction of the Tiexi area is relatively recent (see Figure 3).
As an old district, Dongsheng District has many years of urban development and has accumulated a series of advantages, but it also faces certain challenges. The research team conducted multiple field investigations, had comprehensive interviews and consultations with local government departments and residents, and distributed questionnaires in order to form a basic understanding of the current situation in the study area. In terms of advantages, the first is the formation of a relatively complete urban spatial pattern framework, with a clear development axis, a well-developed road system, and the creation of an attractive core area in the central part of the city. Second, there is a well-established array of urban public service resources, including numerous city-level educational, cultural, and sports facilities. Third, there is a high rate of urbanization with a sufficient population of over 500,000 people (in 2020, the urbanization rate of Dongsheng District was recorded at 95.13%, and the population was the highest in the entire city of Ordos), which can support future development.
Regarding the issues, the first is the problem of “urban villages”. A large proportion of the urban area consists of urban villages where the advantageous resources are distributed, and the local residents have little willingness to relocate, making it difficult to improve or rebuild these areas. Second, there is the problem of idle resources and insufficient development momentum. Due to the overly rapid expansion of the city and the new district attracting a large share of the construction funds, many buildings in the old district are currently in an incomplete state or are idle. Third, there is a lack of public services, such as parking facilities and parks.

3.2. Research Framework

This research followed the strategy of collecting data, constructing an assessment system, and analyzing the results (see Figure 4). First, we collected and processed research data, which involved collecting topographic map data, the third National Spatial Survey data, questionnaire survey data, public service facilities POI, field interviews, land use, and historical maps. Second, based on the characteristics of the research area and related research findings, we constructed an urban renewal potential assessment system, then weighted and analyzed the collected data using ArcGIS (ArcGIS 10.8, Esri, Redlands, CA, USA) to produce the spatial distribution of various renewal potential indicators in the assessment system. Third, we conducted a comparative analysis by juxtaposing the spatial distribution of urban renewal potential derived from the assessment system with the current land use and historical development of the study area to explore potential correlations. Finally, we discuss the output results and propose the spatial distribution of urban renewal potential.

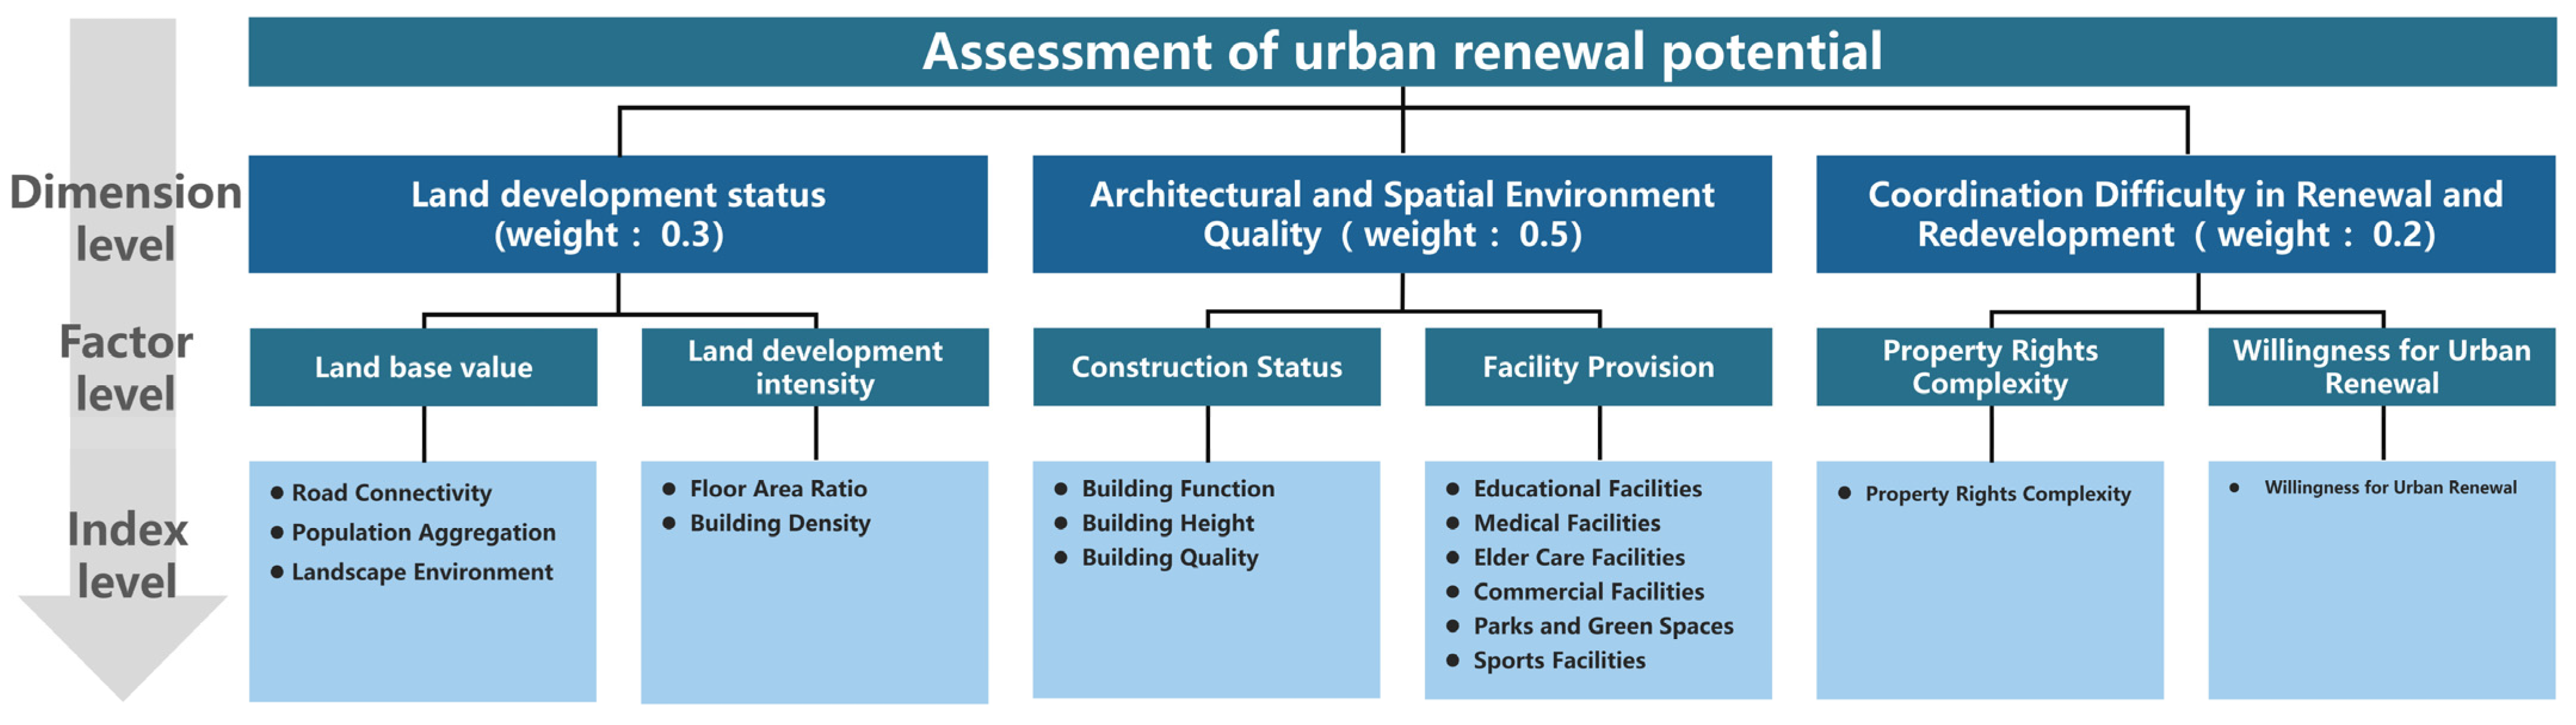
3.3. Urban Renewal Potential Assessment System

In this research, we constructed an assessment system consisting of 3 dimensions, 6 factors, and 16 indicators ranging from macro to micro (refer to Figure 5). At the level of dimensions and factors, referring to the existing urban issues in the built environment, public service, and residents’ lives in the study area, and drawing from other relevant research, key factors contributing to urban renewal potential are primarily concentrated in three aspects: land, building, and resident [43,44]. Based on this, the assessment system of this study was built based on the three dimensions of land development status, architectural and spatial environment quality, and coordination difficulty of renewal and redevelopment, which were further subdivided into six factors: land base value, land development intensity, construction status, facility provision, property rights complexity, and willingness for renewal. In terms of indicator levels, we constructed 16 indicators by synthesizing existing indicators from relevant research, the characteristics of resource-based cities in developing countries, and the characteristics of Dongsheng District. First, drawing from existing indicators in relevant research [45,46,47,48], we propose the following: traffic accessibility, population aggregation, landscape environment, floor area ratio, building density, educational facilities, medical facilities, elder care facilities, commercial facilities, parks and green spaces, sports facilities, and property rights complexity. Second, based on the development characteristics of resource-based cities in developing countries, we propose construction height and building quality. Third, based on the characteristics of Dongsheng District itself, we propose building function and willingness to renew. The overall renewal potential can be obtained by weighted calculations of all indicators.
The weights of Indicators at each level in the assessment system were jointly determined by the research team and experts. First, the research team referred to the weights of indicators in the relevant research to establish the initial weight of each indicator, as follows: land development status, 0.3; architectural and spatial environment quality, 0.4; and coordination difficulty of renewal and redevelopment, 0.3. Subsequently, based on the total weights of dimensions, the specific weights of factors and indicators were determined. The sum of the weights of the 16 indicators was ultimately set to 1. Second, the research team visited local experts in Dongsheng District and, through discussions and consultations with these experts, finally determined the weight of each indicator (the research team received support from the Ordos Natural Resources and Planning Bureau, which is responsible for formulating and implementing urban planning, land use planning, environmental protection planning, and other planning initiatives. Most of its internal staff are local residents of Dongsheng District. The research team selected personnel who were familiar with the local situation and possessed an excellent background in urban planning and urban renewal as experts to discuss the weights of indicators and data collection tasks) (Expert Scoring Method: An expert group publicly selects one expert as the leader, who organizes an open discussion to determine the specific weights of each indicator. The sum of the proportions of the indicators within each factor group is 1. The specific proportion of each indicator is obtained by multiplying its proportion within the group by the corresponding proportion of the higher-level factor group) (see Appendix A).
The data sources and calculation formulas in the assessment system were also subjected to expert consultation and discussion. Each indicator was scored on a five-point scale, with higher scores indicating a greater likelihood of renewal (specific scoring criteria and calculation formulas are provided in Appendix A). In terms of the overall assessment of urban renewal potential, the data were divided into five categories using the Fisher–Jenks Natural Breaks method (the number of categories for results: Based on the principle of minimizing the maximum within-class variance. The data show that when classified into five categories, increasing the number of categories no longer significantly reduces the within-class variance), namely: Low potential block, Medium and low potential block, Medium potential block, Medium-high potential block, and High potential block.

3.4. Comparative Analysis of Urban Renewal Potential Based on Current Land Use and Historical Development

Using the urban renewal assessment system, the research team determined the spatial distribution of each indicator and the overall urban renewal potential. They compared these spatial distributions with the current land use and the historical development of the main urban areas of the study area mentioned in previous sections, analyzing the relationships between various types of urban renewal potential and the spatial distribution of these characteristics.
First, the research team extracted blocks with a score of 5 for each indicator and the high-potential blocks in the overall urban renewal potential. Then, using the intersect function in ArcGIS, these blocks were overlaid with the current land use and historical development of the study area. For current land use, by overlaying blocks, we can directly obtain the composition and proportions of the current land use of the target blocks. For historical development, the research team first assigned scores to the study area in chronological order from low to high (see Figure 3): regions developed before 1985 were assigned a score of 1, regions developed between 1985 and 2006 were assigned a score of 2, regions developed between 2006 and 2010 were assigned a score of 3, and regions developed from 2010 to the present were assigned a score of 4. Then, through block intersects, we calculated the average value of high-potential blocks in terms of historical development. The calculation formula is as follows:
x = a × 1 + b × 2 + c × 3 + d × 4 e ,
where x is the score of high-potential blocks in terms of historical development, and a, b, c, and d represent the area of regions assigned a value of 1, 2, 3, and 4, respectively, and e is the total area of high-potential blocks.

3.5. Data and Materials

The research team conducted field research and collected data in the study area five times from September 2021 to July 2022 (totaling about two months), during which they closely observed and analyzed the built environment and engaged in in-depth discussions with residents and government department workers at various levels. The data sources involved in this research are quite complex, including topographic maps (topographic map refers to a graphic representation of the surface relief, geographical location, and the horizontal projection of shapes. The topographic map includes information such as building outlines, building materials, and building heights required for this research and is produced and maintained by professional surveying organizations organized by local governments throughout China), the third national land space survey (“The Third National Survey of Land Resources” is organized by the Chinese government’s official surveying authorities. It is a survey aimed at comprehensively understanding the types, areas, distribution, and ownership of land nationwide, establishing a land survey database. These data can provide first-hand basic information for land use approval, farmland protection, and adjustments in agricultural industry structure. They are maintained by the natural resources departments of local governments throughout China), points of interest of public service facilities, questionnaire surveys, and on-site interviews and research, with diverse methods of acquisition.
The team applied for the topographic map and third national land space survey data from the Ordos City Natural Resources Bureau. Points of interest in public service facilities were obtained from Baidu Maps, an open public platform, as detailed in the data availability statement.
Questionnaire survey data were obtained by the research team through the distribution of questionnaires and with the support of relevant government departments. The questionnaires were mainly used to collect information about residents’ willingness for urban renewal. The questionnaire design referred to relevant literature on the difficulties and issues encountered by residents when urban renewal actions are spontaneously undertaken, covering aspects such as the economic situation and benefits, the consistency of residents’ attitudes toward urban renewal actions, and the complexity of stakeholders [49,50]. The questionnaire comprised 21 questions (see Appendix B for details). From October 2022 to January 2023, the research team distributed the questionnaire online and collected 341 questionnaires, of which 325 were valid, resulting in a 95.31% effective response rate. The design of the questionnaire was proposed by the team based on the research purpose and was later modified by the Ordos City Natural Resources Bureau based on local characteristics and information collection requirements. The distribution of the questionnaire was strongly supported by the Ordos City Natural Resources Bureau, which promoted its distribution to the public for research through its official government internet account (WeChat (Tencent, Shenzhen, China)).
The research team conducted on-site field surveys and interviews with members of various government departments and organizations to verify the collected data, enhancing the objectivity and timeliness of the data. During their field research, the team walked and cycled across every plot to tally, measure, and quantify the collected data and recorded their findings. Based on the issues encountered, local residents were randomly interviewed, and written records were made. The research team visited the 12 street offices (“Street” is the smallest administrative division in China, with the administrative agency being the Street Office. Dongsheng District in Ordos includes a total of 12 streets) involved in this study to understand the current situation and future development plans. The government departments included the following: Dongsheng District Government, Ordos City Natural Resources Bureau, Dongsheng District Planning Bureau, Dongsheng District Housing Management Bureau, Dongsheng District Planning Center, Dongsheng District Housing and Urban-Rural Development Bureau, Dongsheng District Rebuilt Office, Dongsheng District Culture and Tourism Bureau, Dongsheng District Garden Bureau, Dongsheng District Traffic Police Department, Dongsheng District Education and Sports Bureau, and Dongsheng District Health and Health Committee. The research and interview data were used to verify the other sets of collected data.

4. Results

4.1. Results of Urban Renewal Potential Assessment System

4.1.1. Land Development Status

Land base value
(1) Road Connectivity
The overall road connectivity in the study area is relatively high and shows a decreasing trend from the center to the outskirts (see Figure 6). The central area basically achieves full coverage with a 300 m road buffer zone, while the edges of the study area, especially in the northeast and south, lack sufficient road connectivity.
(2) Population Aggregation
There are significant differences in population aggregation within the study area (see Figure 7). The city center has a higher degree of population aggregation. Most plots in the study area have low potential, with only a small part in the south-central area showing higher potential. The potential is slightly higher in the area west of the railway compared to the area east of the railway.
(3) Landscape Environment
There are significant differences in the potential of the landscape environment (Figure 8). The southern region, through which the river flows, has a higher potential for the landscape environment and extends from the south to the central part; the peripheral areas in the northeast and southwest do not have such potential.
Land development intensity
(1) Floor Area Ratio
The results of this indicator are relatively scattered, with a general trend of increasing from the center outward (see Figure 9). The eastern sector and the western fringe are the main distribution areas for high-potential plots. Larger plots tend to have higher potential.
(2) Building Density
There are significant differences in the potential of building density; the potential generally decreases from the center outward and is higher in the east than in the west (see Figure 10). The central-eastern area of the study area is the main high-potential area.

4.1.2. Architectural and Spatial Environmental Quality

Construction Status
(1) Building Function
The overall building function potential shows a distribution of higher in the east and lower in the west (see Figure 11). With the railway as a boundary, the urban area east of the railway has significantly higher potential than the area to the west.
(2) Building Height
The distribution of building height potential is relatively scattered (see Figure 12). The overall potential shows an increasing trend from the center towards the periphery. Areas with lower potential are mostly scattered in the center and eastern part of the study area.
(3) Building Quality
Building quality potential is higher in the east and lower in the west (see Figure 13). Areas with higher potential are mainly the peripheral regions of the urban area east of the railway.
Facility Provision
(1) Educational Facility Provision
The overall potential for educational facility provision in the study area shows a ring-shaped distribution that is low in the center, high in the middle, and low in the periphery (see Figure 14). Specifically, high-potential plots are mainly distributed in the southeastern and northwestern areas of the ring.
(2) Medical Facilities
There is a trend for this indicator to decrease from the center to the outskirts (see Figure 15). Using the railway as a boundary, there are some high-potential plots both to the west and east of the railway, but the high-potential plots are significantly more numerous in the area east of the railway.
(3) Elder Care Facilities
The potential for elder care facilities has a clear cluster distribution characteristic (Figure 16). High-potential plots have formed two relatively concentrated clusters in the northwest and southeast of the study area.
(4) Commercial Facilities
The commercial facility potential is higher in the east and lower in the west (Figure 17). High-potential plots are mainly distributed in the area east of the railway.
(5) Parks and Green Spaces
The distribution of parks and green spaces is higher in the west and lower in the east (Figure 18). The area west of the railway has generally higher potential, followed by the southern area; the eastern area, especially the northeast, lacks coverage.
(6) Sports Facilities
The potential for sports facilities also has a clear cluster distribution characteristic (Figure 19). High-potential plots have formed two relatively concentrated clusters in the northwest and southeast of the study area.

4.1.3. Coordination Difficulty in Renewal and Redevelopment

Property Rights Complexity
The overall complexity of property rights is higher in the west and lower in the east (Figure 20). To the west of the railway, the area is mainly dominated by easily updatable single-property entities, while the area to the east of the railway is dominated by more complex property entities.
Willingness for Urban Renewal
The willingness for urban renewal within the study area decreases from the center to the boundaries (Figure 21). Several streets where there is a strong willingness for urban renewal are mainly distributed in the central area of the study area, with a particularly strong willingness in the southern central area.

4.1.4. Overall Assessment of Urban Renewal Potential

The overall renewal potential for old urban areas shows a distribution of decreasing from the center to the outskirts, higher in the east, and lower in the west (Figure 22). Medium-high-potential and medium-potential renewal plots are mainly distributed in the central part of the study area, with high-potential renewal plots almost exclusively concentrated in the central area east of the railway. In general, the overall potential for renewal in the study area is relatively high, with a total area of renewable plots of 4553.12 ha. Based on the overall potential scores, plots in the study area can be divided into five groups as follows: (1) high-potential renewal plots with the highest scores cover an area of 434.01 ha, accounting for 9.53% of the total area and are the key plots to start urban renewal in Dongsheng District; (2) medium-high-potential renewal plots cover an area of 813.53 ha, accounting for 17.87% of the total area; (3) medium-potential renewal plots cover an area of 1274.37 ha, accounting for 27.99% of the total area; (4) medium-low-potential renewal plots cover an area of 1127.31 ha, accounting for 24.76% of the total area; and (5) low-potential renewal plots cover an area of 903.9 ha, accounting for 19.85% of the total area.

4.2. Results of Comparative Analysis

4.2.1. Comparative Analysis Based on Current Land Use

By investigating block intersections, the research team obtained the proportions of current land use types and urban villages in high-potential blocks for each indicator (Table 2). The top two categories with the highest proportions of current land use types are relatively consistent, mostly residential and commercial service facilities land. The third-ranking land use types include green spaces, open spaces, public management, and public service land. For overall urban renewal potential, the top three categories are residential land, commercial service facilities land, and public management and public service land. The proportion of urban villages in high-potential blocks for each indicator is not high. In the high-potential blocks for overall urban renewal potential, the proportion of urban villages is 8.69%.

4.2.2. Comparative Analysis Based on Historical Development

By investigating block intersections, the research team obtained scores indicating correlations between various indicators and historical development. The higher the score, the later the construction age of high-potential blocks for the indicator (Table 3). This supported further exploration of the relationship between urban renewal potential and historical development. Based on the standard deviation, we divided the indicators into three groups according to their scores. In the low-score group, the potential of the indicators was found to be negatively correlated with historical development, including overall assessment of urban renewal potential, population aggregation, building density, educational facilities, medical facilities, commercial facilities, and willingness for urban renewal. In the mid-score group, there was no obvious correlation between the potential of the indicators and historical development, including road connectivity, landscape environment, building function, building height, elder care facilities, parks and green spaces, and sports facilities. In the high-score group, the potential of the indicators was found to be positively correlated with historical development, including floor area ratio, building quality, and property rights complexity.

5. Discussion and Strategies

5.1. Potential Spatial Distribution Patterns

5.1.1. Discussion of Indicator-Level Results

The spatial distribution of the majority of indicators shows some correlation with the construction period of the urban areas within the study area. Through further analysis of the results (see Table 3), we found that most indicators were negatively correlated with historical development, mainly population aggregation, building density, willingness for urban renewal, and public service facilities (educational, medical, and commercial facilities), which have relatively rigid demand. Indicators that were less correlated with historical development included road connectivity, landscape environment, building function, building height, and various public service facilities (elder care facilities, parks and green spaces, and sports facilities), which improve quality of life and have more flexible demand. Finally, indicators that were positively correlated with historic development included floor area ratio, building quality, and property rights complexity.
The positive or negative correlation between indicators and historical development may be related to the economic conditions and urban planning theories during different stages of urban development. Through interviews with members of various government departments, we learned that development in the Tiedong area began in 1985. By 2006, the urban area had matured, and by 2010, urban construction was basically completed. This period marked the initial development phase of Dongsheng District, which had relatively low economic levels and building technology, resulting in generally lower building standards. At this point, these legacy buildings can no longer meet residents’ living needs, hence the widespread willingness for urban renewal among residents. Additionally, many urban villages that exist today were formed during this period, which explains the higher population and building density in these areas. Finally, urban construction during this period was primarily focused on meeting the basic living needs of residents, resulting in relatively complete basic public service facilities, including education, medical care, and commerce. From 2010 to the present, the Tiexi area experienced rapid development, with significant achievements in resource-based industries in Ordos. Therefore, the urban areas built during this period received support from China’s economic strength and were guided by contemporary urban planning theories. As a result, urban areas constructed during this phase have more suitable floor area ratios and higher building quality, while unified urban construction under planning also standardized the division of land property rights, increasing the potential for property rights complexity.
Among other indicators weakly correlated with historical development, the natural landscape, as a fixed resource, remained almost unchanged during urban construction. As for the indicators of road connectivity and building height, their unique situations are associated with the development characteristics of the study area. Urban construction in the study area did not progress uniformly. Early construction mostly consisted of small plots and low-rise buildings. During periods of rapid economic development, construction was guided by advanced urban planning theories, which, to some extent, maintained similarities with previous situations. This led to a lower correlation of these indicators with historical development. Regarding public service facility indicators (parks and green spaces, sports facilities, and elder care facilities), China has undertaken extensive community public service facility supplementation actions over the past decade [51]. In this process, the government supplemented communities lacking public service facilities at the building or even floor level. These individual buildings are dispersed among multiple historical development areas, resulting in a lower correlation of these indicators with historical development.

5.1.2. Discussion of the Overall Results

Similar to the spatial distribution of indicator-level results, the overall potential distribution is also somewhat correlated with the construction period of urban areas. This is a result of the combined effect of most of the factors and indicators, with high-potential plots mainly concentrated in older areas on the east side of the railway.
Residential and commercial service blocks are more likely to become high-potential blocks. A further comparison of indicator levels suggests that the primary factors contributing to the high redevelopment potential of these blocks are urban renewal willingness and population aggregation (here, the building function indicators are excluded from the calculation process because they contain information about some current land uses). This is closely related to the characteristics of urban development in the study area, where resource-based city industries tend to be concentrated in suburban mining areas. Initially, urban construction was mainly focused on meeting residents’ basic needs for housing and small-scale retail functions. The subsequent rapid development of industries and the economy expanded new urban areas on this basis. These high-density, low-quality residential and commercial blocks are now among the areas most in need of urban renewal. This explains why these types of blocks have higher potential population density and urban renewal willingness.
Urban villages represent a focal issue within the study area and are commonly considered prime candidates for urban renewal, especially in countries like China, but have not been achieved according to their high potential. A further comparison of factors shows that the low potential willingness to renew and the low population density in these urban village plots are major factors in their not-so-prominent general results, especially in peripheral urban villages. This is closely related to the large-scale construction of new urban areas in Ordos. According to media reports, there is a glut of buildings in Ordos, urban residents often own more than one property in Ordos, and the incentive to improve living conditions by reconstructing urban villages is no longer urgent [52,53]. Moreover, real estate companies, due to market factors, continue to focus on developing new areas, often abandoning urban village renewal projects that involve complex stakeholders and unpredictable outcomes. Urban villages, especially those that are located on the periphery of the old city centers and lack public facilities, are less attractive, leading to a significantly reduced likelihood of their renewal and, consequently, lower expectations among residents.

5.2. Contributions of This Research

This research explored the potential for urban renewal in the old districts of resource-based cities in developing countries. First, we established an assessment system for urban renewal potential in the old areas of resource-based cities in developing countries. Second, we present the spatial distribution regularity of urban renewal potential in such areas through comparative analysis.
The research findings can provide a reference for future academic studies. Currently, the assessment system constructed in this study integrates the characteristics of the research area, showing innovation and relevance. It can serve as a reference for future research in terms of assessment indicators and methods. The spatial distribution reveals a correlation between urban renewal potential in such areas and specific factors related to current land use and historical development, providing direct support for related studies. In the long run, this research provides a relatively innovative perspective for future research. Unlike related studies that concentrate on industrial transformation, sustainable development, or the ecological environment in resource-based cities of developing countries, this research adopts an urban planning and design perspective and assesses the potential for urban renewal from a spatial distribution angle. This can provide insights for relevant research on urban renewal.
Furthermore, the research findings have certain practical guiding significance for urban renewal in resource-based cities. On the one hand, by comprehensively comparing single-factor evaluation results and overall results, specific suggestions for improvement can be effectively proposed. Increasing facilities such as parks and parking lots in old urban areas generally involve two problems. The first challenge is where to build, and the second Is the issue of identifying old areas that can be demolished to make space for construction. Taking parks as an example, the distribution characteristics of parks can be clearly seen through the single-factor analysis of parks and green spaces, and new parks should be located in plots with the highest renewal potential. Combining the evaluation of renewal potential with renewal methods, it is possible to find plots where it is likely that the old buildings will be changed and the land will be reused in the near future. The related planning scheme, completed based on this research, has been highly recognized by relevant personnel and experts. The planning results have been approved by the government of Ordos City and reported as a typical case by China’s Ministry of Natural Resources (https://mp.weixin.qq.com/s/PlNU8gAtHaCJhG5Ai6Litg (accessed on 31 October 2023)).

5.3. Limitations and Future Research Suggestions

Aside from its contributions, this research has certain limitations. The research focused on the main urban area of Dongsheng District in Ordos, covering an area of 79.5 square kilometers, which is a relatively macro scale, and the results and laws formed mostly reflect macro-level distribution trends and land type associations. At specific spatial scales, such as streets, communities, and even inside plots, there are different types of issues worth exploring and more specific solutions to be found. For example, including more detailed indices, such as historical and cultural value, specific environmental pollutants, and legal and policy factors, could enable a more comprehensive analysis.
Meanwhile, due to constraints on the availability of dynamic data, the index values were determined based on static data, which might not fully reflect the real-world situation. Future studies could also consider including dynamic data, such as changing real estate prices, resident income levels, and other economic factors that could influence the potential for urban renewal.
In terms of property rights, this research was mainly based on an analysis of cities under China’s public land ownership system. The renewal scenario under the private land ownership system will require further research. For example, public land ownership makes it relatively easy for the government to coordinate the renewal of various types of land, especially when it involves the renewal of state-owned property rights. The generalizability of the findings to other resource-based cities in developing countries could be improved by conducting comparative studies across multiple cities with similar characteristics.
Regarding the data sources, the data in this research came from "human"-sourced data channels, including questionnaires and interviews. For the purpose of the research, a macro spatial classification of residents based on their place of residence was conducted. However, there are more specific characteristics of these residents that could be further classified, such as age, income, gender, opinions, etc. Such detailed analyses could be further refined in subsequent research.

6. Conclusions

This research specifically addresses the issue of the decline of old districts in resource-based cities during urban development. Through comprehensive research, a renewal assessment system encompassing 3 dimensions, 6 categories of factors, and 16 indicators was designed. This system was aimed at unearthing the renewal potential characteristics of such old districts to produce evaluation results that align with local reality and formulate effective strategies to support future renewal efforts in Dongsheng District.
The assessment system was used to fully consider the unique characteristics of the research object. Dongsheng District, a typical old district in a resource-based city, faces not only the general problems prevalent in old districts, such as the interweaving of low-quality bungalow areas and newly constructed areas and insufficient public green spaces but also particular issues inherent to resource-based cities, such as the mismatch between over-advanced planning and urban industrial momentum. This also leads to old urban areas with excess commercial land, plenty of public facility land, and little industrial land. In addition, the high vehicle ownership as a result of higher per capita income puts pressure on static traffic. Designing the assessment system was a prerequisite for determining the renewal plans for the research object. Therefore, in the design of the assessment system, it was necessary to fully explore the reasons behind various problems in an effort to truly reflect the renewal potential characteristics of Dongsheng District.
Since the assessment was based on multi-source data (including official data, field survey and visitation data, internet big data, and decentralized data from citizen interviews), it not only reflects the development foundation of different areas but also integrates the actual demands of citizens and the planning intentions of the government. As a result, the assessment results can effectively help governments in decision-making and better planning. The overall renewal planning and zoning of Dongsheng District are based on the assessment results. The outcomes of this research have been highly recognized by citizens, local government agencies, and the country’s land use management department, the Ministry of Natural Resources of China. In the subsequent process of compiling detailed regulatory planning, characteristics of different zones were extracted based on the results of single-factor assessment, and zoning renewal strategies were proposed through planning and design methods. They have been embodied in specific control requirements in the form of renewal regulations and endowed with legal status and binding force.
For most old districts in resource-based cities of developing countries, it is time to systematically plan for renewal. Conducting renewal potential analysis and formulating a plan is just the beginning; the specific action plans and policies that follow are even more crucial. Especially for regions that lack high-end talent and intellectual resources, it is necessary to break down the outcomes of renewal potential evaluations and planning into specific action programs and guidelines and allow relevant personnel to clarify their tasks and initiate necessary project demonstrations to better implement renewal in such areas.

Author Contributions

Conceptualization, methodology Y.L; formal analysis and visualization, X.C., W.C. and Q.W.; investigation and resources, Y.L. and J.W.; original draft preparation, X.C. and H.L.; writing—review and editing, Y.L.; funding acquisition, H.L. All authors have read and agreed to the published version of the manuscript.

Funding

This research was funded by the Macau University of Science and Technology Faculty Research Grant (General Research Grants, GRFs), grant number FRG-23-002-FA.

Data Availability Statement

Public service facilities’ points of interest data are publicly available on the Baidu Map Open Platform at https://lbsyun.baidu.com/ (this article was accessed on 19 October 2023). Questionnaire survey data, on-site survey and interview data can be obtained by contacting the corresponding author of this article.

Conflicts of Interest

Author Yifan Li was employed by the company Peking University Planning and Design Institute (Beijing) Co., Ltd. Authors Xushen Chen, Junzhe Wan, Wei Cui and Qianqian Wang were employed by the company Beijing Tsinghua Tongheng Urban Planning & Design Institute. The remaining authors declare that the research was conducted in the absence of any commercial or financial relationships that could be construed as a potential conflict of interest.

Appendix A

The weight proportions of the assessment system and the formulas of indicators are described as follows:
Table A1. Assessment system and weight distribution of urban renewal potential.
Dimension LevelFactor LevelIndicator Level
Dimension WeightFactor WeightIndicatorAssessment CriteriaScore DivisionIndicator Weight
Land usedevelopment status0.3Land base value0.1Road ConnectivityBuffer score2.0–3.050.04
1.0–2.03
0.0–1.01
Population Aggregationpopulation/ha130–19050.03
90–1304
50–903
30–502
0–301
Landscape EnvironmentBuffer score2.0–3.050.03
1.0–2.03
0.0–1.01
land development intensity0.2Floor Area Ratio Floor Area Ratio0.0–1.050.12
1.0–2.04
2.0–3.53
3.5–52
>5.01
Building Density Building Density0.4–0.650.08
0.6–0.84
0.8–1.03
0.2–0.42
0.0–0.21
Architectural and Spatial Environment0.5Construction Status Potential0.15Building Function Building FunctionFirst grade50.045
Second order3
Third estate1
Building Height Maximum number of building floors0.0–5.050.06
5.0–10.04
10.0–15.03
15.0–20.02
20.0–25.01
Building Quality Average value of building quality0.0–0.650.045
0.6–1.24
1.2–1.83
1.8–2.42
2.4–3.01
Facility Provision Potential0.35Educational Facilities Provision Buffer score4.0–5.050.105
3.0–4.04
2.0–3.03
1.0–2.02
0.0–1.01
Medical Facilities Buffer score2.0–3.050.07
1.0–2.03
0.0–1.01
Elderly Care Facilities Buffer score2.0–3.050.0525
1.0–2.03
0.0–1.01
Commercial Facilities Buffer score2.0–3.050.0525
1.0–2.03
0.0–1.01
Park and Green Space Buffer score2.0–3.050.035
1.0–2.03
0.0–1.01
Sports Facilities Buffer score2.0–3.050.035
1.0–2.03
0.0–1.01
Coordination Difficulty in Renewal and0.2Property Rights Complexity Potential0.1Property Rights Complexity Property Rightssingle ownership50.1
two major kinds of ownership3
multiple ownerships1
Willingness to Urban Renewal Potential0.1Willingness to Urban renewal Willingness to Urban renewal4.0–5.050.1
3.0–4.04
2.0–3.03
1.0–2.02
0.0–1.01
Summation1 1 1
1 The buffer zone indicator corresponding to various public service facilities is referred to as the [Urban Residential Area Planning and Design Standard (GB50180-93) [54].
The research on the potential for urban renewal is assessed on current urbanized plots whose usages and boundaries are identified by the Third Land and Space Survey data. The sources of data related to the 16 specific potential indicators for renewal and their calculations are as follows:
  • Road Connectivity
The data are sourced from the Third National Land and Space Survey. The land use categories “Rural Roads,” “Urban Village Roads”, and “Highway Lands” are extracted, and multi-ring buffers at distances of 100 m, 200 m, and 300 m are generated. The calculation formula is as follows (A1):
x = a × 3 + b × 2 + c × 1 d ,
where x is Road Connectivity, a is the area within a 100m buffer, b is the area within a 100–200 m buffer, c is the area within a 200–300 m buffer, and d is the land plot area.
Based on the calculation, the road connectivity of each land plot ranges from 0–3. Further classification and scoring are conducted, with plots in the range of 0–1 scoring 1, those in the range of 1–2 scoring 3, and those in the range of 2–3 scoring 5.
  • Population Agglomeration
The data are based on the residential population of 12 streets in Dongsheng (in China, the minimum administrative unit in an urban area is a “Street”, which has independent economic and social development requirements and statistics. Dongsheng District is divided into 12 Streets), using the administrative boundaries of the street as the spatial range for calculation. The formula for calculating the population agglomeration of each street is (A2):
x = a b ,
where x is population Agglomeration, a is the resident population in the street, and b is the street area.
The original calculated population agglomeration degree ranges from 0–190 people/ha. Further classification and scoring are conducted, with streets in the range of 0–30 scoring 1, 30–50 scoring 2, 50–90 scoring 3, 90–130 scoring 4, and 130–190 scoring 5.
  • Landscape Environment
The data are sourced from the Third National Land and Space Survey. Water systems within the study area are extracted, and multi-ring buffers at distances of 300m and 500m are generated. The calculation formula is as follows (A3):
x = a × 3 + b × 2 c ,
where x is the landscape Environment, a is the area within a 300 m buffer, b is the area within a 300–500 m buffer, and c is the land plot area.
The original landscape environment scores of each land plot range from 0–3. Further classification and scoring are conducted, with plots in the range of 0–1 scoring 1, those in the range of 1–2 scoring 2, and those in the range of 2–3 scoring 5.
  • Floor Area Ratio
The data are sourced from topographic map data. The number of building floors from the topographic map data is extracted, and the formula is as follows (A4):
x = a × b c ,
where x is the Floor Area Ratio, a is the building footprint area, b is the number of floors, and c is the land plot area.
After calculation, the plot ratio of each land plot ranges from 0–6.5. Further scoring is conducted, with plots having a plot ratio greater than 5 scoring 1, those with 3.5–5 scoring 2, those with 2–3.5 scoring 3, those with 1–2 scoring 4, and those with a plot ratio less than or equal to 1 scoring 5.
  • Building Density
The data are sourced from topographic map data. The calculation formula is as follows (A5):
x = a b ,
where x is the building density, a is the building footprint area, and b is the land plot area.
Based on the calculation, the building density of each land plot ranges from 0–1. Further classification and scoring are conducted, with plots with a building density of 0–0.2 scoring 1, those with 0.2–0.4 scoring 2, those with 0.8–1 scoring 3, those with 0.6–0.8 scoring 4, and those with 0.4–0.6 scoring 5.
  • Building Function
The data are sourced from the Third National Land and Space Survey. Current land use is divided into three grades: the first grade is residential and industrial land, scoring 5; the second grade is commercial and unused land, scoring 3; and the third grade is other types of land, scoring 1.
  • Building Height
Data for building height were obtained from topographic map data. The data on the number of stories of buildings within the map were extracted, and the highest number of stories within each plot was used as the score for that plot. According to the statistics, the range of stories within buildings in the study area is 0–25. The results were further assigned as follows: buildings with more than 20 stories scored 1, 15–20 stories scored 2, 10–15 stories scored 3, 5–10 stories scored 4, and 0–5 stories scored 5. The highest building within each plot was taken as the score for the building height of that plot.
  • Building Quality
Building quality data were sourced from topographic maps. Information on building materials was extracted and categorized into four grades for every building: “poor”, “below average”, “average”, and “good”. The materials corresponding to “poor” included earth, dilapidated, and simple structures, scoring 0; “below average” included brick, iron, steel, and wood, scoring 1; “average” included concrete, scoring 2; and “good” included reinforced concrete or artistic structures, scoring 3.
The average score of building quality within each plot was used as the score for that plot. After calculation, the scores for each plot ranged from 0 to 3. Further classification and assignment of these results were made as follows: plots with building quality between 0–0.6 scored 1, 0.6–1.2 scored 2, 1.2–1.8 scored 3, 1.8–2.4 scored 4, and 2.4–3.0 scored 5.
  • Educational Facilities
The data source for educational facilities is the point of interest (POI) data for public service facilities. A 1000 m buffer zone is generated around secondary schools, a 500m buffer zone around primary schools, and a 300m buffer zone around kindergartens. The schools within the study area are categorized by their educational quality (the classification of educational levels is as follows: middle schools that have received provincial-level honors or higher are classified as high-quality middle schools, while others are classified as general middle schools; primary schools that have received provincial-level honors or higher are classified as high-quality primary schools, while others are classified as general primary schools), and the following formula is applied (A6):
x = 0.45 × 5 × a + 3 × b + 0.35 × 5 × c + 3 × d + 0.25 × 5 × e f ,
where x is the Educational Facilities, a is area of premium secondary school 1000 m buffer zone, b is area of general secondary school 1000 m buffer zone, c is area of premium primary school 500 m buffer zone, d is area of general primary school 500 m buffer zone, e is area of kindergarten 300 m buffer zone, f is land plot area.
After calculation, the educational facility scores for each plot ranged from 0 to 5. These results were further classified and assigned as follows: plots with scores of 0–1 scored 1, 1–2 scored 2, 2–3 scored 3, 3–4 scored 4, and 4–5 scored 5.
  • Medical Facilities
Medical facility data were obtained from POI data for public service facilities. Medical facilities are classified into community hospitals and city or district hospitals (the classification of medical facilities is as follows: hospitals with more than 500 beds are classified as city-level or district-level hospitals; other medical facilities with medical qualifications are classified as community hospitals). Multi-ring buffer zones with distances of 500 m and 1000 m are generated based on the location of community hospitals, while a 1000 m buffer zone is created for city and district hospitals. The formula used is as follows (A7):
x = 0.4 × 3 × a + 1 × b + 0.6 × 3 × c d ,
where x is the Medical Facilities, a is the area within the 500 m buffer zone of the community hospital, b is the area within the 500–1000 m buffer zone of the community hospital, c is the area within the 1000 m buffer zone of city or district hospital, d is the land plot area.
The medical facility scores for each plot ranged from 0 to 3 after calculation. Further classification and assignment of these results were as follows: plots with scores of 0–1 scored 1, 1–2 scored 3, and 2–3 scored 5.
  • Elderly Care Facilities
The data source for elderly care facilities is the POI data for public service facilities. Multi-ring buffer zones with distances of 500 m and 1000 m are generated around elderly care centers, and the calculation formula was as follows (A8):
x = 3 × a + 1 × b c ,
where x is the elderly care facilities, a is the area within a 500 m buffer zone of the elderly care facility, b is the area within a 500–1000 m buffer zone of the elderly care facility, and c is the land plot area.
After calculation, the elderly care facility scores for each plot ranged from 0 to 3. These results were further classified and assigned as follows: plots with scores of 0–1 scored 1, 1–2 scored 3, and 2–3 scored 5.
  • Commercial Facilities
Commercial facility data were obtained from the POI data for public service facilities. Multi-ring buffer zones with distances of 500 m and 1000 m are generated around commercial facilities, and the calculation formula is as follows (A9):
x = 5 × a + 3 × b c ,
where x is the Commercial Facilities, a is the area within the 500 m buffer zone of the commercial facility, b is the area within the 500–1000 m buffer zone of the commercial facility, and c is the land plot area.
After calculation, the commercial facility scores for each plot ranged from 0 to 3. Further classification and assignment of these results were as follows: plots with scores of 0–1 scored 1, 1–2 scored 3, and 2–3 scored 5.
  • Parks and Green Spaces
The data source for parks and green spaces came from the Third National Land and Space Survey. The current land use data are extracted for parks and protective green spaces, and buffer zones of 300 m and 500 m are generated, respectively. The calculation formula is as follows (A10):
x = 5 × a + 3 × b c ,
where x is the parks and green spaces, a is the area of parks and green spaces within a 300 m buffer zone, b is the area of parks and green spaces within a 300–500 m buffer zone, and c is the land plot area.
After calculation, the score range for each plot’s parks and green spaces is 0–3. Further classification and assignment of these results are made as follows: plots with scores between 0–1 are scored 1, plots with scores between 1–2 are scored 3, and plots with scores between 2–3 are scored 5.
  • Sports Facilities
The data source for sports facilities comes from point of interest (POI) data for public service facilities. Multi-ring buffer zones with distances of 1000 m and 1500 m are generated around sports facilities. The calculation formula is as follows (A11):
x = 3 × a + 1 × b c
where x is the Sports Facilities, a is the area of sports facilities within a 1000 m buffer zone, b is the area of sports facilities within a 1000–1500 m buffer zone, and c is the land plot area.
After calculation, the score range for each plot’s sports facilities is 0–3. Further classification and assignment of these results are made as follows: plots with scores between 0–1 are scored 1, plots with scores between 1–2 are scored 3, and plots with scores between 2–3 are scored 5.
  • Ownership Complexity
The data source for ownership complexity comes from the Third National Land and Space Survey data, using the current land use plot boundaries as the spatial calculation range. The current plots are classified into three types according to ownership complexity:
Plots that included both residential and commercial land ownerships along with other land types are considered multiple ownerships and are scored 1, plots with two major kinds of ownerships (urban residential land ownership, commercial ownership, or rural resident ownership) are scored 3, and plots with single ownership are scored 5.
  • Willingness to Urban renewal
The data source for the willingness to renew comes from questionnaire survey data, using the administrative boundaries of streets as the spatial calculation range. The average willingness to renew each street is used as the plot score. According to the survey, plots of “unwilling” are scored 1, “fairly average” are scored 2, “average” are scored 3, “willing” are scored 4, and “very willing” are scored 5.
  • Overall Assessment of Urban Renewal Potential
Based on the calculation results of the above indicators and the weights corresponding to each indicator (Table A1), the weighted sum of 16 potential indicators is carried out to obtain the overall score of urban renewal potential of each plot.

Appendix B

The questionnaire questions and answers are as follows:
Table A2. Questions included in the questionnaire (Part 1).
Serial NumberDescriptionAssessment ScaleDescriptive Statistics
NumberScale (%)
1What is your domicile?A. Dongsheng District19359.38%
B. Surrounding towns in Dongsheng District195.85%
C. Flags of other districts outside Dongsheng District, Ordos City6018.46%
D. Other cities5316.31%
This topic is valid to fill in the number of people325100.00%
2What is your residential address?A. Dongsheng District31095.38%
B. Surrounding towns in Dongsheng District72.15%
C. Flags of other districts outside Dongsheng District, Ordos City82.46%
D. Other cities00.00%
This topic is valid to fill in the number of people325100.00%
3How long have you lived (worked) in Dongsheng?A. Within six months51.54%
B. Six months to one year30.92%
C. 1 to 3 years123.69%
D. 3 years to 3 years134.00%
E. More than 5 years29289.85%
This topic is valid to fill in the number of people325100.00%
4What is your monthly income?A. Less than 500013340.92%
B. 5000–800012538.46%
C. 8000–12,0004112.62%
D. 12,000–15,00082.46%
E. More than 15,000185.54%
This topic is valid to fill in the number of people325100.00%
5What is your occupation?A. Public officials (employees of state-owned enterprises and institutions)11334.77%
B. Employees of private and foreign companies6620.31%
C. Self-employed households268.00%
D. Freelance work3611.08%
E. Students51.54%
F. Agricultural personnel61.85%
G. Retirees113.38%
I. Other6219.08%
This topic is valid to fill in the number of people325100.00%
6Where do you work/study?A. Suburbs near Ring Road, Dongsheng District5416.62%
B. Industrial plant area in Dongsheng City144.31%
C. Old business districts/old office buildings in or around Dongsheng City (built before 2005)5115.69%
D. Newly built commercial office buildings in or around Dongsheng City in recent years (built after 2005)10231.38%
E. Kangbashi New District257.69%
F. Other7924.31%
This topic is valid to fill in the number of people325100.00%
7Which of the following houses do you live in?A. New residential area (after 2005)23472.00%
B. Old residential areas (before 2005)7021.54%
C. Urban villages92.77%
D. Village on the edge of town123.69%
This topic is valid to fill in the number of people325100.00%
8What type of house do you live in?A. Purchase commercial housing24876.31%
B. Rent206.15%
C. Staff quarters82.46%
D. Individual house building103.08%
E. Has purchased the unit public housing51.54%
F. Housing placement216.46%
G. Affordable housing20.62%
H. Other113.38%
This topic is valid to fill in the number of people325100.00%
9What do you think of the living environment in Dongsheng District?A. Very satisfied4513.85%
B. Satisfied15648.00%
C. General9930.46%
D. Not satisfied175.23%
E. Very dissatisfied82.46%
This topic is valid to fill in the number of people325100.00%
10Do you think the urban space of Dongsheng Old Town has characteristicsA. Distinctive. If so, which area do you think best represents the urban character of the Old City is _______________6118.77%
B. In general19560.00%
C. No features6921.23%
This topic is valid to fill in the number of people325100.00%
11If the Dongsheng District is updated, which of the following categories do you think should be updated first?A. Shanty towns17553.85%
B. Old residential area17955.08%
C. Old factory, factory building4413.54%
D. Old business district7523.08%
E. Park green space11234.46%
F. Streets with poor features15848.62%
G. Other247.38%
This topic is valid to fill in the number of people325100.00%
12Which renewal method do you prefer for the old factories and factories in the city?A. Continue to maintain production and improve the environment5416.62%
B. After relocation, the factory buildings will be completely demolished and converted to other uses16550.77%
C. After relocation, the factory building will be retained as an urban memory and converted to other purposes after renovation10632.62%
This topic is valid to fill in the number of people325100.00%
13What kind of renewal do you prefer for old business districts in urban areas?A. The building is too old and does not conform to commercial fashion trends, and needs to be completely rebuilt8726.77%
B. The building quality is reasonable, but the lack of design sense, daily use is not convenient, do local reconstruction and upgrading can be done13340.92%
C. The business of Dongsheng District is sufficient, and it should be demolished and rebuilt into other service facilities such as green park10532.31%
This topic is valid to fill in the number of people325100.00%
14What do you think is the most important aspect of park green space that needs to be updated?A. The exercise area is small16751.38%
B. Inadequate sports and exercise facilities16350.15%
C. Leisure facilities such as pavilions and seats are insufficient11535.38%
D. Not enough green vegetation10030.77%
E. Low distribution density, too far away from the working and living places14043.08%
F. The need to strengthen ties with the bustling business district9328.62%
G. Need to enhance the cultural connotation of park green space15246.77%
This topic is valid to fill in the number of people325100.00%
15In terms of streetscape, what do you think needs to be improved?A. Urban landscape lighting10632.62%
B. Street greening15046.15%
C. Building exterior wall decoration10331.69%
D. City billboards4814.77%
E. Wall/fence style7422.77%
F. Road View slow walking trail18958.15%
G. River landscape13541.54%
H. Street building facade10131.08%
This topic is valid to fill in the number of people325100.00%
16What area do you live in?A. Traffic streets154.62%
B. Park Street195.85%
C. Build streets185.54%
D. Tree-lined streets175.23%
E. Tianjiao Street164.92%
F. Revival Street123.69%
G. Textile streets8626.46%
H. Bayimenke Street3510.77%
I. Joerun Street123.69%
J. Ethnic Street134.00%
K. Happy Street6820.92%
L. Xingsheng Street144.31%
This topic is valid to fill in the number of people325100.00%
17What do you think are the advantages of where you live?A. Geographical location convenient travel, convenient public transportation16751.38%
B. Convenient parking with ample parking space11635.69%
C. Mature public service facilities (such as education, culture, medical care, elderly care) and municipal facilities6419.69%
D. Low residential density, clean and orderly living environment, high quality8526.15%
E. Strong cultural atmosphere and rich cultural activities237.08%
F. Favorable support of policies (hukou policy, talent policy, housing policy, etc.)247.38%
G. Adequate employment and good economic vitality175.23%
H. Suitable land price, rent, low cost of living10532.31%
This topic is valid to fill in the number of people325100.00%
18What kind of results do you expect from urban renewal?A. Improve residents’ living conditions and increase urban employment18857.85%
B. Control urban traffic congestion11134.15%
C. Provide better public transport7824.00%
D. Improve education, medical care, culture, elderly care and other service facilities21064.62%
E. Improving the service level of commercial service facilities7523.08%
F. Increase the area and accessibility of urban parks and green Spaces9529.23%
G. Strengthen the protection of urban cultural space and urban features7021.54%
H. Dredge the population of the old city and reduce the population density5216.00%
I. Improve the quality of the urban environment, improve and restore the natural landscape environment11635.69%
J. Other103.08%
This topic is valid to fill in the number of people325100.00%
Table A3. Questions included in the questionnaire (Part 2) (Your satisfaction with the current urban life in Dongsheng: (Please rate the urban renewal and other related issues in your city on a scale of 1–5. 5 points are perfect)).
Topic\Option12345Average Score
A. Economic and industrial development in the old city43 (13.23%)33 (10.15%)107 (32.92%)90 (27.69%)52 (16%)3.23
B. Urban road traffic smooth degree30 (9.23%)39 (12%)91 (28%)96 (29.54%)69 (21.23%)3.42
C. Urban public transportation convenience16 (4.92%)36 (11.08%)74 (22.77%)103 (31.69%)96 (29.54%)3.7
D. Convenience of daily shopping14 (4.31%)24 (7.38%)72 (22.15%)96 (29.54%)119 (36.62%)3.87
E. Convenience of nearby enrollment for compulsory education27 (8.31%)33 (10.15%)63 (19.38%)116 (35.69%)86 (26.46%)3.62
F. Ease of access to the medical services needed nearby26 (8%)59 (18.15%)94 (28.92%)97 (29.85%)49 (15.08%)3.26
G. Convenience of using social welfare facilities such as elderly care52 (16%)51 (15.69%)104 (32%)77 (23.69%)41 (12.62%)3.01
H. Convenient use of cultural facilities and recreational facilities55 (16.92%)54 (16.62%)104 (32%)69 (21.23%)43 (13.23%)2.97
I. Ease of use of sports facilities64 (19.69%)72 (22.15%)89 (27.38%)59 (18.15%)41 (12.62%)2.82
J. The convenience of using the park green space plaza43 (13.23%)50 (15.38%)73 (22.46%)86 (26.46%)73 (22.46%)3.3
K. Ease of use of water, electricity, gas and other infrastructure24 (7.38%)32 (9.85%)63 (19.38%)95 (29.23%)111 (34.15%)3.73
L. Overall sense of security in residential life17 (5.23%)15 (4.62%)37 (11.38%)93 (28.62%)163 (50.15%)4.14
M. Air, water, soil, and other urban environments17 (5.23%)26 (8%)71 (21.85%)117 (36%)94 (28.92%)3.75
N. City appearance and cleanliness14 (4.31%)18 (5.54%)65 (20%)111 (34.15%)117 (36%)3.92
subtotal442 (9.71%)542 (11.91%)1107 (24.33%)1305 (28.68%)1154 (25.36%)3.48

References

  1. Yu, J.; Li, J.; Zhang, W. Identification and classification of resource-based cities in China. J. Geogr. Sci. 2019, 29, 1300–1314. [Google Scholar] [CrossRef]
  2. Wang, R.; Wang, C.; Zhang, S.; Ding, X. A study on the spatial and temporal evolution of urban shrinkage and its influencing factors from a multidimensional perspective: A case study of resource-based cities in China. PLoS ONE 2021, 16, e258524. [Google Scholar] [CrossRef]
  3. Huang, Y.; Fang, Y.; Gu, G.; Liu, J. The evolution and differentiation of economic convergence of resource-based cities in Northeast China. Chin. Geogr. Sci. 2018, 28, 495–504. [Google Scholar] [CrossRef]
  4. Xue, M.; Zhang, X.; Sun, X.; Sun, T.; Yang, Y. Expansion and Evolution of a Typical Resource-Based Mining City in Transition Using the Google Earth Engine: A Case Study of Datong, China. Remote Sens. 2021, 13, 4045. [Google Scholar] [CrossRef]
  5. Ye, X.; Dong, L.; Lv, L.; Shang, Y. Spatiotemporal evolution law and driving force of mining city patterns. Environ. Sci. Pollut. Res. 2022, 29, 10291–10307. [Google Scholar] [CrossRef] [PubMed]
  6. Tao, Y.; Wang, Q. Quantitative Recognition and Characteristic Analysis of Production-Living-Ecological Space Evolution for Five Resource-Based Cities: Zululand, Xuzhou, Lota, Surf Coast and Ruhr. Remote Sens. 2021, 13, 1563. [Google Scholar] [CrossRef]
  7. Available online: https://investaberdeen.co.uk/key-sectors (accessed on 5 February 2024).
  8. Thriving Pittsburgh Industries. Available online: https://pittsburghregion.org/key-industries/ (accessed on 5 February 2024).
  9. Available online: https://www.calgaryeconomicdevelopment.com/sectors/ (accessed on 5 February 2024).
  10. Available online: https://www.houstontx.gov/abouthouston/business.html (accessed on 5 February 2024).
  11. The Official Site of the Prime Minister of the Russian Federation. Available online: http://archive.premier.gov.ru/eng/visits/ru/6041/region/print/ (accessed on 6 February 2024).
  12. Economy of Baku. Available online: https://en.wikipedia.org/wiki/Economy_of_Baku#Light_industry (accessed on 6 February 2024).
  13. Statistical Bulletin of Daqing City’s National Economic and Social Development in 2022. Available online: https://www.saertu.gov.cn/saertu/zfxxgk351/202311/c05_321431.shtml (accessed on 28 August 2024).
  14. Chiatura Mining Town. Available online: https://www.ovpm.org/city/chiatura-georgia/ (accessed on 6 February 2024).
  15. Behind the Difference in Housing Prices between the New and Old Urban Areas of Hebi: The Permanent Population in the Old Urban Area Stopped Flowing out and Showed a Reflux Trend. Available online: https://baijiahao.baidu.com/s?id=1766224026813835558&wfr=spider&for=pc (accessed on 6 February 2024).
  16. China’s Former First Oil City, Oil Exploitation into an Empty City, from the City to the Town, the House Price Is Less than 1000 yuan. Available online: https://cul.sohu.com/a/725572721_121165105 (accessed on 6 February 2024).
  17. District Situation Overview. Available online: http://www.kbs.gov.cn/zjkbs/qqgk/ (accessed on 19 October 2023).
  18. Abandoned Architectural Marvels in China’s Largest Ghost Town. Available online: https://edition.cnn.com/style/article/china-ordos-ghost-town/index.html (accessed on 19 October 2023).
  19. Ordos “Ghost City” under the Phantom Double Crisis. Available online: https://www.bjnews.com.cn/feature/2013/08/31/281143.html (accessed on 19 October 2023).
  20. Ordos Is Full of Empty Buildings Citizens: Will Not Buy Again. Available online: http://politics.people.com.cn/n/2014/1128/c70731-26113626.html (accessed on 19 October 2023).
  21. “Warm City Fanghua” Series Report Three-Ordos City: Accelerate Urban Renewal and Improve Urban Quality. Available online: https://www.ordos.gov.cn/xw_127672/jreeds/202309/t20230904_3481948.html (accessed on 24 October 2023).
  22. Response of the Ordos City Dongsheng District Comprehensive Urban Management and Administrative Law Enforcement Bureau to Proposal No. 35 at the First Session of the Tenth People’s Congress of Dongsheng District. Available online: https://www.ds.gov.cn/gk/fdzdgknr/jytabl/rdjy/202211/t20221129_3310028.html (accessed on 25 June 2024).
  23. Analysis of the October 2023 Labor Force Survey Data in Dongsheng District. Available online: https://www.ds.gov.cn/gk/fdzdgknr/tjxx/tjfx/202311/t20231109_3523942.html (accessed on 25 June 2024).
  24. Ding, F.; Wu, J. The evolution of relevant concepts of urban renewal and its current practical significance. Urban Plan. Forum 2017, 1, 87–95. [Google Scholar] [CrossRef]
  25. Couch, C.; Sykes, O.; Börstinghaus, W. Thirty years of urban regeneration in Britain, Germany and France: The importance of context and path dependency. Prog. Plan. 2011, 75, 1–52. [Google Scholar] [CrossRef]
  26. Tallon, A. Urban Regeneration in the UK, 3rd ed.; Routledge: London, UK, 2020; ISBN 9781351030304. [Google Scholar]
  27. Karadimitriou, N.; de Magalhães, C.; Verhage, R. Planning, Risk and Property Development: Urban Regeneration in England, France and The Netherlands; Routledge: London, UK, 2013; ISBN 978-0415481106. [Google Scholar]
  28. Wu, Y.; Galdini, R.; Hui, E.C.M.; Long, H. Urban regeneration and re-use: China and Europe. Cities 2020, 106, 102863. [Google Scholar] [CrossRef]
  29. Della Torre, S.; Cattaneo, S.; Lenzi, C.; Zanelli, A. Regeneration of the Built Environment from a Circular Economy Perspective; Springer Nature: Berlin/Heidelberg, Germany, 2020; pp. 1–13. ISBN 978-3-030-33256-3. [Google Scholar]
  30. Liu, E.; Wang, Y.; Chen, W.; Chen, W.; Ning, S. Evaluating the transformation of China’s resource-based cities: An integrated sequential weight and TOPSIS approach. Socio-Econ. Plan. Sci. 2021, 77, 101022. [Google Scholar] [CrossRef]
  31. Zhang, M.; Tan, F.; Lu, Z. Resource-based cities (RBC): A road to sustainability. Int. J. Sustain. Dev. World Ecol. 2014, 21, 465–470. [Google Scholar] [CrossRef]
  32. Tan, J.; Zhang, P.; Lo, K.; Li, J.; Liu, S. The Urban Transition Performance of Resource-Based Cities in Northeast China. Sustainability 2016, 8, 1022. [Google Scholar] [CrossRef]
  33. Yu, C.; de Jong, M.; Cheng, B. Getting depleted resource-based cities back on their feet again–the example of Yichun in China. J. Clean. Prod. 2016, 134, 42–50. [Google Scholar] [CrossRef]
  34. Fan, F.; Zhang, X. Transformation effect of resource-based cities based on PSM-DID model: An empirical analysis from China. Environ. Impact Assess. Rev. 2021, 91, 106648. [Google Scholar] [CrossRef]
  35. Yang, Y.; Cheng, D.; Zhang, B.; Guan, C.; Cheng, X.; Cheng, T. Coal resource-based cities at the crossroads: Towards a sustainable urban future. Cities 2023, 140, 104424. [Google Scholar] [CrossRef]
  36. Yang, H.; Zhai, G.; Zhang, Y. Ecological vulnerability assessment and spatial pattern optimization of resource-based cities: A case study of Huaibei City, China. Hum. Ecol. Risk Assess. Int. J. 2021, 27, 606–625. [Google Scholar] [CrossRef]
  37. Song, W.; Yin, S.; Zhang, Y.; Qi, L.; Yi, X. Spatial-temporal evolution characteristics and drivers of carbon emission intensity of resource-based cities in China. Front. Environ. Sci. 2022, 10, 972563. [Google Scholar] [CrossRef]
  38. Song, Y.; Yeung, G.; Zhu, D.; Xu, Y.; Zhang, L. Efficiency of urban land use in China’s resource-based cities, 2000–2018. Land Use Policy 2022, 115, 106009. [Google Scholar] [CrossRef]
  39. Woodworth, M.D. Ordos Municipality: A market-era resource boomtown. Cities 2015, 43, 115–132. [Google Scholar] [CrossRef]
  40. Yin, D.; Qian, J.; Zhu, H. Living in the “Ghost City”: Media Discourses and the Negotiation of Home in Ordos, Inner Mongolia, China. Sustainability 2017, 9, 2029. [Google Scholar] [CrossRef]
  41. Yin, D.; Gao, Q.; Yang, M. Reconstruction and negotiation of the “home” of urban landless peasants: A case study of Ordos. Sci. Geogr. Sin. 2019, 12, 2. [Google Scholar] [CrossRef]
  42. Liu, R.; Chao, L.; Fan, Q. Analysis of coordination between population and economic system in resource-based cities—Taking Ordos City as an example. Areal Res. Dev. 2016, 3, 14. [Google Scholar] [CrossRef]
  43. Bai, Y.; Wu, S.; Zhang, Y. Exploring the Key Factors Influencing Sustainable Urban Renewal from the Perspective of Multiple Stakeholders. Sustainability 2023, 15, 10596. [Google Scholar] [CrossRef]
  44. Tang, Y. Analysis of key dimensions and strategies of China’s urban renewal system construction. Urban Plan. Int. 2022, 37, 1. [Google Scholar] [CrossRef]
  45. Yao, K.; Lu, Y.; Li, X.; Ruan, H.; Gao, F.; Shao, S.; Sun, Y.; Liu, Y.; Li, J. Evaluating and Analyzing Urban Renewal and Transformation Potential Based on AET Models: A Case Study of Shenzhen City. Sustainability 2023, 15, 13528. [Google Scholar] [CrossRef]
  46. Hemphill, L.; McGreal, S.; Berry, J. An indicator-based approach to measuring sustainable urban regeneration performance: Part 2, empirical evaluation and case-study analysis. Urban Stud. 2004, 41, 757–772. [Google Scholar] [CrossRef]
  47. Zheng, H.W.; Shen, G.Q.; Song, Y.; Sun, B.; Hong, J. Neighborhood sustainability in urban renewal: An assessment framework. Environ. Plan. B 2017, 44, 903–924. [Google Scholar] [CrossRef]
  48. Liu, C.; Chen, S.X.; Huang, Z.Y.; Yan, S.X. Evaluation of urban renewal potential supported by multi-source data. World Archit. 2023, 07, 18–19. [Google Scholar] [CrossRef]
  49. Hu, J.H.; Zhang, J.X. Urban renewal dilemma analysis and governance path based on collective action theory. Urban Dev. Stud. 2022, 29, 22–30. [Google Scholar] [CrossRef]
  50. Qin, H.L. Bottleneck and Legislative Suggestion of Public Participation in Urban Renewal: A Case Study of Residential Urban Renewal in Beijing. Urban Rural. Dev. 2022, 1, 12–15. [Google Scholar]
  51. How to “Customize” a 15-Minute Community Life Circle in a Megacity. Available online: https://sghexport.shobserver.com/html/baijiahao/2023/02/08/957993.html (accessed on 8 April 2024).
  52. Rust Belt in the ‘Golden Coal Triangle’. Available online: https://www.rmzxb.com.cn/c/2014-06-16/339921_3.shtml?n2m=1 (accessed on 6 February 2024).
  53. Ordos Mayor: There Is Still a Backlog of Nearly 40,000 Housing Units, Which Will Be Absorbed within Three Years. Available online: https://npc.people.com.cn/n/2014/0307/c376899-24567430.html (accessed on 6 February 2024).
  54. GB50180-93; Code for Urban Residential Area Planning and Design. Ministry of Housing and Urban-Rural Development of the People’s Republic of China & General Administration of Quality Supervision, Inspection and Quarantine of the People’s Republic of China: Beijing, China, 2016.
Figure 1. The three stages of decline in the old urban areas of typical resource-based cities in developing countries.
Buildings 14 03065 g001
Figure 2. Scope and location of the study area (World map and Chinese source for standard map service: http://bzdt.ch.mnr.gov.cn/index.html (accessed on 21 August 2024)).
Buildings 14 03065 g002
Figure 3. Historical development of main urban built-up areas in Dongsheng District since 1985 (Source: drawn by the author based on Google Earth historical map images).
Buildings 14 03065 g003
Figure 4. Research framework.
Buildings 14 03065 g004
Figure 5. Urban renewal potential assessment system.
Buildings 14 03065 g005
Figure 6. Road connectivity.
Buildings 14 03065 g006
Figure 7. Population aggregation.
Buildings 14 03065 g007
Figure 8. Landscape environment.
Buildings 14 03065 g008
Figure 9. Floor area ratio.
Buildings 14 03065 g009
Figure 10. Building density.
Buildings 14 03065 g010
Figure 11. Building function.
Buildings 14 03065 g011
Figure 12. Building height.
Buildings 14 03065 g012
Figure 13. Building quality.
Buildings 14 03065 g013
Figure 14. Educational facilities.
Buildings 14 03065 g014
Figure 15. Medical facilities.
Buildings 14 03065 g015
Figure 16. Elder care facilities.
Buildings 14 03065 g016
Figure 17. Commercial facilities.
Buildings 14 03065 g017
Figure 18. Parks and green spaces.
Buildings 14 03065 g018
Figure 19. Sports facilities.
Buildings 14 03065 g019
Figure 20. Property rights complexity.
Buildings 14 03065 g020
Figure 21. Willingness for urban renewal.
Buildings 14 03065 g021
Figure 22. Overall assessment of urban renewal potential.
Buildings 14 03065 g022
Table 1. Comparison of characteristics of famous resource-based cities in developed and developing countries.
TypeCountryCityUrban Area StructureLeading Industries
Developed countryBritainAberdeenMonolithic and aggregatedEnergy, life sciences, food and drink, technology and digital
USAPittsburghOverall gathered, scattered around urban clustersAdvanced manufacturing, climate tech and decarbonization, cybersecurity, energy, life sciences and healthcare, robotics and AI, space
CanadaCalgaryMonolithic and aggregatedAerospace, agribusiness, creative industries, energy and environment, financial services, digital media and entertainment, life sciences, technology, transportation and logistics
USAHoustonOverall gathered, radiating from the center outward into a distribution of urban clustersBusiness services, technology, aerospace, medicine, manufacturing
Developing countryRussiaKurskTwo urban regions formed in the north and south, relatively independent of each otherIron and steel, electric power, machine manufacturing, metalworking, food processing
AzerbaijanBakuScattered around urban clustersOil and gas extraction, shipbuilding, steelmaking, mechanical engineering, chemical manufacturing
ChinaDaqingTwo urban regions formed in the east and west, with the middle separated by non-urban areas, relatively independent of each otherMining, manufacturing, power, construction
Note: Urban area structure is mainly based on satellite maps.
Table 2. Current proportions of land use types and urban villages with high-potential blocks for each indicator.
IndicatorTop Three Types by ProportionProportion of Urban Villages
TypeProportionTypeProportionTypeProportion
Road connectivityResidential 46.96%Commercial service 21.88%Green and open space 13.34%9.77%
Population aggregationResidential 64.99%Commercial service 10.55%Industrial and mining 9.27%2.65%
Landscape environmentResidential 39.07%Green and open space 31.25%Commercial service 18.11%8.32%
Floor area ratioResidential 49.74%Commercial service 14.11%Green and open space 13.35%4.56%
Building densityResidential 49.08%Commercial service 41.52%Public administration and public service 4.64%6.30%
Building functionResidential 92.82%Industrial and mining 7.18%————4.87%
Building heightResidential 42.03%Commercial service 14.86%Green and open space 14.32%9.12%
Building qualityResidential 48.51%Green and open space 15.04%Commercial service 14.42%5.48%
Educational facilitiesResidential 60.05%Commercial service 15.07%Public administration and public service 11.62%7.16%
Medical facilitiesResidential 50.36%Commercial service 21.27%Public administration and public service 14.10%4.94%
Elder care facilitiesResidential 52.73%Public administration and public service 19.24%Commercial service 16.34%7.54%
Commercial facilitiesResidential 54.26%Commercial service 28.25%Public administration and public service 7.43%9.84%
Parks and green spacesResidential 45.27%Commercial service 19.17%Green and open space 17.06%3.22%
Sports facilitiesResidential 48.07%Public administration and public service 17.53%Commercial service 15.16%6.79%
Property rights complexityCommercial service 31.51%Green and open space 19.76%Residential 14.93%8.57%
Willingness for urban renewalResidential 64.99%Commercial service 10.55%Industrial and mining 9.27%1.22%
Overall assessment of urban renewal potentialResidential 51.86%Commercial service 22.50%Public administration and public service 15.14%8.69%
Note: Only the top three categories based on current land use proportions are shown.
Table 3. Scores of various indicators based on comparative analysis of historical development.
IndicatorScore
Road connectivity3.22
Population aggregation2.22
Landscape environment2.95
Floor area ratio3.34
Building density2.55
Building function3.18
Building height3.33
Building quality3.35
Educational facilities2.55
Medical facilities2.48
Elder care facilities2.84
Commercial facilities2.39
Parks and green spaces3.31
Sports facilities3.18
Property rights complexity3.36
Willingness for urban renewal2.22
Overall Assessment of Urban Renewal Potential1.89
Note: Using standard deviation as the basis, the data were divided into three groups, with numerical (X) intervals as follows: X ≤ 2.2576; 2.2576 < X < 3.3424; X ≥ 3.3424.
Disclaimer/Publisher’s Note: The statements, opinions and data contained in all publications are solely those of the individual author(s) and contributor(s) and not of MDPI and/or the editor(s). MDPI and/or the editor(s) disclaim responsibility for any injury to people or property resulting from any ideas, methods, instructions or products referred to in the content.

