Article

Cyclic Performance and Environmental Impact of Precast Demountable RCS Joints

by
Wei Li
1,2,
Yang Yang
1,
Zhengyi Kong
3,
Wei Huang
4,
Yaping Wang
5,* and
Haijing Wang
6,*
1
College of Civil Engineering and Architecture, Wenzhou University, Wenzhou 325035, China
2
Key Laboratory of Engineering and Technology for Soft Soil Foundation and Tideland Reclamation of Zhejiang Province, Wenzhou 325035, China
3
Institute for Sustainable Built Environment, Heriot-Watt University, Edinburgh EH14 4AS, UK
4
School of Civil Engineering, Xi’an University of Architecture and Technology, Xi’an 710055, China
5
School of Law, Zhongnan University of Economics and Law, Wuhan 430275, China
6
School of Law, Wenzhou University, Wenzhou 325035, China
*
Authors to whom correspondence should be addressed.
Buildings 2024, 14(10), 3071; https://doi.org/10.3390/buildings14103071
Submission received: 22 August 2024 / Revised: 18 September 2024 / Accepted: 22 September 2024 / Published: 26 September 2024

Abstract

:
To facilitate the disassembly and recycling of structural components, this study proposes a novel demountable reinforced-concrete column–steel beam (RCS) joint. Numerical simulations were conducted to analyze the performance of this new RCS joint using finite element software ABAQUS 2021. Simultaneously, to expand the parametric analysis of the finite element model, further validating aspects such as concrete strength, the flange strength of the steel beam, the strength of the gusset plates, and the longitudinal reinforcement ratio were studied. The finite element analysis results demonstrate that the proposed demountable RCS joint exhibits superior bearing capacity and ductility compared to conventional cast-in-place joints. To further investigate the seismic behavior and influencing rules of this joint, analyses were carried out focusing on aspects such as hysteresis curves, skeleton curves, ductility, energy dissipation, residual deformations, and strength degradation. The findings reveal that gusset plate strengths, steel beam strength, beam-end connecting plate strength, longitudinal reinforcement ratio, and concrete strength have significant impacts on the strength and failure modes of the RCS joints. In addition, the life cycle analysis of four different material structures shows that the demountable RCS joints have the smallest carbon emission during the life cycle, which is conducive to the reuse of resources. Finally, the development of demountable RCS joints is proposed for China’s construction industry.

1. Introduction

In recent years, the shortening of construction schedules and the rapid assembly of building structures have increasingly become focal points in the construction industry, giving rise to the development of precast building systems. Among these, beam–column connections are recognized as relatively vulnerable sections of a structure, with damage to the panel zone potentially leading to the overturning or progressive collapse of the entire structure. Consequently, the mechanical properties of beam–column connections have garnered extensive attention [1,2,3,4,5]. Choi et al. [6], adhering to the “strong column and weak beam” principle of seismic design, designed and fabricated five beam–column joints, and the seismic performance indexes such as the hysteresis curve, ductility, and strength degradation of the joints were studied. The results show that fabricated joints can also have good seismic performance. Following this, Zhang et al. [7] studied the seismic behavior of precast concrete-filled tubular column–steel beam connections, conducting quasi-static tests on six scaled-down joints. They examined the failure modes, hysteretic characteristics, bearing capacity, energy dissipation capability, and shear performance of the panel zone. The findings suggested that the primary failure mode of these joints was shear failure in the panel zone. Wu et al. [8] conducted low-cycle reversed loading tests on two large-scale specimens consisting of steel beams, precast concrete columns, and foundation connections. Their results demonstrated that when the ductility coefficient reached 5.0, the components still maintained good lateral stiffness and strength, with neither stiffness nor strength degradation being pronounced. The reasonably designed assembled steel beam-precast column composite frame structure can meet the needs of resisting earthquake action in terms of strength, lateral displacement, ductility, and post-yield deformation capacity.
The reliability and favorable mechanical properties of precast joints have been validated; however, these joints typically require secondary casting on-site, which not only prolongs construction time but also compromises casting quality. Therefore, there is a need to develop a joint connection system that allows for rapid assembly and disassembly, ensuring construction quality and adhering to a schedule while enabling the reuse of buildings. Vidjeapriya et al. [9] introduced a novel demountable frame joint featuring bolted connections between the beam and reinforced-angle steel brackets, with promising results from quasi-static testing indicating good ductility and energy dissipation but lower ultimate load capacity. Subsequently, Zhang [10] and colleagues proposed a demountable precast joint connecting steel beams to precast concrete columns, examining both monotonically and cyclically loaded full-scale specimens of box rib continuous and partitioned-type joints, complemented by numerical simulations using ABAQUS to assess their seismic performance. The outcomes revealed significantly enhanced displacement ductility coefficients and load capacities for the box rib partitioned-type joints compared to their continuous counterparts. Chen [11] carried out cyclic loading on 12 prefabricated hybrid new RCS joints and analyzed the parameters such as the beam–column bearing capacity ratio coefficient, the joint bearing capacity ratio coefficient, and joint web thickness. The results show that the RCS joints have good integrity and deformation capacity under cyclic loading. The ultimate drift ratio of most joints can reach 4%, and each specimen shows good hysteretic performance and energy dissipation capacity. Li [12] and associates, experimentally and through finite element analysis, investigated the seismic performance of three differently demountable RCS joints, comparing them to monolithically cast joints. The findings highlighted that all three connection forms of the demountable RCS joints outperformed monolithic pours in terms of lateral load capacity and energy dissipation. Further, they utilized the validated finite element models for parametric studies.
Previous work has affirmed the satisfactory seismic performance of precast demountable joints, although with a focus predominantly on beam–beam connections and employing a rather singular joint connection form. At the same time, the impact of the non-removable part of the demountable joint on the environment is not considered. The research on the demountable joint is only in the aspect of studying the seismic performance, and the impact on the environment in the whole life cycle and the comparison with other nodes have not been studied further. Moreover, a comprehensive understanding of the mechanical behavior and seismic performance influencing principles of these demountable precast joints has yet to be fully elucidated. Consequently, this study introduces a novel demountable RCS beam–column connection design (depicted in Figure 1a,b), where two inner-stiffened plates are welded in the cover plate. The steel bars are placed through the reserved gap of the inner-stiffened plate. The concrete is poured through the prefabricated formwork. The beam-end connecting plate and the Y-shaped connecting plate are connected using high-strength bolts. The steel beam is welded on the beam-end connecting plate. This design meticulously considers the ease of installation and disassembly. To delve into the impact and advantages of this innovative demountable RCS joint, a detailed parametric study using finite element analysis is further conducted to explore its seismic performance characteristics and potential for broader application.

2. Verification of Finite Element Models

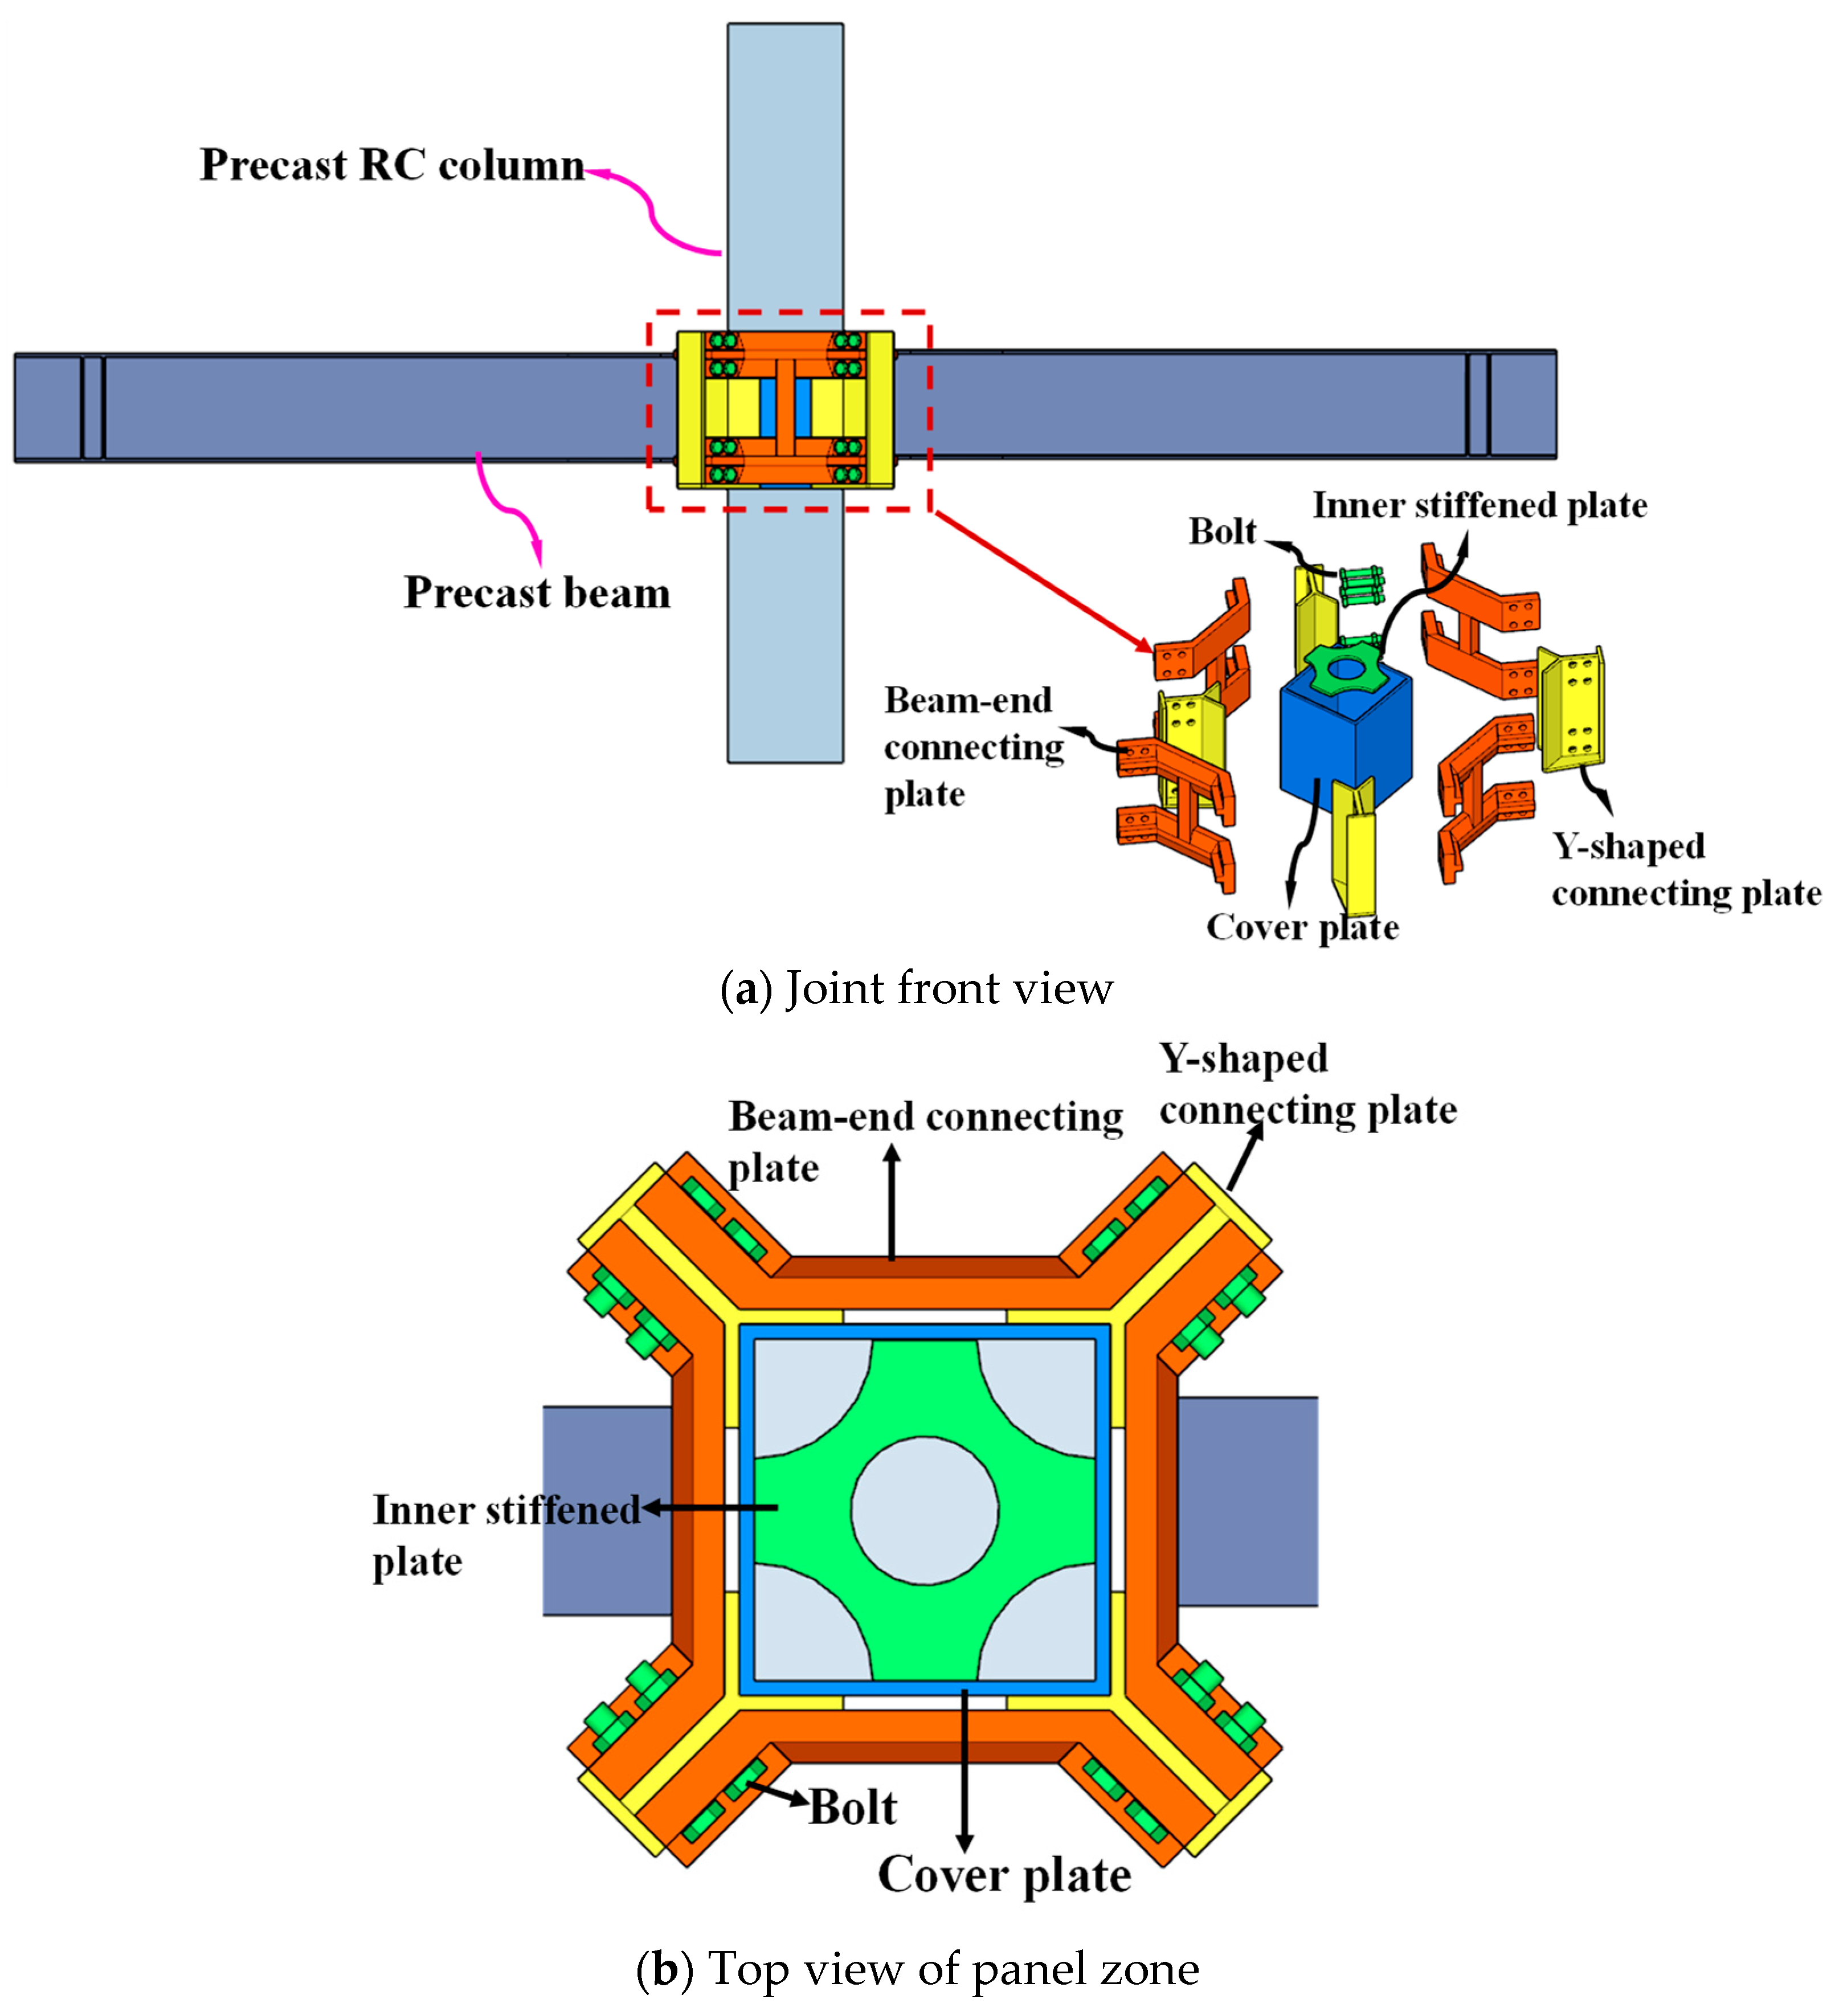
2.1. Selection of Joint Specimen Types

Wang [13] conducted a seismic performance study on the proposed demountable precast RCS joint. The test was conducted at a scale of 1:2, with each beam end measuring 1800 mm in length and each side of the column standing 1000 mm tall. As shown in Figure 2, the substructure of the central joint within the dashed frame of the prototype structure was selected as the test specimen.
The planar schematic diagram of the test specimen is shown in Figure 3, and the detailed design parameters can be found in the literature [12].

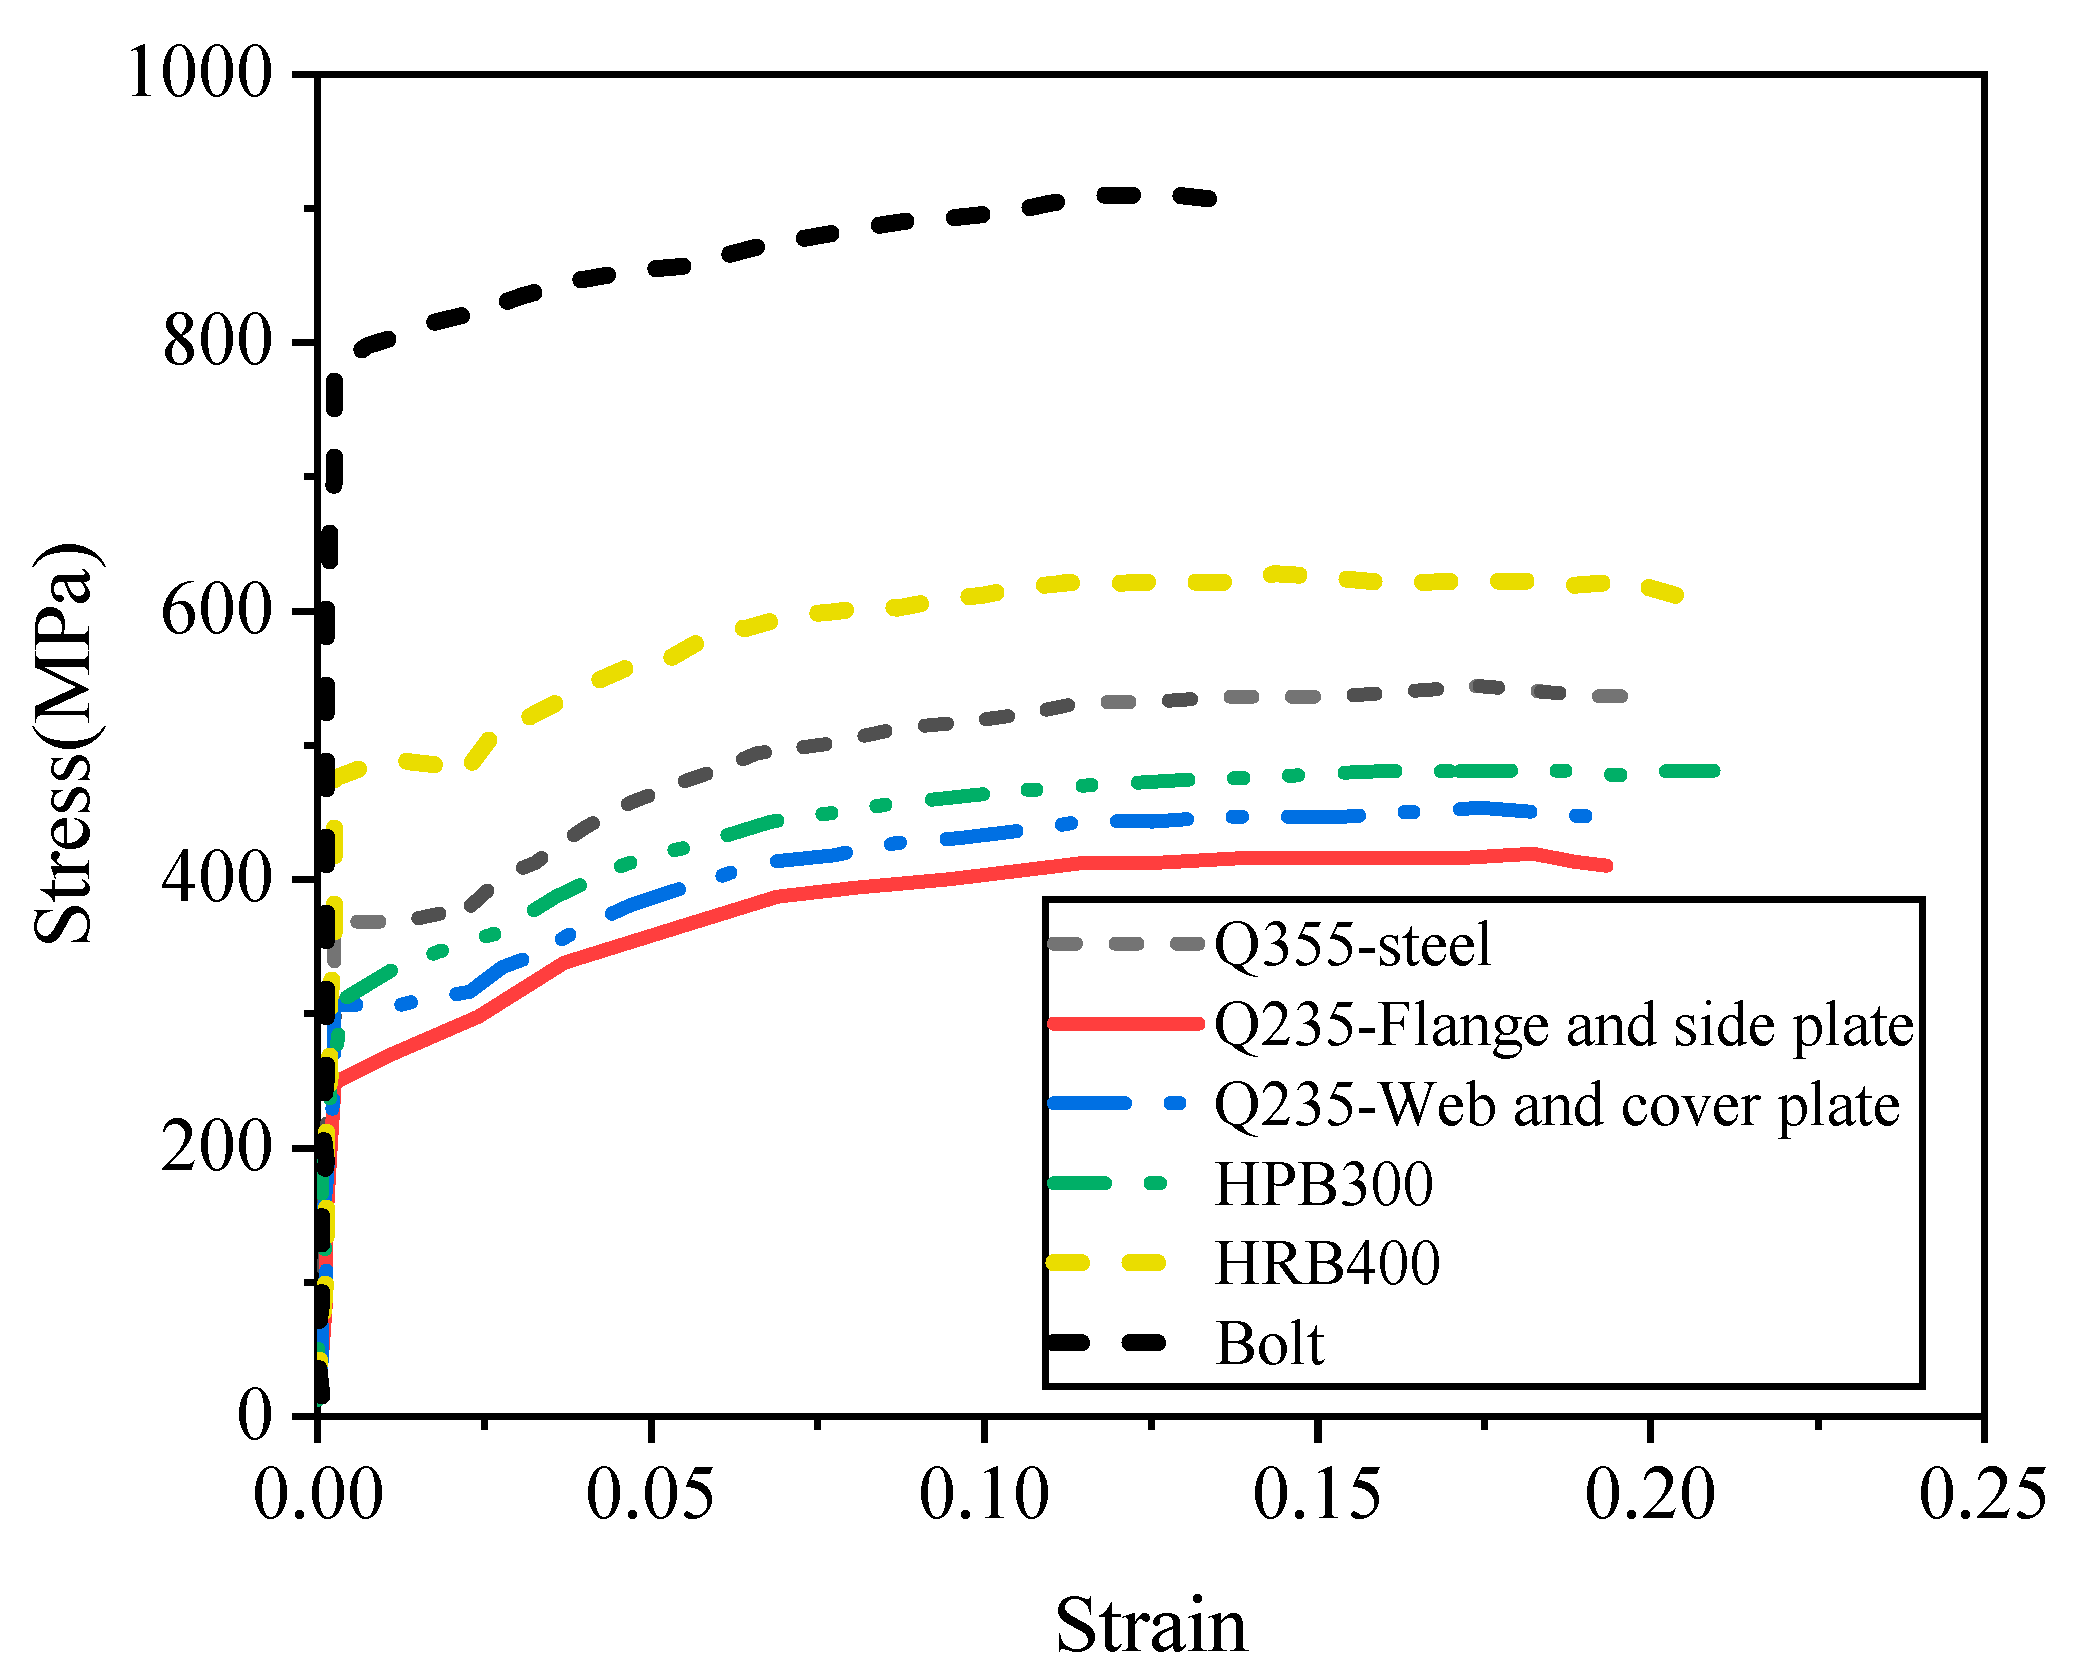
2.2. Determination of Material Constitutive Models

Based on the tension–compression principal relationship criterion specified in the “Code for Design of Concrete Structures” (GB 50010-2010) [14], the stress–strain curves for the numerical model were computed and included. These curves are presented in Figure 4.

2.3. Mesh Generation and Boundary Conditions

Concrete columns, steel beams, and various components were modeled using eight-joints linear reduced-integration hexahedral solid elements (C3D8R), while reinforcing bars were represented by two-joint three-dimensional truss elements (T3D2). The “Embed” constraint was used to embed the reinforcing bars within their respective concrete members. Welded connections between steel components were simulated using “Tie” constraints. Surface-to-surface contact between steel components was established through contact pairs, with friction coefficients of 0.25 for the interface between steel beams and concrete, and 0.20 for steel–steel contact surfaces [15]. The boundary conditions and mesh division applied to the node are shown in Figure 5, where 0 indicates a constraint. To facilitate the application of loads and boundary constraints, coupling is performed at the beam ends and loading surfaces. Displacement constraints in the y and z directions are applied at the bottom of the concrete column to simulate a pin support at the column base. For the method for simulating the boundary conditions of the beam end supports, only displacement constraints in the x, y, and z directions are applied at the coupling points established at the beam ends, allowing the beam end to rotate about the x-axis.

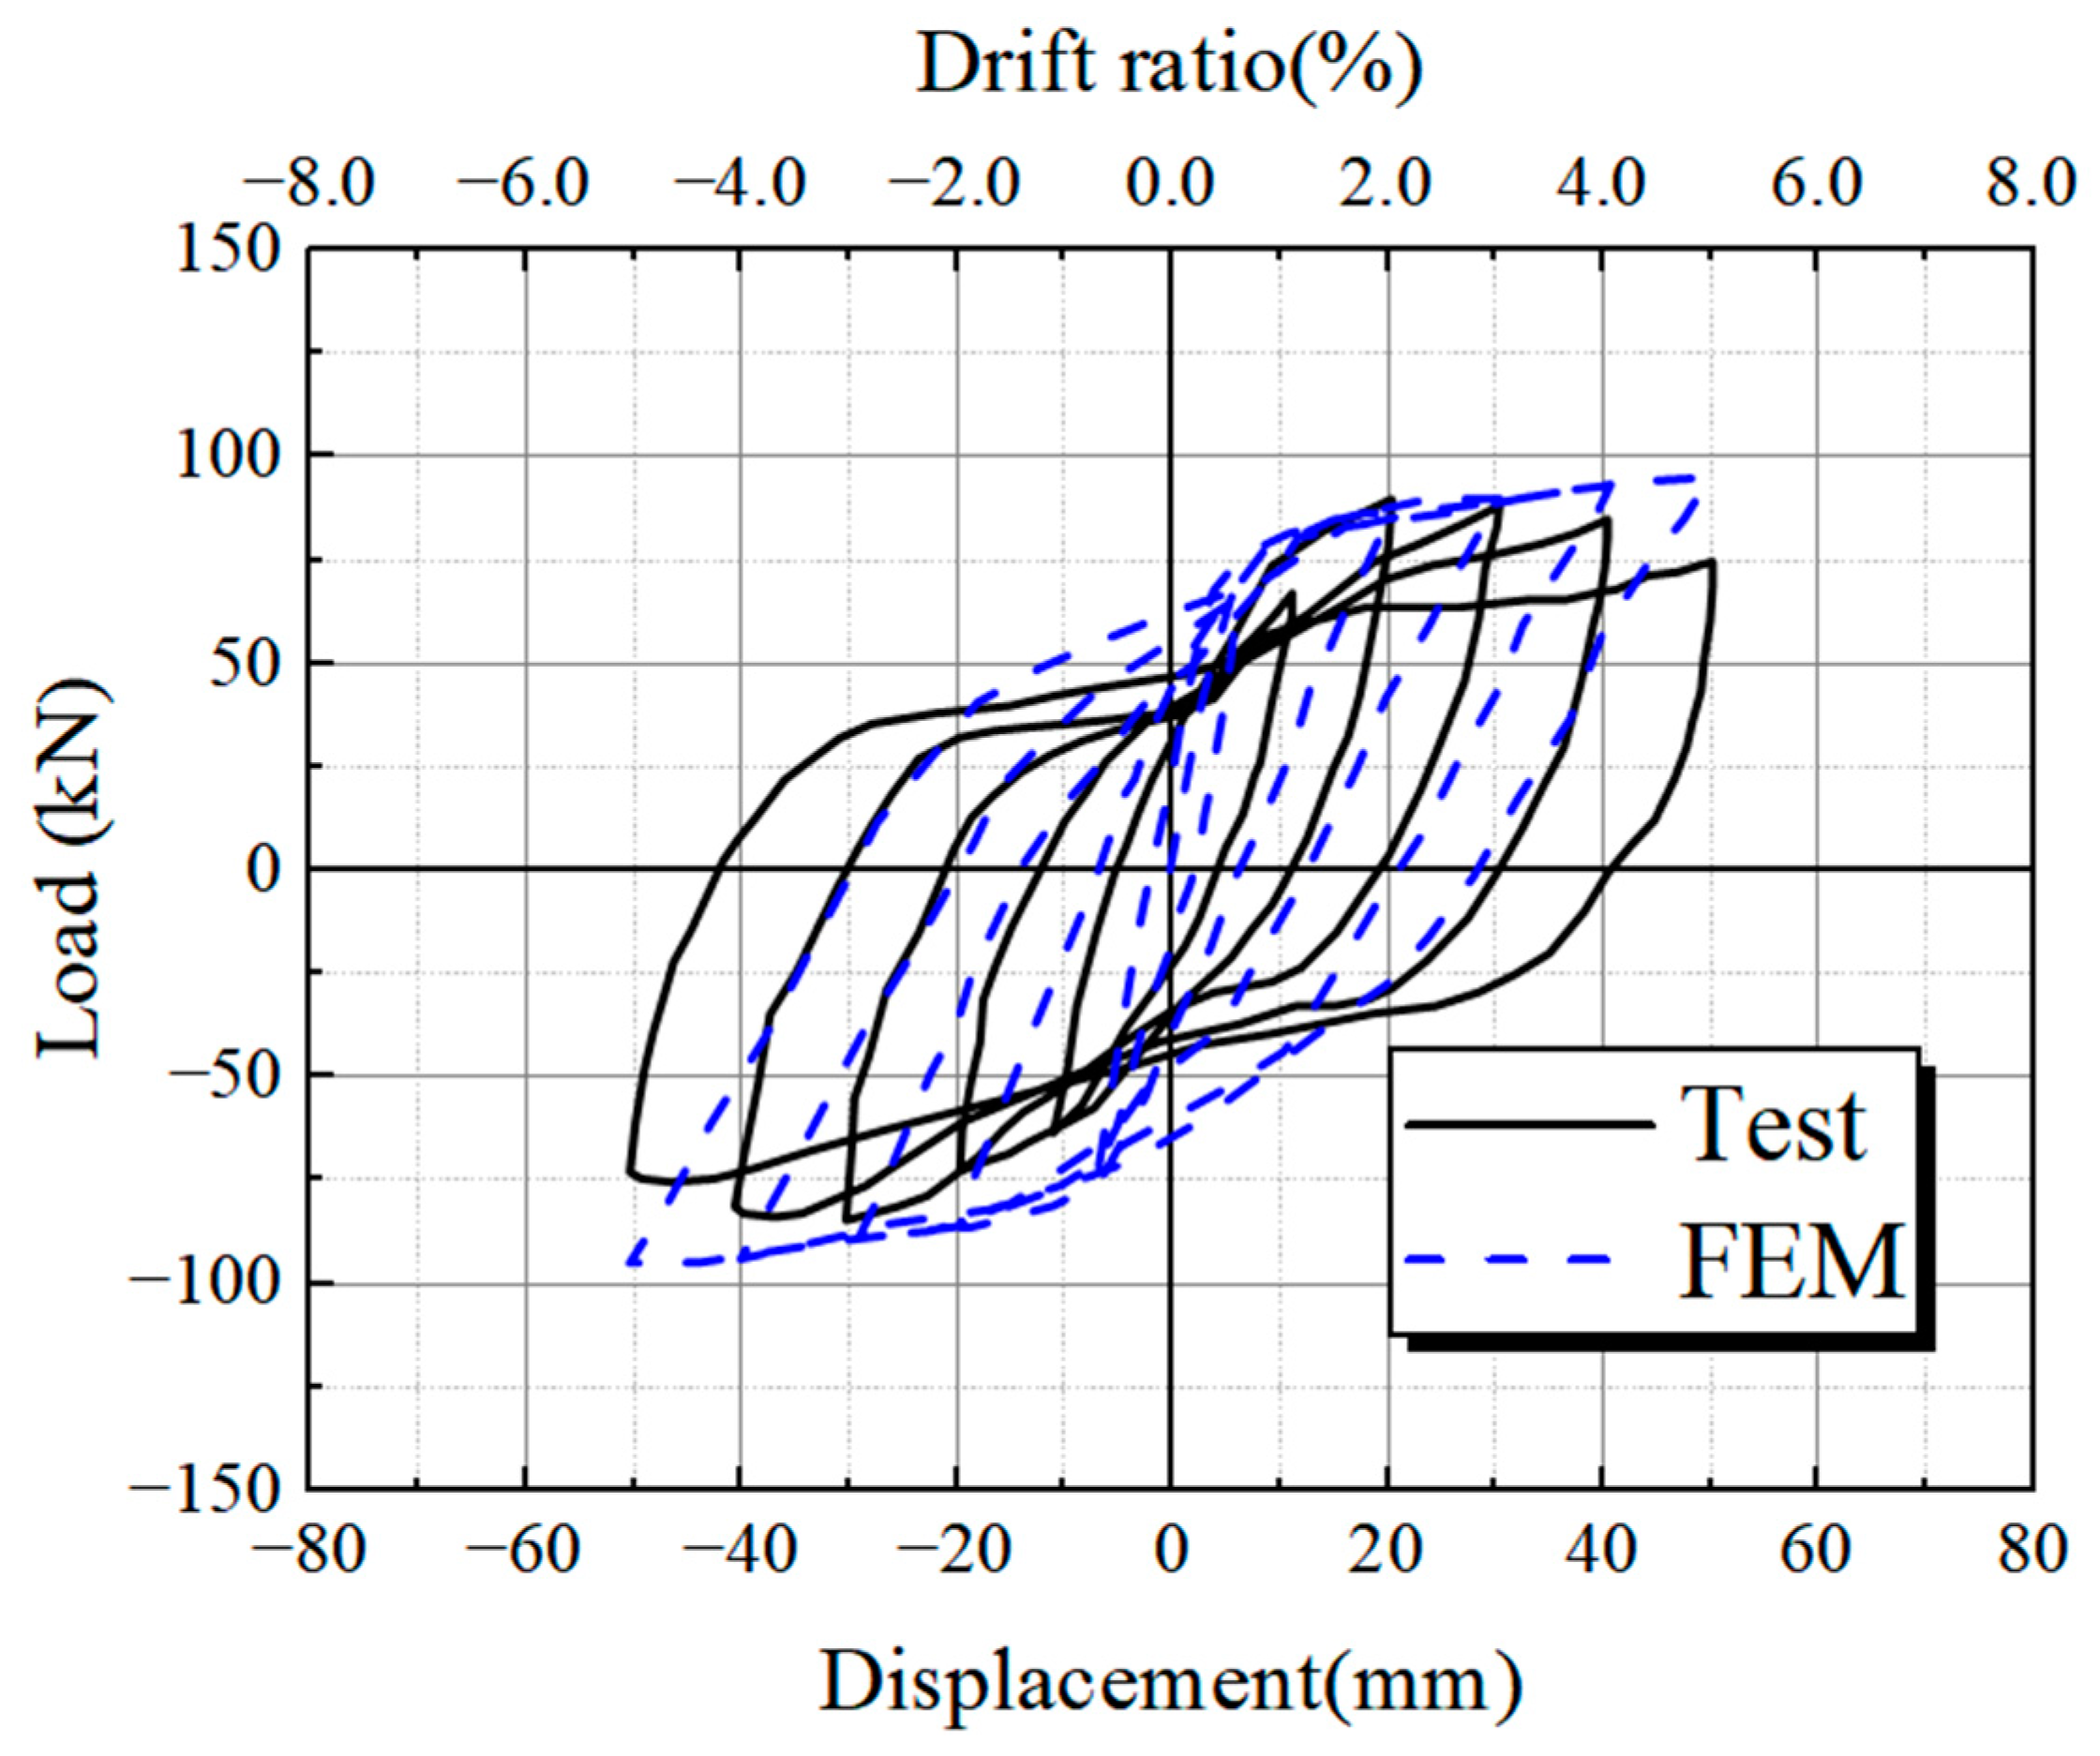
2.4. Comparison of Finite Element Model with Test Results

As shown in Figure 6, by comparing the failure modes of the experimental joint specimens with the instantaneous stress distributions from the finite element models, it can be seen that the numerical simulations can accurately reproduce the final failure states observed in the experiments.
It can be seen from Figure 7 that the numerical simulation can reasonably predict the overall trend in the hysteretic loops of the joint. The difference in the bearing capacities between the test and simulation is less than 5%. Table 1 summarizes the yield points [16] and peak points from both the experiments and simulations.

3. Selection of Finite Element Model for Demountable RCS Joint

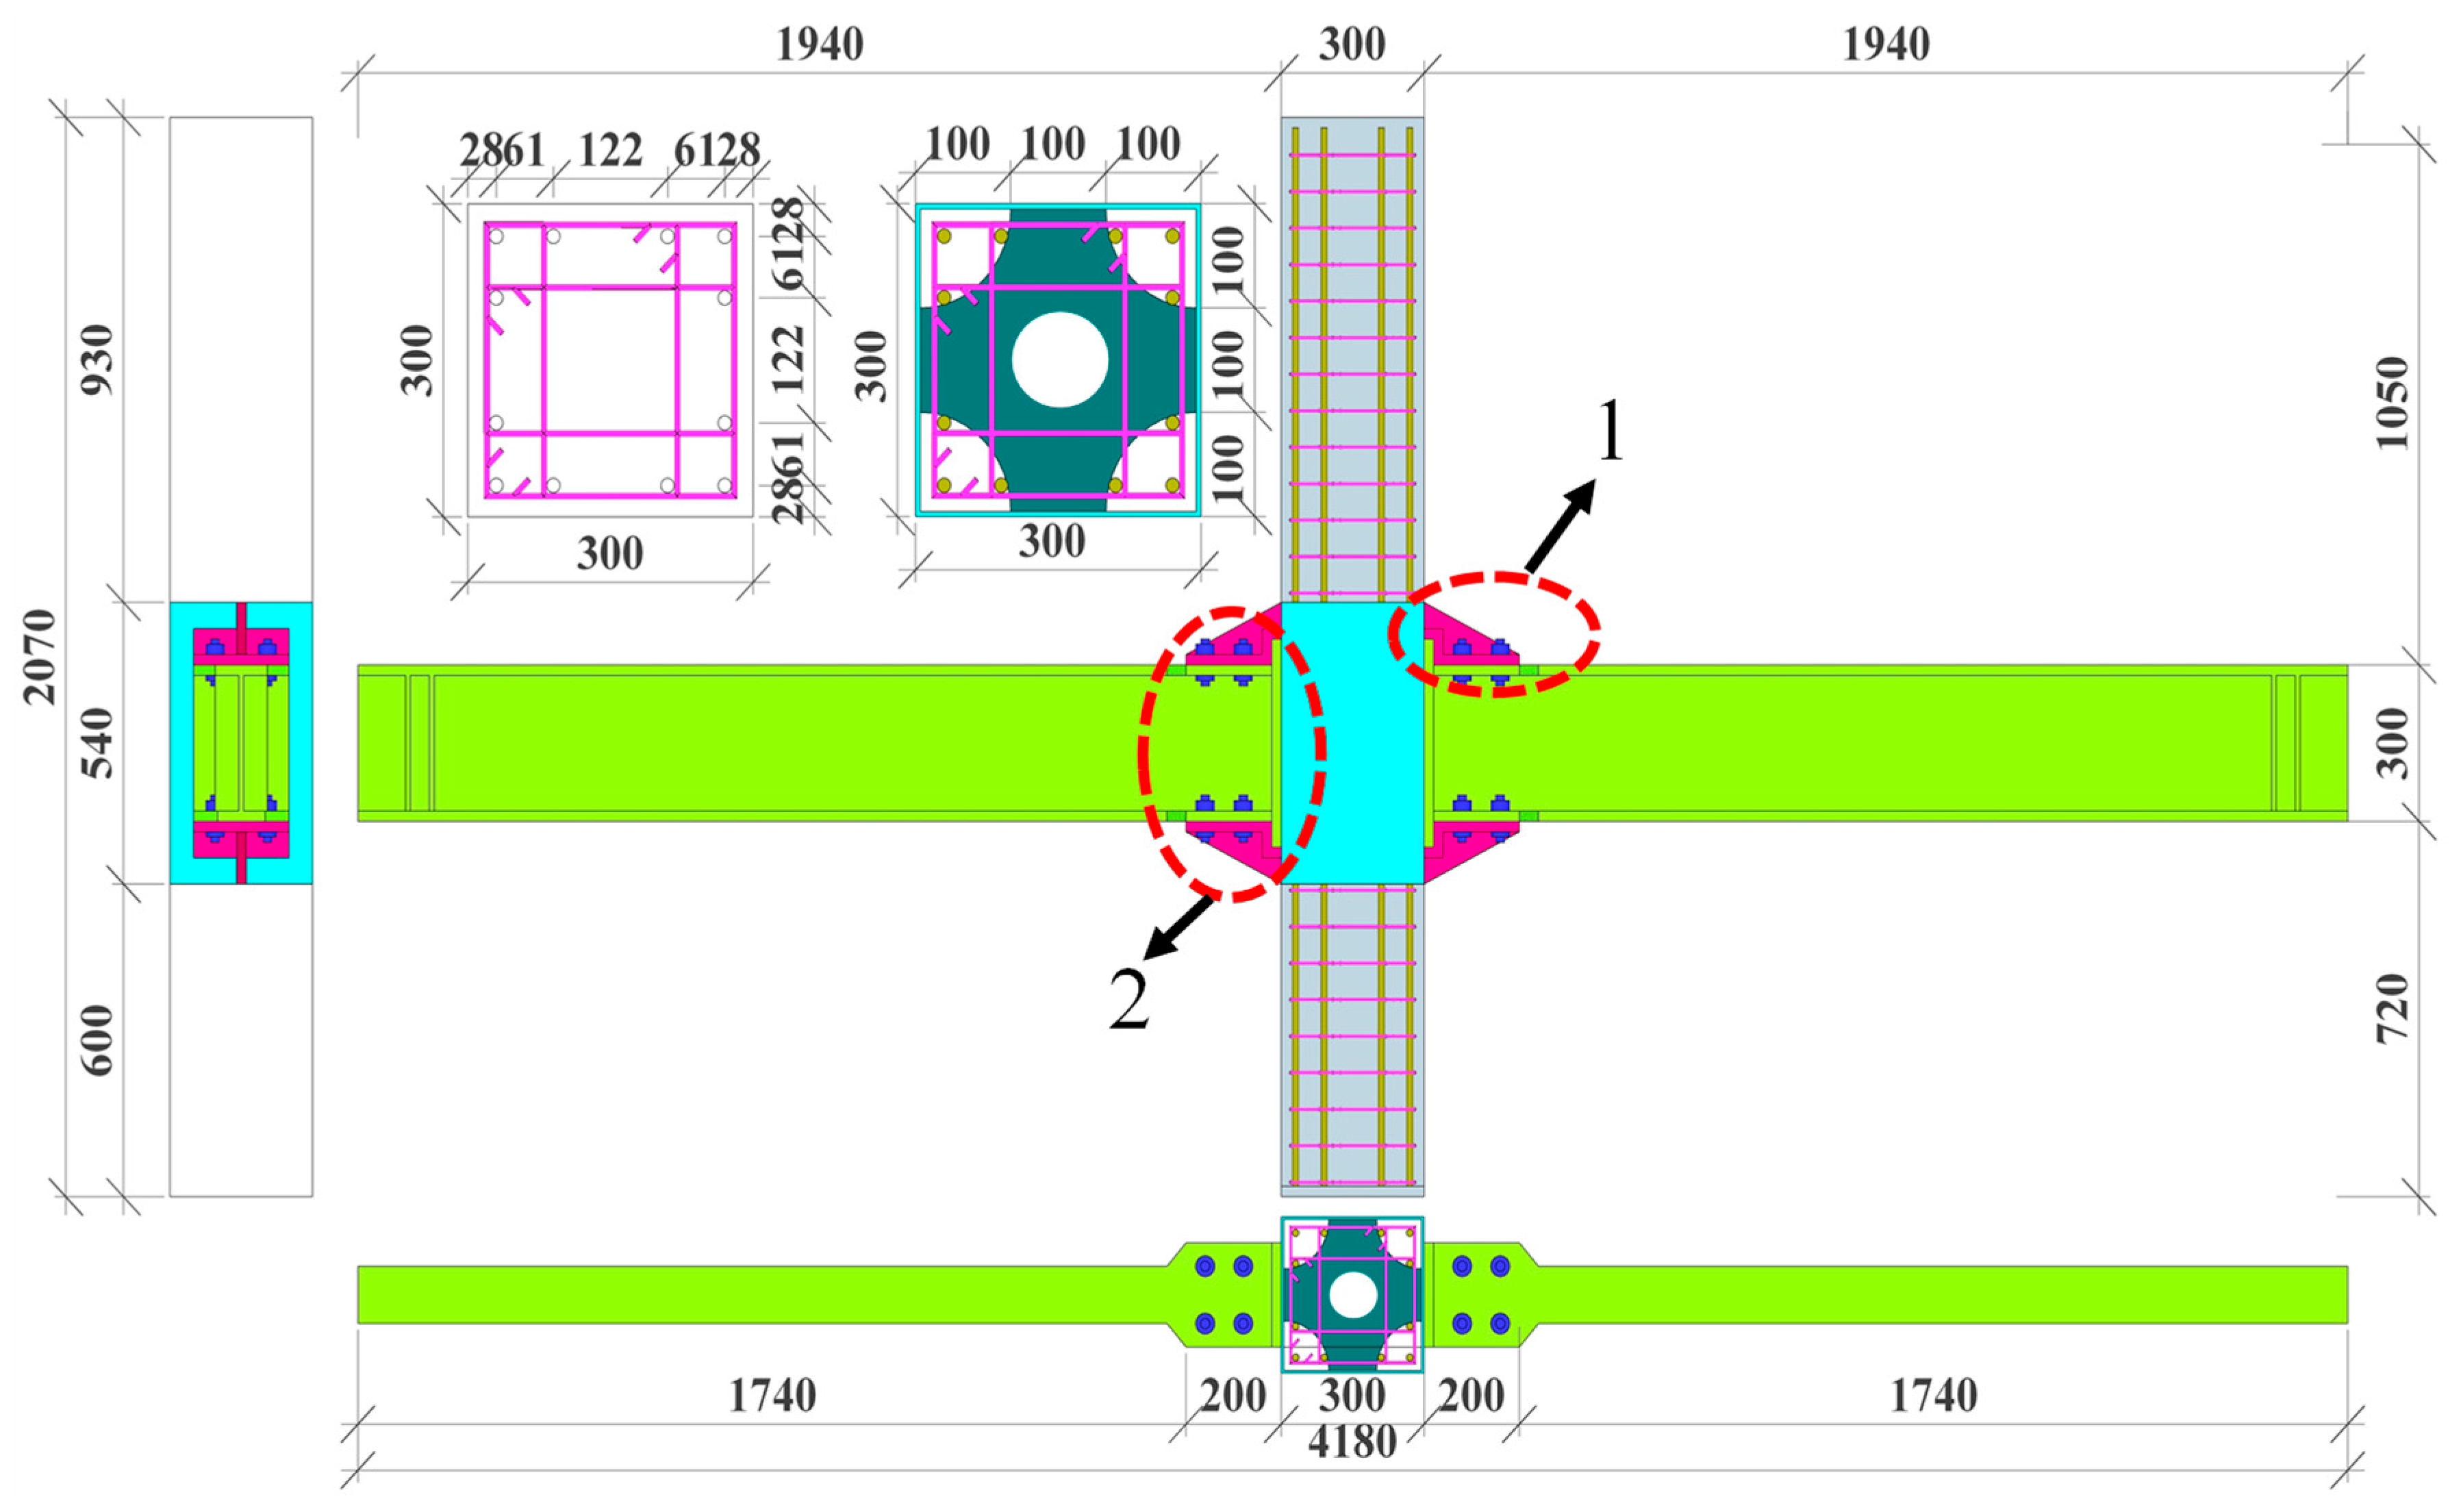
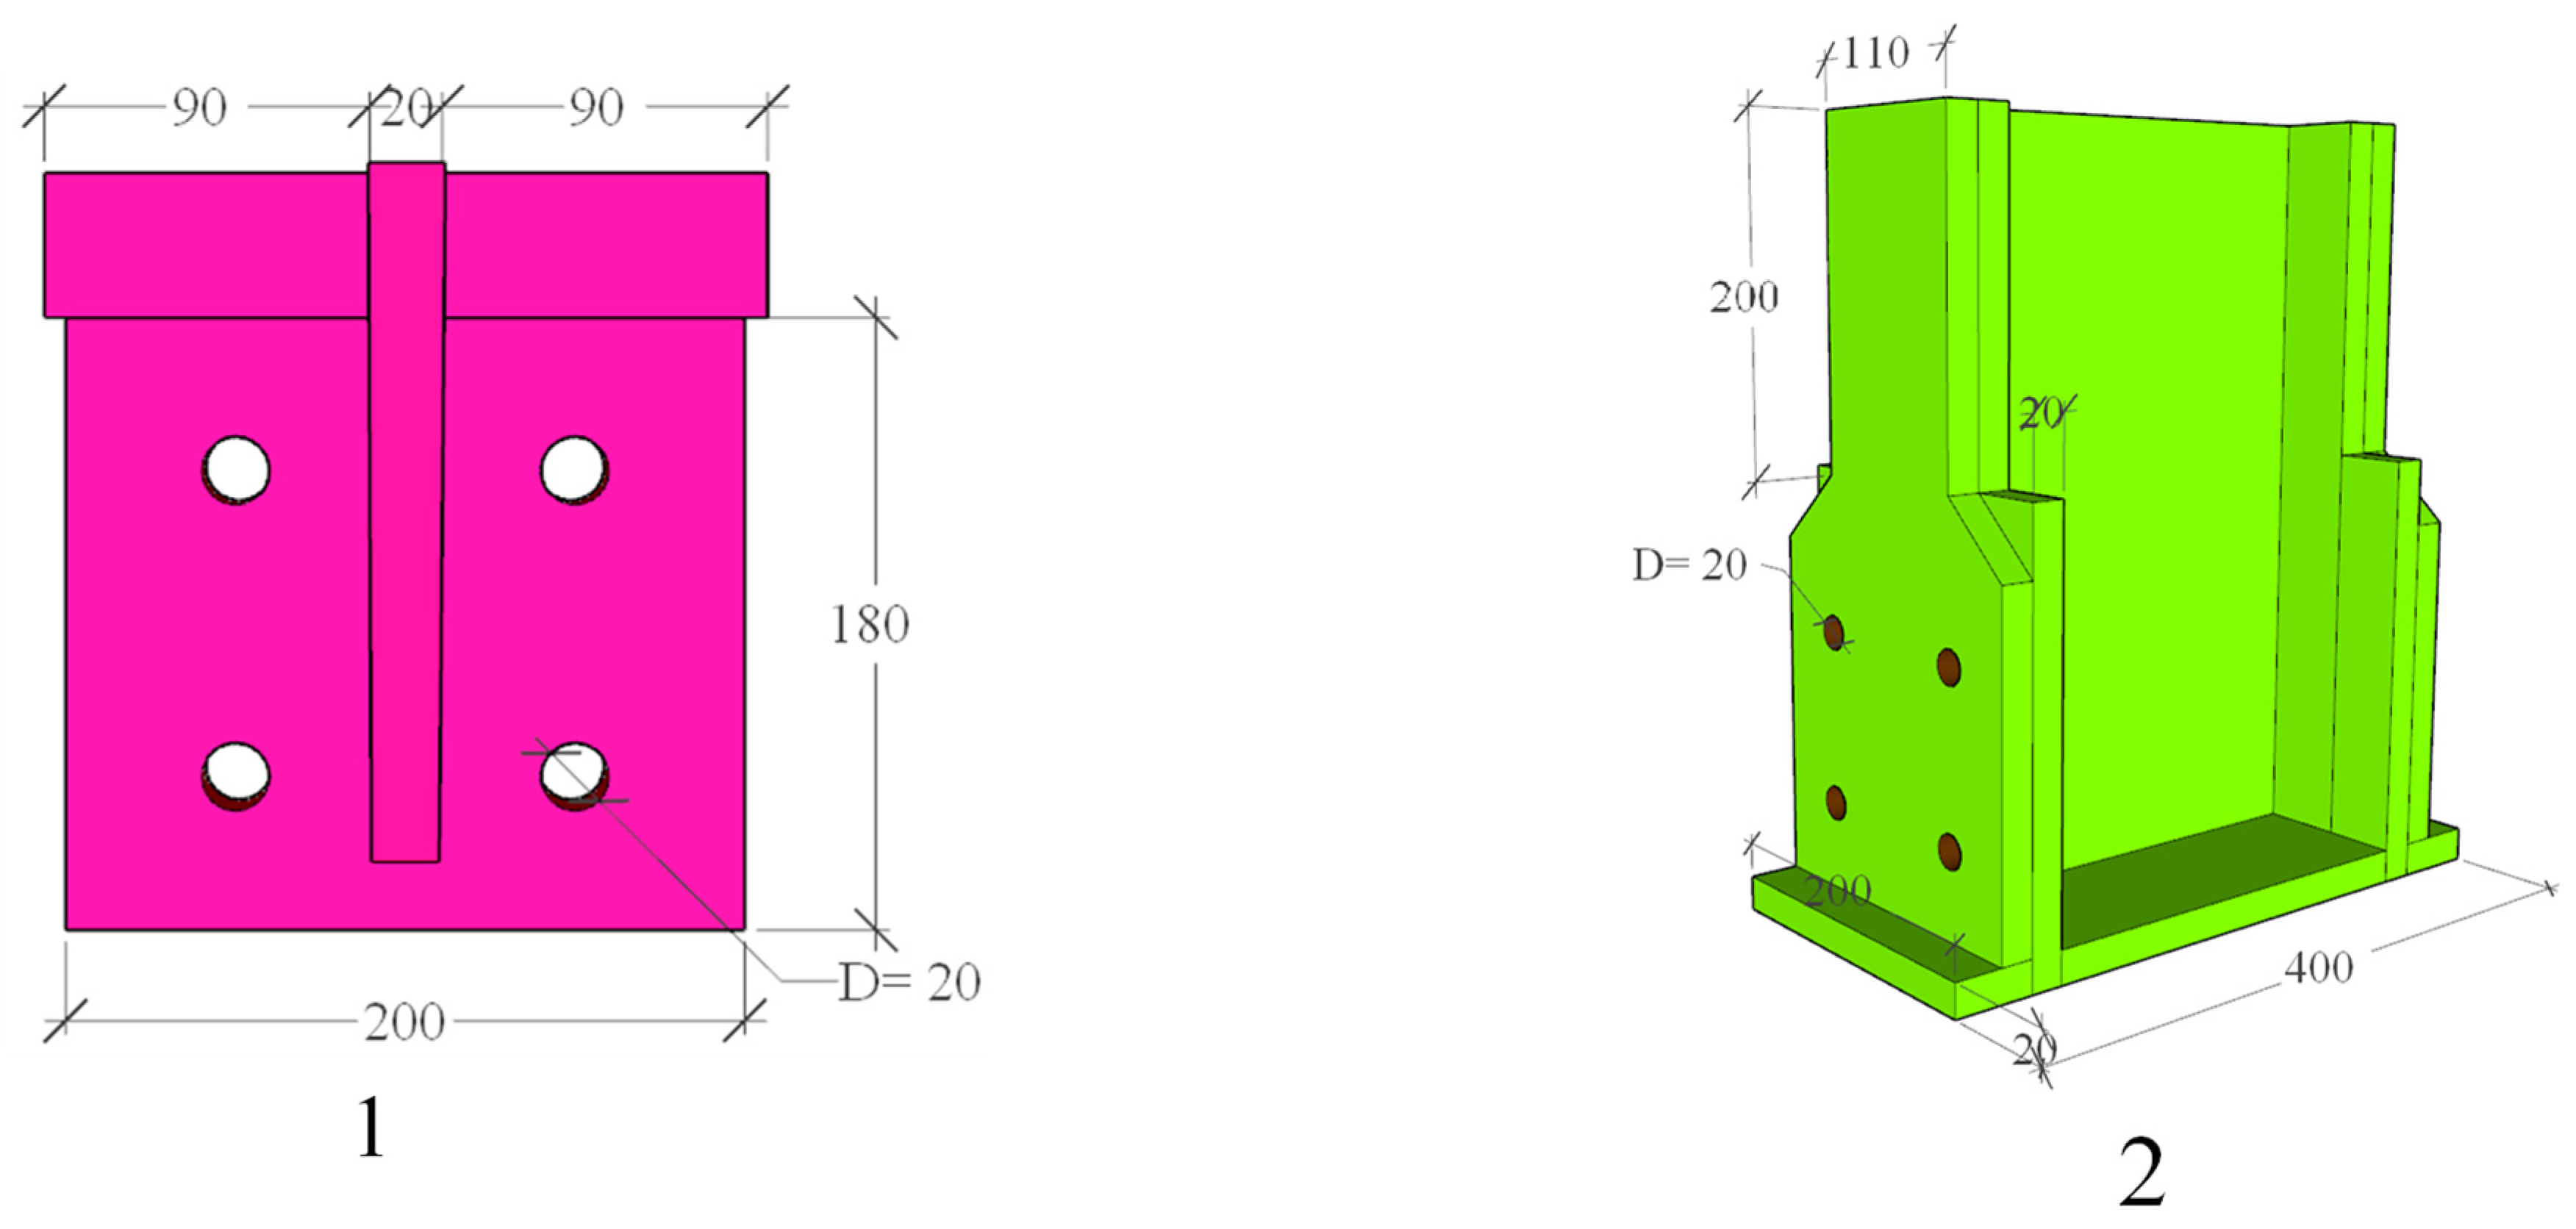
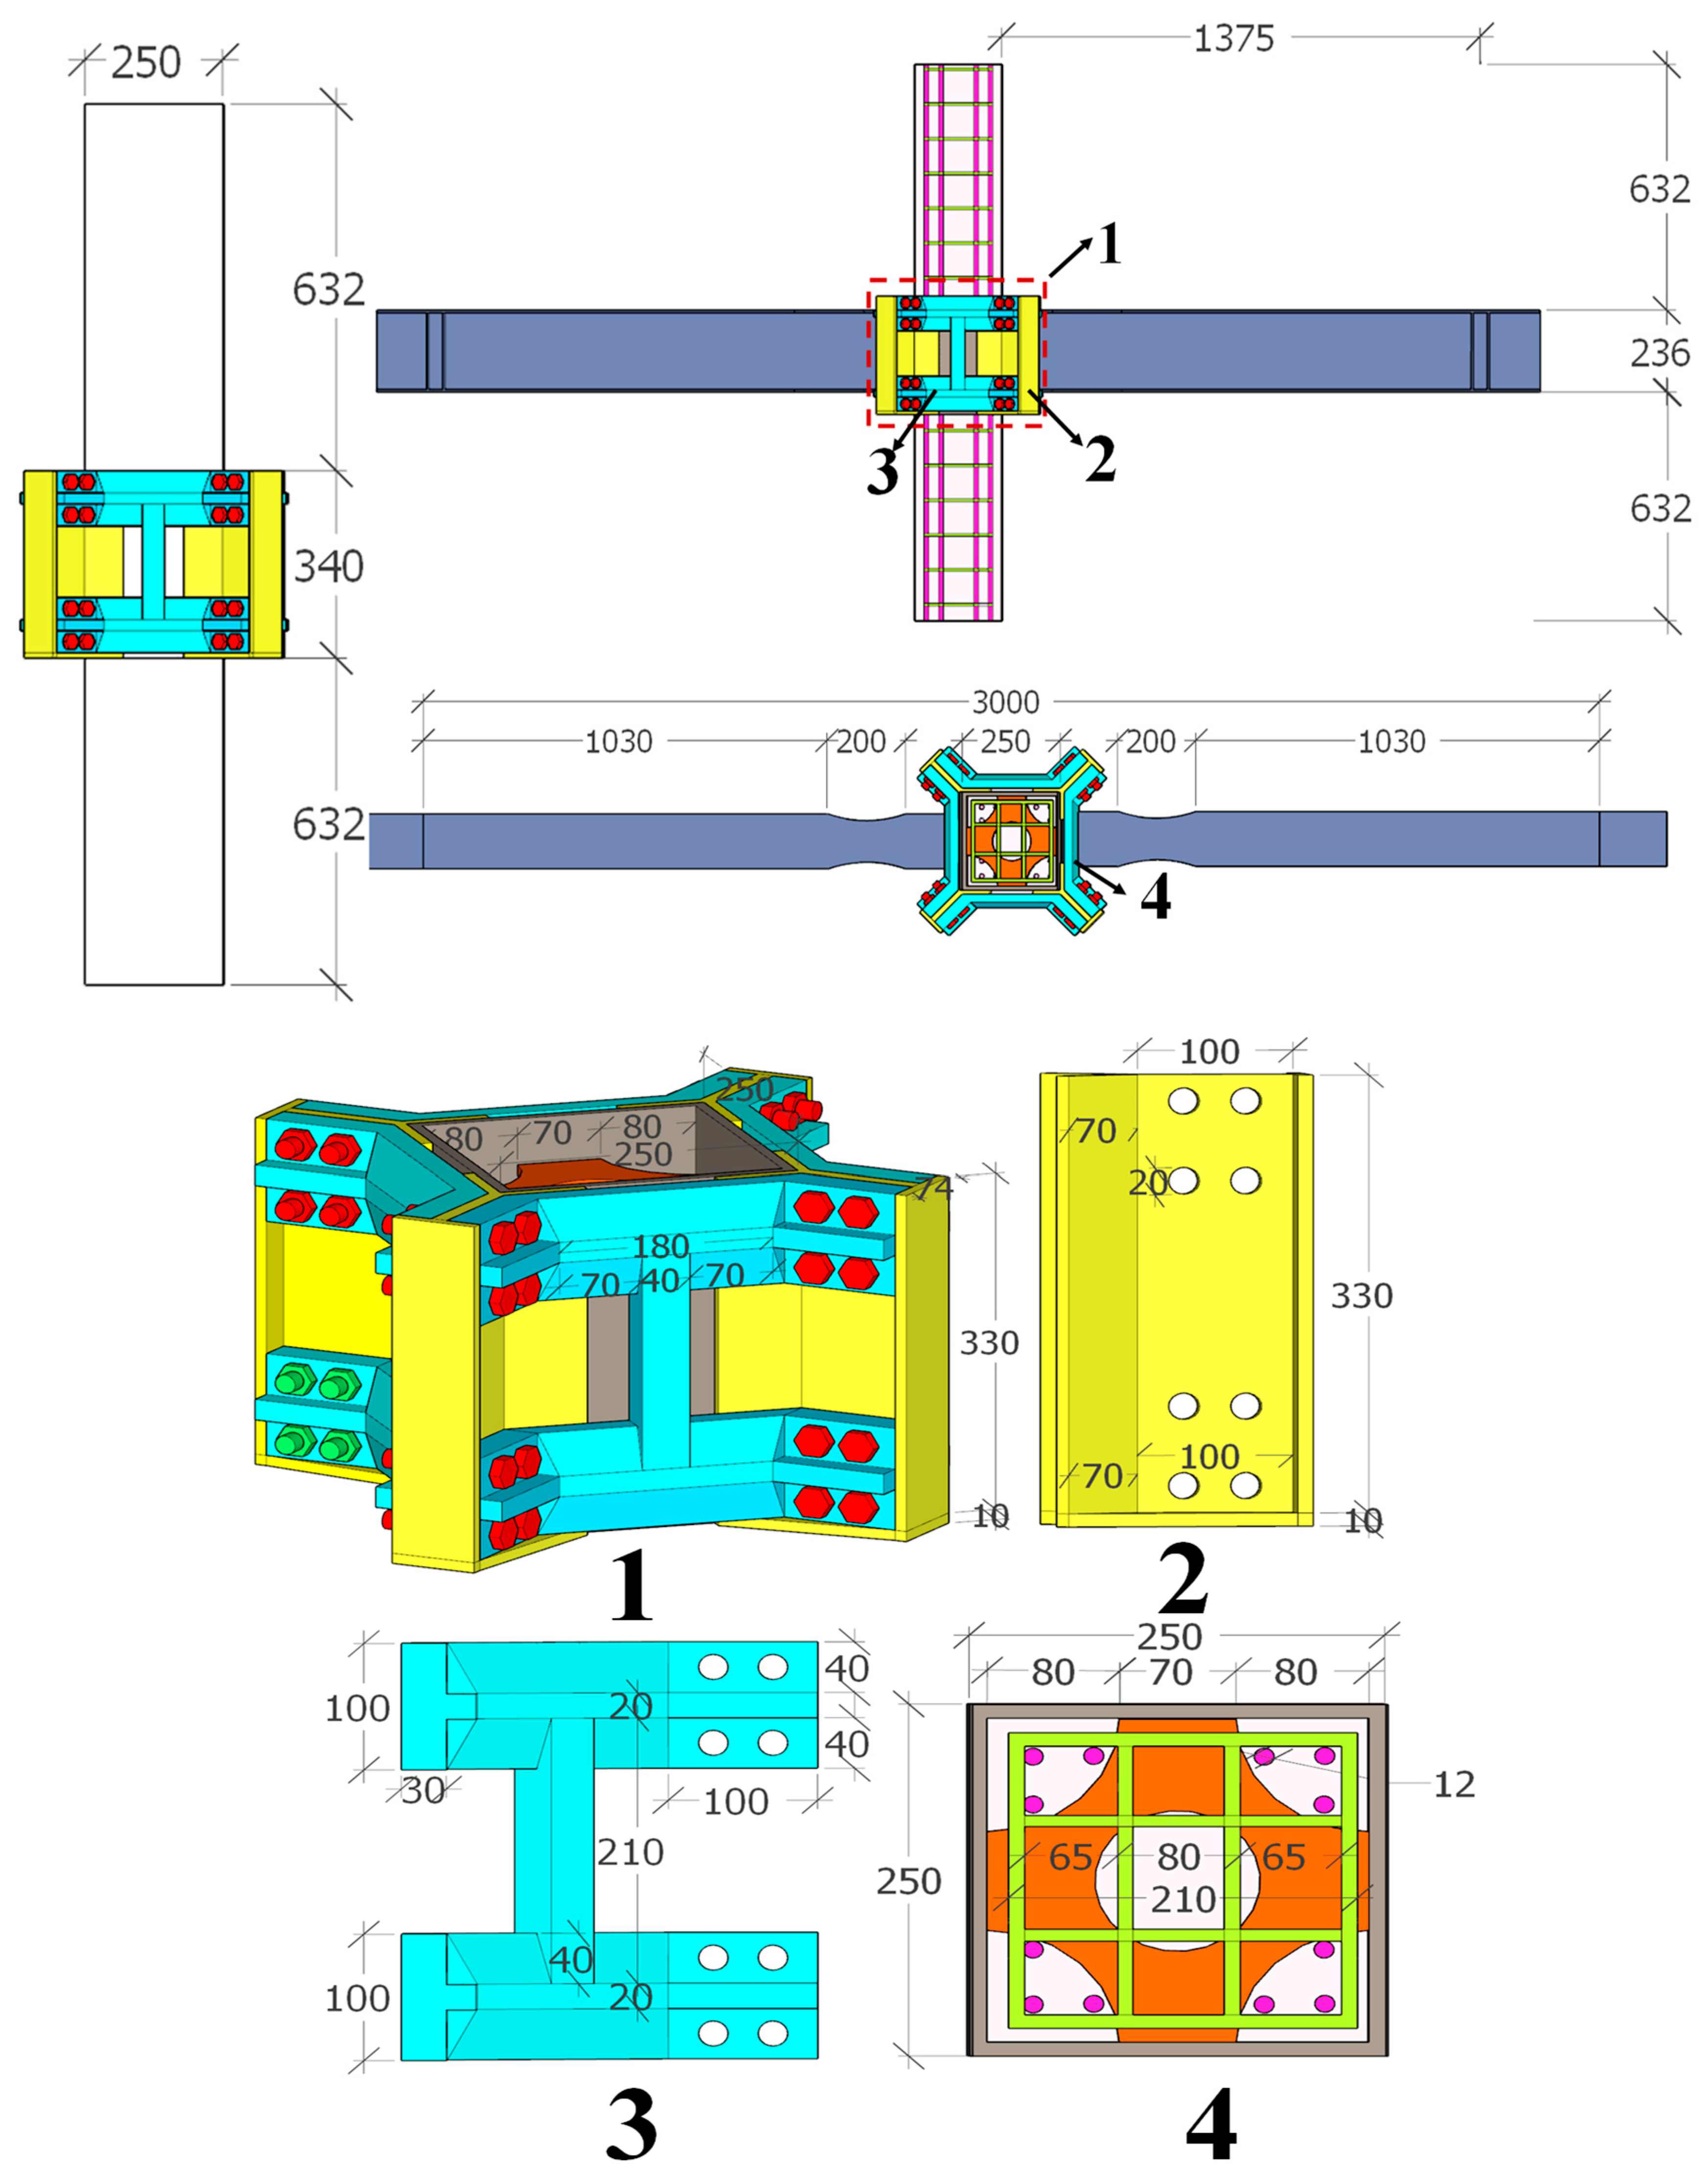
3.1. Specimen Design

The specimen model selects a composite unit of beams and columns between the inflection points of a middle-story, multi-story, and multi-span frame structure, with the beam inflection point distance being 1500 mm and the column inflection point distance also 1500 mm. All of the steel materials adopt Q355 steel. The experiment designs two 1/2 scale reinforced-concrete column–steel beam (RCS) joints. Joint RCS-J0 represents a conventional cast-in-place RCS joint, with its basic dimensions illustrated in Figure 8, whereas joint RCS-J1 is the new demountable RCS joint, whose fundamental dimensions are shown in Figure 9. The details of the cross-sectional reinforcement and core zone dimensions are depicted in Figure 10 and Figure 11, respectively. Specific dimensions and parameters are listed in Table 2.
This new RCS joint meets the design requirement of “strong column, weak beam”, while the beams and columns also need to follow the “strong shear, weak moment” design principle. Under these two design prerequisites, the designed RCS joint is expected to have better seismic resistance. To achieve the goal of “strong column, weak beam”, the bending capacities of the columns and beams on the RCS specimens should satisfy the following relationship:
M C > n c M b
where M c —the sum of the moment design values in either clockwise or counterclockwise direction at the upper and lower ends of the column section at the joint; M b —the larger value of the sum of the beam-end moments at the joint, calculated in both clockwise and counterclockwise directions, considering earthquake combinations; η c —the column end moment amplification factor, which for second-level seismic-resistant frames is taken as 1.5.
During the design process, to improve the ductility of the whole structure, the connection between the steel beam and the beam-end connecting plate is optimized. The specific design formula is given in Equation (2). Moreover, the connection between the Y-shaped connecting plate and the cover plate in the RCS joint area also needs careful design, which is governed by Equation (3) as follows:
t f C W X 2 V c f ϕ n F w l w C W X
t f C C 2 V c f ϕ n F w l w C C
where F w —represents the designed strength of the weld; l w C W X —the maximum weld length between the steel beam and the beam-end connecting plate; t f C W X —the weld length on one side of the web; V c f —the shear force at the plastic hinge location; ϕ n —the resistance factor for non-ductile limit states. And for the Y-shaped connecting plate: l w C C —the maximum feasible weld length at the Y-shaped connecting plate; t f C C —the weld length for the connection between the Y-shaped connecting plate and the cover plate.

3.2. Establishment of the Finite Element Model

Based on the specimen dimensions described in Section 3.1, a finite element model of the joint was created using ABAQUS. Eight-joint linear reduced-integration hexahedral solid elements (C3D8R) were used to model the concrete columns, steel beams, and other components. The reinforcement cages, modeled with two joints three-dimensional truss elements (T3D2), were embedded into the concrete columns using the “Embedded” feature. Normal “hard” contact and tangential Mohr Coulomb “penalty” contact were used for all contact surfaces, with friction coefficients of 0.25 for the steel–concrete interface and 0.20 for steel–steel interfaces. “Tie” constraints were used to bind the welded connections between steel plates. Sensitivity analyses on meshing were performed to avoid convergence problems and simplify the analysis, resulting in a mesh density of 50 for the main concrete columns and 30 for steel beams.
To simulate real experimental conditions as closely as possible, the constraints at the bottom of the column and both beam ends restrict displacements in the x, y, and z directions and rotations in the y and z directions, while only allowing rotation in the x direction. The connections between the prefabricated components in the node domain are made using high-strength bolts. The steel beams are welded to the beam-end connecting plates. These settings are designed to ensure that the node achieves “strong column, weak beam”.
The grid division, element types, and boundary conditions for the demountable RCS joints components are illustrated in Figure 12 and Figure 13, while the constraints and mesh division for the cast-in-place joint are shown in Figure 14.

3.3. Material Property Parameters

The ABAQUS model materials use C40 concrete, with a concrete elastic modulus, Poisson’s ratio, compressive strength, and a yield behavior of concrete in compression and tension that is modeled according to the ‘Code for Design of Concrete Structures’ GB50010-2010 [14]. The tensile curve is determined based on Equations (4)–(7).
σ = ( 1 d t ) E c ε
d t = 1 ρ t [ 1.2 0.2 x 5 ]   x 1 1 ρ t α t ( x 1 ) 1.7 + x   x > 1
x = ε ε t , r
ρ t = f t , r E c ε t , r
In which α t signifies the parameter for the descending segment of the uniaxial tensile stress–strain curve of the concrete, ε t , r represents the representative value of the uniaxial tensile strength of the concrete, and f t , r denotes the peak tensile strain corresponding to this strength. Meanwhile, d t refers to the evolution parameter indicative of the uniaxial tensile damage progression in the concrete.
For the stress–strain curve of concrete under uniaxial compression, it is defined according to Equations (8)–(12).
σ = ( 1 d c ) E c ε
d c = 1 ρ c n n 1 + x n   x 1 1 ρ c α c ( x 1 ) 2 + x   x > 1
ρ c = f c , r E c ε c , r
n = E c ε c , r E c ε c , r f c , r
x = ε ε t , r
In which α c represents the parameter for the descending branch of the uniaxial tensile stress–strain curve of the concrete, f c , r corresponds to the representative value of the uniaxial tensile strength, f c , r represents the peak tensile strain of the concrete, and d c is the evolution parameter for uniaxial tensile damage in the concrete.
The properties of the reinforcement and steel sections are detailed in Table 3. The steel has an elastic modulus E = 2.06 × 10⁵ MPa and a Poisson’s ratio of μ = 0.3.

3.4. Loading Protocol

Under displacement-controlled loading, after the specimen installation is complete, the vertical load is determined based on the axial compression ratio experienced by the specimen, which is then applied to the top of the specimen using a hydraulic jack. The horizontal displacement for each level is calculated based on the actual drift ratio, with a peak difference as the reference, and each level of horizontal loading undergoes two cycles. The loading protocol is illustrated in the following Figure 15.

3.5. Results of Finite Element Analysis

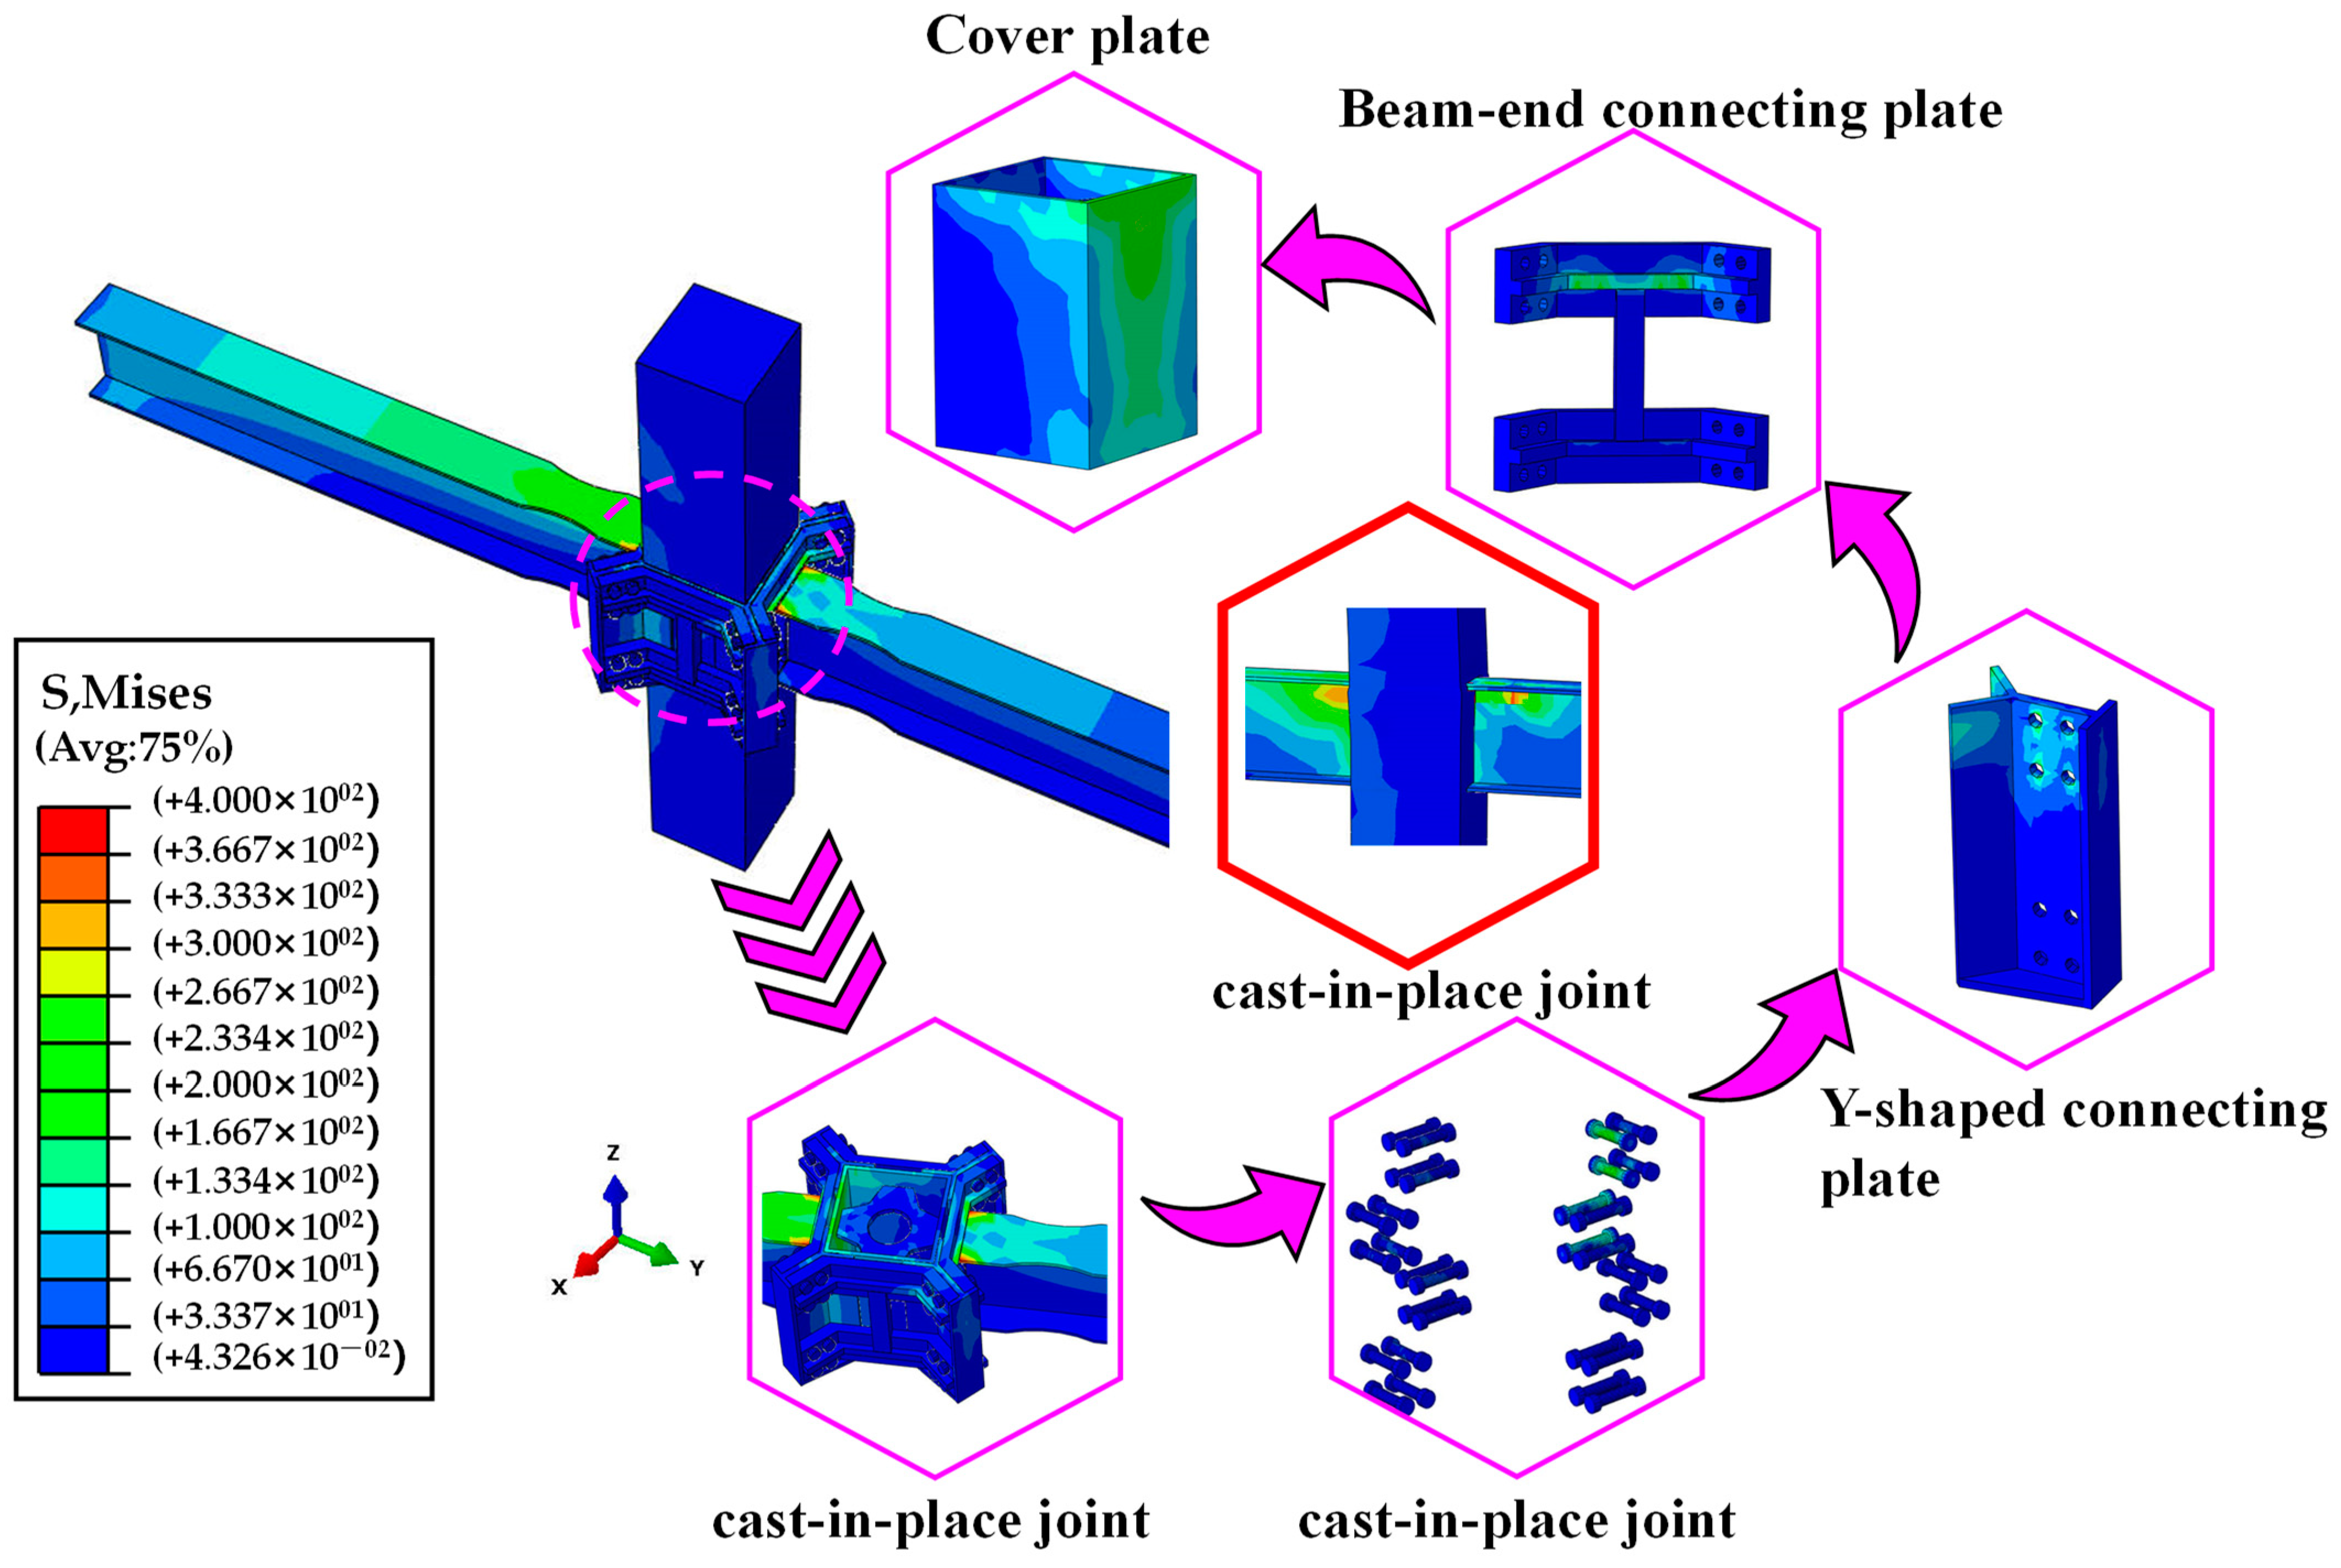
3.5.1. Comparison of Finite Element Stress Contour Plots

The tensile damage development of the RCS-J0 joint at varying drift ratios is shown in Figure 16a, which can be visually interpreted as the propagation of cracks. In the early stage, tensile cracks concentrate in the joint core area and the tension side of the steel beam corners. As the drift ratio increases, these cracks in the panel zone and tension corners expand and form intersecting diagonal cracks, extending towards both ends of the column. When the drift ratio increases from 2.5% to 3.0%, shear failure occurs in the panel zone.
Figure 16b illustrates the stress cloud map, showing the development of tensile and compressive damage in RCS-J1 as the drift ratio increases. Due to the presence of the cover plate, which increases the contact area between the steel beam and concrete column, the load-carrying capacity of the concrete column is efficiently utilized. Cracks initially emerge at the corners where the cover plate meets the concrete and then extend outward to both sides.
Figure 16c shows the strain state of the steel beam under different loading levels. It can be seen from the diagram that the strain at the weakened flange of the steel beam is much larger than that at the un-weakened flange area. From the top view, the stress at the welding of the steel beam and the beam end connection plate is the largest, and the failure form of the joint is the tearing of the steel beam weld, which meets the design requirements.
From Figure 17, it can be seen that the flange of the steel beam near the joint core area and the interface with the concrete-filled steel column in RCS-J0 have already yielded. In contrast, RCS-J1, due to the dog bone weakening of the flanges and the reinforcement of the panel zone, shifts the plastic hinge outward. Its stress is primarily concentrated in the dog bone weakened area and at the weld between the steel beam and the beam-end connecting plate.

3.5.2. Comparison of Seismic Performance between Demountable RCS Joints and Cast-in-Place RCS Joints

Figure 18 compares the hysteretic loops and skeleton curves of RCS-J0 and RCS-J1, with key parameters summarized in Table 4. For the beam-through joint in RCS-J0, the steel beam passes entirely through the reinforced-concrete column, causing more pronounced pinching due to bond–slip between the steel and concrete under cyclic loading. In contrast, RCS-J1 exhibits a faster increase in load-carrying capacity with drift ratio, reaching peak load at about 1.0% drift, while RCS-J0’s load capacity peaks at a 2.7% drift ratio—47.72% lower than RCS-J1. Additionally, RCS-J0’s ductility is only 28.20% of RCS-J1’s. Thus, RCS-J1 demonstrates a superior load-carrying capacity and deformation ability.
The equivalent energy dissipation damping ratio ξ e q is used to assess the level of energy dissipation, calculated using the formula below, with their definitions illustrated in Figure 19 [17].
ξ e q = 1 2 π S A B C + S C D A S O B F + S O D G
Figure 20 depicts the trends in accumulated energy dissipation and the evolution of equivalent viscous damping coefficients with increasing cycle numbers for both RCS-J0 and RCS-J1. Energy dissipation is defined as follows [18]:
E = S A B C + S C D A S O B F + S O D G
Due to the larger maximum drift ratio of RCS-J0, it experiences a greater number of cycles, but its high pinching effect results in smaller hysteretic loop areas, leading to significantly less energy dissipation capability compared to RCS-J1. Its accumulated energy dissipation amounts to only 83.33% of that of RCS-J1. Furthermore, the equivalent viscous damping coefficient of RCS-J1 reaches a maximum of 0.308, while that of RCS-J0 peaks at 0.245, marking a 25.71% increase.
Figure 21 shows the trends in stiffness and stiffness degradation factors for both RCS-J0 and RCS-J1 as the number of cycles increases, separately indicating positive and negative direction cycles with both showing good symmetry. In this case, the secant stiffness is used to evaluate the stiffness degradation of structural components, which can be calculated using the following formula [19]:
k i = F i Δ i
In which k i represents the secant stiffness during the i positive or negative loading cycle, F i denotes the maximum positive and negative load values during the i loading cycle, respectively, and Δ i represents the displacements corresponding to the positive and negative peak loads in the i loading cycle, respectively. Compared to RCS-J0, RCS-J1 boasts a significantly higher initial stiffness, approximately four times that of the conventional joint.
Figure 22 and Figure 23 illustrate the evolving trend in strength degradation coefficients for both RCS-J0 and RCS-J1 as the number of cycles increases. To reflect the degradation characteristics of load-bearing capacity, a strength degradation coefficient λ i is introduced, defined as follows [19]:
λ i = F j i F j 1
where F j i represents the peak load during the i cycle of the j loading level, and F j 1 is the peak load during the first cycle of the j loading level. Here, i = 2. The strength degradation λ i initially decreases and then increases as the displacement grows. Prior to reaching the peak load capacity, the strength degradation rate is rapid. However, in the later stages of loading, due to severe damage to the specimen, the decline in load-bearing capacity becomes less evident. RCS-J0 demonstrates a higher rate of strength degradation.

4. Analysis of Demountable RCS Joint Parameters

4.1. Parameter Design

By performing parametric studies on the validated finite element model, we explore the influence patterns of various seismic parameters on the seismic performance of this demountable RCS joint. The RCS-J1 is chosen as the object of study, and the detailed specimen parameters are presented in Table 5.

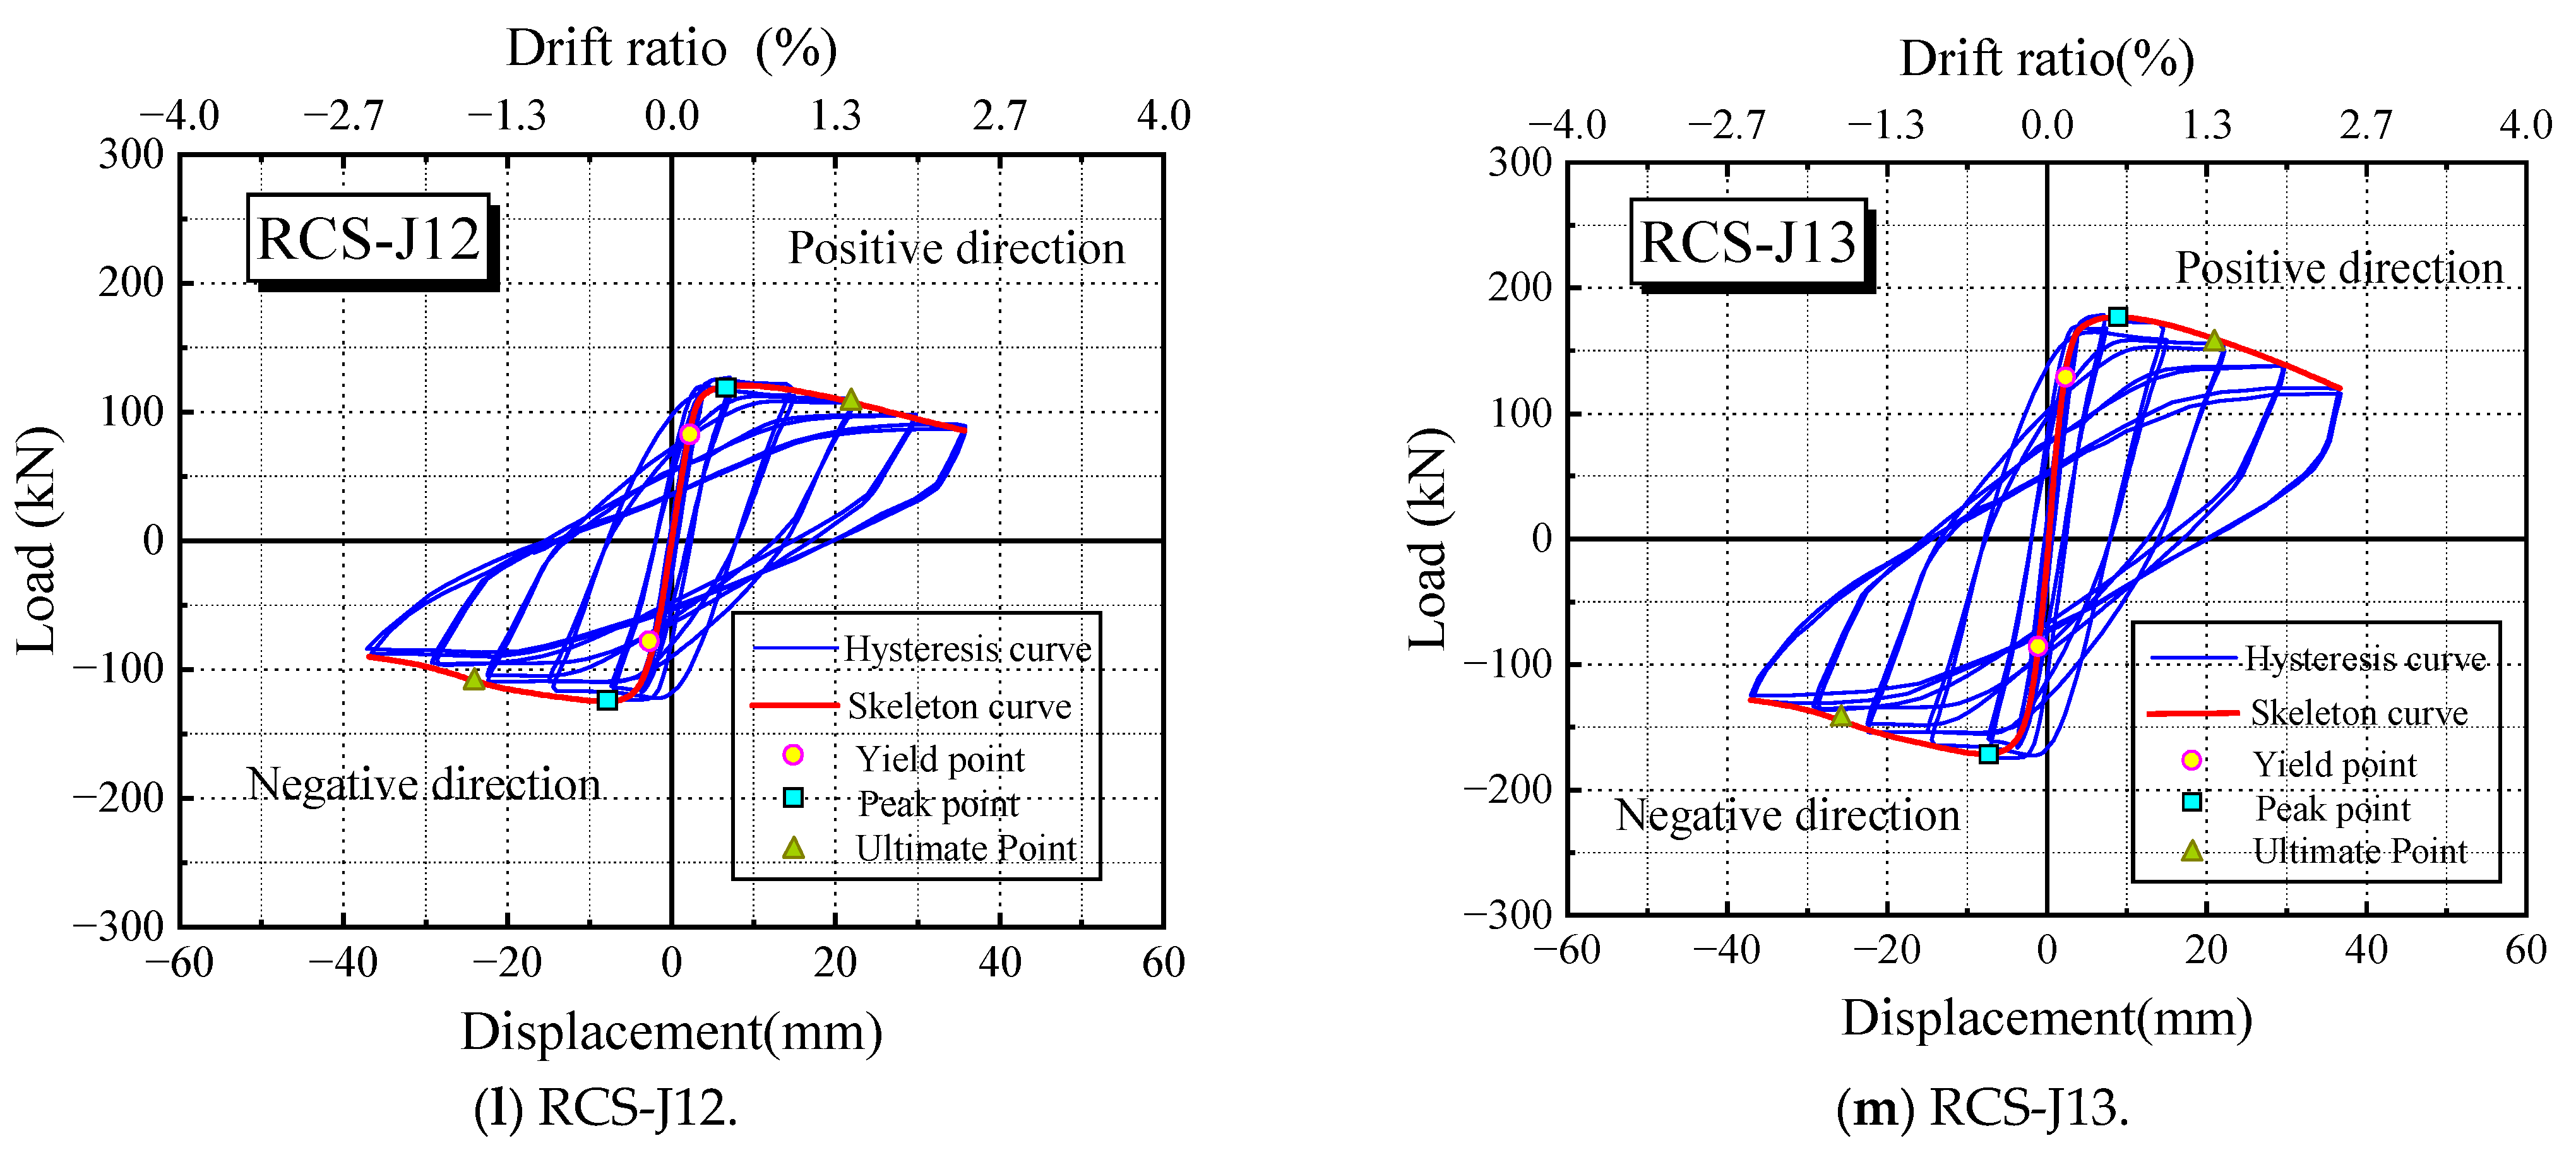
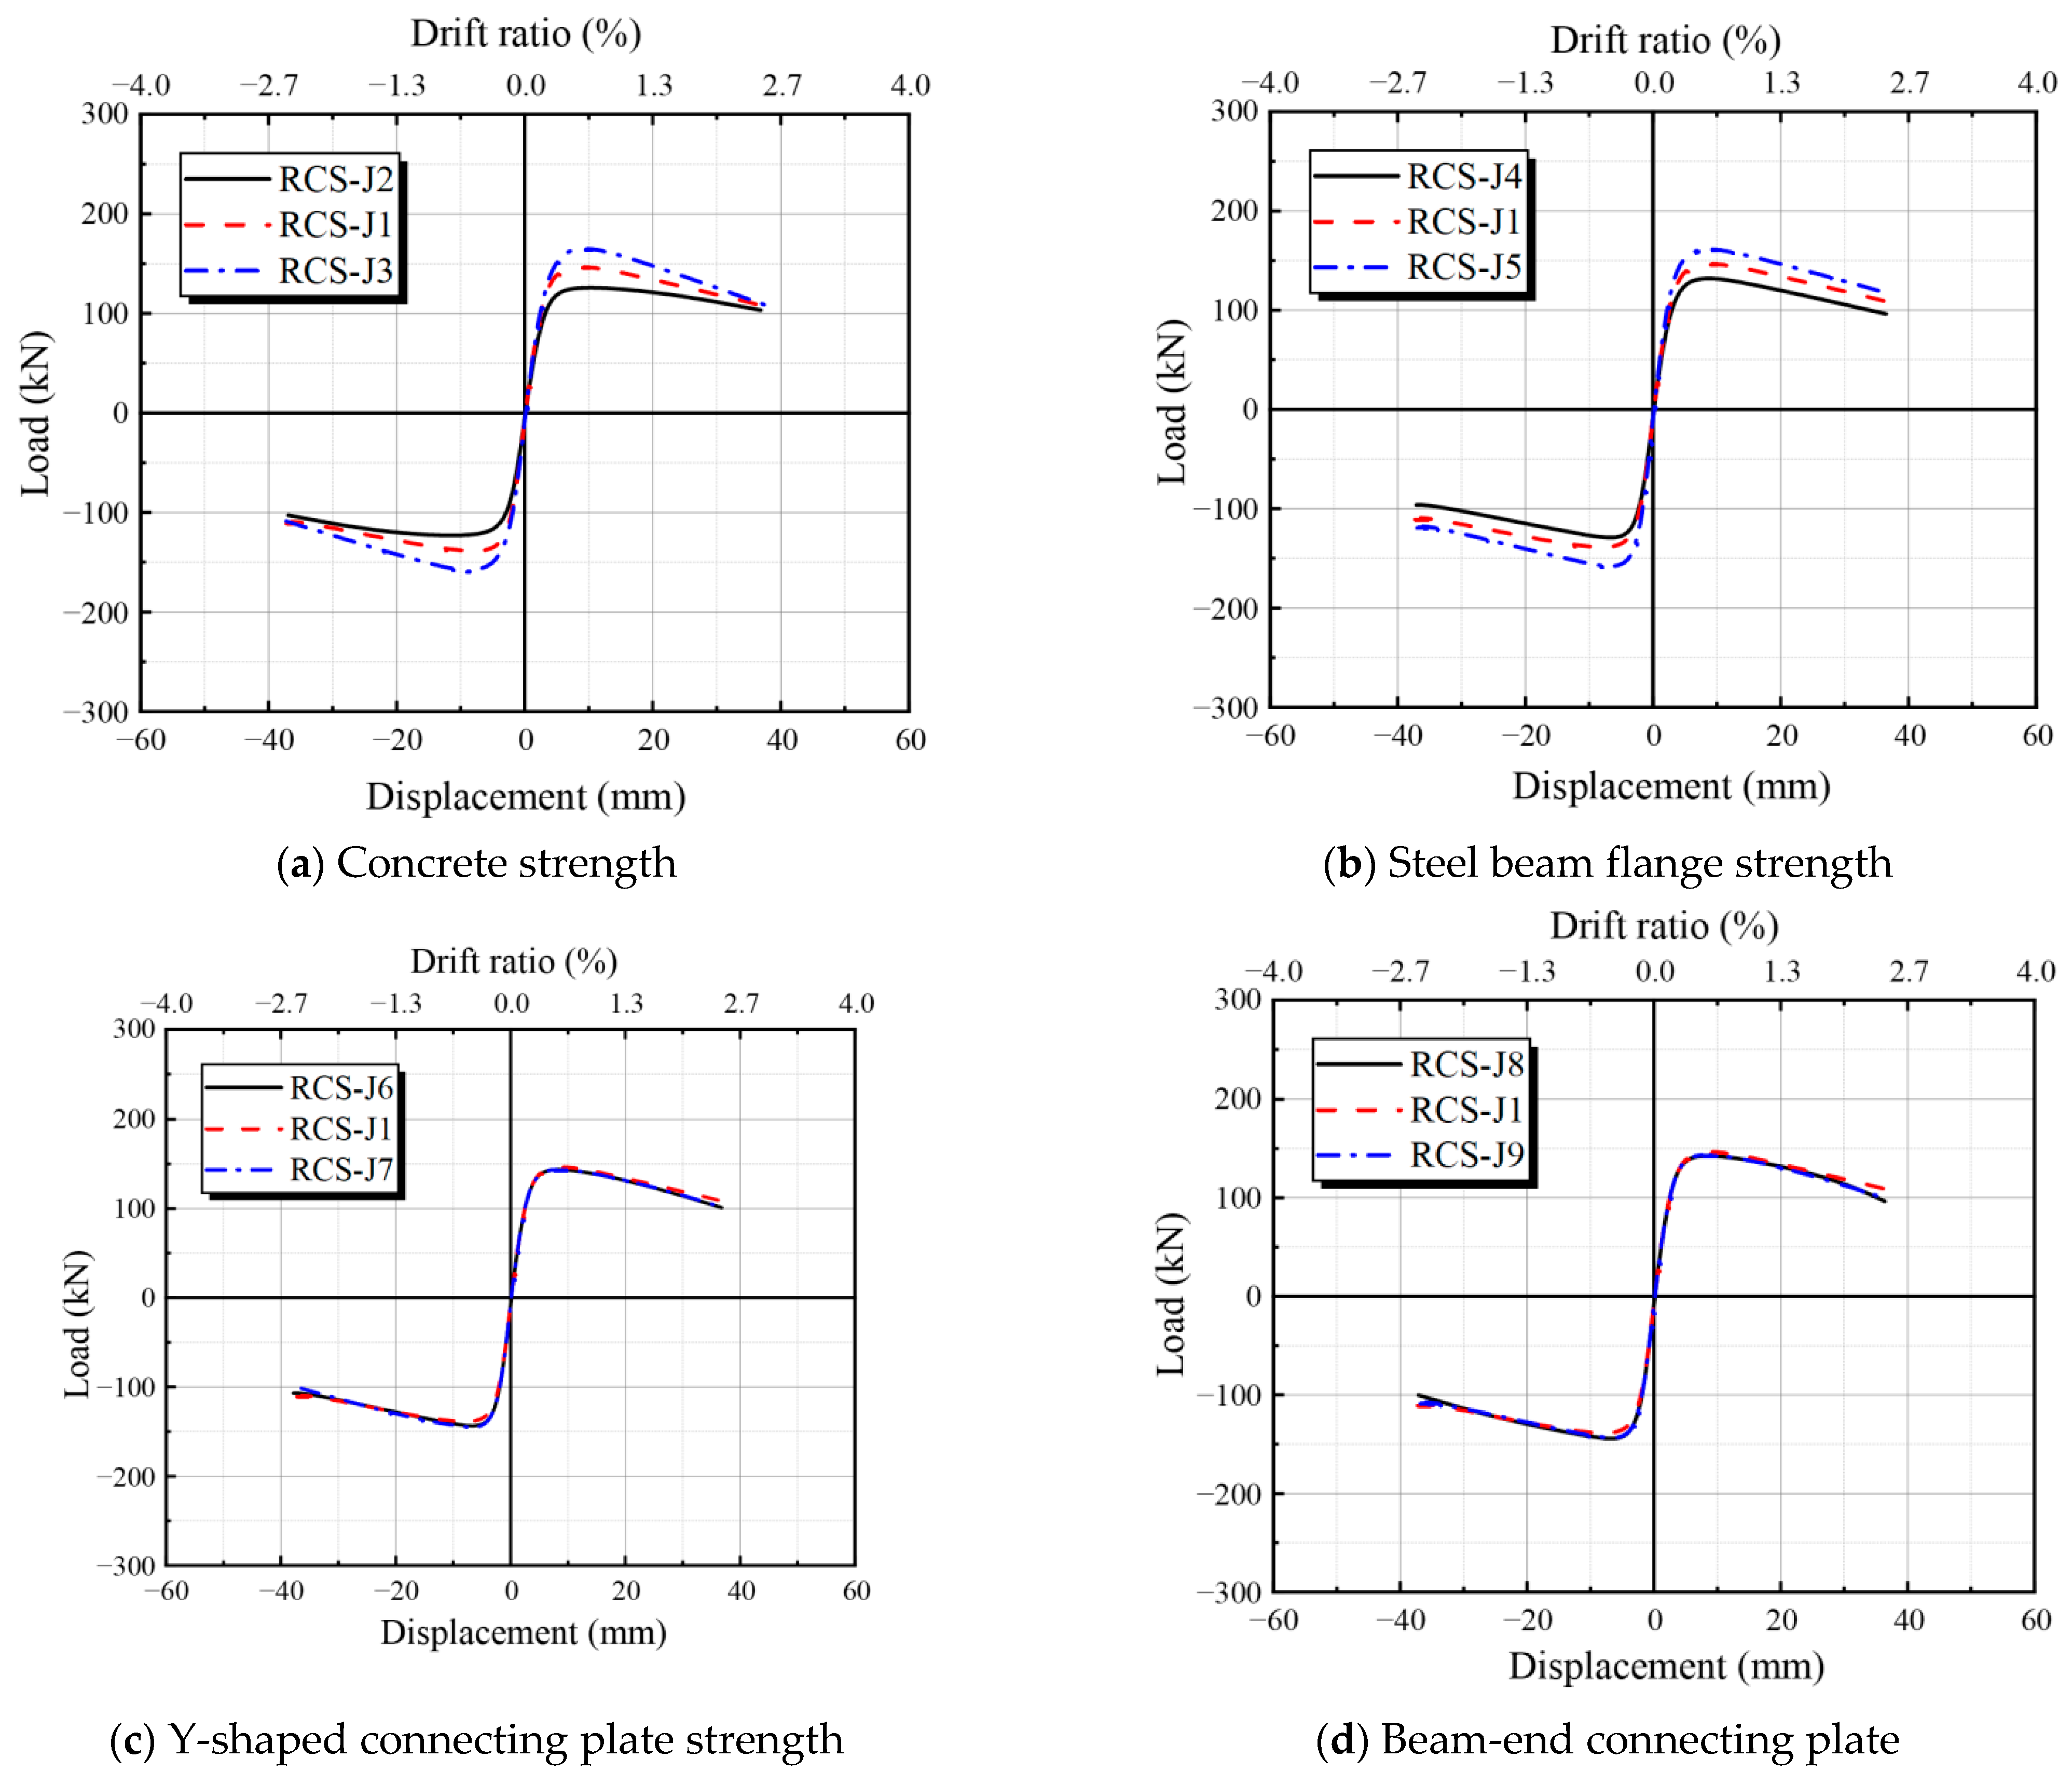
4.2. Analysis of Hysteresis Loops under Different Parameters

Figure 24 presents the hysteresis loops for each joint, with key parameters like equivalent yield point, peak point, and maximum drift ratio summarized in Table 6. All specimens exhibit noticeable pinching effects in their hysteresis loops due to bond–slip between the cover plate and the concrete column. Each specimen undergoes three main stages:
(1)
Elastic Stage: This occurs from the start of loading until a drift ratio of approximately 0.8%, where the lateral load-carrying capacity increases linearly with displacement. The hysteresis loop area is small, and no cracking is observed in any specimen.
(2)
Plastic Stage: Beyond a drift ratio of 0.8%, the specimens enter the plastic stage, with the lateral load-carrying capacity peaking around a 1.0% drift ratio.
(3)
Failure Stage: When the drift ratio exceeds 1.0%, concrete spalling in the joint core, reinforcement yielding, and steel beam deformation lead to a decline in lateral load-bearing capacity. Failure is defined as the point when load-carrying capacity drops to 85% of the peak load.
The hysteresis loops can primarily be categorized into three major classes based on their shapes:
  • Bow-shaped: Specimens including RCS-J1, RCS-J2, RCS-J3, RCS-J6, RCS-J7, RCS-J8, RCS-J9, RCS-J12, and RCS-J13. These loops are relatively full, with a gentle descent, demonstrating good energy dissipation and deformation capabilities.
  • Shuttle-shaped: The high longitudinal reinforcement ratio specimen like RCS-J11. Due to its increased longitudinal reinforcement ratio, this shows a shuttle shape as its load-bearing and deformation capacities are significantly enhanced.
  • Butterfly shaped: The low longitudinal reinforcement ratio specimen like RCS-J10. This type of specimen has a steeper post-peak decay stage.

4.3. Comparative Analysis of Skeleton Curves under Different Parameters

Figure 25 illustrates the comparison of skeleton curves under different parameters, while Figure 26 shows the positive and negative load capacities and their averages. All specimens exhibit similar trends: they first enter a linear elastic stage, then transition to a plastic stage as displacement increases. After reaching the peak, strength, stiffness, and lateral load capacity decline due to cumulative concrete damage and local yielding of the reinforcement and steel beams.
An increase of 20 MPa in concrete strength leads to a 30.38% enhancement in specimen load capacity, although this is accompanied by a decrease of 31.78% in the ductility factor due to the brittleness associated with high-strength concrete. Specimen load capacity also increases with enhancements in the flange strengths. Specimens with a yield strength of 460 MPa demonstrate approximately 20% higher load capacity compared to those with a yield strength of 235 MPa. Furthermore, an increase in reinforcement ratios proportionally enhances specimen load capacity; however, the over-provision of longitudinal bars can limit joint deformation, thereby reducing ductility. The bearing capacity of the specimen decreases with the increase in the weakening area of the flange. The peak bearing capacity of the specimen with larger weakening area is the lowest, and the increase in the weakening area leads to the failure of the steel beam more easily.

4.4. Ductility Analysis of Specimens under Different Parameters

The deformation capacity of the structure is assessed using the ductility coefficient, defined as the ratio of the ultimate displacement Δ u to the yield displacement Δ y . Additionally, the deformation capability of the specimens is evaluated through the ultimate drift ratio, calculated as the ratio of the ultimate displacement Δ u to the column’s calculated height, H = 1500 mm. The ductility coefficients and ultimate drift ratios for each specimen are illustrated in Figure 27.
It is found that the ductility coefficient and ultimate drift ratio of RCS-J2 are increased by 17.94% and 34.36% compared with RCS-J1. The increase in the ratio of longitudinal reinforcement can greatly improve the deformation ability of the specimen.
To sum up, using low strength concrete within the bearing capacity design range and appropriately increasing the ratio of longitudinal reinforcement can significantly improve the deformation ability of RCS joints, and avoid brittle failure caused by excessive axial pressure at the column end in practical engineering.

4.5. Comparison of Accumulated Energy Dissipation and Equivalent Viscous Damping Coefficients under Various Parameters

As the displacement increases, the area of the hysteresis loops expands, and the number of cycles completed by each specimen is positively related to energy dissipation. Except for specimens with different concrete strength grades (RCS-J2, RCS-J3), the energy dissipation in the early stage of each group is similar. The trend in single-cycle energy dissipation is closely aligned with the development of the equivalent viscous damping coefficient, and the accumulated energy dissipation is simply the sum of the dissipations in individual cycles.
As shown in Figure 28a and Figure 29a, the concrete strength increases from C20 to C60, its cumulative energy consumption increases by 49.74%, and its peak equivalent viscosity coefficient increases by 39.45%. As can be seen from Figure 28b and Figure 29b, the flange strength of the steel beam increases from 235 MPa to 460 MPa, and its cumulative energy consumption increases by 62.93%. Comparing Figure 28c,d and Figure 29c,d, it is found that changes in the strength of the Y-shaped connecting plate and beam-end connecting plate have almost no influence on the hysteretic ability of nodes. Because the longitudinal reinforcement has a more significant bending action under cyclic load, the increase in the reinforcement ratio of the longitudinal reinforcement is more effective in improving the energy dissipation capacity of the joint, and its cumulative energy consumption increases by 90.06%. As can be seen from Figure 28f, the cumulative energy dissipation of the specimen decreases with the increase in the weakening area of the flange.

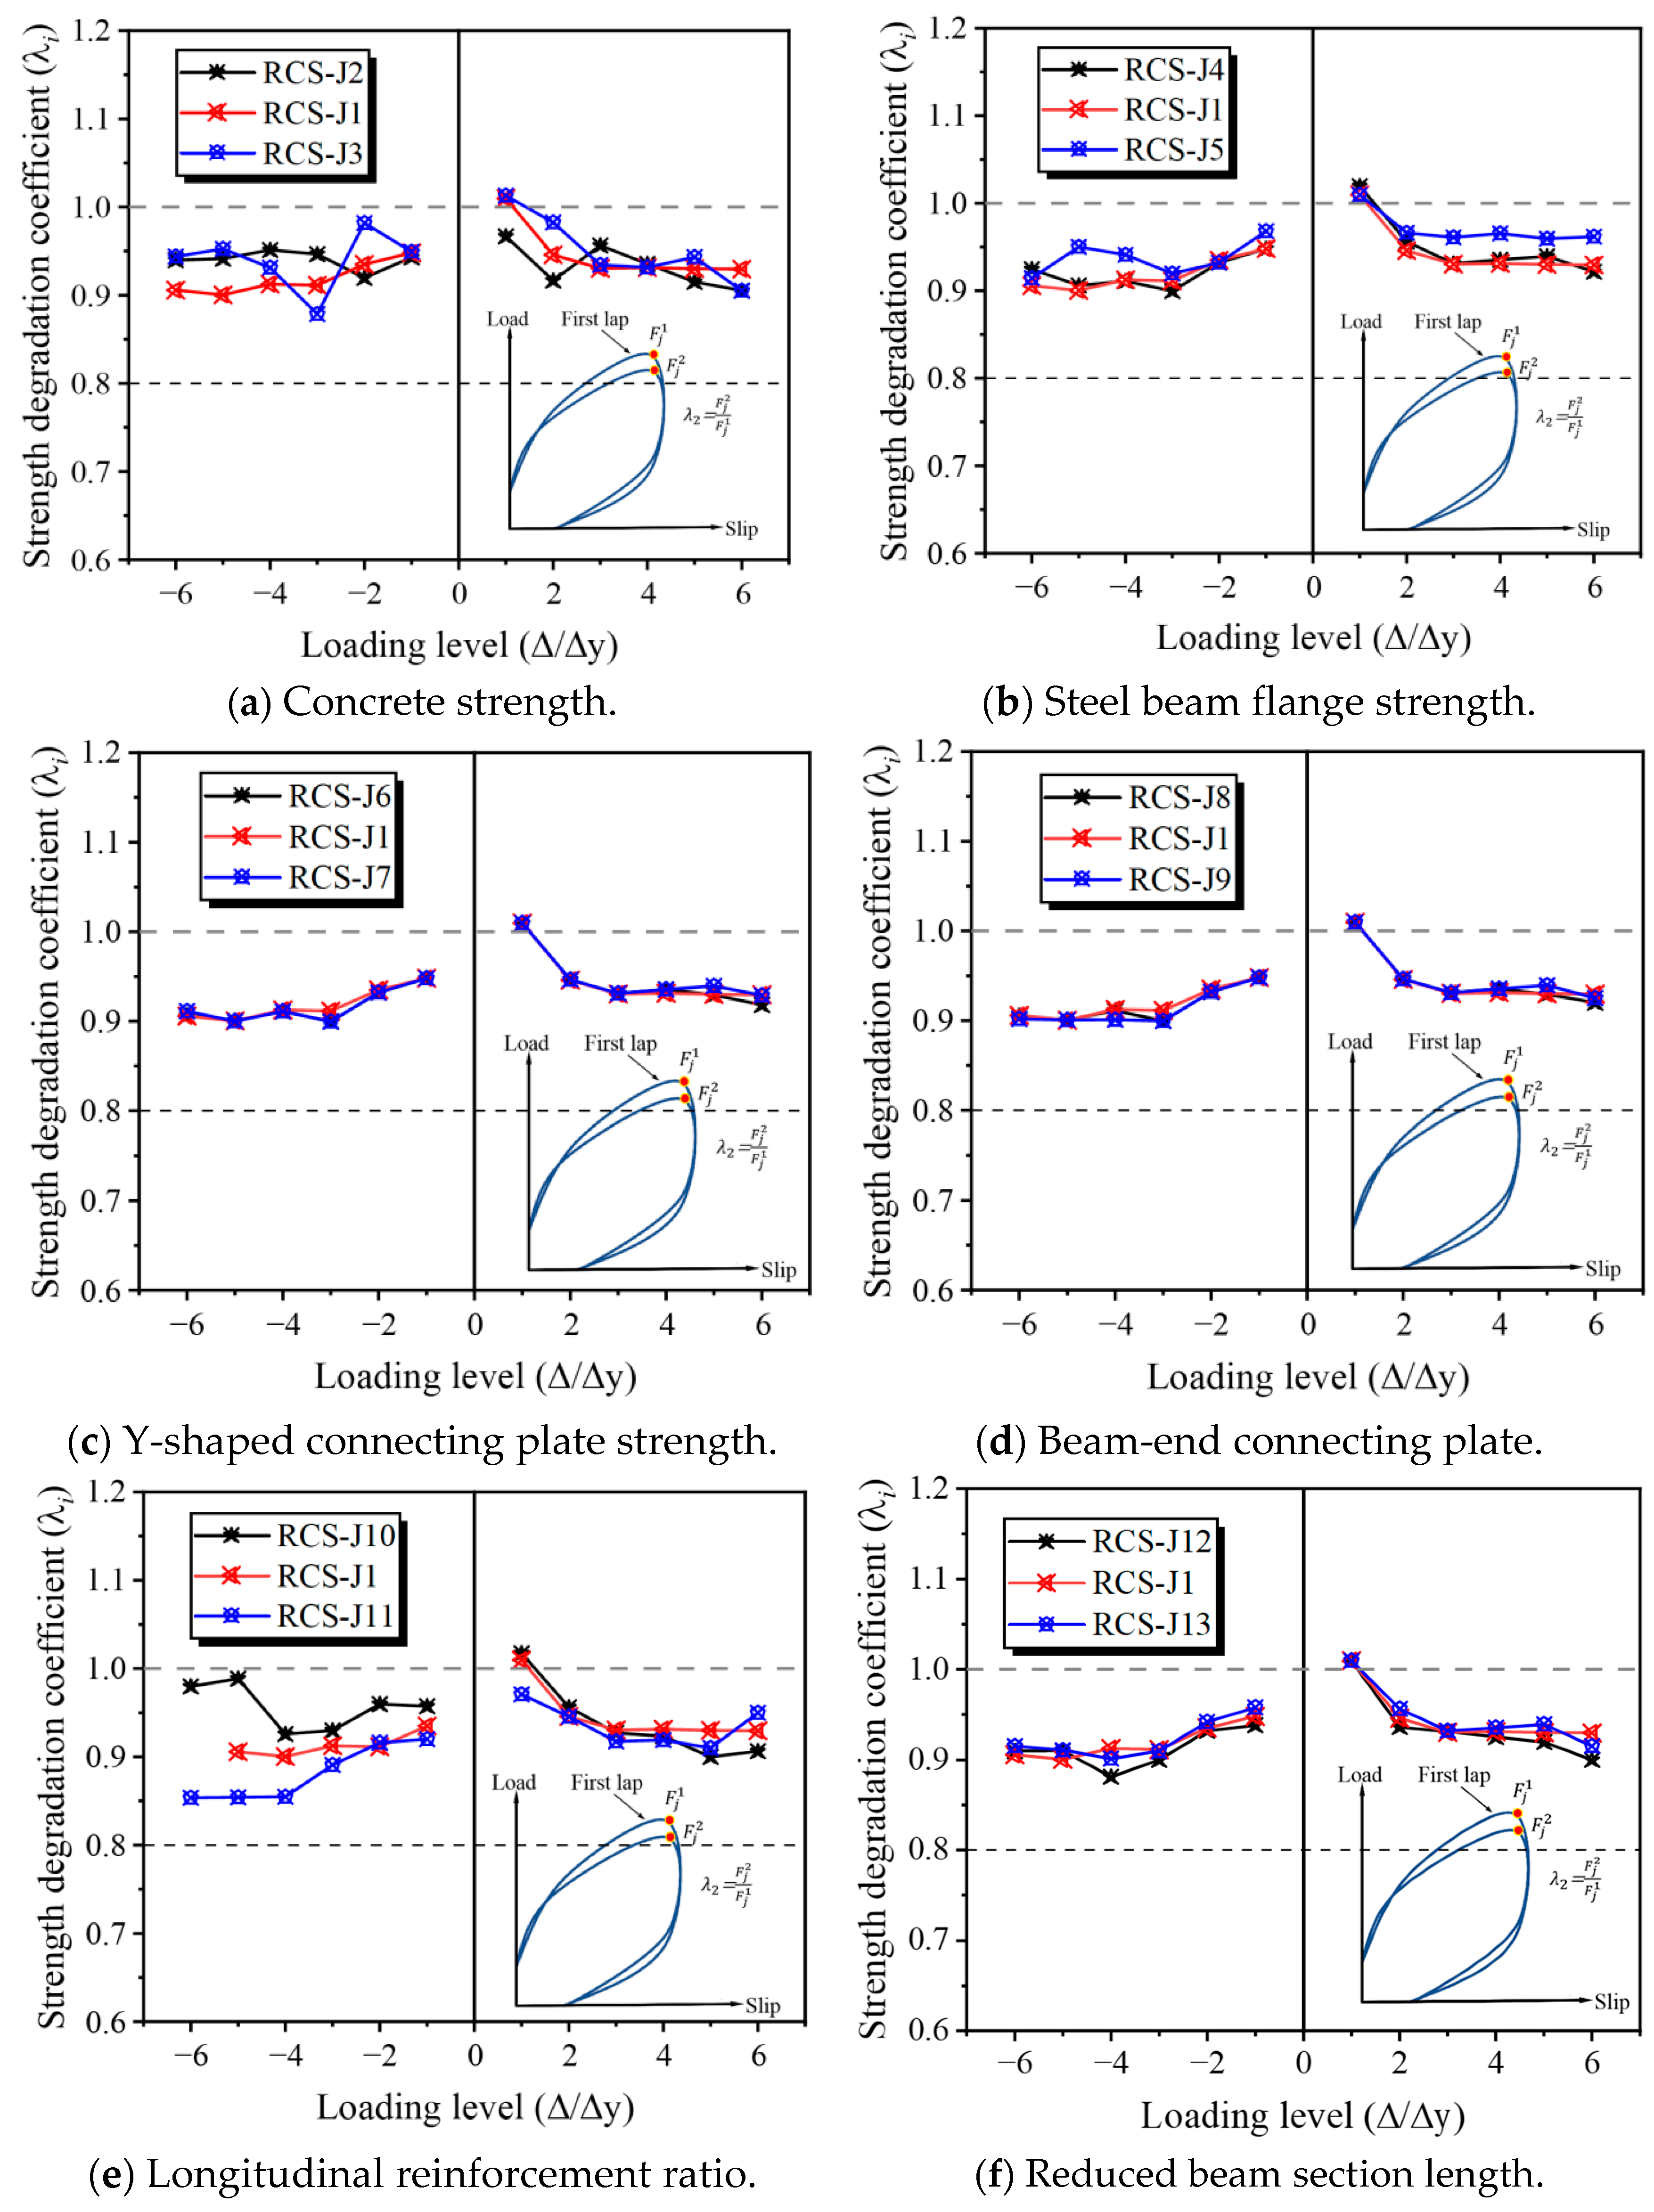
4.6. Analysis of Strength Degradation for Each Specimen

Figure 30 shows the change trend in the strength degradation of RCS joints with the increase in cycle number under different parameters. As can be seen from Figure 30a, the brittleness of high-strength concrete leads to the obvious degradation of its strength after cracking failure, and its minimum strength degradation coefficient is 0.872. Figure 30b–d show the influence of steel beam flange strength, Y-shaped connecting plate strength and the beam-end connecting plate on joint strength degradation. The research results show that the influence of the above parameters on strength degradation can be ignored. The increase in longitudinal reinforcement ratio can delay the rate of strength degradation and improve the degree of strength degradation of the specimen. As can be seen from Figure 30f, the weakening of the flange area has no obvious effect on the strength degradation coefficient of the specimen.
In general, the strength and degradation coefficient decrease first and then increase with the increase in displacement, and the strength degradation rate is faster before the specimen reaches the peak bearing capacity, while the bearing capacity degradation is not obvious due to the serious damage of the specimen at the later stage of loading.

5. Environmental Impact over the Entire Life Cycle

5.1. Carbon Emissions Inventory for the Novel Demountable Structure

At the end of their life cycle, reinforced-concrete structures are decomposed into steel and concrete components. In China’s construction industry, only about 40% of construction steel and 50–60% of concrete is recycled, with the remainder often used as landfill, leading to significant resource waste and increased carbon emissions. This highlights the inadequacy of current construction methods in supporting environmental protection policies. The novel demountable RCS joints designed in this study aim to reduce environmental impact by quantifying the potential benefits of demountable steel structures. The primary failure mode in this structure is the fracture of the weld between the steel beam flange and the beam-end connecting plate, leaving the rest of the structure intact. Since the steel beams can be reused without significant deformation or damage, resource consumption and carbon emissions from producing new components are significantly reduced, thereby minimizing environmental pollution.
According to the Equation (17), the carbon emission factors of the four joints are calculated and counted. Among them, the cast-in-place RCS joint and the cast-in-place reinforced-concrete joint need to remove the concrete according to the Equations (18) and (19) after the end of the whole life cycle to calculate the additional carbon emission, while the demountable RCS joint and the cast-in-place steel structure do not need to be disassembled and can be reused, in which the carbon emission of the steel structure according to the ‘carbon emission calculation standard’ should be calculated according to 50% of the carbon emission of the alternative material. At the same time, the carbon emissions caused by the transportation of the specimens and the use of machinery during installation by workers are ignored. Only the carbon emissions during the production and dismantling stages of each specimen are statistically analyzed.
C S C = i = 1 n M i F i
E C C = i = 1 n Q c c , i f c c , i
f c c , i = j = 1 m T B i , j R j + E j j , i
In the formula, C S C —carbon emissions during the building materials production phase; M i —consumption of the i-th major building material; F i —carbon emission factor of the i-th major building material; E C C —energy consumption in building demolition stage; Q c c , i —the quantity of the i-th demolition project; f c c , i —the energy consumption coefficient of each unit of measurement for the i-th demolition project; T B i , j —the i demolition project unit engineering quantity j construction machinery consumption; i—project serial number in demolition project; j—construction machinery serial number.
The material requirements for the two joints, based on the design size of the specimens, are detailed in Table 7. The carbon emission factors are 301.528 kgCO2e/m3 for C40 non-pumping concrete and 2350 kgCO2e/t for hot-rolled carbon steel. Considering a 50-year life cycle for the four joints, the carbon emissions are as follows: 170.81 kgCO2 for the cast-in-place RCS joint, 181.35 kgCO2 for the cast-in-place reinforced-concrete joint, 71.89 kgCO2e for the demountable RCS joint, and 130.43 kgCO2 for the cast-in-place steel structure joint. As shown in Figure 31, although the cast-in-place joints have lower carbon emissions during the production stage compared to demountable RCS and steel structure joints, their higher emissions during the demolition stage—particularly due to concrete—pose significant environmental challenges, impeding resource reuse.

5.2. Policy Recommendations

China’s construction industry contributes to over 50% of the nation’s carbon emissions, with 2.6 billion tons generated during the production and transportation of building materials. To achieve the “dual carbon” goals, it is crucial to develop and use sustainable building materials. Comparing cast-in-place and demountable RCS joints shows that, after multiple reuse cycles, demountable joints have significantly lower carbon emissions than commonly used prefabricated structures. These joints also play a key role in environmental protection by reducing construction waste, particularly non-degradable concrete [20].
As a leading infrastructure nation, China must promote the use of sustainable and recyclable materials to reach carbon neutrality [21]. The experience of other countries highlights the importance of comprehensive policy and regulatory frameworks in advancing building materials and managing construction waste. Currently, China lacks sufficient regulations for demountable RCS joints [22]. There is an urgent need to improve policy tools, enhance efficiency, and strengthen the guiding role of policies in the construction industry to support sustainable development [23].
Resource utilization enterprises are vital in transforming construction waste into reclaimed resources and promoting sustainable demountable structures like RCS joints. Macro-management policies should regulate the market supply of sustainable building products, including financial subsidies, grants, tax reductions, and incentives [24]. These policies should focus on clean production, technological advancements, and large-scale production to increase the supply and adoption of sustainable demountable structures, thereby reducing ecological impact and lowering carbon emissions.

6. Conclusions

This research has successfully validated the finite element modeling approach for predicting the seismic behavior of demountable RCS joints, offering insights into the structural integrity and performance enhancement through a novel joint design. Key conclusions are summarized as follows:
(1)
The novel demountable RCS joint design, featuring a weakened steel beam flange, has been shown to exhibit a 1.5-fold increase in load-bearing capacity and a 3.5-fold increase in ductility compared to conventional cast-in-place joints, highlighting its superior seismic performance.
(2)
Parametric analyses revealed that the hysteretic behavior of the specimens could be categorized into three distinct patterns. With the increase in concrete strength, the bearing capacity increases by 30.38%, and the ductility coefficient decreases by 31.78%; with the increase in longitudinal reinforcement ratio, the bearing capacity of removable RCS nodes increases by 57.61%. Due to the wide range and large number of longitudinal reinforcements, the deformation capacity of the joints is constrained, and the ductility coefficient decreases by 26.50%. It can be concluded that the increase in concrete strength and reinforcement ratio of the specimens is positively correlated with the bearing capacity of the joints. The size of the weakened area of the steel beam flange is negatively correlated with the bearing capacity of the specimen, but the increase in the area improves the ductility of the specimen.
(3)
The development of cumulative energy consumption is consistent with the development trend in equivalent viscosity coefficient. The concrete strength and reinforcement ratio of longitudinal reinforcement have great influence on hysteretic properties of specimens, and the increase in the reinforcement ratio of longitudinal reinforcement has the greatest influence on hysteretic area, which increases cumulative energy consumption by 90.06%.
(4)
Comparative analysis of the carbon emissions and material usage during the production and dismantling stages of the four types of nodes reveals that the carbon emissions of the demountable RCS nodes are significantly lower than those of the other three nodes. Therefore, the novel joints proposed in this study play a crucial role in reducing carbon emissions and mitigating the environmental impact of building materials.

Author Contributions

Funding acquisition, H.W.; methodology, W.L., W.H. and H.W.; investigation, W.L., Y.Y., Z.K. and Y.W.; data curation, Y.Y.; supervision, H.W. and W.H.; writing—review and editing, W.L., Z.K. and Y.W.; writing—original draft, Y.Y. All authors have read and agreed to the published version of the manuscript.

Funding

This research was funded by the National Social Sciences Fund of China (No. 23FFXB070), Construction scientific research project of Department of Housing and Urban-Rural Development of Zhejiang Province (No. 2022K245), Zhejiang Province Public Welfare Technology Application Research Project (No. LGF22E080004), and Wenzhou Association for Science and Technology (No. kjfw34).

Data Availability Statement

The original contributions presented in the study are included in the article, further inquiries can be directed to the corresponding author.

Acknowledgments

Construction scientific research project of Department of Housing and Urban-Rural Development of Zhejiang Province (No. 2022K245), National Social Sciences Fund of China (No. 23FFXB070), Zhejiang Province Public Welfare Technology Application Research Project (No. LGF22E080004), and Wenzhou Association for Science and Technology (No. kjfw34).

Conflicts of Interest

The authors declare no conflict of interest.

References

  1. Pedrosa, B.; Buecking, L.; Veljkovic, M. Steel-reinforced resin for bolted shear connectors: Confined behaviour under quasi-static cyclic loading. Eng. Struct. 2022, 256, 114023–114045. [Google Scholar] [CrossRef]
  2. Yang, Y.M.; Yang, P.; Shu, Y. Experimental study on seismic behavior of the self-centering RCS joint with replaceable buckling restrained dampers. Eng. Struct. 2022, 261, 114288–1142300. [Google Scholar] [CrossRef]
  3. Pei, Q.J. Research on the Seismic Performance of New RCS Composite Structure Beam–Column Assemblies Under Different Axial Compression Ratios. Ph.D. Thesis, Huaqiao University, Quanzhou, China, 2016. [Google Scholar]
  4. Bai, J.L.; He, J.; Li, C. Experimental investigation on the seismic performance of a novel damage-control replaceable RC beam-to-column joint. Eng. Struct. 2022, 267, 114692. [Google Scholar] [CrossRef]
  5. Liu, X.C.; Wang, D.; Zhang, A.L. Study on the Seismic Behavior of Flange-connected L-shaped Concrete-Filled Steel Tube Columns with H-section Steel Beams using All-Bolted Connections. J. Build. Struct. 2021, 42, 98–109. [Google Scholar]
  6. Choi, H.K.; Choi, Y.C.; Choi, C.S. Development and testing of precast concrete beam-to-column connections. Eng. Struct. 2013, 56, 1820–1835. [Google Scholar] [CrossRef]
  7. Zhang, S.; Zhang, Y.; Zhang, T.; Li, X.; Ding, Y.; Jia, L. Experimental Research on the Seismic Performance of Precast Concrete-filled Tube Column to Steel Beam Connection. Joints J. Build. Struct. 2022, 43, 143–155. [Google Scholar]
  8. Wu, Y.T.; Ming, L.; Xiao, Y. Experimental study on seismic performance of assembled steel beam-prefabricated column composite frame. Joints. J. Build. Struct. 2013, 43, 66–71. [Google Scholar]
  9. Vidjeapriya, R.; Jaya, K.P. Experimental study on two simple mechanical precast beam-column connections under reverse cyclic loading. J. Perform. Constr. Facil. 2013, 27, 402–414. [Google Scholar] [CrossRef]
  10. Zhang, S.H.; Zhao, L.Z.; Jin, M.C. Experimental Study on the Seismic Performance of Assembled Steel Beam-Precast Column Composite Frames. Ind. Constr. 2023, 53, 43–51. [Google Scholar] [CrossRef]
  11. Chen, H.; Guo, Z.X.; Basha, S.H. Seismic behavior of RCS frame joints applied with high-strength bolts-end plate connection. J. Build. Eng. 2022, 63, 10545–10560. [Google Scholar] [CrossRef]
  12. Li, W.; Ye, H.; Wang, Q. Experimental study on the seismic performance of demountable RCS joints. J. Build. Eng. 2022, 49, 104082. [Google Scholar] [CrossRef]
  13. Wang, Q. Research on the Seismic Performance of Demountable Precast RCS Joints. Ph.D. Thesis, Wenzhou University, Wenzhou, China, 2019. [Google Scholar]
  14. GB 50010-2010; Ministry of Housing and Urban-Rural Development of the People’s Republic of China. Code for Design of Concrete Structures. Architecture & Building Press: Beijing, China, 2015.
  15. Cai, J.G.; Deng, Z.; Li, W. Numerical study on seismic behavior of demountable joints consisting of RC columns and steel beams. Buildings 2023, 125, 2558. [Google Scholar] [CrossRef]
  16. Chen, Z.P.; Chen, J.W.; Jiang, X.S. Experimental research and finite element analysis on seismic behavior of square reinforced concrete columns with four interlocking spirals. Structures 2022, 39, 1–16. [Google Scholar] [CrossRef]
  17. Li, W.; Wang, Z.X. Cyclic tests and finite element analysis on hybrid fiber–cement-based composite encased CFST columns. Structures 2023, 58, 10559–10572. [Google Scholar] [CrossRef]
  18. Li, W.; Wang, Z.X.; Li, L.F. Study of the Seismic Behavior of Simplified RCS Joints via Nonlinear Finite Element Analysis. Buildings 2023, 13, 2718–2730. [Google Scholar] [CrossRef]
  19. Li, W.; Wang, Z.X.; Li, L.F. Seismic performance and damage analysis of steel-PVA hybrid fiber cementitious composites encased CFST columns. J. Build. Eng. 2024, 108771–108792. [Google Scholar] [CrossRef]
  20. Chen, Y.Z. Comparative Study of Domestic and International Policies on the Utilization of Construction Waste Resources. Archit. Technol. 2019, 50, 342–345. [Google Scholar]
  21. Fu, W.Z.; Pan, Y.; Wang, D. Quantitative Research on Construction Waste Resource Utilization Policy under Background of Carbon Peak and Carbon Neutrality. Constr. Econ. 2022, 43, 562–565. [Google Scholar]
  22. Nunes, K.R.A.; Mahler, C.F.; Valle, R. Evaluation of investments in recycling centres for construction and demolition wastes in Brazilian municipalities. Waste Manag. 2007, 27, 1531–1540. [Google Scholar] [CrossRef]
  23. Zhu, X.S.; Yan, R.J. Sustainable Building Materials and Their Promotion and Application in Residential Construction. Chem. Mater. Constr. 2001, 2, 1–5. [Google Scholar]
  24. Liu, J.; Sun, R.L. Fiscal and Tax Policy Choices for Promoting and Applying Low-Carbon Buildings: A Case Study of Prefabricated Modular Buildings. Sub Natl. Fisc. Res. 2018, 1, 53–61. [Google Scholar]
Figure 1. Schematic diagram of demountable RCS joints.
Buildings 14 03071 g001
Figure 2. Schematic diagram of prototype RCS structure.
Buildings 14 03071 g002
Figure 3. Schematic diagram of prototype RCS structure (unit in mm).
Buildings 14 03071 g003aBuildings 14 03071 g003b
Figure 4. Stress–strain curve for steel.
Buildings 14 03071 g004
Figure 5. Finite element model and test failure diagram.
Buildings 14 03071 g005
Figure 6. Comparison of destructive modes.
Buildings 14 03071 g006
Figure 7. Comparison of experimental and finite element load–displacement curves.
Buildings 14 03071 g007
Figure 8. Schematic diagram of conventional cast-in-place RCS joint dimensions (unit in mm).
Buildings 14 03071 g008
Figure 9. Schematic diagram of demountable RCS joint (unit in mm).
Buildings 14 03071 g009
Figure 10. Dimensions and reinforcement details of demountable RCS joint (unit in mm).
Buildings 14 03071 g010
Figure 11. Detailed dimension of demountable RCS joint core zone (unit in mm).
Buildings 14 03071 g011
Figure 12. Detail of element types and mesh division for the demountable RCS joint.
Buildings 14 03071 g012
Figure 13. Boundary conditions and mesh division for the demountable RCS joint.
Buildings 14 03071 g013
Figure 14. Boundary conditions and mesh division for the cast-in-place RCS joint.
Buildings 14 03071 g014
Figure 15. Full displacement-controlled loading protocol.
Buildings 14 03071 g015
Figure 16. Development of concrete column damage in cast-in-place joint versus demountable RCS joint.
Buildings 14 03071 g016aBuildings 14 03071 g016b
Figure 17. Stress distribution in cast-in-place joint versus demountable RCS joint.
Buildings 14 03071 g017
Figure 18. Hysteretic loops and skeleton curves of conventional cast-in-place RCS joint versus demountable RCS joint.
Buildings 14 03071 g018
Figure 19. Definition of equivalent viscous damping coefficient.
Buildings 14 03071 g019
Figure 20. Accumulated energy dissipation and equivalent viscous damping coefficient.
Buildings 14 03071 g020
Figure 21. Stiffness and stiffness degradation factors.
Buildings 14 03071 g021
Figure 22. Illustration of strength degradation coefficient.
Buildings 14 03071 g022
Figure 23. Strength degradation coefficient.
Buildings 14 03071 g023
Figure 24. Load–displacement hysteresis loops.
Buildings 14 03071 g024aBuildings 14 03071 g024bBuildings 14 03071 g024c
Figure 25. Load–displacement skeleton curves for demountable RCS joints.
Buildings 14 03071 g025aBuildings 14 03071 g025b
Figure 26. Positive and negative bearing capacity of removable RCS joints.
Buildings 14 03071 g026
Figure 27. Ductility coefficient and ultimate drift ratio of demountable RCS joints.
Buildings 14 03071 g027
Figure 28. The cumulative energy consumption of each specimen.
Buildings 14 03071 g028
Figure 29. The single cycle energy consumption of each specimen.
Buildings 14 03071 g029aBuildings 14 03071 g029b
Figure 30. Strength degradation of each specimen.
Buildings 14 03071 g030
Figure 31. Carbon emissions generated using construction production cycles. Note: CRCS represents cast-in-place RCS joint, DRCS represents demountable RCS joint, CRC represents cast-in-place reinforced-concrete, CST represents cast-in-place steel structure.
Buildings 14 03071 g031
Table 1. Summary of comparison between experiment and simulation.
Loading DirectionYield Load
py/kN
Yield Displacement
Δy/mm
Peak Load Δu/kNPeak Displacement   p u / mm   Ductility μ
TestNegative −65.64−13.44−87.52−50.003.72
Positive65.7610.9287.6850.004.58
FEMNegative −71.64−7.84−95.52−50.006.38
Positive73.647.9595.1950.006.29
Table 2. Specifications of steel joint specimens.
Specimen NumberColumn Cross-Section (mm)Beam Cross-Section (mm)Column Height (mm)Beam Length (mm)Concrete Strength (MPa)Axial Ratio (%)
RCS-J0250 × 250236 × 140 × 6 × 8150030004020
RCS-J1250 × 250150030004020
Table 3. Steel joint specimen specifications.
Steel TypeYield Strength (MPa)Tensile Strength (MPa)Young’s Modulus (GPa)
Q355366470206
HRB400465639200
Table 4. Ultimate load and displacement ductility coefficient.
SpecimenLoading DirectionEquivalent Yield PointPeak PointUltimate PointDuctility FactorUltimate Drift Ratio (%)
Δ y e q P y e q Δ p P p Δ u P u μθ
RCS-J0Positive15.3980.0637.4099.8047.0984.082.513.18
Negative25.2181.0836.92100.1048.1885.10
RCS-J1Positive3.39128.307.11149.1024.64126.808.901.63
Negative2.31122.706.93146.2024.18124.20
Table 5. Parameters of demountable RCS joint.
ParametersSpecimen NumberConcrete Strength (MPa)Axial Ratio (%)Yield Strength (MPa)Spacing of Bars (mm)Beam FlangeY-Shaped Connecting PlateReduced Beam Section
FlangeWebY-Shaped Connecting PlateBeam-End Connecting PlateStirrupsLongitudinal Reinforcement
Standard test pieceRCS-J1402035535535535510012810200
Concrete strengthRCS-J2202035535535535510012810200
RCS-J3602035535535535510012810200
Steel beam flange strengthRCS-J4402023535535535510012810200
RCS-J5402046035535535510012810200
Y-shaped connecting plate strengthRCS-J6402035535523535510012810200
RCS-J7402035535546035510012810200
Beam-end connecting plateRCS-J8402035535535523510012810200
RCS-J9402035535535546010012810200
Longitudinal reinforcement ratioRCS-J1040203553553553551008810200
RCS-J11402035535535535510020810200
Reduced beam section lengthRCS-J12402035535535535510012810220
RCS-J13402035535535535510012810180
Table 6. Ultimate loads and displacement ductility factors.
SpecimenLoading DirectionEquivalent Yield PointPeak PointUltimate PointUltimate Drift Ratio (%)
Δ y e q P y e q Δ p P p Δ u P u θ
RCS-J1Positive3.63133.47.11149.124.64126.81.63
Negative2.26121.96.93146.224.18124.2
RCS-J2Positive3.66114.57.24129.031.7109.62.19
Negative2.8586.97.24125.334.14106.5
RCS-J3Positive4.20152.38.07168.221.58143.01.45
Negative2.45131.47.45160.721.93136.6
RCS-J4Positive3.63120.07.11134.223.98114.11.59
Negative2.26109.87.47131.823.86136.9
RCS-J5Positive3.63146.77.11164.023.98139.41.59
Negative2.26134.37.47161.123.86136.9
RCS-J6Positive3.63133.47.11149.123.65126.81.58
Negative2.26122.07.47146.423.86124.5
RCS-J7Positive3.63133.47.11149.123.65126.81.58
Negative2.26122.07.47146.423.86124.5
RCS-J8Positive3.63133.47.11149.123.65126.81.59
Negative2.26122.07.47146.424.33124.6
RCS-J9Positive3.36133.47.11149.123.65126.81.59
Negative2.26122.07.47146.423.86124.5
RCS-J10Positive3.18118.47.14131.420.62111.71.40
Negative1.81109.57.03128.121.42108.9
RCS-J11Positive3.13187.38.19207.126.63176.01.81
Negative2.50175.411.47200.027.81170.0
RCS-J12Positive2.86113.47.32126.828.08107.71.91
Negative3.10103.77.78124.529.15105.8
RCS-J13Positive3.63160.07.11178.923.65152.11.59
Negative2.26146.57.47175.724.19149.4
Table 7. Summary of concrete and steel material usage and carbon emission factors for different joints.
Joints NameConcrete Usage (kg)Steel Usage (kg)Concrete Carbon Emissions (kgCO2e/m³)Steel Carbon Emissions (kgCO2e/t)Concrete Demolition Carbon Emissions (kgCO2e/m³)
Cast-in-place RCS joint2305330.1562.2875.38
Demountable RCS joint2309315.0856.810
Cast-in-place joint3581045.123.50112.75
Steel joint01850130.430
Disclaimer/Publisher’s Note: The statements, opinions and data contained in all publications are solely those of the individual author(s) and contributor(s) and not of MDPI and/or the editor(s). MDPI and/or the editor(s) disclaim responsibility for any injury to people or property resulting from any ideas, methods, instructions or products referred to in the content.

