Abstract
Dynamic compaction (DC) represents a cost-effective method for reinforcing subgrade and is particularly suited to treating large-scale building subgrade. Nevertheless, the effect of DC reinforcement on high groundwater level (HGL) subgrade remains uncertain due to the lack of clarity surrounding the energy transfer mechanism of DC in HGL subgrade. In this paper, an outdoor model test of HGL subgrade was conducted based on the DC method. The temporal evolution of the internal transverse and vertical dynamic stresses in soil under different water levels, energy levels, and tamper weight conditions was monitored, and the DC mechanism of HGL subgrade was described from the perspectives of the dynamic stress waveform, peak development, and attenuation. On this basis, a novel methodology for assessing the extent of subgrade reinforcement through the utilization of impulses was put forth, thereby facilitating a more precise evaluation. The results showed that the HGL is obstructive in DC energy transfer. The peak dynamic stress, depth of impact and maximum impulse per unit area were markedly diminished when tamping the water surface. The study results also recommend that construction could expand the application range of the DC method and provide engineering suggestions for the selection of construction parameters and subsequent building construction.
1. Introduction
In recent years, with the expansion of coastal cities, the continuous advancement of port construction, and the large-scale development and utilization of coastal areas and the sea, a large number of blowing and reclaiming artificial subgrade and reclaimed land projects have appeared more often for the construction of buildings, airports, ports and so on [1,2]. These construction projects are characterized by their large scale, the high groundwater level, and the fluctuation of water levels due to tidal influence, which makes subgrade treatment difficult and leads to nonuniform settlement of the subgrade. Buildings constructed on such subgrade are also frequently susceptible to uneven settlement. Considering the construction period and construction cost, the DC method has the advantages of easy operation, good effect, strong economy, and a shorter construction period when dealing with similar large-scale subgrade; this method has been gradually and extensively applied to the treatment of coastal high groundwater level (HGL) subgrade [3,4].
Dynamic compaction (DC) is an effective subgrade strengthening method, first applied by L. Menard [5] in 1969 to strengthen the subgrade of seaside buildings in the south of France. It improves the bearing capacity of the subgrade by impacting the subgrade with heavy weights, which densifies the soil particles and reduces the porosity [6,7,8,9]. The DC method gradually extended its application to the treatment of a wide range of subgrades, such as gravelly soils, sandy soils, low-saturated clay soils, etc. [10,11,12,13,14].
However, the DC method applied to the HGL subgrade often results in a decrease in bearing capacity at a later stage and an unstable reinforcement effect due to the high groundwater level and the influence of tides. This is due to the fact that the interaction mechanism between the groundwater level and the subgrade during the DC process is not well understood, so there is also related literature on this subject [15,16,17]. Martin [18] noted that pore water functions as a lubricant in the interparticle contact area, and the soil behaves more smoothly and is more compliant. Zhang et al. [19] assessed the variation in superporous water pressure in field tests with the groundwater level occurring at 2.1 and 3.5 m below the ground surface. A comparison was performed, and it was concluded that the higher the groundwater level is, the smaller the increment in the single-tamping superporous water pressure. Zhou [20] suggested, in a numerical investigation on the zone of improvement for dynamic compaction of sandy ground with a high groundwater table, that the major effect occurs below the high groundwater level and the effective improvement depth is obviously decreased. Jia [21] investigated the temporal variation in the vertical dynamic stress at different depths at the first tamp and the pore water variation under HGL conditions and concluded that pore water plays a conflicting role in determining the compaction effect. Since the effect of shallow groundwater levels remains to be explored and quantified, Kundu [22] observed that the crater depth was greater in the groundwater level model than in the dry soil model, but the improvement depth was more significant for dry sand. This shows that the role of water should be further explored, and the internal response of the treated soil must be investigated.
The distribution of dynamic stresses on the DC process can suitably reflect the internal response of the soil and is considered directly related to the final reinforcement effect. Many scholars have investigated the impact on soil behavior through the study of dynamic stresses [23,24,25,26,27]. Chow [28] introduced a simplified model of the one-dimensional fluctuation equation for loosely granular soils in the tamping process by introducing stress wave propagation in the soil, which in turn can facilitate predicting the effective reinforcement depth. Fattah [29], in his study of the impact response of saturated dry dense sand, found that the amplitude of the force–time course was reduced by about 10 to 22% under saturated conditions, as the pores were filled with water resulting in fewer contact points between the particles. In contrast, the transverse dynamic stress and the spatial–temporal distribution trend of stress waves during the continuous DC process of HGL subgrade have been rarely confirmed experimentally.
Since the dynamic stress distribution and impact mechanism of the DC method for HGL subgrade have not been adequately studied, there remain problems in construction, such as uncertainty in parameter selection, uncertainty about the criteria for stopping tamping, and uncertain energy transfer and dissipation trends, which seriously hinders the application of the DC method in HGL subgrade. These research gaps comprise the motivation behind this study. In this study, we conducted a DC test of sandy soils with different groundwater levels with an outdoor model, monitored the energy application of the tamper and the bidirectional earth pressure inside the tamped HGL subgrade soil, and investigated the effects of different tamper weights, energy levels, and groundwater levels on the compaction effect. We described the spatial distribution and consumption of DC stress waves in HGL subgrade in terms of waveforms and attenuation, proposed a method to assess the reinforcement effect within the soil body by impulses, and gave construction recommendations based on the results of this study. The findings of this study can inform the design of buildings with HGL subgrade, as well as expand the application of the DC method to enhance subgrade treatment. Furthermore, they can provide engineering recommendations for the selection of construction parameters and subsequent building construction.
2. Materials and Methods
2.1. Similarity Ratio
This model considers seven parameters: tamping energy (E), tamper weight (W), crater depth (S), number of tamps (N), tamper diameter (D), dry density (γd), and groundwater level height (H). According to similarity theory and dimensionless analysis [30], these physical quantities can be expressed via Equation (1).
With the use of W and D as independent physical quantities, Equation (2) can be established as:
From Equation (2), each similarity index can be obtained as follows:
Two energy levels representative of the engineering were selected for the test. The similarity coefficient of the model length (ratio = 1:12) can finally be determined by considering the actual site and construction scheme. The similarity coefficients of the other physical quantities can be obtained from these aspects. In order to facilitate a focused investigation, two of the most prevalent energy levels in construction were selected for analysis. Table 1 shows the comparison of prototype and model parameters.

Table 1.
Prototype and model parameters.
2.2. Materials and Test Equipment
The test site was situated in Jinzhong City, Shanxi Province, which is characterized by the presence of loess remnants, hills, and eroded mesas on the surface. The soil in the immediate vicinity of the test site is classified as self-weighted wet subsidence loess. In this experiment, Douluo sand from China was selected as the test material. Sandy soils display favorable permeability characteristics and are highly sensitive to changes in water levels. Figure 1 illustrates the particle size distribution curve, which was determined using the sieving method. The basic soil properties listed in Table 2 were in accordance with the standard for soil testing method GB/T50123-2019 (The Ministry of Water Resources 2019) [31].
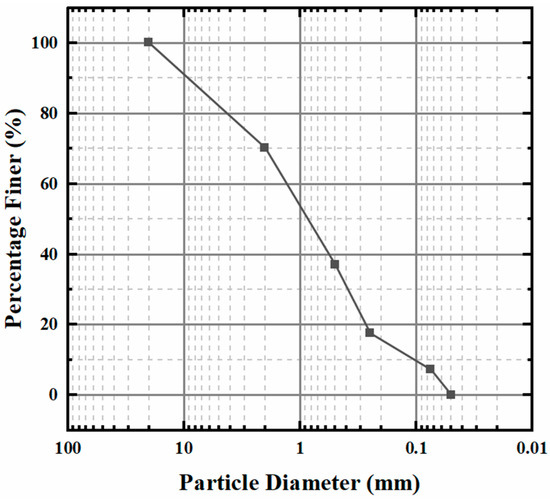
Figure 1.
Particle size distribution curve.
Table 2.
Soil test parameters.
In the Table 2:
Poisson’s ratio: Elastic constant reflecting the transverse deformation of the material
C: Cohesion
φ: Angle of internal friction
ρ: Soil density
ω: Water content of soil
Ip: Plasticity index
To eliminate the boundary effect of the model box sidewalls on the test, a soil pit with a side length of 1.2 m was used. The glass side walls of the traditional model box were discarded in this test, which reduced the influence of the side walls on the results. The uniformity of the fill was ensured by controlling two key variables: the thickness of the layers and the quality of the soil in each layer. The sand was distributed into eight 100 mm thick layers. A geomembrane with a thickness of 400 g/m2 was placed on the pit walls to simulate a fixed water level. A water level monitor was buried in the corner of the pit, which detected the water level in real-time and monitored the changing water level. As the water level rose to the surface, it began to pump at a steady rate.
The tamping point was located at the center of the model pit. To avoid damage to the instrument due to tamper impacts, the first layer of sensors was located 300 mm below the soil surface, with a depth interval of 100 mm and a horizontal interval of 150 mm between the two rows. As shown in Figure 2, the monitoring points in the same horizontal layer were designated by depth as L1, L2, and L3, respectively, whereas those in the same column were labelled by distance from the center as C1, C2, C3, and C4, respectively. Bidirectional dynamic stress sensors were embedded at each monitoring point.
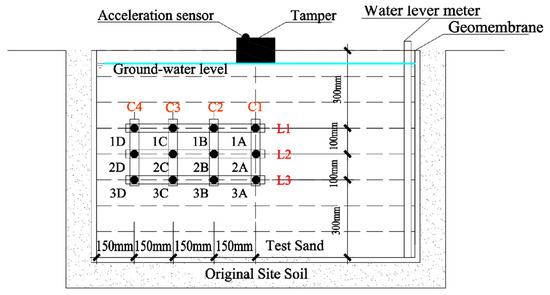
Figure 2.
Full model configuration.
After the soil was backfilled, water was added to the pit at a constant rate and left for 3 h until the water level had stabilized and levelled to a predetermined level error of 1 cm, after which compaction was initiated.
The tamper acceleration sensor and soil pressure sensors used in this test were calibrated and suitable for dynamic and water-filled environment measurements. The tamper acceleration sensor shown in Figure 3 had a diameter of 15 mm, a height of 30 mm, and a measuring range of 1000 g. The soil pressure sensor shown in Figure 4 had a diameter of 28 mm, a thickness of 6.5 mm, with a maximum measuring range of 5 MPa directly below, while the other soil pressure sensors had a maximum measuring range of 2 MPa. The measurement accuracy was less than or equal to 0.3% of the full scale (F-S). During the soil pressure sensor burial, fine-grained soil was used to eliminate the influence of large sand grains on the soil pressure measurements.
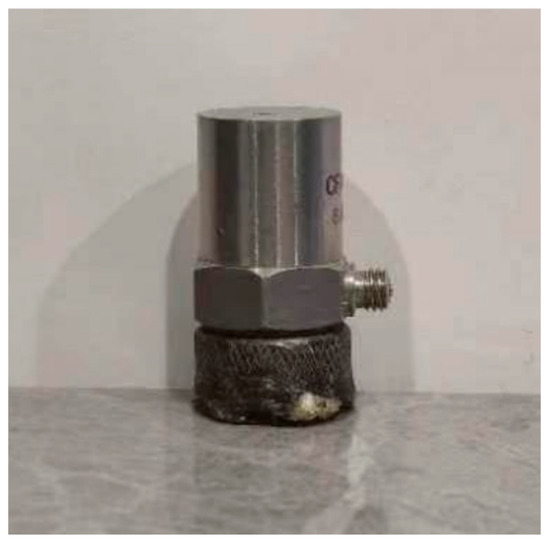
Figure 3.
Tamper acceleration sensor.
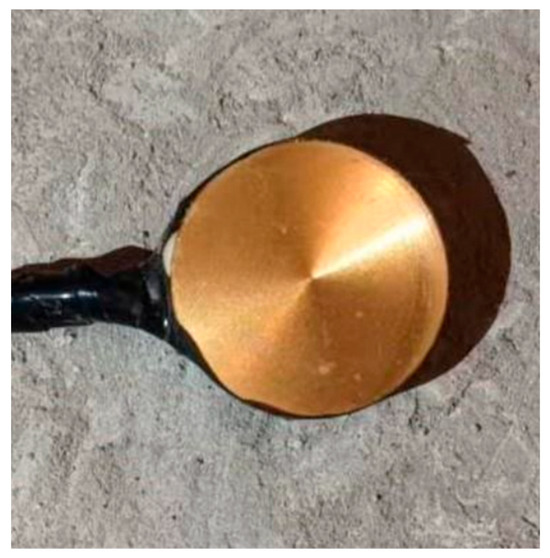
Figure 4.
Soil pressure sensors.
2.3. Test Program and Monitoring Point Arrangement
To study the influences of different factors on the reinforcement effect of DC on coastal HGL subgrade, three types of variables, namely, energy level, tamper weight, and groundwater level at different heights from the ground surface were considered in this study. The specific model parameters are listed in Table 3.
Table 3.
Model parameters.
3. Results
3.1. Dynamic Stress Waveform Analysis
The dynamic stress waveforms induced within the soil during DC were shock waves and oscillatory damping waves. The transverse dynamic stress and vertical dynamic stress directly below the tamper were mainly manifested as shock stress waveforms in Figure 5 and Figure 6, which had a single wave peak and a very short duration of action. The propagation direction was outward from the vibration source, and the mass vibration direction was the same as the wave propagation direction. There were small-amplitude stress fluctuations after the equilibrium state was restored at Point c. Away from the tamping point, the waveform gradually changed from a shock wave to an oscillatory attenuation wave. Figure 7 shows the lateral dynamic stress waveform in the W1 group at Point 2D, where oscillatory damping waves and secondary wave peaks can be observed.
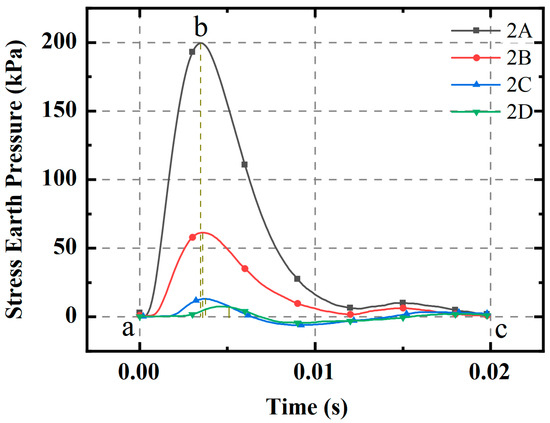
Figure 5.
L2 of vertical stress propagation in Group D1 (10th) (a: starting time; b: peak time; c: end time).
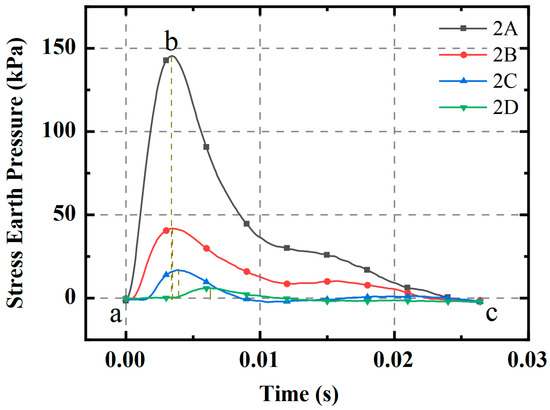
Figure 6.
L2 of vertical stress propagation in Group W1 (10th) (a: starting time; b: peak time; c: ending time).
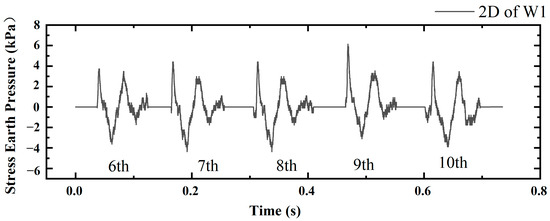
Figure 7.
Dynamic lateral stress waveform in Group W1.
There was a clear time lag in the dynamic stress response at the different soil depths. A comparison of Figure 5 and Figure 6 revealed that the peak dynamic stress emerged with a gradual delay from the near tamping point to the far point. The interval time increased in a sequential manner, while the stress duration decreased gradually. Sections a–b before the peak were significantly shorter than Sections b–c after the peak. As shown in Figure 5 and Figure 6, before the peak point, the tamper produced an accelerated motion with decreasing acceleration, and Sections a–b in Groups D and W showed a similar pattern. However, there were notable differences in the b–c section curves, with Group W exhibiting a longer curve than Group D, particularly after 0.01 s. Additionally, the presence of the water table resulted in a smoothing effect on the decay trend in group W. This buffering effect hindered the transmission of stress waves.
3.2. Peak Dynamic Stress Development Analysis
Figure 8 and Figure 9 display the variation in the peak vertical dynamic stress concerning the number of tamps at the 2A point of Groups D1, D2, W1, and W2, respectively. As demonstrated in Figure 8, the curves show comparable trends, as confirmed by the peak dynamic stress curves of the different groups. The peak dynamic stress in Group D increased with an increase in tamping numbers, and a hard crust layer formed at the bottom of the tamping crater, which remained stable after a certain number of tamps.
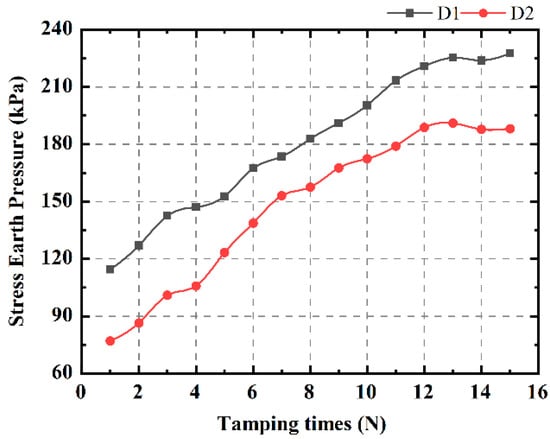
Figure 8.
Variation curve of 4000 kN·m dynamic stress with tamps for Group D.
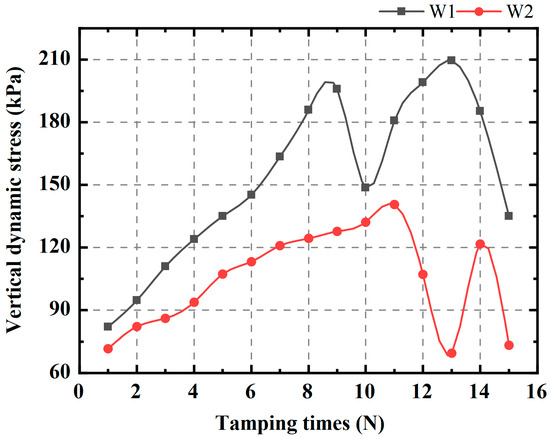
Figure 9.
Variation curve of 4000 kN·m dynamic stress with tamps for Group W.
Group W demonstrated a divergent trend from Group D. As illustrated in Figure 9, the local water level continuously rose due to the vibration caused by tamping, eventually reaching the bottom of the tamping crater (as shown in Figure 10). When the tamper face dropped down to collide with the water level surface, the peak dynamic stress decreased, due to the fact that the energy transferred from the tamper to the soil was consumed first by the water level at the bottom of the crater. For the same reason, the vertical dynamic stress in Group W was less than that observed in Group D. On the 10th and 13th tamps, the water level in the W1 and W2 groups respectively rose to reach the bottom of the crater. Tamping caused peak dynamic stress dissipations of approximately 22.6% in Group W1 and up to 50.7% in Group W2.
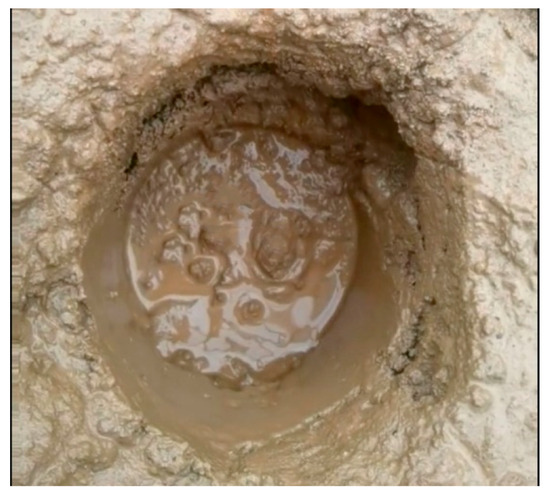
Figure 10.
View of the bottom of the tamping crater in Group W1 (10th).
Continuing to tamp after lowering the water level at this juncture nevertheless maintained the peak dynamic stresses. This evidence demonstrates the importance of maintaining the distance between the surface being tamped and the surface of the water table in construction work. However, as the water level rose to the surface, the tamper collided with it, causing the crater wall to collapse and deform. As shown in Figure 11, significant local liquefaction was observed at the bottom of the crater. This collision resulted in a sudden decline in dynamic stress. Since this tamping failed to effectively transfer stress, the dynamic stress peak decreased, and water gushed out of the crater. At this point, DC struggled to generate a strengthening effect on HGL subgrade.
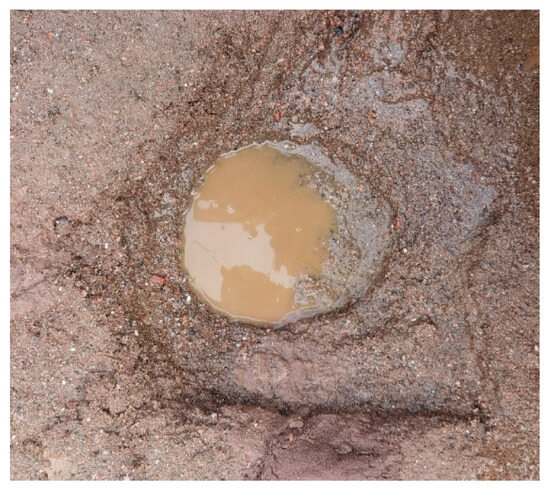
Figure 11.
Tamping crater collapse diagram in Group W1 (14th).
3.3. Two-Way Dynamic Stress Peak Analysis
To study the propagation of dynamic stresses during DC comprehensively, we observed the variations of dynamic stresses along both the vertical and transverse directions within the soil in tests D3, W4, and W5.
Figure 12 presents the ratio of vertical and transverse dynamic stresses at central monitoring point 2A in the three sets of tests. The impact point was situated directly above Point 2A. The peak value and growth of the vertical dynamic stress were significantly greater than those of the transverse dynamic stress, resulting in a higher ratio that showed an upward trend. In Group D, the ratio of the peak vertical and transverse dynamic stresses at Point 2A increased up to 38, while in Group W, the ratio of the maximum peak dynamic stresses at the same point only increased 11 times. This occurred because the vertical dynamic stresses were previously known to be lower in Group W than in Group D, while the transverse dynamic stresses were higher in Group W due to the oscillatory effect of the water level. Therefore, the ratio was lower.
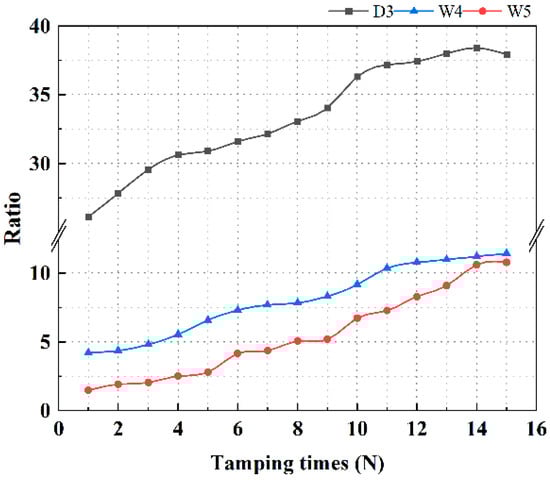
Figure 12.
The ratio of longitudinal and transverse peak dynamic stresses at point 2A.
Figure 13, Figure 14 and Figure 15 illustrate the changes in vertical and transverse dynamic stress ratios as the number of tamps in the L2 layer increased in tests D3, W4, and W5. Contrary to Figure 12, these ratios at points 2B, 2C, and 2D decreased in turn. The dynamic stress in the transverse direction increased more than in the vertical direction as the number of tamps increased. This was due to the fact that the vertical dynamic stress decreased in a uniform manner as the distance between the monitoring point and the ramming point increased. In contrast, the horizontal dynamic stress was at its lowest directly below the tamping point, increasing within a certain distance away from the tamping point.
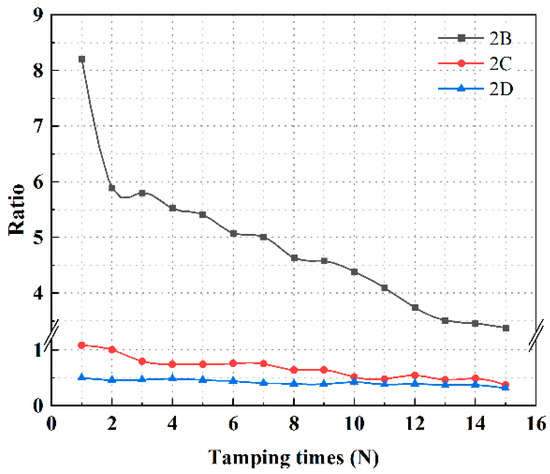
Figure 13.
The ratio of peak of longitudinal and transverse dynamic stresses in group D3.
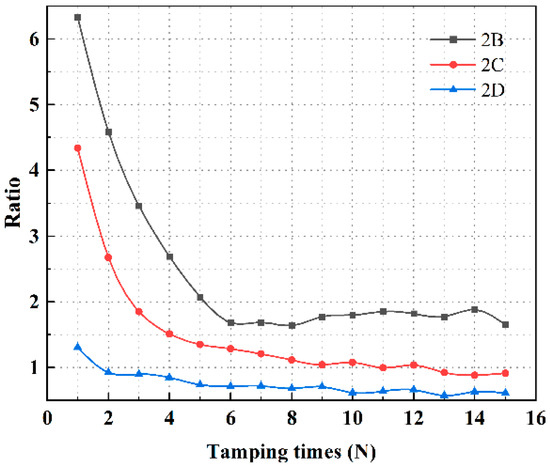
Figure 14.
The ratio of peak of longitudinal and transverse dynamic stresses in Group W4.
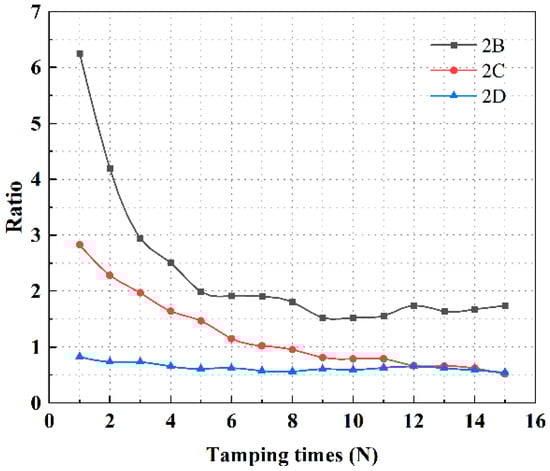
Figure 15.
The ratio of peak of longitudinal and transverse dynamic stresses in Group W5.
When comparing Groups D3, W4, and W5, it was found that the effect of transverse reinforcement in Group W was higher than in Group D. This effect was exacerbated in the case of the high groundwater level, leading to an increase in the oscillatory effect of the water level after impact and, consequently, an enhancement of the transverse dynamic stress peak. The above analysis shows that in the DC process, the soil directly below the tamping point was mainly compacted along the vertical direction, while the soil diagonally below the tamping point was subjected to both vertical compaction and transversal crowding, and the transverse effect was more pronounced in the case of HGL subgrade.
3.4. Attenuation Analysis
3.4.1. Analysis of Water Level Height on Attenuation Rate
As the edge points were significantly influenced by other factors and the dynamic stresses were largely eliminated, they were not representative. Therefore, C4 was excluded from the subsequent transfer analysis. During the propagation of dynamic stress, a significant dissipation phenomenon occurred. The dynamic stress decreased rapidly from 200 to 300 kPa to less than 10 kPa from the 1A point to a depth of 500 mm within the model pit range. Table 4 presents the statistical results of the interlayer loss rate for the full range of tamps in Groups D and W, totaling eight groups. Regarding the variance in the loss rate, the soil surface loss showed high volatility. The L3 range exhibited the highest stability of attenuation rate, while the stability of Group D loss was greater than that of Group W loss. In Group D, the highest loss rate was found in the middle of the second layer within the monitoring range.
Table 4.
Descriptive statistics of the attenuation rate.
Additionally, the variances at Points 2B–2C, 3A–3B, and 3B–3C were all below 0.002, and the most stable propagation area occurred at an oblique angle of 45°. The losses in the L1 layer of Group W were lower, at 39.6%. This phenomenon happened because the dynamic stress in the L1 layer was affected by the water level and occurred when the ground was not adequately reinforced. Additionally, the variance indicated that points 3A–3B were the most stable, indicating that the propagation process was more stable in regions where the water level was less affected by tamping.
Figure 16 and Figure 17 show the transverse damping in Groups D3 and W5 for an even number of tamps. The attenuation rate increased uniformly with the number of tamps. The attenuation rate in Group W increased consistently from 65.94% during the second tamping to 87.17% during the 12th tamping within a 30 cm range. The attenuation rate in Group W fluctuated after the local water level rose to reach the bottom of the pit.
Figure 16.
Attenuation of transverse dynamic stress in group D3.
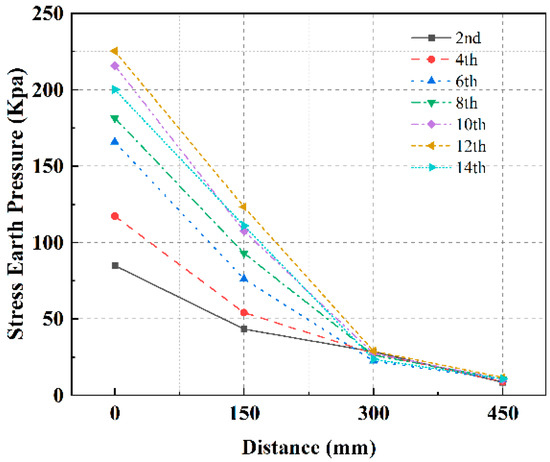
Figure 17.
Attenuation of transverse dynamic stress in the W5 group.
3.4.2. Analysis of Tamper Weight on Attenuation Rate
The tamper weight is a crucial DC parameter that significantly impacts the reinforcement effect. In this study, we used four sets of D1D2 and W1W2 to investigate the effect of the tamper weight on HGL subgrade and the resulting reinforcement effect. Figure 18 and Figure 19 illustrate the variation in peak dynamic stress under vertical and transverse attenuation during the fifth tamper in the four test sets. Figure 18 illustrates that the peak dynamic stress was higher in Group D than in Group W. Sensor L1 responded more significantly to the dynamic stress produced by the light tamper until the groundwater level reached the bottom of the tamping crater. However, when the stress wave propagated to a depth of 400 mm, the average attenuation rate of the light tamper was as high as 61.38%, at which time the dynamic stress of the light tamper had decreased to less than that of the heavy tamper. The data indicate that the vertical dynamic stress loss rate was higher for the light tamper. Additionally, the light tamper exhibited a lower attenuation rate in transverse propagation, as shown in Figure 19. Therefore, during construction, a light tamper is more suitable for reinforcing shallow soil, while a heavy tamper has a greater influence on the depth of reinforcement.
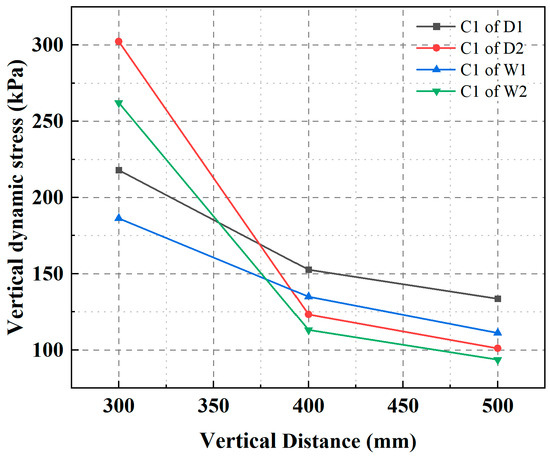
Figure 18.
Vertical center point attenuation of light and heavy tampers for the 5th.
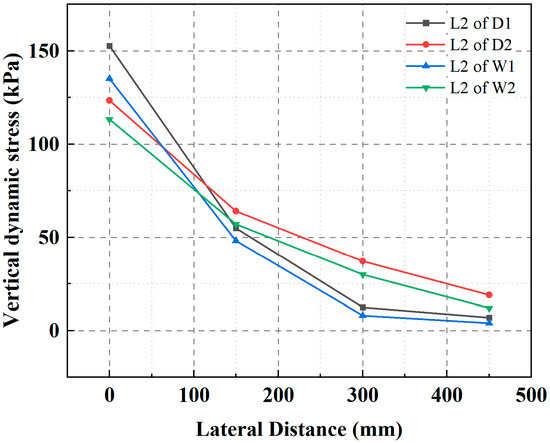
Figure 19.
Light and heavy tamper lateral attenuation of the second layer for the 5th.
Using the heavier tamper resulted in a more intense vibration, as shown in Figure 9 which precipitated a more rapid ascent of the water table to the surface. This indicates that while the heavy tamper improved reinforcement in deeper layers, it also disturbed the effect of soil reinforcement earlier due to rising water levels. When constructing HGL subgrade reinforced by DC construction, it is important to comprehensively assess both the groundwater level and reinforcement energy factors to select tamper parameters. To ensure safety, the groundwater level should be continuously monitored during construction and lowered when necessary. A combination of light and heavy tamper construction methods should be used, with more tamping rounds and fewer tamps per round.
4. Discussion
The DC is divided into two phases with different mechanisms depending on whether the tamper contacts the groundwater or not. Rising water levels at the bottom of the tamping crater have a significant cushioning effect on the tamper, which affects the energy input. The buffering effect can be explained from the perspectives of the tamper and the subgrade. When the tamper collides with the soil, energy is transferred through compacted soil and fluid–solid coupling. However, when tamping in the HGL subgrade, energy is transferred directly to the water body, resulting in a dangerous situation of splashing soil and stones. Therefore, it is necessary to analyze the input and acceptance of energy.
4.1. Energy Input Analysis
The DC method applies energy to the soil through the free fall of a weight. The tamper acceleration time–course curve records the tamper’s entire course from the beginning of the impact to the final stabilization. According to Newton’s second law:
The peak impact force of the tamper can be determined by multiplying its mass with its peak acceleration. To calculate the average stress at the bottom of the tamper, use the following formula:
The time–course curves in Figure 20 and Figure 21 display the average peak dynamic stresses for Groups D and W. The curves represent a typical triangular impulse load, calculated from the tamper accelerometer time–range curve with Equations (4) and (5).
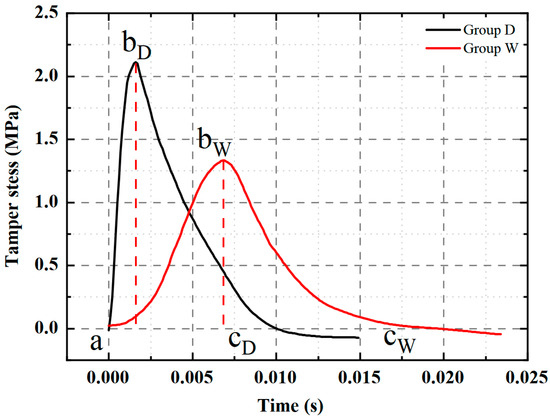
Figure 20.
Dynamic stress curve of tamper (a: Starting time; b: Peak time; c: Zeroing time; Corners marks: Corresponding Group).
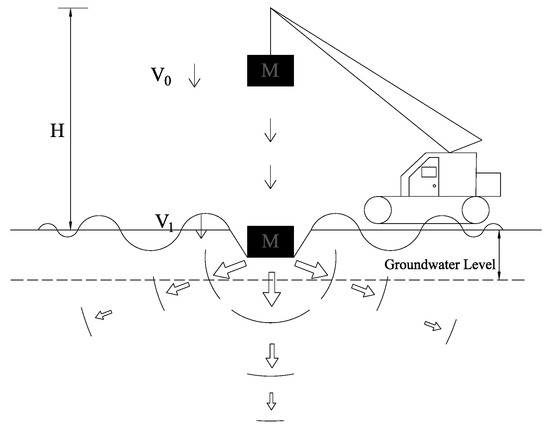
Figure 21.
Schematic diagram of DC (Arrows: Direction of energy transfer).
Upon comparing Groups D and W, it is evident that the acceleration time–course curves exhibited the same triangular impulse loading, but the time distributions differed significantly. The results demonstrated that the duration of the applied load (a–bw) and the overall duration of action (a–Cw) were markedly longer in Group W in comparison to Group D. Specifically, for the same parameters, the tamper action time of Group W was extended by an average of 53.62%, and up to 1.96 times more than that of Group D. This finding was in accordance with the results obtained by Fattah [29] in the study of the behavior of dry and saturated dense sandy soil under the action of a single impulsive load. This suggests that the HGL had a cushioning effect on the applied energy of the tamper.
Equation (6) demonstrates that the tamper velocity was solely contingent upon the drop height. When the tamper fell from the same height, the tamper had the same impact velocity (v) and the same integrated area of the acceleration curve as shown in Figure 20. The buffering effect resulted in a significantly longer impact time for the W groups, which reduced the peak acceleration exerted by the tamper on the soil body and the effective wave absorbed by the soil, thereby affecting the strengthening effect.
The process of tamping can be considered as a completely inelastic collision process and the soil is assumed to be an ideal material. As shown in Figure 21, the following principle of energy conversion and the impulse (I) equation can be achieved with Equations (6) and (7):
M: Tamper quality
h: Falling height of tamper
v1: Landing velocity of tamper
v0: Initial velocity of tamper
It is assumed that both the heavy hammer (M1) and the light hammer (M2) are used at the same energy level, resulting in the corresponding drop heights of h1 and h2, respectively. They have the relationship shown in Equation (8).
The ratio of momentum on the ground caused by the heavy tamper to the light tamper is shown in Equation (9).
It can be seen that the momentum input to the soil from a heavy tamper is times that of a light tamper at the same energy level and that heavy tampers are more effective in reinforcing the soil. It is also proved theoretically that in the tests where the weight of the tamper and the falling height are known, the momentum input of each tamp is fixed. Therefore, further analysis of the energy transfer inside the soil is required for the reinforcement effect.
4.2. Energy Transfer Analysis
The DC process of HGL subgrade differs from that of unsaturated soil. The impact can cause not only compression between soil particles but also water level oscillations. The dynamic stress waveform and stress spatial distribution in Group W can be used to analyze these oscillations. The expansion of the transverse influence range was the most notable effect. However, it can have an adverse effect on reinforcement, leading to soil liquefaction and loss of friction between particles, resulting in a constant rise in water level.
This article assessed the variation in dynamic stresses in different layers of HGL and dry-ground subgrade. The interaction between the tamper and the soil was approximated as a collisional process. However, the direct measurement of the force of the collisional action was inaccurate due to the short duration of the collisional process and the nonuniform pattern of force variations. Simultaneously, DC action resulted in mechanical energy loss, including object deformation, sound emission, and water splashing. This made it challenging to express changes before and after collision using kinetic energy theory alone. To address this, we adopted the process quantity impulse method to describe the cumulative impact on the soil. The impulse equation is as follows:
Figure 22 illustrates how to calculate the impulse per unit area. This is achieved by extracting the force per square millimeter of soil area at the measurement point as an impact force and integrating it over time to obtain the impulse per unit at each point for analysis. Figure 23 represents the variation of impulse in the transverse and longitudinal directions as well as the number of tamps in the L2 monitor layer for Groups D and W.
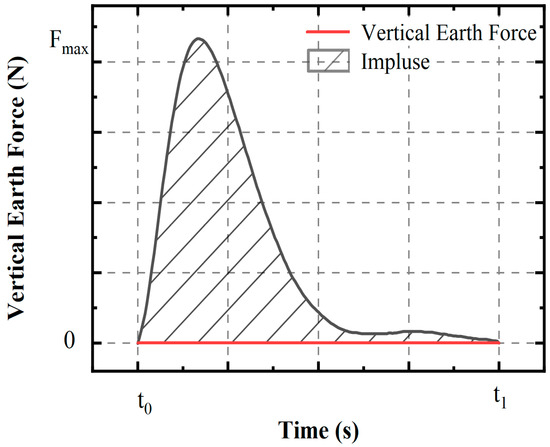
Figure 22.
Impulse diagram.
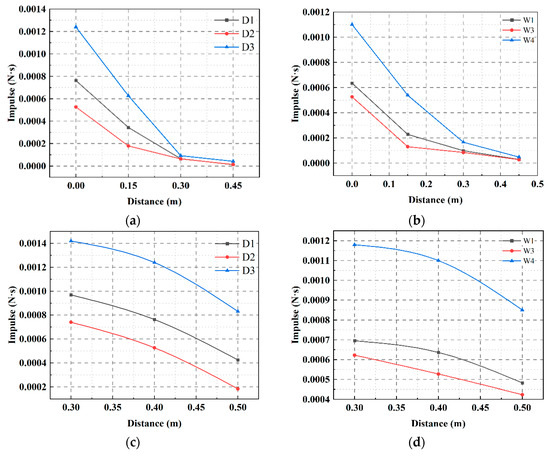
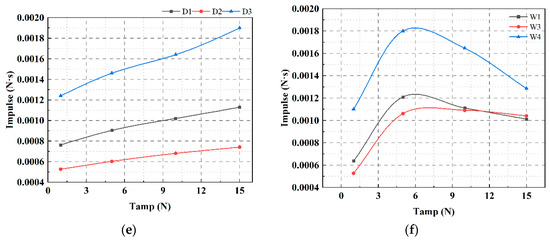
Figure 23.
Unit soil impulse change: (a) transverse attenuation of the impulse in L2 (Group D); (b) transverse attenuation of the impulse in L2 (Group W); (c) vertical attenuation of the impulse in C1 (Group D); (d) vertical attenuation of the impulse in C1 (Group W); (e) impulse with the number of tamps in Group D; (f) impulse with the number of tamps in Group W.
Figure 23a,c,e demonstrates that the impulse decreased with distance and increased with the number of tamps in Group D. The momentum generated at the 8000 kN·m energy level on the unit soil was significantly greater than that produced at 4000 kN·m. Additionally, the difference in the reinforcement effect can be better observed by examining the momentum relative to the peak dynamic stress. As demonstrated by the D2 and D3 curves in Figure 23a and c, respectively, the heavy tamper provided a significant advantage when comparing the momentum received per unit of soil. Although the light tamper produced a higher dynamic stress peak in the surface layer than the heavy tamper, the momentum received by the heavy tamper was on average 59.56% larger than that received by the light tamper. This result was identical to that obtained in the preceding analysis of mass tampering.
Additionally, upon examining Figure 23a–d, it is clear that the impulse received per unit area of soil in Group D was approximately 1.20 times larger than that in Group W. This phenomenon is more clearly shown in Figure 23e,f. With the increasing number of tamps, the impulse volume in Group D increased steadily, while an inflection point emerged in Group W. This inflection point arose due to the coincidence of the tamping surface and the water level surface, which impeded the propagation and absorption of the stress wave. This was also manifested in the time lag and attenuation rate analysis results. Even though the peak dynamic stress still rose after water was encountered, the soil received a lower impulse, which more truly reflected the internal soil conditions.
In Group W, the excessive water level prevented the formation of a dense medium mentioned earlier, and continued tamping exacerbated the formation of liquefaction. Similarly, investigations carried on saturated sands [16] have also shown that there is an increase in the excess pore pressure with amplitude of loading or number of cycles. This results in a loss of specimen shear strength and stiffness, which in turn causes liquefaction damage. During the late stage of DC, the reinforcement effect in the liquefied state was significantly less than the extrusion and compaction effects at the early stage. This indicates that despite precipitation occurring within this point, the efficacy of reinforcement of building subgrade was nevertheless declining.
4.3. Spatial Distribution of the Dynamic Stress
The stress distribution was mapped by plotting the stress at each point with the time of the first peak of the dynamic stress at all monitoring points. Figure 24a,e shows that a compaction zone was formed in the soil during the first tamping, and the reinforcement zone of group D was teardrop-shaped. The compaction zone for the DC method of HGL subgrade was an inverted triangle and the radial propagation was more pronounced. This conclusion is also supported by Figure 24b,f. The morphology of the reinforced zone changed due to the transmission of stress waves in water.
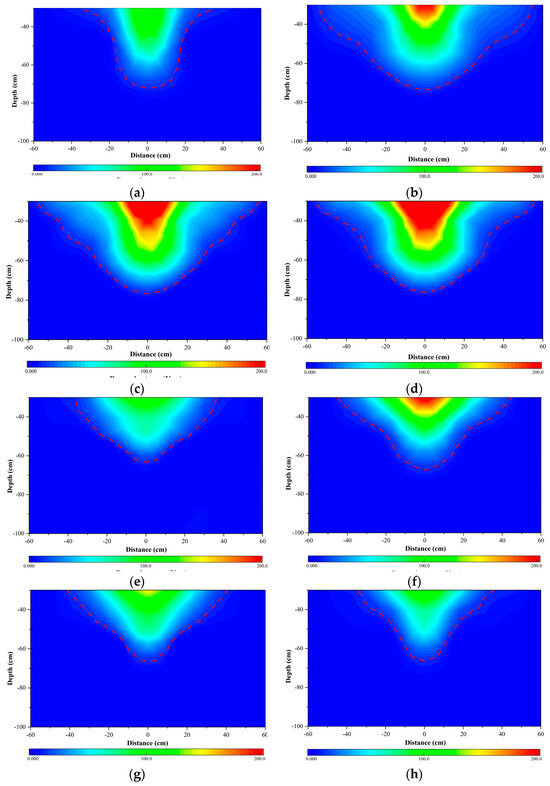
Figure 24.
Spatial distribution of dynamic stress: (a) D1−1st; (b) D1−5th; (c) D1−10th; (d) D1−15th; (e) W3−1st; (f) W3−5th; (g) W3−10th; (h) W3−15th.
In Figure 24, the 10 kPa contour of the soil dynamic stress response is indicated by a red dashed line, and this range is considered to represent the extent of the DC influence. As the input of tamping energy continues, the compaction zone of group D extended deeper into the soil. By the 10th tamp, the dynamic stress influence depth reached 0.76 m. After this point, the compaction depth did not increase further and the compaction zone extended laterally. Figure 24g shows that when the tamper contacted the water in the W group after the 10th tamp, the strengthening effect was weakened, the effective reinforcement depth was obviously smaller, and the depth of the dynamic stress influence decreased to 0.65 m, which was only 85.5% of that of the D group. Similar experimental results on depth of influence were found in the study on rolling dynamic compaction (RDC) with a three-sided compactor on unsaturated sand [32], and the conclusions also suggested a negative influence of moisture and the water table on the effectiveness of RDC.
With continued tamping (Figure 24h), the crater wall collapsed and free water gushed out from the bottom of the tamping crater. The reinforced zone was disturbed more and contracted, causing it to change to a teardrop shape. For construction purposes, it was no longer possible to strengthen the subgrade at this point.
5. Limitations
The objective of this study was to investigate the dynamic stress response inside a HGL subgrade reinforced by the DC method in different groundwater level conditions and to describe the mechanism through the development and attenuation of dynamic stresses. The study did not provide specific analyses of pore water pressure and soil properties before and after impact. Furthermore, given the variability of reinforcement mechanisms in different soil, further research is needed to enhance the DC reinforcement process and related evaluation approaches under various conditions.
6. Conclusions
- Dynamic compaction has been demonstrated to be an effective method for reinforcing HGL subgrade. The dynamic stress waveform generated by DC was primarily manifested in shock stress waveforms and vibration damping waveforms. A more pronounced transverse effect was observed in HGL subgrade.
- The HGL functions as an obstacle to the energy transfer of DC, both in terms of energy input to the tamper and energy reception by the soil. Compared to the low-water level subgrade, the tamping action time was extended by an average of 1.96 times. The mean reduction in peak dynamic stresses in the DC-strengthened HGL subgrade was 33.05% and the depth of influence was reduced by 14.5%. Furthermore, the time lag and decay rate were observed to increase.
- The impulse was a more accurate representation of the actual energy transmitted to the soil. The loss of tamping impulse per unit of soil went up to 31.5% when the water level was higher than the tamping crater. Lowering the water level, increasing energy levels, and switching to heavy tampers can all significantly increase the impulse of energy received per unit of soil.
- In the construction of HGL subgrade reinforcement by DC, it is essential to comprehensively evaluate both the water level and the reinforcement effect. Increasing the tamper weight and energy level causes the groundwater level to rise more rapidly. To avoid dangerous situations, it is crucial to monitor the water level and adjust accordingly throughout the construction process. It is recommended that the single energy level tamping operation be abandoned in favor of a combination of light and heavy tamper construction methods with multiple rounds and fewer tamps each.
Author Contributions
Conceptualization, J.S., P.L. and X.G.; methodology, J.S. and P.L.; software, J.S. and S.T.; validation, J.S., P.L. and J.W.; formal analysis, J.S.; investigation, J.S. and P.L.; resources, J.S.; data curation, J.S.; writing—original draft preparation, J.S., J.W. and Y.L.; writing—review and editing, J.S. and Y.L.; visualization, J.S. and S.T.; supervision, J.S., J.W. and X.G.; project administration, J.S., P.L. and X.G.; funding acquisition, X.G. All authors have read and agreed to the published version of the manuscript.
Funding
This research was funded by Shanxi Provincial Key Research and Development Project, grant number 201803D121114.
Data Availability Statement
Data are contained within the article.
Conflicts of Interest
Author Peixuan Li was employed by the company Shanxi Highway Safety Transportation Technology Co., Ltd. Author Shiyu Tian was employed by the company Shanxi Construction Investment Group Co., Ltd. The remaining authors declare that the research was conducted in the absence of any commercial or financial relationships that could be construed as a potential conflict of interest.
References
- Zhou, J.; Han, J.; Jia, M.-C.; Lin, X. Laboratory model study on densification of hydraulically-filled fine sands by vibro-compaction. In Proceedings of the GeoCongress 2008: Geosustainability and Geohazard Mitigation New York: Geo-Institute of The American Society of Civil Engineers, New Orleans, LA, USA, 9–12 March 2008; pp. 700–707. [Google Scholar] [CrossRef]
- Bo, M.W.; Na, Y.M.; Arulrajah, A.; Chang, M.F. Densification of granular soil by dynamic compaction. Proc. Inst. Civ. Eng. Ground Improv. 2009, 162, 121–132. [Google Scholar] [CrossRef]
- Feng, S.-J.; Shui, W.-H.; Tan, K.; Gao, L.-Y.; He, L.-J. Field Evaluation of Dynamic Compaction on Granular Deposits. J. Perform. Constr. Facil. 2011, 25, 241–249. [Google Scholar] [CrossRef]
- Asaka, Y. Improvement of fine-grained reclaimed ground by dynamic compaction method. Jpn. Geotech. Soc. Spéc. Publ. 2016, 2, 2038–2042. [Google Scholar] [CrossRef]
- Ménard, L.; Broise, Y. Theoretical and practical aspect of dynamic consolidation. Géotechnique 1975, 25, 3–18. [Google Scholar] [CrossRef]
- Mayne, P.W.; Jones, J.J.S.; Dumas, J.C. Ground Response to Dynamic Compaction. J. Geotech. Eng. 1984, 110, 757–774. [Google Scholar] [CrossRef]
- Lutenegger, A.J. Dynamic compaction in friable loess. J. Geotech. Eng. 1986, 112, 663–667. [Google Scholar] [CrossRef]
- Thilakasiri, H.S.; Gunaratne, M.; Mullins, G.; Stinnette, P.; Jory, B. Investigation of impact stresses induced in laboratory dynamic compaction of soft soils. Int. J. Numer. Anal. Methods Geomech. 1996, 20, 753–767. [Google Scholar] [CrossRef]
- Oshima, A.; Takada, N.; Tanaka, Y. Relation between compacted area and ram momentum by heavy tamping. Doboku Gakkai Ronbunshu 1996, 1996, 185–196. [Google Scholar] [CrossRef] [PubMed][Green Version]
- Perucho, A.; Olalla, C. Dynamic consolidation of a saturated plastic clayey fill. Proc. Inst. Civ. Eng.—Ground Improv. 2006, 10, 55–68. [Google Scholar] [CrossRef]
- Rollins, K.M.; Kim, J. Dynamic Compaction of Collapsible Soils Based on U.S. Case Histories. J. Geotech. Geoenviron. 2010, 136, 1178–1186. [Google Scholar] [CrossRef]
- Mostafa, K.F.; Liang, R.Y. Numerical Modeling of Dynamic Compaction in Cohesive Soils; ASCE: New York, NY, USA, 2011. [Google Scholar] [CrossRef]
- Dou, J.; Chen, J.; Wang, W. Method for Estimating the Degree of Improvement in Soil between Adjacent Tamping Locations under Dynamic Compaction. Int. J. Géoméch. 2019, 19, 04019134. [Google Scholar] [CrossRef]
- Kundu, S.; Viswanadham, B. Studies to evaluate the impact of tamper on the depth of improvement in dynamic compaction. Jpn. Geotech. Soc. Spéc. Publ. 2016, 2, 2033–2037. [Google Scholar] [CrossRef]
- El Shamy, U.; Zeghal, M. A micro-mechanical investigation of the dynamic response and liquefaction of saturated granular soils. Soil Dyn. Earthq. Eng. 2007, 27, 712–729. [Google Scholar] [CrossRef]
- Devi Priyanka, D.; Rathi, D.; Kumar, G.K. Effect of Dynamic Loading on Properties of Saturated Sand. In Soil Dynamics and Earthquake Geotechnical Engineering: IGC 2016; Springer: Singapore, 2019; Volume 3, pp. 3–12. [Google Scholar] [CrossRef]
- Nashed, R.; Thevanayagam, S.; Martin, G.R. Dynamic compaction of saturated sands and silty sands: Design. Proc. Inst. Civ. Eng.-Ground Improv. 2009, 162, 81–92. [Google Scholar] [CrossRef]
- Martin, B.E.; Chen, W.; Song, B.; Akers, S.A. Moisture effects on the high strain-rate behavior of sand. Mech. Mater. 2009, 41, 786–798. [Google Scholar] [CrossRef]
- Zhang, H.B.; Li, C.; Wu, J.Q. Field Tests of Effects of Underground Water Level on Dynamic Consolidation. Highway 2015, 60, 14–19. [Google Scholar]
- Zhou, C.; Yao, K.; Rong, Y.; Lee, F.H.; Zhang, D.; Jiang, H.; Yang, C.; Yao, Z.; Chen, L. Numerical investigation on zone of improvement for dynamic compaction of sandy ground with high groundwater table. Acta Geotech. 2022, 18, 695–709. [Google Scholar] [CrossRef]
- Jia, M.; Cheng, J.; Liu, B.; Ma, G. Model tests of the influence of ground water level on dynamic compaction. Bull. Eng. Geol. Environ. 2021, 80, 3065–3078. [Google Scholar] [CrossRef]
- Kundu, S.; Viswanadham, B.V.S. Centrifuge Modeling and DIC of Dynamic Compaction on Sandy Soils with Shallow Water Table. J. Geotech. Geoenviron. Eng. 2021, 147, 04021037. [Google Scholar] [CrossRef]
- Poran, C.J.; Rodriguez, J.A. Design of dynamic compaction. Can. Geotech. J. 1992, 29, 796–802. [Google Scholar] [CrossRef]
- Didyk, R.P.; Masakovskii, E.A. Investigation of field of dynamic stresses with impulse loading. Int. Appl. Mech. 1999, 35, 170–174. [Google Scholar] [CrossRef]
- Niu, Z.; Lu, G.; Cheng, D. Dynamic Characteristics of Soils Subject to Impact Loadings. Acta Mech. Solida Sin. 2008, 21, 347–353. [Google Scholar] [CrossRef]
- Omidvar, M.; Iskander, M.; Bless, S. Stress-strain behavior of sand at high strain rates. Int. J. Impact Eng. 2012, 49, 192–213. [Google Scholar] [CrossRef]
- Yuan, H.-P.; Liu, M.; Li, W.; Wang, Y.-X. Dynamic Compaction Model Tests for the Characteristics of Red Clay Under equal Energy Level. Geotech. Geol. Eng. 2017, 36, 1873–1883. [Google Scholar] [CrossRef]
- Chow, Y.K.; Yong, D.M.; Yong, K.Y.; Lee, S.L. Dynamic Compaction Analysis. J. Geotech. Eng. 1992, 118, 1141–1157. [Google Scholar] [CrossRef]
- Fattah, M.Y.; Ali, A.F.; Ahmed, B.A. Impact Induced Responses of Saturated and Dry Dense Sand. Int. J. Geotech. Earthq. Eng. 2018, 9, 63–85. [Google Scholar] [CrossRef]
- Westine, P.; Dodge, F.; Baker, W. Similarity Methods in Engineering Dynamics; Hayden Book Company: Indianapolis, IN, USA, 1973. [Google Scholar]
- GB/T50123-2019; Standard for Soil Method. The Ministry of Water Resources: Beijing, China, 2019.
- Li, Y.-X.; Airey, D.; Feng, W.-Q. Effectiveness of rolling dynamic compaction with a three-sided compactor on unsaturated sand. Transp. Geotech. 2023, 42, 101093. [Google Scholar] [CrossRef]


Disclaimer/Publisher’s Note: The statements, opinions and data contained in all publications are solely those of the individual author(s) and contributor(s) and not of MDPI and/or the editor(s). MDPI and/or the editor(s) disclaim responsibility for any injury to people or property resulting from any ideas, methods, instructions or products referred to in the content. |
© 2024 by the authors. Licensee MDPI, Basel, Switzerland. This article is an open access article distributed under the terms and conditions of the Creative Commons Attribution (CC BY) license (https://creativecommons.org/licenses/by/4.0/).