
Finite Element Analysis of the Shear Performance of Reinforced Concrete Corbels under Different Design Codes

Abstract
1. Introduction
2. The Establishment of a Finite Element Model
2.1. Material Models
2.2. Element Types and Meshing
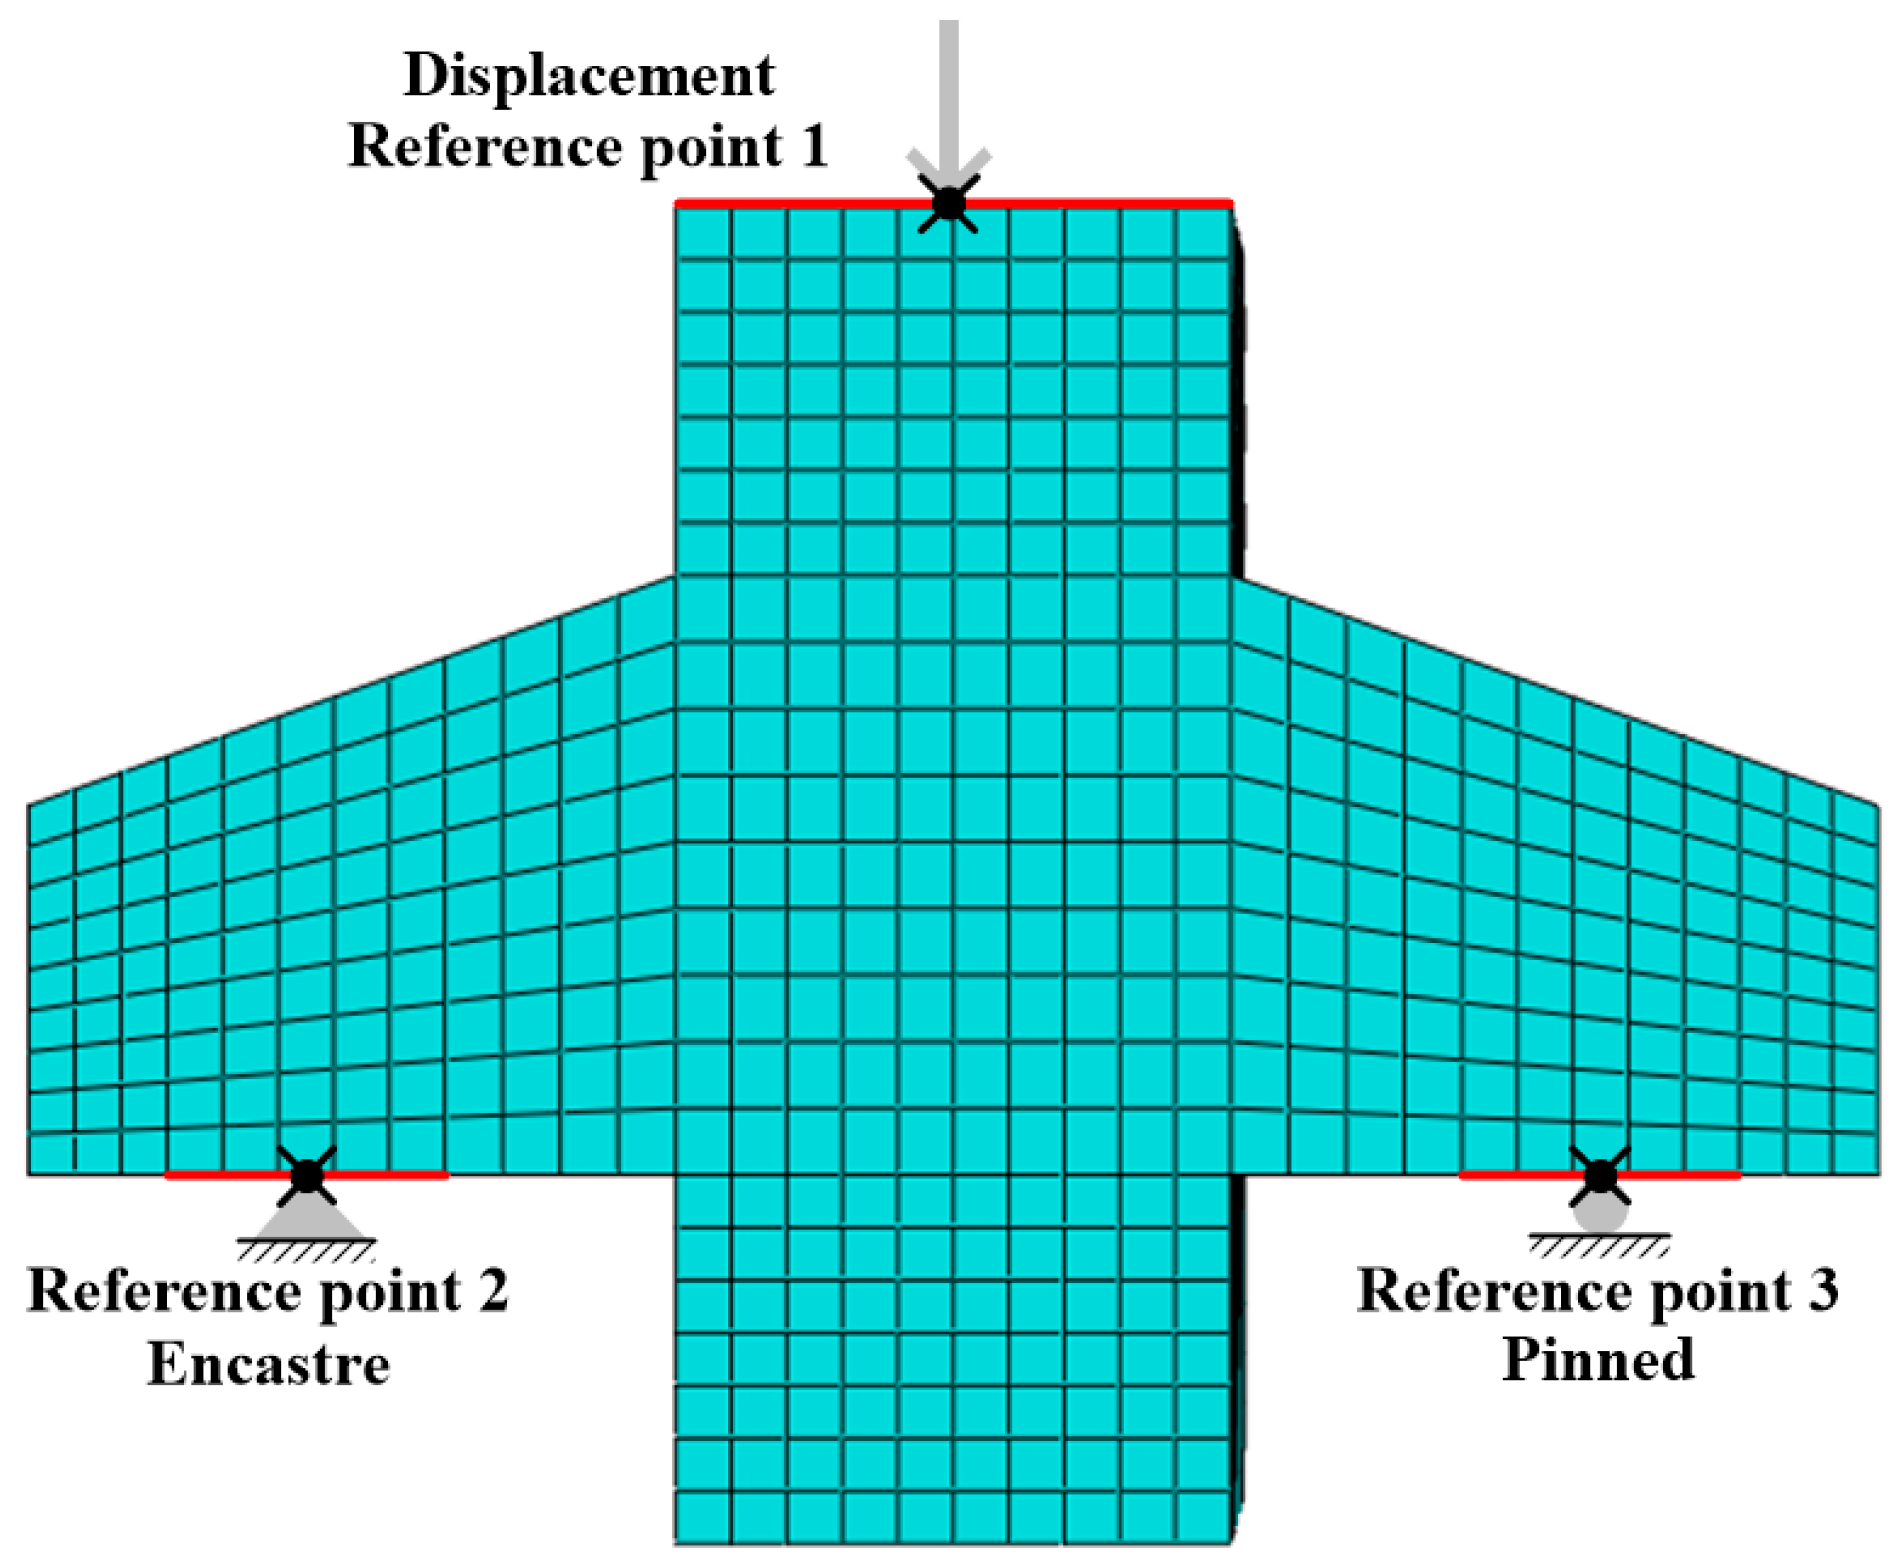
2.3. Boundary and Loading Conditions
3. Verification of the Finite Element Model
3.1. Experimental Program
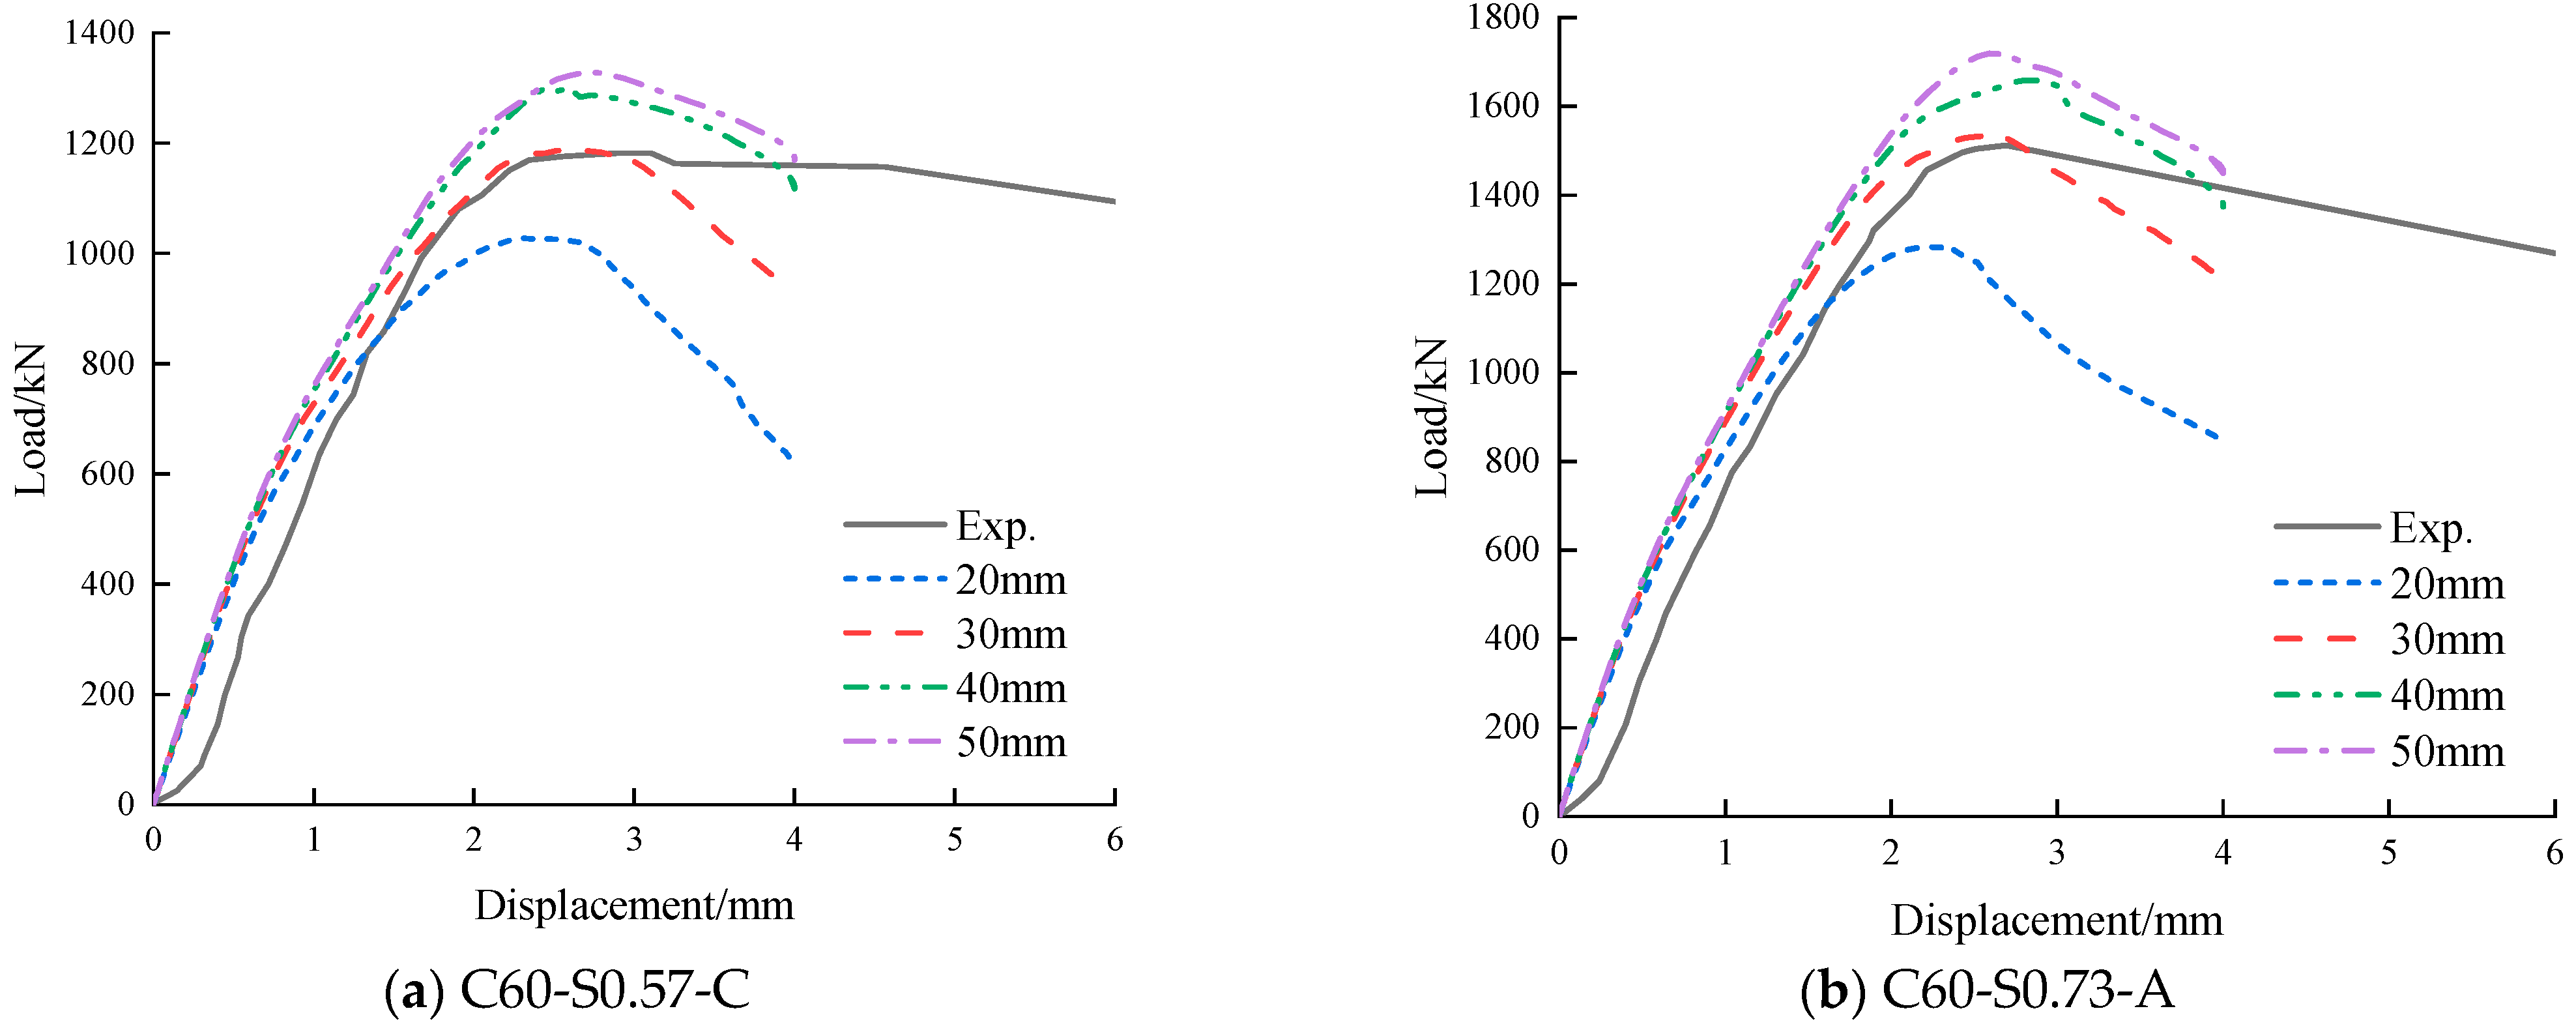
3.2. Effect of Mesh Sizes
3.3. Load–Displacement Curve
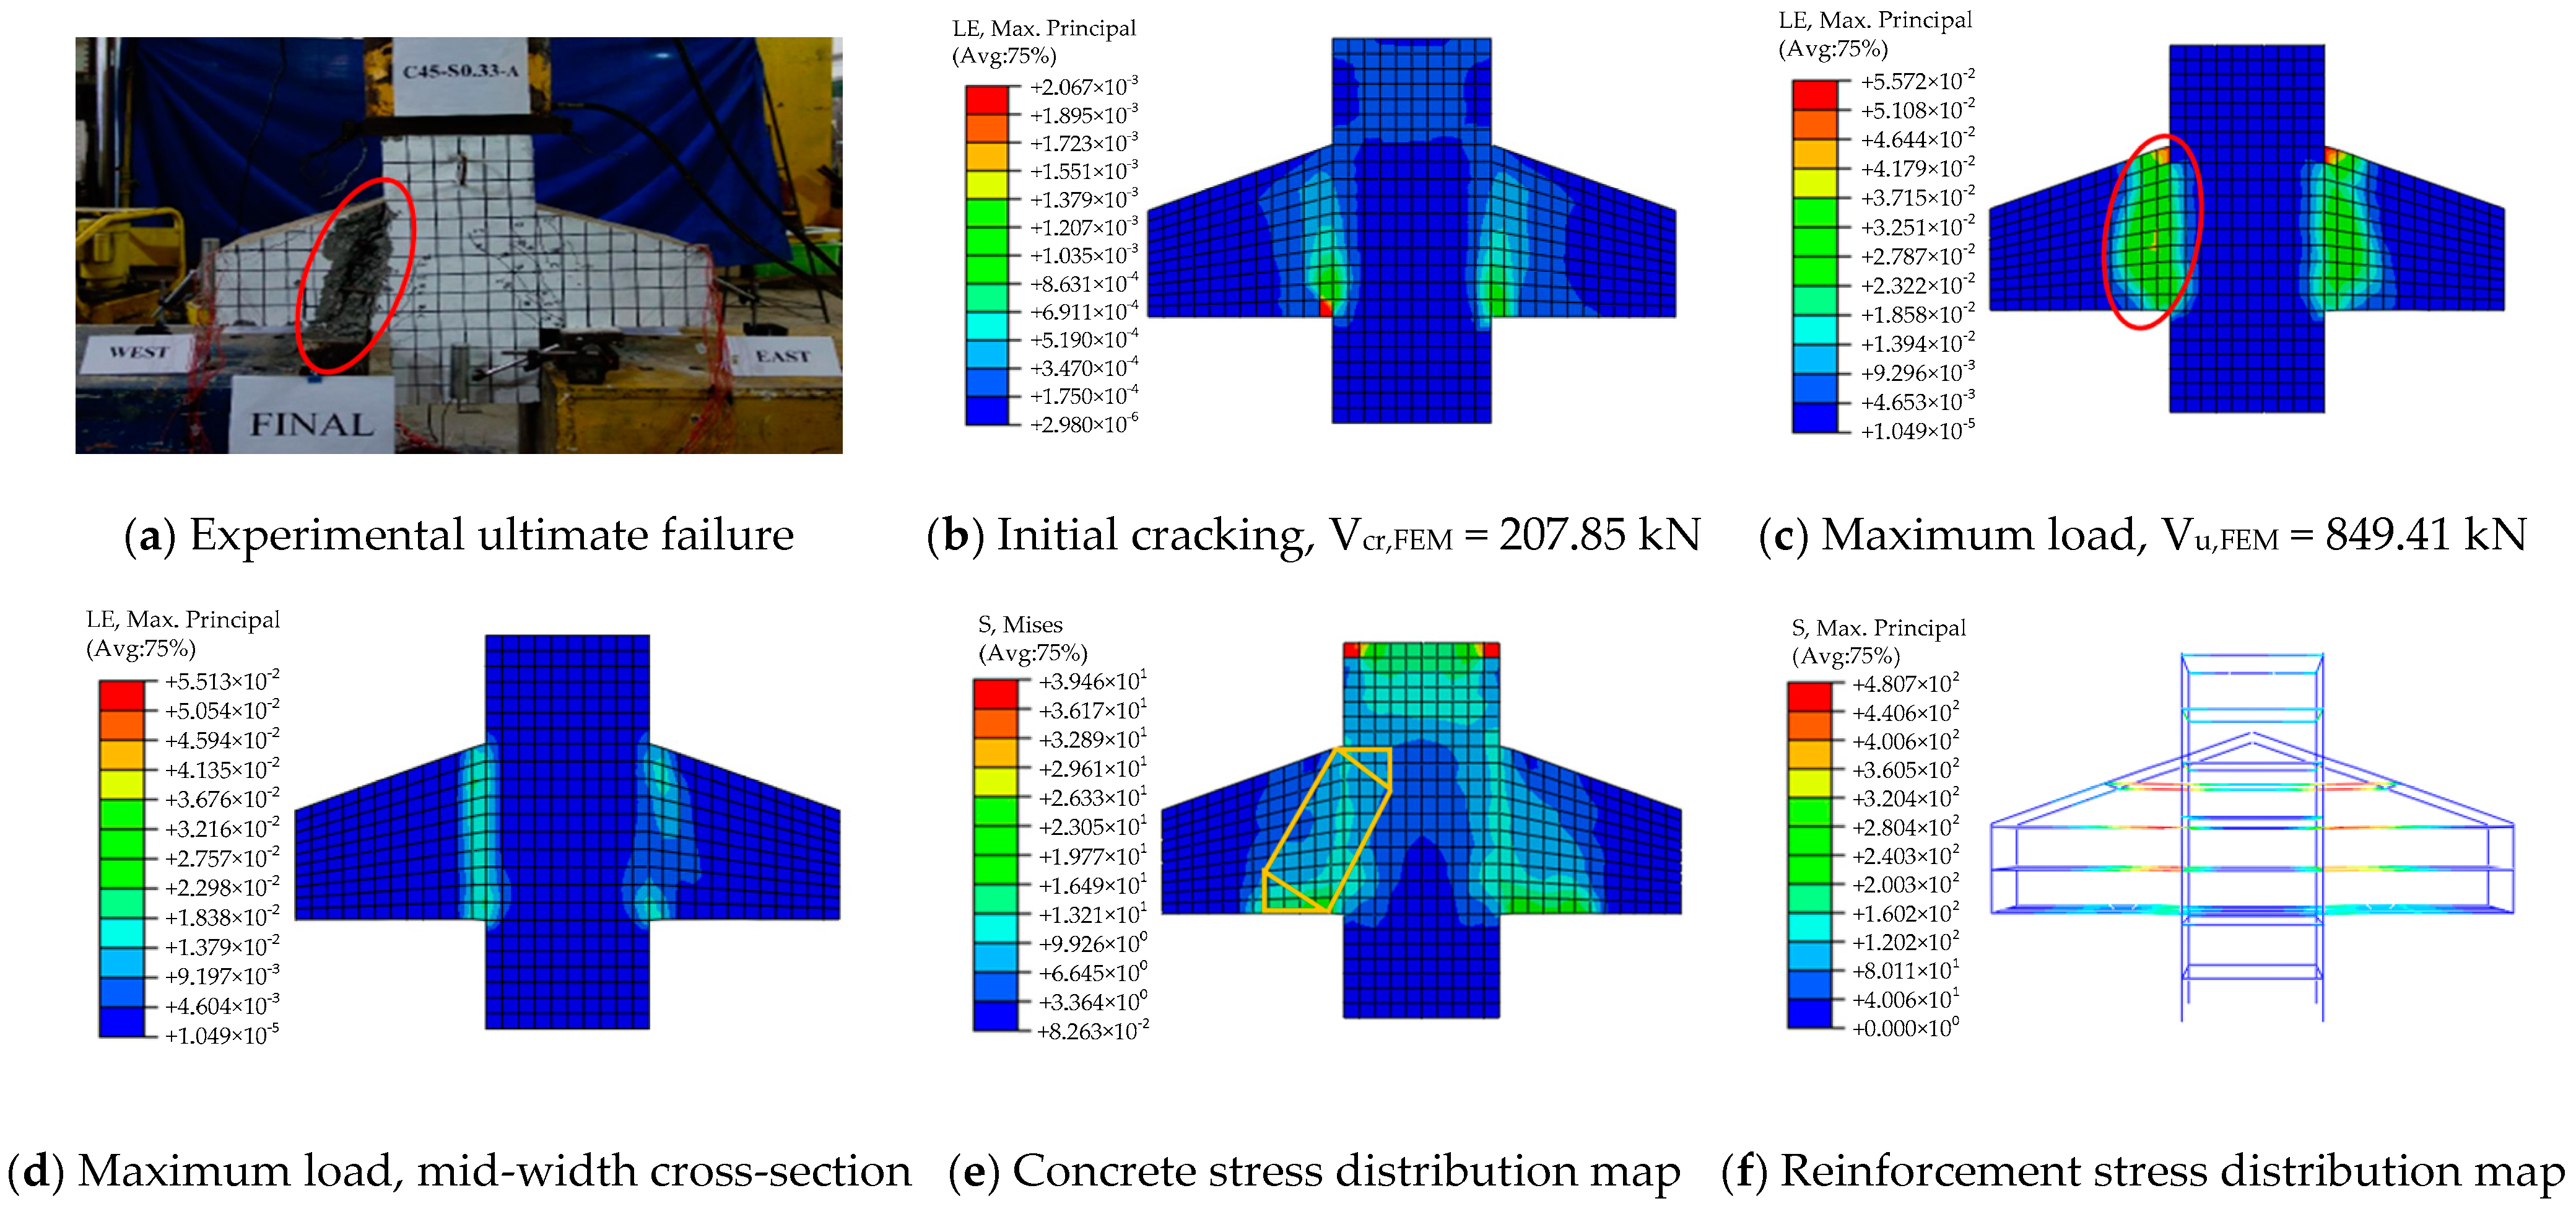
3.4. Failure Mode
4. Finite Element Parameter Analysis and Results
4.1. Parameter Design
4.1.1. Chinese Code GB 50010-2010 Method
4.1.2. American Code ACI 318-19 Method
4.2. Safety Evaluation of Chinese and American Code Design Methods
4.3. Corbels without Stirrups
4.4. Strut Coefficient of the Compression Strut
5. Comparison with Previous Studies
6. Conclusions
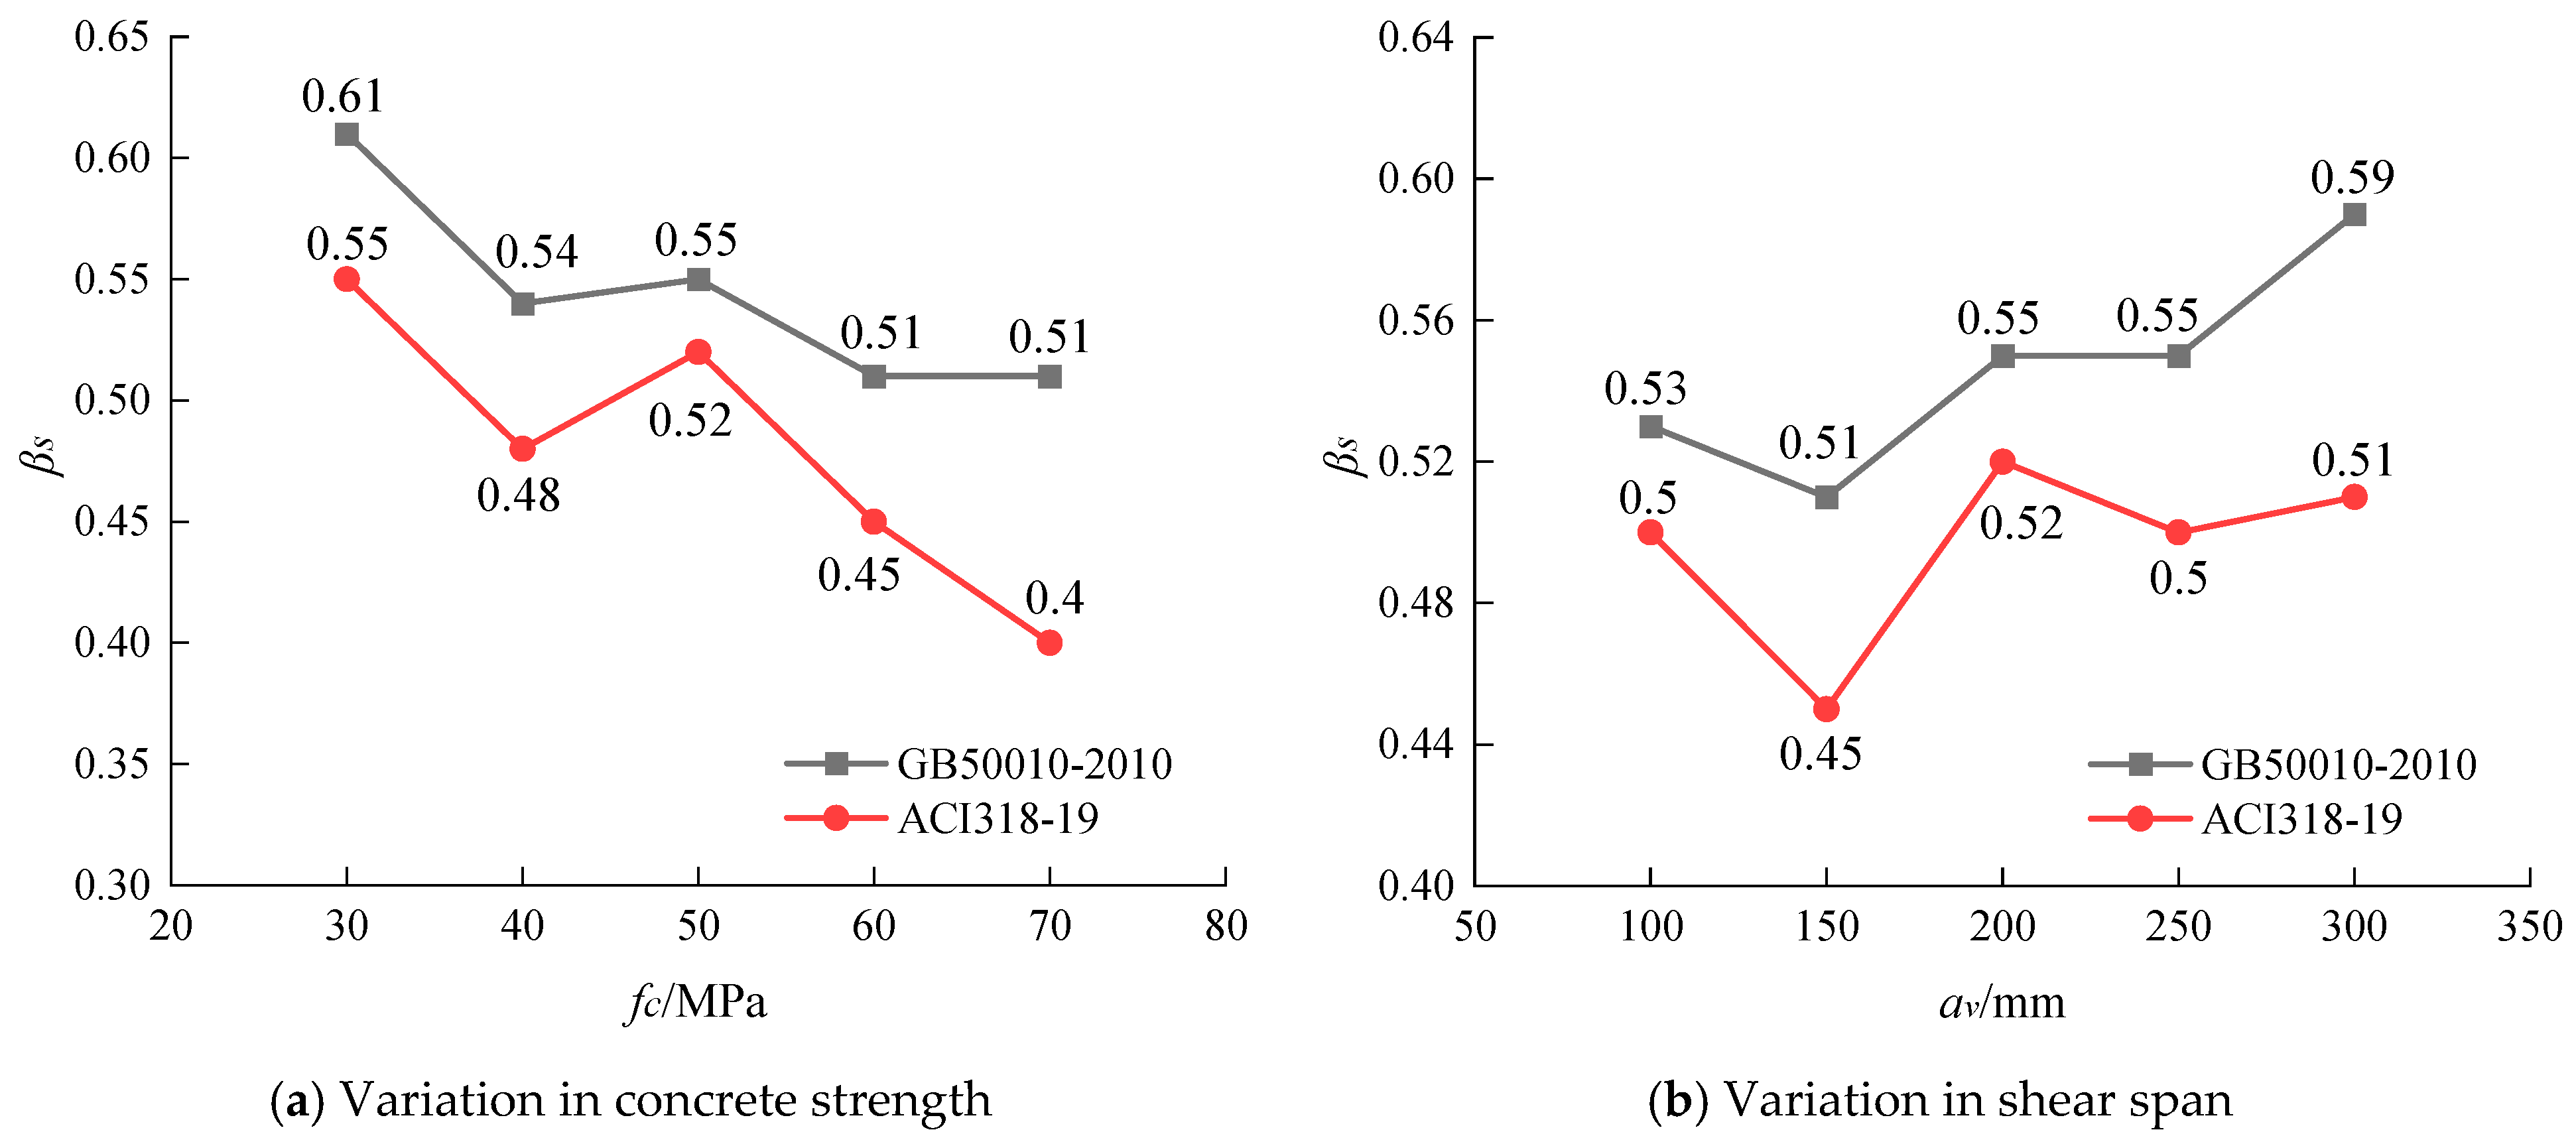
- (1)
- Increasing the compressive strength of concrete can significantly enhance the safety level in the triangular truss model. For instance, when the compressive strength of concrete increases from 30 MPa to 70 MPa, the safety margin increases from 1.28 to 1.87. In contrast, in the strut-and-tie model, the safety level first increases and then decreases with the enhancement of concrete compressive strength. When the compressive strength of concrete increases from 30 MPa to 50 MPa, the safety margin rises from 1.07 to 1.32, and then it drops to 1.2 when further increased to 70 MPa.
- (2)
- In the triangular truss model, the safety level also increases correspondingly with the enlargement of the shear span. For example, when the shear span increases from 100 mm to 300 mm, the safety margin increases from 1.54 to 1.69. In comparison, the safety level in the strut-and-tie model does not show significant changes and tends to decrease with the increase in the shear span.
- (3)
- With the shear span held constant, the safety level in the triangular truss model gradually decreases as the corbel height increases and the concrete strength gradually reduces. The safety level in the strut-and-tie model first increases and then decreases.
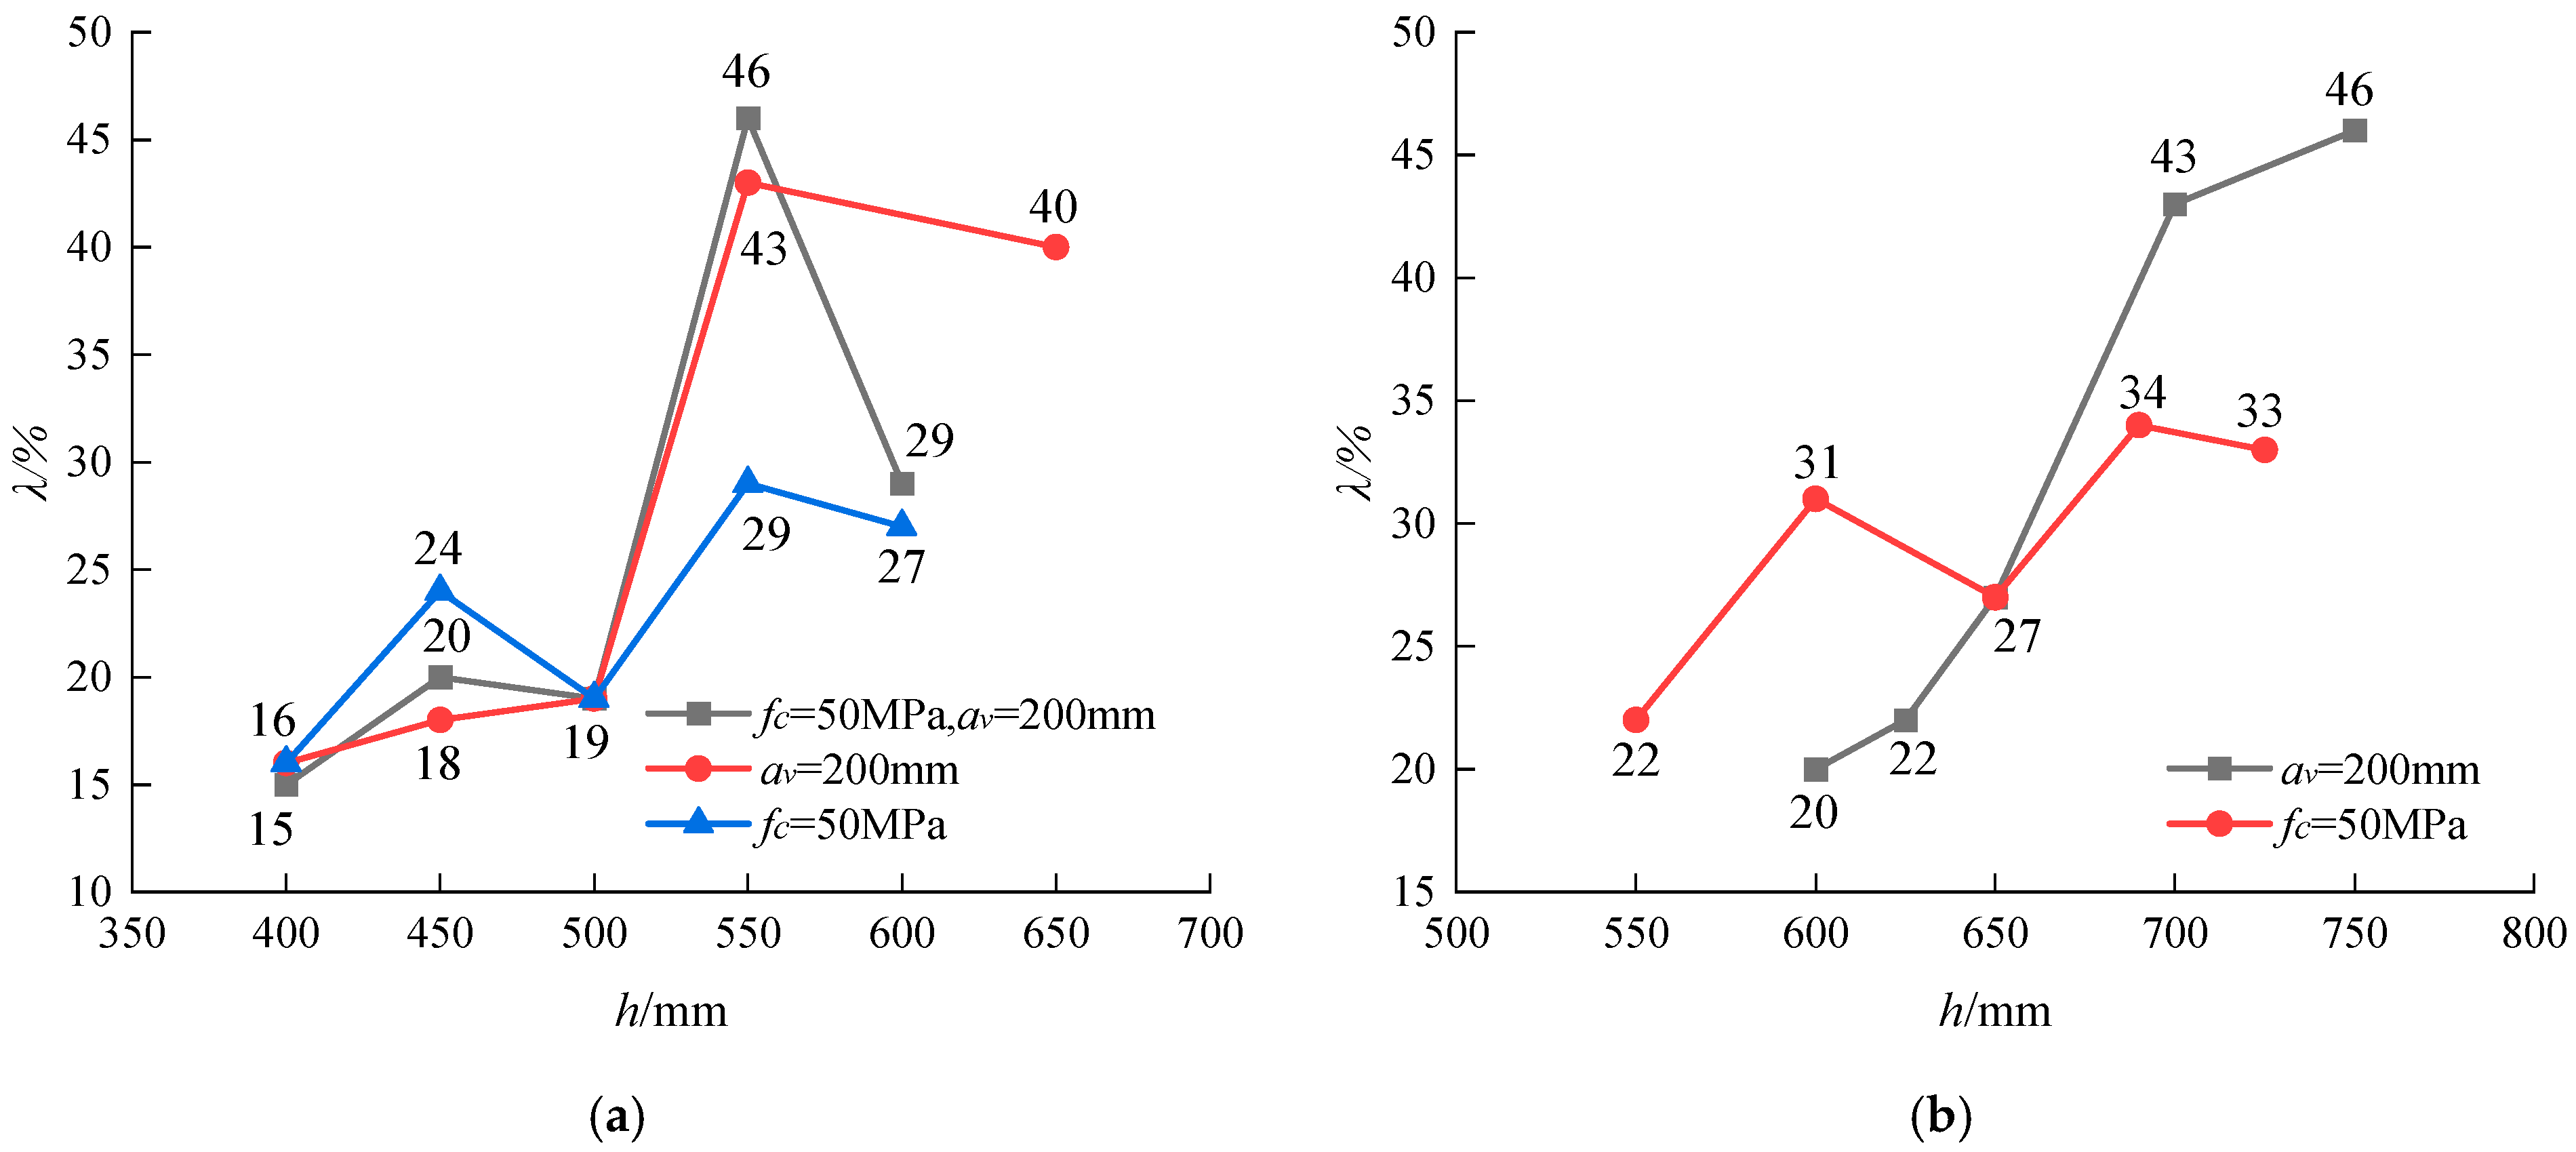
- (4)
- The configuration of horizontal stirrups significantly improves the load-bearing capacity of the corbel, especially in cases of low-strength concrete, a large shear span, or larger corbel heights. Compared to specimens without stirrups, the load-bearing capacity of specimens with stirrups increased by 15% to 46%.
- (5)
- Specimens featuring low-strength concrete, large shear spans, or greater corbel heights exhibit a higher strut coefficient. For corbel members with high-strength concrete and low stirrup ratios, the simplified values in existing codes may lead to unsafe prediction results as they ignore the potential influence of other parameters.
Author Contributions
Funding
Data Availability Statement
Acknowledgments
Conflicts of Interest
References
- GB 50010-2010; Code for Design of Concrete Structures. China Architecture and Building Press: Beijing, China, 2010. (In Chinese)
- ACI 318-19; Building Code Requirements for Structural Concrete. American Concrete Institute: Philadelphia, PA, USA, 2019.
- EN 1992-1-1:2004; Eurocode 2: Design of Concrete Structures. Part 1-1: General Rules and Rules for Buildings. British Standards Institutions: London, UK, 2004.
- CSA A23.3-14; Design of Concrete Structures. Canadian Standards Association: Toronto, ON, Canada, 2014.
- Comité Euro-International Du Béton (CEB). CEB-FIP Model Code 2010 for Concrete Structures; Comité Euro-International Du Béton (CEB): Lausanne, Switzerland, 2010. [Google Scholar]
- Collins, M.P.; Bentz, E.C.; Sherwood, E.G. Where is shear reinforcement required? Review of research results and design procedures. Struct. J. 2008, 105, 590–600. [Google Scholar] [CrossRef]
- Ismail, K.S.; Guadagnini, M.; Pilakoutas, K. Numerical Investigation of the Shear Strength of RC Deep Beams Using the Microplane Model. J. Struct. Eng. 2016, 142, 04016077. [Google Scholar] [CrossRef]
- Ismail, K.S.; Guadagnini, M.; Pilakoutas, K. Strut-and-Tie modeling of reinforced concrete deep beams. J. Struct. Eng. 2018, 144, 04017216. [Google Scholar] [CrossRef]
- Kriz, L.; Raths, C. Connections in Precast Concrete Structures—Strength of Corbels. J. Prestress. Concr. Inst. 1965, 10, 16–61. [Google Scholar] [CrossRef]
- Hermansen, B.R.; Cowan, J. Modified shear-friction theory for bracket design. J. Proc. 1974, 71, 55–60. [Google Scholar]
- Mattock, A.H.; Chen, K.; Soongswang, K. The behavior of reinforced concrete corbels. PCI J. 1976, 21, 52–77. [Google Scholar] [CrossRef]
- Fattuhi, N.I. Column-load effect on reinforced concrete corbels. J. Struct. Eng. 1990, 116, 188–197. [Google Scholar] [CrossRef]
- Foster, S.J.; Powell, R.E.; Selim, H.S. Performance of high-strength concrete corbels. ACI Struct. J. 1996, 93, 555–563. [Google Scholar] [CrossRef]
- Lu, W.-Y.; Lin, I.-J. Behavior of reinforced concrete corbels. Struct. Eng. Mech. 2009, 33, 357–371. [Google Scholar] [CrossRef]
- Wilson, H.R.; Yousefpour, H.; Brown, M.D.; Bayrak, O. Investigation of Corbels Designed According to Strut-and-Tie and Empirical Methods. ACI Struct. J. 2018, 115, 813–824. [Google Scholar] [CrossRef]
- DING, B.Y. Calculation of Reinforced Concrete Corbels. Ind. Constr. 1974, 2, 31–36+51. [Google Scholar]
- Abdul-Razzaq, K.S.; Dawood, A.A. Corbel strut and tie modeling–Experimental verification. Proc. Struct. 2020, 26, 327–339. [Google Scholar] [CrossRef]
- Faleh, S.K.; Chkheiwer, A.H.; Saleh, I.S. Structural behavior of high-strength concrete corbels involving steel fibers or closed stirrups. Period. Eng. Nat. Sci. 2022, 10, 239–252. [Google Scholar] [CrossRef]
- Caner, F.C.; Bažant, Z.P. Microplane Model M7 for Plain Concrete. I: Formulation. J. Eng. Mech. 2013, 139, 1714–1723. [Google Scholar] [CrossRef]
- Caner, F.C.; Bažant, Z.P. Microplane Model M7 for Plain Concrete. II: Calibration and Verification. J. Eng. Mech. 2013, 139, 1724–1735. [Google Scholar] [CrossRef]
- Ozturk, B. Seismic behavior of two monumental buildings in historical Cappadocia region of Turkey. Bull. Earthq. Eng. 2017, 15, 3103–3123. [Google Scholar] [CrossRef]
- Baiarti, Z. Microplane model for strain-controlled inelastic behaviour. In Mechanics of Engineering Materials; Desai, C.S., Gallagher, R.H., Eds.; John Wiley & Sons: Hoboken, NJ, USA, 1984. [Google Scholar]
- Bažant, Z.P.; Oh, B.H. Crack band theory for fracture of concrete. Matériaux Constr. 1983, 16, 155–177. [Google Scholar] [CrossRef]
- Nguyen, V.P.; Lloberas-Valls, O.; Stroeven, M.; Sluys, L.J. On the existence of representative volumes for softening quasi-brittle materials–A failure zone averaging scheme. Comput. Methods Appl. Mech. Eng. 2010, 199, 3028–3038. [Google Scholar] [CrossRef]
- Yang, H.; Xie, S.-Y.; Secq, J.; Shao, J.-F. Experimental study and modeling of hydromechanical behavior of concrete fracture. Water Sci. Eng. 2017, 10, 97–106. [Google Scholar] [CrossRef]
- Xue, J.; Kirane, K. Cylindrical microplane model for compressive kink band failures and combined friction/inelasticity in fiber composites II: Analyses. Compos. Struct. 2022, 291, 115589. [Google Scholar] [CrossRef]
- Xue, J.; Kirane, K. Cylindrical microplane model for compressive kink band failures and combined friction/inelasticity in fiber composites I: Formulation. Compos. Struct. 2022, 289, 115382. [Google Scholar] [CrossRef]
- Reginato, L.; de Sousa, A.M.; Santos, J.V.; El Debs, M.K. NLFEA of Reinforced Concrete Corbels: Proposed Framework, Sensibility Study, and Precision Level. Buildings 2023, 13, 1874. [Google Scholar] [CrossRef]
- Yin, W.M. Research on the Shear Bearing Capacity of Reinforced Concrete Corbels. Master’s Thesis, Hunan University, Changsha, China, 2021; pp. 19–62. [Google Scholar] [CrossRef]
- Schlaich, J.; Schafer, K.; Jennewein, M. Towards a consistent design of reinforced concrete structures. PCI J. 1987, 32, 74–150. [Google Scholar] [CrossRef]
- Chen, H.; Yi, W.-J.; Hwang, H.-J. Cracking strut-and-tie model for shear strength evaluation of reinforced concrete deep beams. Eng. Struct. 2018, 163, 396–408. [Google Scholar] [CrossRef]
- Al-Shaarbaf, I.A.; Al-Azzawi, A.A.; Farahan, R.S. Experimental investigation on the behavior of reinforced concrete corbels under repeated loadings. J. Eng. Sustain. Dev. 2015, 19, 126–147. [Google Scholar]
- Othman, Z.; Aziz, O.Q. Ultimate shear strength ofreinforced high strength concrete corbelssubjected to vertical load. Al-Rafidain Eng. J. 2010, 18, 1–12. [Google Scholar] [CrossRef]


| Specimen No. | h/mm | fc/MPa | fy/MPa | As/mm2 | ρs/% | ρst/% | av/mm | Vt/kN | VFEM/kN | Vt/VFEM |
|---|---|---|---|---|---|---|---|---|---|---|
| C30-S0.42-C | 500 | 23.8 | 478 | 393 | 0.276 | 0.213 | 200 | 572.5 | 586.61 | 0.98 |
| C45-S0.50-C | 425 | 54.2 | 458 | 452 | 0.378 | 0.262 | 200 | 623.5 | 619.25 | 1.01 |
| C60-S0.57-C | 375 | 44.2 | 458 | 565 | 0.540 | 0.300 | 200 | 593.0 | 594.55 | 1.00 |
| C45-S0.31-C | 350 | 54.2 | 478 | 339 | 0.349 | 0.208 | 100 | 631.5 | 649.51 | 0.97 |
| C45-S0.67-C | 475 | 50.4 | 459 | 615 | 0.458 | 0.350 | 300 | 678.5 | 673.51 | 1.01 |
| C30-S0.57-A | 375 | 27.7 | 422 | 804 | 0.772 | 0.452 | 200 | 491.5 | 518.78 | 0.95 |
| C45-S0.67-A | 325 | 54.2 | 425 | 942 | 1.064 | 0.532 | 200 | 729.5 | 727.88 | 1.00 |
| C60-S0.73-A | 300 | 44.2 | 492 | 1017 | 1.251 | 0.579 | 200 | 754.0 | 767.44 | 0.98 |
| C45-S0.33-A | 325 | 54.2 | 459 | 615 | 0.688 | 0.527 | 100 | 824.0 | 849.41 | 0.97 |
| C45-S0.80-A | 400 | 50.4 | 492 | 1017 | 0.914 | 0.564 | 300 | 662.0 | 589.43 | 1.12 |
| C45-S0.33-A0 | 325 | 54.2 | 459 | 615 | 0.688 | 0 | 100 | 658.5 | 693.30 | 0.95 |
| C45-S0.67-A0 | 325 | 54.2 | 425 | 942 | 1.064 | 0 | 200 | 611.5 | 606.33 | 1.01 |
| C45-S0.80-A0 | 400 | 50.4 | 492 | 1017 | 0.914 | 0 | 300 | 445.0 | 479.58 | 0.93 |
| Average | 0.99 | |||||||||
| Coefficient of variation | 0.05 | |||||||||
| Specimen No. | h/mm | he/mm | fc/MPa | As/mm2 | ρs/% | n | ρst/% | av/mm | VFEM/kN | Vd/kN | α | VFEM0/kN | λ/% | βs |
|---|---|---|---|---|---|---|---|---|---|---|---|---|---|---|
| C30-S0.32-A | 650 | 350 | 30 | 950 | 0.511 | 4 | 0.338 | 200 | 850.90 | 792.63 | 1.07 | 606.23 | 40 | 0.55 |
| C40-S0.38-A | 550 | 300 | 40 | 972 | 0.623 | 4 | 0.403 | 200 | 925.97 | 750.72 | 1.23 | 645.70 | 43 | 0.48 |
| C50-S0.43-A | 500 | 250 | 50 | 1074 | 0.762 | 3 | 0.334 | 200 | 990.34 | 750.40 | 1.32 | 828.98 | 19 | 0.52 |
| C60-S0.48-A | 450 | 250 | 60 | 1204 | 0.956 | 3 | 0.374 | 200 | 956.36 | 750.39 | 1.28 | 812.94 | 18 | 0.45 |
| C70-S0.54-A | 400 | 200 | 70 | 1373 | 1.237 | 3 | 0.425 | 200 | 897.82 | 750.42 | 1.20 | 774.99 | 16 | 0.40 |
| C50-S0.27-A | 400 | 200 | 50 | 869 | 0.783 | 3 | 0.425 | 100 | 973.52 | 750.29 | 1.30 | 842.57 | 16 | 0.50 |
| C50-S0.36-A | 450 | 250 | 50 | 984 | 0.781 | 3 | 0.374 | 150 | 923.61 | 750.16 | 1.23 | 742.04 | 24 | 0.45 |
| C50-S0.48-A | 550 | 300 | 50 | 1145 | 0.734 | 4 | 0.403 | 250 | 1013.99 | 750.03 | 1.35 | 785.93 | 29 | 0.50 |
| C50-S0.53-A | 600 | 300 | 50 | 1204 | 0.704 | 4 | 0.367 | 300 | 1000.13 | 750.40 | 1.33 | 784.88 | 27 | 0.51 |
| C50-S0.54-A | 400 | 200 | 50 | 1400 | 1.261 | 3 | 0.425 | 200 | 747.58 | 750.06 | 1.00 | 649.78 | 15 | 0.44 |
| C50-S0.47-A | 450 | 250 | 50 | 1214 | 0.963 | 3 | 0.374 | 200 | 857.81 | 750.03 | 1.14 | 713.39 | 20 | 0.46 |
| C50-S0.38-A | 550 | 300 | 50 | 963 | 0.617 | 4 | 0.403 | 200 | 1069.01 | 750.02 | 1.43 | 732.42 | 46 | 0.45 |
| C50-S0.35-A | 600 | 300 | 50 | 874 | 0.511 | 4 | 0.367 | 200 | 1111.27 | 750.24 | 1.48 | 863.72 | 29 | 0.51 |
| C30-S0.28-C | 750 | 400 | 30 | 623 | 0.267 | 5 | 0.364 | 200 | 961.24 | 750.20 | 1.28 | 660.11 | 46 | 0.61 |
| C40-S0.30-C | 700 | 350 | 40 | 623 | 0.308 | 5 | 0.391 | 200 | 1071.68 | 750.20 | 1.43 | 749.99 | 43 | 0.54 |
| C50-S0.32-C | 650 | 350 | 50 | 670 | 0.360 | 4 | 0.338 | 200 | 1175.98 | 750.32 | 1.57 | 928.08 | 27 | 0.55 |
| C60-S0.34-C | 625 | 350 | 60 | 698 | 0.391 | 4 | 0.352 | 200 | 1241.41 | 750.15 | 1.66 | 1017.34 | 22 | 0.51 |
| C70-S0.35-C | 600 | 300 | 70 | 729 | 0.426 | 4 | 0.367 | 200 | 1402.73 | 750.55 | 1.87 | 1165.20 | 20 | 0.51 |
| C50-S0.19-C | 550 | 300 | 50 | 623 | 0.321 | 4 | 0.403 | 100 | 1156.96 | 750.20 | 1.54 | 945.47 | 22 | 0.53 |
| C50-S0.26-C | 600 | 300 | 50 | 623 | 0.320 | 4 | 0.367 | 150 | 1146.49 | 750.20 | 1.53 | 873.48 | 31 | 0.51 |
| C50-S0.38-C | 690 | 350 | 50 | 787 | 0.397 | 5 | 0.397 | 250 | 1220.62 | 750.56 | 1.63 | 910.05 | 34 | 0.55 |
| C50-S0.43-C | 725 | 350 | 50 | 897 | 0.430 | 5 | 0.377 | 300 | 1269.74 | 750.70 | 1.69 | 958.05 | 33 | 0.59 |
| Source | Specimen No. | h0/mm | b/mm | av/mm | fc/MPa | fy/MPa | As/mm2 | fyt/MPa | Ast/mm2 | Vt/kN | Vd,ACI/kN | αACI | Vd,GB/kN | αGB |
|---|---|---|---|---|---|---|---|---|---|---|---|---|---|---|
| 1976 Mattock [11] | B1 | 226 | 152 | 102 | 25 | 335 | 258 | 449 | 129 | 209 | 103 | 2.02 | 89 | 2.35 |
| B2 | 226 | 152 | 152 | 24 | 321 | 400 | 462 | 129 | 173 | 116 | 1.50 | 70 | 2.46 | |
| B3A | 225 | 152 | 229 | 29 | 357 | 639 | 452 | 258 | 187 | 115 | 1.63 | 61 | 3.08 | |
| 2015 Al- Shaarbaf [32] | LNC1 | 215 | 150 | 108 | 35 | 532 | 339 | 510 | 113 | 186 | 214 | 0.87 | 96 | 1.94 |
| LSCC1 | 215 | 150 | 108 | 36 | 532 | 339 | 510 | 113 | 218 | 220 | 0.99 | 97 | 2.24 | |
| HNC1 | 215 | 150 | 108 | 46 | 532 | 339 | 510 | 113 | 210 | 228 | 0.92 | 108 | 1.94 | |
| HSCC1 | 215 | 150 | 108 | 48 | 532 | 339 | 510 | 113 | 229 | 229 | 1.00 | 110 | 2.08 | |
| LNC8 | 215 | 150 | 108 | 35 | 532 | 339 | 510 | 57 | 193 | 214 | 0.90 | 96 | 2.01 | |
| HNC8 | 215 | 150 | 108 | 46 | 532 | 339 | 510 | 57 | 209 | 228 | 0.92 | 108 | 1.93 | |
| 2018 Wilson [15] | C0 | 559 | 356 | 368 | 37 | 506 | 2039 | 506 | 1032 | 1427 | 1005 | 1.42 | 527 | 2.71 |
| C1 | 559 | 356 | 330 | 45 | 487 | 2039 | 487 | 774 | 1678 | 1238 | 1.36 | 585 | 2.87 | |
| C2 | 559 | 356 | 330 | 47 | 487 | 2039 | 487 | 1032 | 1785 | 1242 | 1.44 | 619 | 2.88 | |
| 1996 Foster [13] | SB2 | 740 | 150 | 250 | 56 | 430 | 1548 | 420 | 465 | 1200 | 856 | 1.40 | 476 | 2.52 |
| SC2–1 | 600 | 125 | 300 | 62 | 430 | 2322 | 420 | 465 | 980 | 629 | 1.56 | 277 | 3.54 | |
| SD1 | 600 | 125 | 300 | 95 | 430 | 2322 | 420 | 465 | 1000 | 808 | 1.24 | 315 | 3.17 | |
| SD2 | 600 | 125 | 300 | 65 | 430 | 2322 | 420 | 465 | 1000 | 661 | 1.51 | 281 | 3.56 | |
| PG2 | 500 | 150 | 300 | 94 | 415 | 2322 | 490 | 387 | 1050 | 957 | 1.10 | 286 | 3.67 | |
| 2010 Othman [33] | C11 | 239 | 180 | 135 | 40 | 415 | 452 | 415 | 101 | 351 | 227 | 1.55 | 128 | 2.74 |
| C12 | 239 | 180 | 135 | 50 | 415 | 452 | 415 | 101 | 383 | 230 | 1.67 | 140 | 2.73 | |
| C13 | 239 | 180 | 135 | 60 | 415 | 452 | 415 | 101 | 424 | 232 | 1.83 | 148 | 2.87 | |
| C21 | 239 | 180 | 135 | 40 | 415 | 452 | 415 | 151 | 373 | 227 | 1.64 | 128 | 2.91 | |
| C22 | 239 | 180 | 135 | 50 | 415 | 452 | 415 | 151 | 406 | 230 | 1.77 | 140 | 2.90 | |
| C23 | 239 | 180 | 135 | 60 | 415 | 452 | 415 | 151 | 476 | 232 | 2.05 | 148 | 3.22 | |
| C31 | 239 | 180 | 135 | 40 | 415 | 452 | 415 | 201 | 402 | 227 | 1.77 | 128 | 3.13 | |
| C32 | 239 | 180 | 135 | 50 | 415 | 452 | 415 | 201 | 425 | 230 | 1.85 | 140 | 3.03 | |
| C33 | 239 | 180 | 135 | 60 | 415 | 452 | 415 | 201 | 476 | 232 | 2.05 | 148 | 3.22 | |
| 2021 Yin [29] | C30-S0.57-A | 347 | 300 | 200 | 28 | 422 | 804 | 478 | 471 | 492 | 372 | 1.32 | 253 | 1.94 |
| C45-S0.67-A | 295 | 300 | 200 | 54 | 425 | 942 | 478 | 471 | 730 | 408 | 1.79 | 267 | 2.73 | |
| C60-S0.73-A | 271 | 300 | 200 | 44 | 492 | 1017 | 478 | 471 | 754 | 453 | 1.67 | 217 | 3.48 | |
| C45-S0.33-A | 298 | 300 | 100 | 54 | 459 | 615 | 478 | 471 | 824 | 464 | 1.78 | 381 | 2.16 | |
| C45-S0.80-A | 371 | 300 | 300 | 50 | 492 | 1017 | 478 | 628 | 662 | 469 | 1.41 | 296 | 2.24 | |
| C30-S0.42-C | 475 | 300 | 200 | 24 | 478 | 393 | 541 | 303 | 573 | 314 | 1.82 | 345 | 1.66 | |
| C45-S0.50-C | 399 | 300 | 200 | 54 | 458 | 452 | 478 | 314 | 624 | 295 | 2.12 | 351 | 1.78 | |
| C60-S0.57-C | 349 | 300 | 200 | 44 | 458 | 565 | 478 | 314 | 593 | 318 | 1.87 | 322 | 1.84 | |
| C45-S0.31-C | 324 | 300 | 100 | 54 | 478 | 339 | 541 | 202 | 632 | 295 | 2.14 | 428 | 1.48 | |
| C45-S0.67-C | 448 | 300 | 300 | 50 | 459 | 615 | 478 | 471 | 679 | 329 | 2.06 | 358 | 1.89 |
Disclaimer/Publisher’s Note: The statements, opinions and data contained in all publications are solely those of the individual author(s) and contributor(s) and not of MDPI and/or the editor(s). MDPI and/or the editor(s) disclaim responsibility for any injury to people or property resulting from any ideas, methods, instructions or products referred to in the content. |
© 2024 by the authors. Licensee MDPI, Basel, Switzerland. This article is an open access article distributed under the terms and conditions of the Creative Commons Attribution (CC BY) license (https://creativecommons.org/licenses/by/4.0/).
Share and Cite
Huang, Y.; Peng, L.; Wei, H. Finite Element Analysis of the Shear Performance of Reinforced Concrete Corbels under Different Design Codes. Buildings 2024, 14, 3100. https://doi.org/10.3390/buildings14103100
Huang Y, Peng L, Wei H. Finite Element Analysis of the Shear Performance of Reinforced Concrete Corbels under Different Design Codes. Buildings. 2024; 14(10):3100. https://doi.org/10.3390/buildings14103100
Chicago/Turabian StyleHuang, Yuan, Leilei Peng, and Hanlin Wei. 2024. "Finite Element Analysis of the Shear Performance of Reinforced Concrete Corbels under Different Design Codes" Buildings 14, no. 10: 3100. https://doi.org/10.3390/buildings14103100
APA StyleHuang, Y., Peng, L., & Wei, H. (2024). Finite Element Analysis of the Shear Performance of Reinforced Concrete Corbels under Different Design Codes. Buildings, 14(10), 3100. https://doi.org/10.3390/buildings14103100