Article

Non-Woven Fabric Filter Materials Used in Public Buildings for Filtering Particulate Matter Experience Performance Changes under Ultrasonic Cleaning Based on Dual Carbon Target

1
School of Resources Engineering, Xi′an University of Architecture and Technology, Xi’an 710055, China
2
School of Engineering and Technology, Jiyang College of Zhejiang A&F University, Zhuji 311800, China
3
Wuhan Second Ship Design and Research Institute, Wuhan 430205, China
*
Authors to whom correspondence should be addressed.
Buildings 2024, 14(10), 3105; https://doi.org/10.3390/buildings14103105
Submission received: 27 August 2024 / Revised: 17 September 2024 / Accepted: 24 September 2024 / Published: 27 September 2024
(This article belongs to the Section Building Materials, and Repair & Renovation)

Abstract

:
The long-term use of air filters causes dust to accumulate on their surfaces or fill in the fibers of their internal filtering materials over time, thereby greatly reducing their effectiveness; therefore, the cleaning and replacement of air filter materials in public buildings are of great concern. The most commonly used non-woven fabric materials currently on the market are taken as the research object for this work, in which experiments are conducted on ultrasonic cleaning parameters, cleaning performance, regeneration effects, etc. The results showed that the best cleaning performance was achieved when the ultrasonic cleaning parameter was set to 120 W, and the cleaning time to 11.2 s, with a significant effect on particulate matter with a particle size of less than 2.5 μm. Under the premise of repeated dust containment, when PM10, PM2.5, and PM1.0 are cleaned nine, six, and seven times, respectively, the filtration performance for these particles can also recover to over 85% of the performance of the fresh filter material before cleaning; however, after ten ultrasonic cleanings, the filtration resistance decreased within the range of 4.6~20.7 Pa. In this study, we aim to effectively reduce the replacement of old filters and the generation of incineration pollution, thereby reducing carbon-dioxide-equivalent emissions and providing a reference value for achieving the efficient utilization of filter materials in public buildings under the dual carbon target.

1. Introduction

The health problems caused by environmental issues have led people to pay more attention to the air quality in their living, working, and production environments [1,2,3]. The issue of air quality is exacerbated by high-concentration pollutant emissions in some cold regions [4,5,6]; for example, cities in northern China conduct significant fossil fuel combustion during the winter heating period [4,5], which further contributes to atmospheric pollution. Related studies have shown [7,8,9,10] that particulate matter can enter the human respiratory system, causing respiratory diseases such as lung cancer [7] and, in severe cases, even death [8]. In addition to particulate matter, there are also harmful gases, microorganisms, etc., that can spread through the air and enter other organs of the human body, thereby damaging the body and its immune system, causing irreparable damage [9,10]. Currently, high concentrations of particulate matter are still the main research object in air treatment; therefore, the quality of the indoor environment has long been a focus of attention, and the aim of creating a healthy environment requires continuous in-depth research and exploration.
As a result, countries and organizations around the world have conducted extensive research on how to reduce air pollution and have introduced a series of relevant policies and regulations [11,12,13] to control pollution from the source and set recommended limits for control. From multiple perspectives, targeted pollutants have shown decreasing trends year by year; however, due to the many influencing factors [14], the effective creation of indoor environments is still the focus of research at present.
Air filters are widely used [15], especially in densely populated public buildings, to filter polluted outdoor air into fresh, clean air, and improve the air quality in living environments. In the post-pandemic era, with strict requirements for indoor environments, the use and replacement of air filters will also become more widespread. According to relevant statistics, the usage of air filters has reached 36.78 million units as of 2021 [16]; therefore, the usage of air filters has become prevalent, mainly because air filters adsorb significant quantities of particles, residue from oil stains, etc., after installation and short-term use. However, this usage results in the accumulation of solid particles, gas pollutants, and bioaerosols on the fiber surface and in the deep layers of the air filtration materials inside, leading to increased resistance, decreased filtration efficiency, and even the inability to function properly [17,18]. In addition, a large number of bacteria can easily breed and grow on the fiber surface, resulting in secondary indoor pollution [19]. In this context, the replacement and cleaning of air filter materials have become significant issues; the most common solution is to replace them directly, while the replaced filter materials are mostly discarded or incinerated, which not only pollutes the environment, but also wastes resources [20]. Therefore, efficiently extending the service life, developing regeneration methods, and improving the performance of existing filter materials have become current research hotspots.
Many experiments have been conducted to research the performance of filter materials [21,22,23,24,25], some of which mainly focus on the inherent performance of filter materials [21,22], increasing their capture efficiency [21], improving the toughness of filter fibers [22], or optimizing the structural form of filter materials [23]. Other research focuses on the service cycle of existing filter materials, clarifying the replacement time range [24], and studying regeneration methods [25]. Although the above studies have achieved some results, they still cannot effectively solve the prominent practical problems caused by the frequent replacement of filter materials, or the extensive use of incineration to dispose of discarded materials [20]. In addition, certain achievements have been made in the research and development of new materials; however, due to their relatively high costs [26], they are difficult to widely promote at this stage. Therefore, conducting research on the regeneration of existing filter materials is of greater practical significance and may be able to effectively solve the aforementioned difficulties associated with replacing large quantities of filter materials.
At present, the most commonly used filter materials are polyester and non-woven fabrics [27]. Polyester is mostly used for coarse filters, which mainly filter particles larger than 5 μm and prevent damage to the end filter caused by leaves, flying insects, and large particles [27]. Non-woven fabrics are often used as end filters in public buildings, and they aid in purifying and maintaining the indoor environment. Other, more efficient, filtering materials are used in places with high environmental requirements, based on differences in usage and human requirements. Given the aforementioned qualities, further research on the cleaning of non-woven fabrics is the most practical for public and civil buildings. The most commonly used cleaning method is water washing, as there are lower economic and treatment costs for the utilized aqueous solution [28]; however, there still exists the phenomenon of poor water flow stability and uneven cleaning, which easily leads to poor regeneration effects on the filter material after cleaning. In recent years, ultrasonic cleaning technology has gradually been applied to filter materials, due to its strong penetration and impact on airflow, which can separate attached pollutants [29]. Currently, research on it is mainly focused on the relevant principles [30], influencing factors [31], and cleaning methods of ultrasonic technology [32] in the laboratory. However, due to the special nature of fiber materials [33], they are prone to damage [34], and the most efficient parameters for ultrasonic cleaning [35] are not yet clear. There is relatively little research on the parameters and stability for existing air filter materials under ultrasonic cleaning methods, but there is almost no research on whether the most commonly used non-woven fabrics in the current market can be cleaned using ultrasonic waves, on their optimal cleaning parameters, or on their performance changes after cleaning. Therefore, it is both valuable and practical to conduct research on the ultrasonic cleaning of non-woven fabric materials.
Thus, the work herein focuses on the practical problems mentioned above, using existing non-woven fabrics that are commonly used as filter materials as the research object, and in-depth research on their regeneration parameters and performance using ultrasonic cleaning method was conducted. This research, therefore, provides a reference basis for the regeneration and utilization of air filter fibers under the dual carbon target.

2. Methods

2.1. Experimental Instruments

Figure 1 presents the utilized experimental platform, which was built according to our experimental requirements. A GRIMM1.109 Portable Aerosol Spectrometer was used to measure the concentrations of particles before and after the air filters were applied, the specific testing locations of which were measuring points 3 and 6, shown in Figure 1; it was supplied by Beijing Saak-Mar Environmental Instrument Ltd., Beijing, China. The upper limit for concentration measurements was 2,000,000 P/L, the measurement range was 0.1~100,000 μg/m3, and the repeatability was 5%. An MTQ300 g electronic analytical balance was used to measure the weight of dust-loading materials; it was supplied by Shenzhen Mobil Electronics Co., Ltd., Shenzhen, China. The measuring range was 0.03~300 g, and the measurement accuracy was 0.001 g. An HD2114P.0 Portable Micromanometer was used to measure filtration resistance, the specific testing locations for which are at measuring points 2 and 5 in Figure 1; it was supplied by DeltaOHM Co., Ltd., Selvazzano (PD), Italy. Its accuracy was ± 2%, reading + 0.1 m/s, and the pressure range was ± 0.4% F.S. An HD37AB1347 Indoor Air Quality Monitor was used to measure velocity, the specific testing location for which is at measuring point 1 in Figure 1; it was supplied by DeltaOHM Co., Ltd., Selvazzano (PD), Italy. Its accuracy range was ± 3%. An XCS-101-0BS electrical blast-drying oven was used for the drying process after cleaning the materials; it was supplied by Shaoxing shi Shang Cheng Instrument equipment Co., Ltd., Shaoxing, China. The temperature ranged from room temperature to 300 °C. A JSM-6510LV scanning electron microscope was used for characterization analysis of the fiber structure morphology inside the material; it was supplied by Japan Electronics Co., Ltd., Tokyo, Japan. Its magnification was 5~30 million times, and its resolution was up to 3.0 nm. A KQ-500DE ultrasonic cleaning instrument was used to remove dust from fibers; it was supplied by Kunshan Shumei Co., Ltd., Kunshan, China. Its ultrasonic power was 0–500 W, with power adjustable from 40 to 100%. Two identical filter materials were tested for each group, and they (F6, EN779, ISO9001) were obtained from GuangDong Fresh Filter Co. Ltd., Foshan, China. The fibers’ diameter, filling ratio, and porosity were 21.16 ± 0.03 μm, 2.23 ± 0.02%, and 97.77 ± 0.02%, and the average value of the two filter materials was used for research. The average concentrations over 5 min before and after testing were used in our calculations to reduce experimental errors.

2.2. Evaluation of Performance Parameters

The cleanliness of air filter materials after cleaning was used as the evaluation standard, and the amount of dust in air filter materials after cleaning was calculated using Equation (1) [31].
η 1 = ( 1 m M ) × 100 %
where η 1 is cleanliness (%); m is the mass of residual dust in the filter material after cleaning (g); and M is the initial mass of the fresh filter material (g).
Air filter filtration efficiency was calculated using Equation (2) [32].
η = C 1 C 2 C 1 × 100 %
where η is the filtration efficiency (%); C1 is the concentration of particulate matter before filtration (μg/m3); and C2 is the concentration of particulate matter after filtration (μg/m3).
Air filter counting efficiency was calculated using Equation (3) [32].
η i = ( 1 N 2 i N 1 i ) × 100 %
where η i is the counting efficiency (%); N 1 i is the average counting concentration of a certain particle size in a segment before filtration, (particle/L); and N 2 i is the average counting concentration of a certain particle size in a segment after filtration, (particle/L).
The filtration velocity was the same before and after the filters were applied, and the cross-sectional area was equal. The filtration resistance could be expressed as the static pressure difference and was calculated using Equation (4) [32].
Δ P = P 2 P 1
where P1 is the static pressure before filtration (Pa) and P2 is the static pressure after filtration (Pa).
The air filter filtration efficiency decay rate was calculated using Equation (5) [16].
K = η n η 0 η 0 × 100 %
where η n is the filtration efficiency, corresponding to each ultrasonic cleaning at different filtration velocities (n is the test condition at different filtration velocities), %; η 0 is the filtration efficiency of fresh filter material, without ultrasonic cleaning, at different filtration velocities, %. When K > 0, the filtration efficiency increases, and when K < 0, the filtration efficiency decreases.

3. Results and Discussion

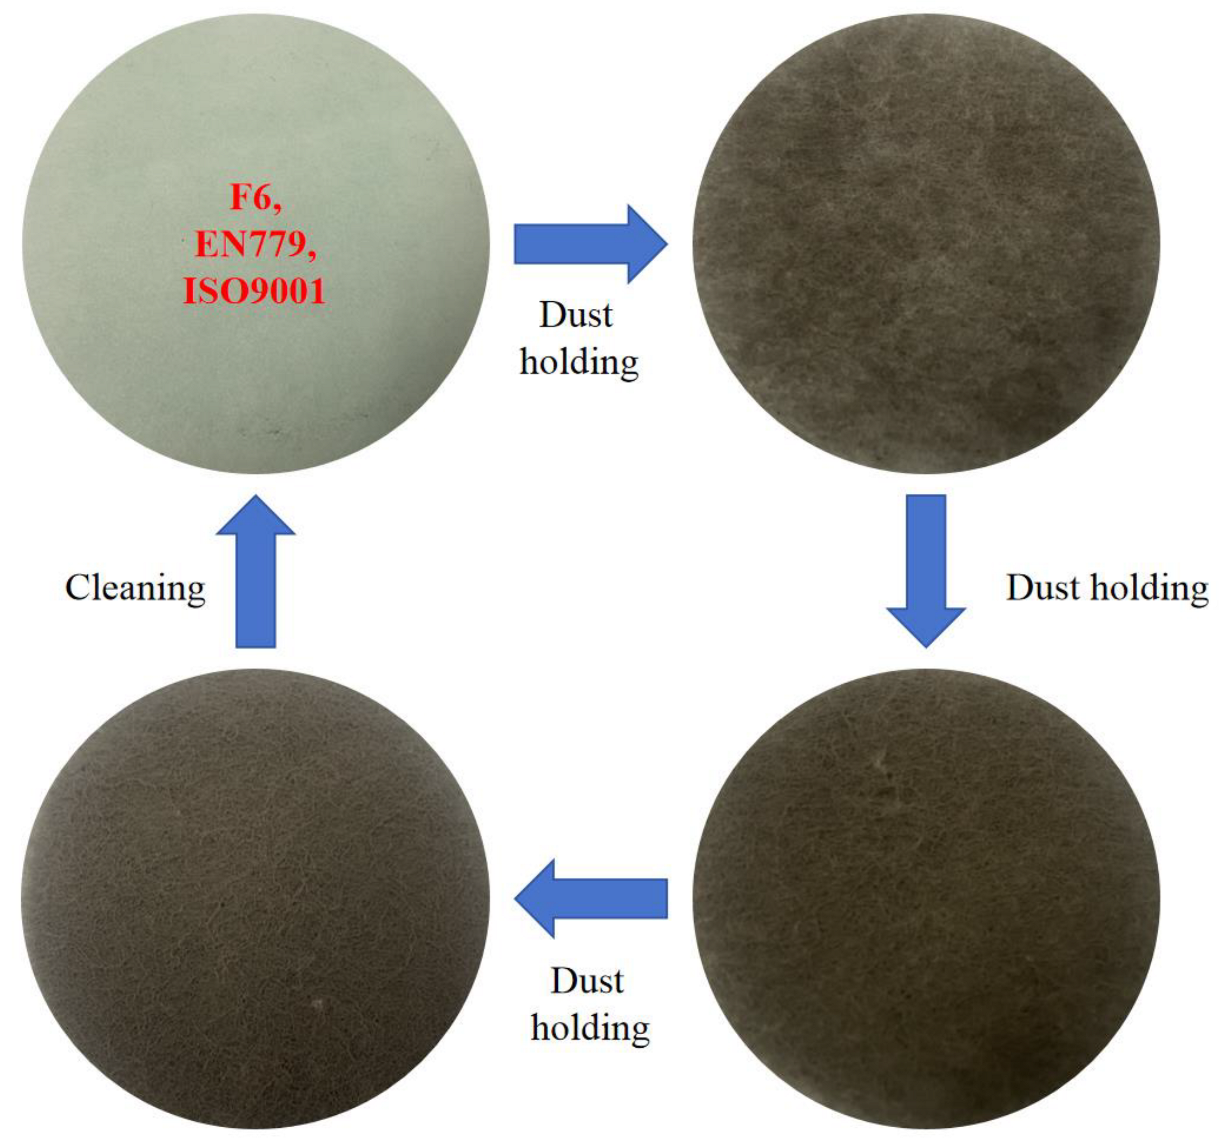
3.1. Determination of Ultrasonic Cleaning Parameters

Referring to the relevant literature and experimental data, it was found that the temperature of the water used has a relatively small impact on the effects of ultrasonic cleaning in practical engineering [16], and it is generally recommended to use tap water for easy accessibility and operation. Related studies have also shown that the cleaning effects of low-frequency ultrasound are higher than those of high-frequency ultrasound [33]; therefore, in this study, we only considered the influences of ultrasound frequency and ultrasound time on the cleaning effects and, when controlling for a single variable, the designed ultrasonic power levels were 120 W and 200 W, respectively. The ultrasonic cleaning durations were 5 s, 10 s, 15 s, 20 s, 25 s, and 30 s. The fresh filter material was weighed separately, the dust was collected, and water flow was maintained to completely clean the entire structure of the material. Thereafter, the material was cleaned before weighing, and then Equation (1) was applied. Cleanliness was obtained under different ultrasound powers and cleaning durations while ensuring the control of a single variable. The specific operation and physical changes utilized for this experiment are shown in Figure 2, and the analysis of related factors is shown in Figure 3.
Figure 3 shows that the ultrasonic cleaning method has different effects on non-woven air filter materials under different ultrasonic powers, and the difference in cleaning time is not significant under different ultrasonic powers. The cleanliness limit for this study was a post-cleaning efficiency greater than or equal to 85% of the pre-cleaning efficiency for the air filter standard [34]; therefore, through the fitting in Figure 3, it was found that, when the cleanliness reaches 85% of the original cleanliness, the corresponding durations for 120 W and 200 W are 11.2 s and 9.6 s, respectively. Therefore, more energy-efficient process parameters were selected as recommended parameters. By calculating the electricity consumption under different working conditions, we found that the electricity consumption for 120 W was 0.000373 KWh, and for 200 W was 0.000533 KWh; the power consumption for 200 W is higher, so process parameters of 120 W ultrasonic power and 11.2 s cleaning time (actual experimental cleaning time selected was an integer of 12 s) were selected as recommended parameters after comprehensive consideration. In our experimental study of ultrasonic cleaning methods, described in the following text, multiple ultrasonic cleaning operations were carried out using these operating parameters to test filter regeneration performance.

3.2. Filter Performance Testing and Analysis

Dust-loading experiments were conducted [25] according to the dust generation quantities given in the relevant specifications [34], using dust particles from the ventilation system. Dust generation was stopped when the final resistance of the filter material reached twice the initial resistance [34]. The above steps were repeated after determining the optimal ultrasonic cleaning parameters, and the changes in filtration efficiency with the increasing number of cleaning cycles are shown in Figure 4.
Figure 4 shows that the filtration efficiency shows a trend of first increasing and then decreasing with increasing filtration velocity, and reaches its maximum when the filtration velocity is 0.8 m/s. This result is consistent with the literature, thus verifying the accuracy of our outcomes [23]. Compared to the original group, the efficiency of PM10 filtration slightly increased by 2.52%, 1.11%, and 0.49% after one to three cycles of ultrasonic cleaning at the optimal filtration velocity; the efficiency of PM2.5 filtration increased slightly, by 4.02%, 3.59%, and 1.42%, respectively; the efficiency of PM1.0 filtration also increased slightly, by 2.11%, 1.34%, and 0.30%, respectively. Overall, the filtration efficiency of PM10, PM2.5, and PM1.0 gradually decreased with the increasing number of cycles after about three ultrasonic cleanings, after which the filtration efficiency of PM10 decreased by 1.72%, to 18.96%, after 4 to 10 ultrasonic cleanings; that of PM2.5 decreased by 1.56%, to 12.34%; and that of PM1.0 decreased by 1.74%, to 10.95%. This decreased efficiency is mainly because, after three cleaning cycles, some dust will still adhere to the fibers of the filter materials, blocking the pores between the fibers and reducing their porosity, resulting in a slight improvement in filtration efficiency; however, with the continuous effect of ultrasonic vibration, the fibers between the non-woven fabric filter materials are subjected to multiple shear forces, causing the originally disordered fibers inside the filter materials to develop a regular and uniform direction [16,35]. The porosity of the filter materials also shows a slight increase, and the amount of dust attached to the filter material fibers decreases, resulting in a gradual decrease in filtration efficiency. Figure 5 shows the trend of the filtration efficiency decay rate with the number of cleanings.
Figure 5 shows that, after repeated dust loading and ultrasonic cleaning, the filtration efficiency decay rates of non-woven fabric materials for PM10, PM2.5, and PM1.0 all show gradually decreasing trends. The variation range for the PM10 filtration efficiency decay rate after 10 ultrasonic cleaning cycles is −17.65~4.45%; that for PM2.5 is −22.77~12.33%; and that for PM1.0 is −26.11% to 8.41%. For the filtration of PM10, the performance of non-woven fabric material can recover to over 85% of the fresh filter material’s performance after one to nine ultrasonic cleanings; for PM2.5, this recovery occurs after one to six cleanings; for PM1.0, it occurs after one to seven cleanings. After exceeding their respective numbers of cleaning cycles, the filtration efficiency of PM10, PM2.5, and PM1.0 suddenly decreased, and the filtration efficiency could drop to below 85% of the performance of the filter material; this decrease in efficiency is due to the shear force generated by the repeated action of ultrasound, which causes slight damage to the fiber structure of the filter material, thus leading to an increase in pores and a sharp decrease in its particle capture effect [16]. Therefore, it can be seen that nine ultrasonic cleaning cycles is the limit for PM10, six is the limit for PM2.5, and seven is the limit for PM1.0, which are consistent with their requirements for reuse.
In addition, there are slight differences in the filtration mechanism for particles of different sizes. Due to the porosity of the fibers, large particles do not enter the interior fibers and mostly adhere to their surface; therefore, under the action of ultrasound, large particles will directly slide off the surface of the fibers, resulting in relatively low attenuation of PM10. The smaller the particles, the deeper into the interior of the fibers they will travel. With ultrasound, some particles will detach from the fibers, while others will still enter the interior of the fibers; with increasing cleaning cycle durations, particles inside of the fiber gradually move towards the fiber’s edge and eventually detach from it. However, due to the unevenness of particles and the influence of cleaning forces, their fiber structure is affected to a certain extent, thus resulting in a relatively short cleaning cycle; this conclusion also suggests that the smaller the particles, the shorter the relative cleaning cycle.

3.3. Counting Filtration Performance Testing and Analysis

Under the same conditions as detailed above, the number of cleaning cycles also affects counting efficiency filtration under the ultrasonic cleaning method, as shown in Figure 6.
Figure 6 shows that counting filtration efficiency shows a gradually increasing trend with increasing particle size. The counting filtration efficiency of particles shows the same trend under different numbers of cleaning cycles, with relatively obvious changes in small particles and little difference in large particles, due to the fact that, as the number of ultrasonic cleaning cycles gradually increases, the shear force generated by the continuous vibration of cavitation bubbles under the ultrasound causes slight damage to the structure of the filter material fiber itself [16]. As a result, the porosity of the air filter material gradually increases, and the amount of dust attached to the fiber will also decrease after multiple cleaning cycles; therefore, the counting efficiency begins to gradually decrease.
Figure 6 also shows that the filtration performance for particles smaller than 2.5 μm decreases significantly after repeated ultrasonic cleaning, compared to particles larger than 2.5 μm. For particles smaller than 2.5 μm, the counting efficiency after 10 repeated ultrasonic cleaning cycles decreases by 28.28% compared to the fresh filter material’s counting efficiency; for particles smaller than 1.0 μm, the counting efficiency under the same condition decreases by 19.18%; for particles larger than 2.5 μm, the counting efficiency decreases by 10.57%. Therefore, ultrasonic cleaning is more effective for particles smaller than 2.5 μm.

3.4. Filtration Resistance Testing and Analysis

The effects of filtration resistance on filtration velocity under the ultrasonic cleaning method are shown in Figure 7.
Figure 7 shows that, under consecutive cleaning cycles, the filtration resistance also shows an increasing trend with the continuous increase in filtration velocity. There is a difference in the resistance range between the fresh filter material and the cleaned filter material. The resistance range of the fresh filter material is 33.3~135.2 Pa, the resistance range after the 1st cleaning is 34.6~134.9 Pa, after the 2nd cleaning is 31.7~133.2 Pa, after the 3rd cleaning is 31.0~132.7 Pa, after the 4th cleaning is 30.5~128.5 Pa, after the 5th cleaning is 29.9~129.7 Pa, after the 6th cleaning is 30.1~124.3 Pa, after the 7th cleaning is 29.5~127.1 Pa, after the 8th cleaning is 28.2~127.1 Pa, after the 9th cleaning is 28.9~120.0 Pa, and after the 10th cleaning is 38.65~121.8 Pa. The largest change in resistance occurs after the first cleaning, the main reason for which is that, under the same conditions, after the first cleaning, some dust still adheres to the filter material, which blocks the pores between fibers, thereby reducing the porosity between fibers and affecting the uniformity of airflow [36], resulting in an increase in resistance. However, with an increasing number of ultrasonic cleaning cycles, the resistance of the non-woven fabric material slightly decreases, possibly because, under the action of ultrasound, the shear force of the moving fluid causes changes in the internal fibers of the filter material [16], and the disordered fiber structure becomes more regular, resulting in a slight decrease in resistance. After 10 ultrasonic cleanings, the filtration resistance characteristics slightly decreased, compared to the initial resistance of the fresh filter material, with a decrease range of 4.6~20.7 Pa.
Furthermore, difficult-to-remove fiber bonding may occur during the practical use of filters due to the influences of particles, microorganisms, and impurities, such as spiderwebs and leaves, as well as the common failure to clean them in a timely manner. The relevant indicators imply that the resistance range after cleaning should not exceed 150% of the resistance before cleaning [34]; in order to meet their performance requirements after cleaning, we performed a fitting analysis on the results shown in Figure 7, and the fitting results are shown in Table 1.

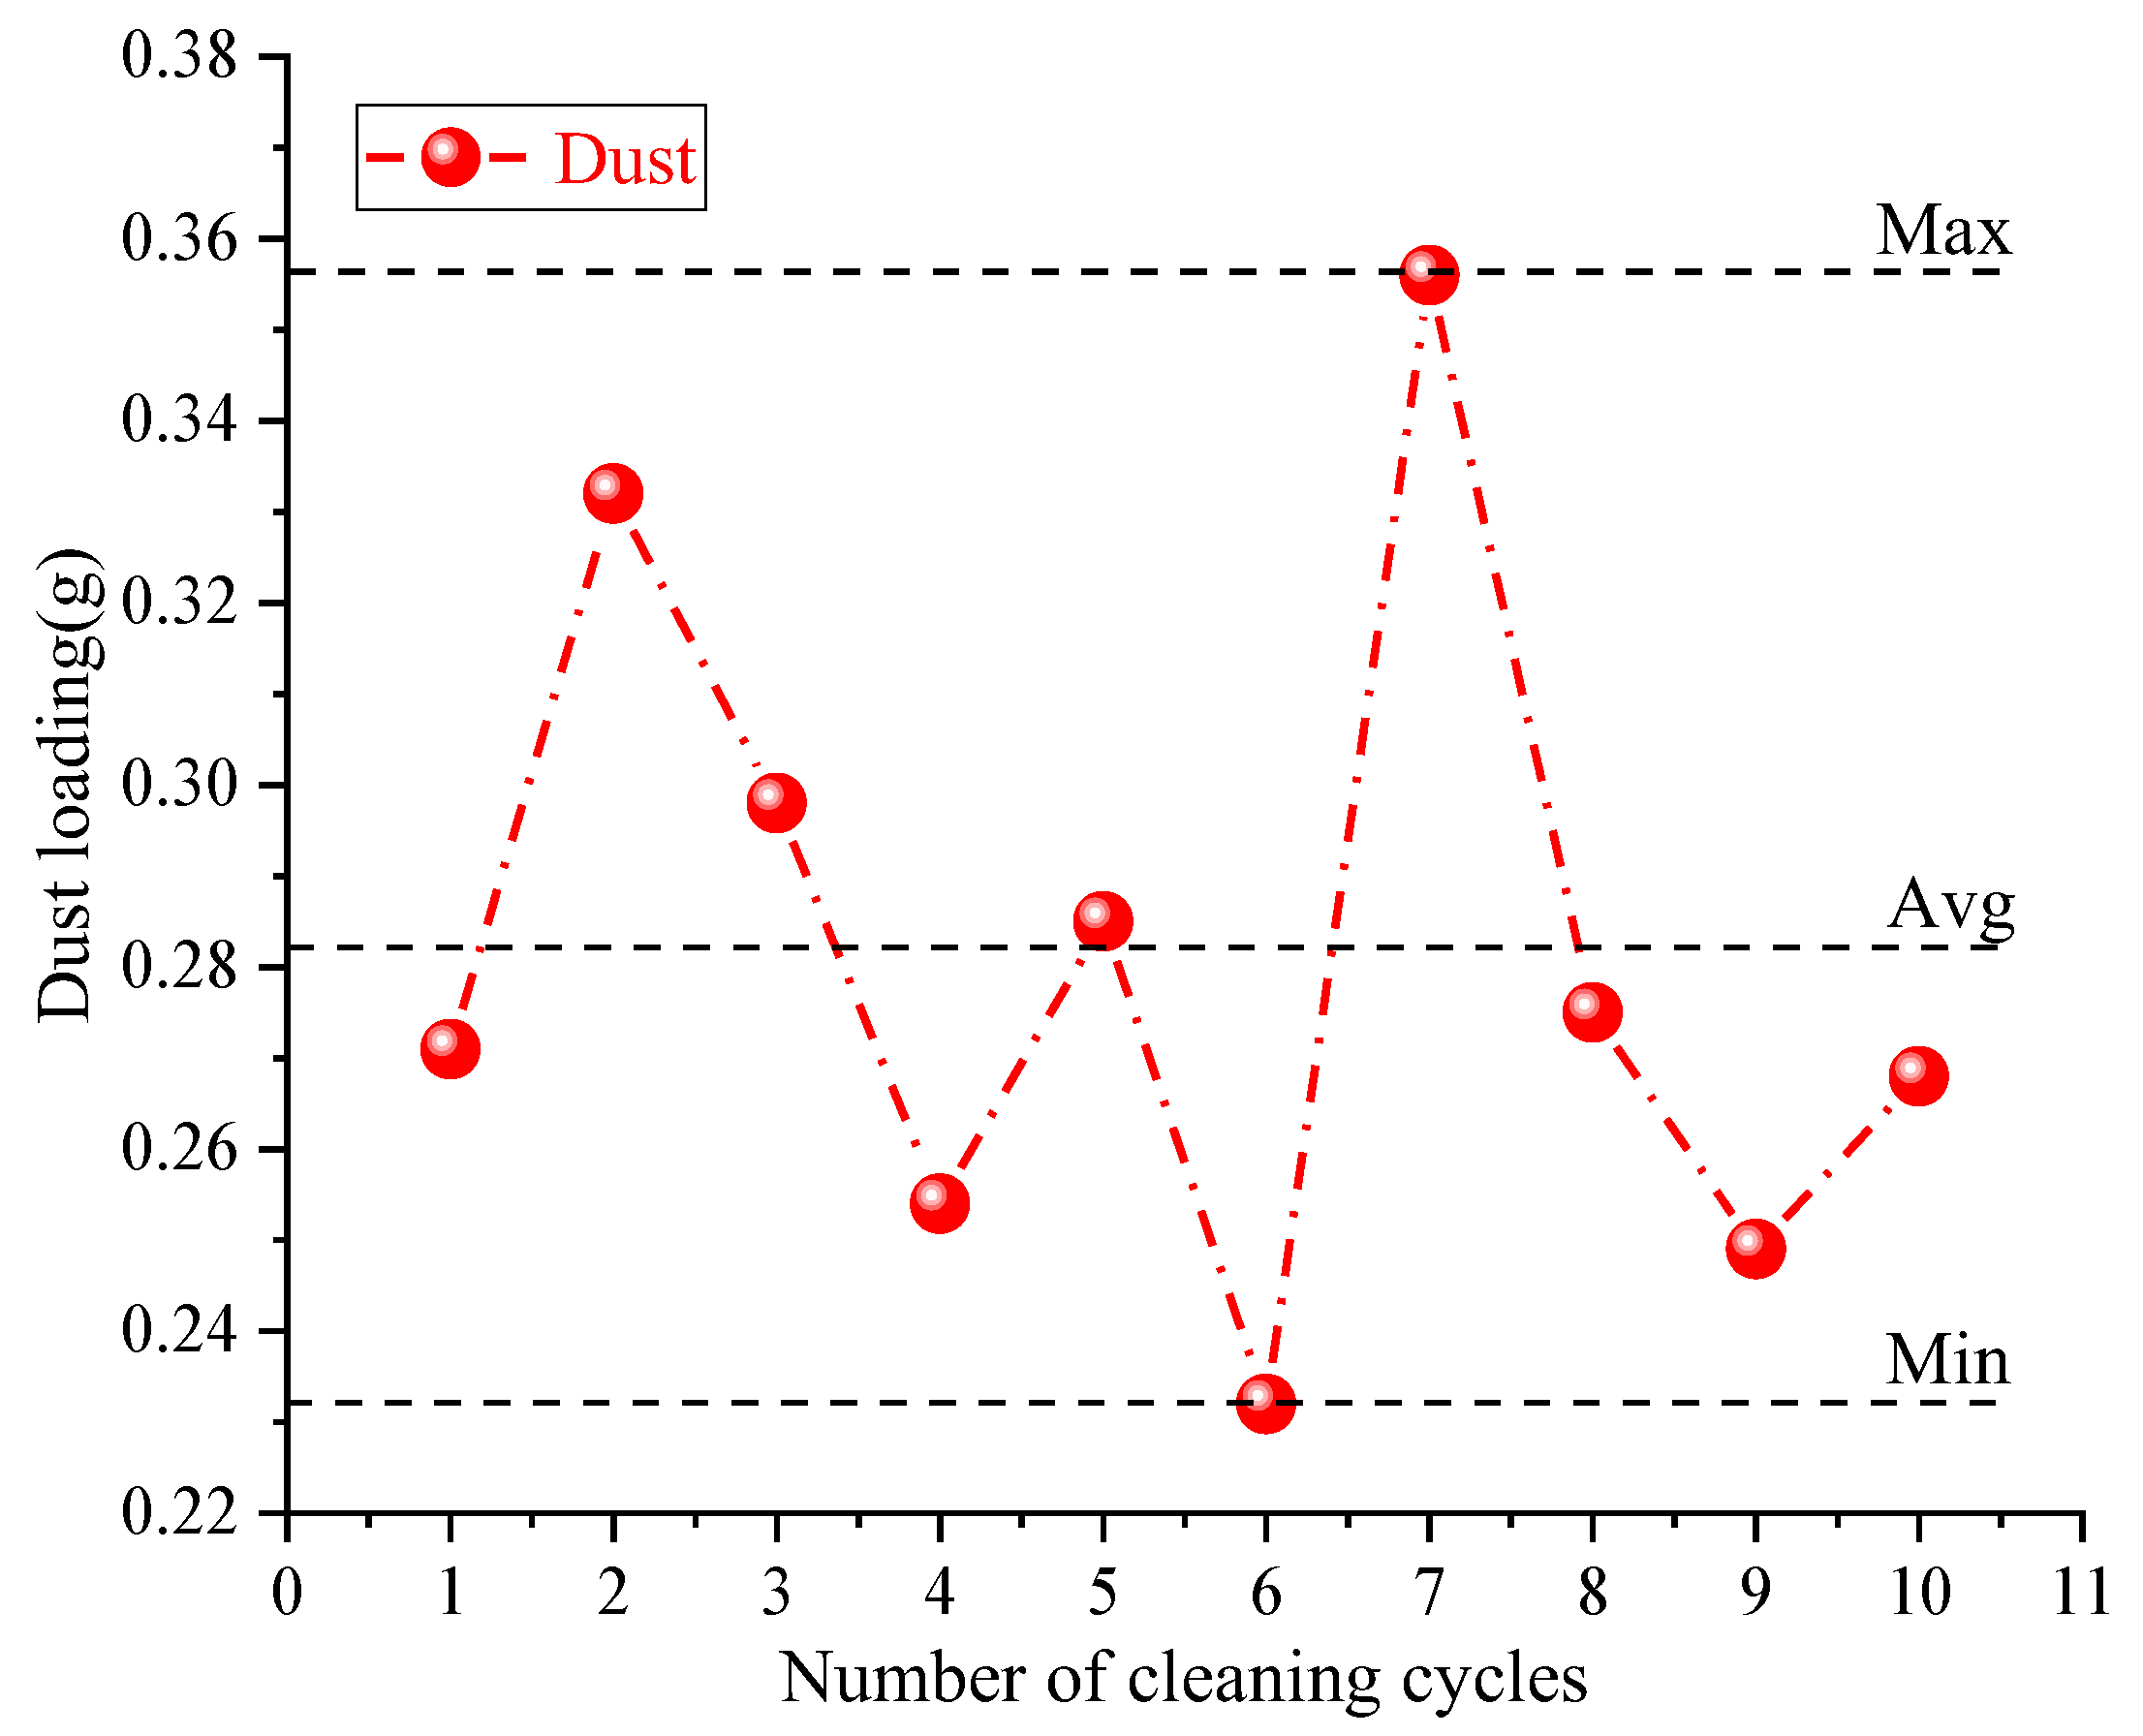
3.5. Influence of Consecutive Cleaning Cycles on Dust Loading

Figure 8 shows the effects of consecutive cleaning cycles on dust loading when the filtration velocity is 0.8 m/s.
Figure 8 shows that, after 10 cycles of ultrasonic cleaning, there was no significant change in the dust loading of the non-woven fabric material. The maximum value was 0.356 g, the minimum value was 0.232 g, the difference was 0.124 g, and the average dust loading after 10 cycles was 0.282 g; this indicates that, although it had been cleaned 10 times, there was no significant impact on the internal fiber structure of the filter material, thus proving the advantages of ultrasonic cleaning [16]. The relevant literature has pointed out the shortcomings of water cleaning [37], which can easily damage the internal structure of the fibers. As a result, the relatively small number of cleaning cycles cannot meet the performance requirements for regeneration. As further explanation of the internal structure of its fibers, Figure 9 shows a scanning electron microscope image of the non-woven fabric material.
Figure 9 shows that the fibers of the fresh non-woven fabric material exhibit a smooth and naturally twisted state, with relatively loose fibers between them. After 10 cleaning cycles, it can be seen that some fibers are worn or damaged because, during the ultrasonic cleaning process, particles attached to the surfaces of the fibers are separated from the fibers under the action of shear force; however, due to the unevenness of the particles, some of them have sharp edges, which can damage the fiber structure when separated from it. This outcome indirectly indicates that more cleaning cycles can also change the surface structure of the fibers, affecting their filtration efficiency and resistance. In addition, it was also found that the fiber sorting inside the filter material changed after 10 cleaning cycles, making it more orderly, which also proves the accuracy of Figure 3 and Figure 6. However, in practical use, it is necessary to comprehensively consider factors such as labor costs, ease of operation, and applicable site requirements [38]; Overall, therefore, ultrasonic cleaning has significant advantages, applications, and practical value in the current market.

4. Conclusions

For this study, we adopted the most commonly used non-woven fabric material currently on the market as the research object and used ultrasonic cleaning methods to study its ultrasonic cleaning parameters, cleaning performance, regeneration effects, and other properties. The conclusions of this work are as follows:
  • The experiment was conducted using a cleanliness level that reached 85% of that for the fresh filter material. The parameters of 120 W ultrasonic power and 11.2 s cleaning time were selected for the best effects.
  • The filtration efficiency shows a trend of first increasing, and then decreasing with the increase in filtration velocity and, when the filtration velocity is 0.8 m/s, the filtration efficiency reaches its maximum. Compared to the original group, the efficiency of PM10 filtration slightly increased by 2.52%, 1.11%, and 0.49% after one to three cycles of ultrasonic cleaning at the optimal filtration velocity; the efficiency of PM2.5 filtration increased slightly, by 4.02%, 3.59%, and 1.42%, respectively; the efficiency of PM1.0 filtration also increased slightly, by 2.11%, 1.34%, and 0.30%, respectively. The filtration efficiency of PM10 decreased by 1.72%, to 18.96%, after 4 to 10 ultrasonic cleanings; that of PM2.5 decreased by 1.56%, to 12.34%; and that of PM1.0 decreased by 1.74%, to 10.95%. The variation range for the filtration efficiency decay rate of PM10 after 10 ultrasonic cleanings is −17.65~4.45%; for PM2.5 is −22.77~12.33%; and for PM1.0 is −26.11% to 8.41%. It was thus determined that nine ultrasonic cleaning cycles is the limit for PM10, six is the limit for PM2.5, and seven is the limit for PM1.0, which are consistent with their requirements for reuse.
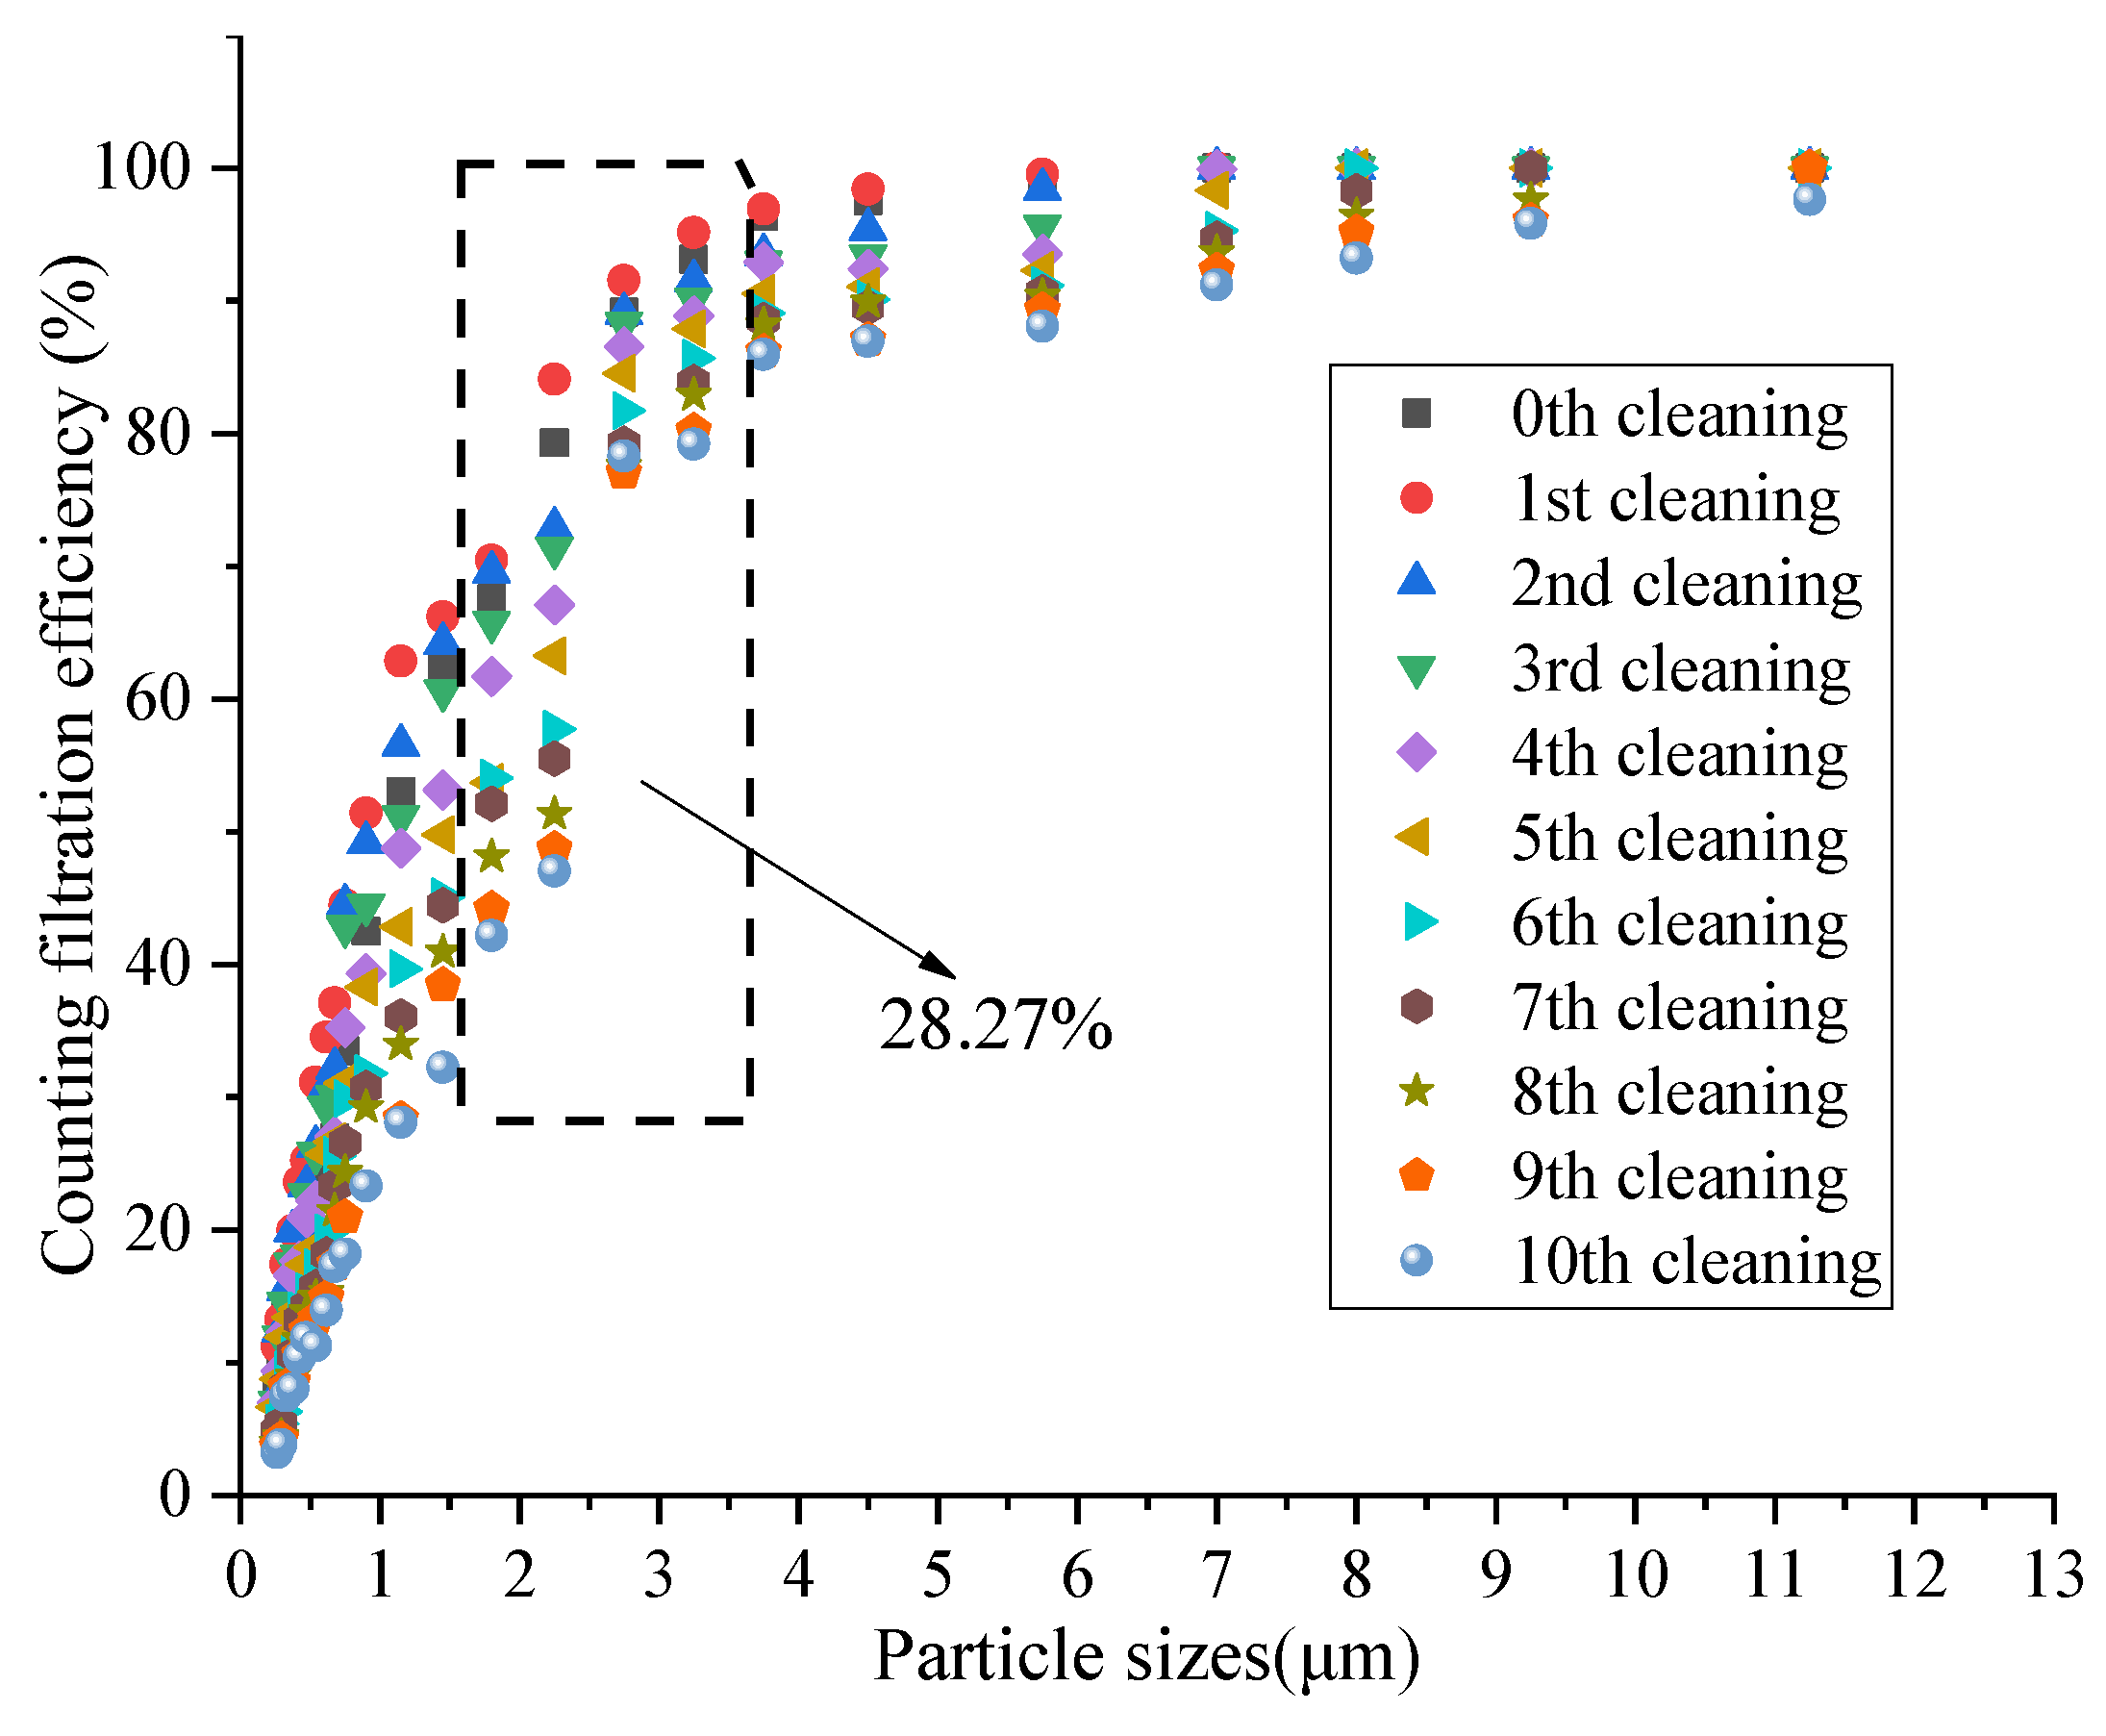
  • The counting filtration efficiency shows a gradually increasing trend with increasing particle size. Ultrasonic cleaning is mainly more effective for particles smaller than 2.5 μm, as the counting efficiency after 10 consecutive ultrasonic cleanings decreases by 28.28% compared to the fresh filter material’s counting efficiency.
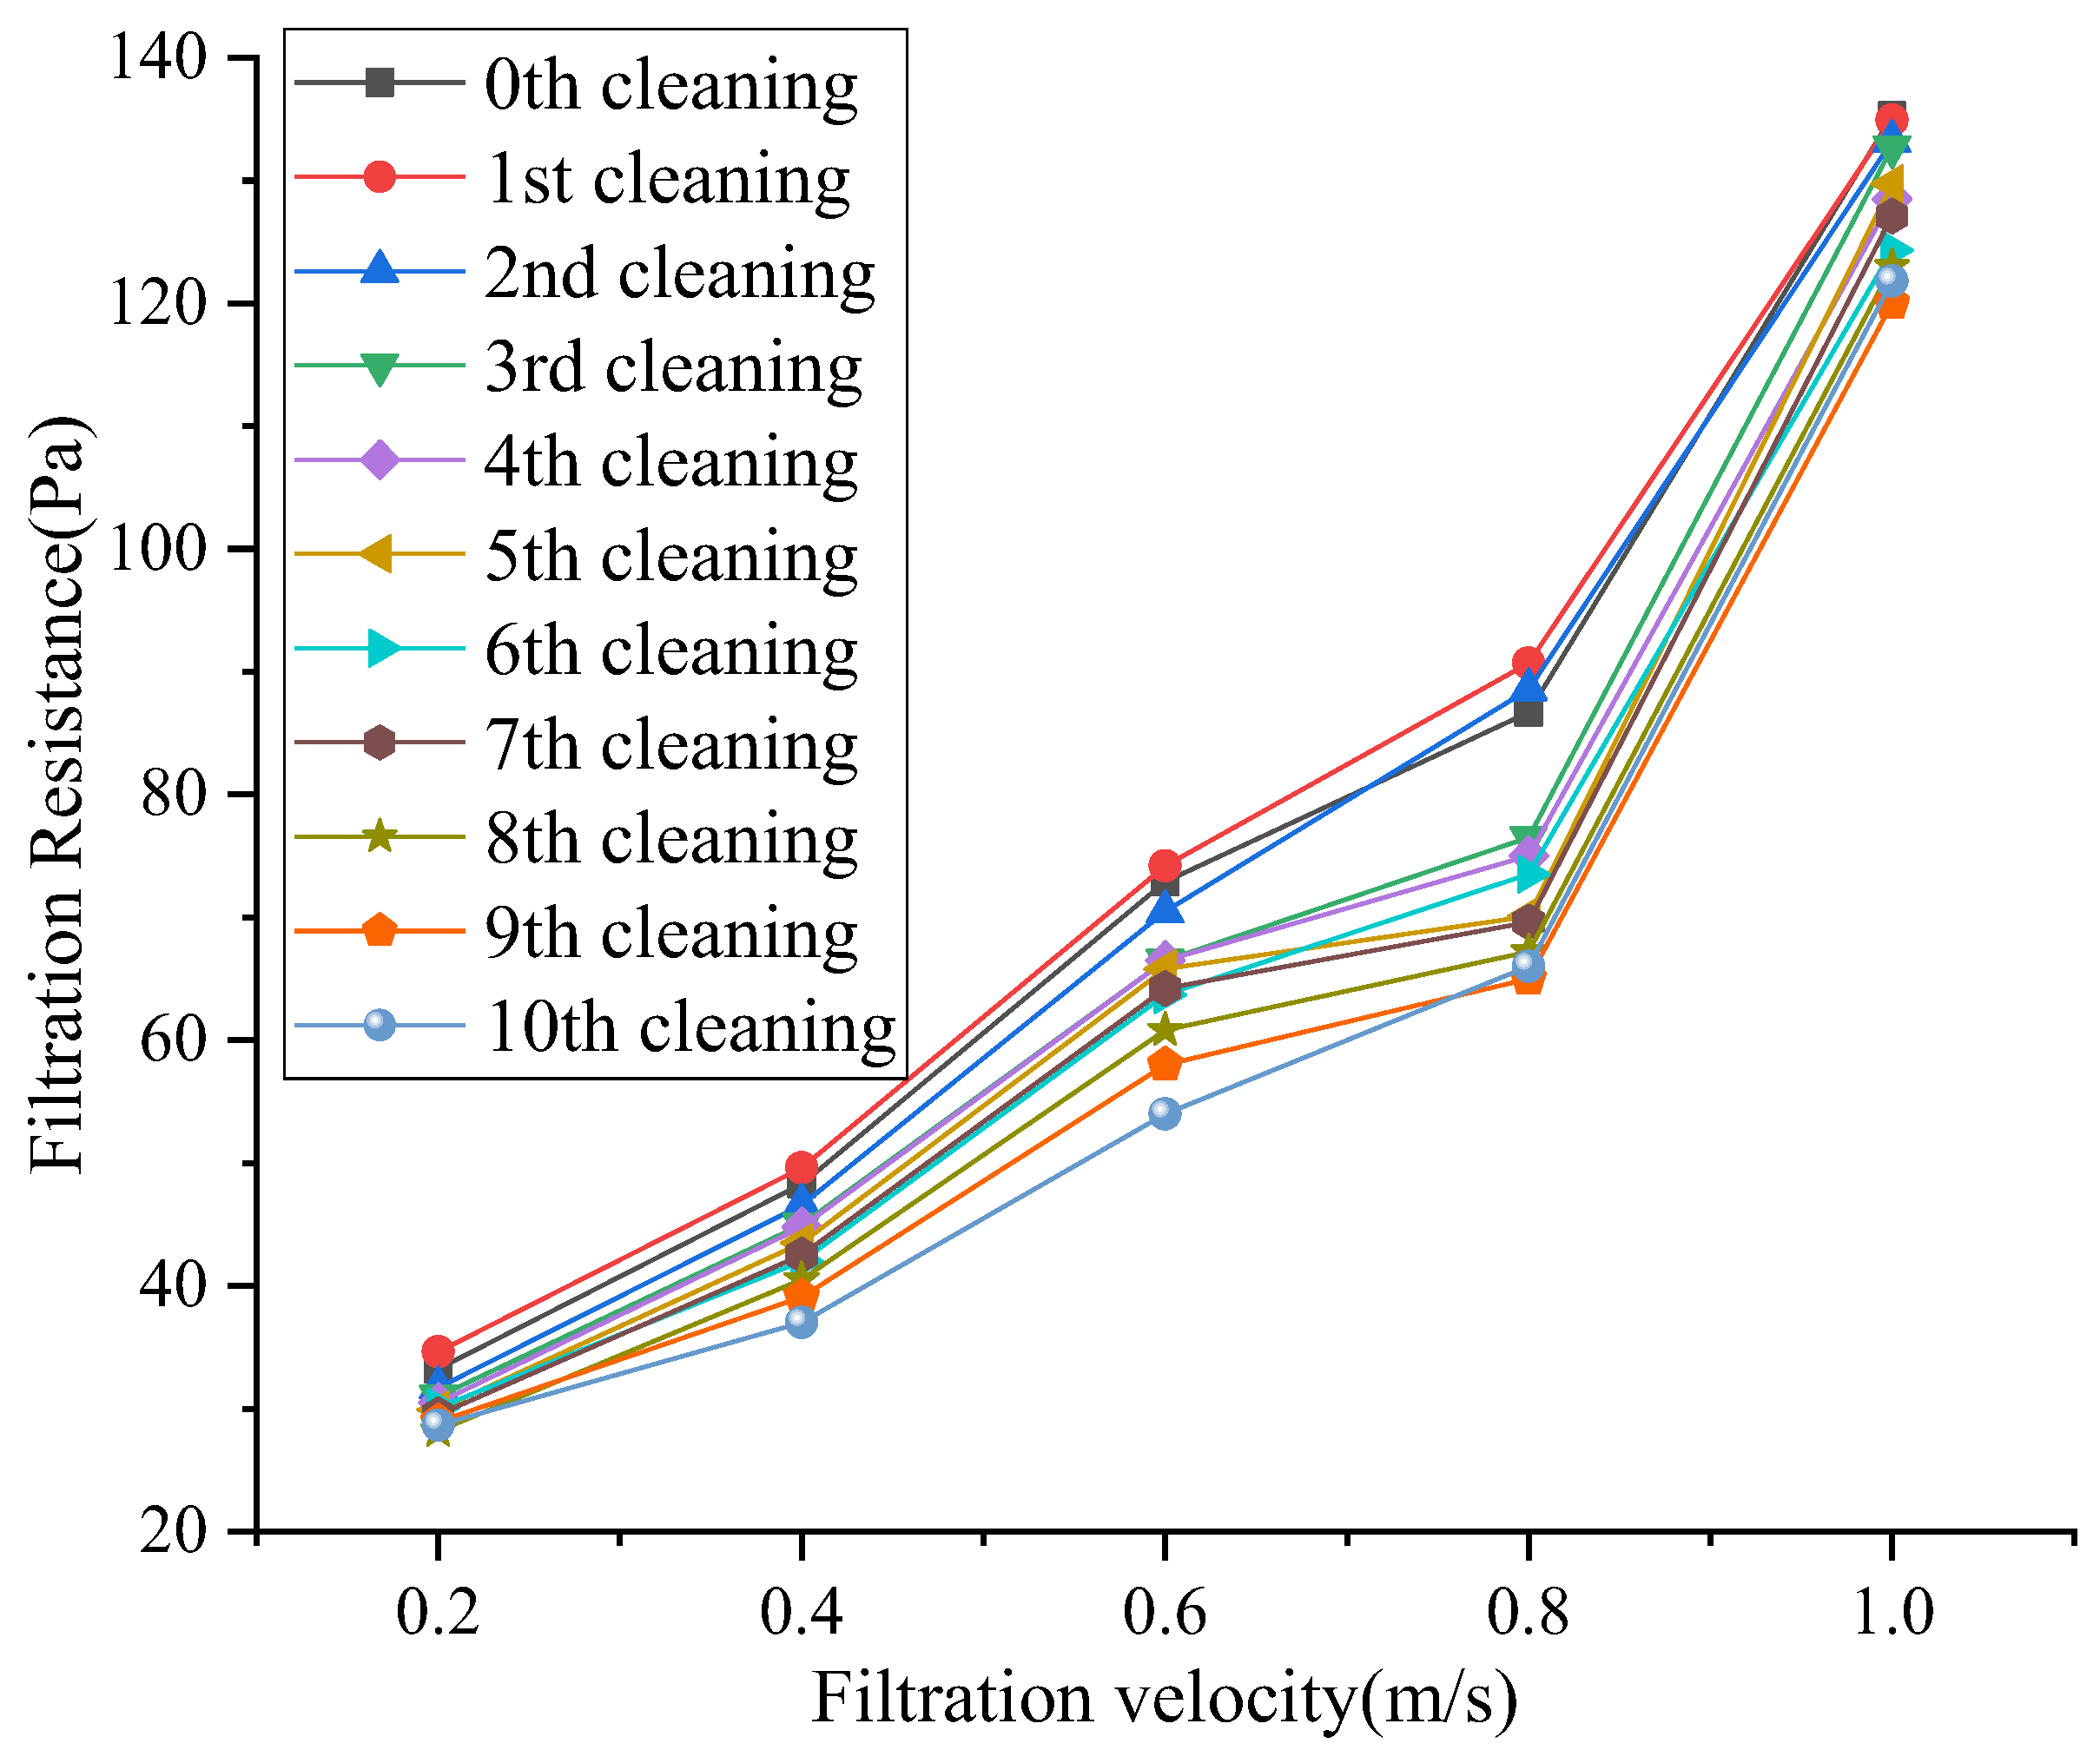
  • After 10 cycles of ultrasonic cleaning, the filtration resistance decreased, in the range of 4.6~20.7 Pa. However, it is necessary to comprehensively consider other factors in practical use, such as labor costs, ease of operation, and applicable site requirements. Overall, ultrasonic cleaning has significant advantages, and the findings herein provide data reference value for regeneration performance method and filter material evaluation.

Author Contributions

Conceptualization, T.X. and X.Z.; methodology, X.Z. and F.L.; investigation, P.C. and T.Y.; validation, F.L.; resources, P.C. and F.S.; writing—original draft preparation, X.Z. and F.S.; writing—review and editing, T.X. and T.Y. All authors have read and agreed to the published version of the manuscript.

Funding

This study was supported by the Natural Science Basic Research Program of Shaanxi Province (No. 2024JC-YBQN-0453; 2024JC-YBMS-258) the Project of Shaanxi Provincial Land Engineering Construction Group (No. DJNY-YB-2023-13), and the Shaanxi Provincial Department of Science and Technology Project (No. 2024JC-YBQN-0733).

Data Availability Statement

The data presented in this study are available on request from the corresponding author.

Conflicts of Interest

The authors declare no conflicts of interest.

References

  1. Asbach, C.; Todea, A.M.; Kaminski, H. Evaluation of a Partector Pro for atmospheric particle number size distribution and number concentration measurements at an urban background site. Aerosol Res. 2024, 2, 1–12. [Google Scholar] [CrossRef]
  2. Song, H.; Dong, Y.H.; Yang, J.Y.; Zhang, X.; Nie, X.X.; Fan, Y.X. Concentration Characteristics and Correlations with Other Pollutants of Atmospheric Particulate Matter as Affected by Relevant Policies. Int. J. Environ. Res. Public. Health 2023, 20, 1051. [Google Scholar] [CrossRef] [PubMed]
  3. Feng, T.; Sun, Y.C.; Shi, Y.T.; Ma, J.; Feng, C.M.; Chen, Z.N. Air pollution control policies and impacts: A review. Renew. Sust. Energy Rev. 2024, 191, 114071. [Google Scholar] [CrossRef]
  4. Zhang, X.; Fan, Y.S.; Wei, S.X.; Wang, H.; Zhang, J.X. Spatiotemporal Distribution of PM2.5 and Its Correlation with Other Air Pollutants in Winter During 2016~2018 in Xi’an, China. Pol. J. Environ. Stud. 2021, 30, 1457–1464. [Google Scholar] [CrossRef]
  5. Yang, Y.; Østergaard, P.A.; Wen, W.; Zhou, P. Heating transition in the hot summer and cold winter zone of China: District heating or individual heating? Energy 2024, 290, 130283. [Google Scholar] [CrossRef]
  6. Jandacka, D.; Durcanska, D.; Nicolanska, M.; Holubcik, M. Impact of Seasonal Heating on PM10 and PM2.5 Concentrations in Sučany, Slovakia: A Temporal and Spatial Analysis. Fire 2024, 7, 150. [Google Scholar] [CrossRef]
  7. Jones, R.R.; Fisher, J.A.; Hasheminassab, S.; Kaufman, J.D.; Freedman, N.D.; Ward, M.H.; Sioutas, C.; Vermeulen, R.; Hoek, G.; Silverman, D.T. Outdoor ultrafine particulate matter and risk of lung cancer in Southern California. Am. J. Resp. Crit. Care 2024, 209, 307–315. [Google Scholar] [CrossRef] [PubMed]
  8. Deng, Q.S.; Cuesta, L.; Alvarado, R.; Murshed, M.; Tillaguango, B.; Işık, C.; Rehman, A. Nexus between government stability and environmental pollution. J. Clean. Prod. 2024, 434, 140061. [Google Scholar] [CrossRef]
  9. Zhou, F.R.; Yang, J.R.; Wen, G.; Ma, Y.; Pan, H.; Geng, H.; Cao, J.; Zhao, M.; Xu, C. Estimating spatio-temporal variability of aerosol pollution in Yunnan Province, China. Atmos. Pollut. Res. 2022, 13, 101450. [Google Scholar] [CrossRef]
  10. Desservettaz, M.; Pikridas, M.; Stavroulas, I.; Bougiatioti, A.; Liakakou, E.; Hatzianastassiou, N.; Sciare, J.; Mihalopoulos, N.; Bourtsoukidis, E. Emission of volatile organic compounds from residential biomass burning and their rapid chemical transformations. Sci. Total Environ. 2023, 903, 166592. [Google Scholar] [CrossRef] [PubMed]
  11. GB3095-2012; Ambient Air Quality Standards. China Environmental Science Press: Beijing, China, 2012.
  12. Tian, Y.L.; Li, X.Y.; Sun, H.T.; Xue, W.H.; Song, J.X. Characteristics of atmospheric pollution and the impacts of environmental management over a megacity, northwestern China. Urban Clim. 2022, 42, 101114. [Google Scholar] [CrossRef]
  13. Burnett, R.T.; Spadaro, J.V.; Garcia, G.R.; Pope, C.A. Designing health impact functions to assess marginal changes in outdoor fine particulate matter. Environ. Res. 2022, 204, 112245. [Google Scholar] [CrossRef]
  14. Kumar, P.; Singh, A.B.; Arora, T.; Singh, S.; Singh, R. Critical review on emerging health effects associated with the indoor air quality and its sustainable management. Sci. Total Environ. 2023, 872, 162163. [Google Scholar] [CrossRef]
  15. Zacharias, N.; Haag, A.; Lamprecht, R.B.; Gebel, J.; Essert, S.M.; Kistemann, T.; Exner, M.; Mutters, N.T.; Engelhart, S. Air filtration as a tool for the reduction of viral aerosols. Sci. Total Environ. 2021, 772, 144956. [Google Scholar] [CrossRef]
  16. Yu, W.Q. The Experimental Study of Air Filter Re-Cleaning Based on Ultrasonic Method. Master’s Thesis, Xi’an University of Architecture and Technology, Xi’an, China, 2022. (In Chinese). [Google Scholar]
  17. Berry, G.; Beckman, I.; Cho, H. A comprehensive review of particle loading models of fibrous air filters. J. Aerosol Sci. 2023, 167, 106078. [Google Scholar] [CrossRef]
  18. Liu, H.; Zhu, Y.T.; Zhang, C.W.; Zhou, Y.Q.; Yu, D.G. Electrospun nanofiber as building blocks for high-performance air filter: A review. Nano Today 2024, 55, 102161. [Google Scholar] [CrossRef]
  19. Liu, C.; Hsu, P.C.; Lee, H.W.; Ye, M.; Zheng, G.Y.; Liu, N.; Li, W.Y.; Cui, Y. Transparent air filter for high-efficiency PM2.5 capture. Nat. Commun. 2015, 6, 6205. [Google Scholar] [CrossRef] [PubMed]
  20. Liu, X.P.; Bian, S.S.; Chang, D.Q.; Mao, N.; Liu, J.X.; Sun, X. Effect of Water Cleaning on Performance of Air Filtration Medias. J. Filtr. Sep. 2012, 22, 6–10. (In Chinese) [Google Scholar] [CrossRef]
  21. Yeganeh, F.; Chiewchan, N.; Chonkaew, W. Cellulose nanofiber/polyimide composites for highly-efficient air filters. Cellulose 2023, 30, 4421–4436. [Google Scholar] [CrossRef]
  22. Tang, M.; Thompson, D.; Chang, D.Q.; Chen, S.C.; Pui, D.Y.H. Filtration efficiency and Loading characteristics of PM2.5 through commercial electret filter media. Sep. Purif. Technol. 2018, 195, 101–109. [Google Scholar] [CrossRef]
  23. Zeng, Y.X.; Liu, Q.; Zhang, X.; Wang, Z.; Yu, T.; Ren, F.; He, P.C. Comparative Filtration Performance of Composite Air Filter Materials Synthesized Using Different Impregnated Porous Media. Materials 2023, 16, 4851. [Google Scholar] [CrossRef] [PubMed]
  24. Azimi, B.; Sepahvand, S.; Ismaeilimoghadam, S.; Kargarzadeh, H.; Ashori, A.; Jonoobi, M.; Danti, S. Application of cellulose-based materials as water purification filters; a state-of-the-art review. J. Polym. Environ. 2024, 32, 345–366. [Google Scholar] [CrossRef]
  25. Yang, M.; Yang, B.; Zhang, X.; Wu, S.S.; Yu, T.; Song, H.; Ren, F.; He, P.C.; Zhu, Y.H. Experimental Study of the Factors Influencing the Regeneration Performance of Reduced Graphite Oxide Filter Materials under Water Cleaning. Materials 2023, 16, 4033. [Google Scholar] [CrossRef] [PubMed]
  26. Cigeroglu, Z.; El Messaoudi, N.; Şenol, Z.M.; Baskan, G.; Georgin, J.; Gubernat, S. Clay-based nanomaterials and their adsorptive removal efficiency for dyes and antibiotics: A review. Mater. Today Sustain. 2024, 26, 100735. [Google Scholar]
  27. Zhang, X.; Ma, J.Y.; Wang, J.H.; Shi, H.X.; Guo, J.P.; Fan, Y.S.; Nie, X.X.; Guo, T.; Luo, X.X. Modifying the Fiber Structure and Filtration Performance of Polyester Materials Based on Two Different Preparation Methods. Langmuir 2023, 39, 3502–3511. [Google Scholar] [CrossRef]
  28. Qin, J.D.; Zhang, Y.H.; Yi, Y.L. Water washing and acid washing of gasification fly ash from municipal solid waste: Heavy metal behavior and characterization of residues. Environ. Pollut. 2023, 320, 121043. [Google Scholar] [CrossRef] [PubMed]
  29. Hu, G.; Wang, Z.; Wang, X. Ultrasonic cleaning in the membrane process: From phenomenon to mechanism and mathematical model. Chem. Eng. Sci. 2023, 282, 119267. [Google Scholar] [CrossRef]
  30. Wang, A.; Xu, H.; Chen, C.G.; Liu, C.; Lin, T.; Ma, J.; Ding, M. Critical review on advances and perspectives of ultrasound assisted membrane technologies for water purification. Chem. Eng. J. 2024, 482, 148873. [Google Scholar] [CrossRef]
  31. Yang, L.L.; Liu, Z.Y.; Liu, J.X. Experiment on Cleaning and Regeneration of Filter Material. Ind. Saf. Environ. Prot. 2021, 47, 94–98. (In Chinese) [Google Scholar]
  32. Sun, F.G.; Zhang, X.; Xue, T.; Cheng, P.; Yu, T. The Performance Testing and Analysis of Common New Filter Materials: A Case of Four Filter Materials. Materials 2024, 17, 2802. [Google Scholar] [CrossRef] [PubMed]
  33. Perrin, L.; Desobry-Banon, S.; Gillet, G.; Desobry, S. Study and optimization of oil-in-water emulsions formulated by low-and high-frequency ultrasounds. Int. J. Cosmetic Sci. 2023, 45, 198–213. [Google Scholar] [CrossRef] [PubMed]
  34. GB/T 14295-2019; Air Filter. China Environmental Science Press Administration for Market Regulation, Standardization Administration of the People’s Republic of China: Beijing, China, 2019.
  35. Shi, Z.P.; Yang, Z.H.; Wang, Z.D.; Liu, L.Y. Ultrasonic intensification of flocculation filtration for kaolinite: Unraveling mechanisms and performance gains. Sep. Purif. Technol. 2024, 332, 125773. [Google Scholar] [CrossRef]
  36. Zhou, Z.Q.; You, T.; Wang, D.; Pan, Z.Y.; Xu, G.L.; Liang, Y.; Tang, M. Conformal Build-Up of Functionalized Air Filters with Improved Air Cleaning and Bioprotective Traps. Adv. Funct. Mater. 2024, 34, 2306777. [Google Scholar] [CrossRef]
  37. Werkneh, A.A.; Gebru, S.B. Development of ecological sanitation approaches for integrated recovery of biogas, nutrients and clean water from domestic wastewater. Resour. Environ. Sustain. 2023, 11, 100095. [Google Scholar] [CrossRef]
  38. Zhang, Y.N.; Li, X.; Teng, Y.; Bai, S.J.; Chen, Z. Two-list genetic algorithm for optimizing work package schemes to minimize project costs. Automat Constr. 2024, 165, 105595. [Google Scholar] [CrossRef]
Figure 1. Experimental platform.
Buildings 14 03105 g001
Figure 2. The specific operation and physical changes.
Buildings 14 03105 g002
Figure 3. Correlation factor analysis.
Buildings 14 03105 g003
Figure 4. Impact of number of cleaning cycles on filtration efficiency.
Buildings 14 03105 g004
Figure 5. The decay rate of filtration efficiency varies with the number of cleaning cycles.
Buildings 14 03105 g005
Figure 6. The influence of the number of cleaning cycles on counting filtration efficiency.
Buildings 14 03105 g006
Figure 7. The influence of filtration resistance on different filtration velocities.
Buildings 14 03105 g007
Figure 8. The influence of cleaning times on dust loading.
Buildings 14 03105 g008
Figure 9. Electron microscope scanning at 50 times magnification.
Buildings 14 03105 g009
Table 1. Resistance of non-woven fabric materials after consecutive cleaning cycles.
Cleaning CycleFitting FormulaR2
0th Δ P = 100.29v2 + 0.84v + 36.65R2 = 0.9799
1st Δ P = 89.86v2 + 12.99v + 29.48R2 = 0.9879
2nd Δ P = 95.82v2 + 7.51v + 27.44R2 = 0.9900
3rd Δ P = 100.29v2 + 0.84v + 36.65R2 = 0.9799
4th Δ P = 116.43v2 − 26.61v + 33.80R2 = 0.9593
5th Δ P = 132.14v2 − 45.47v + 36.94R2 = 0.9387
6th Δ P = 117.68v2 − 31.26v + 33.70R2 = 0.9668
7th Δ P = 129.82v2 − 44.64v + 36.24R2 = 0.9444
8th Δ P = 130.54v2 − 48.49v + 35.60R2 = 0.9484
9th Δ P = 138.82v2 − 62.56v + 38.66R2 = 0.9507
10th Δ P = 160.54v2 − 84.99v + 41.85R2 = 0.9668
Disclaimer/Publisher’s Note: The statements, opinions and data contained in all publications are solely those of the individual author(s) and contributor(s) and not of MDPI and/or the editor(s). MDPI and/or the editor(s) disclaim responsibility for any injury to people or property resulting from any ideas, methods, instructions or products referred to in the content.

