Article

Seismic Performance of Pile Groups under Liquefaction-Induced Lateral Spreading: Insights from Advanced Numerical Modeling

by
Rujiang Pan
1,2,
Chengshun Xu
1,*,
Romain Meite
2 and
Jilong Chen
1
1
Key Laboratory of Urban Security and Disaster Engineering of Ministry of Education, Beijing University of Technology, Beijing 100124, China
2
Department of Civil and Environmental Engineering, The University of Auckland, Auckland 1010, New Zealand
*
Author to whom correspondence should be addressed.
Buildings 2024, 14(10), 3125; https://doi.org/10.3390/buildings14103125 (registering DOI)
Submission received: 15 August 2024 / Revised: 23 September 2024 / Accepted: 26 September 2024 / Published: 29 September 2024
(This article belongs to the Section Building Structures)

Abstract

:
Post-earthquake investigations have shown that piles in liquefiable soils are highly susceptible to damage, especially in sloping sites. This study examines the seismic performance of pile groups with lateral spreading through advanced numerical modeling. A three-dimensional finite element model, validated against large-scale shaking table test results, is implemented to capture the key mechanisms driving the dynamic response of pile groups under both inertial and kinematic loading conditions. Parametric seismic response analyses are conducted to compare the behavior of batter and vertical piles under varying ground motion intensities. The results indicate that batter piles experience increased axial compressive and tensile forces compared to vertical piles, up to 70% and 20%, respectively. However, batter piles provide enhanced lateral stiffness and shear resistance compared to vertical piles, reducing horizontal displacements by up to 20% and tilting the cap by 85% under strong ground motion. The results demonstrate that batter piles not only enhance the overall seismic stability of the structure but also mitigate the risk of liquefaction-induced lateral spreading in the near-field through pile-pinning effects. While vertical piles are more commonly used in practice, the distinct advantages of batter piles for seismic stability highlighted in this study may encourage using more advanced numerical modeling in engineering projects.

1. Introduction

Observations from numerous seismic events have shown that liquefaction can cause substantial damage to pile–supported structural systems such as bridges, which are particularly vulnerable to lateral spreading. Well-documented case studies include the Showa Bridge [1] in the 1964 Niigata earthquake, the elevated highway bridges [2] in the 1995 Kobe earthquake, the Shengli Bridge [3] in the 2008 Wenchuan earthquake, the railway bridges [4] in the 2011 Great East Japan earthquake, and more recently, the 2023 Qinghai Maduo earthquake [5], where a complete collapse of the bridge was observed.
During shaking, piles are subjected to inertial forces from the superstructure, but kinematic lateral forces are amplified by liquefaction−induced lateral spreading. Batter piles have been widely used in engineering to accommodate complex load requirements on structures such as buildings, bridges, wharves, and offshore wind turbines. Examples include the Schnitzer Steel Wharf at the Port of Tacoma [6], the Padma Bridge in the Bay of Bengal [7], and the Alpha Ventus offshore wind farm in Germany [8]. Previous post-earthquake assessments have indicated that the performance of batter piles during earthquakes is either satisfactory or poor [9]. For instance, in the 1987 Edgecumbe earthquake, despite the observed lateral displacement of 1.5 m on the north bank, the Landing Road Bridge supported by batter piles exhibited good seismic performance, with only minor damage observed in the piers [10]. Chen [11] analyzed the bearing capacity of the Landing Road Bridge using the OptumG2 platform and found that the passive earth pressure exerted by the overlying 1.5 m thick stiff soil layer was almost equal to the collapse load. Post-earthquake observations of liquefaction-induced damage to structures supported by deep foundations suggest that batter piles are more effective than vertical piles in resisting the adverse effects of lateral spreading during shaking. For instance, during the 1995 Kobe earthquake, the Maya Futo Wharf, founded on vertical piles, was destroyed, while the wharf supported by batter piles on the other side withstood the earthquake [12]. However, during the 1989 Loma Prieta earthquake, the same wharf suffered severe damage despite the presence of batter piles [13], with extensive tensile failure occurring at the pile head connections near the shore. Given the uncertainties in predicting the performance of batter piles during past earthquakes, both the French seismic design code (AFPS 1990) [14] and the European design code (Eurocode EC8/Part 5) [15] do not recommend their use in seismically active regions. Rajeswari and Sarkar [16] found that failures of batter piles in historical earthquakes can be attributed to multiple approximations in the design methods used to estimate pile loads in the early stages.
In recent years, post-earthquake assessments of structural systems supported by batter piles have shown that well-designed batter piles can not only effectively resist lateral spreading but also improve the seismic performance of the foundation [17]. These results have been confirmed using model experiments and numerical simulations [10]. Giannakou et al. [17] found that the seismic behavior of battered piles is complex and can be either beneficial or detrimental, depending on factors like soils conditions, structure height, and the balance between overturning moments and shear forces transmitted from the superstructure. McManus et al. [18] conducted a series of shaking table tests and found that micro-batter piles can effectively suppress the accumulation of soil deformation and the development of excess pore water pressure (EPWP), exhibiting a more significant pile-pinning effect than vertical piles. Li and Motamed [19] analyzed the seismic performance of battered and vertical pile–supported structures based on the E−Defense platform. They found that batter piles exhibit enhanced resistance against lateral seismic forces due to their inclined orientation. However, they may experience increased bending moments and axial loads under seismic action. During liquefaction-induced lateral spreading, batter piles near quay walls or waterfront structures endure higher deformations and lateral pressures, particularly in the rear rows of pile groups. Likewise, Kayalvizhi et al. [20] found that batter piles exhibit greater lateral load resistance compared to vertical piles, especially on sloping ground. This study suggests that the optimum distance to position the pile behind the slope crest, in order to reduce the negative effects of the slope, is ten times the pile diameter. Tazoh et al. [21] comparatively analyzed the seismic performance of vertical and batter piles under pure kinematic loads and combined (kinematic + inertial) loads. They found that the seismic performance of batter piles under pure kinematic loads was not ideal compared to vertical piles. However, batter piles exhibit better seismic performance under combined (kinematic + inertial) loads. Furthermore, Li et al. [14] investigated the influence of the P–∆ effect and the height of the superstructure’s center of gravity on the seismic performance response of batter piles through centrifuge tests. This study indicated that the seismic performance of batter piles improves as the center of gravity of the superstructure decreases, with a reduction in inertial forces. Rajeswari and Sarkar [15] analyzed the influence of the predominant frequency of the superstructure on the seismic performance of pile-supported structural systems through numerical simulations. The results showed that batter piles have a more significant positive effect on long-period structures than short-period ones.
Although previous studies have provided significant insights into the seismic performance of batter piles, their use in engineering design practice remains limited. For instance, the high costs of experiments and the bearing capacity limitations of piles on shaking tables make it difficult to conduct large-scale experiments, hindering the systematic analysis of influencing factors. Finite element modeling of soil–structure systems in liquefiable sites can be used to capture the effects of nonlinearities on the overall seismic response through time-history analyses [22]. Numerical simulations are mostly restricted to two–dimensional models due to convergence issues when solving the dynamic equations governing soil–pile response during ground motions and high computational costs. However, this two-dimensional approach cannot accurately capture the complex behavior of pile–soil systems in liquefiable sites, such as cap rotation, soil–structure separation, and slippage, especially on sloping sites.
In this study, a three–dimensional finite element model is implemented to gain more insights into the dynamic response of batter piles founded on sloping sites subject to liquefaction-induced lateral spreading. The model captures the development of large deformations in liquefiable soils, as well as the nonlinear response of soil–pile systems. The numerical model is first calibrated to simulate the seismic response of batter piles as obtained from an experimental study. Parametric analyses are conducted by varying the pile group configurations and the ground motion intensities. The seismic response of various soil–pile–structure systems is examined by assessing the axial force, bending moment, and shear force in the piles, as well as the rotation and displacement of the pile cap and structures. The key mechanisms controlling the seismic response on batter piles on sloping ground are presented.

2. Numerical Analysis Description

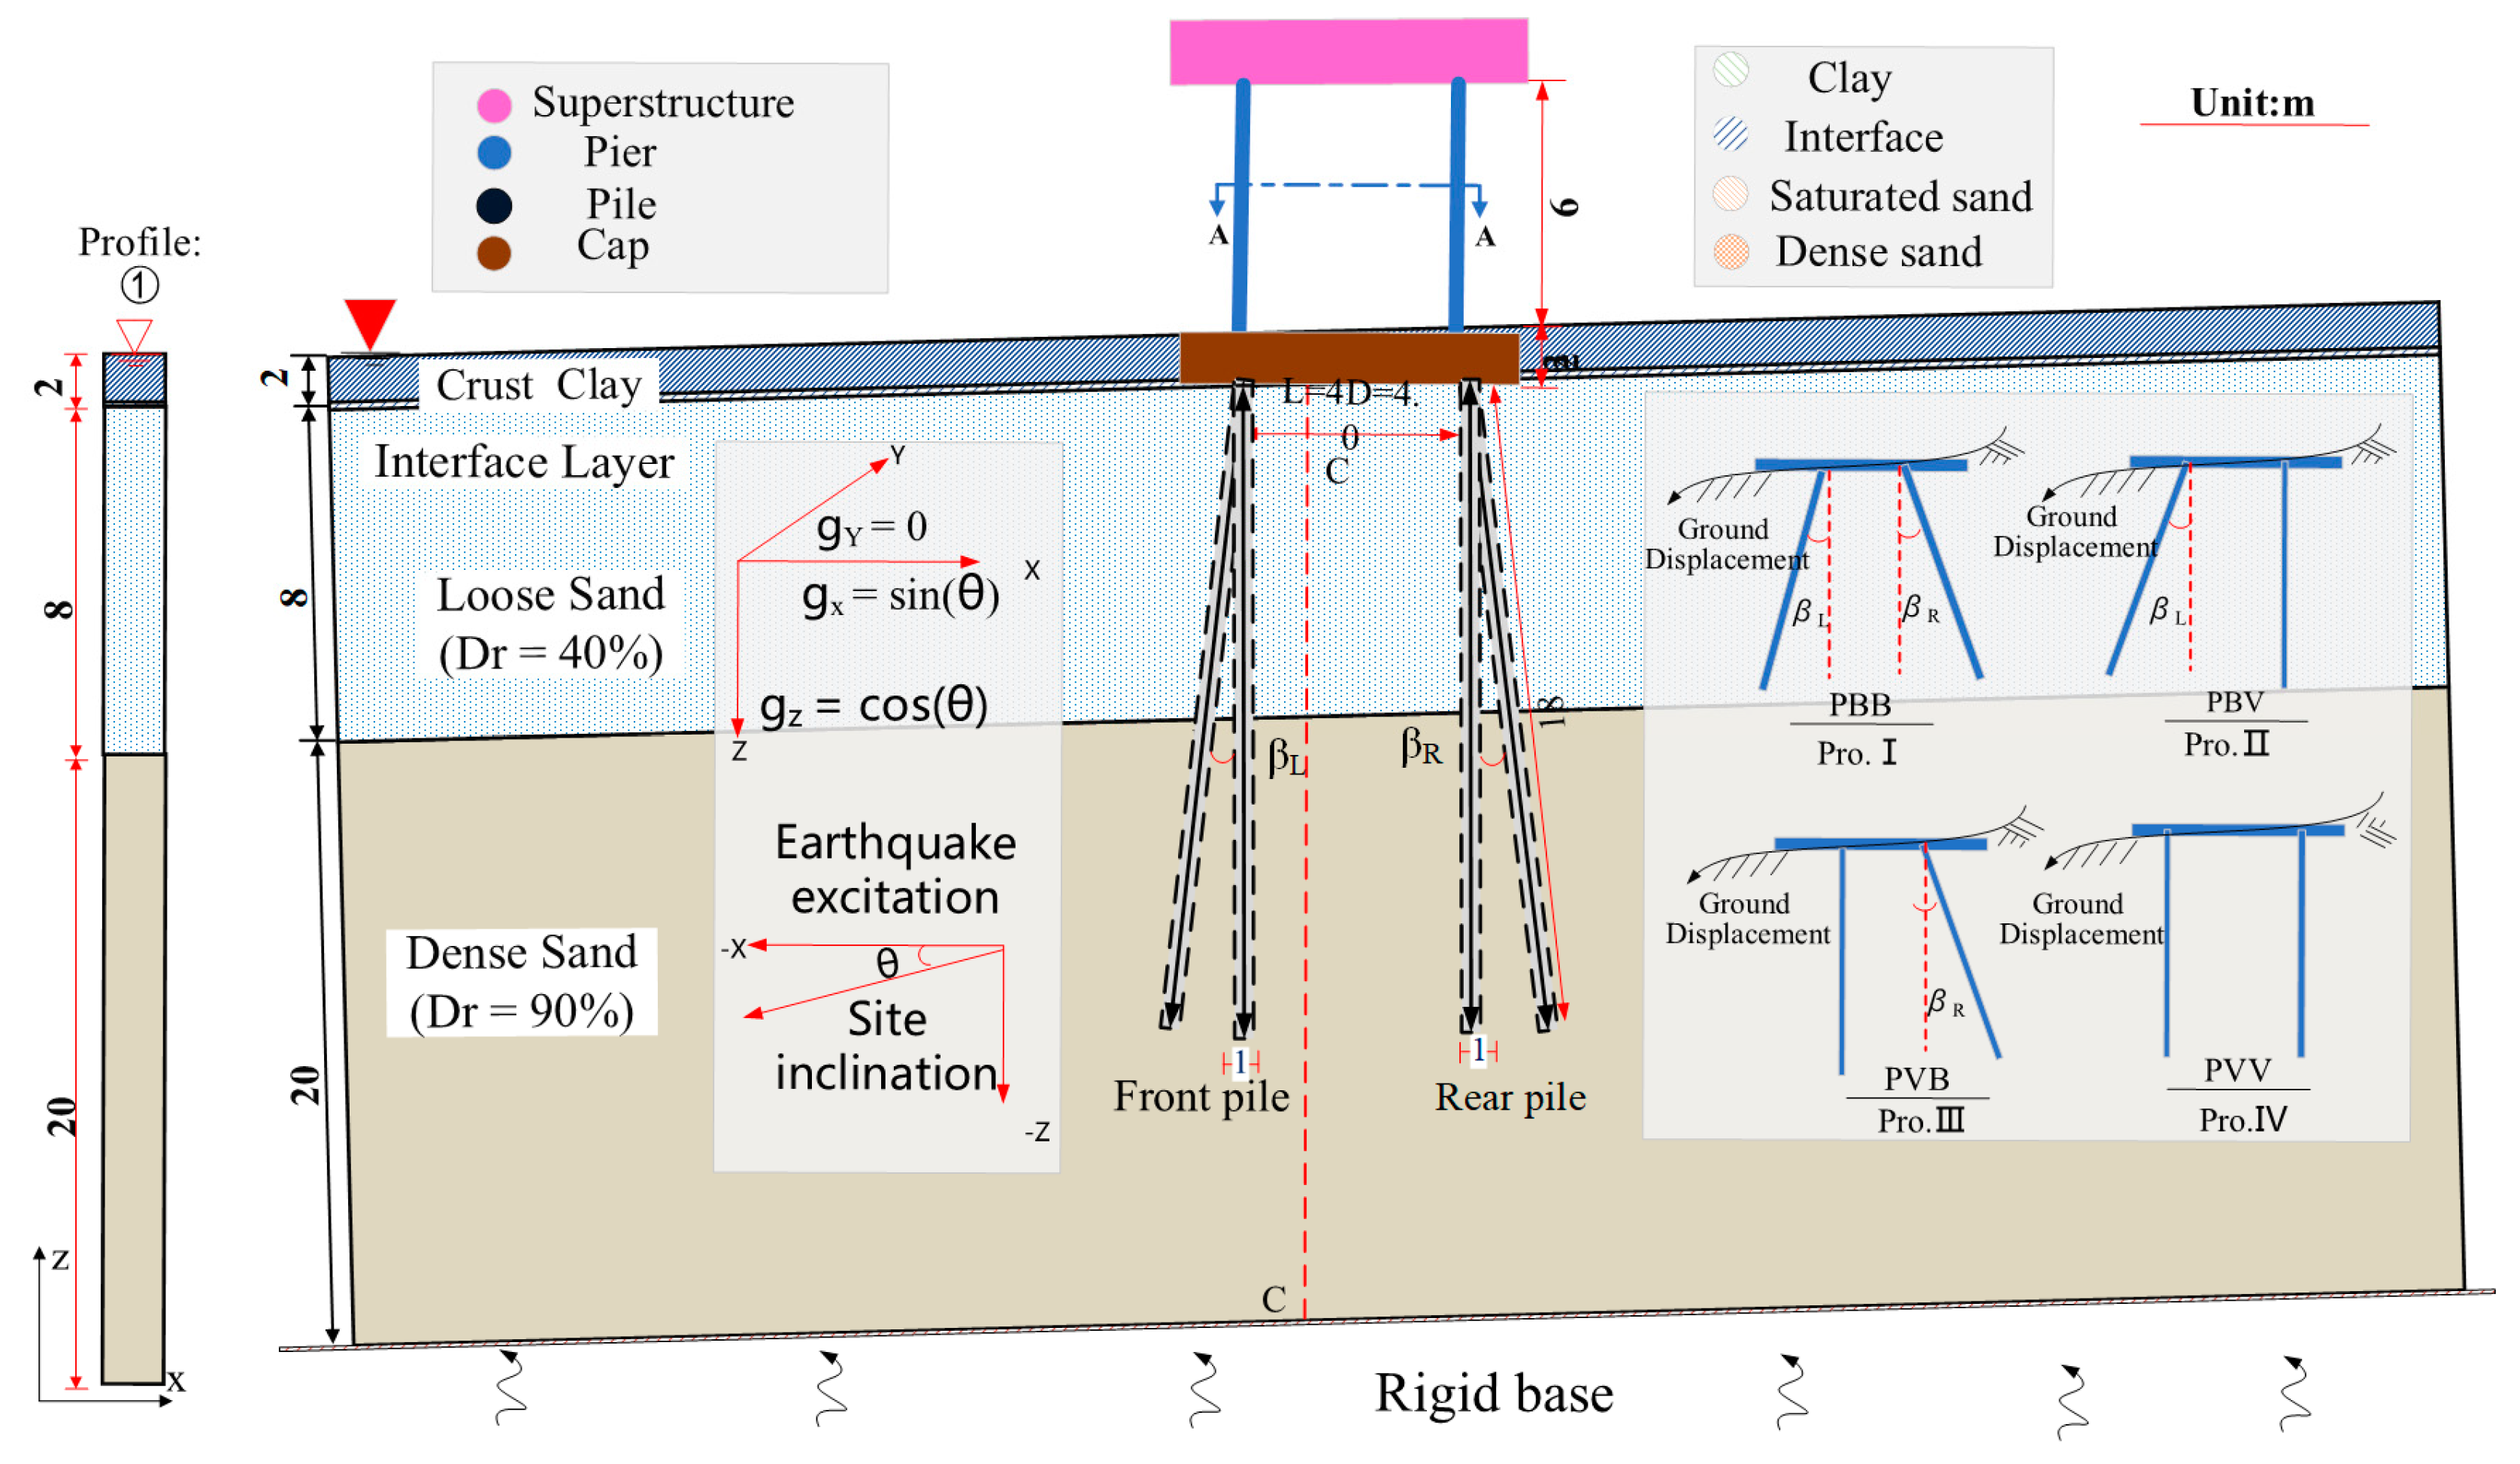
2.1. Problem Definition

The problem implemented consists of a group of 2 × 2 piles embedded in a liquefiable sloping ground, as shown in Figure 1. The soil profile consists of a 2 m thick clay crust overlying an 8 m thick saturated loose sand layer (Dr = 40%), which rests atop a 20 m thick dense sand layer (Dr = 90%). The foundation comprises a 2 × 2 arrangement of prestressed reinforced concrete circular piles, with a pile diameter (D) of 1 m, a pile length of 18 m, and a pile spacing of 4 × D. The reinforcement ratio of the cross-section is 2%. The dimensions of the pile cap are 6 m × 6 m × 2 m, and the embedment depth is 2 m. The pier height is 6.0 m, the diameter is 1.1 m, and the mass of the superstructure is 80 t. Four 2 × 2 pile group configurations were considered in this study, referred to as configuration PBB (downstream and upstream batter piles); configuration PBV (downstream batter piles and upstream vertical piles); configuration PVB (downstream vertical piles and upstream batter piles); and configuration PVV (downstream and upstream vertical piles). These pile configurations are similar to those used in the Landing Road Bridge in New Zealand [10] and the centrifuge testing of batter piles conducted by Li et al. [23]. The piles’ inclination angle was set to 10°. Youd and Perkins [24] found that liquefaction-induced lateral spreading is most likely to occur on gentle slopes of 0.5° to 6°. Therefore, an intermediate slope angle of 3° was considered in this study to represent site conditions susceptible to lateral spreading during shaking.
The Tabas earthquake record from the 1978 Iran earthquake was used as the input motion. Figure 2 shows the corresponding normalized time–history acceleration plotted with the build-up of Arias intensity over time, denoted as HUSID, and the normalized ground response acceleration spectrum. The Tabas earthquake record corresponds to a strong ground motion with a significant duration (D5–95 = 16.5 s), suggesting a high potential to induce liquefaction in saturated sands. Additionally, the predominant period of the ground motion is close to the structure’s fundamental period (0.36 s), making it suitable for investigating the effects of seismic resonance in the soil–structure system. Seismic ground response analyses were performed using the Tabas earthquake record as input excitation, with a constant scaling factor applied to achieve peak ground accelerations of 0.10 g and 0.40 g, representing weak and strong ground motions, respectively.

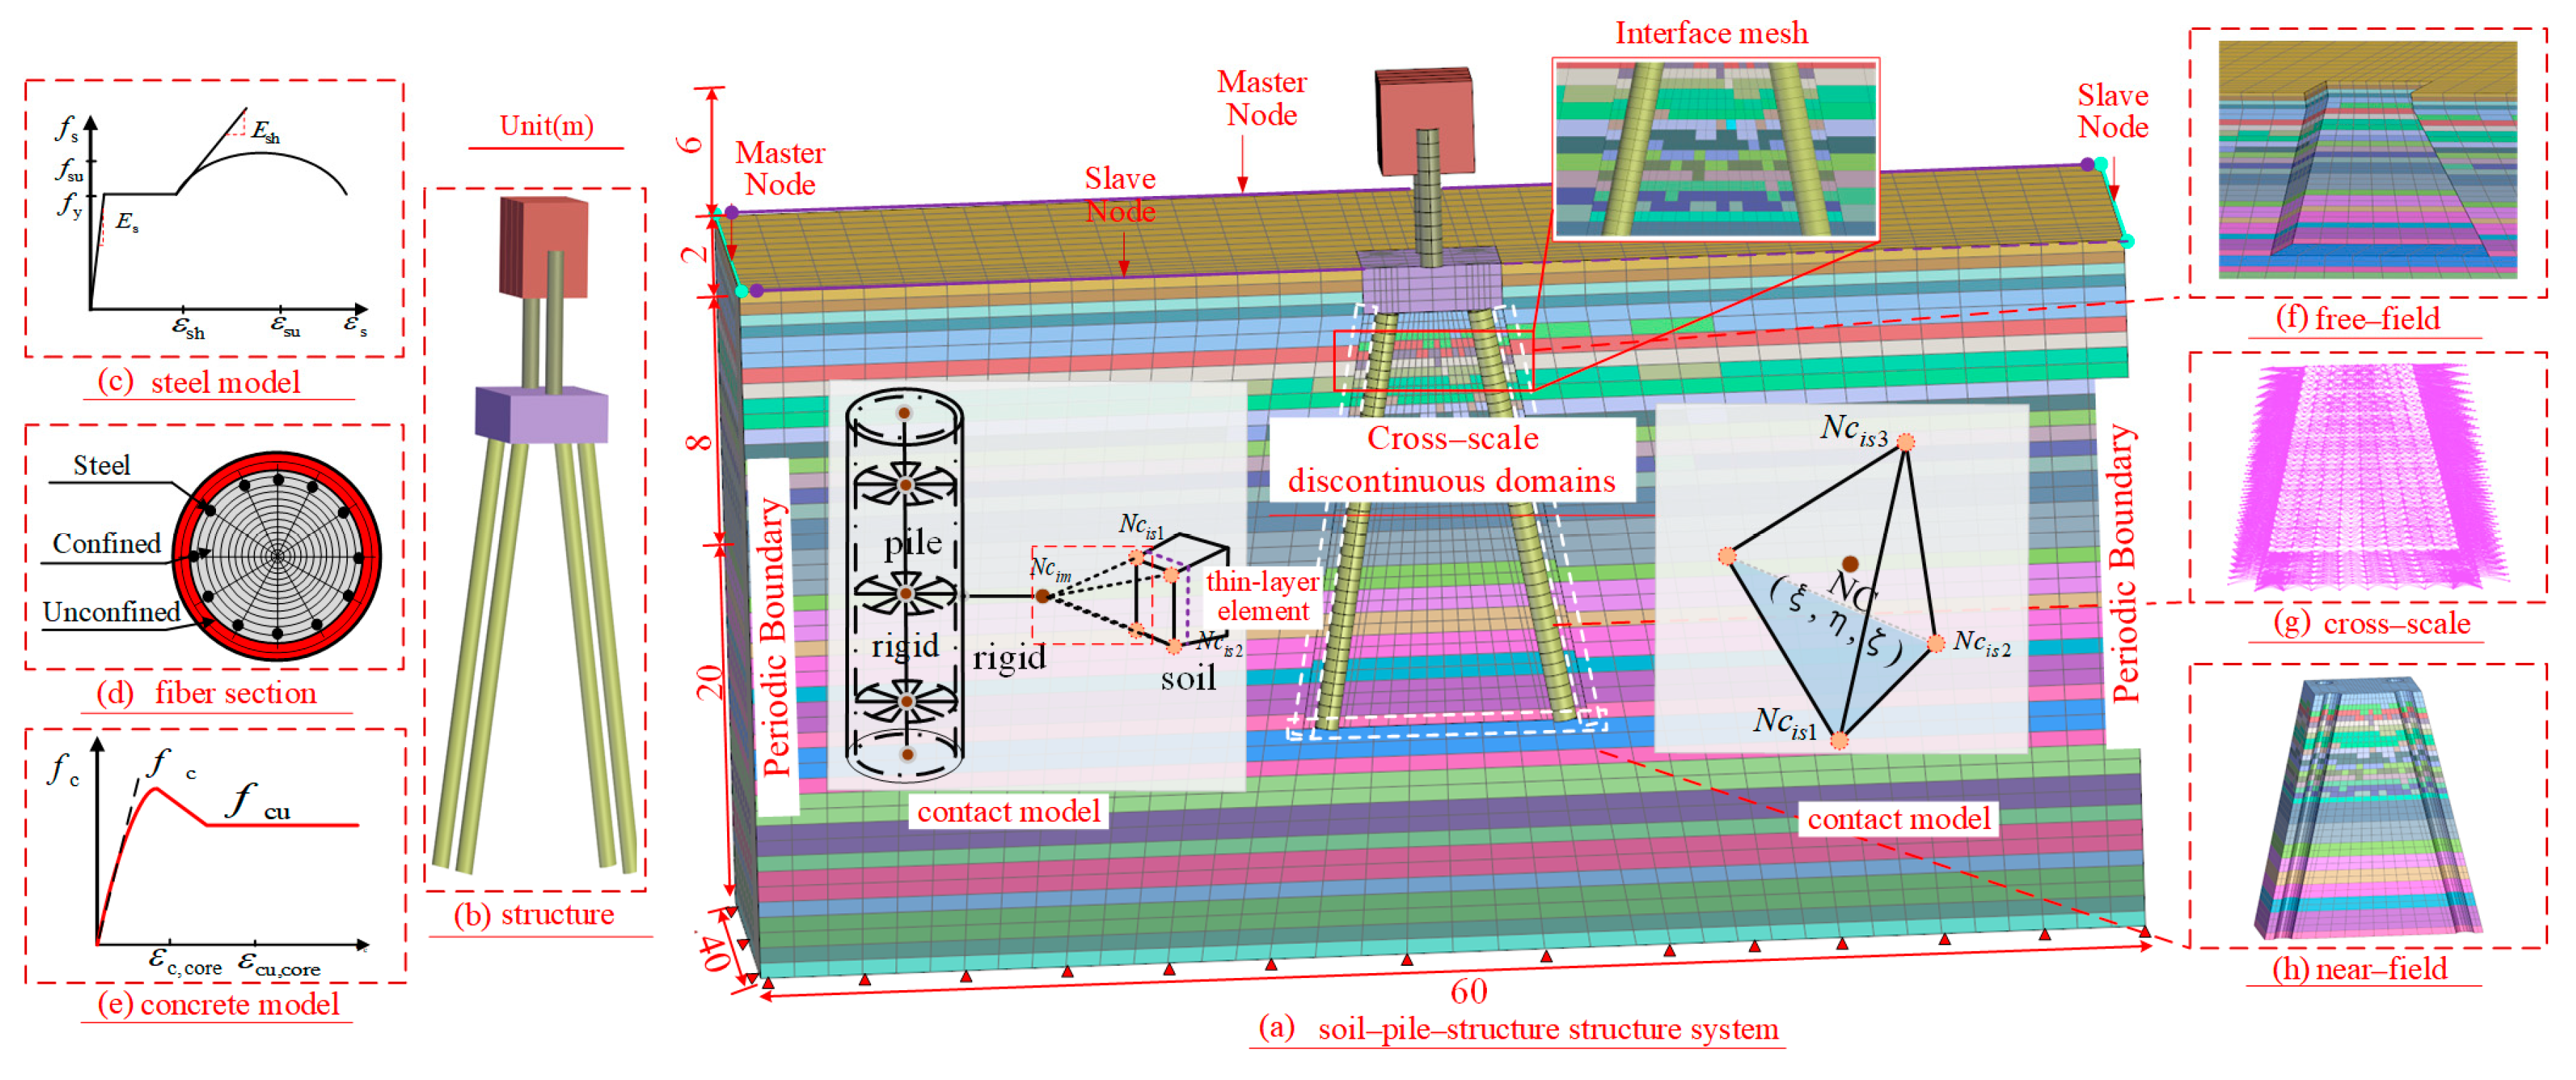
2.2. Details of Numerical Modeling
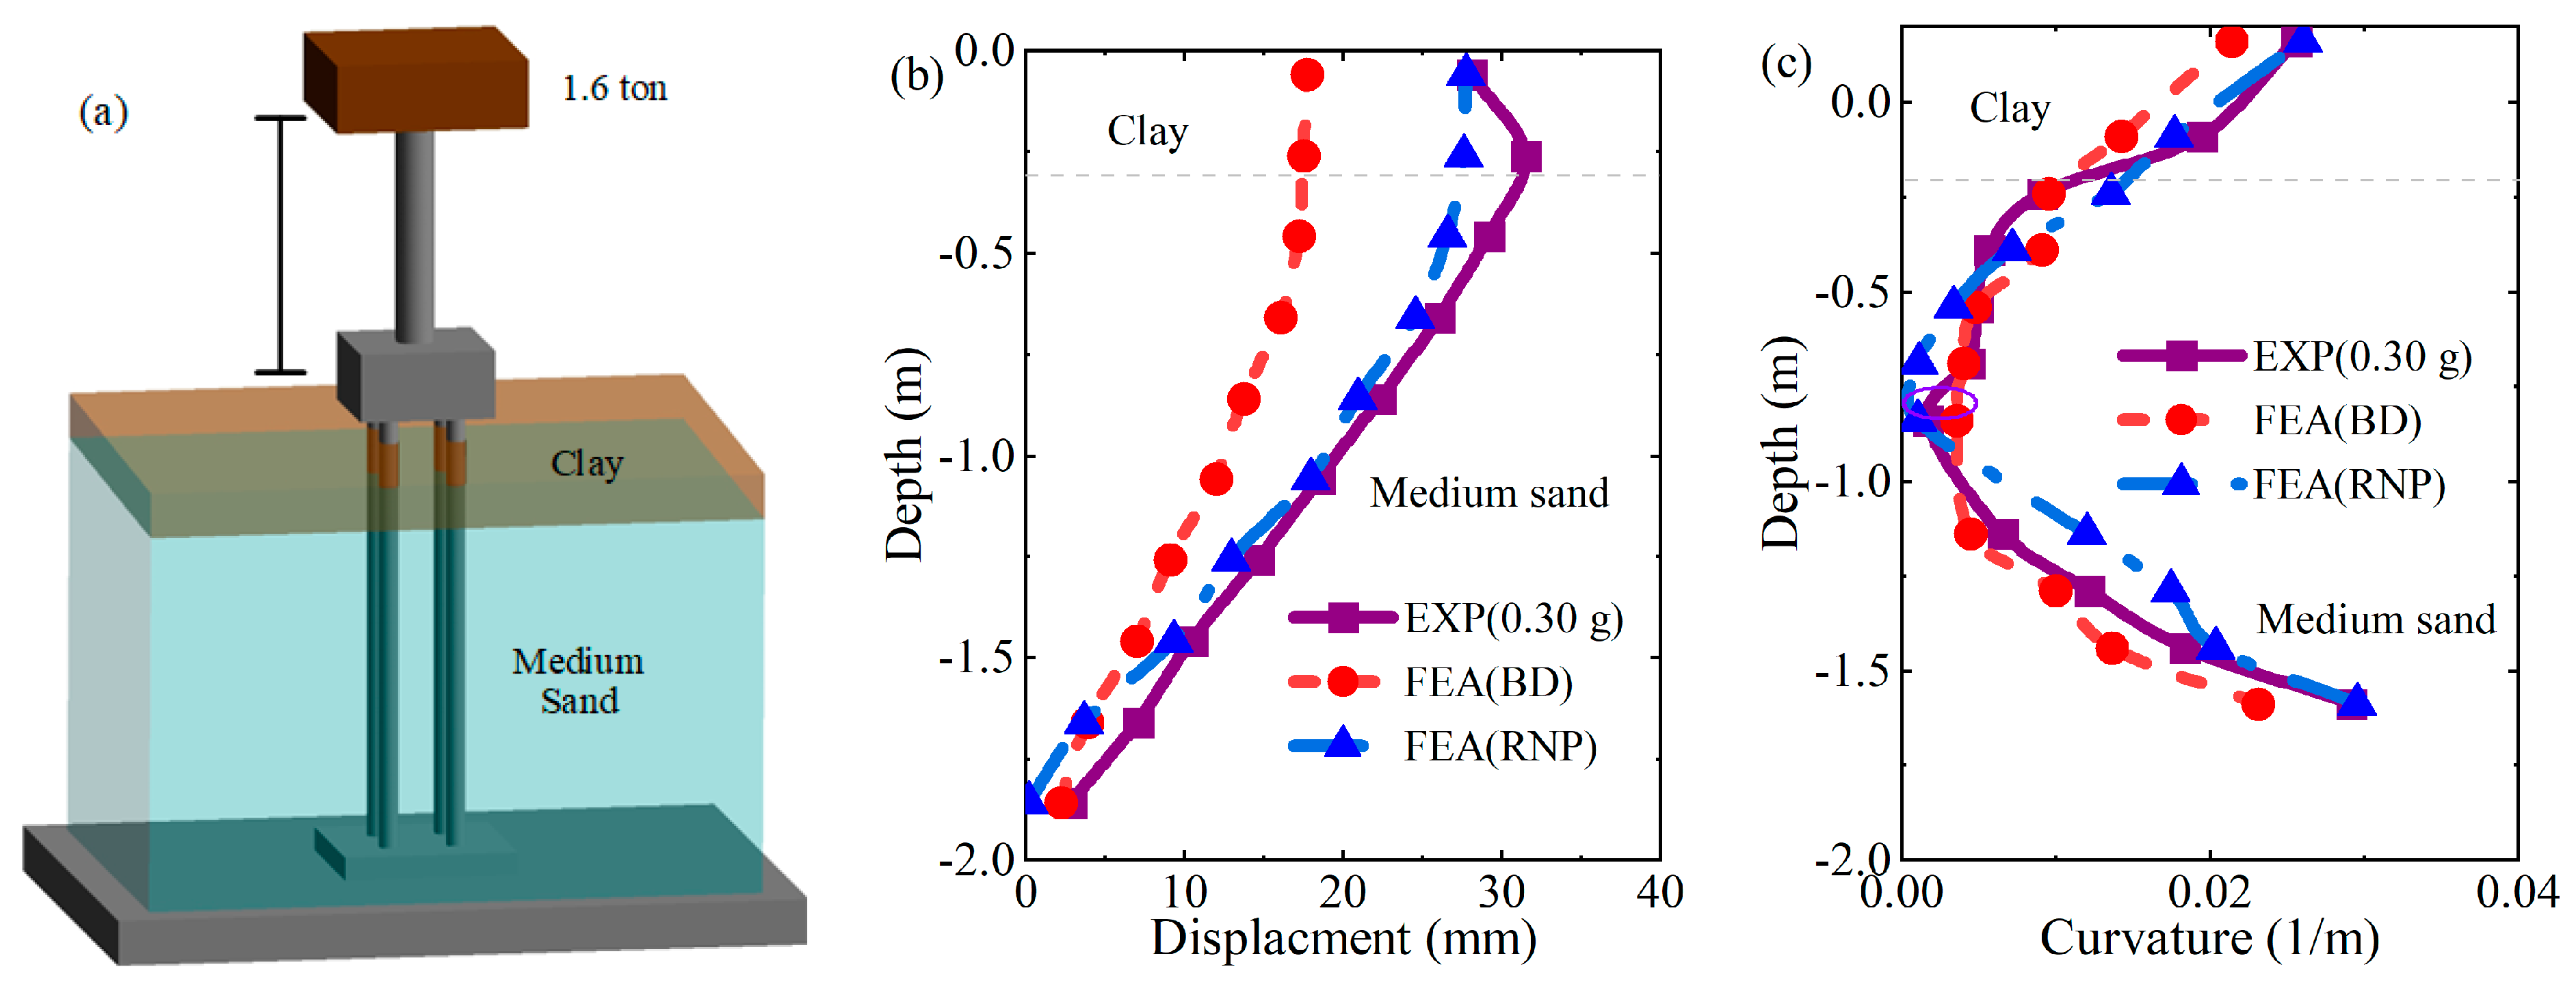
Three-dimensional numerical models of soil–pile–structure systems were implemented using the opensource program OpenSeesMP [25]. A parallel computing discontinuous domain mesh model was employed to balance computational accuracy and efficiency. The model was spatially divided into a collection of subdomains, and the AEM material was used to realize interface data exchange [26]. Specifically, smaller element sizes were used in the near–field, while larger ones were used in the free–field. Constraint penalty functions were used to enforce the boundary conditions at the pile–soil interface and ensure accuracy and numerical stability. Through mesh sensitivity analysis, the near-field mesh size was determined to be 0.25 m, and the far–field mesh size was 0.9 m. Details on the three–dimensional finite element model implemented for the soil–pile–structure system are shown in Figure 3. The model contains 47,663 nodes and 30,676 elements.
During shaking, soil liquefaction can cause the structure and surrounding soil to separate and slide, affecting the overall stiffness of the soil–structure system and its seismic performance. A dynamic nonlinear contact model (RNP) was employed at the soil–pile interface to capture the transfer of contact forces, as shown in Figure 3. The RNP model consists of a series of rigid elastic beam elements which form the cylindric shape of the piles, preventing the collapse of soil elements at the interface with the pile. The Desai thin layer and master–slave contact material simulates the transfer of contact forces between the soil and structure. The thin layer simulates the sliding characteristics of the contact surface [27], and the master–slave contact material simulates the opening and closing states of the contact surface [28]. During dynamic loading, both the shear and normal stiffnesses of the contact surface decrease. Therefore, a reduction factor was introduced to describe the shear and normal stiffness of the interface material [29]. In seismic pile–soil response analyses, the width of the weak layer is taken as 1 × D [30]. Below the ground surface, the pile elements are linked to the master nodes, while the surrounding soil nodes are constrained as slave nodes. The displacements and pore water pressures of the surrounding soil are equivalently applied to the master nodes using the weighted averaging method. The Euler backward method is used in the calculation process, along with the Newton–Raphson solving method. The governing equation is defined as follows:
U C x ( m a s t e r ) = i = 1 n N i ( ξ , η ) U C x i ( s l a v e ) U C y ( m a s t e r ) = i = 1 n N i ( ξ , η ) U C y i ( s l a v e ) θ C z = i = 1 n ( N i ( ξ , η ) x R y , i ( s l a v e   N i ( ξ , η ) y R x , i ( s l a v e ) ) / 2
where UC ( m a s t e r ) is the displacement of the master node and UC ( s l a v e ) is the displacement of the slave node.
The soil permeability significantly influences the development of excess pore water pressures and liquefaction-induced settlements. Shahir et al. [31] proposed a simplified formulation to adjust the permeability coefficient based on the excess pore pressure ratio (EPWPR) developed during the analysis to improve the accuracy of model predictions. The functional relationship is defined as follows:
k k 0 = 1 + ( γ 1 ) r u λ 1 r u < 1   build - up   phase   γ r u 1   liquefaction   phase   1 + ( γ + 1 ) r u λ 2 r u < 1   dissipation   phase
where r u is the EPWPR; k 0 is the initial permeability coefficient; k is the permeability coefficient; and γ , λ 1 , and λ 2 are constant values equal to 10, 2, and 10, respectively. In this study, a C++ code was implemented to update the coefficient of permeability for liquefiable soils during the time-history analysis.
The PIMY material was used for the saturated clay crust, while the PDMY02 material was used for the saturated sand layers [25]. Table 1 summarizes the parameters used in this study to constrain constitutive soil models. Seismic ground response analyses were conducted by applying a control time-history acceleration at the base of the finite element model. Periodic boundaries were introduced laterally to simulate an infinite domain and eliminate the occurrence of wave reflection at the borders [22].

3. Model Validation

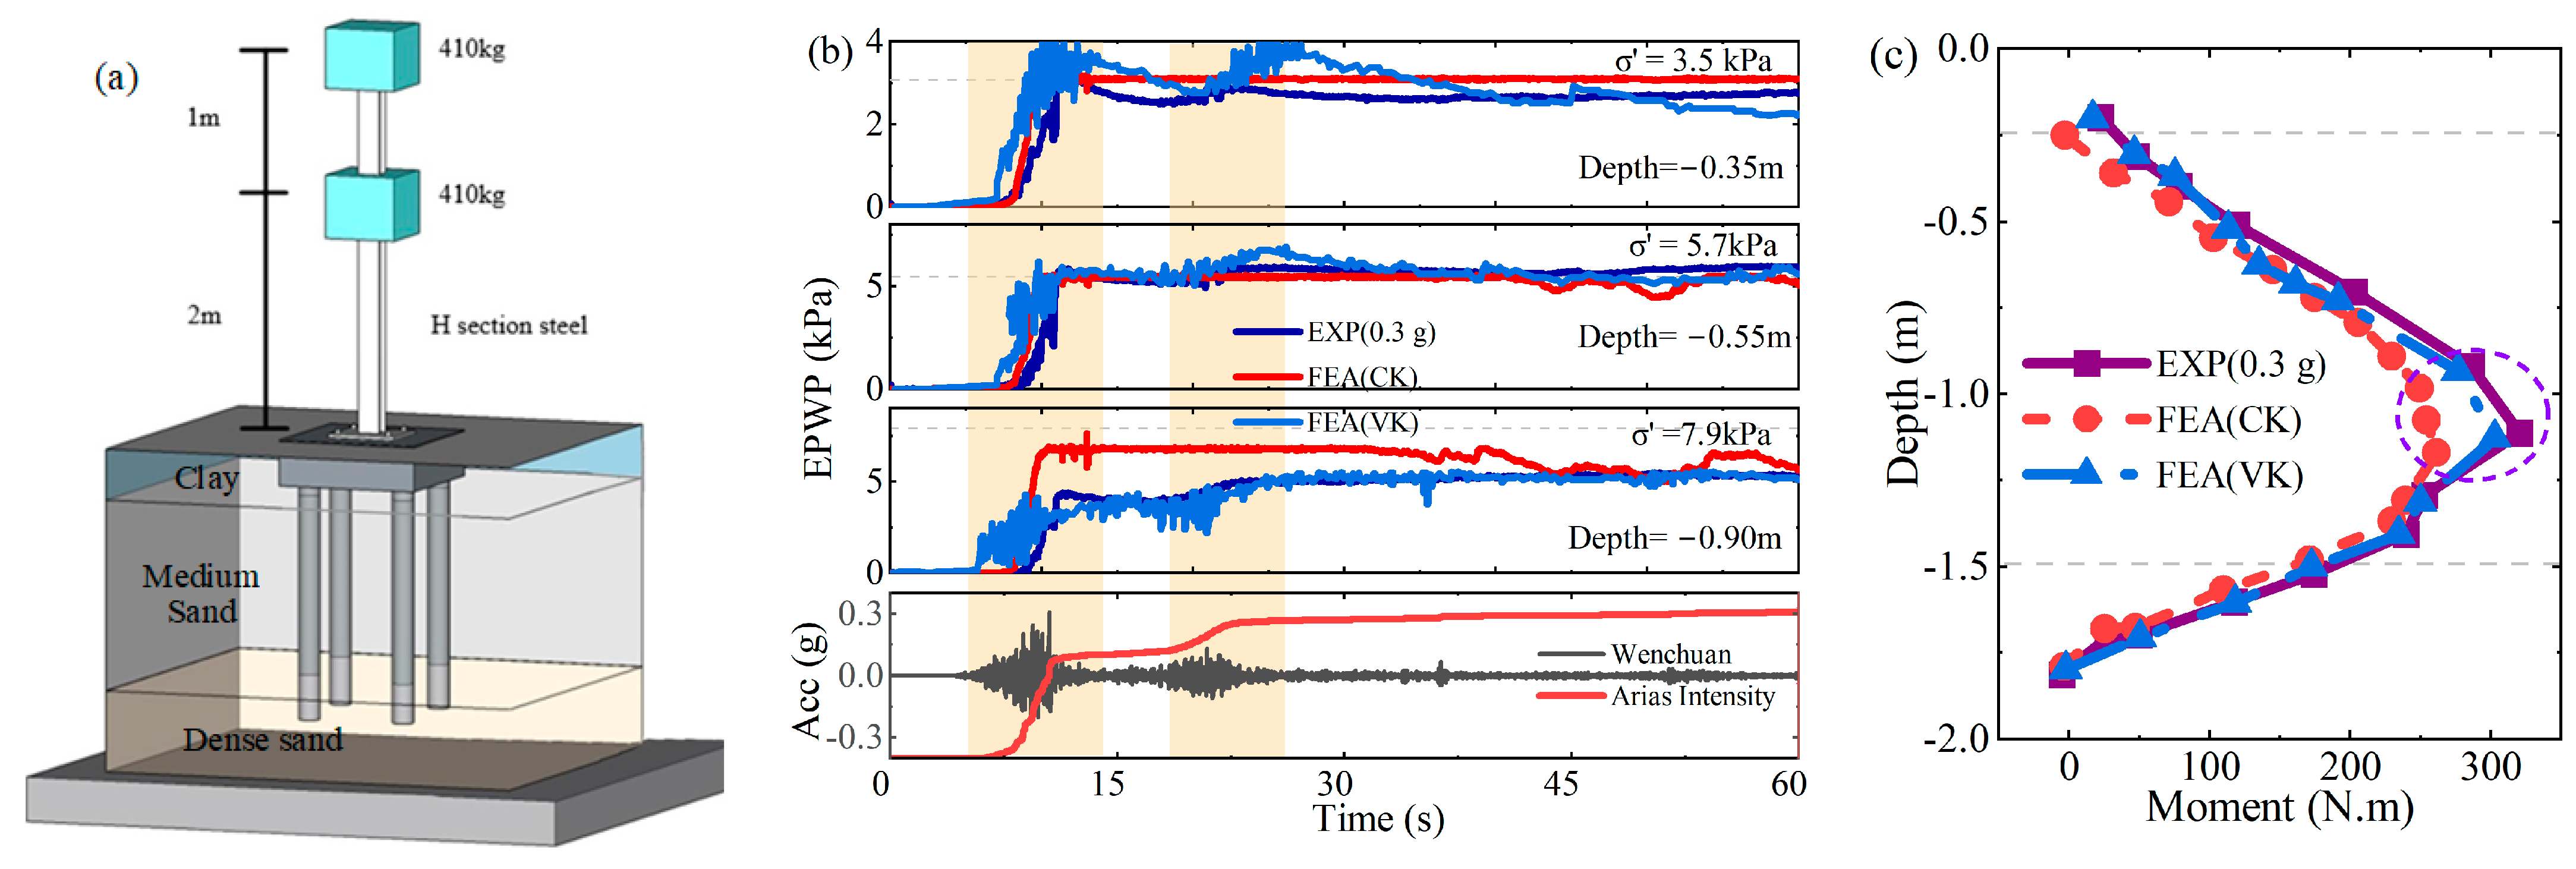
3.1. Model Parameter Calibration

Figure 4 compares the cyclic simple shear test results obtained between the PDMY02 constitutive soil model in OpenSeesMP, after calibration, and the experimental test results using Ottawa sands. This figure shows that medium–dense sand (Dr = 40%) exhibits a lower peak and residual strength, with significant post-peak softening behavior. In comparison, dense sand (Dr = 90%) has a higher peak strength and residual strength. In the mean effective stress–deviatoric stress space, medium–dense sand (Dr = 40%) experiences a rapid reduction in mean effective stress due to the rapid increase in EPWP, exhibiting hydrostatic compression and shear dilation characteristics. On the other hand, dense sand (Dr = 90%) shows a slower decrease in mean effective stress, predominantly exhibiting shear compression.

3.2. Comparison of Soil–Pile Response in Liquefiable Horizontal Site

The coefficient of permeability used in the numerical model is validated using the large-scale shaking table tests of pile–soil systems on liquefiable sites conducted by Xu et al. [35]. Figure 5a illustrates the overview of the model. The soil bed consists of a 0.5 m dense sand layer, a 1.2 m liquefiable loose sand layer, and a 0.3 m clay crust from top to bottom. Figure 5b,c compare the experimental results to two numerical model predictions: one with a constant coefficient of permeability, referred to as the FEA(CK) model, and a refined model, referred to as FEA(VK), where the permeability coefficient is updated throughout the time-history analysis to account for water migration during liquefaction. Compared to the VK model, the CK model can more accurately capture the oscillation phenomenon (shear dilation, shear contraction) of EPWP development. The pile’s bending moment follows a “K–shaped” distribution along the depth, with the peak bending moment occurring in the middle of the medium–dense sand layer. Compared to the CK model, the VK model underestimates the deformation of the structure and fails to capture the most unfavorable location of the structure accurately.

3.3. Comparison of Soil–Pile Response in Liquefiable Sloping Site

The seismic behavior of the soil–structure model is validated using the shaking table tests of pile–soil systems on liquefiable sloping sites conducted by Jia et al. [36]. Figure 6 compares the experimental results against the binding and RNP contact models discussed previously in Section 2.2. The soil displacement follows a cosine distribution along the burial, with the peak displacement occurring at the interface between the loose sand and the overlying clay layer, which is attributed to the accumulation of EPWP, forming a thin water film [22]. The binding contact model fails to capture the near-field soil displacement response accurately. Compared to the experimental results, the binding contact model underestimates the permanent displacement of the near-field soil by approximately 34%. The pile’s curvature envelope diagram follows a “K–shaped” distribution along the burial, with the peak curvature occurring at the pile head. Compared to the experimental results, the binding constraint contact model underestimates the curvature at the pile head by approximately 22%. The model predictions accurately capture the pile curvature distribution near the cap, and the displacement predictions are sufficiently reliable for comparing the performance of different pile group configurations.

4. Numerical Results and Discussion

In this section, the downstream piles (F) are referred to as the “Front pile”, while the upstream piles (R) are referred to as the “Rear pile” (Figure 1). The performance indicator (P) proposed by Li et al. [23], as shown in Equation (3), is used to evaluate the seismic performance of batter piles and vertical piles under similar conditions in terms of quantifying the relative change in the system response caused by the use of batter piles.
P = Q u l t , B - Q u l t , V Q u l t , V × 100 %
where P is the performance indicator, and Q u l t , B and Q u l t , V represent the calculated dynamic response values for batter piles and vertical piles, respectively.

4.1. Soil Response

4.1.1. Liquefaction Process and Excess Pore Water Pressure Development

The rise in EPWP during seismic events is fundamentally driven by the contractive nature of loose sands under cyclic loading, leading to reduced effective stress and liquefaction. Figure 7a presents the time history of the EPWP ratios developed at various depths for the Tabas earthquake record. The development of EPWP can typically be divided into four stages: Stage Ⅰ (no EPWP increase), Stage Ⅱ (EPWP accumulation), Stage Ⅲ (full liquefaction), and Stage Ⅳ (EPWP dissipation). In Stage Ⅱ, the EPWP develops rapidly with increased seismic wave amplitude. The EPWP ratio peaks at 25 s without significant liquefaction in the dense sand layer. However, the EPWP ratio peaks at 10 s in the loose sand layer, and the time required to trigger liquefaction increases with depth. Liquefaction occurs in the loose sand layer after 10 s (Stage Ⅲ), with erratic spikes in the EPWP ratios, characteristic of contractive and dilative behaviors of sand during shaking.
The distribution of EPWP ratios with depth is further examined in Figure 7b,c, near the vertical pile group (PVV configuration) and the batter pile group (PBB configuration), respectively. These distributions are shown at various lateral distances, ranging from the center of the pile group to an offset of ± 20 × D, where D represents the pile diameter. The results show that the EPWP ratio developed at the center of the pile group (0 × D) is typically lower than the EPWP ratio further away from the pile group (±20 × D). This occurs due to the pile–pinning effect, which hinders the initiation of liquefaction by restricting the build–up of pore pressure around the piles, particularly near the cap. The reduction in EPWP ratios in the near–field is more pronounced for PBB than PVV. The inclined orientation of batter piles enhances this effect by distributing lateral forces more efficiently, thereby maintaining higher confining pressures near the pile head. This localized confinement effect reduces the probability of liquefaction in the surrounding soil and enhances the seismic stability of pile–supported structures. The shaking table experiments conducted by McManus et al. [19] also demonstrated similar beneficial effects.

4.1.2. Soil Displacement

The propagation of seismic shear waves through the soil induces shear strains that result in lateral movement. This phenomenon becomes more complex to assess when considering liquefiable sloping sites that are prone to lateral spreading. The influence of pile systems on residual soil displacements in the horizontal direction is presented in Figure 8a for the configuration PVV. Soil displacement follows a piecewise linear distribution over depth, which aligns with the change in soil stiffness and liquefaction resistance. The peak displacement occurs at the top of the liquefiable loose sand layer, imposing an overall downslope movement on the overlying clay crust. Chang [32] also observed similar phenomena in centrifuge tests, where large horizontal displacements in the overlying soil layer accompanied the development of large shear strains in the weak liquefied layer. Figure 8b,c compare the near-field soil displacements for different pile group configurations. The results indicate that pile inclination has little influence on the horizontal displacement developed in the deep dense sand layer. In contrast, batter piles significantly impact horizontal soil displacements at shallow depths. The observed reduction in soil displacement for batter piles can be attributed to their inclined orientation, which increases the pile–soil contact area and allows for a better distribution of lateral forces, as discussed in the following sections. For weak ground motion (0.10 g), the effective depth over which the soil displacements are reduced by pile–pinning effects is 3 × D. The influence depth increases to 5 × D as the input motion intensity increases. Compared to vertical piles, batter piles are more effective at mitigating horizontal soil displacements near the surface. For instance, under strong ground motion (0.40 g), the PBB, PBV, and PVB configurations with batter piles reduce the near–field soil displacement by 16.63%, 11.59%, and 6.58%, respectively, compared to the PVV configuration with vertical piles only. As the input motion intensity increases, the beneficial effects of batter piles contrast with vertical piles, which offer less lateral resistance and, therefore, exhibit greater lateral displacement.
Figure 9 presents a contour map of permanent vertical displacements developed in the soil–structure system after shaking. The site undergoes lateral spreading and large vertical settlement as liquefaction is triggered in the loose sand layer. Apparent separation and sliding phenomena occur between the cap and the surrounding soil, causing the structure to undergo significant flexural deformation and tilting in the direction of lateral spreading. This observation validates the capability of the contact model employed in this study to effectively capture the macroscopic phenomenon of soil–structure separation in liquefiable sites. Chang and Pan [22,32] found that when sand undergoes liquefaction-induced lateral spreading, the binding contact model tends to overestimate the axial force developing in the piles, and a tensile axial force may occur in some cases. The foundation suppresses the near-field soil movement, forming a circular–arc sliding failure surface and local heave phenomena. Furthermore, the near-field response varies significantly across the different pile group configurations. For vertical piles, discontinuous vertical displacements occur at the pile head, causing tilting of the foundation, while in batter piles, the magnitude of tilting is less pronounced.

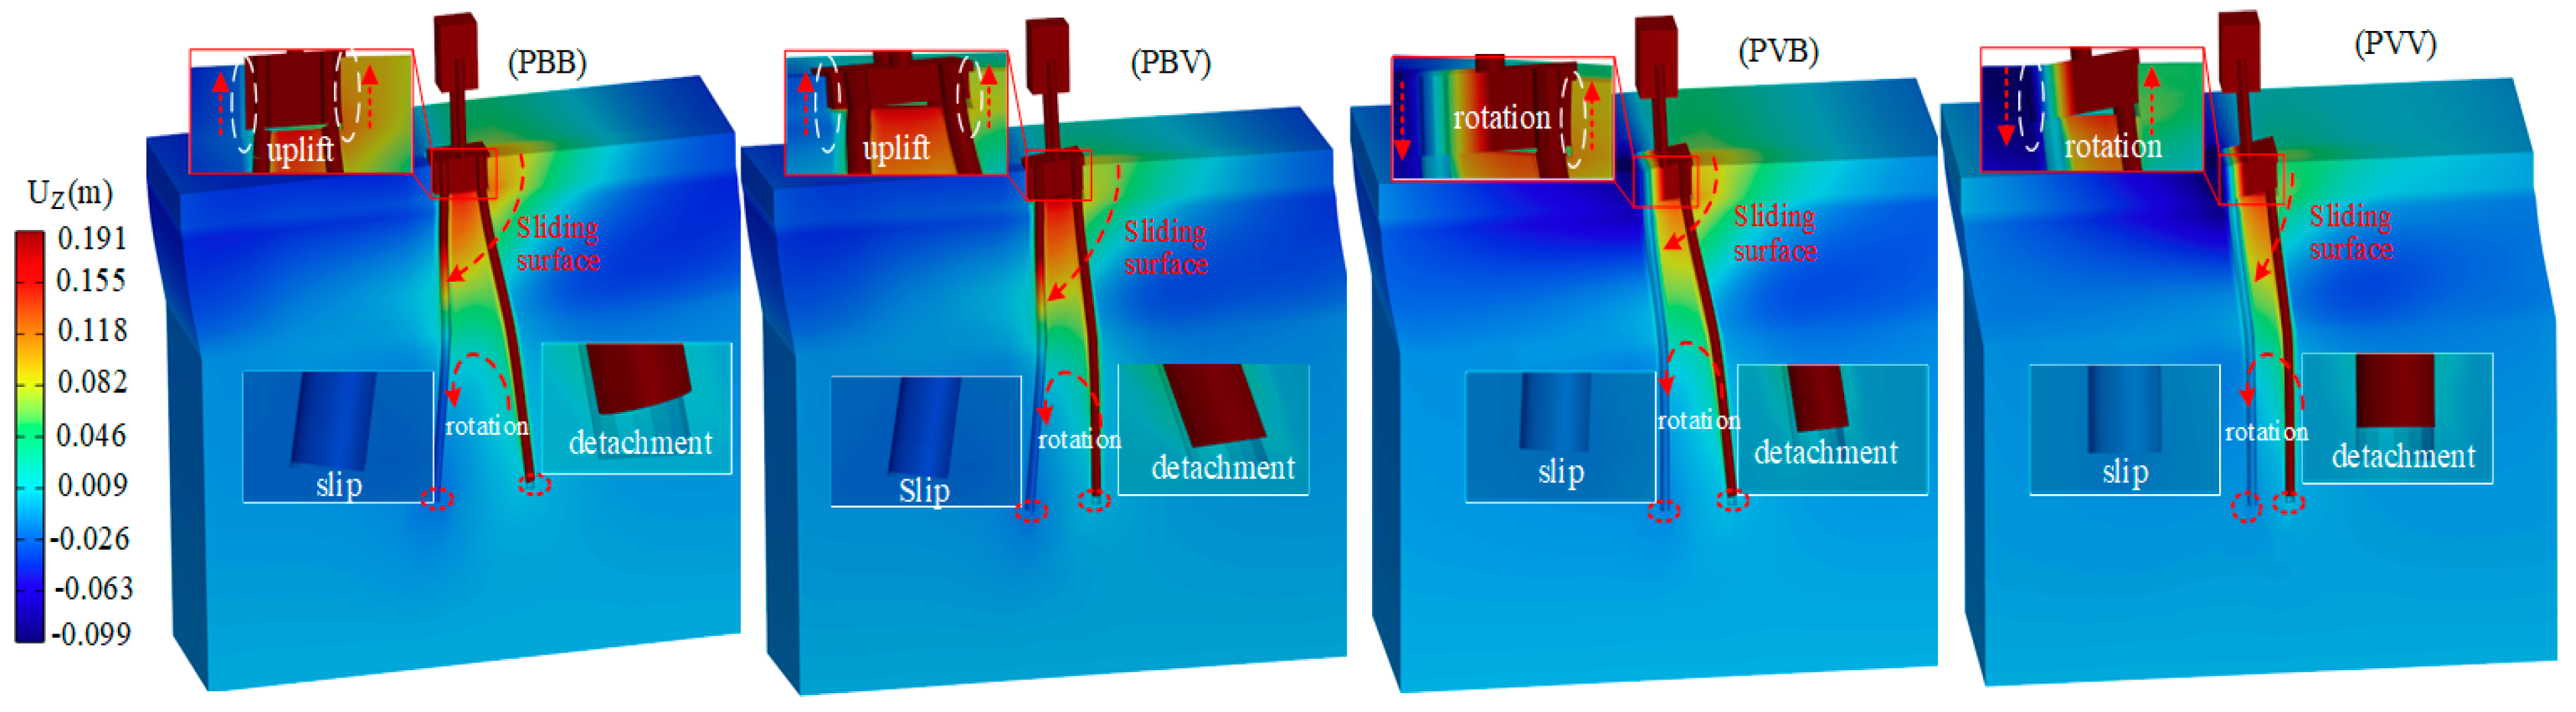
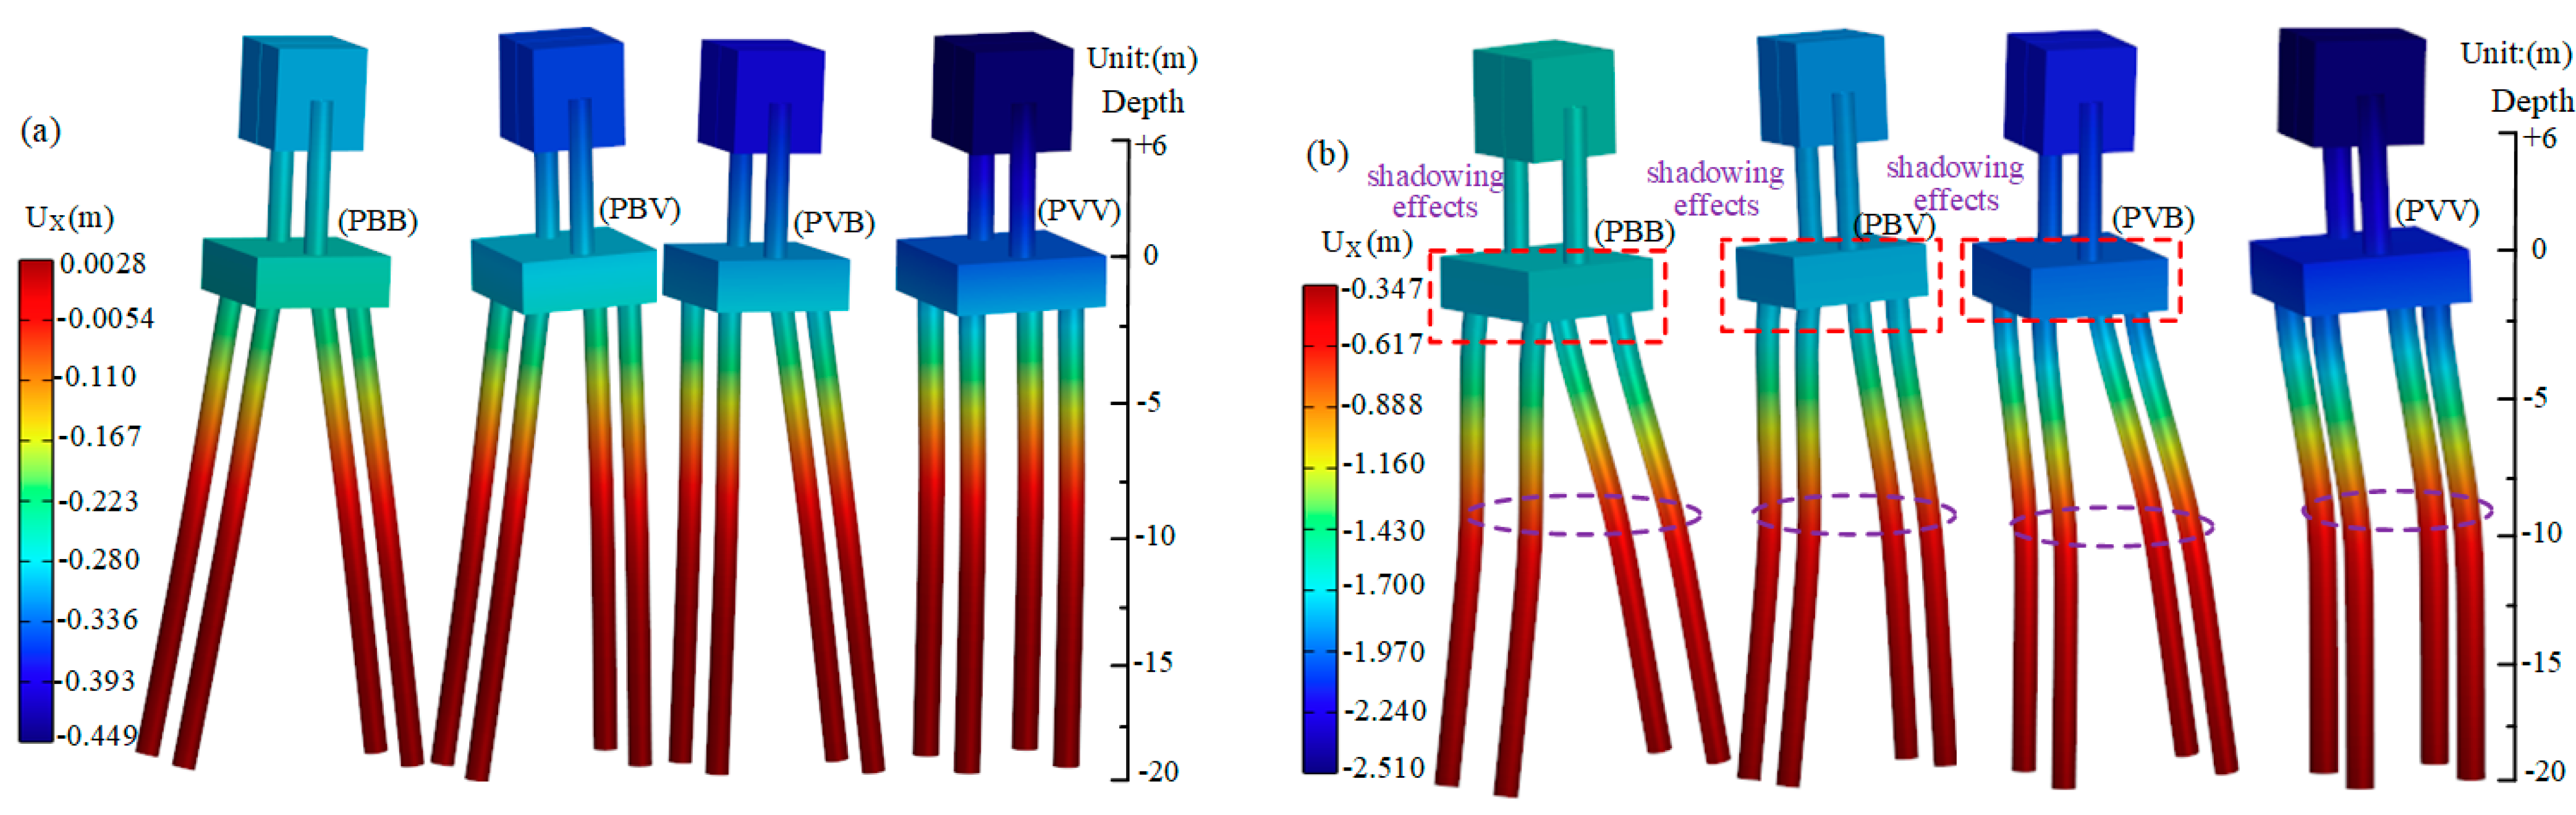
4.2. Structural Response

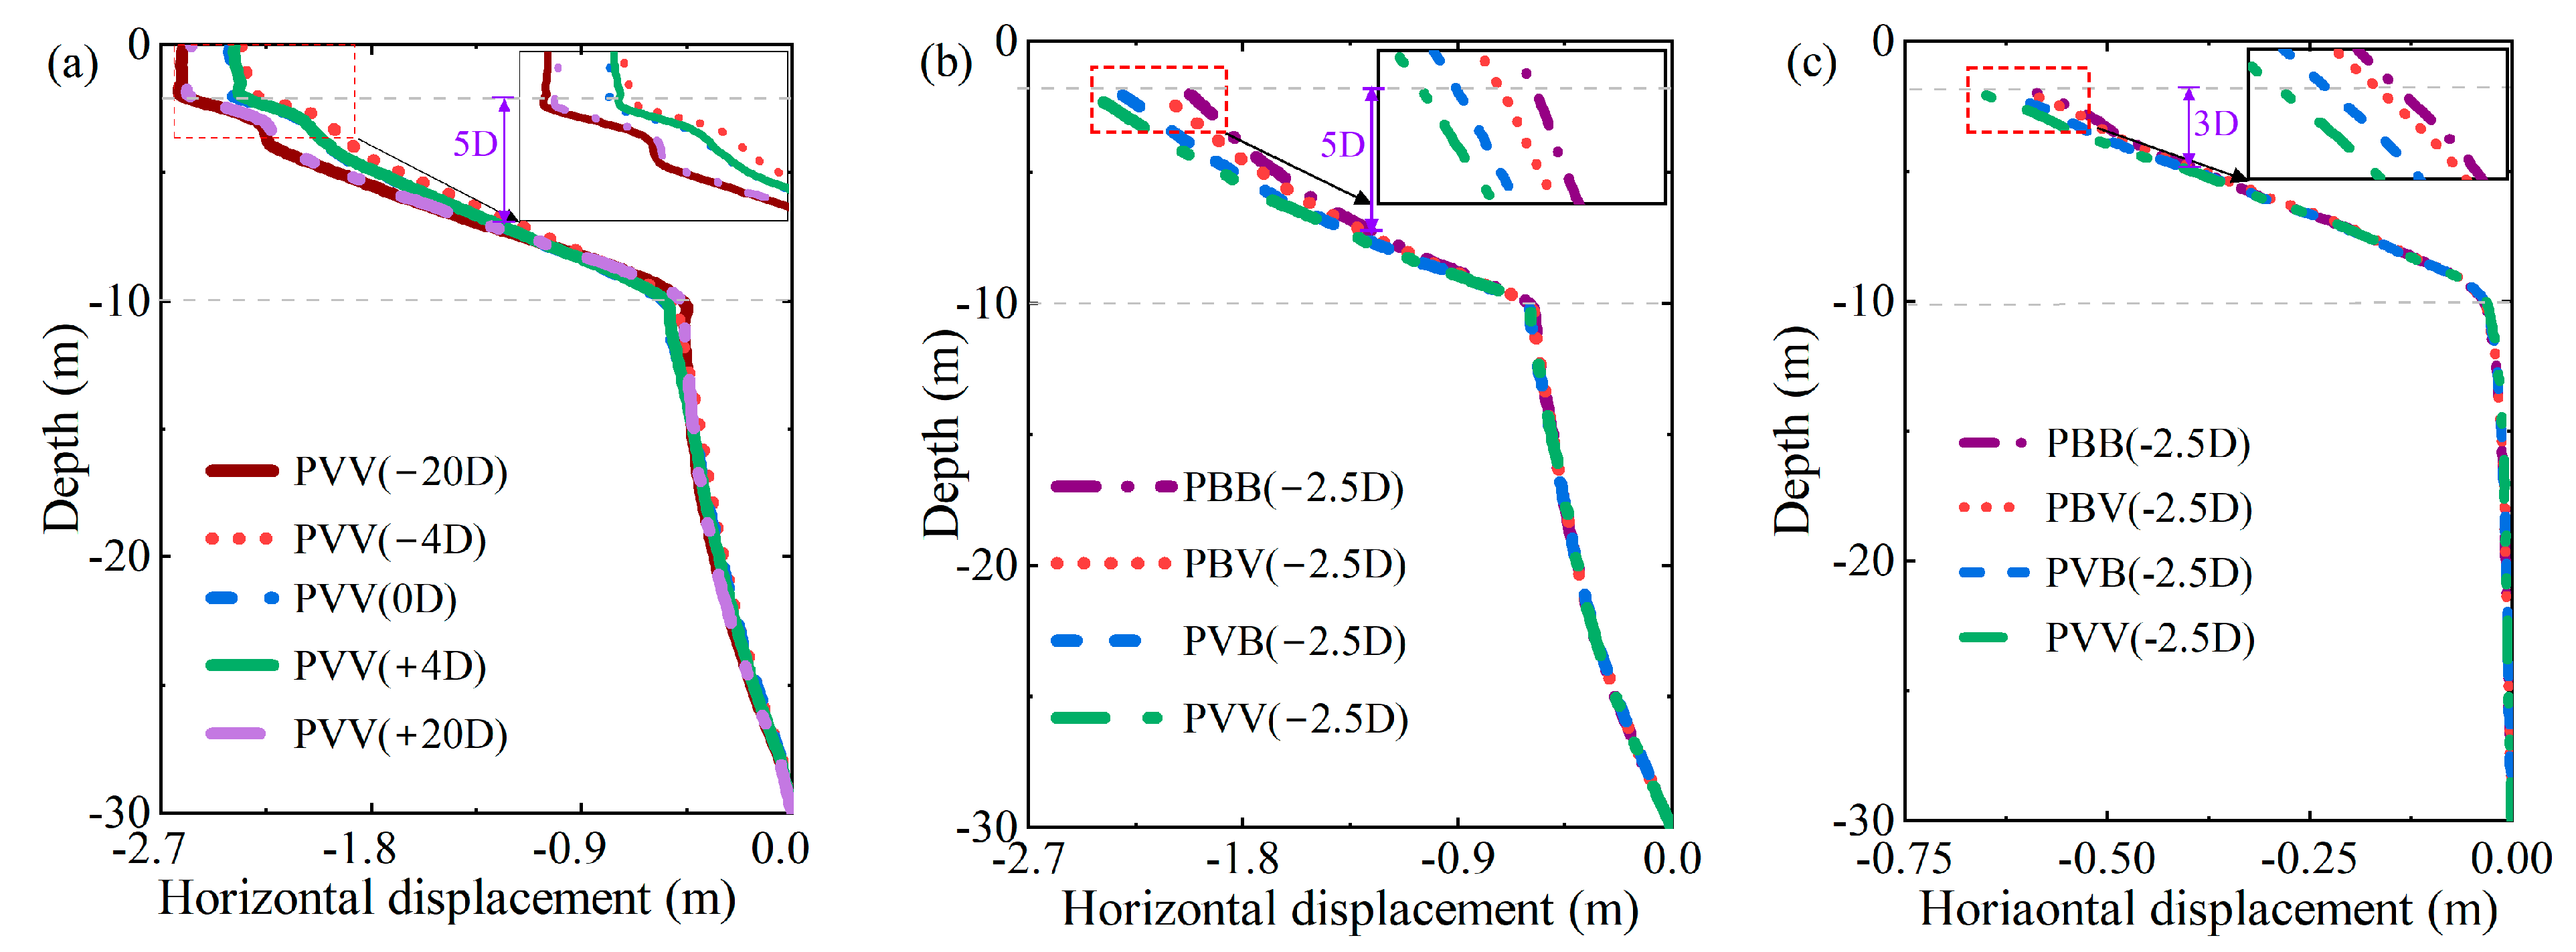
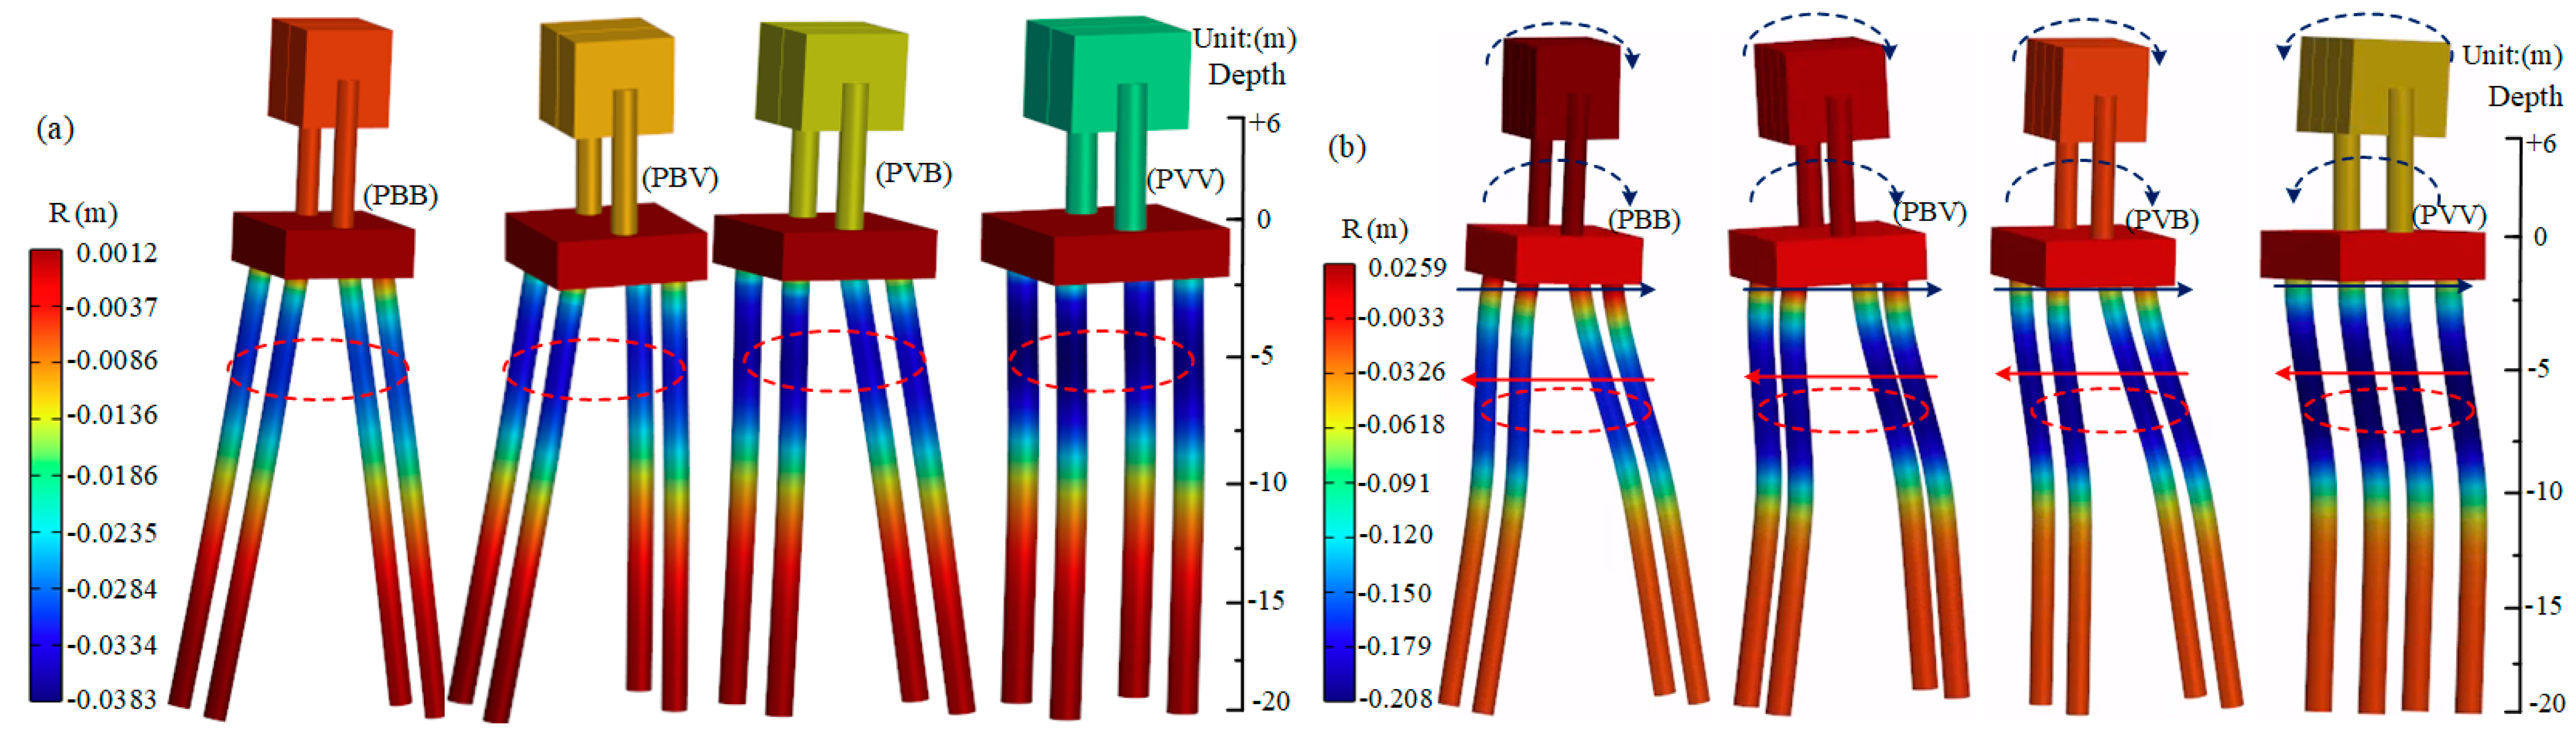
4.2.1. Pile Displacement

The lateral displacements developed in the downstream piles (F) and upstream piles (R) are depicted in Figure 10 for the different pile group configurations. For weak ground motion (0.10 g), corresponding to Figure 10a, the structure response is dominated by inertial effects. In this case, the pile lateral displacement follows a linear distribution along the pile depth, with both vertical and batter piles exhibiting peak displacements at the pile head. Under strong ground motion (0.40 g) depicted in Figure 10b,c, the structure response is dominated by kinematic effects. The pile-pinning and cap shielding effects contribute to forming a reinforcement zone near the pile head with increased lateral stiffness. The soil displacement at shallow depths follows a cosine distribution, with the peak displacement in batter piles occurring at a depth of 1 × D below the pile head. Gang et al. [37] attributed this trend to the increase in bending moment caused by the superstructure. Comparing the different pile group configurations, batter piles exhibit more significant beneficial effects than vertical piles in reducing structural horizontal displacements. The reduced displacement observed in batter piles stems from their ability to mobilize axial and lateral resistance. For instance, under weak ground motion (0.10 g), the configuration PBB is more effective at reducing lateral displacements at the pile head (with Pdisp decreasing to −16.62%) than the PBV (with Pdisp decreasing to –13.64%) and PVB (with Pdisp decreasing to −5.490%) configurations. Under strong ground motion (0.40 g), the configurations PBB, PBV, and PVB reduce the horizontal displacement by 20.02%, 14.65%, and 6.77%, respectively, compared to the PVV configuration. As the input motion intensity increases, the beneficial effects of batter piles become more pronounced.
Figure 11 presents the contour map of horizontal displacements in the different pile–cap–structure configurations. As expected, the maximum horizontal displacement occurs in the superstructure, which has a lower lateral stiffness than the soil–pile system. The structure exhibits no significant residual deformation under weak ground motion (0.10 g). However, under strong ground motion (0.40 g) with liquefaction triggered, the structure experiences substantial permanent displacements, with more pronounced displacements obtained in vertical piles compared to batter piles. Moreover, due to the change in soil shear stiffness over depth and the cap shielding effect near the surface, the shear deformations at the interfaces between soil layers and between the pile head and the cap are increased. The magnitude of flexural deformation in the piles increases substantially at the interface between the competent dense sand layer and the liquefiable loose sand layer. The magnitude of displacement in the pile cap and structures is reduced for batter piles compared to vertical piles. This is because the combination of axial and lateral forces in batter piles prevents the rapid accumulation of displacements that typically occur in vertical piles, especially in loose sand. This aspect is further discussed in the following sections.
Figure 12 presents the contour map of residual vertical displacements obtained in different pile–cap–structure configurations. The structure exhibits no significant residual vertical deformation under weak ground motion (0.10 g). The upstream and downstream piles undergo opposite vertical movements along the center of the cap, with the downstream piles moving downward and the upstream piles moving upward as the foundation system tilts in the slope direction. Under strong ground motion (0.40 g), the structure experiences substantial residual displacements in the vertical direction, with increased vertical deformations occurring in the piles at the interface between soil layers. The pile group configuration has a significant influence on the near-field response. Within depths up to 4 × D, the upstream and downstream batter piles exhibit opposite vertical movement patterns. As shown previously in Figure 9, this is because batter piles exhibit a higher lateral stiffness, which in turn prevents the development of a critical slip surface in the near-field soil.

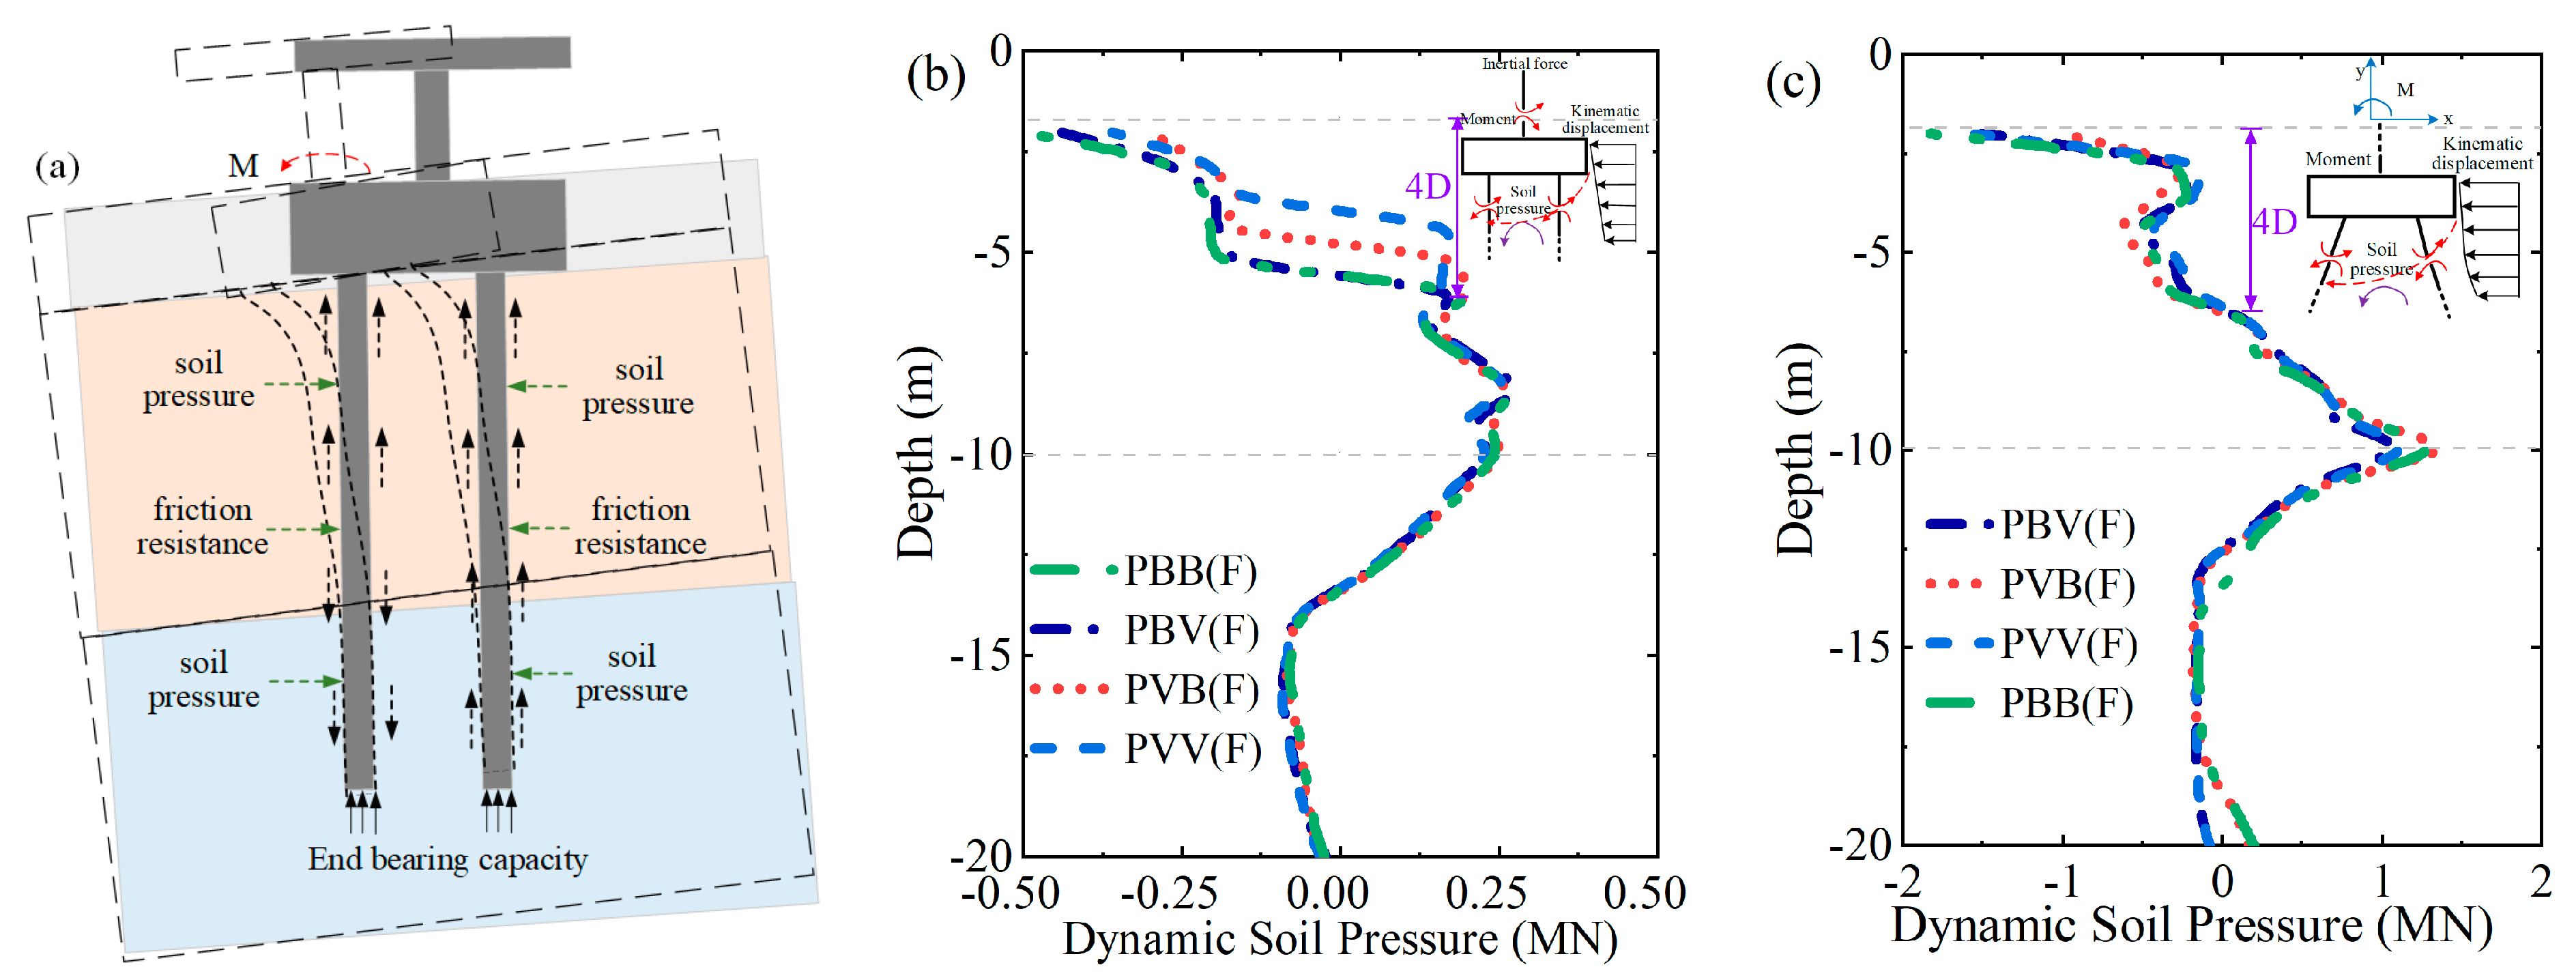
4.2.2. Dynamic Soil Pressure

Figure 13a illustrates the typical deformation mode predicted in vertical pile groups embedded in liquefiable sloping sites. As soil liquefaction occurs, the piles lose the surrounding soil’s confining effect. Figure 13b,c depict the distribution of peak dynamic earth pressures developed in the piles for different configurations. The peak dynamic earth pressure generated in the dense sand layer is low. The discontinuity of soil properties with depth causes significant contact displacement at the interface between soil layers, which explains the amplification of dynamic earth pressures during shaking. During weak ground motion (0.10 g), where inertial effects dominate, the dynamic earth pressure in the soil profile increases gradually with depth as minor levels of soil nonlinearity develop. It has also been observed in other studies [37]. Figure 13b shows that the influence depth affected by inertial effects is up to 4 × D. However, under strong ground motion (0.40 g), as depicted in Figure 13c, the dynamic earth pressure in the loose sand layer decreases towards the middle of the layer and then increases with depth. As the EPWP builds up, the liquefied soil behaves like a viscous fluid, and the dynamic earth pressure increases substantially due to the rapid loss of soil stiffness as pore water pressure builds up. At this stage, the loss of soil shear resistance at the interface between the loose sand and dense sand layers results in severe lateral spreading in the direction of the slope. This result is consistent with previous observations in Figure 9, where the soil moves in the direction of lateral spreading, and the foundation resists the flow of the upstream soil. An arc-shaped slip surface forms in the near-field as the dynamic earth pressure develops rapidly within the depth of 4 × D below the pile head, with the peak dynamic earth pressure occurring at the pile head.

4.2.3. Dynamic Friction Resistance

Figure 14 presents the variation in dynamic frictional resistance mobilized in different pile group configurations. Under weak ground motion (0.10 g), the dynamic frictional resistance exhibits a linear distribution with depth. The inclination of the pile shafts in the dense sand layer causes batter piles to generate more significant dynamic frictional resistance than vertical piles. Under strong ground motion (0.40 g), as the EPWP rises, the soil strength decreases, and the site undergoes lateral spreading, leading to bending deformation in the structure. The piles in the dense sand layer are subjected to upward forces, generating positive frictional resistance. However, the loose sand layer piles move downward due to liquefaction flow, mobilizing negative frictional resistance. Due to their inclination, batter piles experience better dynamic frictional resistance in sand layers than vertical piles.

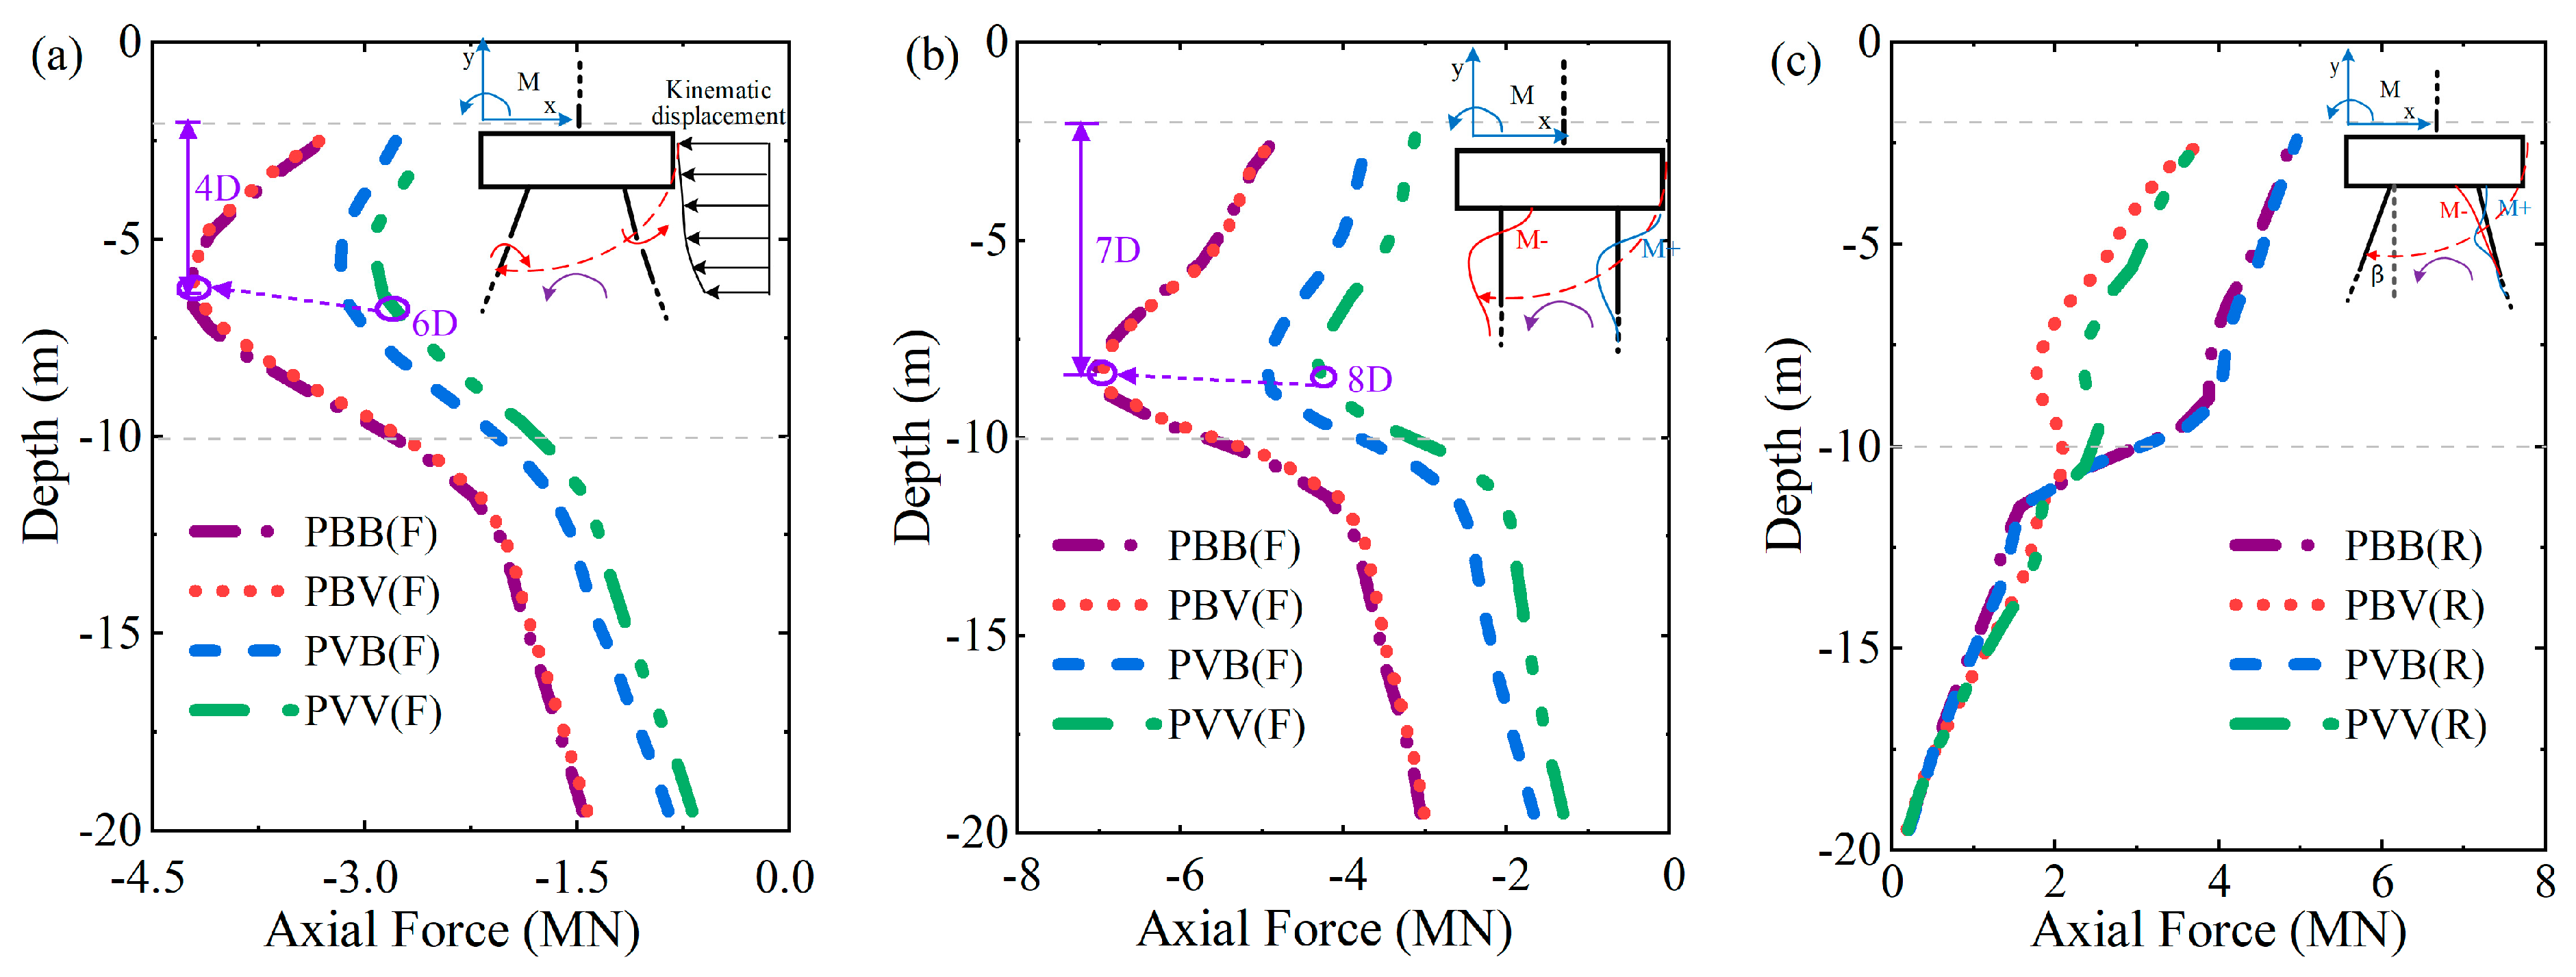
4.2.4. Pile Axial Force

The influence of different pile group configurations on axial forces developed in the piles is examined in Figure 15. As the EPWP builds up, the soil shear strength decreases significantly, and the upstream soil slides along the slope direction. The lateral earth pressures on the upstream piles are significantly higher than those on the downstream piles, causing a tilt in the foundation system. As a result, the upstream piles are primarily subjected to tensile axial forces, while the downstream piles experience mainly compressive axial forces. As shown in Figure 14, liquefaction in the loose sand layer is accompanied by downward negative frictional resistance at the pile–soil interface as the soil settles relative to the piles. This settlement, in turn, increases the axial tensile forces in the piles. The axial force in the downstream piles exhibits a “K–types” distribution with depth, with the peak axial force occurring in the middle of the loose sand layer and gradually shifting downward as the input motion intensity increases. The axial force in the upstream piles exhibits a linear distribution with depth, with the peak axial force occurring at the pile head. The active earth pressure generated by the movement of the shallow soil at the pile head, combined with the negative friction resistance caused by the liquefaction of the loose sand, further amplifies the tensile force at the pile head. Li and Motamed [19] also observed similar phenomena in their experiments and attributed them to the lateral displacement of the soil. Under strong ground motion (0.40 g), the downstream piles in the PBB, PBV, and PVB configurations experience significantly higher axial compressive forces compared to those in the PVV configuration, with increases of 69.8%, 68.37%, and 14.75%, respectively. In comparison, the axial tensile forces in the upstream piles increase by 28.02%, 30.74%, and 1.30%, respectively. On sloping sites, the PBB configuration typically attracts larger axial forces; however, the peak axial forces remain well below the allowable limit of 30.15 MN.

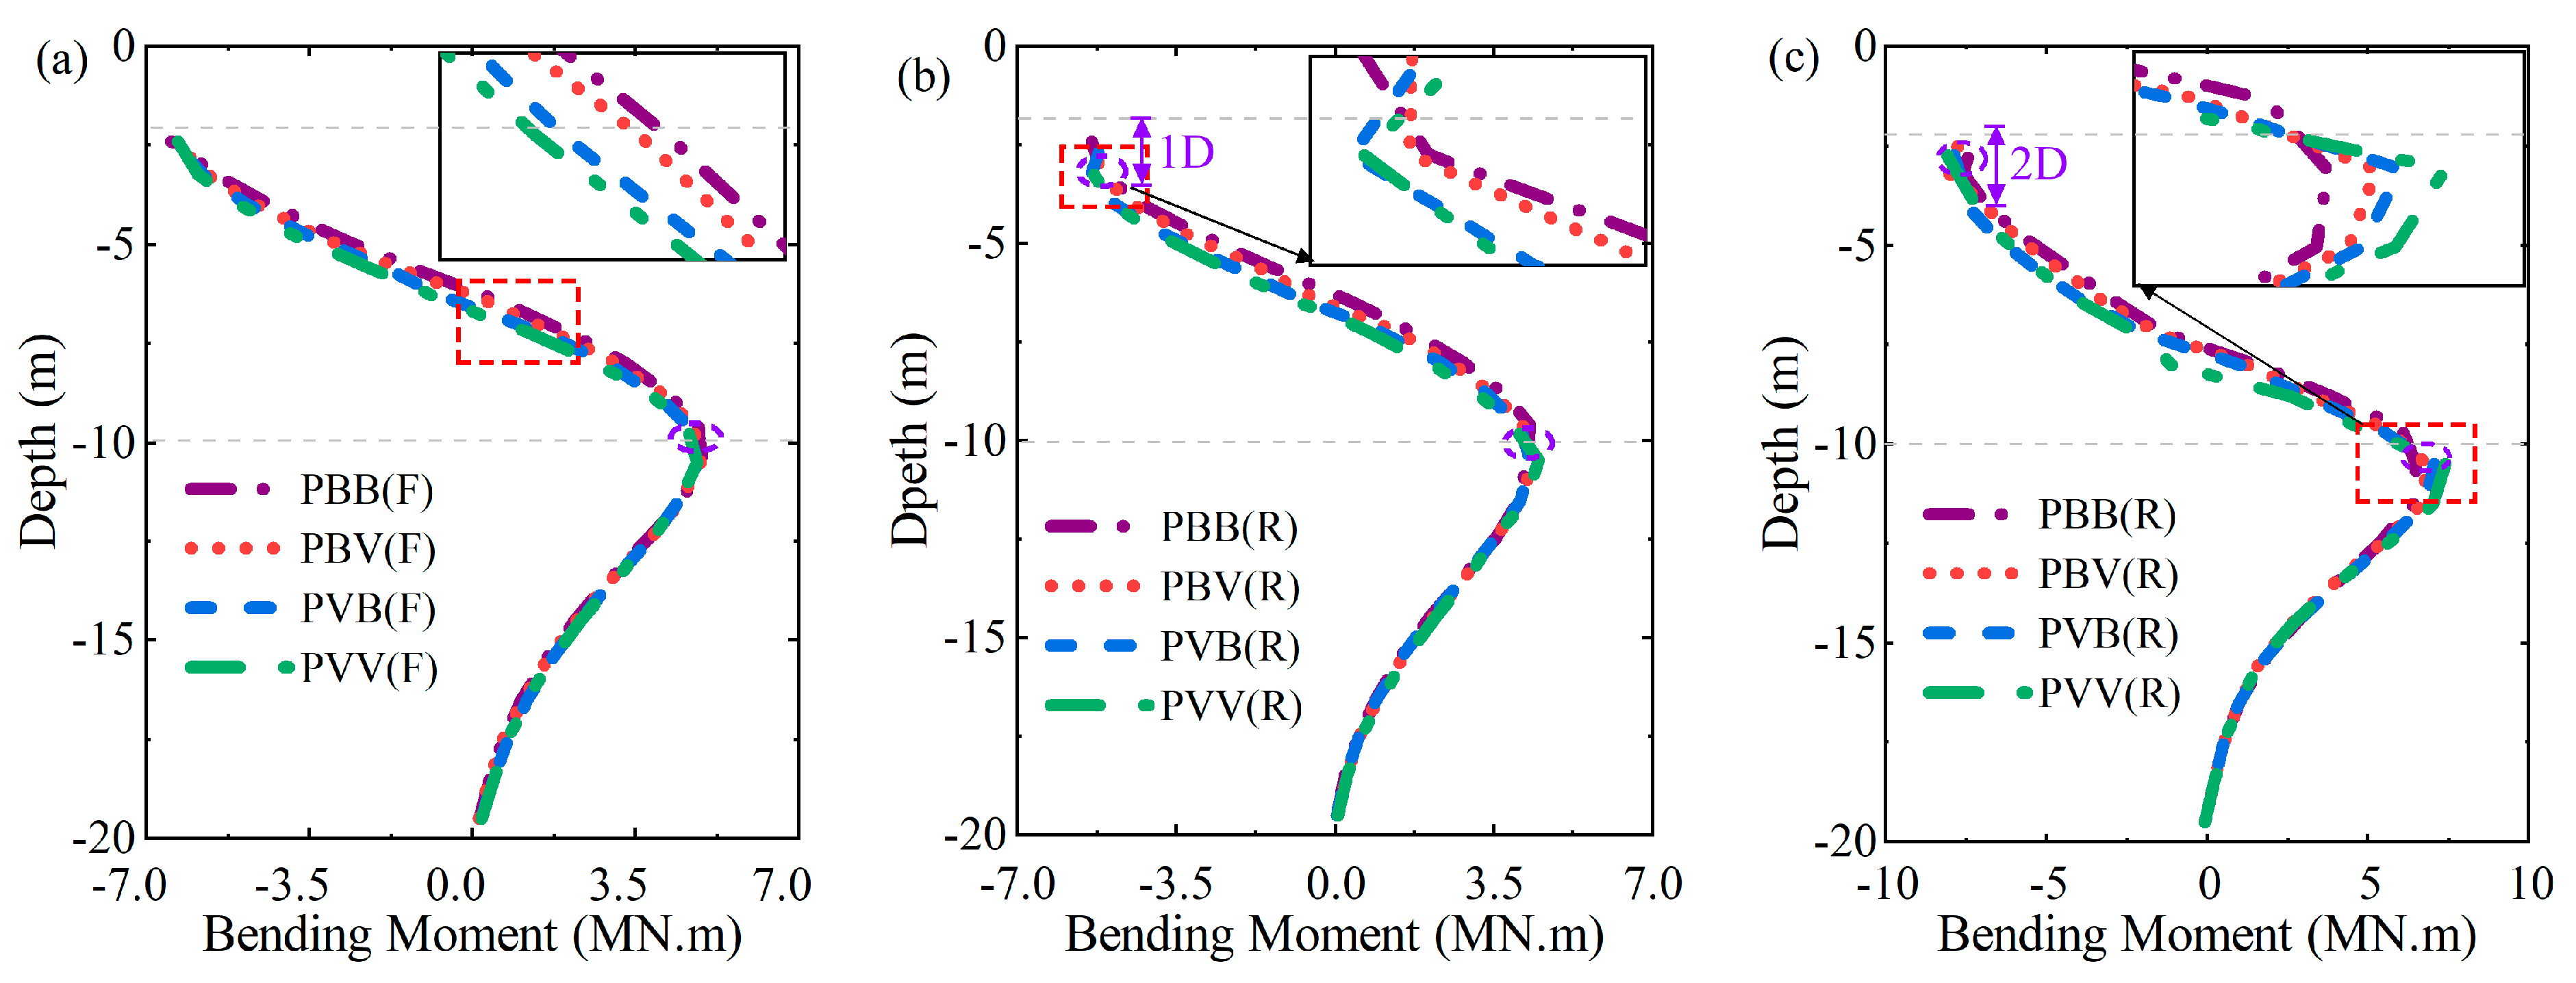
4.2.5. Pile Bending Moment

The influence of different pile group configurations on the bending moment along the piles is scrutinized in Figure 16. Under weak ground motion (0.10 g), the peak bending moment in the downstream piles is located at the pile head. In contrast, the peak bending moment in the upstream piles occurs at a depth of 1 × D and shifts deeper, up to 2 × D, as the input motion intensity increases. This result is consistent with previous observations in Figure 9 and Figure 10. An improved zone of increased lateral stiffness is formed within the depth of 2 × D below the pile head, which restrains the pile movement within the soil crust. Variations in pile group configurations, whether vertical or batter piles, have minimal impact on the bending moments developed along the piles when considering weak ground motions. However, for strong ground motion susceptible to triggering liquefaction, batter piles gradually leverage their lateral stiffness advantage, leading to significantly smaller bending moments than vertical piles. As shown in Figure 16b, the pile bending moment in the loose sand layer is reduced by 12.3%. Chen and Tazoh et al. [21] reported similar phenomena in their experiments, with batter piles exhibiting smaller responses. Under strong ground motion (0.40 g), the potential for bending failure is concentrated within a depth of 2 × D below the pile head, with this effect being more pronounced in the downstream piles than the upstream piles. Therefore, batter piles should be further reinforced within a depth of 2 × D below the pile head to mitigate the risk of failure during earthquakes.

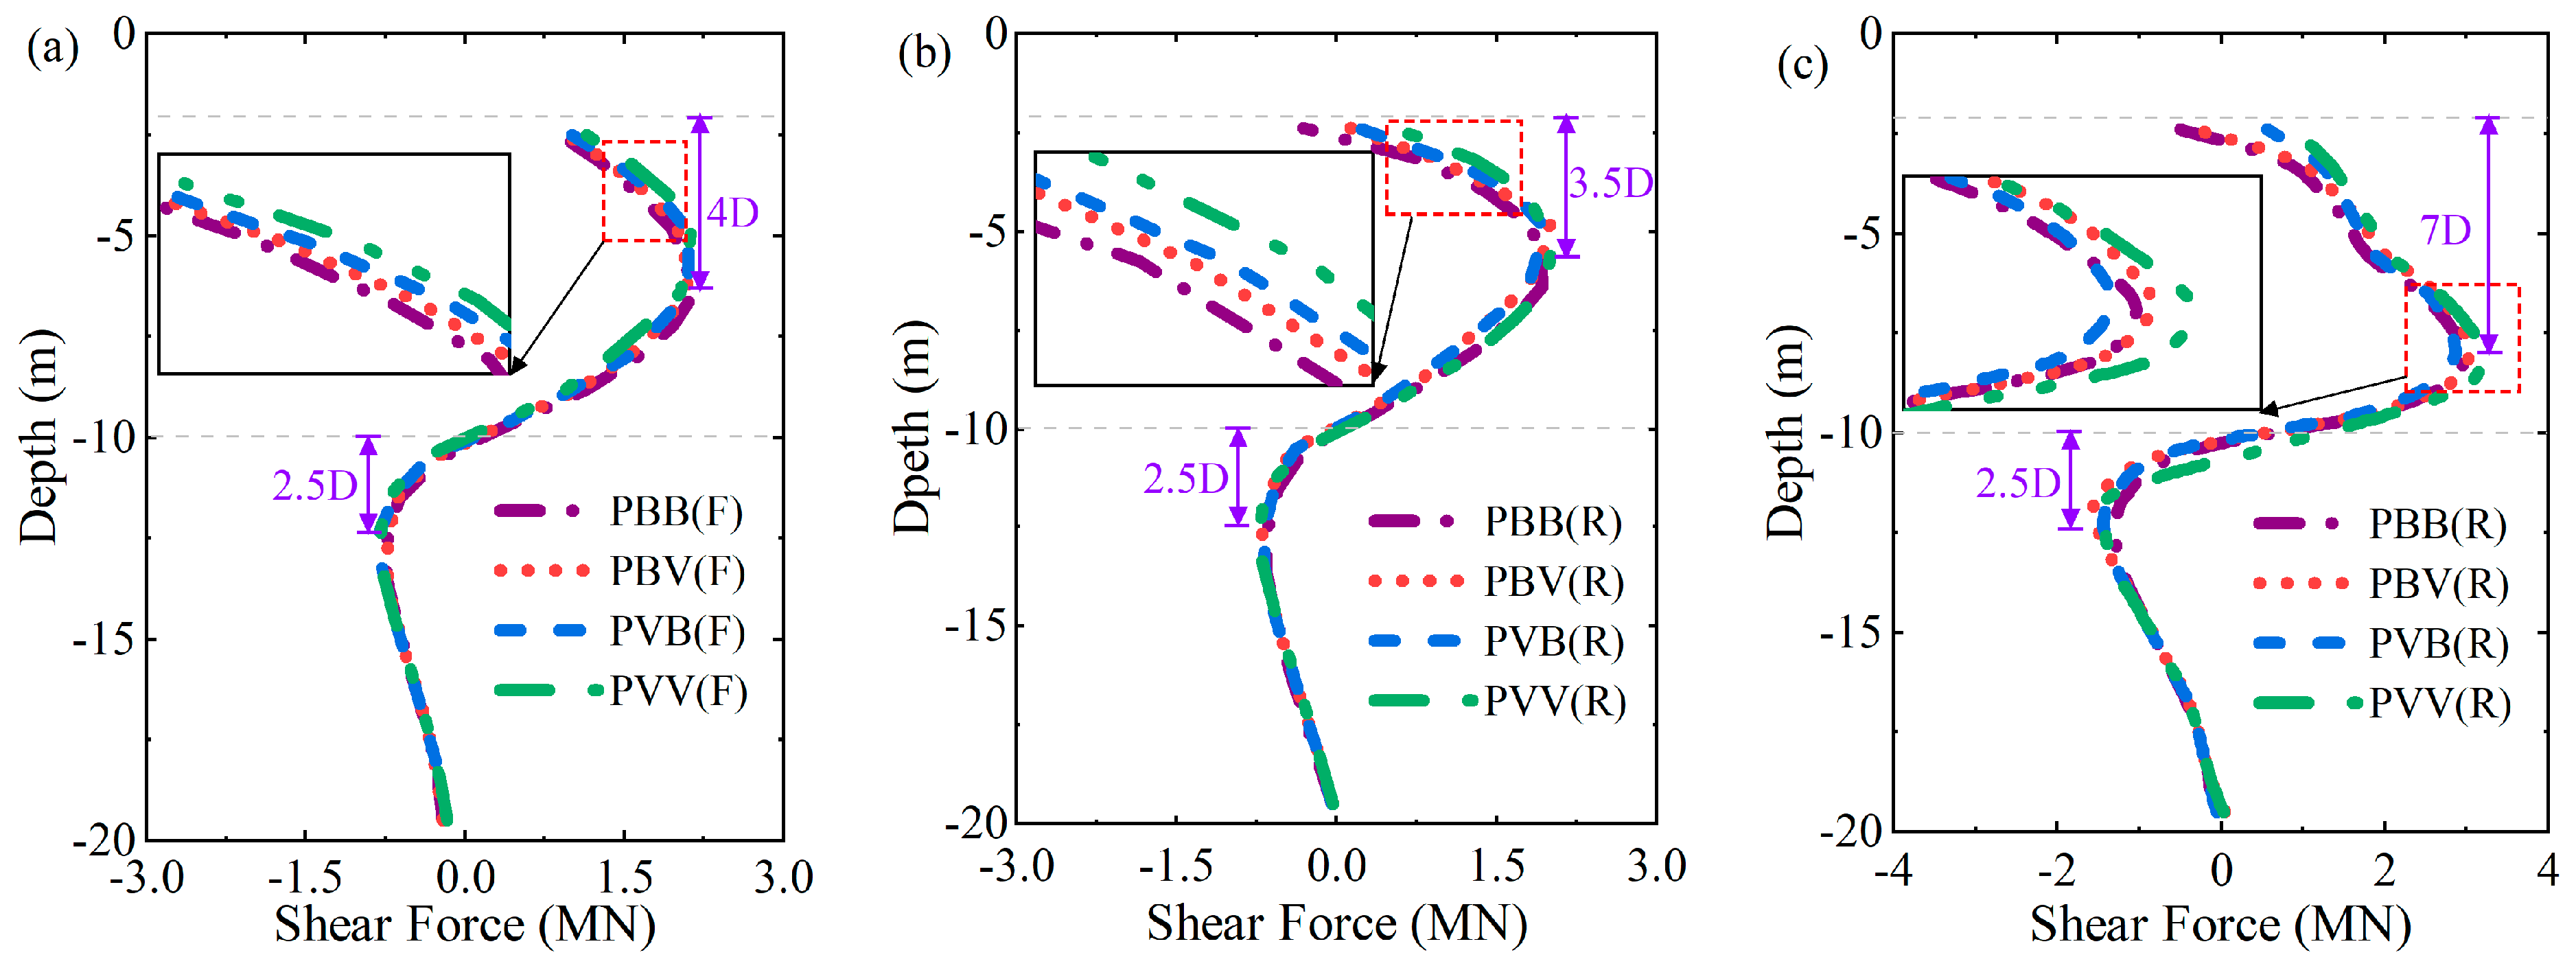
4.2.6. Pile Shear Force

Likewise, the impact of different pile group configurations on the shear forces along the piles is examined in Figure 17. The variation in pile shear force with depth exhibits an “S”-type distribution. The peak shear force is located at a depth of 4 × D below the pile head, corresponding to the middle of the loose sand layer, and progressively shifts to a deeper depth of 7 × D as the input motion intensity increases. This range of depths aligns with the increased dynamic earth pressure observed in Figure 13 due to inertial and kinematic effects. Indeed, during strong ground motion (0.40 g), liquefaction-induced lateral spreading is triggered within the loose sand layer. This causes the shear forces in the piles to shift downward at the interface between the sliding loose sand layer and the competent dense sand layer. In the dense sand layer, pile displacements are in phase with soil shear deformations, reducing shear forces within the piles. After soil liquefaction, batter piles demonstrate better shear resistance than vertical piles, with the peak shear force decreasing by 10.59%. This positive effect is more significant for upstream than downstream piles. The phenomenon of reduced shear force at the pile head has also been reported in the literature ([11,15,17]). Furthermore, the shielding effect of the pile cap and the high lateral stiffness generated by the pile-pinning effect gradually exert a positive influence, effectively suppressing the movement of the shallow soil in the near-field. Batter piles exhibit better shear resistance compared to vertical piles, with shear forces at the pile head reduced by 64.5%.

4.3. Cap and Superstructure Response

4.3.1. Cap Rotational Deformation

The seismic performance of the different group pile configurations is scrutinized in Figure 18 by showing the cap rotation during shakings. The results indicate that the residual rotation of the cap is more pronounced in the vertical pile group configuration (PVV) compared to batter pile configurations (PBB, PBV, PVB), which exhibit better resistance to tilting. Due to their inclined geometry, battery piles provide additional lateral stiffness, reducing rotational forces acting on the cap. For instance, under weak ground motion (0.10 g), the PBB, PBV, and PVB configurations reduce the rotational deformation by 68.3%, 41.8%, and 31.22%, respectively, compared to the PVV configuration. This reduction in rotational deformation of the cap becomes more significant when considering strong ground motion (0.40 g), with up to an 85.9% reduction for the PBB configuration. The inclined piles resist the rotational inertial forces by generating a counteracting moment, stabilizing the pile cap, and preventing excessive rotation.
Figure 19 shows the contour map of structural bending deformation. Under weak ground motion (0.10 g), no significant residual bending deformation is observed, while under strong ground motion (0.40 g), the structure displays pronounced bending deformation. This latter trend is due to the sliding of the upstream soil as shown in Figure 9 and Figure 12, increasing the lateral earth pressure on the piles. The piles in the loose sand layer undergo significant bending deformation, which is more prominent for vertical piles than batter piles. The piles’ group configuration alters the deformation mode of the superstructure. The vertical and batter pile-supported system superstructures undergo rotational deformation in opposite directions.

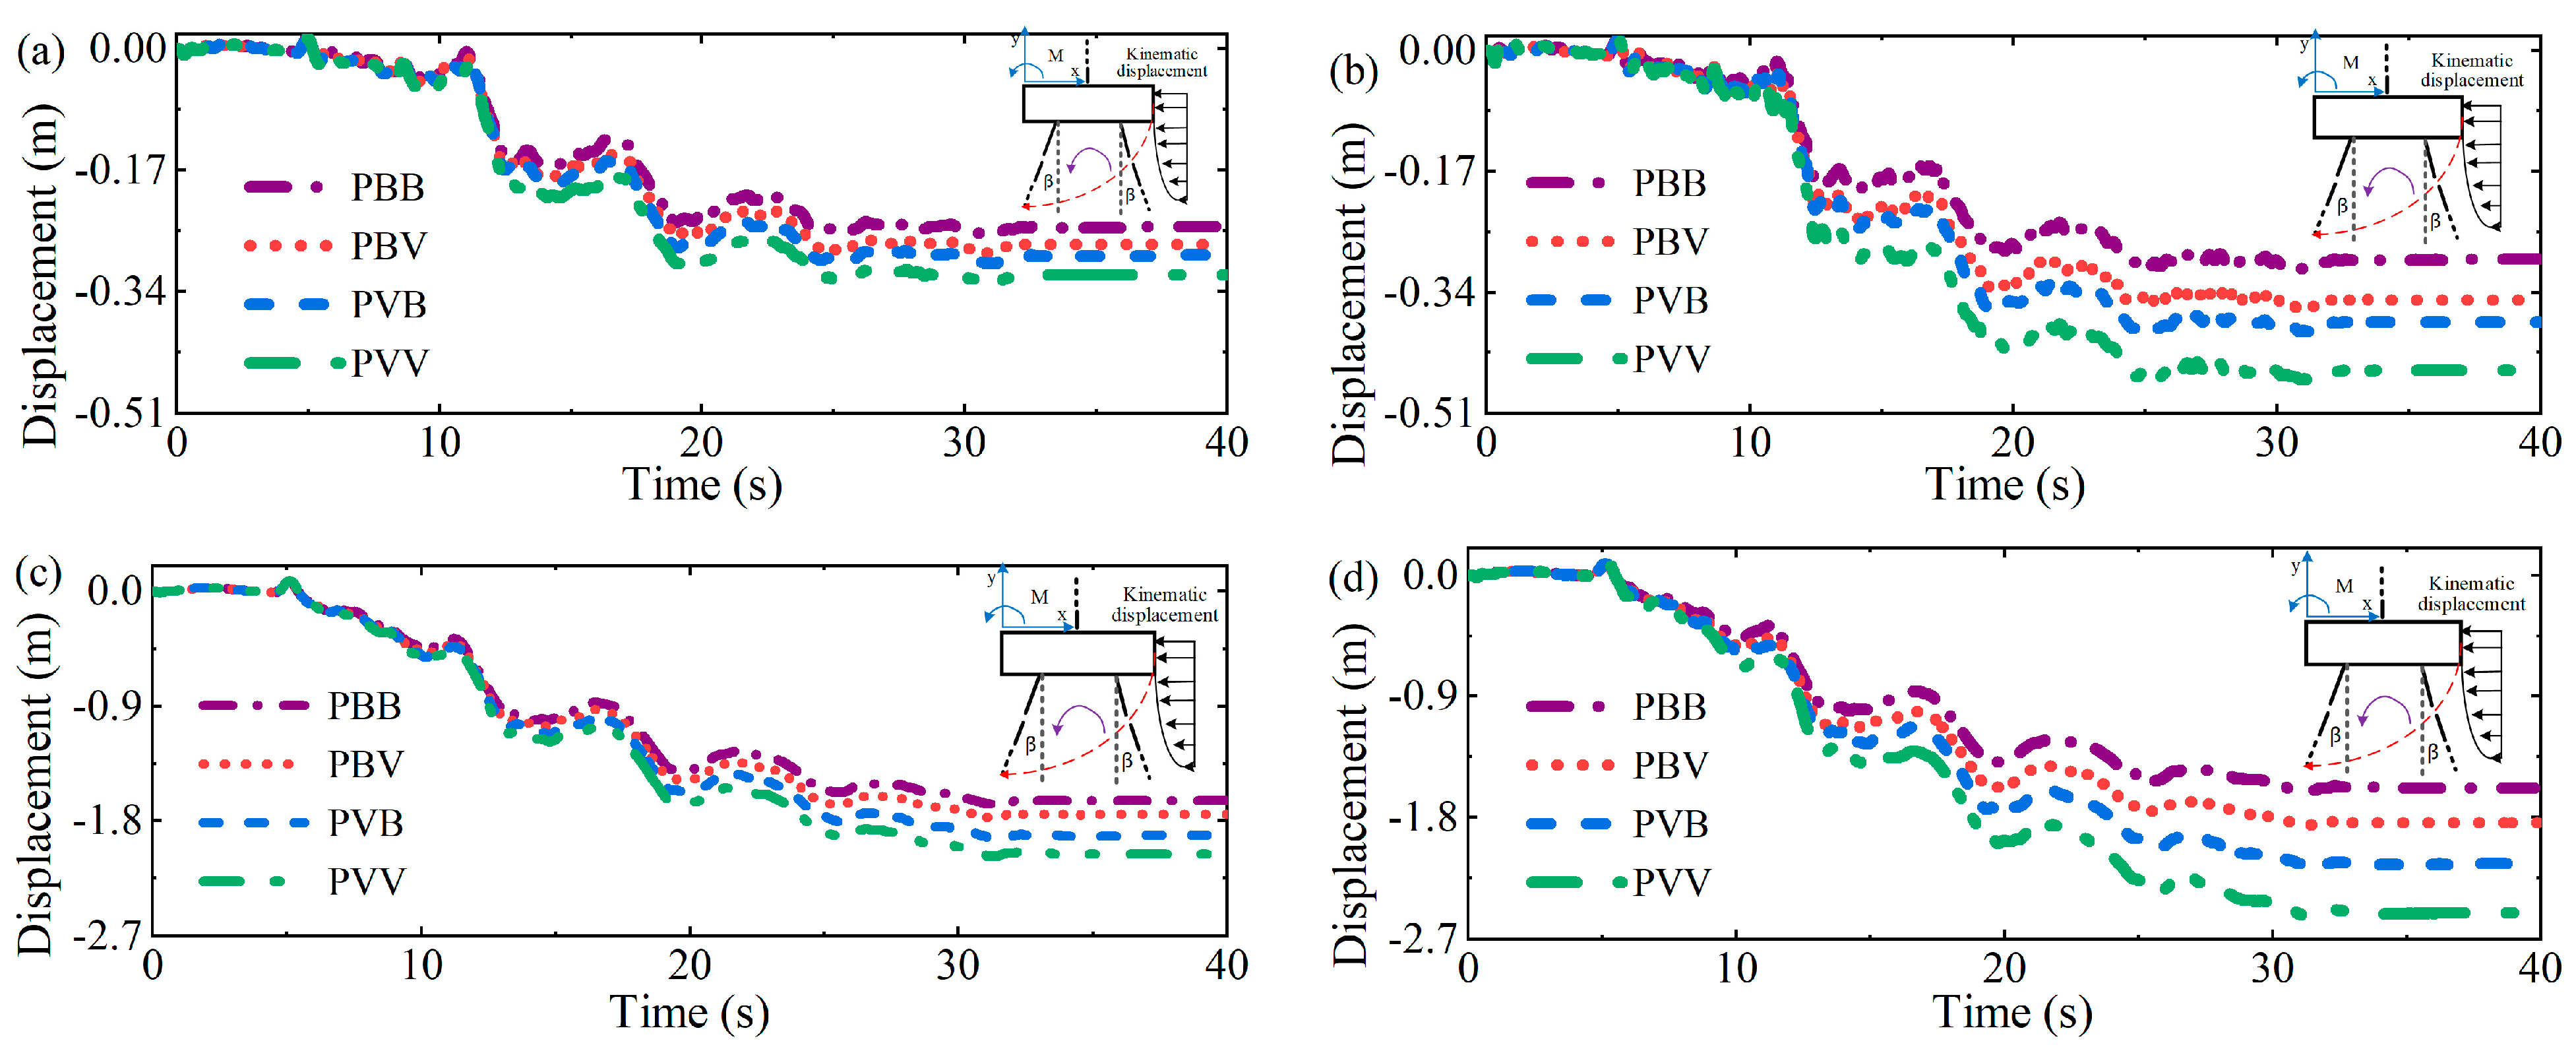
4.3.2. Cap and Superstructure Horizontal Displacement

The horizontal displacement of the pile cap and superstructure under seismic loading is driven by the dynamic interaction between the soil and the pile foundation. Figure 20 presents the time history of horizontal displacement for both the cap and the superstructure. During weak and strong ground motions, the pile cap and superstructure undergo significant permanent displacements, which increase notably with height. For instance, under weak ground motion (0.10 g), the PBV configuration shows a more pronounced positive effect on the superstructure, with cap displacements (CDisp) decreasing by 14.96%, compared to the PVB configuration, which reduces (CDisp) by 6.96%. However, the PBB configuration has the greatest impact, decreasing (CDisp) by 20.2%. Similar trends are observed for strong ground motion (0.40 g), with maximum displacements in the superstructure reduced by 37.13%, 26.76%, and 14.55% in the PBB, PVB, and PBV configurations, respectively, compared to the PVV configuration. Batter piles can significantly reduce the horizontal displacement of the superstructure, and as the height increases, structures supported by batter piles tend to experience smaller displacements. The observed reduction in horizontal displacement in batter piles is primarily due to the enhanced lateral resistance offered by their inclined geometry. Batter piles transfer lateral loads more efficiently to the surrounding soil, thereby reducing the overall displacement of the superstructure. Additionally, the inclined piles generate a stiffening effect, particularly in dense sands, that limits the lateral movement of the entire pile group.

5. Conclusions

This study presents a detailed numerical investigation comparing the seismic performance of batter and vertical piles on liquefiable sloping sites. A three-dimensional finite element model simulates the dynamic response of a superstructure supported by pile groups on a liquefiable site prone to lateral spreading during seismic shaking. An advanced constitutive soil model for liquefaction is employed, and the finite element model is validated using large-scale shaking table test results. Parametric seismic ground response analyses are conducted by varying the pile group configurations and input ground motion intensities.
Key findings indicate that batter piles, due to their inclined orientation, outperform vertical piles in resisting lateral spreading. They exhibit enhanced lateral stiffness, reducing the soil displacement and liquefaction potential in the near-field. Residual horizontal displacements in batter piles are reduced by up to 20% compared to vertical piles. While the peak displacement of vertical piles occurs at the pile head, in batter piles, it occurs at a depth of 2 × D below the pile head. Furthermore, batter piles display better shear resistance and smaller bending moments at shallow depths due to the shielding effect. Consequently, the tilting of the pile cap is significantly reduced in batter piles, with up to an 85% reduction under strong ground motion. However, batter piles experience increased axial compressive and tensile forces compared to vertical piles, with increases of approximately up to 70% and 20%, respectively.
While vertical piles are often preferred in engineering practice, the beneficial effects of batter piles on the seismic stability of structures demonstrated in this study may encourage the adoption of more advanced numerical modeling in engineering projects. Future research could further refine the pile geometry and spacing and extend the analysis to different soil types and ground motion scenarios to generalize the findings.

Author Contributions

R.P.: Conceptualization, Writing—Original Draft Preparation; C.X.: Writing—Review and Editing, Funding Acquisition; R.M.: Writing—Review and Editing; J.C.: Software, Visualization. All authors have read and agreed to the published version of the manuscript.

Funding

This research was funded by [National Outstanding Youth Science Fund Project of the National Natural Science Foundation of China] grant number [52225807], and [China Scholarship Council program] grant Number ID: 202306540040).

Data Availability Statement

The raw data supporting the conclusions of this article will be made available by the authors on request.

Acknowledgments

The authors thank the China Scholarship Council (CSC) and the financial support from the National Outstanding Youth Science Fund Project of the National Natural Science Foundation of China (Grant No. 52225807). Special thanks go to the peer reviewers who provided valuable suggestions for improving this paper.

Conflicts of Interest

The authors declare no conflict of interest.

References

  1. Bhattacharya, S.; Tokimatsu, K.; Goda, K.; Sarkar, R.; Shadlou, M.; Rouholamin, M. Collapse of Showa Bridge during 1964 Niigata Earthquake: A Quantitative Reappraisal on the Failure Mechanisms. Soil Dyn. Earthq. Eng. 2014, 65, 55–71. [Google Scholar] [CrossRef]
  2. Fujino, Y.; Hashimoto, S.; Abe, M. Damage Analysis of Hanshin Expressway Viaducts during 1995 Kobe Earthquake. I: Residual Inclination of Reinforced Concrete Piers. J. Bridge Eng. 2005, 10, 45–53. [Google Scholar] [CrossRef]
  3. Yu, J.; Yong, P.; Read, S.; Brabhaharan, P.; Foon, M. The Ms 8.0 Wenchuan Earthquake of 12 May 2008 Reconnaissance Report. Bull. New Zealand Soc. Earthq. Eng. 2010, 43, 41–83. [Google Scholar] [CrossRef]
  4. Moss, R.E.S.; Kayen, R.E.; Tong, L.-Y.; Liu, S.-Y.; Cai, G.-J.; Wu, J. Retesting of Liquefaction and Nonliquefaction Case Histories from the 1976 Tangshan Earthquake. J. Geotech. Geoenviron. Eng. 2011, 137, 334–343. [Google Scholar] [CrossRef]
  5. Bian, W.; Wu, J.; Lei, B.; Zhang, L.; Liang, H. Detection of Pre-Seismic Deformation of 2021 Maduo M7.4 Earthquake by Using ASF HYP3. In Proceedings of the IET International Radar Conference (IRC 2023), Chongqing, China, 1 December 2023; pp. 4178–4182. [Google Scholar] [CrossRef]
  6. Joque, D.T.; Huggins, M.; Rusten, A. Design/Build Delivery of the Schnitzer Steel Wharf and Seawall, Tacoma, Washington. In Proceedings of the Ports ’01; American Society of Civil Engineers: Norfolk, VA, USA, 27 April, 2001; pp. 1–10. [Google Scholar]
  7. Rashid, M.; Kabir, M.d.R.; Ibne Zaman, M.M. Padma Bridge in Global Media and Boost to SDGs in Bangladesh. J. Media 2023, 4, 445–466. [Google Scholar] [CrossRef]
  8. Brauer, S.A. Damage Identification of an Offshore Wind Turbine Jacket Support Structure. Master’s Thesis, Norwegian University of Science and Technology, Trondheim, Norway, 2014. [Google Scholar]
  9. Wang, Y.; Orense, R.P. Numerical Analysis of Seismic Performance of Inclined Piles in Liquefiable Sands. Soil Dyn. Earthq. Eng. 2020, 139, 106274. [Google Scholar] [CrossRef]
  10. Berrill, J.B.; Christensen, S.A.; Keenan, R.P.; Okada, W.; Pettinga, J.R. Case Study of Lateral Spreading Forces on a Piled Foundation. Géotechnique 2001, 51, 501–517. [Google Scholar] [CrossRef]
  11. Chen, T. Centrifuge Test and Numerical Study on the Seismic Behavior of Batter Pile Foundation in Lateral Spreading Soil. Master’s Thesis, Tsinghua University, Beijing, China, 2018. [Google Scholar]
  12. Kastranta, G.; Gazetas, G.; Tazoh, T. Performance of Three Quay Walls in Maya Wharf: Kobe 1995. In Proceedings of the 11th European Conference on Earthquake Engineering, Paris, France, 6–11 September 1998; Volume Topic TS3. [Google Scholar]
  13. Seed, R.B.; Dickenson, S.E.; Idriss, I.M. Principal Geotechnical Aspects of the 1989 Loma Prieta Earthquake. Soils Found. 1991, 31, 1–26. [Google Scholar] [CrossRef]
  14. Li, Z.; Escoffier, S.; Kotronis, P. Centrifuge Modeling of Batter Pile Foundations under Earthquake Excitation. Soil Dyn. Earthq. Eng. 2016, 88, 176–190. [Google Scholar] [CrossRef]
  15. Rajeswari, J.S.; Sarkar, R. Seismic Behavior of Batter Pile Groups Embedded in Liquefiable Soil. Earthq. Eng. Eng. Vib. 2021, 20, 583–604. [Google Scholar] [CrossRef]
  16. Rajeswari, J.S.; Sarkar, R. Adequacy of Batter Piles under Seismic Conditions: A Review of Past Performances and Investigations. Structures 2024, 61, 106022. [Google Scholar] [CrossRef]
  17. Giannakou, A.; Gerolymos, N.; Gazetas, G.; Tazoh, T.; Anastasopoulos, I. Seismic Behavior of Batter Piles: Elastic Response. J. Geotech. Geoenvironmental Eng. 2010, 136, 1187–1199. [Google Scholar] [CrossRef]
  18. McManus, K.; Turner, J.; Charton, G. Inclined Reinforcement to Prevent Soil Liquefaction. In Proceedings of the Annual NZSEE Technical Conference, Wairakei, New Zealand, 11 March 2005; pp. 11–13. [Google Scholar]
  19. Motamed, R.; Towhata, I.; Honda, T.; Tabata, K.; Abe, A. Pile Group Response to Liquefaction-Induced Lateral Spreading: E-Defense Large Shake Table Test. Soil Dyn. Earthq. Eng. 2013, 51, 35–46. [Google Scholar] [CrossRef]
  20. Kayalvizhi, S.K.; Muthukkumaran, K.; Shukla, S.K. Experimental Study on Evaluating the Lateral Load Capacity of Raker Pile in Sloping Ground. Aust. J. Civ. Eng. 2023, 21, 20–33. [Google Scholar] [CrossRef]
  21. Tazoh, T.; Sato, M.; Jang, J. Centrifuge Tests on Pile Foundation-Structure Systems Affected by Liquefaction-Induced Soil Flow after Quay Wall Failure. Doboku Gakkai Ronbunshuu A 2010, 66, 133–147. [Google Scholar] [CrossRef]
  22. Pan, R.; Xu, C.; Jia, K.; Dou, P.; Kamran, I. Large-Scale Shaking Table Test and Three-Dimensional Numerical Simulation Research on Earthquake Seismic Failure Response of Laterally Spreading Site-Pile Group-Superstructure System. Bull Earthq. Eng. 2023, 21, 4789–4819. [Google Scholar] [CrossRef]
  23. Li, Z.; Escoffier, S.; Kotronis, P. Centrifuge Modeling of Batter Pile Foundations under Sinusoidal Dynamic Excitation. Bull Earthq. Eng. 2016, 14, 673–697. [Google Scholar] [CrossRef]
  24. Youd, T.L.; Perkins, D.M. Mapping of Liquefaction Severity Index. J. Geotech. Eng. 1987, 113, 1374–1392. [Google Scholar] [CrossRef]
  25. Zhu, M.; McKenna, F.; Scott, M.H. OpenSeesPy: Python Library for the OpenSees Finite Element Framework. SoftwareX 2018, 7, 6–11. [Google Scholar] [CrossRef]
  26. Borgese, P. Numerical Analysis of Half-Joints Subjected to Corrosion and Evaluation of Possible Retrofitting Interventions. Master’s Thesis, Politecnico di Torino, Torino, Italy, 2024. [Google Scholar]
  27. Desai, C.S.; Zaman, M.M.; Lightner, J.G.; Siriwardane, H.J. Thin-Layer Element for Interfaces and Joints. Int. J. Numer. Anal. Methods Geomech. 1984, 8, 19–43. [Google Scholar] [CrossRef]
  28. Trapani, F.D.; Bogatkina, V.; Petracca, M.; Camata, G. Evaluation of the Additional Shear Demand Due to Frame-Infill Interaction: A New Capacity Model. Procedia Struct. Integr. 2023, 44, 496–503. [Google Scholar] [CrossRef]
  29. Ghalibafian, H. Evaluation of the Effects of Nonlinear Soil-Structure Interaction on the Inelastic Seismic Response of Pile-Supported Bridge Piers. Ph.D. Thesis, University of British Columbia, Vancouver, BC, Canada, 2006. [Google Scholar]
  30. Hussein, A.F.; El Naggar, M.H. Seismic Behaviour of Piles in Non-Liquefiable and Liquefiable Soil. Bull Earthq. Eng. 2021, 20, 77–111. [Google Scholar] [CrossRef]
  31. Shahir, H.; Mohammadi-Haji, B.; Ghassemi, A. Employing a Variable Permeability Model in Numerical Simulation of Saturated Sand Behavior under Earthquake Loading. Comput. Geotech. 2014, 55, 211–223. [Google Scholar] [CrossRef]
  32. Chang, D. Inertial and Lateral Spreading Demands on Soil -Pile -Structure Systems in Liquefied and Laterally Spreading Ground during Earthquakes. Ph.D. Thesis, University of California, Davis, CA, USA, 2007. [Google Scholar]
  33. Dashti, S.; Kirkwood, P. A Centrifuge Study of Seismic Structure-Soil-Structure Interaction on Liquefiable Ground and Implications for Design in Dense Urban Areas. Earthq. Spectra 2018, 34, 1113–1134. [Google Scholar] [CrossRef]
  34. Ramirez, J.; Barrero, A.R.; Chen, L.; Dashti, S.; Ghofrani, A.; Taiebat, M.; Arduino, P. Site Response in a Layered Liquefiable Deposit: Evaluation of Different Numerical Tools and Methodologies with Centrifuge Experimental Results. J. Geotech. Geoenviron. Eng. 2018, 144, 04018073. [Google Scholar] [CrossRef]
  35. Xu, C.; Dou, P.; Du, X.; El Naggar, M.H.; Miyajima, M.; Chen, S. Large Shaking Table Tests of Pile-Supported Structures in Different Ground Conditions. Soil Dyn. Earthq. Eng. 2020, 139, 106307. [Google Scholar] [CrossRef]
  36. Jia, K.; Xu, C.; El Naggar, M.H.; Zhang, X.; Du, X.; Dou, P.; Cui, C. Large-Scale Shake Table Testing of Pile Group-Bridge Model in Inclined Liquefiable Soils with Overlying Crusts. Soil Dyn. Earthq. Eng. 2022, 163, 107555. [Google Scholar] [CrossRef]
  37. Zheng, G.; Zhang, W.; Zhou, H.; Forcellini, D.; Zhao, J.; Zhang, T. 3D Numerical Modeling of the Inertial and Kinematic Interactions of Inclined Pile Groups in Liquefiable Soils. Int. J. Geomech. 2024, 24, 04024161. [Google Scholar] [CrossRef]
Figure 1. Schematic diagram of soil–structure system.
Buildings 14 03125 g001
Figure 2. Input ground motions: (a) normalized time–history acceleration and HUSID plots; (b) response spectra.
Buildings 14 03125 g002
Figure 3. Schematic and details of a three–dimensional numerical model of soil–structure system.
Buildings 14 03125 g003
Figure 4. Comparison between experimental and numerical simulations for Ottawa sand F65 with Dr (40%) and Dr (90%).
Buildings 14 03125 g004
Figure 5. Comparison of experiment and numerical simulation in a liquefiable horizontal site: (a) overall model view; (b) EPWP time history; (c) piles’ bending moment.
Buildings 14 03125 g005
Figure 6. Comparison of experiment and numerical simulation in a liquefiable sloping site: (a) overall model view; (b) near–field soil displacement; (c) piles’ curvature.
Buildings 14 03125 g006
Figure 7. Excess pore water pressure ratios (EPWPRs) predicted in numerical simulation using the Tabas earthquake record: (a) time-history far-field response; (b) near-field response for PVV configuration; (c) near-field response for PBB configuration.
Buildings 14 03125 g007
Figure 8. Peak soil displacements in the horizontal direction: (a) free–field and near–field; (b) weak earthquake (0.10 g); (c) strong earthquake (0.40 g).
Buildings 14 03125 g008
Figure 9. Contour map of vertical displacements developed in the soil–structure system.
Buildings 14 03125 g009
Figure 10. Horizontal pile displacements for different configurations: (a) downstream piles (0.10 g); (b) downstream piles (0.40 g); (c) upstream piles (0.40 g).
Buildings 14 03125 g010
Figure 11. Contour map of residual horizontal displacements for different pile–cap–structure configurations: (a) weak earthquake (0.10 g); (b) strong earthquake (0.40 g).
Buildings 14 03125 g011
Figure 12. Contour map of residual vertical displacements for different pile–cap–structure configurations: (a) weak earthquake (0.10 g); (b) strong earthquake (0.40 g).
Buildings 14 03125 g012
Figure 13. Dynamic earth pressures along the piles: (a) schematic diagram of friction pile forces; (b) weak earthquake (0.10 g); (c) strong earthquake (0.40 g).
Buildings 14 03125 g013
Figure 14. Dynamic frictional resistance along the piles: (a) weak earthquake (0.10 g); (b) strong earthquake (0.40 g).
Buildings 14 03125 g014
Figure 15. Axial forces along the piles: (a) downstream piles (0.10 g); (b) downstream piles (0.40 g); (c) upstream piles (0.40 g).
Buildings 14 03125 g015
Figure 16. Bending moments along the piles: (a) downstream piles (0.10 g); (b) upstream piles (0.10 g); (c) upstream piles (0.40 g).
Buildings 14 03125 g016
Figure 17. Shear forces along the piles: (a) downstream piles (0.10 g); (b) upstream piles (0.10 g); (c) upstream piles (0.40 g).
Buildings 14 03125 g017
Figure 18. Cap rotational deformation: (a) weak earthquake (0.10 g); (b) strong earthquake (0.40 g).
Buildings 14 03125 g018
Figure 19. Contour map of structural rotational deformation: (a) weak earthquake (0.10 g); (b) strong earthquake (0.40 g).
Buildings 14 03125 g019
Figure 20. Horizontal displacements of the cap and superstructure: (a) cap (0.10 g); (b) superstructure (0.10 g); (c) cap (0.40 g); (d) superstructure (0.40 g).
Buildings 14 03125 g020
Table 1. Soil parameters [32,33,34].
ParameterOttawa SandClayDescription
D r (%)4090 Relative density
e0.700.55 Void ratio
P r ' (kPa) 101101101Reference effective confining pressure
G r e f (MPa) 8210515Octahedral small-strain shear modulus
γ max 0.10.10.1Maximum octahedral shear strain
d0.50.50.5Pressure dependency coefficient
φ T X C (degrees) 3138.5-Triaxial peak friction angle
φ P T (degrees)26.834-Phase transformation angle
c 1 ,   c 2 ,   c 3 0.61, 3.1, 2.240.077, 1.25, 1.36-Control shear-induced volumetric change, contraction tendency based on dilation history, and overburden stress effects, respectively.
d 1 ,   d 2 ,   d 3 0.1, 3.0, 0.271.13, 3.0, 1.05-Reflect dilation tendency; stress history, d; and overburden stress, respectively.
Disclaimer/Publisher’s Note: The statements, opinions and data contained in all publications are solely those of the individual author(s) and contributor(s) and not of MDPI and/or the editor(s). MDPI and/or the editor(s) disclaim responsibility for any injury to people or property resulting from any ideas, methods, instructions or products referred to in the content.

