Abstract
To address the challenge of quantitatively assessing the mentalization of emotions in color design schemes, this study uses Baidu Street View images and deep learning, integrates multi-source data, and innovatively constructs a color data model based on a comprehensive color indicator system for the quantitative assessment and visual representation of how the color environments of elementary school urban neighborhoods impact children’s mentalization of emotions. This model systematically incorporates physical color indicators, integrates elements such as perceptual frequency, and provides a novel perspective for color planning. The study’s results reveal that color metrics significantly impact children’s mentalization of emotions across multiple dimensions, with gender and age emerging as important influencing factors. Additionally, significant correlations were found between color and environmental elements such as building façades, roads, and signs. The study provides urban planners and architects with a practical color data model and recommendations for the revitalization of elementary school urban neighborhoods, offering a scientific basis for optimizing color design.
1. Introduction
1.1. Background
With the sustainable development of cities, the continuous improvements in quality of life, and the ongoing pursuit of distinctive urban features, the colors of urban neighborhoods have become increasingly diverse, enriching the urban visual experience and exerting a profound psychological impact on its users. It is increasingly important to thoroughly investigate the impact of urban environmental colors on people’s psychology. Urban environmental colors can be studied through various dimensions, including natural color [1], cultural color [2], and architectural and spatial color [3]. This study investigates children’s emotional responses, with a particular focus on street interfaces and architectural color analysis. It evaluates the relationship between the color design of primary school urban blocks and children’s mental well-being, offering foundational guidance for color planning within the context of urban renewal.
Traditional color measurement methods, such as field surveys, color charts, or spectrophotometers, can provide accurate data, but are limited by high costs and low efficiency, making them unsuitable for large-scale and rapidly changing urban environments [4]. As digital image processing technology and streetscape image resources advance [5], image-based color assessment methods have emerged [6,7,8], providing new avenues for data collection and research. Street view images can accurately reflect the urban environment [9,10,11] and are readily accessible and easy to process. By combining semantic image segmentation with deep learning, the color information of urban façades can be automatically extracted from extensive streetscape images [12,13], enabling large-scale and precise color mapping [8,14]. Such studies enhance both the efficiency and accuracy of data processing [15], while also providing new insights and methodologies for researching the influence of urban spatial color on children’s psychological perception.
Therefore, this study endeavors to integrate the analysis of color with environmental elements, perceived frequency, and the mentalization of emotion, aiming to establish a comprehensive model for analyzing color data in elementary school urban neighborhoods. This paper defines “elementary school urban neighborhood color” as the color of the built environment in the blocks, including community units and school districts, surrounding elementary schools within an urban area. This study systematically investigates the influence of elementary school urban block color on children’s mentalization of emotions by developing a color indicator system and integrating it with Baidu Street View images (BVIs). The specific research questions include the following: What correlations exist between the colors of street buildings and children’s mentalization of emotions? How does the color indicator system affect children’s mentalization of emotions? How can the forward derivation and reverse application of the color data model be implemented?
Forward derivation refers to the proactive analysis and comparison of planned color schemes, using a color data model to assess children’s mentalization of emotional responses to various color indicators, in order to identify the most child-friendly color planning and design scheme. Reverse derivation is goal-oriented, involving the targeted manipulation of the color indicators in primary school urban blocks based on the correlations between color and children’s mentalization of emotions, as well as the relationships between color and campus environmental elements. This approach allows for the adjustment of these indicators to influence children’s mentalization of emotional expressions, applying the results of the color data model. Addressing these issues will provide a scientific basis for urban planning and architectural design and promote the healthy development of children’s mental well-being.
1.2. Literature Review
1.2.1. Mentalizing Emotions
The theory of mentalizing was introduced by British psychologist Peter Fonagy and his colleagues [16]. The ability to mentalize refers to an individual’s capacity to understand their own and others’ emotions and to apply these cognitive abilities in social interactions. The mentalization of emotions helps researchers assess an individual’s level of emotional–social development by evaluating their competence in these areas.
Peter Fonagy and his colleagues demonstrated that mentalization encompasses the cognitive and affective capabilities required to comprehend one’s own thoughts and feelings as well as those of others [17]. Their study indicated that the development and improvement of mentalizing abilities can significantly enhance the mental health of individuals [18,19]. Research by Emmons and Colvin [20] found that social support can enhance the mental health of individuals. They conc luded that social support enables individuals to regulate their emotions in the face of stress, thereby reducing the risk of mental illness. This viewpoint aligns with the assessment goal of the Mentalizing Affective Scale, which is to enhance an individual’s ability to regulate their emotions and gain social support by improving their mentalizing abilities.
Jurist’s [21] study further confirmed the value of the Mentalized Affective Scale’s application in the field of mental health. His study concluded that the mentalization of emotions refers to the ability to understand one’s own and others’ emotions across both cognitive and affective domains, and he introduced a new perspective on emotion regulation called the mentalized affectivity (MA) theory, which encompasses three dimensions: emotion recognition, emotion processing, and emotion expression. Based on the above theoretical model, Greenberg et al. [22] developed the Mentalized Affectivity Scale (MAS), which can be used in psychology, psychiatry, and neuroscience for both clinical and non-clinical settings, thereby advancing theory and research on emotion regulation. In recent years, psychiatrists have applied the MAS to adolescent counseling, and Jurist suggested that there may be cross-cultural differences in the mentalization of emotions.
In conclusion, the mentalization of emotions is an important assessment tool for understanding individuals’ mentalization and social interaction abilities, and its theoretical basis, development process, scoring method, and application areas have been widely explored across various fields of research. The MA framework analyzes and describes the mentalization of emotions primarily in three dimensions: emotion recognition, emotion processing, and emotion expression. This study utilized the Difficulties in Emotion Regulation Scale (DERS), the Emotion Regulation Questionnaire (ERQ), the Affective Style Questionnaire (ASQ), the Flexible Regulation of Expressing Emotions Scale (FREE), and the Emotional Intelligence Scale (EIS). The nine-level scoring system of the SAM (Self-Assessment Manikin) questionnaire was simplified to create a condensed version of the emotional scale [23]. Using data from elementary school urban blocks, the study identified three indicators of children’s mentalization of emotions: arousal, dominance, and pleasure.
The first aspect is identifying emotions. In its most basic form, it involves labeling emotions and gaining a deeper understanding of emotions within the context of a person’s history by exploring their underlying meaning (e.g., why do I feel this way?). The second area is dealing with emotions. Processing involves modulating or regulating emotions, which entails altering emotions, such as modifying their duration or intensity. The third aspect is expressing emotions. Expression encompasses a range of thoughts and emotions communicated outwardly by an individual. An individual’s past experience affects all aspects of emotional regulation, from recognition and processing to expression [21]. In addition, these three aspects are intimately connected to individual emotional subjective consciousness; recognition represents the emergence of emotional subjective consciousness, processing is the realization of emotional subjective consciousness, and expression reflects the outcome or manifestation of emotional subjective consciousness.
1.2.2. Multi-Source Data
From the perspective of studying color based on multi-source data, there has been a decline in studies that apply multi-source data and computer image technology as research methods in the field of color, where most data sources are derived from street view data, and color identification relies primarily on machine recognition technology. Teng Zhong et al. (2021) [15] attempted to establish an automated quantitative assessment method based on deep learning to identify the colors of urban façades. Jiaxin Zhang et al. (2021) developed a method to quantitatively classify building colors using the semantic segmentation of streetscapes, and approximately quantified the colors of residential, public, and commercial buildings by following a technical route that included image color calibration, building façade segmentation, and dominant color computation [24]. Meichen Ding also utilized convolutional neural network technology and streetscape images, following a more comprehensive technical route that included data acquisition, image processing, primary color extraction, color feature quantification, and urban comparative analysis to explore the color characteristics of buildings under cultural influence [25]. Yu et al. [26] analyzed the color composition of tourism-related images and examined the influence of three major color attributes on the popularity of posts. Zhang Y. Y. et al. [27] found that tourists tend to have more positive transient emotional experiences. Barnes et al. [28] used a machine learning approach to study the effects of color combinations in the accommodation environment on tourists’ spending intentions.
In the field of the psychological impact of urban color schemes on users, we find that while there is a significant amount of literature on urban color, there is relatively little research on the color of primary school buildings and its emotional impact. In 2010, a British scholar was the first to simulate a three-dimensional virtual world and learning environment to investigate user satisfaction with the color of learning spaces, initiating the design of digital educational facilities based on the psychology and emotions of the test subjects. The subjects expressed a sense of identity with learning environments featuring cool and neutral colors [29]. Japan also launched a nationwide color planning initiative, with color research across various regions documented in detail in Environmental Color Design Techniques [30], where the psychological perception of color correlation is a commonly employed research method. An Indian scholar’s book documented the color preferences of ethnic communities in the inland valleys of the western Himalayas, combining semi-structured interviews to evaluate these preferences [31]. It can be observed that previous studies mainly focused on city-wide color schemes, architectural color, and color preferences, but paid limited attention to the impact of specific architectural colors on the mental health of users. Particularly from the perspective of children, there has been no precedent for exploring the influence of color in neighborhoods near urban primary schools on children’s mentalization of emotions.
Previous studies have demonstrated the potential for color quantification and analysis using streetscape images [4,32], computer imaging techniques [33], and machine learning algorithms [34,35]. This study specifically focuses on the effects of color on children’s mentalization of emotions in elementary school urban neighborhoods. Unlike previous studies that primarily focus on overall city colors or architectural colors, this study specifically examines the mechanisms through which color influences children’s mentalization of emotions, thereby addressing a gap in this field. This paper focuses on constructing a color data model and offering practical design recommendations, providing urban planners, architects, and color scholars with comprehensive models and methods to optimize the color environments of elementary school urban neighborhoods and support children’s psychologically healthy growth.
2. Materials and Methods
2.1. Research Framework
The study is divided into three parts (Figure 1): (1) Multi-source data collection, which includes road network data from Open Street Map (OSM), statistical yearbook data, Point of Interest (POI) data, elementary school mentalization of emotion questionnaire platform data, and Baidu Street View image (BVI) data. (2) The establishment of the color data model, which involves street view collection and processing, developing the color index system, and optimizing the color data model training. The second part includes analyzing transportation accessibility using the OSM road network data, crowd heat maps generated from the statistical yearbook data, and resource intensity maps derived from the POI data, which serve as indicators of perceived thermodynamic properties. These factors constitute the mentalized emotional thermal property model. The emotional perception comparison results from the mentalized emotional platform are converted into emotional perception data via the hierarchical Bayesian model. Additionally, color data extraction is performed using the BVIs to construct the color indicator system. Finally, the four data models are linked to establish the color data model. (3) The acquisition of the color environment data for a comprehensive mentalized emotional assessment of children. The third part involves quantitative analysis and results presentation in three areas: color thermal attribute perception frequency, color mentalized emotion assessment, and color environment. (4) Finally, the results are subjected to quantitative analysis and discussion.
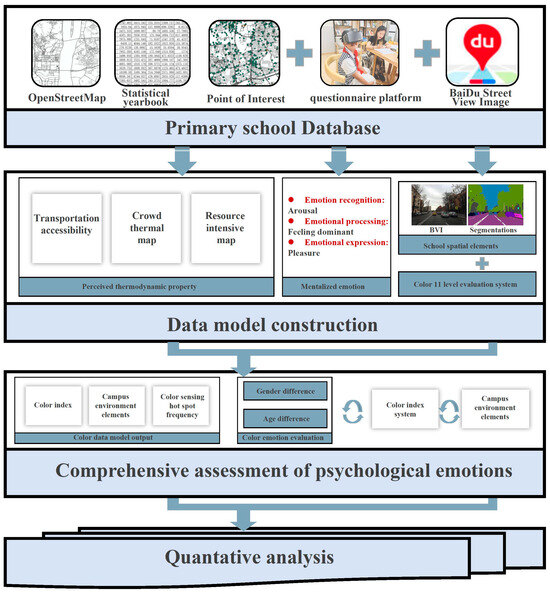
Figure 1.
Research framework.
2.2. Research Area and Data
2.2.1. Study Area
This study was conducted in Changsha, Hunan Province, China. Changsha is one of the first cities in China to adopt the goal of “creating a child-friendly city” and was selected as a key case study to utilize multi-source data to assess the colors of the elementary school neighborhoods and the children’s mentalization of emotions. This approach aims to inform the future planning and design of elementary school neighborhoods in the city. Changsha ranks 15th in the country by population with 381 elementary schools in the urban area, 17 of which are located in the study area. The study area was selected as the most concentrated region of elementary schools in central Changsha (Figure 2), comprising six school districts, including the Dongmao Street Primary School District, and 58 streets, such as Duzheng Street, South Gate, Herong Sports Center, and Xiangjiang River Scenic Belt. Dongmao Street Elementary School within the study area was selected as the sample site for the virtual simulation experiment.
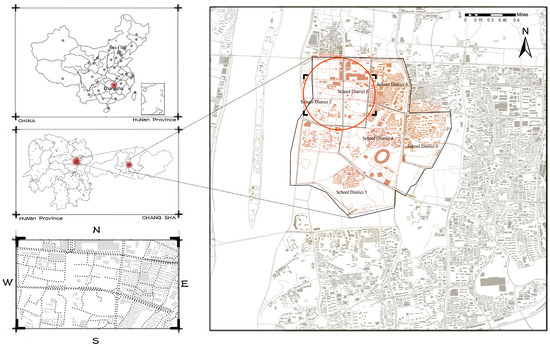
Figure 2.
Research area.
2.2.2. Research Data
- (1)
- Traffic Accessibility Calculation Using OSM Road Network Data
Obtain the road network data for the target area from OSM (https://www.openstreetmap.org/, accessed on 20 March 2024), followed by data preprocessing, including coordinate conversion, road screening, and merging. Construct the traffic network dataset, set the road access costs, calculate the shortest path and its cost using the OD cost matrix, generate a spatial distribution map of traffic accessibility through visual representation, and calculate the road accessibility in the study area. This process provides the foundation for the subsequent calculation of the perceived thermal attribute frequency.
- (2)
- Crowd Heat Calculation Using Statistical Yearbook Data
The population and economic activity data from the statistical yearbook are integrated and analyzed to estimate the crowd activity density in the study area. This part extracts data on the population numbers, population density, and economic activity intensity from the statistical records of Changsha City, and calculates the crowd activity heat distribution by combining the study area dimensions, building layouts, and other environmental factors.
- (3)
- Resource Calculation Using POI Data
Integrate the POI data to analyze the spatial aggregation patterns of the urban elements and perform the resource calculations. Given the varying proportions and importance of the different POI elements in the city, the spatial distribution patterns of five types of elements are weighted and superimposed. Kernel density and hot spot analyses are applied to explore the spatial aggregation patterns and characteristics of the urban elements, thus measuring the resources in the study area.
- (4)
- Primary School Mentalized Emotional Questionnaire Platform Using Hierarchical Bayesian Modeling
Unlike previous online questionnaire methods, this experiment uses virtual simulation to enable elementary school students to experience environments using VR equipment (Chongqing iQiyi Intelligent Technology Co., Ltd., Chongqing, China) and to assess the mentalization of emotional experiences in typical elementary school neighborhoods. The construction of the mentalized emotion questionnaire platform comprises two components: basic information and mentalized emotion questionnaire collection (Figure 3). The basic information encompasses gender, age, and grade level. The emotion perception comparison results from the mentalized emotion platform are converted into emotion perception data through hierarchical Bayesian modeling. The mentalized emotion questionnaire was designed to assess three dimensions: emotion recognition, emotion processing, and emotion expression. To ensure comprehension by the elementary school students, the mentalization of emotions was described using simple language. At the emotion recognition level, arousal was described as making one feel calmer, more relaxed, comfortable, or sleepy; at the emotion processing level, dominance was summarized as agitation, drastic mood changes, and emotional responsiveness to the environment; and at the emotion expression level, pleasantness was described as anticipation, pleasure, liking, and happiness. To enhance the accuracy, comparative questions were used in the rubric, such as “Which of the following two pictures contains colors that make you feel more excited, cause more dramatic mood changes, or evoke stronger emotional responses to the environment?”. The questionnaire collected 1596 comparisons from 76 elementary school students in grades 1–6 across the three dimensions of emotion recognition, emotion processing, and emotion expression, with 51.32% (Thirty-nine people) being boys and 48.68% (Thirty-seven people) being girls. Since most elementary school children in Changsha City are permanent residents, the study focused on students who have lived in the city for more than six months.
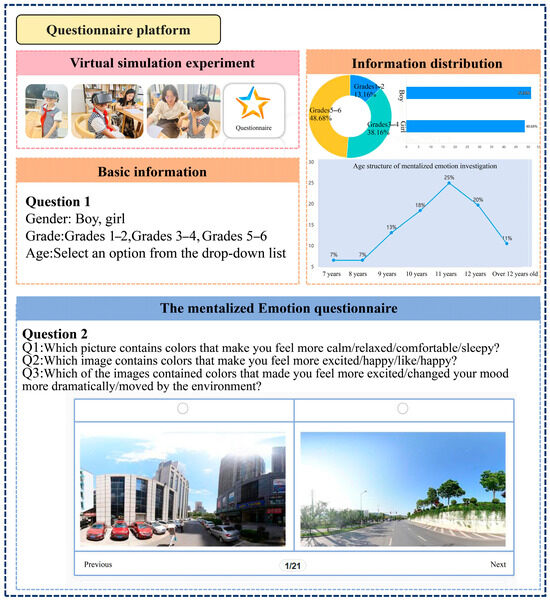
Figure 3.
Construction of questionnaire platform for mentalization of emotions.
3. Color Data Model Establishment
3.1. Street Image Acquisition and Processing Model
In this paper, we obtained BVIs of the elementary school urban blocks, which were used for acquiring the tertiary color indicators, extracting the campus environment elements, and serving as the dataset for the mentalized emotion platform. The BVI acquisition involved the following steps: First, we segmented the road network and extracted the sampling points, setting a sampling distance of 20 m to generate equally spaced points on the network. Next, we converted the coordinates of these points from the WGS84 coordinate system to the Baidu coordinate system and used them as parameters to extract BVI panoramas though the Baidu Map API. Street view images were then acquired using Baidu’s panorama API by instantiating the function with the coordinates of the sampling points. A total of 497,088 images were acquired from 4812 sampling points, and 15,534 panoramic images were processed. The BVI panoramas were set to a resolution of 1024 × 512 pixels with a 360° field of view (FOV). Since BVIs vary with the lighting conditions, including the light quality, sunlight, and atmospheric effects, color correction was performed using the automatic white balance (AWB) method [36]. The AWB method is widely used for its ability to automatically estimate illuminance and correct image color. It employs various algorithms, including white patch, gray world, iterative white balance, light source voting, and color correlation algorithms, tailored to different scenarios [37]. Additionally, the Automatic Exposure Correction (AEC) method was applied to adjust overexposed and underexposed street images [38]. Figure 4 illustrates the comparison between images before and after color correction.
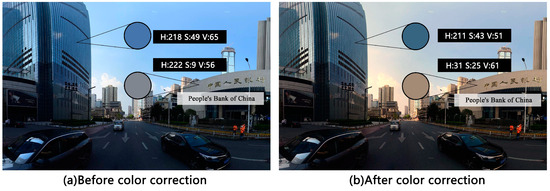
Figure 4.
Comparison of BVI color correction.
DeepLab V3+ was employed to automatically extract and quantify environmental elements from the BVIs of elementary school urban neighborhoods [7]. DeepLab is a series of open-source semantic image segmentation models based on TensorFlow’s Convolutional Neural Networks (CNNs), designed for pixel-level image classification [39]. The Cityscapes dataset is a benchmark suite and large-scale dataset used for understanding semantic urban scenes, including complex street scenes from 50 different cities [40]. DeepLab V3+ models trained on the Cityscapes dataset have demonstrated high reliability in semantic image segmentation applications [41,42]. This study utilized the Cityscapes dataset to train semantic image segmentation models for building façade extraction.
Figure 5 illustrates the process of extracting building façades from the BVI panoramas of elementary school urban neighborhoods. The semantic segmentation model divided the image into 19 segments, ultimately focusing on the seven most significant parts based on their percentage: “ground”, “road”, “building”, “variable signs”, “school greenery”, “sky”, and “rider”. Elements with smaller percentages were excluded from the analysis. The building façade images of elementary school urban blocks were then extracted by cropping the streetscape images according to the segmented façade boundaries. To enhance the extraction results, a closure and erosion algorithm was applied to refine the building edges by removing the fragmented regions [43].
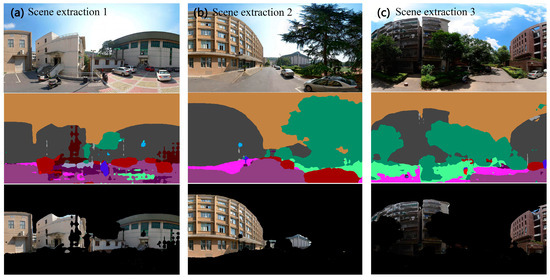
Figure 5.
Semantic segmentation of BVIs for extracting building façades in elementary school city blocks.
3.2. Color Index System
According to the hue quantification method of Tian Yumin [44], the HSB color model for non-uniform color hue H is divided into sixteen copies, the S saturation and V luminance for the non-uniform color is divided into four copies, and r (the pixel area share) is calculated for each copy.
In studies related to color index systems, Wang Zhanzhu et al. explored the relationship between color elements, visual perception, and subjective comfort, examining the correlations between individual and multiple elements from a multi-dimensional perspective [45]. Zhai Yujia and colleagues analyzed the relationship between façade color distribution, color harmony, and color diversity across three dimensions [46]. Yang Shuang and colleagues developed a more comprehensive color evaluation system encompassing three dimensions: color richness, visual impact, and color expression. Based on analysis and comparison, this study adopts the color element quantification method proposed by Yang Shuang et al. [47,48,49] and establishes a color index system for primary school campus buildings using the dimensions of color richness, visual impact, and color expression (Table 1). Color richness (B1) is described by the number of colors (C1), the proportion of primary colors (C2), and the type of color palette (C3). Visual impact (B2) is defined by hue contrast (C4), saturation contrast (C5), and luminance contrast (C6). Color performance (B3) is characterized by the hue index (C7), saturation index (C8), luminance index (C9), and color warmth and coldness (C10). Collectively, B1, B2, and B3 are employed to describe the color of elementary school urban neighborhoods.

Table 1.
Three-level indexes and calculation method of elementary school urban neighborhood colors.
3.3. Color Data Model Training and Optimization
The Lasso regression model (Least Absolute Shrinkage and Selection Operator) was utilized for training and predicting the children’s mentalization of emotions. Lasso regression extends linear regression by incorporating a penalty term into the loss function to impose constraints and perform coefficient selection. This approach is particularly suitable for high-dimensional datasets, as it effectively reduces model complexity through variable selection and regularization, thereby enhancing the prediction accuracy and interpretability. In this study, Lasso regression (Table 2) was selected based on a comparative analysis of model fitting performances. It was employed to analyze color-related mentalization of emotions by examining the perceived frequency of color thermal attributes, environmental elements, and color metrics in elementary school urban neighborhoods, with the goal of predicting the children’s mentalization of emotions. Seventy percent of the data was allocated for training the Lasso regression model, while the remaining thirty percent was reserved for testing and validating the model.
Table 2.
Fitting effect of Lasso regression model.
4. Results and Discussion
4.1. Color Data Model Results
4.1.1. Color Indicator Analysis
Figure 6 illustrates the hot spot analysis of the color indicator system for the elementary school city block, highlighting the extreme value aggregation areas of the ten color indicators within the study area. Figure 6 shows eight color indicators where the impact on the children’s mentalization of emotions is greater than or equal to 10%, accompanied by a hot and cold spot analysis. Cold spots indicate clusters of low-value color indicators, while hot spots indicate clusters of high-value color indicators. Building on this analysis, the study explores the relationship between the color indicators and the extreme value aggregation areas of mentalized emotions in the elementary school urban blocks. Overall, the three color indicators—main color ratio (C2), saturation contrast (C5), and saturation index (C8)—exhibit more hot spots within the study area, indicating that this core region of Changsha displays richer saturation variations and a stronger thematic presence.
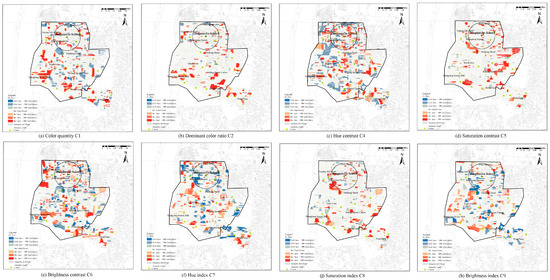
Figure 6.
Hot spot analysis of color indexes with influence greater than or equal to 10% on mentalized emotional utility.
In the 300 m campus circle of Dongmaojie Primary School, the brightness index (C9) and hue index (C7) exhibit a significant cold spot distribution, indicating that the brightness and color expression of the school and surrounding urban blocks remain relatively stable. This is in line with the “Changsha City Color Planning and Management Research” benchmark for the color control of educational and cultural buildings, which aligns with the warm and restrained color theme emphasized in the benchmark. The primary block leading to the commercial area east of the elementary school shows a concentrated hot spot for hue contrast (C4), while the area near the residential zone to the south and west exhibits a concentrated cold spot for hue index (C7). Additionally, the hue expression level intensifies from the southwest to the north, reflecting the functional requirements of the elementary school’s city block color.
4.1.2. Analysis of Environmental Elements
The identified environmental elements of the six primary school urban blocks include “ground”, “road”, “building”, “various signs”, “school greenery”, “sky”, and “rider”. The hot spot analysis of the environmental elements in the urban blocks of primary schools (Figure 7) reveals that the distribution ratio of environmental elements varies across different coordinates. Cold spots indicate that the proportion of a particular environmental element in a region is at a low threshold, while hot spots indicate that the proportion is at a high threshold. Changes in the terrain elevation affect the proportions of sky and ground. The construction of the road facilities is more regular and orderly, leading to a localized hot spot distribution of roads in the 3D images of the elementary school urban neighborhoods. Building façades are more densely distributed in the northwest and less so in the southeast, while campus greenery is concentrated in the southwest as a hot spot and in the southeast as a cold spot.
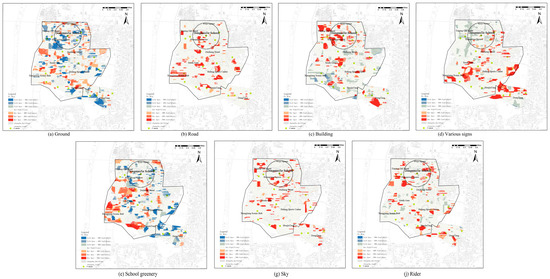
Figure 7.
Hot spot analysis of environmental elements in elementary school urban neighborhoods.
Pedestrians and various signs illustrate the human cultural distribution. Various signs create a significant hot spot at the junction of Houjiatang and Dongtang, as well as in the Xiangjiang River landscape zone. Meanwhile, riders form localized hot spots around Dongmaojie Elementary School, Fengying Xili neighborhood, and Huangxing Square.
4.1.3. Color Perception Hot Spot Frequency Analysis
An analysis of road network accessibility is conducted, and a population distribution heat map is generated using statistical yearbook data. The POI distribution within the elementary school city block is examined for resource integration (Figure 8). The analysis reveals that the color perception hot spots in the elementary school urban blocks are primarily concentrated in the northwest periphery of a 300 m radius around Dongmao Street Primary School. The hot spot centers include Taiping Old Street, Wuyi Square, and Huangxing Square, with hot spots extending in all directions. The southern study area exhibits a lower frequency of perceived hot spots, while the Houjiatang and Xiangjiang River landscape zones demonstrate strong road accessibility.
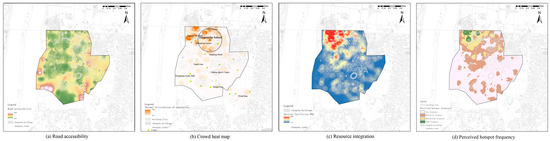
Figure 8.
Frequency of color perception hot spots in elementary school urban blocks.
Following Hu, K’s [50] neighborhood division method, the neighborhoods are categorized based on perceived frequency into high frequency, medium-high frequency, medium-low frequency, and low frequency. High frequency streets are defined as those in the top 25% for both population heat and resource integration, and are ranked highest in accessibility. Low frequency streets are in the bottom 25% for both metrics and have lower accessibility. Medium-high frequency streets fall within the top 50% for population density and resource integration, exhibiting middle or higher levels of accessibility. The remaining neighborhoods are categorized as medium-low frequency areas.
Therefore, through the road accessibility analysis (Figure 8a), population heat analysis (Figure 8b), and resource integration analysis (Figure 8c), and according to the block division mode, a total perceived hot spot frequency graph (Figure 8d) is synthesized, with the perceived frequency divided into four categories: high, medium-high, medium-low, and low frequency. The perceived frequency represents the intensity of the elementary school city block being sensed. Thus, greater attention should be given to the color perception of the districts with higher perceived frequency, while the areas with lower perceived frequency require less priority in color perception.
Assessing the street perceived frequency aids in determining the color perception priorities for the elementary school urban blocks, offering valuable insights for urban renewal and block design. Ultimately, the analysis of the color index for these urban blocks informs proposals for color renovation and renewal.
4.2. Mentalized Emotional Assessment Results
4.2.1. Analysis of Hot Spots in Mentalized Emotions Assessment
Environmental psychology states that the physical properties of the environment, including color, can significantly affect mood and behavior. From a child development perspective, the relationship between color and emotion is particularly important in the urban elementary school neighborhood environment, as children’s emotions and cognitions are highly sensitive to external stimuli. The color data model was employed to predict children’s mentalization of emotions within the study area, with arousal, dominance, and pleasure visually represented (Figure 9). The analysis revealed that arousal and dominance within a 300 m radius around Dongmao Street Elementary School exhibited a fragmented distribution of cold spots, with very few hot spots. Pleasure, on the other hand, showed an equal distribution of hot and cold spots. The trend of cold spots gathering in the west and hot spots gathering in the east is observed overall. The scattered distribution of arousal and the scarcity of hot spots suggest a mix of color stimuli that fail to consistently promote positive arousal, potentially being suppressed by other environmental factors. Similarly, the scattered cold spot distribution of dominance suggests that the elementary school children’s perceptions of dominance and control are suppressed. This phenomenon highlights a lack of coherence in the color design of the urban blocks in the primary schools and a mismatch between the urban design features and color schemes, resulting in differences in the sense of mastery or control of space.
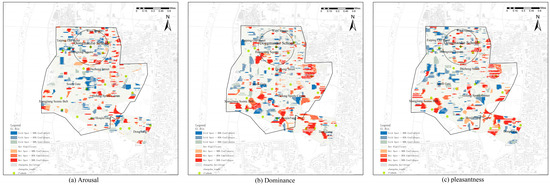
Figure 9.
Analysis of hot spots in mentalized emotions assessment.
In this region, by contrast, the distribution of pleasure is more balanced between hot and cold spots. From an environmental psychology perspective, pleasure is influenced by an overall sense of satisfaction or comfort, which can be more evenly distributed when the environment offers a mix of stimulating and calming features. This is also consistent with child development theory, which holds that children’s emotional well-being can be supported by providing a balanced mix of stimulating and quiet environments. Dominance and pleasantness displayed an approximate hot distribution in the areas outside the school neighborhoods, with slight variations observed among the 17 schools in the study area. This indicates that arousal operates differently from dominance and pleasantness regarding the influence of environmental color on the children’s mentalization of emotions, leading to a more fragmented distribution of hot and cold spots. The relative consistency of dominance and pleasantness indicates that the mentalization of emotions is closely linked to the consistency and balance of the overall urban aesthetics. The spatial patterns of arousal, dominance, and pleasure suggest that dominance and pleasure are influenced by broader, more holistic environmental characteristics, while arousal operates on a more direct and immediate scale.
4.2.2. Emotional Color Utility by Gender
For children of different genders, various color indices impacted and were utilized differently across the mentalized affective dimensions (Figure 10). The influence utility (%) of the 10 color indicators is represented on the horizontal axis, while gender is represented on the vertical axis. Each color bar represents a different color indicator (C1–C10), distinguished by the data labels. The brightness index (C9) and dominant color ratio (C2) play a more prominent role in the girls’ arousal, which can be explained by their innate perceptual tendencies, physiological conditions, early cognitive development, heightened sensitivity to detailed visual cues, and tendency to develop advanced color discrimination skills earlier than boys. From a child development perspective, girls tend to exhibit greater emotional regulation and sensitivity to environmental aesthetics, which magnifies their emotional responses to specific color attributes. For the arousal of the boys, color richness (B1), impact (B2), and color expression (B3) exert similar average effects. This suggests that the color indicators influencing arousal in boys are more complex, indicating that boys are influenced by more diverse and bold visual environments. This can be explained by the diverse play behaviors and environmental interactions that boys have been encouraged to engage in.
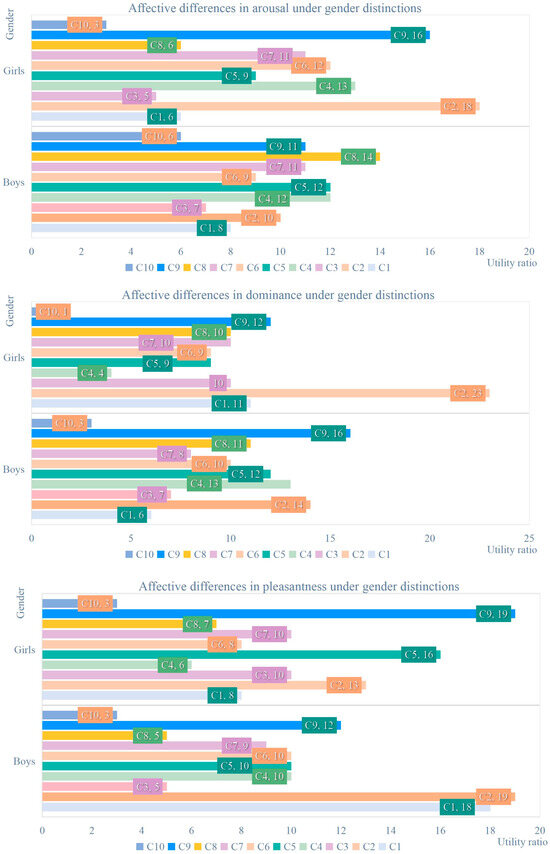
Figure 10.
Color utility of mentalization of emotions by gender.
Regarding dominance, the primary color ratio (C2) was more significant for girls, whereas boys showed a greater preference for the luminance index (C9). The boys also exhibited more consistent effects across the color index criteria. This suggests that girls are generally more sensitive to visual details and gain a sense of control or mastery from environments with clear and defined color schemes. The presence of dominant colors can create a sense of order and clarity that resonates with their sense of control over the color environment. At the same time, the results reflect that boys’ emotional response to color is not driven by specific color indicators, but rather spread across multiple indicators, with various color characteristics collectively contributing to a more holistic sense of dominance.
In terms of pleasantness, the brightness index (C9) and saturation contrast (C5) were significant. This suggests that brightness contributes to the overall clarity and positivity of the environment, which can promote a sustained sense of well-being in both boys and girls. For the boys, while C9 and C5 were similarly average compared to the other factors, the number of colors (C1) and the main color ratio (C2) were notably influential. This indicates that the color richness (B1) significantly affects boys’ pleasantness. A rich and varied spatial environment makes boys more responsive to mental satisfaction, which leads to a stronger sense of pleasure. This is consistent with research in environmental psychology and child development, showing that boys generally thrive in environments that provide a range of sensory inputs. The presence of multiple colors and visual contrasts may contribute to feelings of excitement and satisfaction, which in turn enhances boys’ sense of pleasure within a given space.
Interestingly, the warm and cold color index (C10) had no significant influence on the mentalization of either the boys or the girls. This may be due to the fact that color warmth, while traditionally associated with children’s emotional states, may dilute emotional responses when other color indicators co-determine children’s mentalization of emotions. Additionally, the local origin of the surveyed participants may mean that geographical conditions set a basic emotional tone, rendering the contrast between warm and cold colors (C10) less impactful on their psychological emotions.
4.2.3. Emotional Color Utility by Age
Different color indicators affect the mentalization of emotions of elementary school children by shaping their overall perception of the environment. The age of primary school children (7–12 years old) is divided into three groups: 7–8 years old, 9–10 years old, and 11–12 years old, represented on the horizontal axis. The influence utility (%) of the 10 color indicators is represented on the vertical axis, with each color bar representing a different color indicator (C1–C10). The study indicates (Figure 11) that the saturation contrast (C5) and luminance index (C9) are closely associated with arousal in 9–10-year-old elementary school children. This relationship arises because colors exhibiting a high saturation contrast and vivid luminance can stimulate the visual receptors of 9–10-year-old children, thereby capturing their attention and heightening arousal. From a child development perspective, for 9–10 year olds, who are developing both cognitively and emotionally, vivid, dynamic colors are more likely to trigger their sensory perception. The visual impact of high saturation contrast and a high brightness index aligns with their heightened responsiveness to environmental stimuli, which in turn increases their arousal.
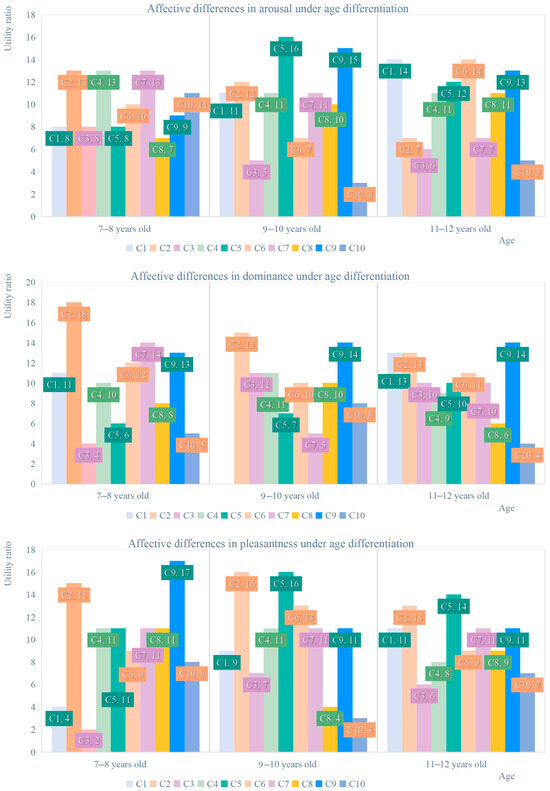
Figure 11.
Color utility of mentalization of emotions by age.
Conversely, saturation contrast (C5) does not significantly affect the dominance of 7–10-year-old elementary school children. The primary color ratio (C2), hue index (C7), and luminance index (C9) have a more significant impact on the dominance experienced by elementary school children. Research suggests that children experience a greater sense of control and dominance in an environment with a well-defined color scheme. In structured environments, these color indicators can help 7–10 year olds become more responsive to basic stimuli, navigate their space, and develop a sense of dominance and mastery, as children tend to seek environments that allow them to predict patterns and establish control over their surroundings.
In contrast to dominance, visual impact (B2) significantly influences the pleasantness experienced by 9–10-year-old elementary school children. As children’s cognitive abilities develop and become more complex, primary school children begin to appreciate not only bright, clear, and striking colors, but also the overall aesthetic and visual impact of urban spaces. The children’s strong pleasure derived from the color environment of the high visual impact elementary school blocks indicates that they appreciate not only the clear and rich colors but also the thoughtful design, which emphasizes visual diversity and impact.
4.3. Color Perception Characteristics of Urban Neighborhoods in Elementary Schools
4.3.1. Color Relevance to School Environment Elements
Pearson correlation analysis was employed to examine the relationships between the ten indicators in the three-level color indicator system and the seven most significant elements of the campus environment (Table 3), and to further explore the relationship between the color attributes of the elementary school urban neighborhoods and these environmental elements. The results elucidate the relationships between color indicators and campus environment elements, providing valuable insights for urban planners, color scholars, and social administrators into the interplay between campus environment features and color attributes. The findings indicate that building façades exhibit a significant positive correlation with hue contrast (C4) and lightness contrast (C6). Both roads and building façades show a significant negative correlation with hue index (C7). Various signs are significantly positively correlated with lightness contrast (C6) and saturation index (C8), and significantly negatively correlated with hue index (C7). School greenery displays a significant negative correlation with color tonal type (C3), hue contrast (C4), and brightness contrast (C6), while showing a significant positive correlation with hue index (C7) and brightness index (C9). According to the correlation table, researchers can identify the environmental elements in the primary school urban blocks most strongly correlated with the color indicators requiring adjustment and make the appropriate modifications in architectural design and planning. This approach aims to balance the arousal, dominance, and pleasure levels of children’s mentalization of emotions by adjusting the color indicators at all levels.
Table 3.
Pearson correlation between color indexes and campus environment elements.
4.3.2. Color and Children’s Mentalized Emotional Correlations
Pearson correlation analysis was employed to examine the relationship between color indicators and children’s mentalization of emotions (Table 4). The results indicate that arousal is significantly positively correlated with color saturation contrast (C5), hue index (C7), saturation index (C8), and brightness index (C9), while showing a significant negative correlation with hue contrast (C4). These color features enhance visual stimulation, which can foster positive arousal in children and increase their emotional engagement with their surroundings. Less tonal variation supports a more focused arousal level. On the contrary, dominance is significantly correlated with saturation index (C8), color tonal type (C3), and color warmth and coldness (C10). This suggests that pure, tone-harmonious, and warm environments provide children with a stable sense of security and a sense of mastery and control over their surroundings, positively contributing to their cognitive and emotional development. Pleasure levels were highly correlated with the saturation index, suggesting that environments with well-managed saturation levels create more emotionally satisfying and enjoyable experiences for children. The results are consistent with previous studies showing that moderate saturation helps create a pleasant atmosphere for elementary school children. Additionally, arousal shows a strong correlation with color visual impact and color performance, reinforcing the idea that vivid and influential color design can stimulate children’s emotional excitement and engagement. This also confirms the previously mentioned observation that the overall use of color in the study area is conservative, resulting in a more fragmented distribution of cold spots for arousal. This suggests that richer, more vibrant color schemes help create positive environments conducive to arousal emotions in children.
Table 4.
Pearson correlations between color indicators and children’s mentalization of emotions.
Urban planners and colorists can utilize Table 3 as a reference for controlling the specific color indicators in elementary school urban neighborhoods, regulating children’s emotional expression by adjusting the color indicators (Table 4), and enhancing positive emotional expression. Enhancing the sense of dominance, pleasure, and appropriate arousal can mitigate the effects of changes in the color indicators and the color atmosphere in school blocks on elementary school children’s mental emotions. Such an environment can promote children’s emotional well-being and support their cognitive and social development. Table 3 and Table 4 can be used as practical tools for controlling the color variables in urban design, to better regulate children’s mentalization of emotional responses and promote their mental health development. By making smart adjustments to the colorful atmosphere of elementary school city blocks, city planners and designers can create healthier, more emotionally rich spaces for children.
4.4. Mentalized Emotional Experience Based on Perceived Hotspot Frequency and Color Indicators
4.4.1. Mental Emotional Experience Based on Perceived Hot Spot Frequency and Color Indicators
The analysis of the color perception hot spot frequency and mentalized emotions in elementary school urban neighborhoods offers valuable insights for urban color planning and architectural design, specifically regarding the mental health of elementary school children. This helps in identifying the areas that require priority in neighborhood renewal. Consequently, elementary school neighborhoods were classified based on the frequency of color perception hot spots and the intensity of mentalized emotions. The color perception hot spot frequencies were categorized into four groups: high frequency, medium-high frequency, medium-low frequency, and low frequency. The elementary school urban blocks were then classified based on the analysis of cold and hot spots across the three dimensions of mentalization of emotions, leading to classifications such as high scores of high frequency perception (HSHF), high scores of low frequency perception (HSLF), low scores of high frequency perception (LSHF), low scores of low frequency perception (LSLF), and other intermediate categories.
The HSHF areas, characterized by high scores in mentalized emotions and a high frequency of color perception hot spots, often serve as an exemplary model for design. HSHF areas score highly in all three dimensions of the mentalization of emotions, indicating their strong capacity to attract attention and engage interest. These areas benefit from effective color and spatial design, providing a positive emotional experience. Conversely, the HSLF areas exhibit low frequencies of perceived hot spots, but high scores in mentalized emotions. These areas have significant potential for development and can emerge as new focal points. LSHF neighborhoods exhibit a high frequency of perceived hot spots but lower scores in mentalized emotions, indicating significant urban design deficiencies that require urgent attention. LSLF neighborhoods, facing substantial challenges, require comprehensive renovation and upgrades, yet are considered lower priority.
Using the perceived hot spot frequency and mental emotions of the primary school city block, the cold and hot spots of perceived hot spot frequency (high frequency, medium-high frequency, medium-low frequency, and low frequency) and the three indicators of mental emotion (arousal, dominance, and pleasure) were superimposed and analyzed (Figure 12) to study the geographical distribution of each mental emotion based on the perceived frequency. The analysis revealed that the neighborhoods with high scores in mentalized emotions are often located near urban nodes, highlighting the importance of the mentalization of emotions in relation to these nodes. The HSLF areas exhibit significant levels of dominance and pleasantness, primarily located in Dongtang and Houjiatang, the eastern part of Duzhong Street, and around Huangxing Plaza. These areas are considered crucial nodes for future development. The Taiping Old Street area, a representative of LSHF, suggests that the old city with narrow streets requires color updates to improve pleasantness and arousal.
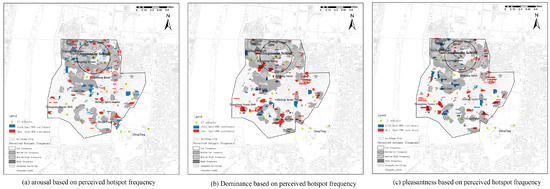
Figure 12.
Mentalization of emotion based on color perception hot spot frequency.
4.4.2. Application of Mentalization of Emotions in Elementary School Urban Blocks Based on Color Index System and Campus Environment Elements
The color design for the elementary school urban neighborhoods is derived from the goal-oriented application of the color data model results. The LSHF area requires the most urgent attention, while the HSHF area is the most representative. Therefore, focus should be directed toward the mentalization of emotions in these two areas. Figure 12 illustrates that both areas should prioritize enhancing pleasantness and arousal. According to Table 4, these dimensions are primarily influenced by visual impact (B2: C4, C5) and color performance (B3: C7, C8, C9). Table 3 further indicates that the five color indicators in this system are influenced by various environmental elements. Urban planners and architects can modify the proportions of environmental elements to improve or diminish specific qualities. By adjusting color richness, expression, and impact, planners can regulate color indicators, thereby enhancing the mentalization of emotions of the elementary school urban blocks to a more satisfactory level.
Beyond goal-oriented color design, a primary application of the color data model involves deriving and comparing planning color schemes to identify the most child-friendly designs. The color data model developed in this study can be applied to data from various regions for design and research purposes. With a comprehensive color index system and integration with psychological theories, it offers valuable references for creating urban neighborhoods that support users’ mental health and facilitates the quantitative evaluation of color and design solutions.
5. Conclusions
The quantitative assessment and evaluation of color design solutions has been a focus and challenge in previous research [51]. However, there are few studies that utilize Baidu Street View images and deep learning for color research in elementary school urban neighborhoods, particularly those that establish a comprehensive system of color indicators. This study employs multi-source data to establish a color data model. Its innovation lies in incorporating not only the physical attributes of color, but also the children’s mentalization of emotions, school environment elements, and color perception frequency, thus offering a novel perspective for color planning.
The results reveal that various color indicators significantly affect the different dimensions of children’s mentalization of emotions. Specifically, the saturation contrast, luminance index, and hue index are closely associated with children’s arousal, dominance, and pleasure. Additionally, gender and age are significant factors influencing how color affects children’s mentalization of emotions. This underscores the importance of considering these variables in color design for children of different genders and ages.
The study found significant correlations between color and various campus environment elements, such as building façades, roads, and signs, with specific color indicators. Furthermore, the study categorized elementary school urban neighborhoods based on the color perception hot spot frequencies and mentalized emotions. It identified the priority areas for color updates, particularly the LSHF areas, which require urgent renovation and urban design attention. This enables urban planners to adjust the colors of specific environmental elements more precisely to enhance children’s mentalization of emotional expression.
However, the study has limitations. Quantifying the mentalization of emotions remains challenging. Although the study sought to convert emotional data into an analyzable form through a mentalized emotion platform for elementary schools using virtual simulation, it may not fully capture the true feelings of children regarding their colorful environments. Future research should further investigate the impact of urban color on children’s mentalization of emotions across various cultural, social, and geographical contexts. Additionally, there is a need to refine the color data model and expand its application to a broader spectrum of urban planning and design practices.
Author Contributions
Conceptualization, Q.H. and R.Z.; methodology, R.Z.; software, Z.P.; validation, R.Z., Z.P. and X.Z.; formal analysis, X.Z.; investigation, L.S.; resources, C.Y.; data curation, L.S.; writing—original draft preparation, Q.H.; writing—review and editing, R.Z.; visualization, Z.P.; supervision, C.Y.; project administration, Q.H.; funding acquisition, R.Z. All authors have read and agreed to the published version of the manuscript.
Funding
This research was funded by the Natural Science Foundation of Hunan Province of China, grant number 2024JJ3010, and by the Hunan Office of Philosophy and Social Science, grant number 23WTC03.
Data Availability Statement
Due to privacy reasons and data complexity, the data provided in this study can be obtained through email requests to corresponding author. Further enquiries can be directed to the corresponding author.
Conflicts of Interest
The authors declare no conflicts of interest.
References
- Shen, S.; Yao, Y.; Li, C. Quantitative study on landscape colors of plant communities in urban parks based on natural color system and M-S theory in Nanjing, China. Color Res. Appl. 2022, 47, 152–163. [Google Scholar] [CrossRef]
- Xu, Z.; Zheng, X. Roadmap of moving urban colour toward cultural sustainability in China. Color Res. Appl. 2021, 46, 222–239. [Google Scholar] [CrossRef]
- Li, Y. Research on the Urban Architecture Color and Chromatography—A Proposal of Digital Environmental Color Taking Dandong City’s Building Color as an Example. Adv. Mater. Res. 2013, 671–674, 2245–2249. [Google Scholar] [CrossRef]
- Li, M.; Xu, J.G.; Zhang, X. Spatial-Sensitivity Analysis for Urban Color Planning: Study of Luoyang City, China. J. Urban Plan. Dev. 2017, 143, 05016014. [Google Scholar] [CrossRef]
- Yan, L.; Li, Q.; Zhang, Y.; Zhu, C. Computer vision quantization research on the architectural color of Avenida de Almeida Ribeiro in Macau based on the human eye perspective. Front. Comput. Neurosci. 2022, 16, 951718. [Google Scholar] [CrossRef]
- Badrinarayanan, V.; Kendall, A.; Cipolla, R. SegNet: A Deep Convolutional Encoder-Decoder Architecture for Image Segmentation. IEEE Trans. Pattern Anal. Mach. Intell. 2017, 39, 2481–2495. [Google Scholar] [CrossRef] [PubMed]
- Chen, L.C.; Papandreou, G.; Kokkinos, I.; Murphy, K.; Yuille, A.L. DeepLab: Semantic Image Segmentation with Deep Convolutional Nets, Atrous Convolution, and Fully Connected CRFs. IEEE Trans. Pattern Anal. Mach. Intell. 2018, 40, 834–848. [Google Scholar] [CrossRef] [PubMed]
- Liang, J.; Gong, J.; Sun, J.; Zhou, J.; Li, W.; Li, Y.; Liu, J.; Shen, S. Automatic sky view factor estimation from street view photographs-A big data approach. Remote Sens. 2017, 9, 411. [Google Scholar] [CrossRef]
- Cao, R.; Zhu, J.; Tu, W.; Li, Q.; Cao, J.; Liu, B.; Zhang, Q.; Qiu, G. Integrating Aerial and Street View Images for Urban Land Use Classification. Remote Sens. 2018, 10, 1553. [Google Scholar] [CrossRef]
- Krylov, V.A.; Kenny, E.; Dahyot, R. Automatic Discovery and Geotagging of Objects from Street View Imagery. Remote Sens. 2018, 10, 661. [Google Scholar] [CrossRef]
- Du, Y.; Huang, W. Evaluation of Street Space Quality Using Streetscape Data: Perspective from Recreational Physical Activity of the Elderly. ISPRS Int. J. Geo-Inf. 2022, 11, 241. [Google Scholar] [CrossRef]
- Starešinič, M.; Simončič, B.; Bračko, S. Using a Digital Camera to Identify Colors in Urban Environments. J. Imaging Sci. Technol. 2011, 55, 060201. [Google Scholar] [CrossRef]
- Nguyen, L.; Embrechts, J.J.; Teller, J. Colour in the city: A chromatic typology for the quantitative analysis of spatial coherence. Landsc. Res. 2020, 45, 44–62. [Google Scholar] [CrossRef]
- Zhong, T.; Ye, C.; Wang, Z.; Tang, G.; Zhang, W.; Ye, Y. City-Scale Mapping of Urban Façade Color Using Street-View Imagery. Remote Sens. 2021, 13, 1591. [Google Scholar] [CrossRef]
- Ibrahim, M.R.; Haworth, J.; Cheng, T. Understanding cities with machine eyes: Are view of deep computer vision in urban analytics. Cities 2020, 96, 102481. [Google Scholar] [CrossRef]
- Fonagy, P.; Gergely, G.; Jurist, E.L. (Eds.) Affect Regulation, Mentalization and the Development of the Self, 1st ed.; Routledge: Oxfordshire, UK, 2002. [Google Scholar] [CrossRef]
- Fonagy, P.; Campbell, C. Bad Blood Revisited: Attachment and Psychoanalysis. Br. J. Psychother. 2015, 31, 229–250. [Google Scholar] [CrossRef]
- Schwarzer, N.H.; Nolte, T.; Fonagy, P.; Gingelmaier, S. Mentalizing and Emotion Regulation: Evidence from a Nonclinical Sample. Int. Forum Psychoanal. 2021, 30, 34–45. [Google Scholar] [CrossRef]
- Batson, C.D.; Fultz, J.; Prisons, M. The Altruism Question: Toward a Social-Psychological Answer; Psychology Press: New York, NY, USA, 2007. [Google Scholar] [CrossRef]
- Emmons, R.A.; Colvin, C.R. Does social support improve physical health? A meta-analytic review. Psychol. Bull. 1995, 117, 410–425. [Google Scholar]
- Jurist, E.L. Mentalized affectivity. Psychoanal. Psychol. 2005, 22, 426. [Google Scholar] [CrossRef]
- Greenberg, D.M.; Kolasi, J.; Hegsted, C.P.; Berkowitz, Y.; Jurist, E.L. Mentalized affectivity: A new model and assessment of emotion regulation. PLoS ONE 2017, 12, e0185264. [Google Scholar] [CrossRef]
- Bradley, M.M.; Lang, P.J. Measuring Emotion: The Self-Assessment Manikin and the Semantic Differential. Behav. Res. Ther. 1994, 25, 49–59. [Google Scholar] [CrossRef]
- Zhang, J.; Fukuda, T.; Yabuki, N. Development of a City-Scale Approach for Facade Color Measurement with Building Functional Classification Using Deep Learning and Street View Images. ISPRS Int. J. Geo-Inf. 2021, 10, 551. [Google Scholar] [CrossRef]
- Ding, M.C. Quantitative contrast of urban agglomeration colors based on image clustering algorithm: Case study of the Xia-Zhang-Quan metropolitan area. Front. Archit. Res. 2021, 10, 692–700. [Google Scholar] [CrossRef]
- Yu, C.E.; Xie, S.Y.; Wen, J. Coloring the destination: The role of color psychology on Instagram. Tour. Manag. 2020, 80, 104110. [Google Scholar] [CrossRef]
- Zhang, Y.Y.; Wang, M.; Li, J.Y. Do greener urban streets provide better emotional experiences? An experimental study on Chinese tourists. Int. J. Environ. Res. Public Health 2022, 19, 16918. [Google Scholar] [CrossRef] [PubMed]
- Barnes, S. In living color? Understanding the importance of color complexity in listing images for accommodation sharing. Tour. Manag. 2022, 90, 104487. [Google Scholar] [CrossRef]
- Saleeb, N.; Dafoulas, G. Perception of Color in 3D Virtual World Architectural Computer-Aided Design: Impact of Color Design in Student Satisfaction. In Proceedings of the International Conference on Computer Engineering & Systems, Cairo, Egypt, 30 November–2 December 2010; IEEE: Piscataway, NJ, USA, 2010. [Google Scholar]
- Yoshida, S. Techniques of Environmental Color Design—Creating Street Block Colors; China Architecture & Building Press: Beijing, China, 2011. [Google Scholar]
- Joshi, N.C.; Rawat, G.S. Why Only Blue in the Traditional Architecture of Western Himalaya, India? Color Res. Appl. 2020, 45, 50–60. [Google Scholar] [CrossRef]
- Lu, Y. Using Google Street View to investigate the association between street greenery and physical activity. Landsc. Urban Plan. 2019, 191, 103435. [Google Scholar] [CrossRef]
- Li, X.; Ratti, C. Mapping the spatio-temporal distribution of solar radiation within street canyons of Bost on using Google Street View panoramas and building height model. Landsc. Urban Plan. 2019, 191, 103387. [Google Scholar] [CrossRef]
- Chen, L.; Lu, Y.; Sheng, Q.; Ye, Y.; Wang, R.; Liu, Y. Estimating pedestrian volume using Street View images: A large-scale validation test. Comput. Environ. Urban Syst. 2020, 81, 101481. [Google Scholar] [CrossRef]
- Ye, Y.; Richards, D.; Lu, Y.; Song, X.; Zhuang, Y.; Zeng, W.; Zhong, T. Measuring daily accessed street greenery: Ahuman-scale approach for informing better urban planning practices. Landsc. Urban Plan. 2018, 191, 103434. [Google Scholar] [CrossRef]
- Lam, E.Y.; Fung, G.S.; Lukac, R. Automatic white balancing in digital photography. In Single-Sensor Imaging; CRC Press: Boca Raton, FL, USA, 2018; pp. 287–314. [Google Scholar]
- Suny, A.H.; Mithila, N.H. A Shadow Detection and Removal from a Single Image Using LAB Color Space. Int. J. Comput. Sci. Issues. 2013, 10, 270. [Google Scholar] [CrossRef]
- Yuan, L.; Sun, J. Automatic exposure correction of consumer photographs. In Proceedings of the European Conference on Computer Vision, Florence, Italy, 7–13 October 2012; pp. 771–785. [Google Scholar]
- Barbierato, E.; Bernetti, I.; Capecchi, I.; Saragosa, C. Integrating remote sensing and street view images to quantify urban forest ecosystem services. Remote Sens. 2020, 12, 329. [Google Scholar] [CrossRef]
- Chen, L.C.; Zhu, Y.; Papandreou, G.; Schroff, F.; Adam, H. Encoder-Decoder with Atrous Separable Convolution for Semantic Image Segmentation. In Proceedings of the European Conference on Computer Vision (ECCV), Munich, Germany, 8–14 September 2018; pp. 801–808. [Google Scholar]
- Wang, Z.; Sun, H.; Li, J. Research on Architectural Color and Visual Comfort in Historic Landscape Areas. Buildings 2023, 13, 1004. [Google Scholar] [CrossRef]
- Labib, S.M.; Lindley, S.; Huck, J.J. Spatial dimensions of the influence of urban green-blue spaces on human health: A systematic review. Environ. Res. 2020, 180, 108869. [Google Scholar] [CrossRef] [PubMed]
- Gil, J.Y.; Kimmel, R. Efficient dilation, erosion, opening, and closing algorithms. IEEE Trans. Pattern Anal. Mach. Intell. 2002, 24, 1606–1617. [Google Scholar] [CrossRef]
- Yumin, T.; Gaoquan, L. Color image retrieval method based on color feature. J. Xi’an Univ. Electron. Sci. Technol. 2002, 29, 43–46. [Google Scholar] [CrossRef]
- Wang, Z.; Shen, M.; Huang, Y. Exploring the Impact of Facade Color Elements on Visual Comfort in Old Residential Buildings in Shanghai: Insights from Eye-Tracking Technology. Buildings 2024, 14, 1758. [Google Scholar] [CrossRef]
- Zhai, Y.; Gong, R.; Huo, J.; Fan, B. Building Façade Color Distribution, Color Harmony and Diversity in Relation to Street Functions: Using Street View Images and Deep Learning. ISPRS Int. J. Geo-Inf. 2023, 12, 224. [Google Scholar] [CrossRef]
- Yang, S.; Zhang, X.; Liu, Y.; Guo, N.; Li, Y. Landscape evaluation of plant community in Longzi Lake waterfront Park in Zhengzhou based on quantitative analysis of color elements. For. Investig. Plan. 2024, 49, 89–97+119. [Google Scholar]
- Song, Y. Introduction to a new method of decision analysis—Analytic Hierarchy Process. Hebei Coal. 1985, 4, 41–46. [Google Scholar]
- Ning, H.; Shao, F.; Sun, Q.; Shan, J. Plant landscape evaluation of Hangzhou Huagang Fish Park based on AHP method. J. Zhejiang Agric. 2011, 23, 717–724. [Google Scholar] [CrossRef]
- Hu, K.; Xu, Z.; Wang, X.; Wang, Y.; Li, H.; Zhang, Y. Research on Street Color Environment Perception Based on CEP-KASS Framework. Buildings 2023, 13, 2649. [Google Scholar] [CrossRef]
- Sun, H.; Xu, H.; He, H.; Wei, Q.; Yan, Y.; Chen, Z.; Li, X.; Zheng, J.; Li, T. A Spatial Analysis of Urban Streets under Deep Learning Based on Street View Imagery: Quantifying Perceptual and Elemental Perceptual Relationships. Sustainability 2023, 15, 14798. [Google Scholar] [CrossRef]
Disclaimer/Publisher’s Note: The statements, opinions and data contained in all publications are solely those of the individual author(s) and contributor(s) and not of MDPI and/or the editor(s). MDPI and/or the editor(s) disclaim responsibility for any injury to people or property resulting from any ideas, methods, instructions or products referred to in the content. |
© 2024 by the authors. Licensee MDPI, Basel, Switzerland. This article is an open access article distributed under the terms and conditions of the Creative Commons Attribution (CC BY) license (https://creativecommons.org/licenses/by/4.0/).