Article

Optimization Study on Stakeholder Capability Configuration in Green Construction

School of Civil Engineering and Transportation, Northeast Forestry University, 26 He Xing Road, Harbin 150040, China
*
Author to whom correspondence should be addressed.
Buildings 2024, 14(10), 3135; https://doi.org/10.3390/buildings14103135
Submission received: 14 August 2024 / Revised: 26 September 2024 / Accepted: 28 September 2024 / Published: 1 October 2024
(This article belongs to the Section Construction Management, and Computers & Digitization)

Abstract

:
Green construction is considered to be a construction model that pursues high resource efficiency and the utilization of reduced environmental impacts through technological innovation and management optimization under the realization of the project’s iron triangle. The realization of its performance relies on the level of stakeholder capability configuration. To reveal the optimal capability configuration and interaction between regulators and executors, this study constructed a utility model based on a post-positivist methodology. By analyzing the optimal capability configuration and coordination levels of regulators and executors according to the practices and constraints of green construction, this study conducted a static analysis to compare the effects of marginal value on regulators’ capability input and coordination coefficients. Finally, a sensitivity analysis uncovers the changes in capability configuration interaction and coordination coefficients at different stages of green construction. The results indicate that high levels of coordination in green construction cannot be maintained in the long term; continuous capability input from regulators is required for sustained support. Only by eliminating external uncertainties, reducing the variable costs for executors in advancing green construction, and controlling their risk aversion can executors be truly motivated to promote green construction. The capability configuration of both regulators and executors adjusts with corresponding marginal values. The capability configuration of executors shows a trend of initially increasing and then decreasing as the progressive coefficient rises. The model proposed in this study ensures that the final coordination level stabilizes at a relatively high level, which is between 0.6 and 0.7. In summary, the breakthrough findings provide critical insights into green construction management, contributing to the achievement of the anticipated green construction objectives.

1. Introduction

The construction industry is often criticized for its significant environmental impact or its failure to achieve the anticipated “green” goals [1]. To promote green construction practices, governments around the world have continuously developed green construction evaluation standards and policies to encourage stakeholders to allocate sufficient capabilities [2,3]. However, the construction industry still accounts for 40% of global energy consumption, 30% of carbon dioxide emissions, and 40% of solid waste production. Existing governance models fail to provide insights into the effective configuration of stakeholders’ capabilities to foster collaboration in addressing environmental challenges [4,5]. Faced with challenges such as the opacity of information regarding green products, the high-cost premiums of green materials and technologies, and the uneven distribution of benefits, stakeholders tend to exploit ambiguities in contracts and relational norms to achieve the greatest economic benefit with minimal capability investment [6]. To maximize unilateral value, they often reduce capability inputs, pay lip service to green construction requirements, or even engage in greenwashing [7]. A study in Singapore showed that clients are unwilling to bear the cost premium of green construction, preferring to strike a delicate balance between reducing “green” capability inputs and achieving economic benefits [8]. Similarly, contractors in Nigeria indicated that, in the absence of regulation and economic incentives, they tend to avoid green construction practices to prevent cost increases associated with excessive capability investment [9].
To achieve the established “green” goals, research in engineering management has consistently aimed at identifying methods to promote the optimal capability configuration among stakeholders [10,11,12]. This is done to mitigate risks and conflicts in green construction, bridge the gap between green construction goals and opportunity benefits, and foster collaborative cooperation [13]. Research has identified capability as the critical element contributing to the success of green construction. To advance standardized green practices in construction projects and shape consistent behavioral strategies [12,14], a study proposed a corresponding governance capability system, suggesting that capability configuration in green construction should encompass aspects such as materials, human resources, finance, operations, and project management [6,15]. They attempted to drive the identification of optimal capability configurations in green construction through the “capability bundling value” argument. Table 1 demonstrates the existing research involving capability response in green construction. However, these discussions, which focus on unilateral strategies, fail to provide accurate insights into capability configuration based on interactions between stakeholders [1,16,17]. In another prevalent study, researchers sought to ensure sufficient capability interaction from contractors to address risks in green construction through punitive measures [15]. However, faced with the static value distribution in contracts, stakeholders with different risk preferences tend to avoid additional investments [13,14]. Existing research attempts to optimize contracts and incentivize stakeholders’ collaborative configuration decisions in green construction [18]. They argue that if a reasonable dynamic reward–punishment mechanism compensates for the extra efforts, stakeholders will continue to increase their capability investment in response to potential uncertainties as the collaborative feedback in green construction persists, and this capability investment can be measured [19]. In reality, while stakeholders may determine their capability strategies in green construction based on contract requirements, they do not necessarily have formal relationships with each other. For example, although supervisors, general contractors, and subcontractors supervise and promote green construction according to contract requirements, they do not have direct contractual relationships. Current research in engineering management seems to focus more on the effects of formal and informal relationship governance, while the impact of such quasi-contractual cooperation is still overlooked. Supervisors also collaborate with general contractors and subcontractors to establish regulatory and execution procedures in green construction and configure corresponding capabilities to ensure the effectiveness of the plan. According to the division of responsibilities among stakeholders in green construction, governance relationships exist between them. A lack of understanding of capability interactions within these governance relationships can lead not only to the risk of falsifying green construction results due to insufficient capability investment but also to increased costs due to redundant capability configuration. Current research still fails to bridge the gap in capability investment among stakeholders in green construction [20,21].
In fact, stakeholders often develop green construction plans in advance to drive collaborative governance of potential unexpected situations through established cooperative procedures and guidelines [29]. However, the reciprocity and obligations of stakeholders in green construction are not predetermined. It is challenging for stakeholders to continuously invest sufficient capabilities to proactively address potential risks in green construction [30]. If the governance model is result-oriented, they tend to avoid additional investments or even engage in greenwashing, especially when the plans do not effectively guide green construction practices [13]. Conversely, if stakeholders establish cooperative mechanisms in green construction, such as cost compensation, profit distribution, and risk-sharing, and thoroughly guide and enforce “green” requirements, they are more likely to coordinate across organizations, learn from and restructure the construction plans or cooperation models, and reconfigure capability investments in response to unforeseen circumstances. This will help achieve the green construction objectives [31].
In green construction, there are both contractual relationships and supervisory relationships among developers, supervisors, general contractors, and subcontractors. This dual role means that while developers, supervisors, and general contractors act as regulators in green construction, supervisors, general contractors, and subcontractors also serve as executors. Therefore, it is essential to comprehensively consider the interactions between stakeholders in green construction based on their governance relationships [32]. In green construction, regulators and executors first develop and assess the feasibility of plans based on the construction tasks, and then both parties execute the green construction tasks according to the established procedures. However, existing research seems to be more concerned with developing the construct of “capability” and assessing the level of unilateral capability programs. When unexpected situations arise, and the plans fail to guide green construction practices, the existing plans need to be restructured. So, what is the optimal capability configuration level for them? How does the interaction of capability configuration between regulators and executors change at different stages of green construction? What are the influencing factors? How does the level of coordination between them evolve? This study aims to identify the interactions between stakeholders in green construction under governance relationships, construct a corresponding capability configuration model, and achieve Pareto optimal improvements in resource allocation levels within green construction governance.

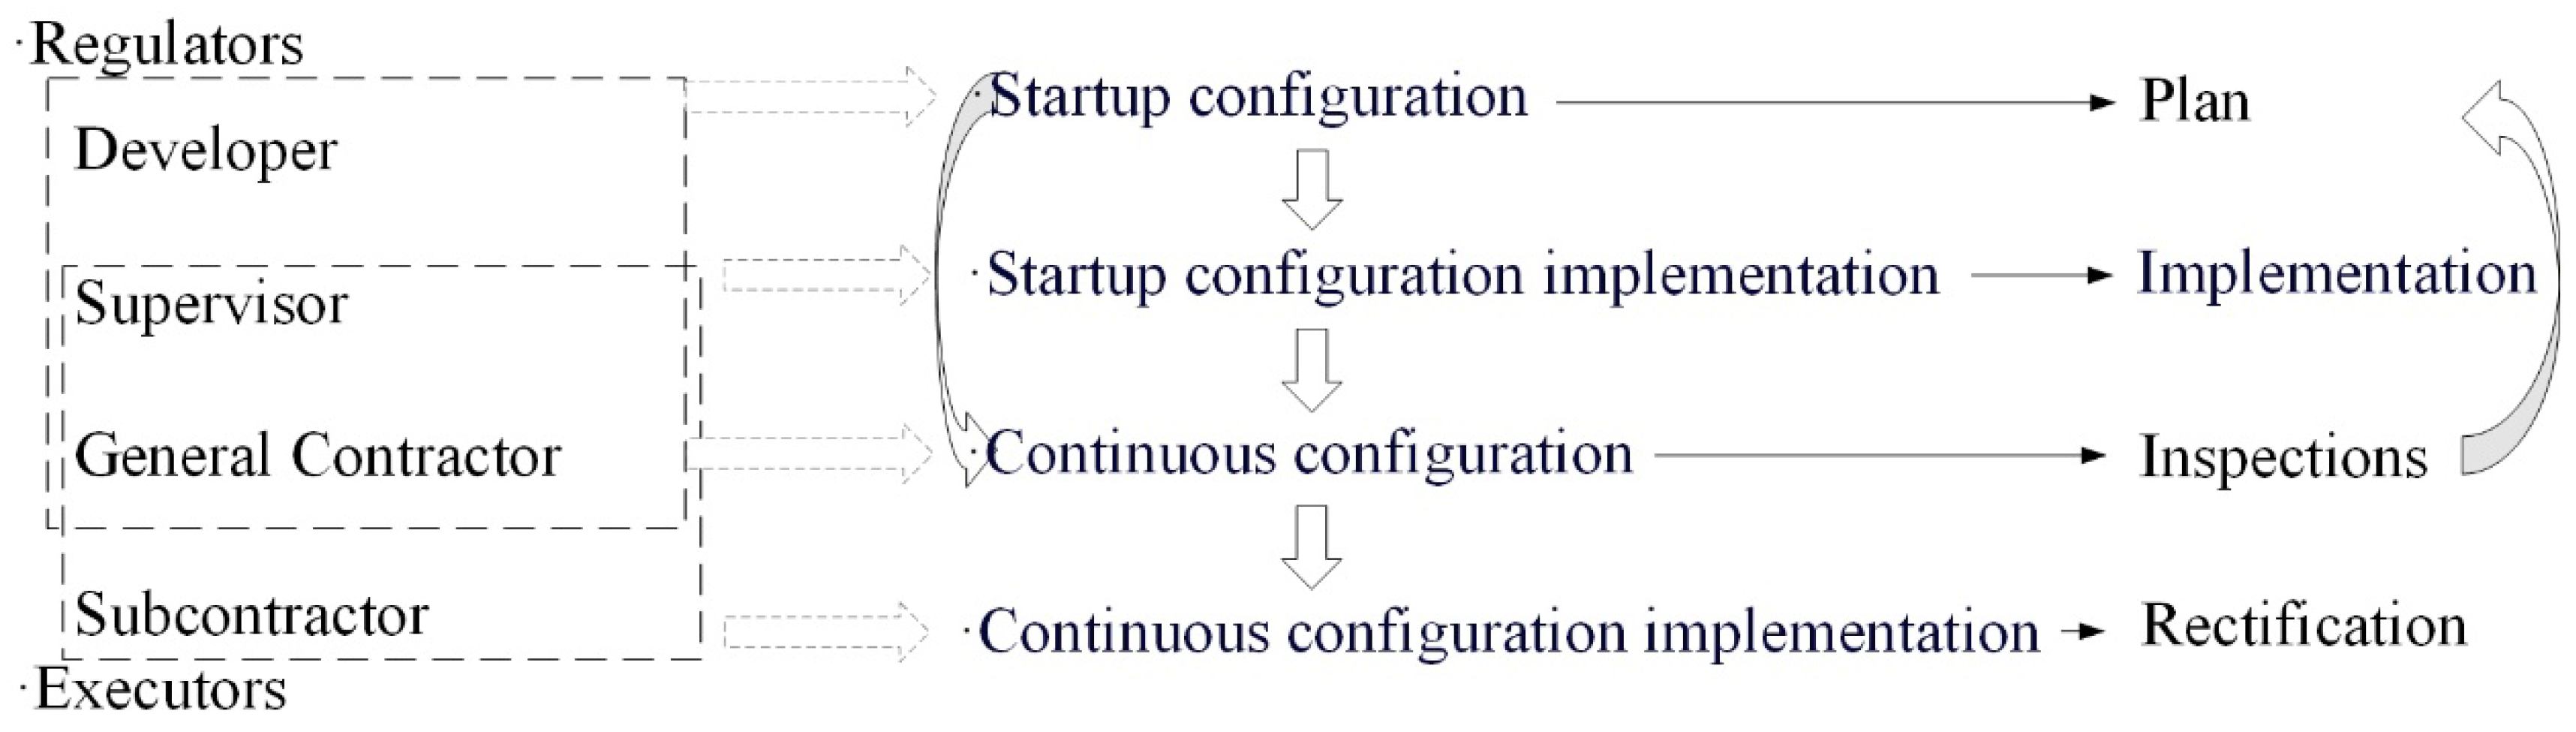
2. Configuration of Capability in Green Construction

To identify the interactions in capability configuration within green construction governance, this study implemented a nested research design to recognize the capability responses of projects or teams in individual green construction management studies. This cross-level reflexive review practice facilitates an understanding of the causal relationships in capability interactions at different stages [33]. In green construction, most of the measures that stakeholders use to eliminate, mitigate, or transfer the threats of unforeseen situations and achieve the expected goals are capability-based [10]. Regulators and executors continuously learn, enhance, and configure their capabilities through ongoing feedback from acceptance processes, thereby promoting collaborative governance. Therefore, the optimal level of capability investment is the minimum effective resource level they maintain through continuous feedback to regulate and advance the execution of green construction plans [34].
Based on the practice of green construction, stakeholders must develop a green construction plan in advance and allocate sufficient capability according to the established procedures to achieve the set “green” goals [20]. Consequently, the tasks of regulators in green construction are divided into “startup configuration” and “continuous configuration”. Correspondingly, the tasks of executors are divided into advancing “startup configuration” and advancing “continuous configuration”. The regulator’s startup configuration often represents a consistent drive towards the “green” goals. They shape a shared value orientation and guide executors to follow the correct cooperation procedures and obligations based on the green construction plan, mobilizing mutual capability to create an ideal green construction process [15]. During the startup configuration, regulators ensure the establishment of green construction systems, staff training, technical preparation, and resource configuration by investing in adequate capability levels. This effectively and delineates responsibilities between regulators and executors and addresses how to handle unexpected situations in green construction [23]. Depending on the dependencies between processes, it breaks down the green construction project into manageable entities to facilitate collective continuous decision making [35]. Executors need to configure their capability input according to the regulator’s startup configuration to advance the startup configuration. At this stage, executors adjust their capability levels according to the plan to perform green construction tasks as required. Focusing on implementing systems and action guidelines in green construction, advancing startup configuration often signifies the executors’ recognition of the balance between the value brought by green construction and their economic interests. By advancing the regulator’s startup configuration, they achieve mutual coordination. This prompts regulators and executors to continuously evaluate and adjust capability levels based on feedback from green construction, which typically covers aspects such as change approvals, daily supervision, testing, and rectification standards and coordination [36].
The regulator’s continuous configuration is the process of evaluating and adjusting the capability levels based on the results of the executor’s startup configuration advancement during the green construction phase. In continuous configuration, regulators actively respond to potential unexpected situations through regular inspections. This process also integrates the plan with the green construction process to create value. Research indicates that capability configuration can be observed through the behavior and intentions of executors in green construction [8]. Another study suggests that once a shared value goal is established through contracts, capability can address potential risks and conflicts in green construction, thus promoting cooperation [33]. Facing potential risks and cost premiums, regulators continuously configure additional capability and guidance measures to ensure the achievement of the expected green goals, and they continuously adjust and optimize the established plan [6,37,38]. At this stage, to balance the uncertainties of green construction with value pursuit, regulators use appropriate capability strategies to prompt the executor’s continuous configuration advancement to achieve the expected goals [39]. Executors’ advancement in continuous configuration is often adjusted based on the regulators’ modifications to capability input. Thus, advancing continuous configuration represents the executors’ effort to align with regulators’ requirements and collaboratively manage unexpected situations in green construction.
Startup configuration, advancing startup configuration, continuous configuration, and advancing continuous configuration refer to the planning, execution, evaluation, and action processes undertaken by regulators and executors in green construction. According to the specificity of capability and the dependencies among sub-projects, the level of capability configuration among stakeholders represents a dynamic process of capability coupling between regulators and executors, as illustrated in Figure 1.

3. Methodology

Focusing on the relationship between green construction experience and practice, this study was designed based on a post-positivist worldview. It develops a utility model to identify the reasons and motivations for the optimal configuration of capabilities between regulators and executors in green construction. Table 2 summarizes the parameters involved in the model and descriptions. The study follows a series of stages as illustrated in Figure 2.
Accordingly, the fundamental hypotheses of the research are as follows:
Hypothesis 1.
Green construction is a process based on continuous execution according to the plan [38]. Since the executor’s capability input level in advancing continuous configuration is inherited from their startup configuration capabilities, the capability input level in advancing continuous configuration in green construction is A e 2 = α × A e 1 . According to the value attributes of green construction, the marginal value obtained by the executor during the advancement of startup configuration is v 1 , which includes the marginal value of establishing long-term cooperation to promote green transformation [40]. In the face of unexpected situations, to ensure the smooth progress of green construction, the marginal value obtained by the executor during the advancement of continuous configuration is v 2 . This includes the marginal value of enhanced decision support and public trust, which improves competitive advantage [15]. The green construction process is affected by exogenous environmental uncertainties, leading to losses for the executor, such as fluctuations in the cost of green materials and changes in regulations [41]. Therefore, the construction plan and the exogenous variables affecting the executor’s losses in green construction, denoted as o 1 ,   o 2 , follow normal distributions with parameters ( 0 , ε 1 2 ) and ( 0 , ε 2 2 ) , respectively, where ε 1 and ε 2 are external uncertainty factors. Consequently, the output benefit of the executor in green construction is φ = φ 1 + φ 2 . The benefit functions for advancing startup configuration and continuous configuration are denoted as φ 1 = v 1 × A e 1 + o 1 and φ 2 = v 2 × A e 2 + o 2 , respectively. The distribution function of φ satisfies the monotone likelihood ratio property (MLRP) and convexity conditions [42].
Hypothesis 2.
In green construction, the regulatory party will perform a supervisory and guiding function [36]. On one hand, the regulator continuously improves the supervision process based on actual conditions, encouraging executors to implement more environmentally friendly construction practices where the plan is unclear. On the other hand, the regulator conducts detailed supervision and review of the construction process to achieve high satisfaction and reputation from the government and the public. They aim to increase the financing supply for green construction, addressing the market failure issues associated with the solely market-based allocation of green construction capital [1]. The regulator, through the pre-established cooperative processes, guides the executor’s implementation of green construction with rewards valued at b 1 , which includes providing detailed green construction standards and resource allocation mechanisms. In the face of unexpected situations, the regulator’s guidance intensity during the green construction process is b 2 , which includes regular construction inspections, patrols, and problem resolution. The guidance process is affected by exogenous environmental factors such as extreme weather, temporary shortages of materials or equipment, and sudden environmental incidents [41]. This generates random error o 3 , which follows a normal distribution with parameter ( 0 , ε 3 2 ) . Consequently, the dynamic guidance support the executor receives in green construction is N = b 1 × A e 1 + b 2 × A e 2 + o 3 . The degree of guidance provided by the regulator and the executor’s advancement in continuous configuration will achieve mutual governance. At this point, if the executor actively invests capability to meet the regulator’s requirements, the resulting synergistic effect is s N .
Hypothesis 3.
The regulator exhibits risk-neutral characteristics, while the executor demonstrates risk-averse characteristics [43]. The instability of benefits in green construction results in an indeterminate level of utility for the executor. A utility function can be used to maximize expected utility as π = A e θ g [44]. Here, a higher θ indicates greater aversion to risk by the executor.
Hypothesis 4.
Executors incur input costs, denoted as C ( A e ) = f 1 + f 2 + c 1 A e 1 2 2 + c 2 A e 2 2 2 . Here, f 1 and f 2 include costs for training and building governance systems. The cost function for the executor’s capability configuration is a strictly increasing convex function with a first-order continuous partial derivative and a second-order differentiable property [1]. The risk cost for the executor, denoted as R ( g ) = 0 . 5 × θ × V a r ( g ) , is positively correlated with their risk aversion coefficient. The cost of supervision and guidance borne by the regulator is C ( b ) = m 1 × b 1 + m 2 × b 2 .
Given this, the regulator’s optimal expenditure function is as follows:
A ( φ ) = R 1 + R 2 + A r 1 × φ 1 + A r 2 × φ 2 + s N
In Equation (1), R 1 and R 2 include various subsidies for green construction.
Based on the above assumptions, the benefits obtained by the executor in green construction are given by Equation (2):
w = A ( φ ) C ( A e )   = R 1 + R 2 + v 1 A r 1 A e 1 + r 1 o 1 + v 2 A r 2 A e 2 + r 2 o 2 + s ( A e 1 b 1 + A e 2 b 2 + o 3 ) f 1 f 2 c 1 A e 1 2 2 c 2 A e 2 2 2
Given the executor’s risk-averse characteristics, the final benefit is represented by the certainty equivalent C E ( g ) . C E ( g ) is the difference between the expected benefit E ( g ) and the risk cost R ( g ) , C E ( g ) = E ( g ) R ( g ) . Based on Equation (2) and Hypotheses 1, 2, and 4, the expressions for E ( g ) , R ( g ) are provided in Equations (3) and (4), respectively. Therefore, C E ( g ) can be expressed as shown in Equation (5).
E ( g ) = R 1 + R 2 + v 1 A r 1 A e 1 + v 2 A r 2 A e 2 + s A e 1 b 1 + s A e 2 b 2 f 1 f 2 c 1 A e 1 2 2 c 2 A e 2 2 2
R ( g ) = θ 2 ( A r 1 2 ε 1 2 + A r 2 2 ε 2 2 + s 2 ε 3 2 )
C E ( g ) = R 1 + R 2 + v 1 A r 1 A e 1 + v 2 A r 2 A e 2 + s A e 1 b 1 + s A e 2 b 2     f 1 f 2 c 1 A e 1 2 2 c 2 A e 2 2 2 θ 2 ( A r 1 2 ε 1 2 + A r 2 2 ε 2 2 + s 2 ε 3 2 )
The regulator guides the executor to invest capability in advancing green construction, and the benefit G obtained by the regulator is the difference between the executor’s output benefits in green construction and the utility of the model and the cost of supervision and guidance. Based on Hypotheses 1 and 4, and Equation (1), G can be represented as shown in Equation (6):
G = φ A ( φ ) C ( b )   = v 1 A e 1 + v 2 A e 2 + o 1 + o 2 ( m 1 b 1 + m 2 b 2 )     [ R 1 + R 2 + v 1 A r 1 A e 1 + A r 1 o 1 + v 2 A r 2 A e 2 + A r 2 o 2 + s ( A e 1 b 1 + b 2 A e 2 b 2 + o 3 ) ]
Given that the regulator exhibits risk-neutral preferences, the expected utility E ( G ) can be represented by Equation (7).
E ( G ) = v 1 A e 1 + v 2 A e 2 ( m 1 b 1 + m 2 b 2 ) [ R 1 + R 2 + v 1 A r 1 A e 1 + v 2 A r 2 A e 2 + s ( A e 1 b 1 + A e 2 b 2 ) ]
In green construction, the regulator designs the management model to align the executor’s objectives with the “green” goals, aiming to maximize the expected benefits of green construction. Simultaneously, the regulator seeks to maximize their own certainty equivalent return in green construction. Therefore, the optimal governance model must satisfy two constraints: incentive compatibility (IC) and individual rationality (IR) [1,8]. IC indicates that the executor chooses the optimal level of capability investment based on the certainty equivalent return. IR ensures that the executor’s certainty equivalent return exceeds the reservation utility ( U * ). Thus, the optimal utility model for green construction is represented by Equation (8):
max ( v 1 , v 2 , z ) E ( G ) , s . t . max ( e 1 ) C E ( g ) ( I C ) , C E ( g ) U * ( I R ) .
From Equations (5) and (7), the optimal model in green construction can be expressed by Equation (9):
max ( v 1 , v 2 , z ) v 1 A e 1 + v 2 A e 2 ( m 1 b 1 + m 2 b 2 ) [ R 1 + R 2 + v 1 A r 1 A e 1 + v 2 A r 2 A e 2 + s ( A e 1 b 1 + A e 2 b 2 ) ] s . t . max ( e 1 ) R 1 + R 2 + v 1 A r 1 A e 1 + v 2 A r 2 A e 2 + s A e 1 b 1 + s A e 2 b 2 f 1 f 2 c 1 A e 1 2 2 c 2 A e 2 2 2 θ 2 ( A r 1 2 ε 1 2 + A r 2 2 ε 2 2 + s 2 ε 3 2 ) ( I C ) , R 1 + R 2 + v 1 A r 1 A e 1 + v 2 A r 2 A e 2 + s A e 1 b 1 + s A e 2 b 2 f 1 f 2 c 1 A e 1 2 2 c 2 A e 2 2 2 θ 2 ( A r 1 2 ε 1 2 + A r 2 2 ε 2 2 + s 2 ε 3 2 ) U * ( I R )

4. Results

4.1. Results of the Utility Model

Based on the IC (incentive compatibility) constraint, the executor aims to maximize benefits in green construction. When the IC is stable, the optimal capability input level for the executor in advancing startup configuration is given by Equation (10). Substituting A e 1 * into C E ( g ) U * ( I R ) and setting U * = 0 , we obtain Equation (11).
A e 1 * = v 1 A r 1 + v 2 A r 2 α + s ( α b 2 + b 1 ) c 1 + c 2 α 2
R 1 + R 2 = f 1 + f 2 + c 1 A e 1 2 2 + c 2 α 2 A e 2 2 2 + θ 2 ( A r 1 2 ε 1 2 + A r 2 2 ε 2 2 + s 2 ε 3 2 )     [ v 1 A r 1 A e 1 + v 2 A r 2 α A e 1 + s ( A e 1 b 1 + A e 1 b 2 α ) ]
By substituting Equations (10) and (11) into the objective function in Equation (9), the optimal capability level can be determined. In green construction, synergy is a critical variable with significant impact on green construction effectiveness. It also influences the effectiveness of the regulator’s guiding function. Therefore, the regulator aims to achieve optimal collaborative governance.
To find the optimal capability investments for the regulator, the first-order partial derivatives of the objective function in Equation (9) (setting E A r 1 = E A r 2 = E s = 0 ) are computed. This yields the optimal capability investments for the regulator in startup configuration and continuous configuration, as given by Equations (12) and (13). The synergy coefficient between the regulator and the executor is represented by Equation (14).
A r 1 = v 1 2 + v 1 v 2 α ( 1 A r 2 ) ( b 1 v 1 + b 2 α v 1 ) s ( c 1 + c 2 α 2 ) θ ε 1 2 + v 1 2
A r 2 = v 2 2 α 2 + v 1 v 2 α ( 1 A r 1 ) ( b 1 α v 2 + b 2 α 2 v 2 ) s ( c 1 + c 2 α 2 ) θ ε 2 2 + α 2 v 2 2
s = ( v 1 b 1 + v 1 b 2 α ) ( 1 - A r 1 ) + ( α v 2 b 1 + α 2 v 2 b 2 ) ( 1 A r 2 ) ( c 1 + c 2 α 2 ) θ ε 3 2 + ( b 1 + b 2 α ) 2
Since C E ( g ) and E ( G ) have maximum values, when 2 C E ( g ) A e 1 2 < 0 , 2 E A r 1 2 < 0 , 2 E A r 2 2 < 0 , 2 E s 2 < 0 , solving Equations (12) through (14) and substituting into Equation (10) allows for the calculation of e 1 * . Ultimately, this leads to the governance model in green construction being represented by Equations (15) through (18).
A e 1 = v 1 + v 2 α [ v 1 2 ε 2 2 ε 3 2 + v 2 2 α 2 ε 1 2 ε 3 2 + ( b 1 + b 2 α ) 2 ε 1 2 ε 2 2 ] ( c 1 + c 2 α 2 ) [ ( c 1 + c 2 α 2 ) θ ε 1 2 ε 2 2 ε 3 2 + v 1 2 ε 2 2 ε 3 2 + v 2 2 α 2 ε 1 2 ε 3 2 + b 1 + b 2 α 2 ε 1 2 ε 2 2 ]
A r 1 = ( v 1 + v 2 α ) v 1 ε 2 2 ε 3 2 ( c 1 + c 2 α 2 ) θ ε 1 2 ε 2 2 ε 3 2 + v 1 2 ε 2 2 ε 3 2 + v 2 2 α 2 ε 1 2 ε 3 2 + ( b 1 + b 2 α ) 2 ε 1 2 ε 2 2
A r 2 = ( v 1 + v 2 α ) v 2 α ε 1 2 ε 3 2 ( c 1 + c 2 α 2 ) θ ε 1 2 ε 2 2 ε 3 2 + v 1 2 ε 2 2 ε 3 2 + v 2 2 α 2 ε 1 2 ε 3 2 + ( b 1 + b 2 α ) 2 ε 1 2 ε 2 2
s = ( v 1 + v 2 α ) ( b 1 + b 2 α ) 2 ε 1 2 ε 2 2 ( c 1 + c 2 α 2 ) θ ε 1 2 ε 2 2 ε 3 2 + v 1 2 ε 2 2 ε 3 2 + v 2 2 α 2 ε 1 2 ε 3 2 + ( b 1 + b 2 α ) 2 ε 1 2 ε 2 2

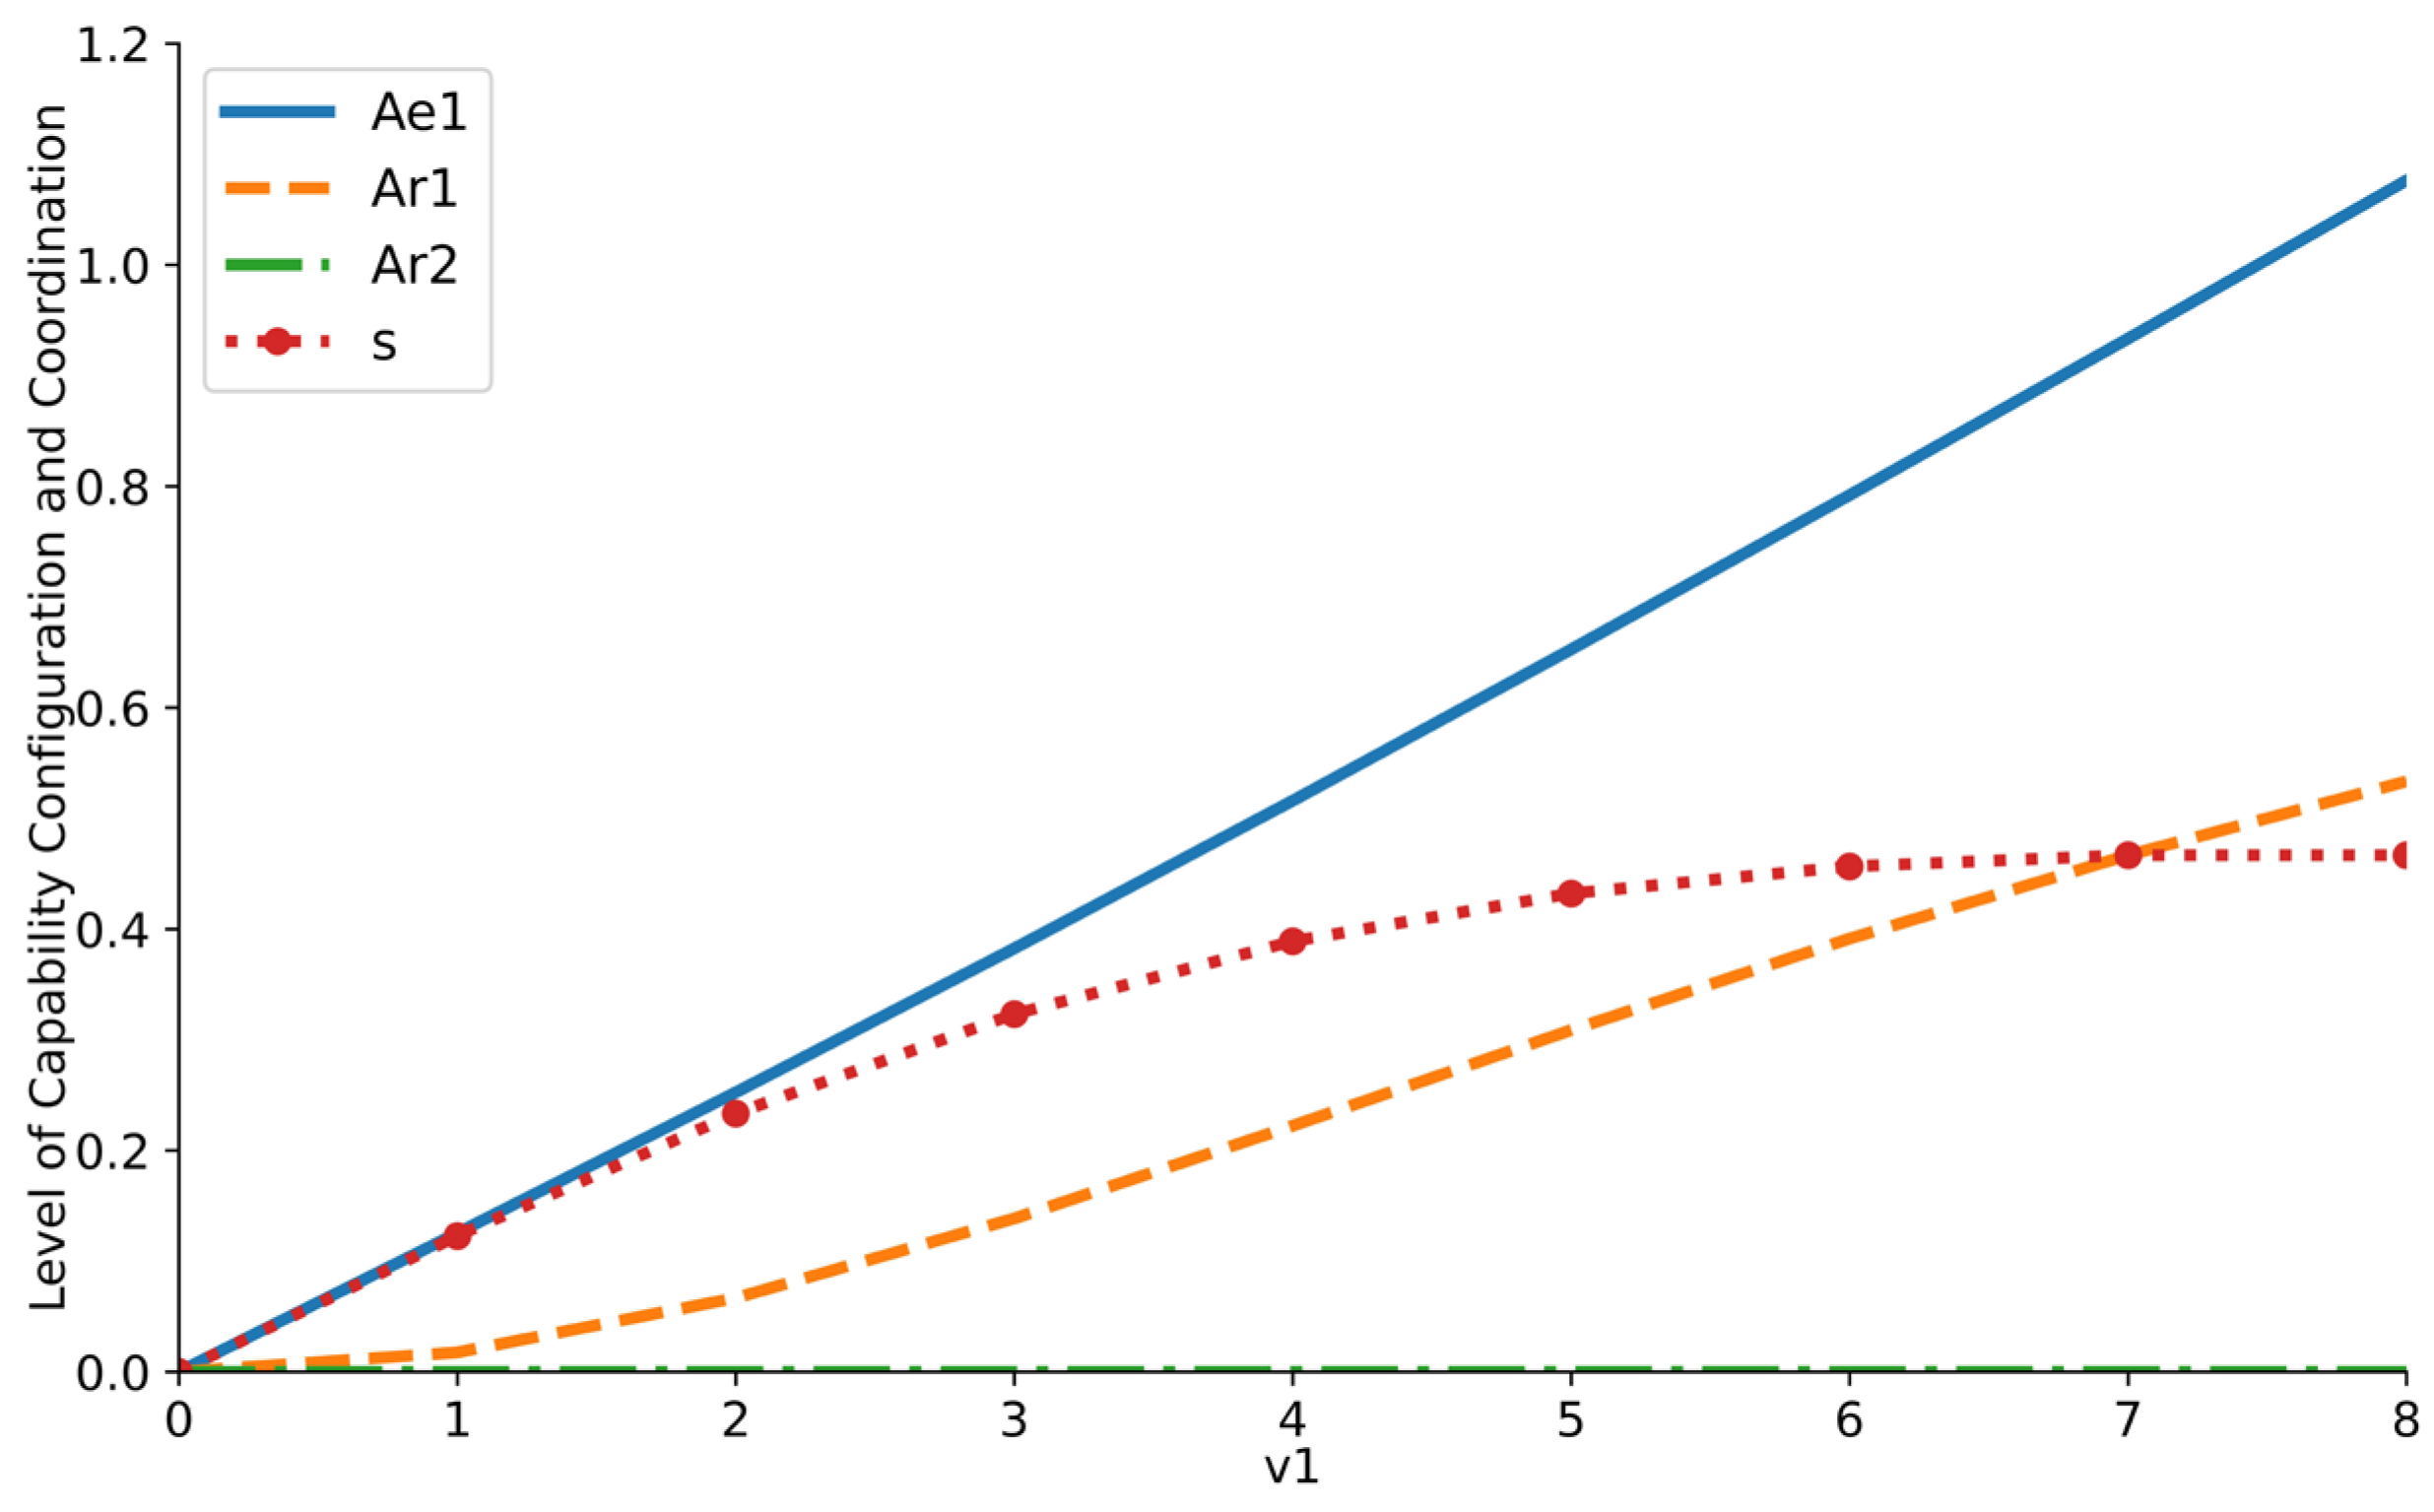
4.2. Static Comparative Analysis

According to Equation (10), the executor’s capability configuration is a function of the regulator’s capability configuration and the synergy coefficient. Therefore, a comparative static analysis of the regulator’s startup configuration, continuous configuration, and synergy coefficient is required.
As seen from Equations (16) through (18), the regulator’s optimal startup configuration, continuous configuration, and synergy coefficient are influenced by factors such as marginal benefits, progressive coefficients, variable cost coefficients, risk aversion coefficients, guidance intensity, and exogenous random factors. The relationship between capability investment levels and the synergy coefficient with marginal benefits is relatively complex.
(1)
Comparative Static Analysis of the Regulator’s Startup Configuration
Given I = ( c 1 + c 2 α 2 ) θ ε 1 2 ε 2 2 ε 3 2 + v 1 2 ε 2 2 ε 3 2 + v 2 2 α 2 ε 1 2 ε 3 2 + ( b 1 + b 2 α ) 2 ε 1 2 ε 2 2 , and based on Equation (16), we have
A r 1 v 1 = ε 2 2 ε 3 2 [ ( 2 v 1 + v 2 α ) I 2 ( v 1 + v 2 α ) v 1 2 ε 2 2 ε 3 2 ] I 2
A r 1 v 2 = α v 1 ε 2 2 ε 3 2 [ ( c 1 + c 2 α 2 ) θ ε 1 2 ε 2 2 ε 3 2 + v 1 2 ε 2 2 ε 3 2 + v 2 2 α 2 ε 1 2 ε 3 2 ] I 2   + α v 1 ε 2 2 ε 3 2 [ ( b 1 + b 2 α ) 2 ε 1 2 ε 2 2 2 ( v 1 + v 2 α ) v 2 α ε 2 2 ε 3 2 ] I 2
Based on Equations (19) and (20), the variation of the regulator’s A r 1 with respect to marginal values v 1 and v 2 cannot be directly observed. However, when there exists a threshold v 0 such that v 2 > v 0 and v 1 v 0 , it follows that A r 1 v 1 > A r 1 v 2 holds true. In this scenario, A r 1 is more influenced by v 1 than by v 2 , indicating that the regulator’s capability configuration is more significantly affected by the marginal value v 1 . For executors to continuously receive substantial support in the startup configuration during green construction, they must still focus on their efforts in advancing the startup configuration.
(2)
Static Comparative Analysis of the Regulator’s Capability Configuration in Continuous Configuration
According to Equation (17), we have
A r 2 v 1 = α v 2 ε 2 2 ε 3 2 [ ( c 1 + c 2 α 2 ) θ ε 1 2 ε 2 2 ε 3 2 + v 1 2 ε 2 2 ε 3 2 + v 2 2 α 2 ε 1 2 ε 3 2 ] I 2   + α v 2 ε 2 2 ε 3 2 [ ( b 1 + b 2 α ) 2 ε 1 2 ε 2 2 2 ( v 1 + v 2 α ) v 2 α ε 2 2 ε 3 2 ] I 2
A r 2 v 2 = ε 1 2 ε 3 2 [ ( v 1 + 2 v 2 α ) α I 2 ( v 1 + v 2 α ) v 2 2 α 3 ε 1 2 ε 3 2 ] I 2
Based on Equations (21) and (22), the impact of the regulator’s capability configuration in green construction on the expected marginal values v 1 and v 2 cannot be directly observed. However, when there is a threshold v 0 * such that v 0 * < v 1 and v 2 v 0 * , it follows that A r 2 v 2 > A r 2 v 1 . In this case, the regulator’s investment in continuous configuration is more significantly influenced by v 2 . As a result, the regulator should increase investments in continuous configuration to encourage the executor to advance this phase. Proper coordination between investments in the startup and continuous configuration stages is crucial for enhancing the executor’s motivation and ensuring effective green construction.
(3)
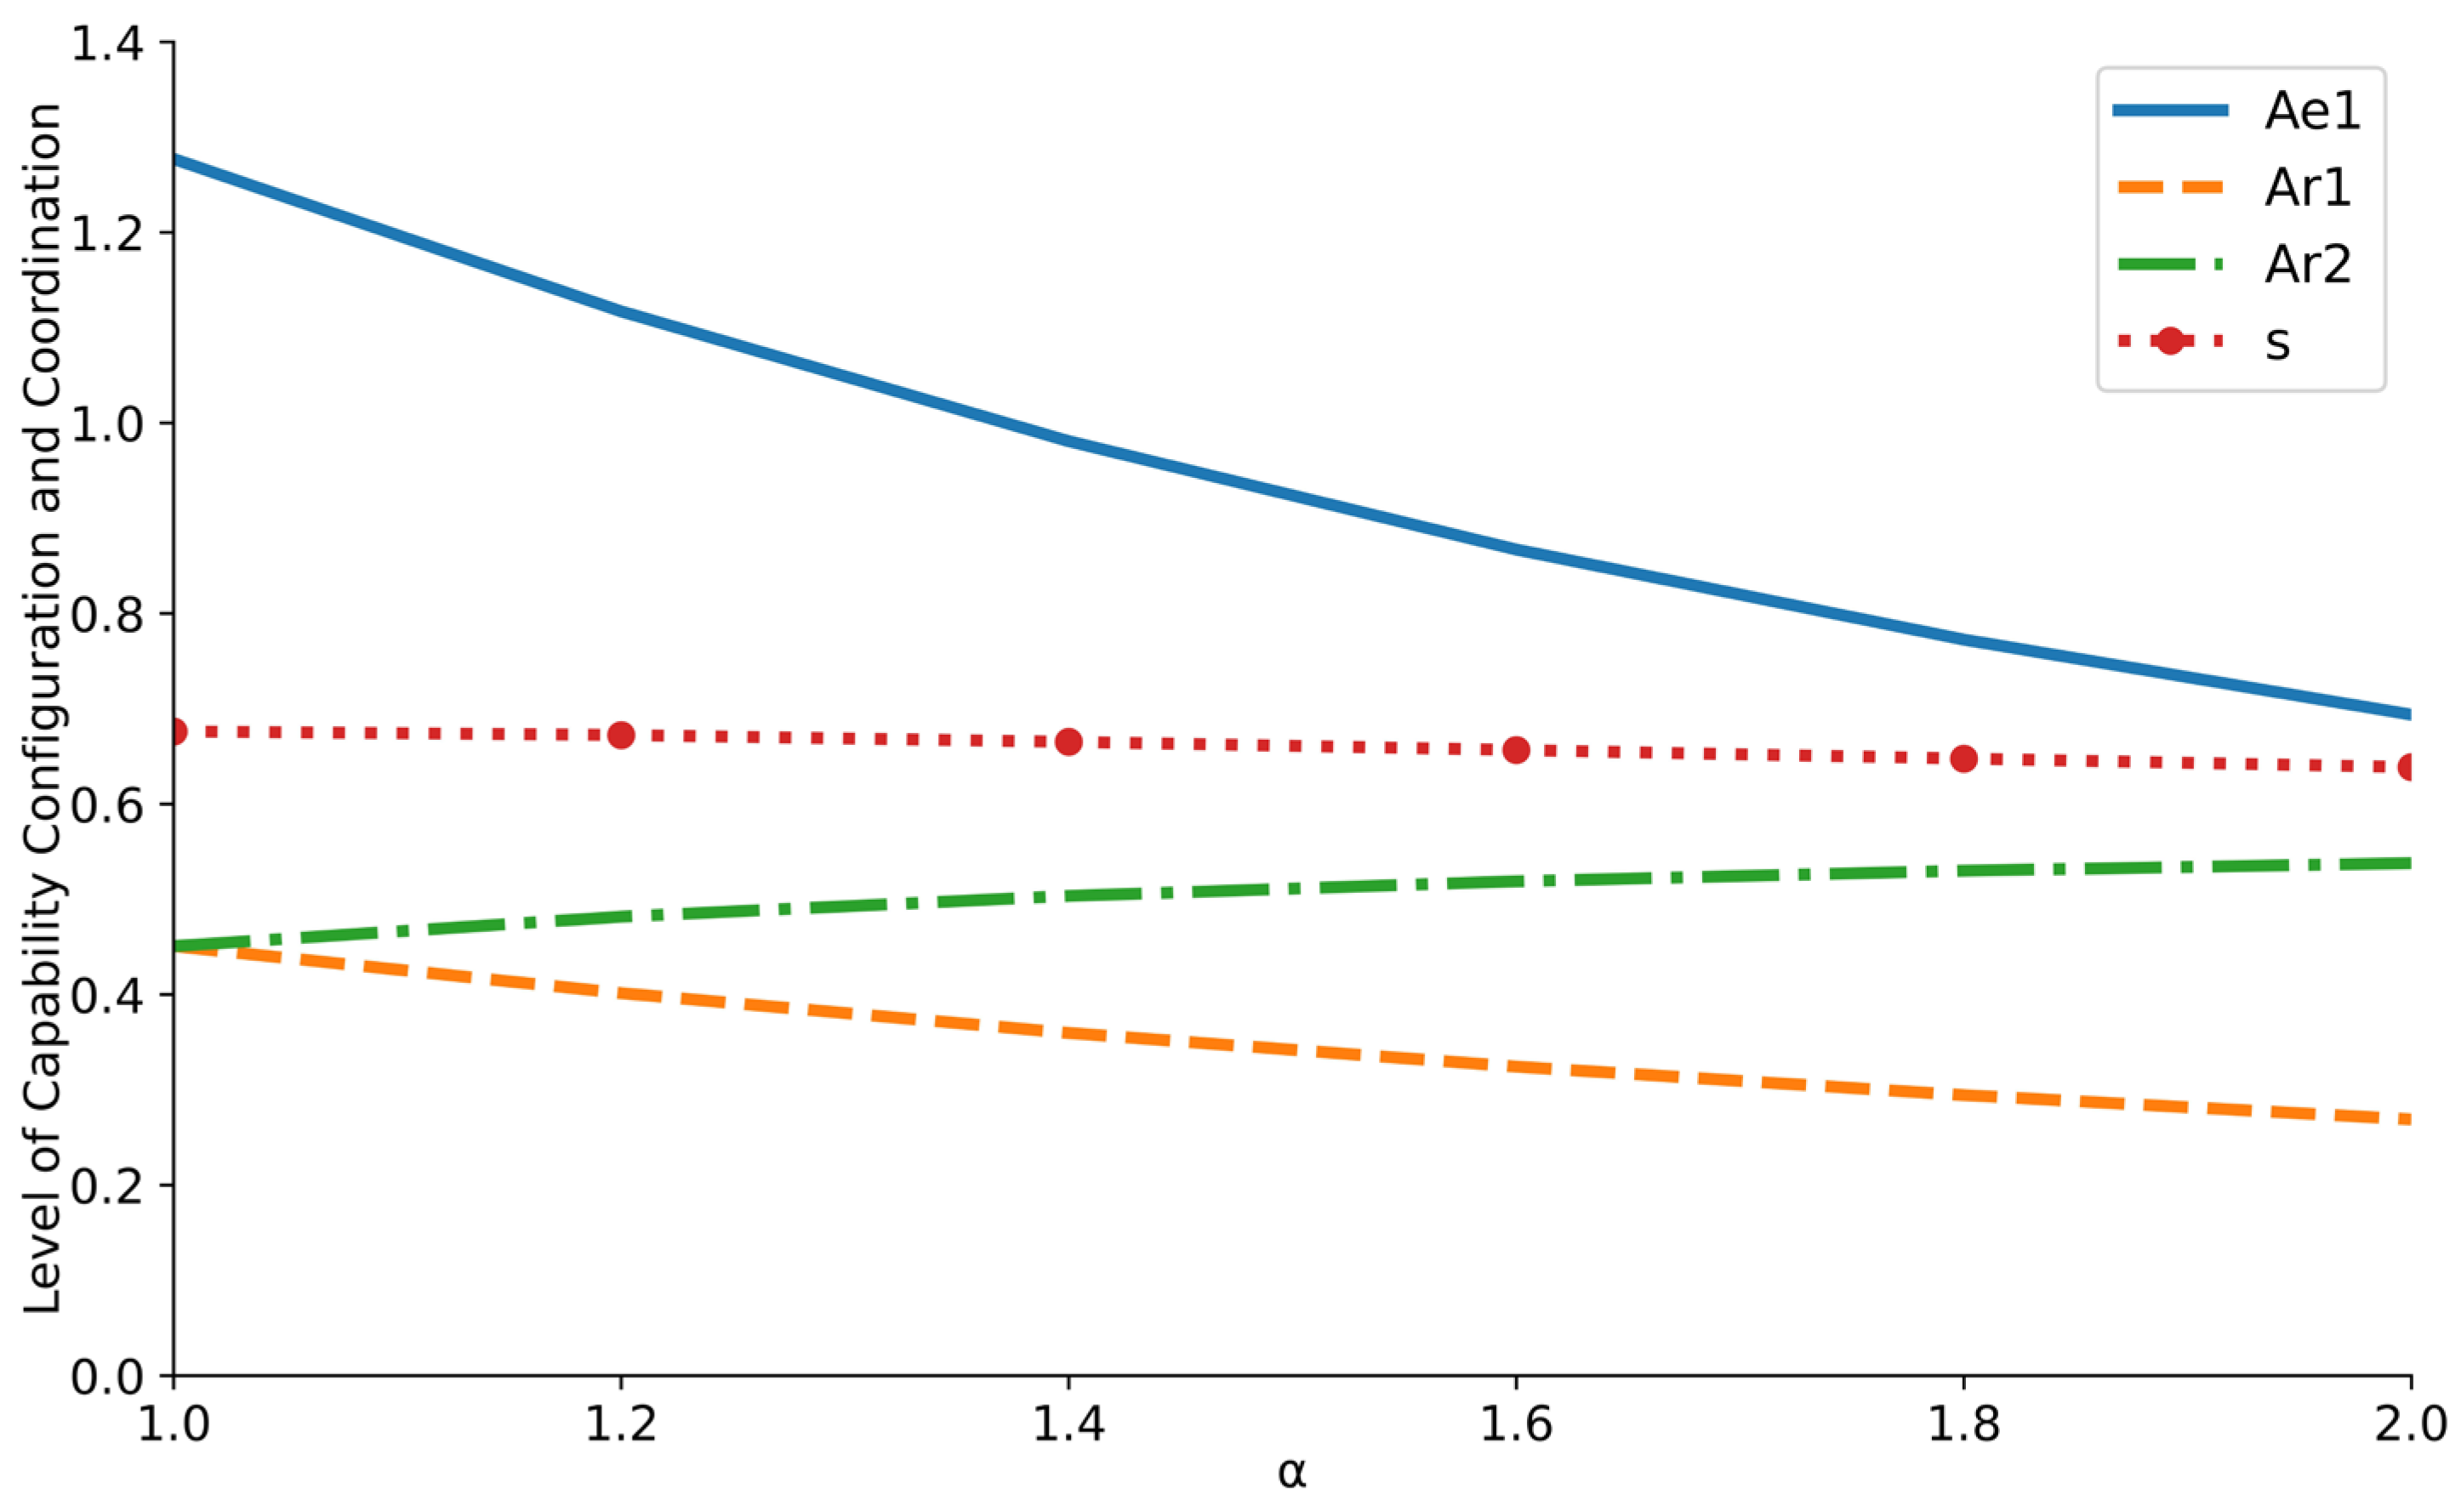
Static Comparative Analysis of the Synergy Coefficient
According to Equation (18), we have
s v 1 = ( b 1 + b 2 α ) 2 ε 1 2 ε 2 2 [ ( c 1 + c 2 α 2 ) θ ε 1 2 ε 2 2 ε 3 2 + v 2 2 α 2 ε 1 2 ε 3 2 + ( b 1 + b 2 α ) 2 ε 1 2 ε 2 2 ] ( v 1 2 + 2 v 1 v 2 α ) ε 2 2 ε 3 2 I 2
s v 2 = α ( b 1 + b 2 α ) 2 ε 1 2 ε 2 2 [ ( c 1 + c 2 α 2 ) θ ε 1 2 ε 2 2 ε 3 2 + v 1 2 α 2 ε 3 2 + ( b 1 + b 2 α ) 2 ε 1 2 ε 2 2 ] ( v 2 2 α 2 + 2 v 1 v 2 α ) ε 1 2 ε 3 2 I 2
Based on Equations (23) and (24), the impact of marginal values on the coordination coefficient cannot be observed directly. However, when v n and v n * are considered, where v n < v 1 , v n * < v 2 and s v 1 < 0 , s v 2 < 0 , it indicates that as the green construction project makes significant progress and scales up, leading to greater value, the coordination coefficient between the regulator and the executor will gradually decrease with further increases in marginal value. This reflects the characteristic of inefficiency in high-level coordination over time in green construction projects.
According to Equation (10), s A e 1 = ( c 1 + c 2 α 2 ) ( b 1 + b 2 α ) , s A r 1 = v 1 ( b 1 + b 2 α ) , s A r 2 = v 2 α ( b 1 + b 2 α ) . This reveals that the coordination coefficient between the executor and the regulator is positively correlated with the executor’s startup configuration progress level. Conversely, it is negatively correlated with the regulator’s investments in both startup and continuous configurations. This suggests that, under a fixed-price contract model, a higher investment from the regulator indicates greater complexity in the green construction project. As a result, the executor tends to focus more on unilateral value. In this context, the regulator’s guidance in startup and continuous configurations will mitigate this negative effect, promoting better coordination.

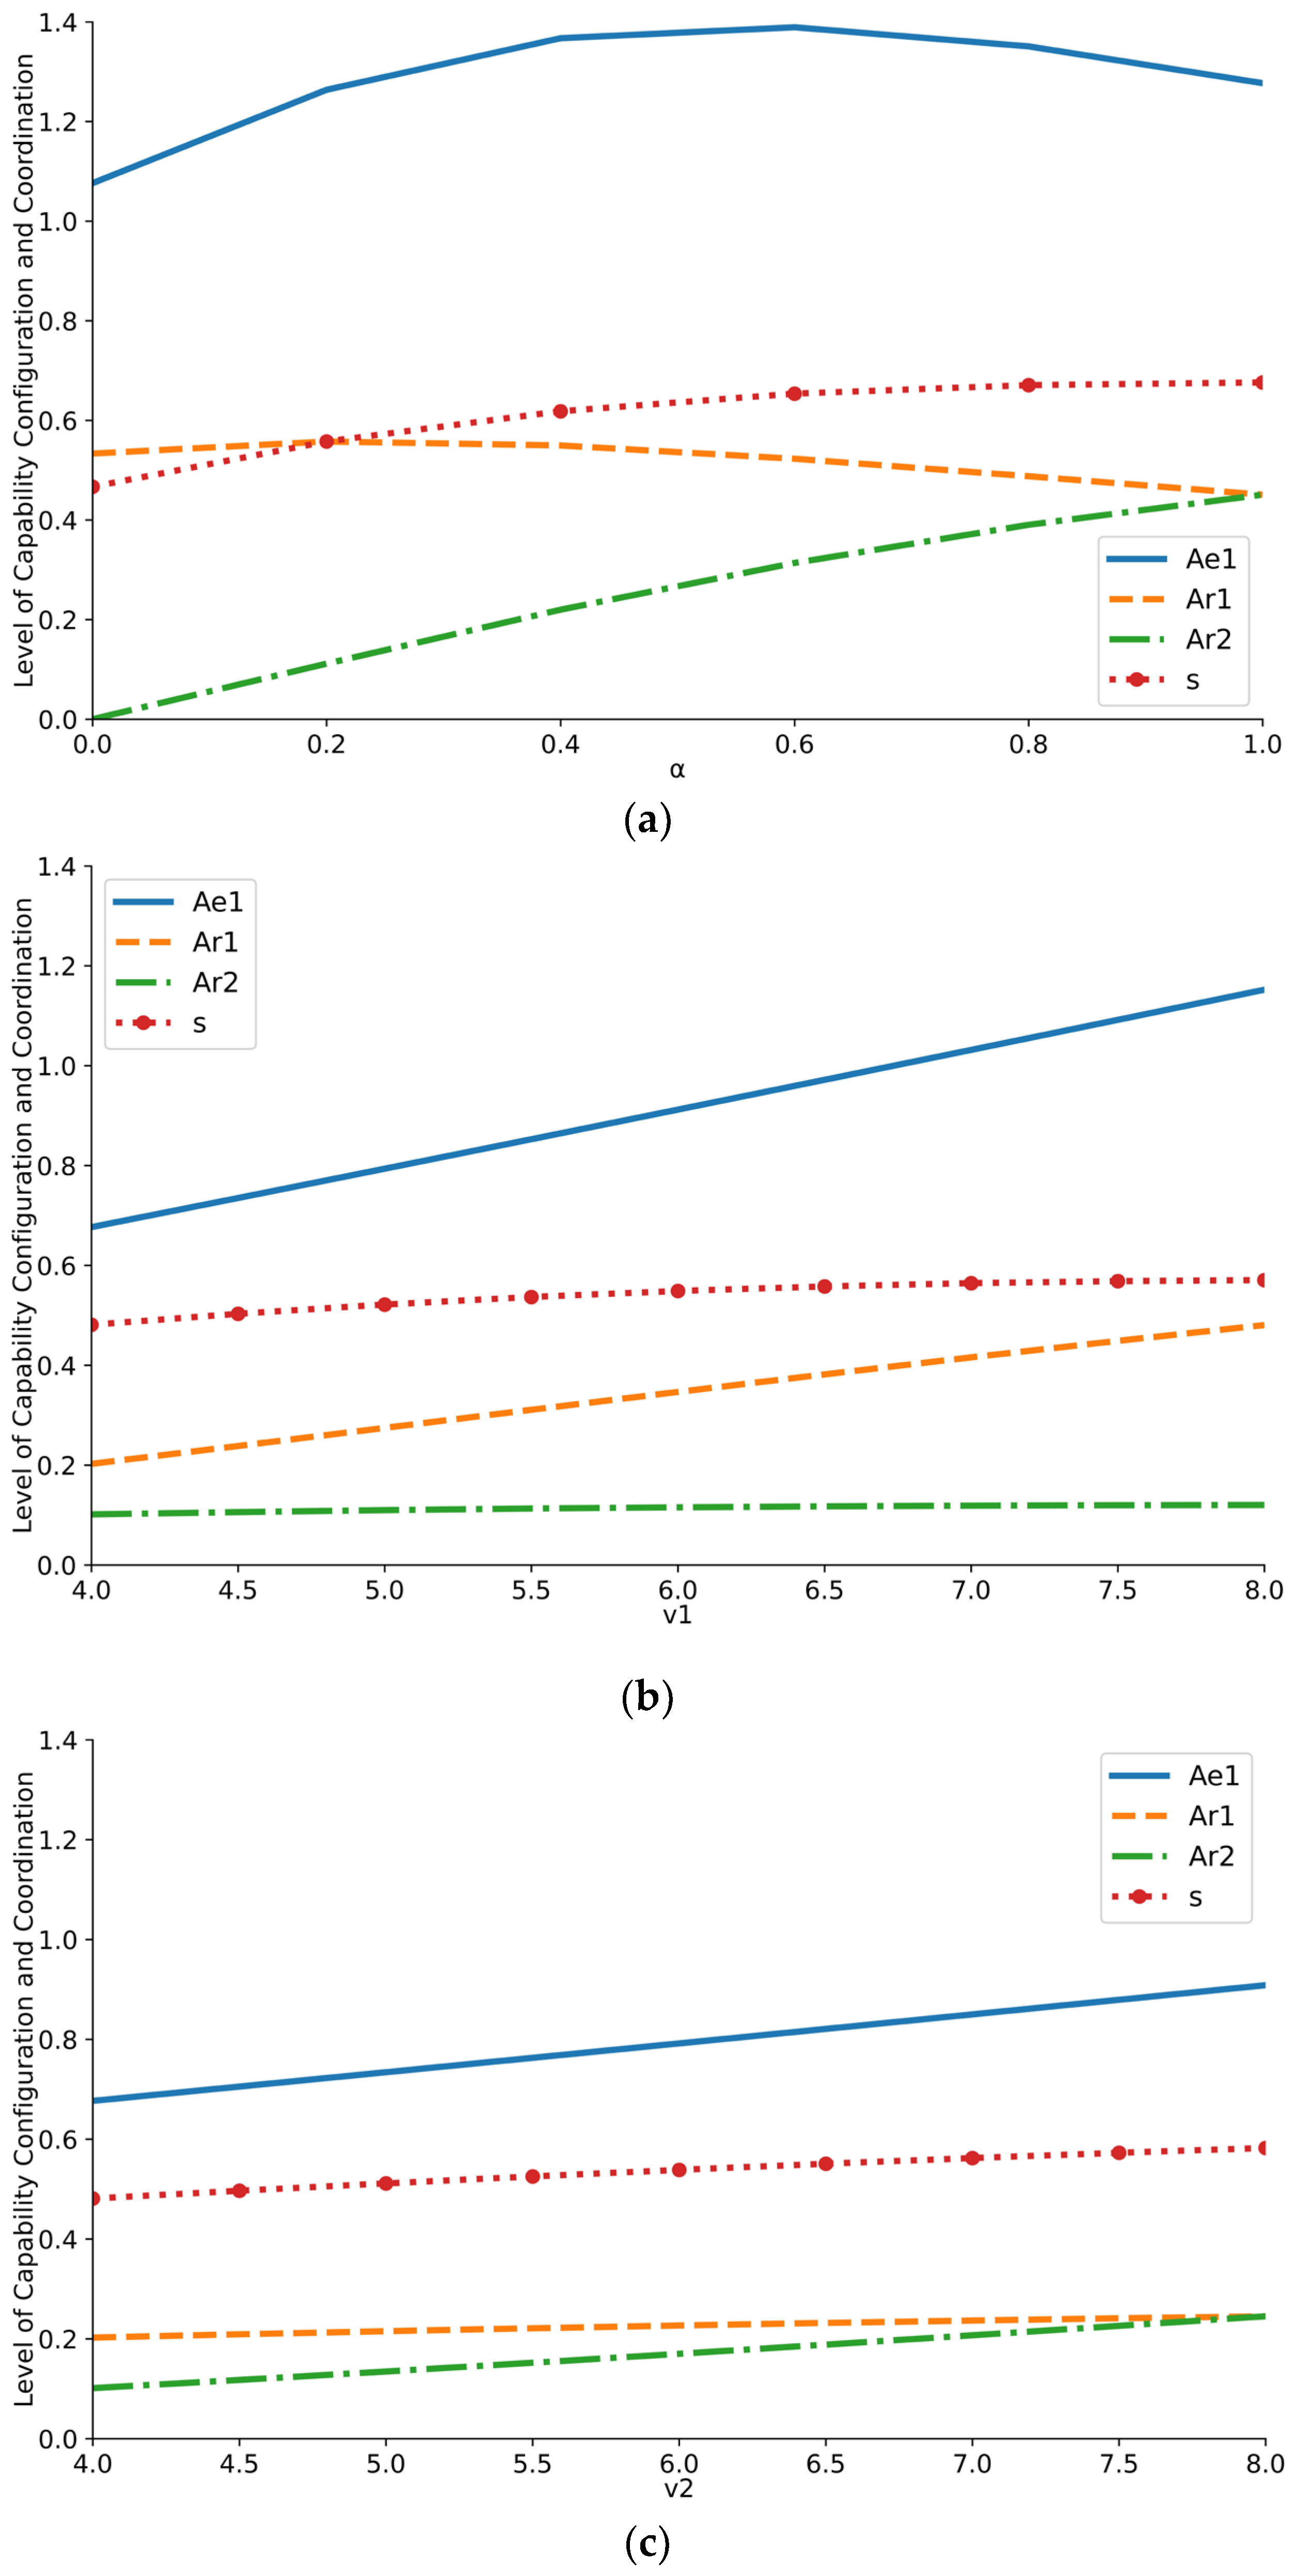
4.3. Sensitivity Analysis of the Green Construction Phase

Green construction practice encompasses three key components: developing the construction plan, executing the plan, and reconstructing the plan based on practical experience. Consequently, the tasks of both the regulator and the executor typically involve three stages: startup configuration, which drives continuous configuration; continuous configuration, which may lead to the refinement of startup configuration; and the iterative process of refining configurations. While existing research has explored the measurability of capabilities in green construction, there is a lack of precise references for capability input parameters across these different stages. Therefore, analyzing parameter values in green construction practices is essential to provide generalized conceptual insights.
During the startup configuration phase, the regulator establishes detailed governance procedures and guidelines. They expect the executor to fully commit their capability according to these procedures to ensure the smooth progress of green construction. At this stage, the cooperation process addresses all possible unforeseen circumstances and capability investments. The regulator builds long-term cooperation with the executor to shape a shared value orientation, thereby advancing the startup configuration. Consequently, fixed investments in this stage are substantial. Given that the initial plan cannot anticipate all potential unforeseen events, significant risks are transferred to the executor. Therefore, the variable cost coefficients, marginal values, and the regulator’s guidance intensity are relatively high at this stage. It is assumed that α = 0 , b 1 = 7 , b 2 = 0 , c 1 = 7 , c 2 = 0 , v 2 = 0 ; the risk aversion coefficient θ and external uncertainty ε 1 , ε 2 , ε 3 are both 1; and v 1 fluctuates at a low level (0 to 8). The variations in A r 1 , A r 2 , A e 1 , s during the startup configuration phase are illustrated in Figure 3.
As shown in Figure 3, the regulator’s investment in the startup configuration increased with the rise in marginal value brought by the executor. This increase started slowly and then accelerated. Meanwhile, A e 1 rose rapidly. The synergy coefficient between the regulator and the executor first increased quickly and then more slowly, reflecting a contraction as v 1 increased. At this stage, since continuous configuration was not involved, A r 2 remained at 0. Stakeholders in this stage set up a reasonable mechanism of capability interaction in the co-operation procedure to advance both parties to cooperate in the green construction process to manage the possible accidents. As the established procedures responded to the willingness of both parties, the capability configuration and the level of coordination showed an upward trend.
In the phase where the startup configuration drives the continuous configuration, the regulator is responsible for inspecting and evaluating the execution of the green construction according to the plan’s requirements. During this stage, the regulator provides ongoing guidance to the executor as per the plan. However, because a detailed plan was established, the level of guidance decreased as the execution performance improved, leading to a reduction in the variable cost coefficient. To achieve the expected green construction performance, the regulator continues to offer high levels of marginal value for the executor’s progress in green construction. In reality, green construction projects do not always meet the anticipated green targets, and the executor may not fully invest their capability. Assume 0 < α < 1 , b 1 = 7 , b 2 = 5 , c 1 = 7 , c 2 = 5 . The risk aversion coefficient θ and external uncertainty ε 1 , ε 2 , ε 3 were both set to 1. The marginal values v 1 and v 2 fluctuated at high levels (4 to 8). The regulator’s investments in the startup configuration and continuous configuration are illustrated in Figure 4.
Figure 4a shows that when α < 0.2 , the regulator tended to invest a higher level of capability in the startup configuration, with a slight increase over time. As the executor’s progress coefficient increased, the regulator gradually increased the configuration level, but it remained below the capability level promised in the cooperation procedure. When α = 1 , A r 1 = A r 2 , indicating that the regulator had aligned the capability configuration with the cooperation procedure in green construction. In practice, however, due to the stronger guidance from the regulator during the planning phase ( b 1 > b 2 ), the regulator bore a larger portion of the green construction configuration. A e 1 shows a trend of initially increasing and then decreasing, while maintaining a relatively high level. This decrease might have been due to the executor becoming more precise about the required configuration levels as α and A r 2 rose, leading to a reduction in redundant configurations. Additionally, during this phase, the coordination coefficient also showed a significant increase.
Since v 2 = 4 , the regulator places greater emphasis on the executor’s continuous configuration advancement. At this stage, regulators want to transfer possible risks in green construction beforehand. Figure 4b shows that as v 1 increased, A e 1 also rose significantly. Both A r 1 and A r 2 increased to varying degrees, with A r 1 showing a significantly larger increase than A r 2 . The coordination coefficient also rose. This indicates that an increase in v 1 leads the regulator to enhance the level of capability investment in the startup configuration, which significantly impacts the executor’s startup configuration advancement. However, the changes in A r 2 suggest that v 1 does not have a substantial effect on the continuous configuration, and the support A e 1 provides for continuous configuration is limited.
When v 1 = 4 , the regulator focused more on the executor’s continuous configuration advancement. The regulator was more concerned with feedback during practice than with developing a detailed green construction program. At this point, both parties relied on the common values shaped to develop a relatively flexible co-operation mechanism. Figure 4c shows that as v 2 increased, A r 1 , A r 2 experienced varying degrees of increase. However, the increase in A r 2 was relatively larger than that of A r 1 , although A r 2 remained at a relatively low level. At this point, A e 1 inherited the impact of changes in v 1 , but its rate of increase slowed down. A e 1 and v 2 exhibited nearly identical trends. The coordination coefficient showed a slight increase. This indicates that the increase in marginal value for the executor’s continuous configuration advancement encourages the regulator to invest more capability to support the green construction measures. Continuous feedback will prompt the regulator to enhance investments in the startup configuration, which in turn drives the executor’s investments in startup configuration advancement.
In the phase of continuous configuration reconstructing startup configuration, previous plans failed to effectively address unforeseen issues in green construction, necessitating the redesign of capability configuration, advancement strategies, and risk-sharing mechanisms. As the effectiveness of the previous plan diminishes, the long-term cooperation strategy drives the executor to invest more capability than originally allocated for startup configuration. The regulator focuses more on guiding and supporting the executor in green construction. Assuming α > 1 , b 1 = 5 , b 2 = 7 , c 1 = 5 , c 2 = 7 , v 1 = 8 , v 2 = 8 , and with the risk aversion coefficient θ and external uncertainty factor ε 1 , ε 2 , ε 3 set to 1, the variation was as depicted in Figure 5. Figure 5 shows that as the executor’s advancement coefficient increased, the regulator’s investment in startup configuration and continuous configuration became increasingly bifurcated. This bifurcation occurred because the previous startup configuration became less effective, necessitating increased A r 2 to handle unforeseen changes, while A r 1 gradually decreased to a certain level. This level may represent the minimum necessary investment to maintain green construction operations. Similarly, A e 1 exhibited a trend similar to A r 1 , showing a decline. During this phase, the coordination coefficient experienced a slight decrease.

5. Discussion

Distinct from dynamic capabilities, this study, grounded in the perspective that ordinary capabilities are measurable [45], introduces critical insights into capability configuration. The model proposed in this study bridges the gap in research on “capability” in engineering management and advances its knowledge base, taking into account previous research on capability only in terms of conceptual insights and unilateral capability scenarios. Given that in green construction, stakeholders are bound not only by contractual relationships but also by governance relationships based on contractual requirements, this study categorizes the primary stakeholders into regulators and executors. The utility model was pioneered to be developed based on the post-positivist methodology to analyze the optimal capability configuration. It also reveals the interaction of the capabilities and the coordination level at different stages of green construction through static and sensitivity analyses, which provide a new perspective and theoretical basis in green construction. Sensitivity analysis results indicate that, under the proposed model, the coordination coefficient between regulators and executors continuously increases and eventually stabilizes at a higher level. This finding, along with static comparative analysis, provides key insights for this study.
There is a substitution mechanism between the regulator’s investments in startup configuration and continuous configuration, as well as between startup configuration and continuous configuration of the executor in green construction. According to Equations (12) and (13), when s increases, A r 1 and A r 2 decrease; conversely, when s decreases, A r 1 and A r 2 increase. This indicates that the substitution mechanism between the regulator’s capability configuration and the coordination coefficient jointly impacts the executor’s progress in green construction. As the coordination coefficient increases and provides greater support to the executor, the regulator can reduce investments in startup configuration and continuous configuration. Conversely, when the coordination coefficient decreases, the regulator needs to increase investments in startup configuration and continuous configuration. From Equation (14), it is evident that when both A r 1 and A r 2 are 0, there is an upper limit to s , which is b 1 ( v 1 + v 2 α ) + b 2 ( α v 1 + α 2 v 2 ) ( c 1 + c 2 α 2 ) θ σ 3 2 + ( b 1 + b 2 α ) 2 . This indicates that as the green construction process progresses, the level of coordination between stakeholders cannot be increased further.
Figure 4 and Figure 5 show that although A r 1 , A r 2 , A e 1 remain at a high level, the coordination coefficient does not reach a high level. This is due to the limitations of the capabilities allocated despite the detailed plans and adequate capacity levels established between the regulator and the executor. These limitations, particularly in the context of risks associated with green construction, prevent achieving and maintaining high levels of coordination. Ultimately, it remains crucial for regulators to constrain executors to promote coordinated governance. This key finding explains the persistent challenge of achieving efficient coordination in green construction, as noted in previous research [1]. Coordination between regulators and executors in green construction has an upper bound and unsustainable characteristics, which can be supported within certain limits by the regulator’s capability investment. As shown in Figure 4 and Figure 5, s is positively related to A r 2 . In Figure 1, s also increases with A r 1 . Thus, the regulator’s startup configuration and continuous configuration are core drivers for maintaining effective governance in green construction and remain irreplaceable. From Equations (12), (13), (16) and (17), A r 1 and A r 2 are decreasing functions of each other, with A r 1 , A r 2 0 . Therefore, there is a mutual constraint between the regulator’s startup configuration and continuous configuration. Figure 4a,b illustrate this substitutive relationship. In green construction, regulators should adjust startup configuration and continuous configuration based on the executor’s progress to avoid a decrease in utility. This is especially important in environments subject to significant external influences.
The capability configuration of the regulator and the coordination coefficient are negatively correlated with external uncertainty factors, variable cost coefficients, and the risk aversion coefficient of the executor. Additionally, they are negatively correlated with guidance intensity. According to the monotonicity analysis from Equations (12)–(14), A r 1 and A r 2 are decreasing functions of uncertainty factors, variable costs, and the executor’s risk aversion coefficient, while the regulator’s capability investment is a decreasing function of guidance intensity. This indicates the following: (1) When uncertainty factors decrease, the executor’s startup configuration and continuous configuration efforts become more perceptible. Enhancing startup configuration and continuous configuration can effectively constrain the executor’s behavior, and the coordination coefficient improves due to the transparency of the executor’s activities in green construction. (2) When fixed investments are high but variable costs are low, the regulator allocates necessary capabilities to encourage the executor’s ongoing efforts. As green construction progresses, the executor, having made significant early investments, will not engage in greenwashing due to reputation concerns and sunk cost effects. Considering the executor’s subjective initiative in advancing green construction, the regulator may reduce its investment in startup configuration and continuous configuration. (3) A higher risk aversion coefficient corresponds to greater fear of risks associated with green construction by the executor. Therefore, the regulator should adopt a strategy of advancing continuous configuration to reconstruct startup configuration, assessing whether the executor will continue investing in green construction capabilities in the next phase. The coordination coefficient also decreases due to the executor’s risk concerns, making it difficult to supply capabilities in the short term. As the executor advances both startup configuration and continuous configuration in green construction, they will continue to receive adequate support from the regulator. The level of investment by the executor in both startup configuration and continuous configuration is negatively correlated with the variable cost coefficient and the risk aversion coefficient.
The monotonicity analysis from Equation (15) shows that the executor’s capability investment level is a decreasing function of the variable cost coefficient and the risk aversion coefficient. As risks or variable costs increase, the executor’s capability investment decreases. Additionally, the executor’s investment is influenced by the regulator’s capability configuration and the coordination coefficient. Therefore, the executor and the regulator need to establish governance mechanisms in green construction, advancing reforms in green construction management systems, including construction standards, green materials, and collaboration rules [46]. This helps avoid reduced enthusiasm from the executor due to high variable costs. In fact, as previously analyzed, a dilemma may arise: when variable costs are low, the executor actively invests in green construction capabilities and achieves coordinated governance with the regulator; however, when variable costs are high, the executor’s enthusiasm diminishes, leading the regulator to reduce startup configuration and continuous configuration, thereby decreasing coordination support. Ultimately, the executor will remain in a low level of advancement [47].
It is noteworthy that, according to Equations (15) and (16), there exists a ratio, that is, A e 1 A r 1 = ( v 1 + v 2 α ) [ v 2 2 α 2 ε 1 2 ε 2 2 ε 3 2 + ( b 1 + b 2 α ) 2 ε 1 2 ε 2 2 ] ( c 1 + c 2 α 2 ) . At this point, when stakeholders such as regulators and executors are involved, differences in configuration levels during startup configuration and its advancement may arise, for instance, between supervisors and general contractors. This discrepancy may be attributed to differences in motivation and cognitive load due to their distinct roles. Executors, who are responsible for actual green construction work and simultaneously handling multiple tasks, tend to invest more capability [33].

6. Conclusions

This study views green construction projects as a continuous process of planning and feedback, emphasizing that stakeholder relationships extend beyond contractual to governance interactions. Consequently, stakeholders are categorized into regulators and executors, leading to the development of a governance model that explores the interplay between the intensity of regulators’ startup and continuous configurations and the coordination coefficient. The study defines the impact of regulators’ capability configuration levels, executors’ capability advancement levels, and coordination coefficients, creating a capability configuration utility model for green construction. This study is the first to discuss the interaction of stakeholders’ capability configurations in the context of governance relationships, and the application of the model can strengthen the resilience of the whole process of green construction and ensure that a higher level of coordination is achieved. The findings are as follows: (1) In green construction, there exists a substitution mechanism between the regulator’s configuration level and the coordination coefficient. However, the executor’s coordination with the regulator exhibits unsustainability. Therefore, the regulator’s startup and continuous configurations should be maintained over the long term and remain non-exit. (2) Fewer uncertainties, reduced variable costs, and controlled risk aversion facilitate the maximization of green construction governance benefits by the regulator. Increased guiding intensity helps the regulator to optimize the allocation of startup and continuous configurations, thereby alleviating pressure. (3) Variable cost coefficients and risk aversion coefficients negatively impact the executor’s advancement in green construction, leading to a dual dilemma of low-level investment and risk aversion. (4) The startup configuration of the regulator is significantly influenced, allowing the executor to enhance startup configuration efforts and establish a long-term cooperation mechanism to gain higher startup configuration support from the regulator. (5) The coordination coefficient decreases with marginal value, indicating that as green construction progresses, coordination between the regulator and executor will gradually diminish. Therefore, in green construction, regulators should strengthen long-term capability configuration and guidance, as well as establish a dynamic adjustment mechanism. This will help to ensure that the formulated cooperation process can adapt to the changes in green construction, adjust the capability configuration and advancement in a timely manner, and maintain close communication; in addition, the cooperation pattern should be deepened to reduce the variable costs of the executors, control risk avoidance, and strengthen the trust between both parties. This will help reduce the concerns of executors when facing uncertainties and risks in green construction, establish a long-term cooperation model by shaping common values and visions, stimulate their motivation, and jointly enhance the level of competence in the field of green construction.

Author Contributions

Conceptualization, Z.Z. (Zhizhe Zheng) and Y.S.; methodology, Z.Z. (Zhizhe Zheng); software, J.L.; validation, J.L. and Z.Z. (Zhizhe Zheng); formal analysis, Z.Z. (Zhichao Zhou); investigation, Z.Z. (Zhichao Zhou); resources, Y.S.; data curation, J.L.; writing—original draft preparation, Z.Z. (Zhizhe Zheng); writing—review and editing, Z.Z. (Zhizhe Zheng); visualization, Y.S.; supervision, Y.S., Z.Z. (Zhichao Zhou) and X.W.; project administration, Y.S.; funding acquisition, Y.S. All authors have read and agreed to the published version of the manuscript.

Funding

This research was funded by [National Key Research and Development Program of China] grant number [2021YFF0602002], [Philosophy and Social Sciences Project in Heilongjiang Province] grant number [21GLB063], [Key Science and Technology Projects in the Transport Sector] grant number [2019-ZD5-028].

Data Availability Statement

Dataset available on request from the authors.

Conflicts of Interest

The authors declare no conflict of interest.

References

  1. Gao, X.; Zeng, S.; Zeng, R.; Shi, J.J.; Song, R. Multiple-stakeholders’ game and decision-making behaviors in green management of megaprojects. Comput. Ind. Eng. 2022, 171, 108392. [Google Scholar] [CrossRef]
  2. Liu, Q.L.; Qiu, Z.X.; Li, M.; Shang, J.P.; Niu, W.C. Evaluation and empirical research on green mine construction in coal industry based on the AHP-SPA model. Resour. Policy 2023, 82, 103503. [Google Scholar] [CrossRef]
  3. Fitriani, H.; Ajayi, S. Investigation of requisite measures for enhancing sustainable construction practices in Indonesia. Eng. Constr. Archit. Manag. 2023, 30, 2602–2620. [Google Scholar] [CrossRef]
  4. Shurrab, J.; Hussain, M.; Khan, M. Green and sustainable practices in the construction industry. Eng. Constr. Archit. Manag. 2019, 26, 1063–1086. [Google Scholar] [CrossRef]
  5. He, W.; Zhang, Y.; Li, S.; Li, W.; Wang, Z.; Liu, P.; Zhang, L.; Kong, D. Reducing betrayal behavior in green building construction: A quantum game approach. J. Clean. Prod. 2024, 463, 142760. [Google Scholar] [CrossRef]
  6. Shang, H.; Chen, R.; Li, Z. Dynamic sustainability capabilities and corporate sustainability performance: The mediating effect of resource management capabilities. Sustain. Dev. 2019, 28, 595–612. [Google Scholar] [CrossRef]
  7. Chen, Y.; Wang, G.; He, Y.; Zhang, H. Greenwashing behaviors in construction projects: There is an elephant in the room! Environ. Sci. Pollut. Res. 2022, 29, 64597–64621. [Google Scholar] [CrossRef]
  8. Pourvaziri, M.; Mahmoudkelayeh, S.; Kamranfar, S.; Fathollahi-Fard, A.M.; Gheibi, M.; Kumar, A. Barriers to green procurement of the Iranian construction industry: An interpretive structural modeling approach. Int. J. Environ. Sci. Technol. 2024, 21, 3599–3616. [Google Scholar] [CrossRef]
  9. Onubi, H.O.; Yusof, N.; Hassan, A.S. Green construction practices: Ensuring client satisfaction through health and safety performance. Environ. Sci. Pollut. Res. 2022, 29, 5431–5444. [Google Scholar] [CrossRef] [PubMed]
  10. Yu, C.; Wang, T.; Gu, X. Collective reputation cognition, network competence and enterprise innovation performance. Manag. Decis. 2022, 60, 567–588. [Google Scholar] [CrossRef]
  11. Aka, K.G.; Labelle, F. The Collaborative Process of Sustainable Innovations under the Lens of Actor–Network Theory. Sustainability 2021, 13, 10756. [Google Scholar] [CrossRef]
  12. Zhang, Q.; Oo, B.L.; Lim, B.T.H. Linking corporate social responsibility (CSR) practices and organizational performance in the construction industry: A resource collaboration network. Resour. Conserv. Recycl. 2022, 179, 106113. [Google Scholar] [CrossRef]
  13. He, Q.; Wang, Z.; Wang, G.; Zuo, J.; Wu, G.; Liu, B. To be green or not to be: How environmental regulations shape contractor greenwashing behaviors in construction projects. Sustain. Cities Soc. 2020, 63, 102462. [Google Scholar] [CrossRef]
  14. Shi, Q.; Chen, X.; Xiao, C.; Han, Y. Network Perspective in Megaproject Management: A Systematic Review. J. Constr. Eng. Manag. 2022, 148, 03122002. [Google Scholar] [CrossRef]
  15. Zhang, J.; Ouyang, Y.; Philbin, S.P.; Zhao, X.; Ballesteros-Pérez, P.; Li, H. Green dynamic capability of construction enterprises: Role of the business model and green production. Corp. Soc. Responsib. Environ. Manag. 2020, 27, 2920–2940. [Google Scholar] [CrossRef]
  16. Meng, Q.; Liu, Y.; Li, Z.; Wu, C. Dynamic reward and penalty strategies of green building construction incentive: An evolutionary game theory-based analysis. Environ. Sci. Pollut. Res. 2021, 28, 44902–44915. [Google Scholar] [CrossRef] [PubMed]
  17. Qin, X.; Wang, Y.; Cui, S.; Liu, S.; Liu, S.; Wangari, V.W. Post-assessment of the eco-environmental impact of highway construction—A case study of Changbai Mountain Ring Road. Environ. Impact Assess. Rev. 2023, 98, 106963. [Google Scholar] [CrossRef]
  18. Xue, J.; Shen, G.Q.; Yang, R.J.; Zafar, I.; Ekanayake, E.M.A.C.; Lin, X.; Darko, A. Influence of formal and informal stakeholder relationship on megaproject performance: A case of China. Eng. Constr. Archit. Manag. 2020, 27, 1505–1531. [Google Scholar] [CrossRef]
  19. Derakhshan, R.; Turner, R.; Mancini, M. Project governance and stakeholders: A literature review. Int. J. Proj. Manag. 2019, 37, 98–116. [Google Scholar] [CrossRef]
  20. Shen, Z.Z.; Min, H.; Wang, L.B.; Zhang, Y.C. Evaluation of Carbon Neutrality Capacity of Regional Construction Industry Based on the Entropy Weight TOPSIS Model. Buildings 2024, 14, 2363. [Google Scholar] [CrossRef]
  21. Cao, L.F.; Cong, W.Y.; Su, Y.K.; Zheng, Z.Z. Research on the Production Capacity Evaluation of Prefabricated Component Manufacturing Enterprises. Buildings 2024, 14, 1816. [Google Scholar] [CrossRef]
  22. Luo, W.; Sandanayake, M.; Hou, L.; Tan, Y.; Zhang, G. A systematic review of green construction research using scientometrics methods. J. Clean. Prod. 2022, 366, 132710. [Google Scholar] [CrossRef]
  23. Gu, J.; Guo, F.; Peng, X.; Wang, B. Green and Sustainable Construction Industry: A Systematic Literature Review of the Contractor’s Green Construction Capability. Buildings 2023, 13, 470. [Google Scholar] [CrossRef]
  24. Komurlu, R.; Ceceloglu, D.K.; Arditi, D. Exploring the Barriers to Managing Green Building Construction Projects and Proposed Solutions. Sustainability 2024, 16, 5374. [Google Scholar] [CrossRef]
  25. Sharghi, M.; Jeong, H. The Potential of Recycling and Reusing Waste Materials in Underground Construction: A Review of Sustainable Practices and Challenges. Sustainability 2024, 16, 4889. [Google Scholar] [CrossRef]
  26. Wu, Y.N.; Al-duais, Z.A.M.; Zhu, X.Q.; Lin, S.Y. Digital economy’s role in shaping carbon emissions in the construction field: Insights from Chinese cities. J. Environ. Manag. 2024, 365, 121548. [Google Scholar] [CrossRef] [PubMed]
  27. Zhang, H.; Li, X.W.; Ding, Z.Y. Optimal supply chain performance: Risk aversion to green innovation. Manag. Decis. 2024. [Google Scholar] [CrossRef]
  28. Wang, Y.; Chong, D.; Liu, X. Evaluating the Critical Barriers to Green Construction Technologies Adoption in China. Sustainability 2021, 13, 6510. [Google Scholar] [CrossRef]
  29. Haniff, A.P.; Galloway, L. Modeling strategic alignment in project networks. Int. J. Proj. Manag. 2022, 40, 517–530. [Google Scholar] [CrossRef]
  30. Han, W.; Yin, Y. Influence of Project Governance on Opportunistic Behavior: Taking a Dynamic Perspective. Buildings 2022, 12, 1659. [Google Scholar] [CrossRef]
  31. Alattyih, W.; Haider, H.; Boussabaine, H. Risk Factors Impacting the Project Value Created by Green Buildings in Saudi Arabia. Appl. Sci. 2020, 10, 7388. [Google Scholar] [CrossRef]
  32. Fu, Y.; Dong, N.; Ge, Q.; Xiong, F.; Gong, C. Driving-paths of green buildings industry (GBI) from stakeholders’ green behavior based on the network analysis. J. Clean. Prod. 2020, 273, 122883. [Google Scholar] [CrossRef]
  33. Wang, C.; Loo, S.C.; Yap, J.B.H.; Abdul-Rahman, H. Novel Capability-Based Risk Assessment Calculator for Construction Contractors Venturing Overseas. J. Constr. Eng. Manag. 2019, 145, 04019059. [Google Scholar] [CrossRef]
  34. Chen, C.H. Development of green business strategies through green dynamic capabilities and environmental regulation: Empirical evidence from the construction sector. J. Clean. Prod. 2024, 438, 140826. [Google Scholar] [CrossRef]
  35. Ninan, J.; Sergeeva, N. Mobilizing Megaproject Narratives for External Stakeholders: A Study of Narrative Instruments and Processes. Proj. Manag. J. 2022, 53, 520–540. [Google Scholar] [CrossRef]
  36. Gunduz, M.; Elsherbeny, H.A. Critical assessment of construction contract administration using fuzzy structural equation modeling. Eng. Constr. Archit. Manag. 2020, 27, 1233–1255. [Google Scholar] [CrossRef]
  37. Li, Y.; Lu, Y.; Cui, Q.; Han, Y. Organizational Behavior in Megaprojects: Integrative Review and Directions for Future Research. J. Manag. Eng. 2019, 35, 04019009. [Google Scholar] [CrossRef]
  38. Gondia, A.; Ezzeldin, M.; El-Dakhakhni, W. Dynamic networks for resilience-driven management of infrastructure projects. Autom. Constr. 2022, 136, 104149. [Google Scholar] [CrossRef]
  39. Xie, L.; Xu, T.; Han, T.; Xia, B.; Chen, Q.; Skitmore, M. Influence of Institutional Pressure on Megaproject Social Responsibility Behavior. J. Civ. Eng. Manag. 2022, 28, 177–195. [Google Scholar] [CrossRef]
  40. Zeng, X.C.; Li, S.C.; Yin, S.; Xing, Z.Y. How Does the Government Promote the Collaborative Innovation of Green Building Projects? An Evolutionary Game Perspective. Buildings 2022, 12, 1179. [Google Scholar] [CrossRef]
  41. Wang, Y.C.; Guo, J.Y.; Geng, X.X.; Li, W. Research on Coupling Effect Measurement and Coupling Risk Simulation of Green Building Construction Safety Risk Factors. Buildings 2024, 14, 2195. [Google Scholar] [CrossRef]
  42. Tsukada, S. Hypothesis testing for mean vector and covariance matrix of multi-populations under a two-step monotone incomplete sample in large sample and dimension. J. Multivar. Anal. 2024, 202, 105290. [Google Scholar] [CrossRef]
  43. Abrudan, D.B.; Rafi, N.; Daianu, D.C.; Kalyar, M.N. Linking green intellectual capital with green innovation: Examining the roles of green dynamic capabilities and ‘motivation to achieve legitimacy’. Agric. Econ. (Zeměd. Ekon.) 2022, 68, 250–258. [Google Scholar] [CrossRef]
  44. Hu, J.; Zhang, D.L.; Xu, H.F.; Zhang, S.N. Distributional utility preference robust optimization models in multi-attribute decision making. Math. Program. 2024, 1–47. [Google Scholar] [CrossRef]
  45. Ashill, N.; Williams, P.; Khan, M.S.; Naumann, E. Dynamic and Ordinary Capabilities: A Project Management Perspective. IEEE Trans. Eng. Manag. 2022, 69, 2173–2186. [Google Scholar] [CrossRef]
  46. Wang, L.Z.; Wang, X.N.; Liu, X.M. Project Governance and Governance of Interorganizational Project Networks: Toward Understanding Their Relationships and Future Research Agenda. Proj. Manag. J. 2024. [Google Scholar] [CrossRef]
  47. Li, J.; Wu, Q.; Wang, C.C.; Du, H.; Sun, J. Triggering factors of construction waste reduction behavior: Evidence from contractors in Wuhan, China. J. Clean. Prod. 2022, 337, 130396. [Google Scholar] [CrossRef]
Figure 1. Dynamic process of capability configuration.
Buildings 14 03135 g001
Figure 2. Flow chart of the research procedure.
Buildings 14 03135 g002
Figure 3. A r 1 , A r 2 , A e 1 , s with changes in v 1 .
Buildings 14 03135 g003
Figure 4. (a) A r 1 , A r 2 , A e 1 , s with changes in α ( v 1 = v 2 = 8 ); (b) A r 1 , A r 2 , A e 1 , s with changes in v 1 ( α = 0.5 , v 2 = 4 ); (c) A r 1 , A r 2 , A e 1 , s with changes in v 2 ( α = 0.5 , v 1 = 4 ).
Buildings 14 03135 g004
Figure 5. A r 1 , A r 2 , A e 1 , s with changes in α ( α > 1 ).
Buildings 14 03135 g005
Table 1. Capability responses to promote green construction success.
Research TopicsResponses to Promote Green Construction Success
Capability (%)Others (%)
Systematic assessment of elements to overcome barriers to green construction [22]75.025.0
Drivers of green construction capability implementation [23]100.00
Measures to overcome barriers to green construction management [24]90.010.0
Research on the standardisation of green construction [25]67.033.0
Management of carbon emissions during the construction phase [26]80.020.0
How to drive green construction practices [9]100.00
Addressing risks in green construction [27]88.012.0
Addressing barriers to the adoption of green construction technologies [28]67.033.0
Table 2. The parameters of the model and their description.
ParameterDescription
A e 1 The capability input level of the executor in advancing startup configuration.
A e 2 The capability input level of the executor in advancing continuous configuration.
α The progressive coefficient of the executor in advancing startup configuration and continuous configuration.
v 1 The marginal value obtained by the executor during the advancement of startup configuration.
v 2 The marginal value obtained by the executor during the advancement of continuous configuration.
o 1 , o 2 The construction plan and the exogenous variables affecting the executor’s losses in green construction.
ε 1 , ε 2 External uncertainty factors.
φ The output benefit of the executor in green construction. In which, φ 1 , φ 2 are the benefit functions for advancing startup configuration and continuous configuration, respectively.
b 1 , b 2 Strength of regulators’ guidance to implementers in developing programmes and green construction, respectively.
o 3 Random errors in the guidance process.
ε 3 External uncertainty factors in random errors.
N The dynamic guidance support that the executor receives in green construction.
s The synergy coefficient.
θ The risk aversion coefficient.
g The benefits obtained by the executor.
π Utility of the capability of executors.
f 1 and f 2 The fixed inputs for advancing startup configuration and continuous configuration, respectively.
c 1 and c 2 The variable cost coefficients for advancing startup configuration and continuous configuration, respectively.
C ( A e ) The input costs of executors.
R ( g ) The risk cost for the executor.
C ( b ) The cost of supervision and guidance borne by the regulators.
m 1 and m 2 The average costs for establishing cooperative processes and for guiding and supervising in green construction, respectively.
R 1 and R 2 The fixed incentive rewards provided by the regulator to the executor.
A r 1 and A r 2 The capabilities invested by the regulator in startup configuration and continuous configuration, respectively.
w The benefits obtained by the executor in green construction.
C E ( g ) The expected benefit of executors.
G Benefits gained by regulators.
Disclaimer/Publisher’s Note: The statements, opinions and data contained in all publications are solely those of the individual author(s) and contributor(s) and not of MDPI and/or the editor(s). MDPI and/or the editor(s) disclaim responsibility for any injury to people or property resulting from any ideas, methods, instructions or products referred to in the content.

