Abstract
In practical engineering, a shed-tunnel structure often encounters repeated impacts from rockfall during its whole service life; therefore, this research focuses on exploring the dynamic response characteristics of shed-tunnel structures under repeated impacts from rockfall with a numerical method. First of all, based on a model test of a shed tunnel under rockfall impacts as a reference, an FEM (finite element method)-SPH (Smoothed Particle Hydrodynamics) coupled numerical calculation model is established based on the ANSYS/LS-DYNA finite element code. Numerical simulation of the dynamic response of the shed-tunnel structure under rockfall impacts is realized, and the rationality of the model is verified. Then, with this model and the full restart technology of the LS-DYNA code, the effects of four factors, e.g., rockfall mass, rockfall impact velocity, rockfall impact angle and rockfall shape, on the impact force and impact depth of the buffer layer, the maximum plastic strain and axial force of the rebar, the shed roof’s vertical displacement and plastic strain of the shed tunnel are studied. The results show that the impact force, impact depth, roof displacement and plastic strain of the shed tunnel are positively correlated with the rockfall mass, velocity and angle under multiple rockfall impacts. The impact force, roof displacement and plastic strain of the shed-tunnel structure generated by the impact of rockfall consisting of cuboids are all greater than those under spherical rockfall, and the impact depth generated by the impact of spherical rockfall is greater than that of rockfall consisting of cuboids. For rockfall consisting of cuboids, the impact depth, roof displacement and plastic strain are negatively correlated with the contact area. Under repeated rockfall impacts, the peak impact force usually increases first and then tends to be stable.
1. Introduction
Rockfall in mountainous areas is the third most prevalent type of geological disaster after landslides and debris flow [1,2]. Because of its high frequency of occurrence and the strong randomness of its movement characteristics, accurate predictions of rockfall’s time of occurrence, movement trajectory and damage to protective structures are very difficult [3,4,5,6]. Therefore, protective structures such as rockfall walls, flexible nets and shed tunnels are often used in practical engineering to protect roads and buildings [7,8]. Among these, shed-tunnel structures have been widely used because of their good rockfall impact resistance, limited damage to natural mountains and simple maintenance [9]. Therefore, the dynamic response of shed-tunnel structures under rockfall impacts has attracted extensive attention from domestic and international scholars and has been studied deeply according to three aspects, e.g., model and field tests, theoretical analyses and numerical simulations.
In the early stage, the research mainly focused on common shed tunnels, which consist of two parts: the reinforced concrete main structures and the cushion material on the top, with the latter playing a vital role in mitigating the impact force of rockfall [10,11]. Therefore, most of the research has concentrated on the effect of the properties of the cushion material, such as its type and depth, on the dynamic response of the shed tunnel. Kawahara and Muro [12] studied the effect of the dry density and thickness of sand cushion on the pressure of the rockfall impact. With tests and numerical simulations, Sun et al. [13] found that the tire cushion layer could effectively reduce the peak acceleration and the maximum impact force. Zhao et al. [14,15] proposed a new cushion layer composed of a foam material (expanded polystyrene (EPS) or expandable polyethylene (EPE)) and granular material (soil or sand), and then large-scale rockfall impact experiments were carried out on a reinforced concrete shed tunnel with three types of cushions: sand, sand–EPS, and sand–EPE. With model tests and numerical simulations, Shen et al. [16] studied the effect of the soil particle size on the efficiency of the cushion buffer in resisting the force of rockfall impacts. Wu et al. [17] conducted a rockfall impact test to study the relationship between the impact force on the reinforced concrete slab induced by rockfall and the cushion’s thickness. Zhao et al. [18] conducted a series of laboratory tests and numerical investigations on the buffer performance of geofoam under the impact of different rock shapes and obtained a series of useful conclusions. However, because of the difficulty constructing it and the high cost of poor-quality bedrock, reinforced concrete has gradually been replaced by a new type of material for flexible shed tunnels, which consists of flexible nets and vaulted steel structures [19]. Shi et al. [20] proposed a new concept for a flexible shed tunnel and conducted an impact experiment on a 1:1 prototype to evaluate its performance. Wang et al. [21] conducted full-scale tests on a flexible three-module shed tunnel using a rockfall kinetic energy ranging from 100 to 250 kJ to study its mechanical characteristics and put forward useful suggestions for its optimal design.
Theoretical studies on the dynamic response of shed tunnels under rockfall impacts have also been conducted. Olsson et al. [22] proposed a dynamic response model for an anisotropic composite plate under the impact of spheres with a low mass based on Hertzian contact theory. On this basis, Wang et al. [23] studied the elastoplastic dynamic response mechanism of a reinforced concrete shed tunnel under rockfall. In view of viscoelastic contact theory, Chen et al. [24] proposed a rockfall impact mechanics model, and a general solution form for the time–history law for rockfall impact loads was obtained.
Finally, many researchers have studied the dynamic response of shed tunnels with numerical simulations. Shen et al. [25] studied the effect of the rockfall shape on the response in terms of the impact of rockfall on a soil buffer layer with a discrete element method and found that the penetration depth decreased linearly when increasing the degree of sphericity of the rockfall. Ouyang et al. [26] proposed a new shed-tunnel absorption cushion composed of geogrid-reinforced soil and EPS and studied its dynamic mechanical behavior under rockfall impacts with the finite element method. In all, the prevalent numerical methods used to simulate rockfall impacts acting on shed-tunnel structures are continuous and discontinuous methods. Although they have high computational efficiency in calculating a structure’s dynamic response, continuous methods such as the FEM will have errors because of the occurrence of distorted meshes in the sand or soil buffer layer, induced by the repeated impacts of rockfall. Therefore, early in 1977, Lucy [27] and Gingold et al. [28], respectively, proposed a Lagrangian meshless particle method, namely Smoothed Particle Hydrodynamics (SPHs), which could effectively avoid the mesh distortion caused by local large deformation of the material. However, its computational efficiency is much lower than that of the finite element method (FEM). Therefore, in order to make full use of the advantages of these two methods, many researchers have proposed a coupled FEM-SPH method, which has been successfully used in the field of material failure simulations, such as for blasting and impacts, in recent years [29,30,31,32]. For instance, using a coupled SPH-FEM method, Zhong et al. [29] studied the shed-tunnel mechanical behavior under rockfall impacts from three aspects, e.g., the rockfall impact force, the inertia effect coefficient and the structural damage evaluation. Liu et al. [30] used an SPH-FEM method to find the optimal thickness combination of the two-layered absorbing system combined with an expanded polystyrene (EPS) cushion and a soil layer in a steel shed under dynamic loadings.
From the research status above, it can be found that the existing studies on the shed-tunnel structure’s dynamic response mainly focus on the rockfall single impact on the shed-tunnel structure, and few scholars study the cumulative damage caused by the repeated impacts of rockfall on a shed-tunnel structure. However, the shed-tunnel structure will inevitably encounter the repeated impacts of rockfall during its whole service life. Therefore, this study mainly focuses on a shed-tunnel structure’s dynamic response to repeated impacts of rockfall using a new numerical simulation method. First, this study establishes a coupled FEM-SPH numerical model and adopts the full restart technology of the ANSYS/LS-DYAN code to study this issue. Then, this model is validated with the model test along with a comparison of the impact force of rockfall with other methods. Finally, the effect of the following four factors, e.g., rockfall mass, rockfall impact velocity, rockfall shape and rockfall impact angle, which are assumed to be very important and attract more attention [18,25,29], on a shed-tunnel structure’s dynamic response to the repeated impacts of rockfall is studied in detail.
2. Establishment of the Numerical Calculation Model
2.1. A Coupled FEM-SPH Numerical Model
Due to high cost and a time-consuming nature, there are very few model tests on the dynamic response of a reinforced concrete plate under the impact of rockfall, especially under the repeated impacts of rockfall. Fortunately, in order to study the failure mode of the shed and retaining wall under rockfall, Wu et al. [17] conducted an outdoor test platform for rockfall impacting the reinforced concrete slab covered with an overlying cushion layer. Then, they studied the rockfall impact force, the failure process and dynamic failure modes of the reinforced concrete slab under different impact conditions and obtained many good results. Therefore, this numerical simulation is conducted according to their model test. The size of the concrete support and the reinforced concrete plate is 0.2 m × 1.6 m × 0.25 m and 2.4 m × 1.6 m × 0.25 m, respectively. Two layers of φ14@200 mm rebar mesh are laid vertically and orthogonal inside the reinforced concrete plate, whose protective layer is 20 mm thick. The buffer layer is 2.4 m × 1.6 m × 0.3 m. The bottom of the support is fixed in all directions, and four sides of the buffer layer are fixed in the normal direction. The numerical model is shown in Figure 1.
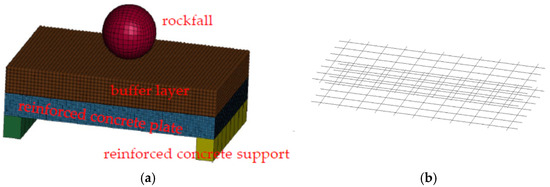
Figure 1.
The coupled FEM-SPH numerical calculation model and the bars for the reinforced concrete. (a) The numerical calculation model; (b) two layers of the reinforcing rebar.
As stated above, the coupled FEM-SPH method is adopted here, in which the concrete supports and reinforced concrete plate are simulated with FEM, and the buffer layer is simulated with SPH to avoid the mesh distortion. The algorithmic principle of the coupled FEM-SPH method has been described in detail in many studies [33,34].
In conclusion, the numerical model for rockfall impact the shed-tunnel structure is established using a coupled FEM-SPH method, which can not only effectively avoid the mesh distortion but also improve the reliability and calculation efficiency of the simulation.
2.2. The Calculation Parameters of the Materials
In the numerical model shown in Figure 1, the materials involved are rockfall, buffer layer and reinforced concrete, where the reinforced concrete is simulated with the separate model; namely, it is regarded as a combination of concrete and rebar. In view of the existing constitutive models in the ANSYS/LS-DYAN code and the relevant research [29], the constitutive models for these above four materials are as follows. Rockfall, buffer layer, concrete and rebar are assumed to be the rigid model, MAT_FHWA_SOIL model, MAT_CSCM model and PLASTIC_KINEMATIC model, respectively. Their corresponding calculation parameters are shown in Table 1.

Table 1.
The material physical and mechanical parameters.
2.3. Verification of the Numerical Model
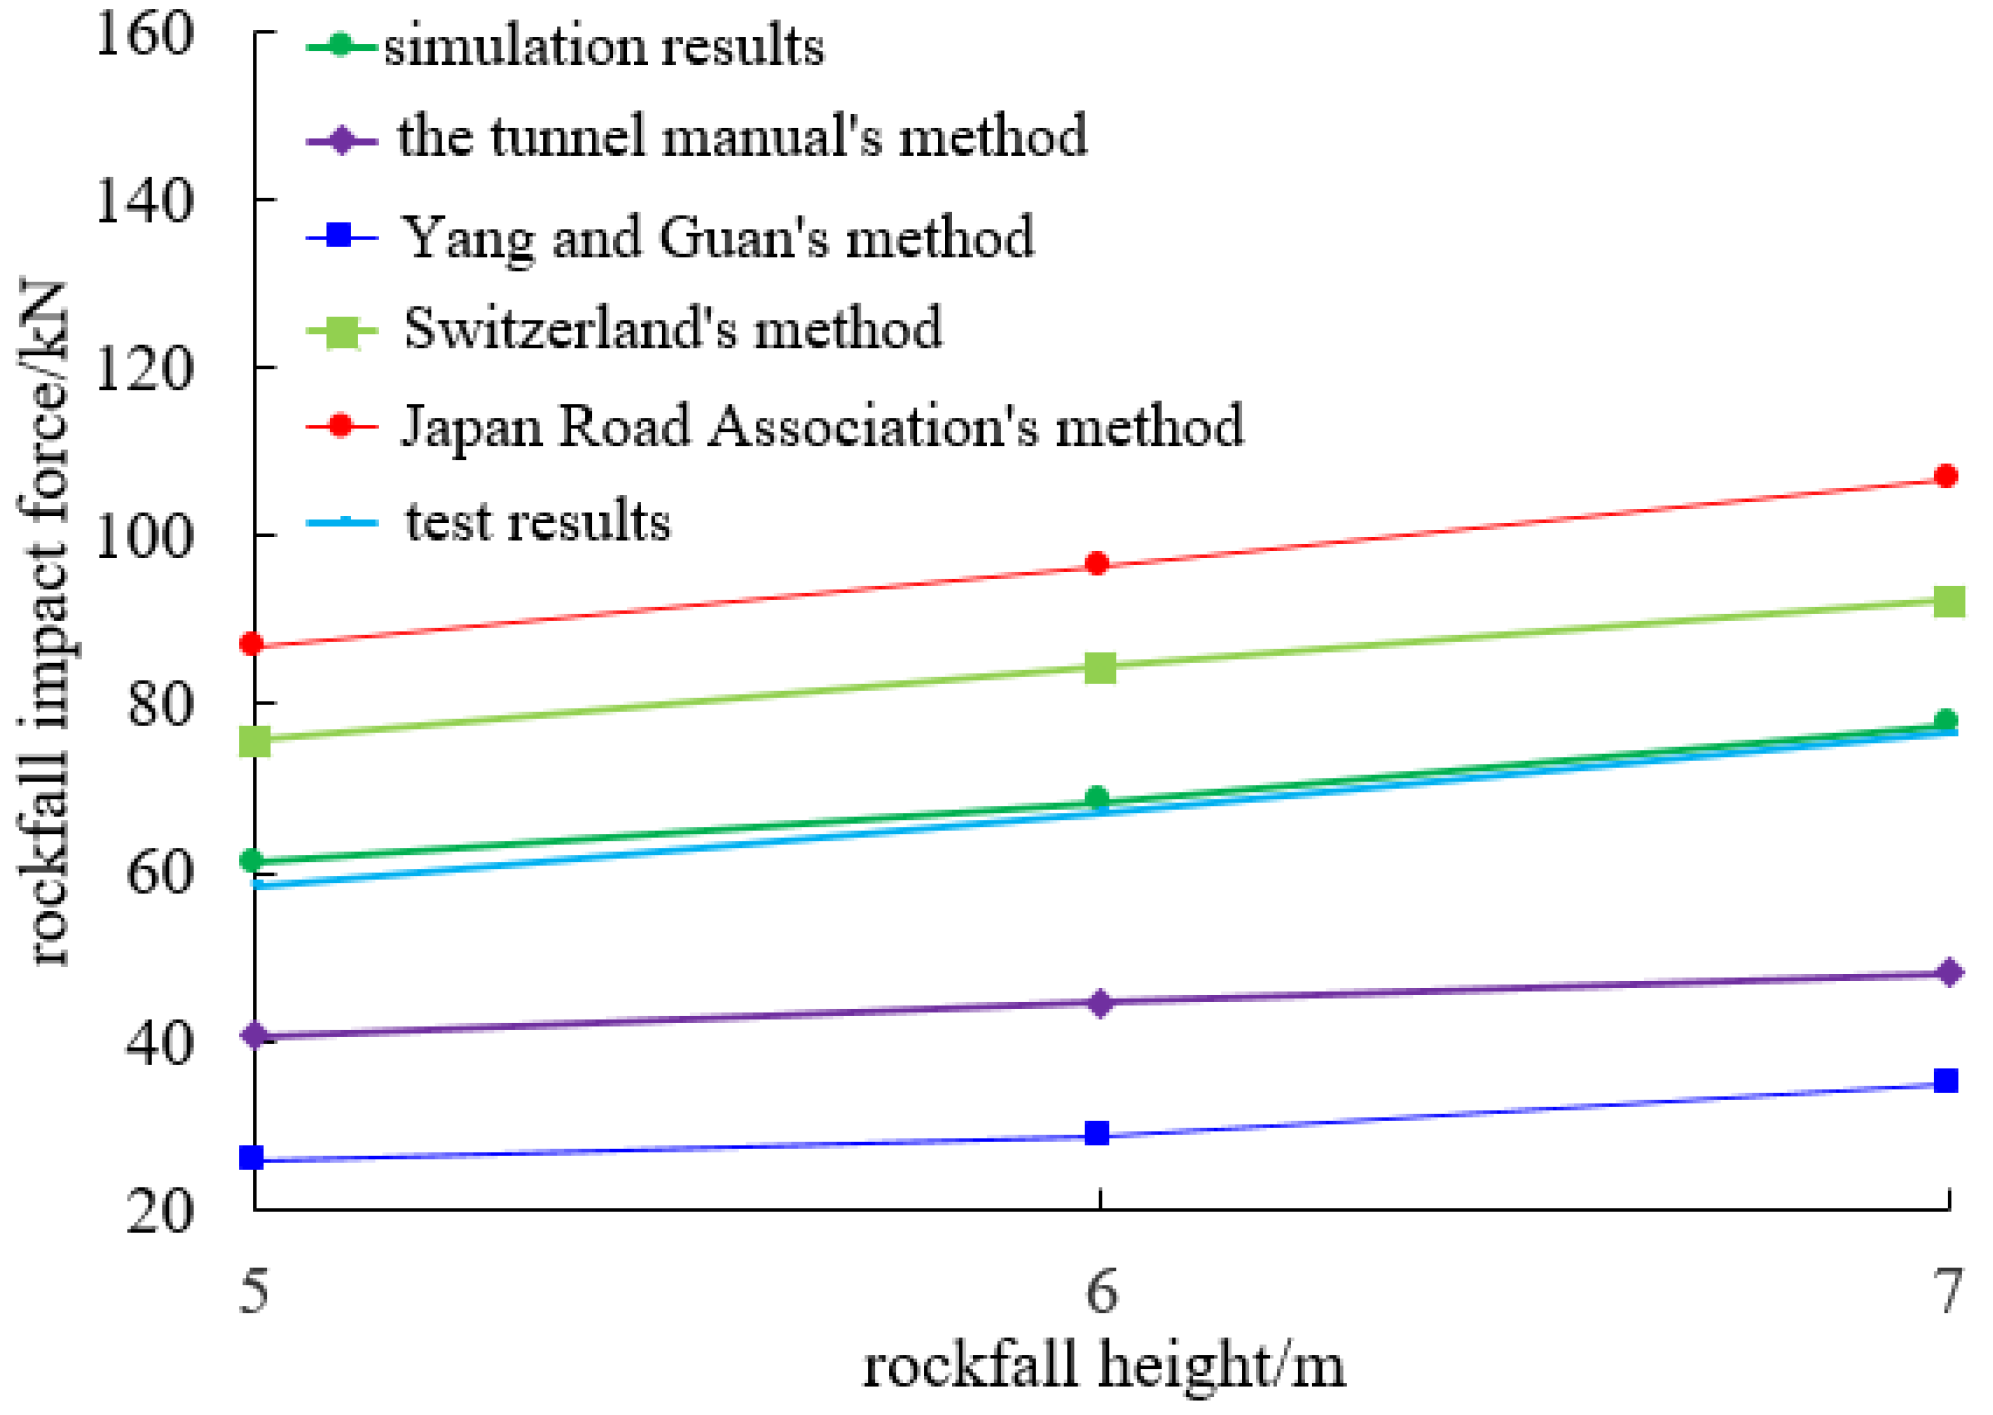
In order to validate the numerical model, the rockfall impact force on the buffer layer is first studied. Assume the rockfall vertically impacts the buffer layer, and three impacts are carried out with the falling heights of 5, 6 and 7 m, respectively. Accordingly, the rockfall impact velocity reaching the buffer layer is 9.9 m/s, 10.84 m/s and 11.71 m/s, respectively. The simulation results of the rockfall impact force on the buffer layer are compared with those tested by Wu et al. [17] and those obtained with the often-used calculation methods shown in Table 2 to validate this numerical model. This comparison is shown in Figure 2, from which it can be seen that the simulation results agree well with the test ones. The rockfall impact force almost increases linearly with increasing the rockfall falling height. However, the impact force calculated with these methods in Table 2 is different. The maximum difference is about 5-times between Japan Road Association’s method [35] and Yang and Guan’s method [36]. This is because the considered factors in each method are different, as shown in Table 2. In general, the impact force calculation results obtained with the proposed numerical model are between those of the Switzerland method [37] and the tunnel manual method [38] and agree well with the test ones obtained by Wu et al. [17], which indicates that the calculation results are largely reasonable.
Table 2.
The often-used calculation methods of the rockfall impact force.
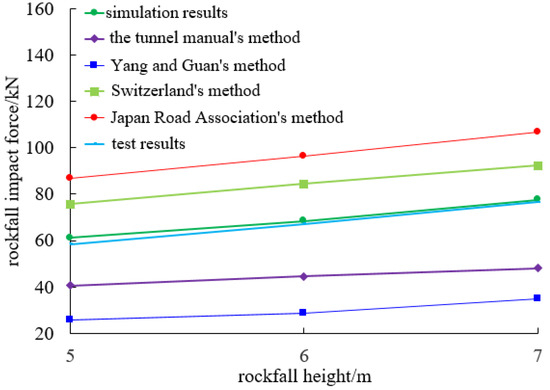
Figure 2.
Comparison of impact force calculation results obtained with six methods, e.g., Japan Road Association’s method [35], Yang and Guan’s method [36], Switzerland’s method [37], the tunnel manual’s method [38] and test results [17].
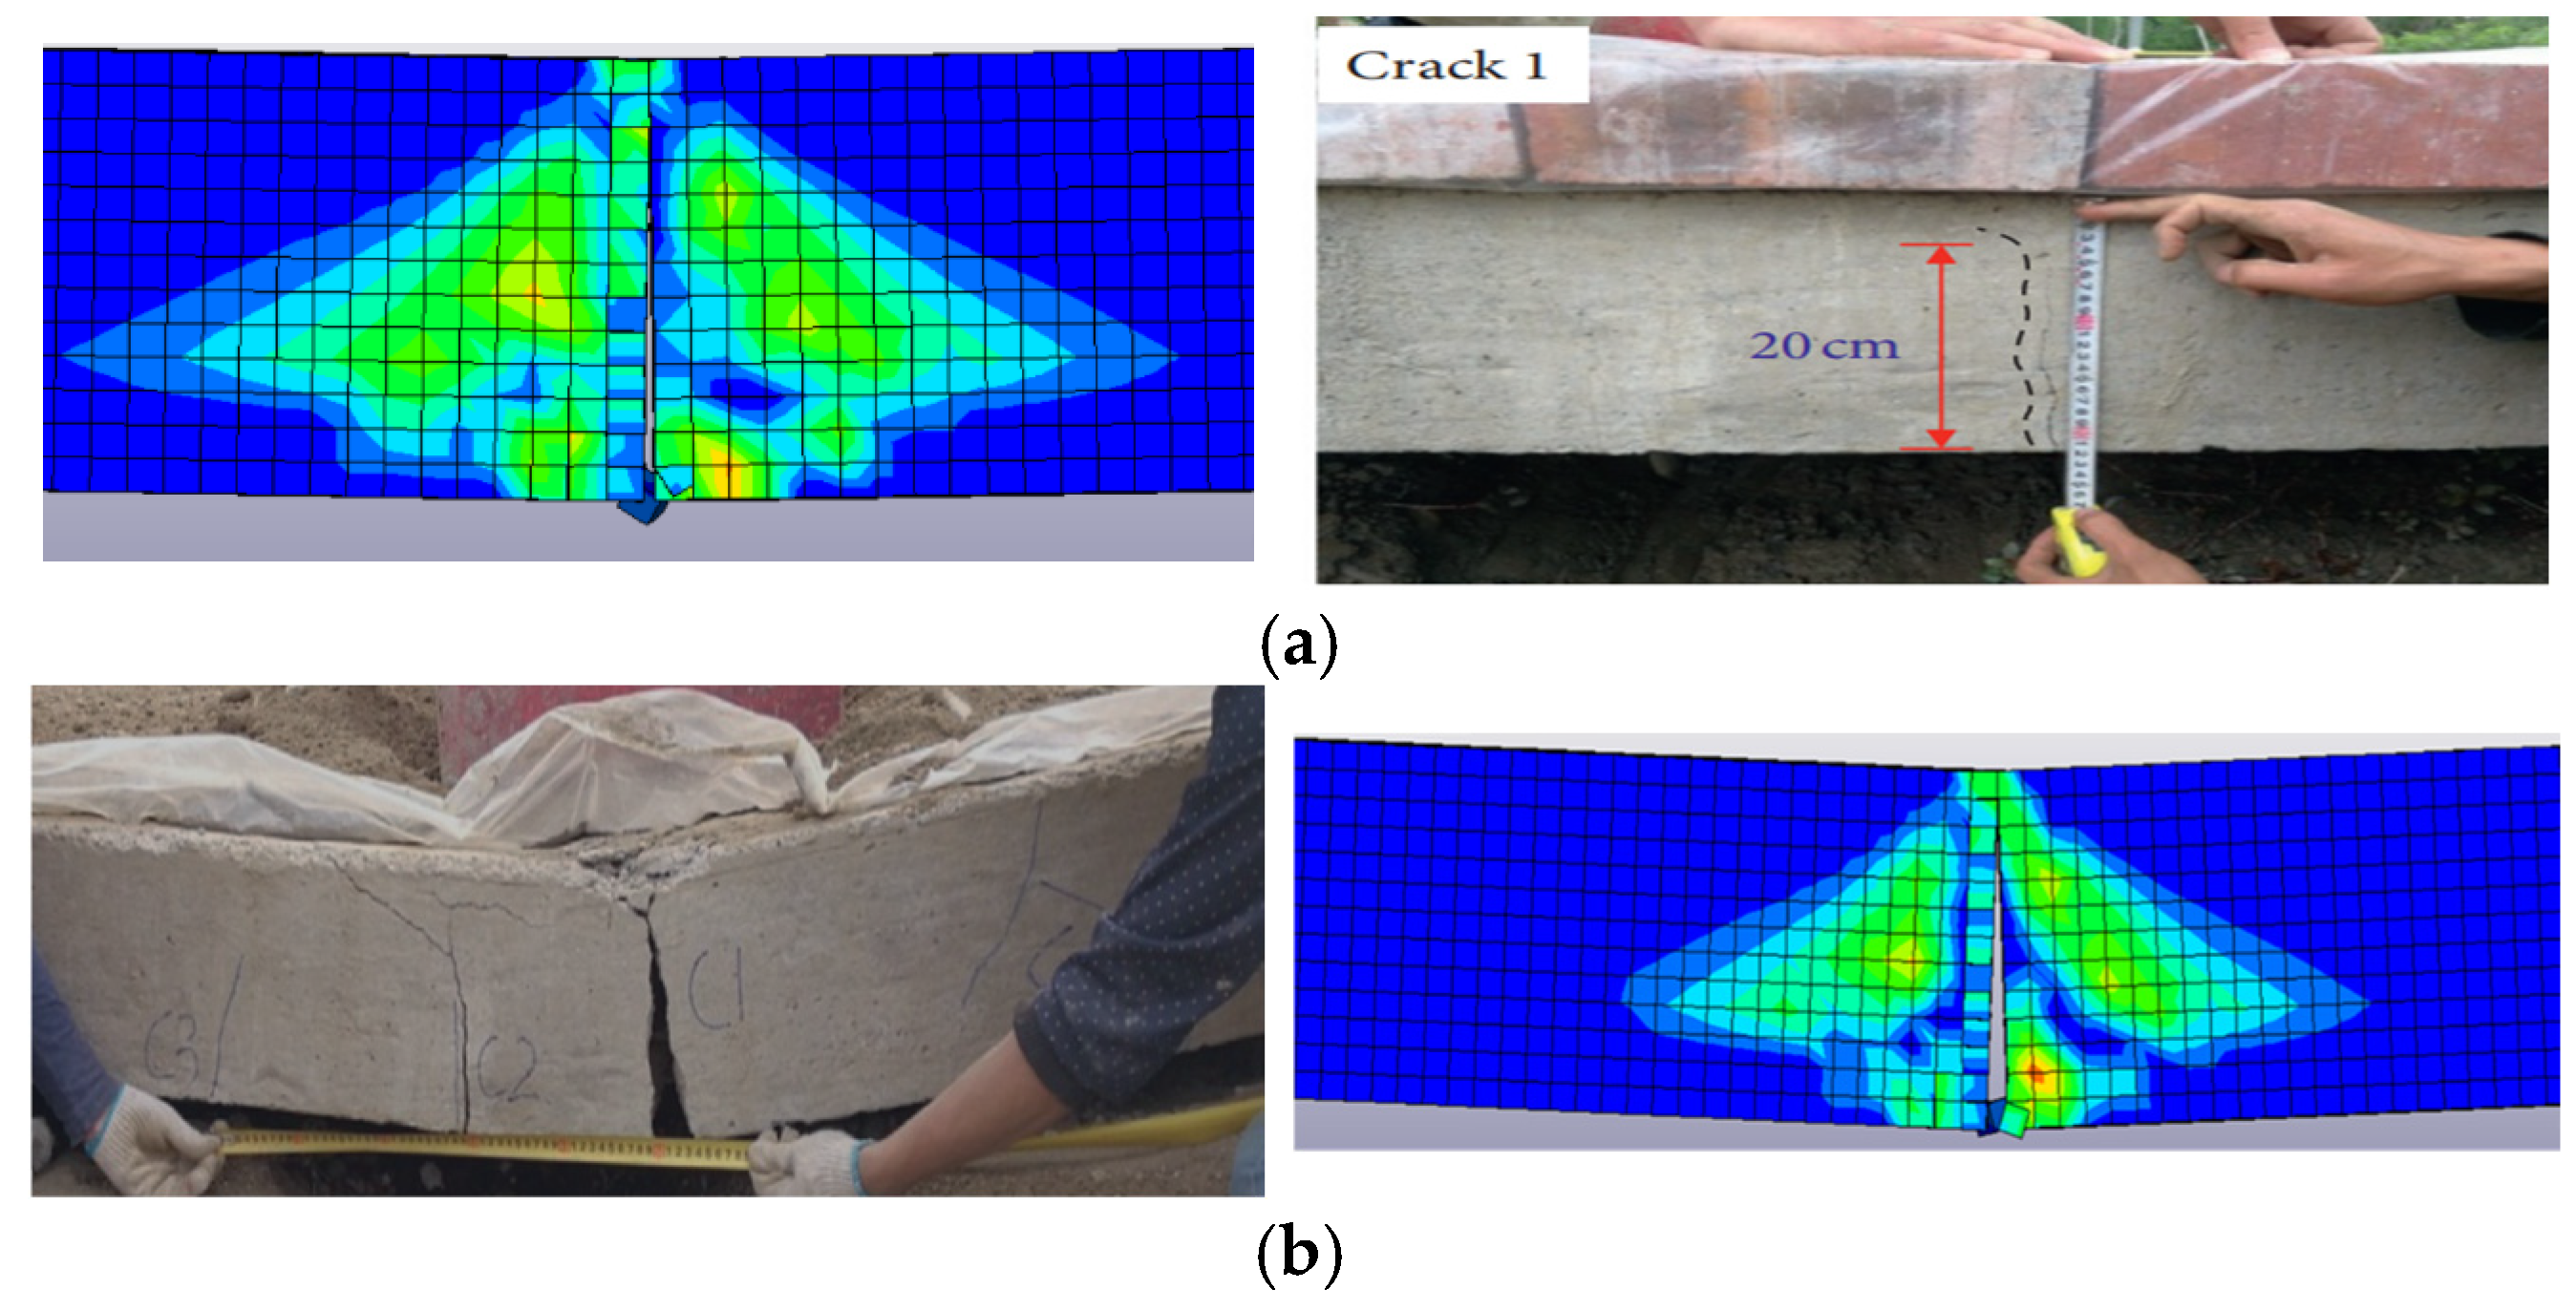
In addition, the failure process of the reinforced concrete plate is also adopted to validate this numerical model. Assume the rockfall vertically impacts the reinforced concrete plate several consecutive times, the impact interval is 0.05 s, the impact velocity is 20 m/s, and the damage of the reinforced concrete plate is observed. As shown in Figure 3, the numerical simulation results show that the main cracks in the reinforced concrete plate first appear at the bottom and then continue to propagate and coalesce, which is in good agreement with the test results. It indicates that the numerical model is suitable to simulate the failure process of the reinforced concrete plate under the rockfall impact.

Figure 3.
Comparison of the simulation results and test ones of the mid-span bending main crack initiation, propagation and coalescence. (a) Crack initiation and propagation. (b) Crack coalescence.
3. Dynamic Response Simulation of the Shed-Tunnel Structure under the Repeated Impacts of Rockfall
3.1. The Numerical Calculation Schemes and Study Workflow
The numerical simulation of the dynamic response of a shed-tunnel structure under the repeated impacts of rockfall adopts the full restart technology of the LS-DYNA code. The calculation result of the previous rockfall impact is taken as the calculation initial condition of the next rockfall impact, in which the initialization process is achieved with the keyword STRESS_INTIALIZATION to ensure the information continuity of the numerical calculation. Then, the dynamic response laws of a shed tunnel under the repeated impacts of rockfall, such as the impact force, impact depth, vertical displacement of a shed-tunnel roof and plastic strain, are studied under different conditions, such as the rockfall mass, shape, impact velocity and impact angle. The numerical calculation schemes are shown in Table 3. Among them, the impact force refers to the time–history relationship curve of the interaction between the rockfall and the buffer layer, from which the peak impact force on the buffer layer and its change law can be judged. Impact depth refers to the vertical displacement of the surface nodes of the buffer layer after the rockfall impact, which directly indicates the impact effect, and the point directly contacted with the rockfall, namely, the center point of the upper surface of the buffer layer, is set as the displacement monitoring point. The vertical displacement of the shed-tunnel roof refers to the maximum vertical displacement of the nodes on the upper surface of the reinforced concrete plate, and the center of the upper surface is selected as the monitoring point. The shed-tunnel plastic strain directly indicates the failure of the reinforced concrete plate.
Table 3.
The numerical calculation schemes.
In all, the workflow of this study is illustrated in Figure 4, from which we can clearly understand the overview of this study.
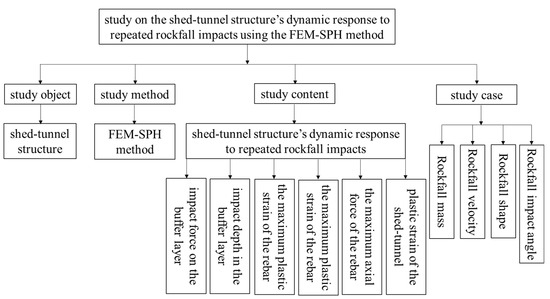
Figure 4.
The workflow of this study.
3.2. Study Cases and Calculation Result Analysis
3.2.1. Effect of Rockfall Mass
In order to study the effect of rockfall mass on the dynamic response of the shed tunnel, the rockfall impact velocity and direction are fixed to be 20 m/s and perpendicular to the buffer layer. The rockfall radius is assumed to be 0.2 m (five impacts), 0.25 m (five impacts) and 0.3 m (four impacts, because the model is destroyed at the fifth impact, and the calculation cannot converge), and, accordingly, the rockfall mass is 70.3 kg, 137.31 kg and 237.26 kg, respectively. The interval between two neighboring impacts is 0.05 s.
- (1)
- The impact force on the buffer layer
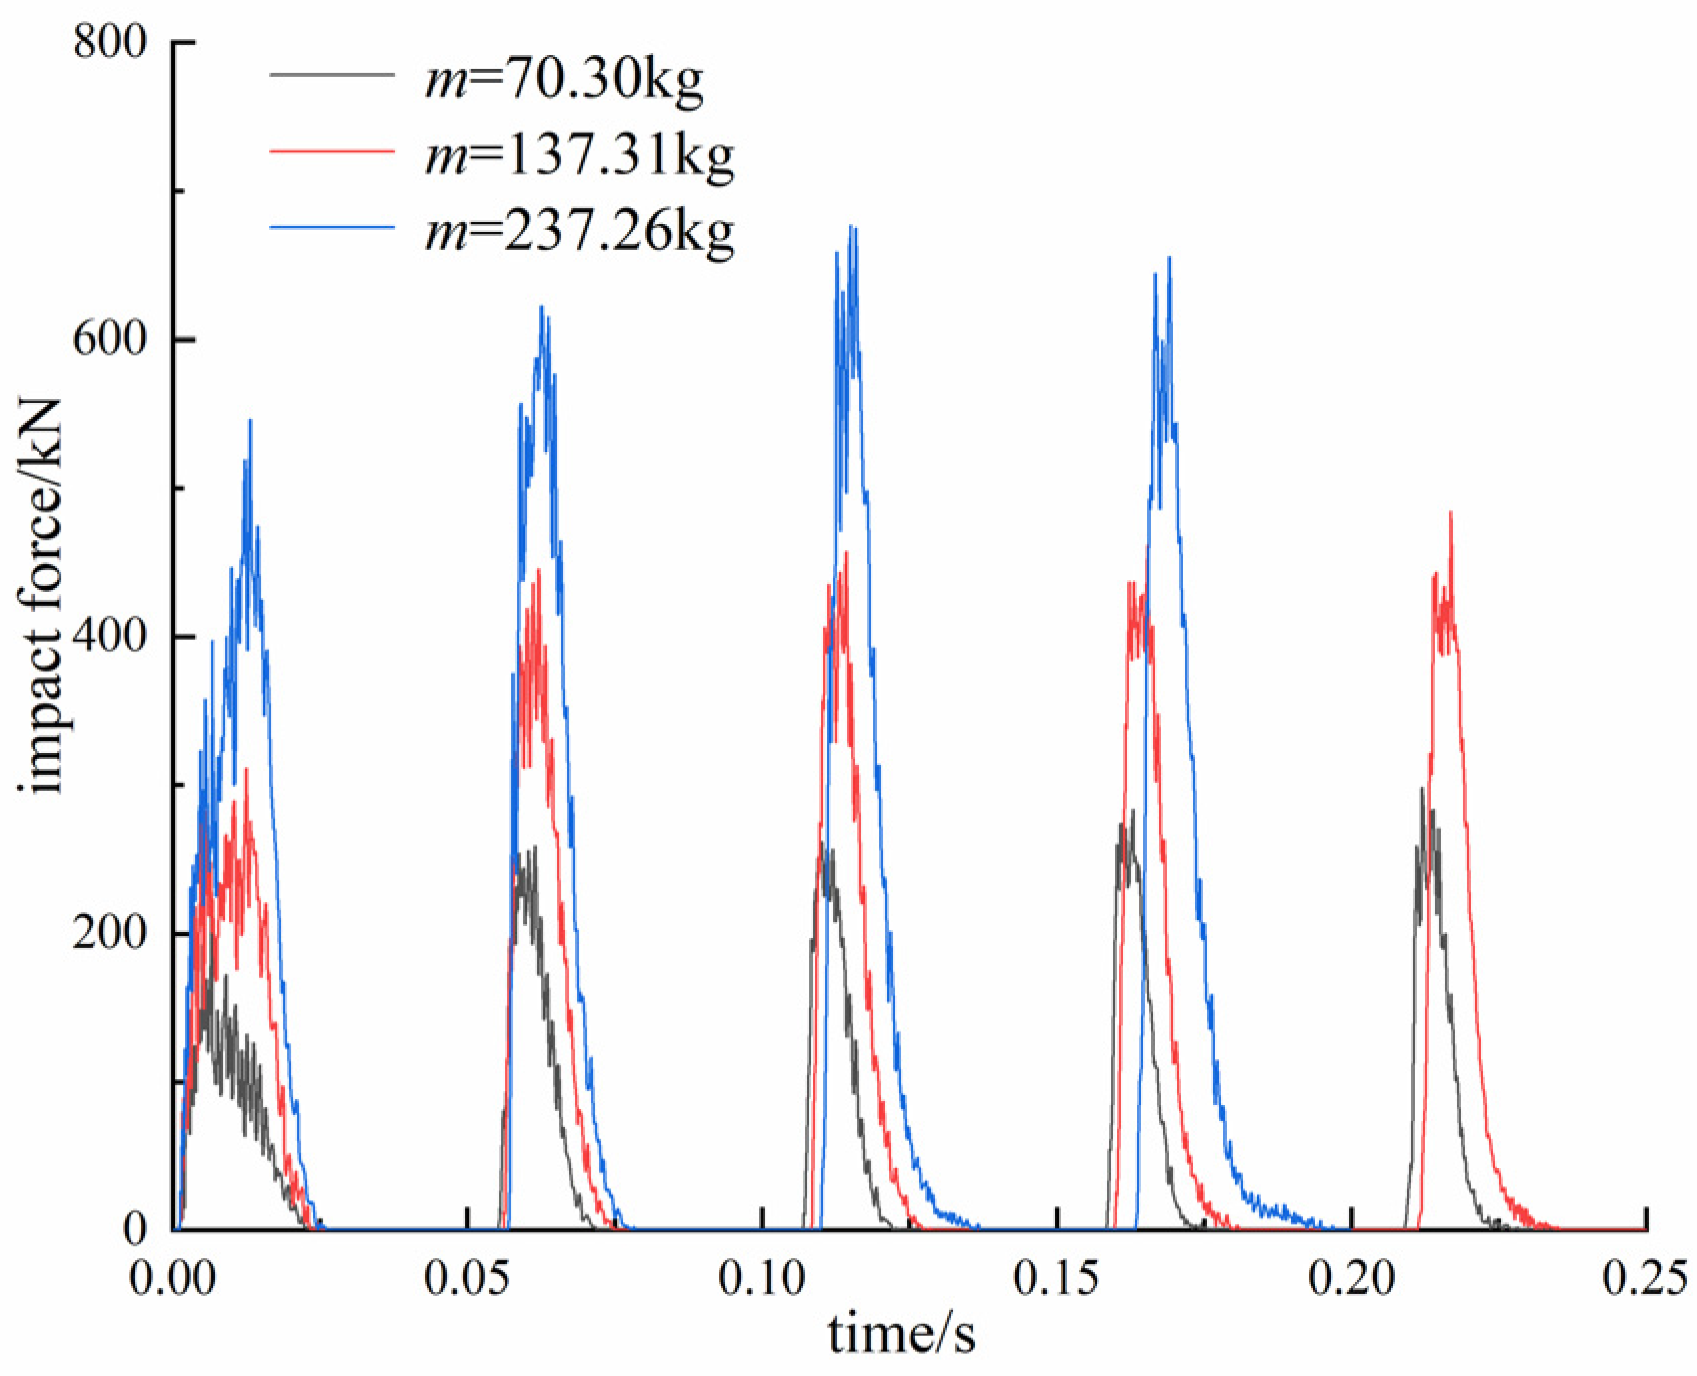
The following results can be obtained from the calculation results shown in Figure 5 and Table 4. First of all, after each impact, the pattern of the time–history curve of the impact force is basically the same. The impact force first increases to the maximum and then decreases to 0 with time going on. Second, when the rockfall mass is fixed, with an increasing impact number, the peak impact force increases rapidly after the second impact and then tends to be relatively stable. When the rockfall is 70.3 kg, the peak impact force increases from 221.32 kN of the first impact to 259.12 kN of the second impact, whose increase extent is 17.08%. And then the increase extent of subsequent impacts is not as high as that of the second impact. The peak impact force reaches the maximum 298.77 kN in the fifth impact, which increased by 15.3% compared with the second impact. When the rockfall mass is 137.31 kg, the peak impact force rapidly increases from 311.36 kN of the first impact to 445.18 kN of the second impact, whose increase extent is 42.98%. The peak impact force reaches the maximum 484.25 kN at the fifth impact, which increases by 8.78% compared with the second impact. When the rockfall mass is 237.26 kg, the peak impact force rapidly increases from 546.89 kN of the first impact to 622.54 kN of the second impact, whose increase extent is 13.83%. The peak impact force reaches the maximum 677.58 kN at the third impact, which increases by 8.84% compared with the second impact. This is mainly because the buffer layer is not compressed at the first impact, and its buffer performance is the best. With increasing the impact number, its buffer capacity gradually weakens, so the peak impact force will increase at the first several times. However, with the impact continuing, the buffer layer can hardly be compressed anymore, so its buffer performance tends to be stable, resulting in the peak impact force also tending to be stable. At the same time, it can also be seen that the greater the rockfall mass, the lower the impact number required to reach the maximum. Finally, the larger the rockfall mass, the greater the peak impact force. Here, we explain that the number of repeated impacts of rockfall is set to five, because for the case of m = 237.26 kg, the shed tunnel is destroyed after five impacts, and, therefore, the number of repeated rockfall impacts is set to 5.
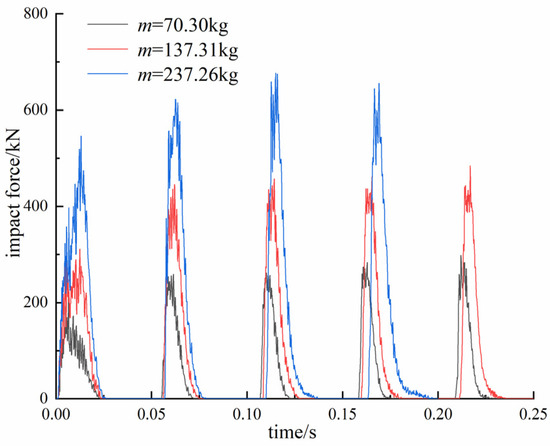
Figure 5.
The time–history curve of the impact force on the buffer layer with different rockfall masses.
Table 4.
Results of the peak impact force on the buffer layer with different rockfall masses (unit: kN).
- (2)
- The impact depth in the buffer layer
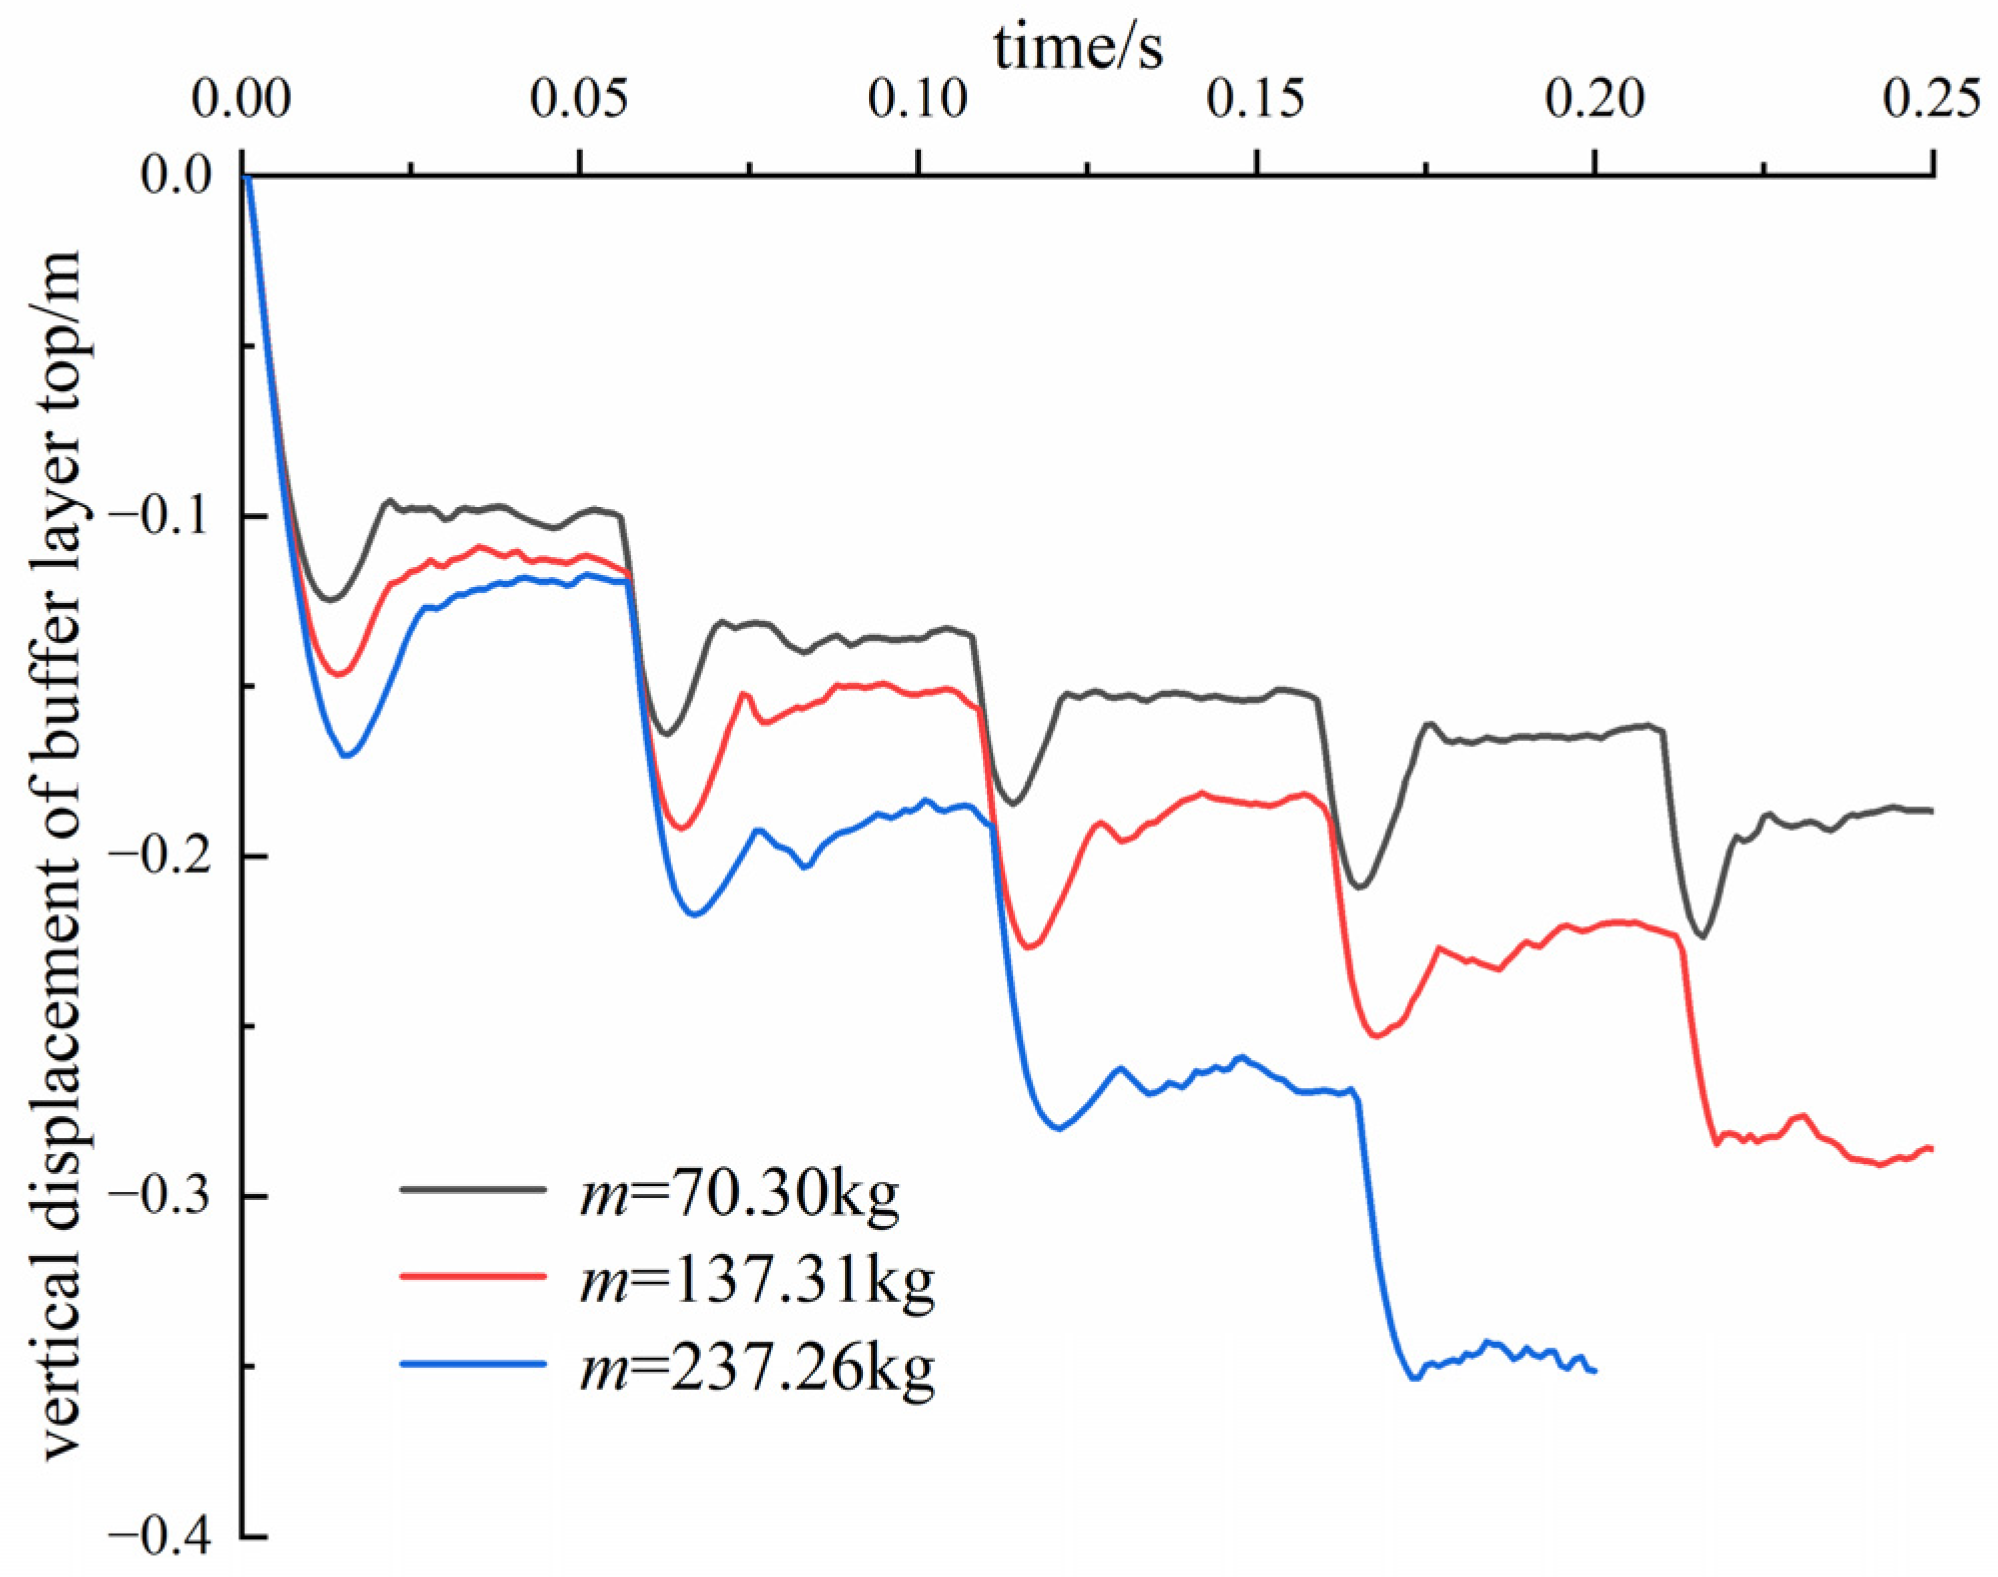
The calculation results of the time–history curve of the impact depth in the buffer layer with different rockfall masses are shown in Figure 6, from which the following conclusions can be obtained. First of all, after each impact, the buffer layer will have a certain degree of rebound, because it is an elastic–plastic material, and the elastic deformation will recover after the impact force is unloaded. Second, when the rockfall mass is fixed, with an increasing impact number, the maximum impact depth gradually increases, but its increase extent is less than that of the first impact. When the rockfall mass is 70.3 kg, the impact depth of the first impact is 0.099 m, and that of the second impact is 0.035 m, which is only 35.35% of the first one. When the rockfall mass is 137.31 kg, the impact depth of the first impact is 0.115 m, and that of the second impact is 0.039 m, which is only 33.91% of the first one. When the rockfall mass is 237.26 kg, the impact depth of the first impact is 0.119 m, and that of the second impact is 0.185 m, which is only 55.46% of the first one. This is mainly because the soil is compacted after the first impact, resulting in the impact depth of the first impact being much greater than that of the subsequent impacts. Meanwhile, when the rockfall mass is small (70.3 kg), the rebound ratio of each impact is large. However, when the rockfall mass is large (237.26 kg), the rebound ratio is small. Finally, the greater the rockfall mass, the greater the impact depth of the buffer layer.
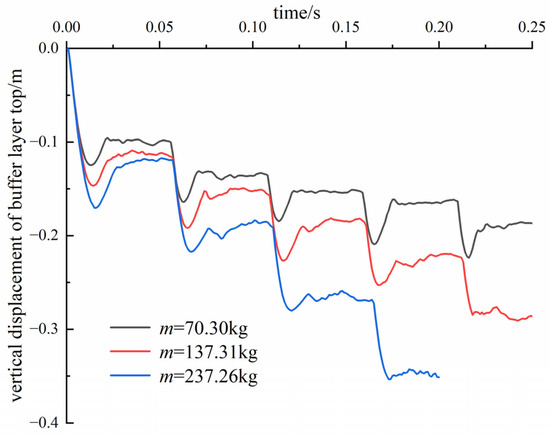
Figure 6.
The time–history curve of the impact depth in the buffer layer with different rockfall mass.
- (3)
- The maximum plastic strain of the rebar
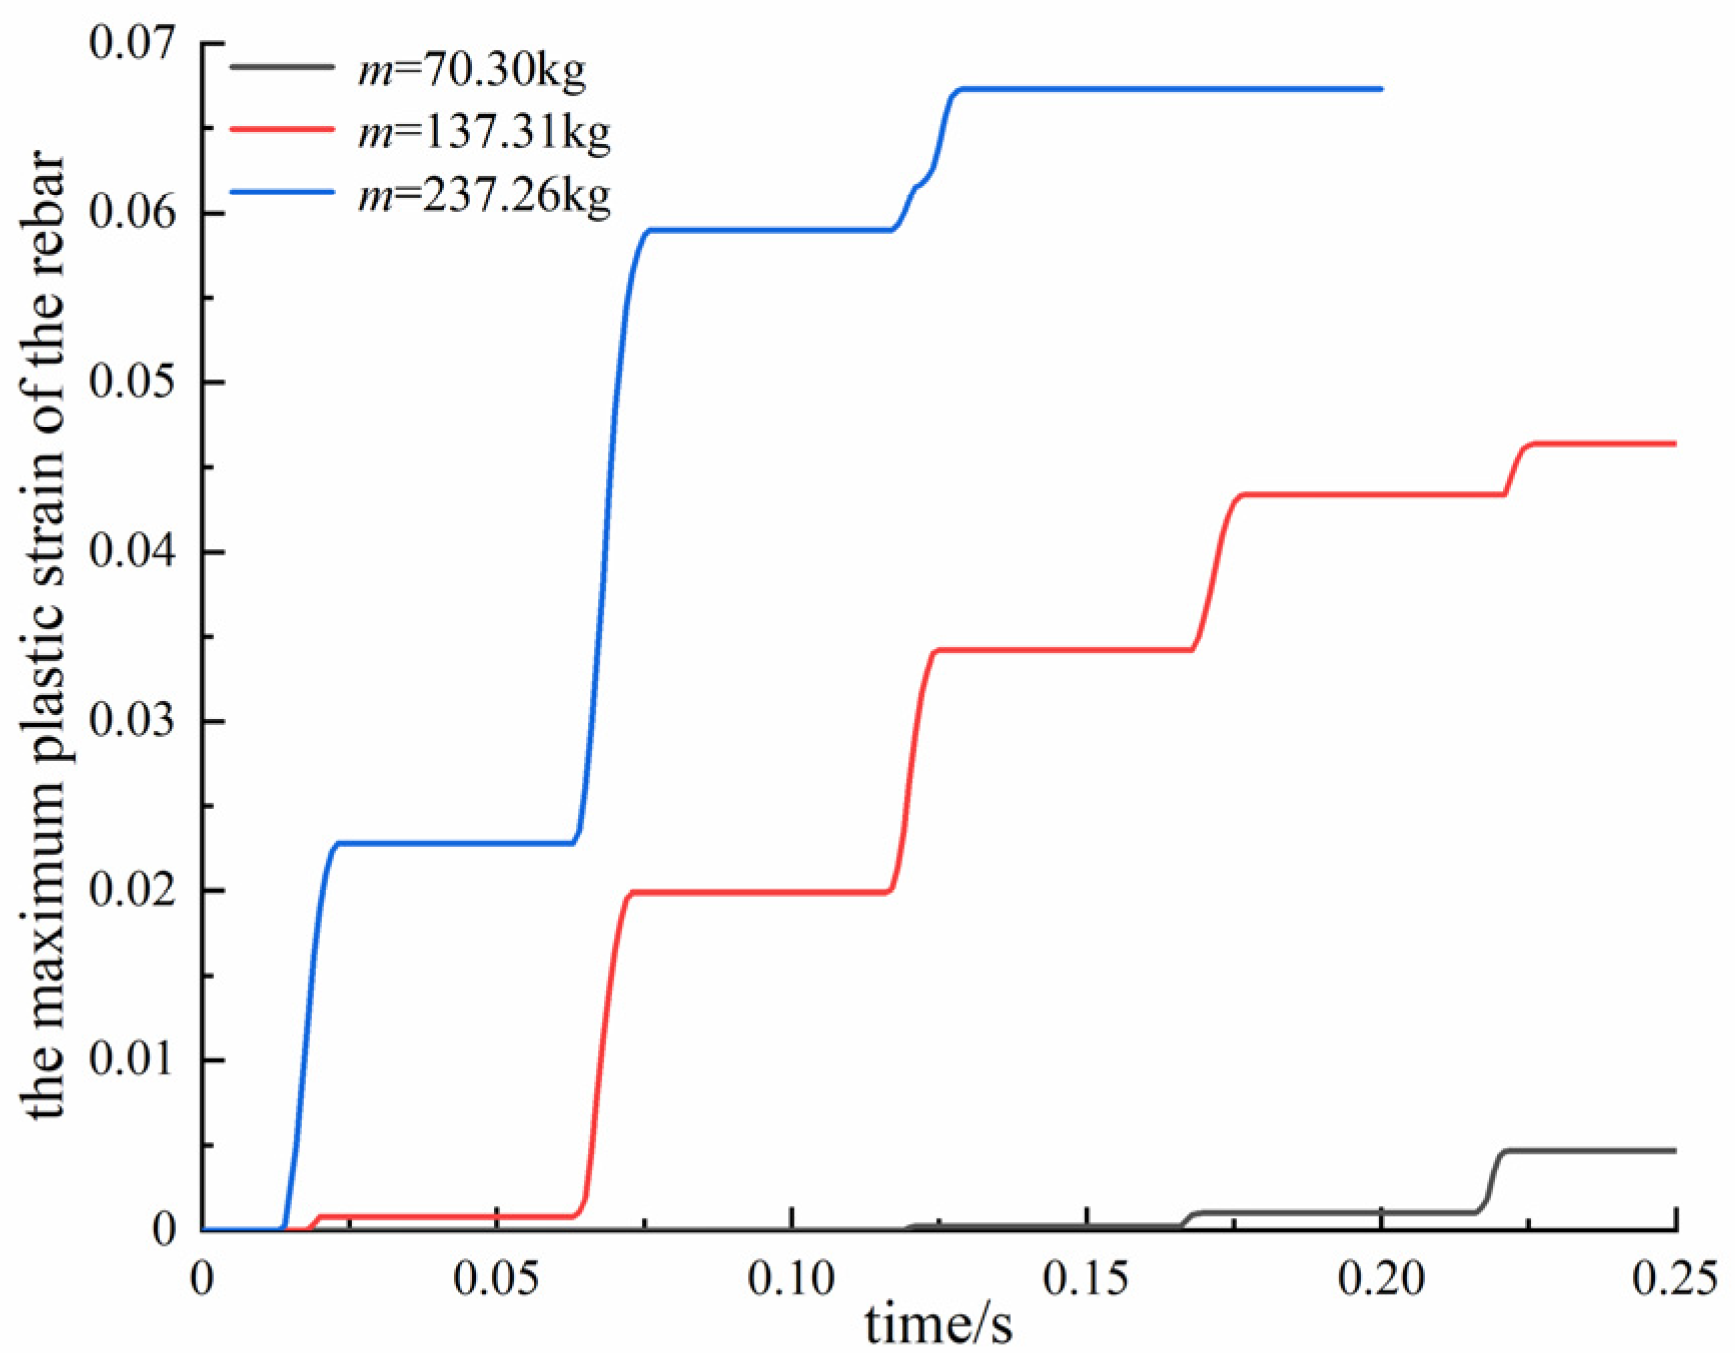
The calculation results of the time–history curve of the maximum plastic strain of the rebar with different rockfall masses are shown in Figure 7, from which the following conclusions can be obtained. First of all, the maximum plastic strain of the rebar shows a monotonically increasing trend on the whole. Second, the plastic strain of the rebar increases rapidly first and then tends to be stable. This is because the deformation in the reinforced concrete plate will drive the rebar to produce plastic strain. When the reinforced concrete plate reaches balance, the rebar no longer generates more plastic strain and achieves stability. Third, the greater the rockfall mass is, the faster the maximum plastic strain of the rebar increases. The maximum plastic strain of the rebar is sensitive to the rockfall mass, and the plastic strain produced by five rockfall impacts of 70.3 kg is less than that produced by one rockfall impact of 237.26 kg. When the rockfall mass is small (70.3 kg), the plastic strain is not generated in the first few impacts, but when it is large (237.26 kg), the plastic strain is generated in the first impact. When the rockfall mass is 237.26 kg, the plastic strain produced by four impacts is 0.0673. When the rockfall mass is 70.3 kg, the plastic strain produced by five impacts is 0.00467, which is only 6.94% of the rockfall mass of 237.26 kg. When the rockfall mass is 137.31 kg, the plastic strain produced by five impacts is 0.0464, which is 68.95% of the rockfall mass of 237.26 kg.
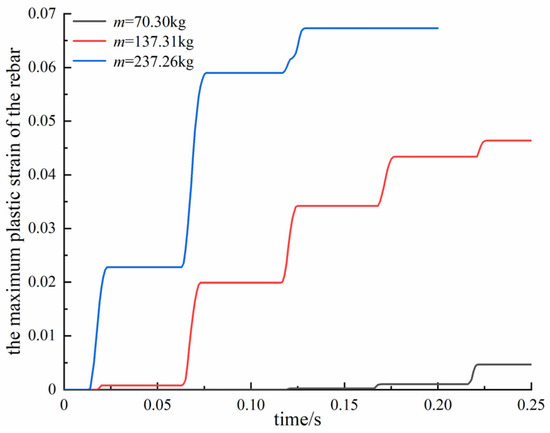
Figure 7.
The time–history curve of the maximum plastic strain of the rebar with different rockfall mass.
- (4)
- The vertical displacement of the shed roof
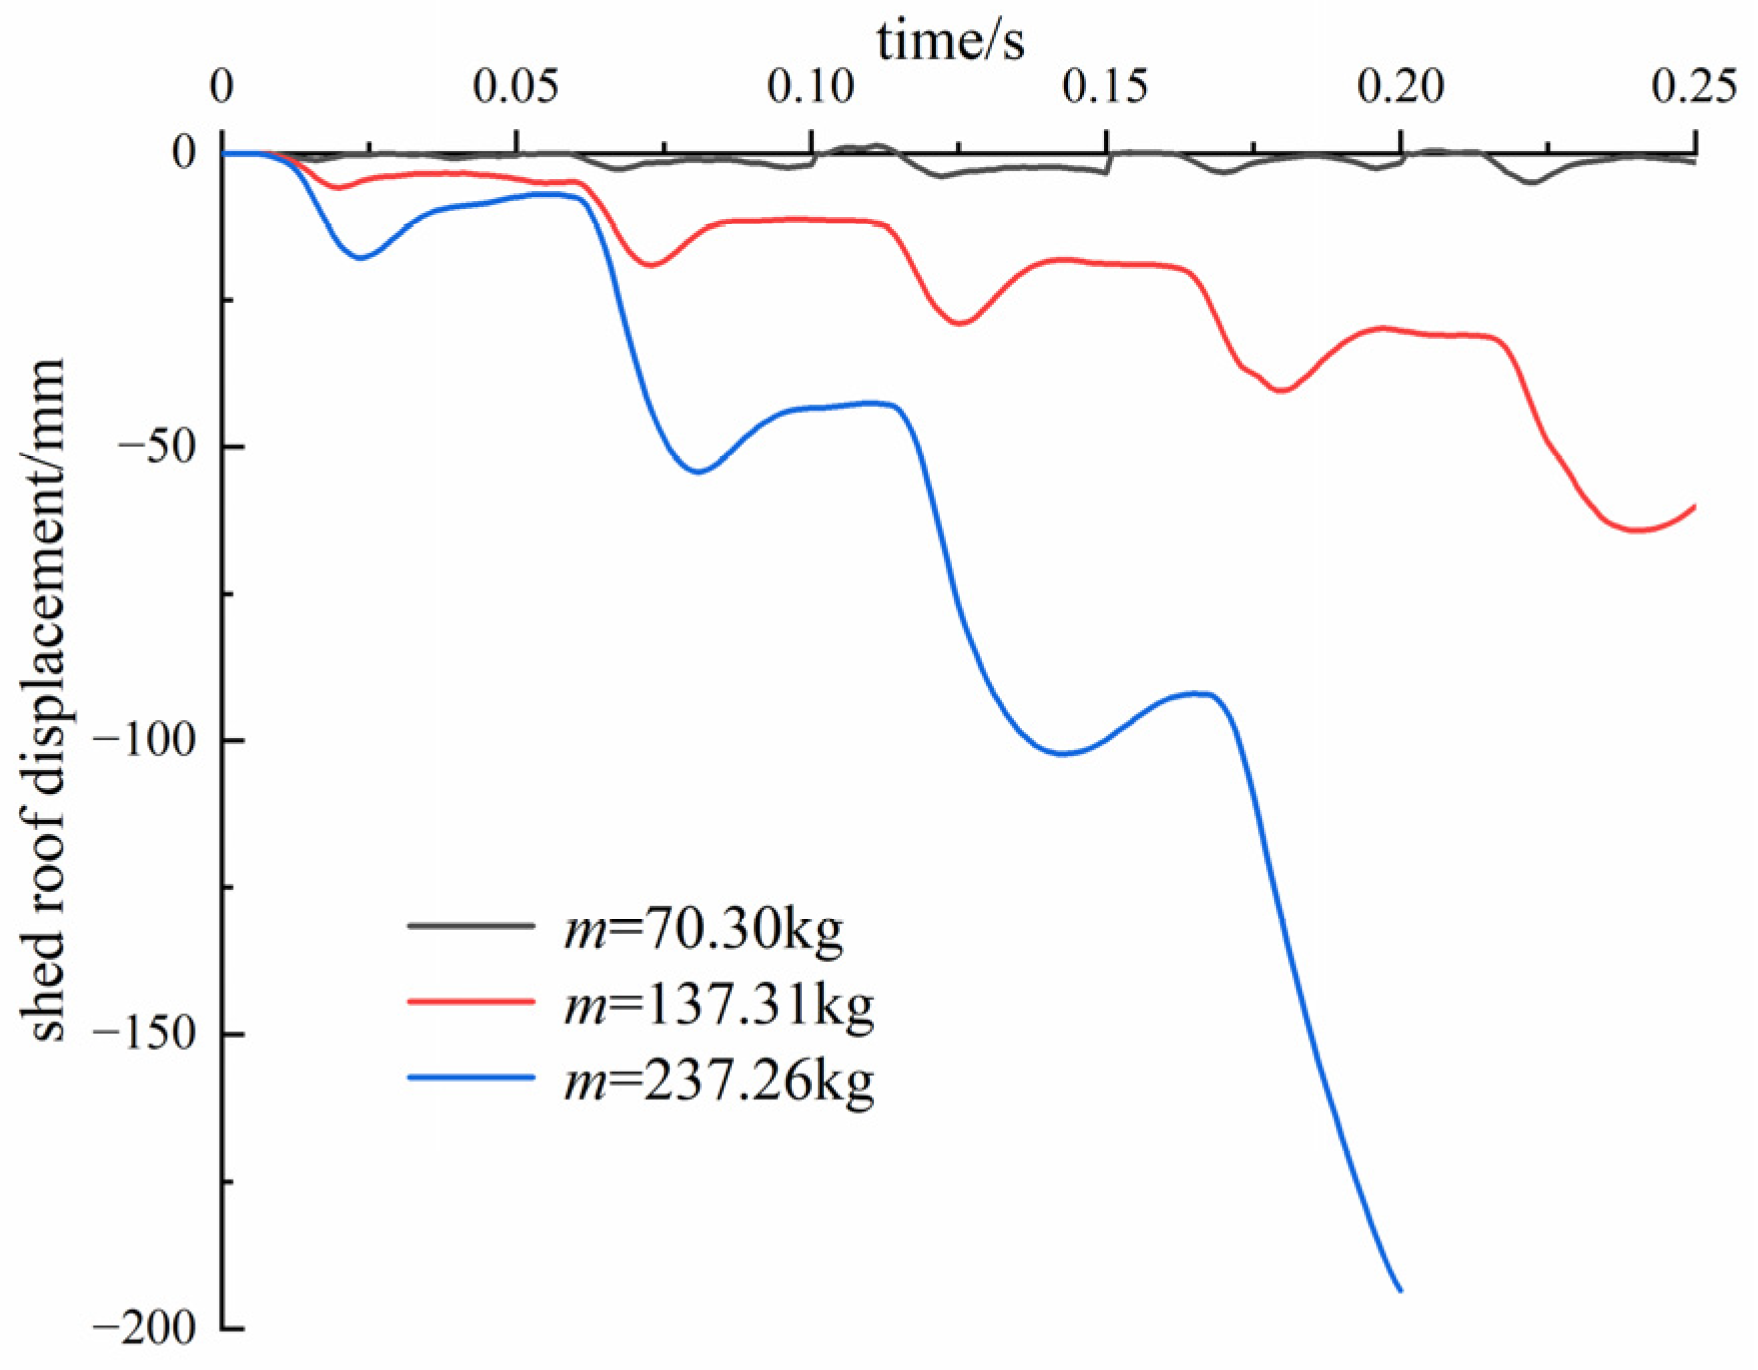
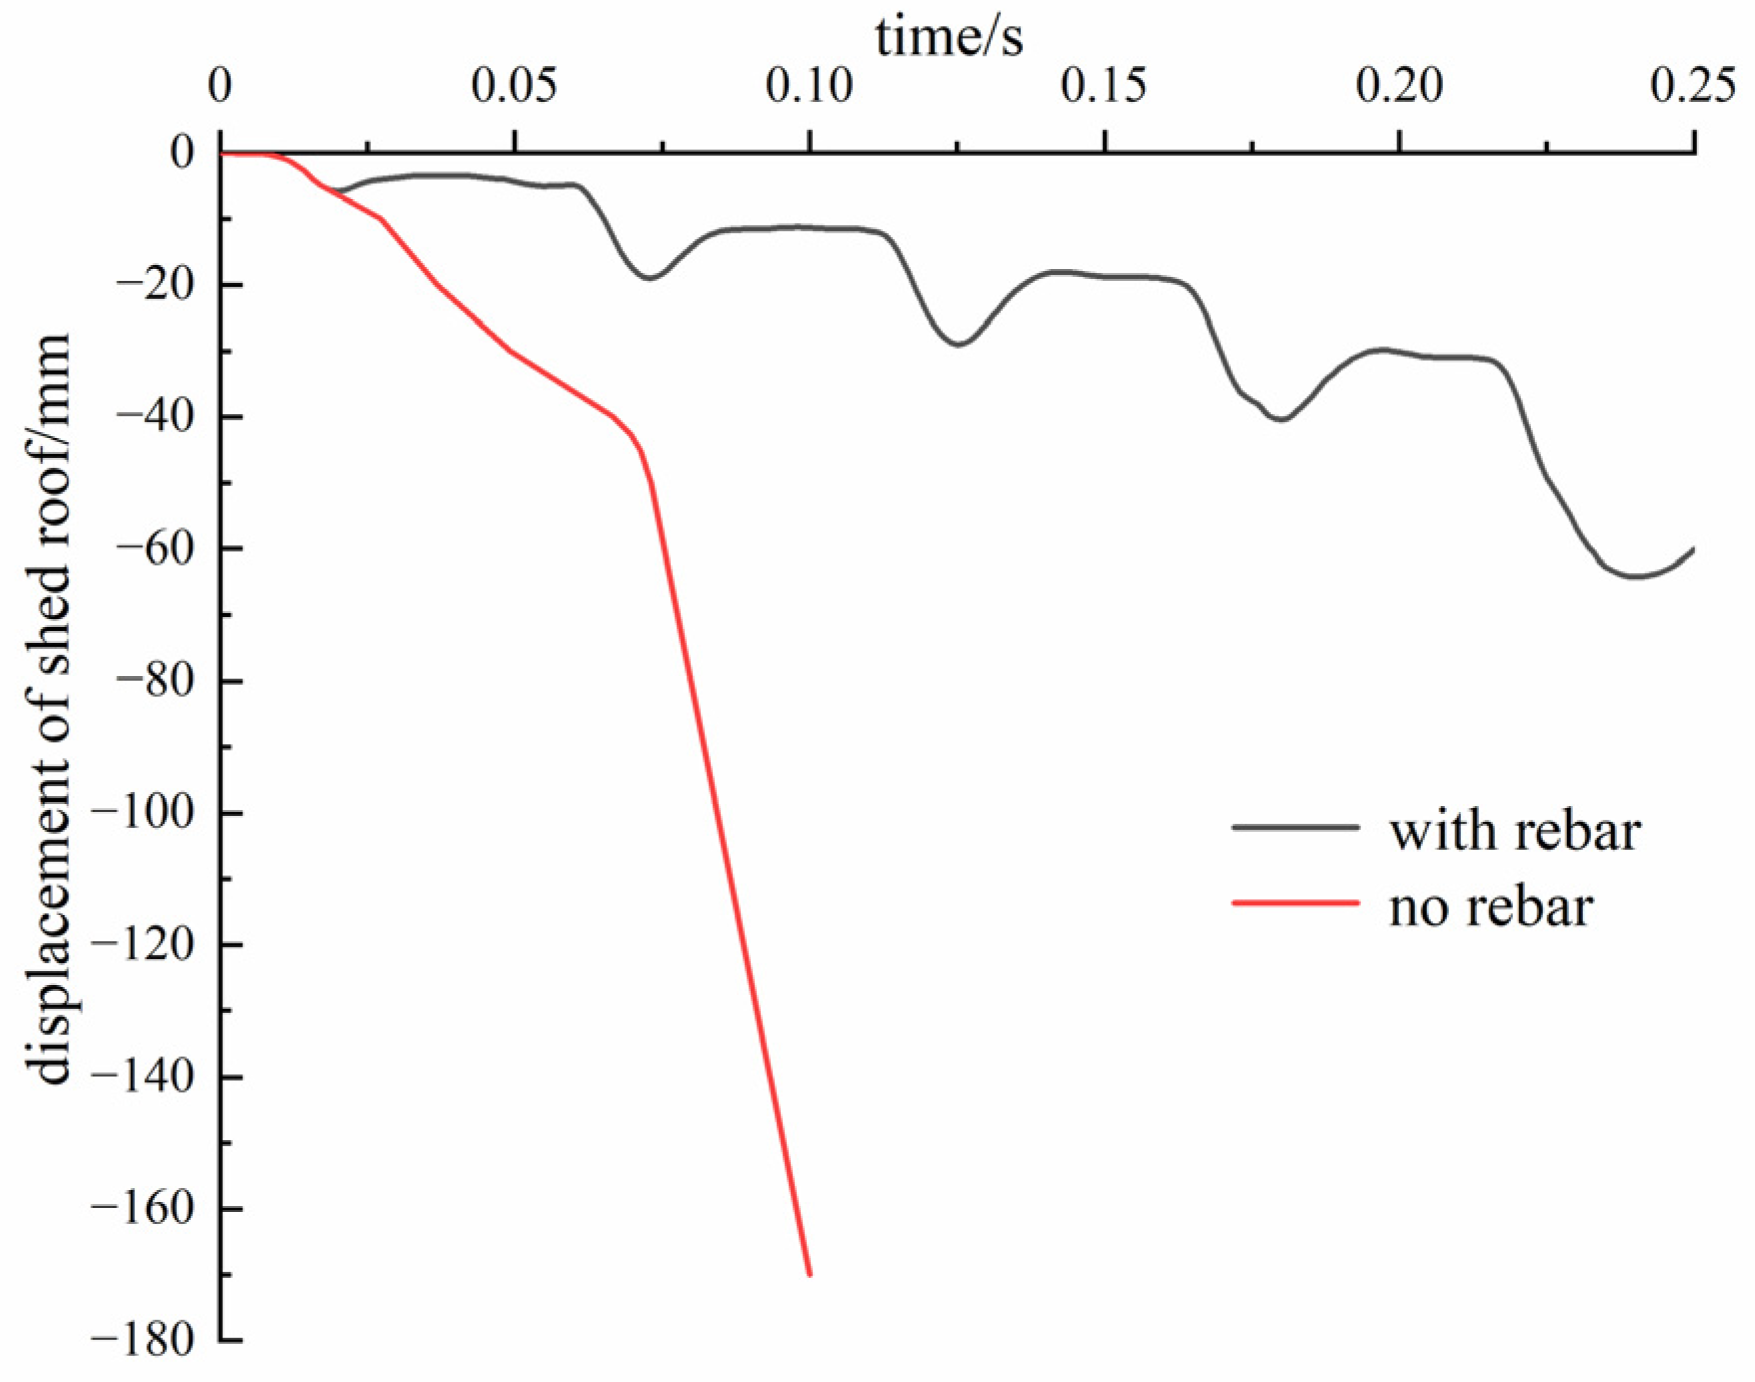
The calculation results of the vertical displacement of the shed roof with different rockfall masses is shown in Figure 8, from which the following conclusions can be obtained. First of all, there is a rebound phenomenon in the vertical displacement of the shed roof, which is mainly speculated to be caused by the existence of the rebar. Because concrete is a typical brittle material, no rebound will occur in it in theory, so it is speculated that the existence of the rebar leads to the rebound of the shed roof. To verify this hypothesis, a comparative experiment is designed. The rockfall radius is set to 0.25 m, and, accordingly, its mass is 137.31 kg. The impact velocity is set to 20 m/s, and the impact direction is vertically downward. The time–history curve of the vertical displacement of the shed roof is compared in one model with rebar and the other model without rebar. It can be seen from the calculation result shown in Figure 9 that when it has the rebar, the shed roof has obvious rebound, while when it has no rebar, the shed roof’s vertical displacement increases monotonically, and there is no rebound phenomenon. It shows that the rebar has a great influence on the strength and deformation of the reinforced concrete plate. If the shed roof has no rebar, it fails very easily. Second, when the rockfall mass is large (137.31 kg, 237.26 kg), the vertical displacement of the shed roof gradually increases with an increasing impact number. When the rockfall mass is small (70.3 kg), the rebound ratio of the vertical displacement of the shed roof after each impact is large, and the vertical displacement of the shed roof after stability shows very little change compared with the initial state. However, when the rockfall mass is large (237.26 kg), the rebound ratio is small. Finally, upon increasing the rockfall mass, the vertical displacement of the shed roof increases significantly.

Figure 8.
The time–history curve of the vertical displacement of the shed roof with different rockfall masses.
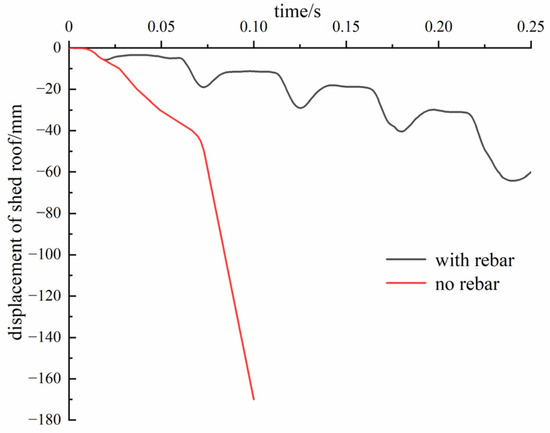
Figure 9.
Effect of the rebar on the vertical displacement of the shed roof.
- (5)
- The maximum axial force of the rebar
The calculation results of the maximum axial force of the rebar with different rockfall masses are shown in Figure 10, from which the following conclusions can be obtained. First of all, when the rockfall mass is fixed, in the first few impacts, the axial force of the rebar basically shows a trend of increasing from zero to the maximum and then decreasing to zero. However, after several subsequent impacts, the axial force of the rebar will not recover to zero, because the plastic deformation of the rebar cannot recover, so a certain axial force remains. Compared with the upper and lower rebars, the axial force of the lower rebars is obviously greater than that of the upper rebars. Because the lower rebars bear greater tensile stress, it is important to strengthen the reinforcement of the lower part of the reinforced concrete plate. What is more, comparing the calculation results with three kinds of rockfall mass, it can be seen that the greater the rockfall mass is, the greater the variation in the rebar axial force. This is because the rockfall impact force increases with the rockfall mass, and, accordingly, the axial force of the rebar also increases.
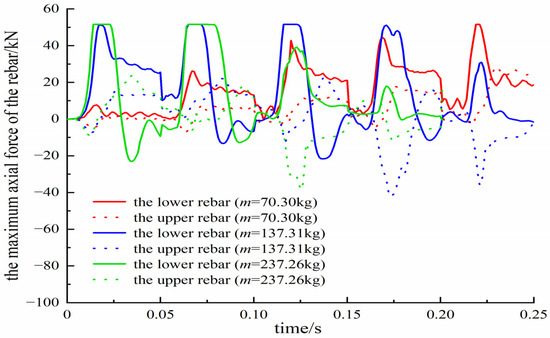
Figure 10.
The maximum axial force of the rebar with different rockfall masses.
- (6)
- The plastic strain of the shed tunnel
The calculation results of the plastic strain contour of the shed tunnel with different rockfall masses are shown in Figure 11, from which the following conclusions can be obtained. After many impacts, large plastic deformation occurs in the shed tunnel, which mainly concentrates in and around the center of the shed tunnel. The greater the rockfall mass, the greater the plastic zone and the greater the damage caused by the rockfall to the shed tunnel. The plastic strain of the shed tunnel is sensitive to the rockfall mass, and the damage range of the shed tunnel produced by five impacts of the rockfall with 70.3 kg is far less than that produced by four impacts of rockfall at 237.26 kg. The damage of the shed tunnel begins from the bottom of the span, and cracks gradually propagate towards the upper and both sides of the reinforced concrete plate.

Figure 11.
The plastic strain contour of the shed tunnel with different rockfall masses. (a) m = 70.3 kg and after five impacts (b) m = 137.31 kg and after five impacts (c) m = 237.26 kg and after four impacts.
3.2.2. Effect of the Rockfall Impact Velocity
- (1)
- The impact force on the buffer layer
The calculation results of the time–history curve of the impact force on the buffer layer with different rockfall impact velocities and its peak are shown in Figure 12 and Table 5, respectively. The following conclusions can be obtained. First of all, when the impact velocity is fixed, the peak impact force increases rapidly after the second impact and then tends to be stable with an increasing impact number. When the rockfall impact velocity is 15 m/s, the peak impact force increases from 266.52 kN of the first impact to 326.66 kN of the second impact, whose increase extent is 22.56%. And then the increase extent of subsequent impacts is not as high as that of the second impact. The peak impact force reaches the maximum 363.20 kN in the fifth impact, which increases by 11.19% compared with the second impact. When the rockfall impact velocity is 20 m/s, the peak impact force rapidly increases from 311.36 kN of the first impact to 445.18 kN of the second impact, whose increase extent is 42.98%. The peak impact force reaches the maximum 484.25 kN at the fifth impact, which increases by 8.78% compared with the second impact. When the rockfall impact velocity is 25 m/s, the peak impact force rapidly increases from 421.33 kN of the first impact to 516.98 kN of the second impact, whose increase extent is 22.70%. The peak impact force reaches the maximum 569.11 kN at the fourth impact, which increases by 10.08% compared with the second impact. It indicates that the greater the rockfall impact velocity, the lower the impact number required to reach the peak impact force. What is more, comparing the time–history curves of the impact force with these three velocities, it can be seen that the lager the rockfall mass is, the greater the peak impact force is.
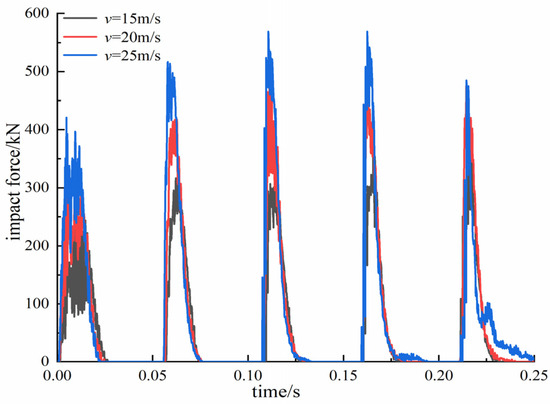
Figure 12.
The time–history curve of the impact force on the buffer layer with different rockfall impact velocity.
Table 5.
Results of the peak impact force on the buffer layer with different rockfall impact velocities (unit: kN).
- (2)
- The impact depth in the buffer layer
The calculation results of the time–history curve of the impact depth in the buffer layer with different rockfall impact velocities are shown in Figure 13, from which the following conclusions can be obtained. First of all, when the rockfall impact velocity is fixed, with an increasing impact number, the maximum impact depth gradually increases, but its increase extent is less than that of the first impact. When the rockfall impact velocity is 15 m/s, the impact depth of the first impact is 0.095 m, and that of the second impact is 0.027 m, which is only 28.42% of the first one. When the rockfall impact velocity is 20 m/s, the impact depth of the first impact is 0.115 m, and that of the second impact is 0.039 m, which is only 33.91% of the first one. When the rockfall impact velocity is 25 m/s, the impact depth of the first impact is 0.140 m, and that of the second impact is 0.056 m, which is only 40% of the first one. However, it can be seen that the increase extent increases much more after the fourth impact. This is mainly because the shed tunnel is seriously destroyed, which leads to significant displacement of the buffer layer. Meanwhile, when the rockfall impact velocity is small (15 m/s), the rebound ratio of each impact is large. However, when the rockfall impact velocity is large (25 m/s), the rebound ratio is small. Finally, the greater the rockfall impact velocity is, the greater the impact depth of the buffer layer is.

Figure 13.
The time–history curve of the impact depth in the buffer layer with different rockfall impact velocities.
- (3)
- The maximum plastic strain of the rebar
The calculation results of the time–history curve of the maximum plastic strain of the rebar with different rockfall impact velocities are shown in Figure 14, from which the following conclusions can be obtained. First of all, the maximum plastic strain of the rebar shows a monotonically increasing trend on the whole. Second, the plastic strain of the rebar increases rapidly first and then tends to be stable. Second, with increasing the rockfall impact velocity, the maximum plastic strain of the rebar increases, which is sensitive to the rockfall impact velocity, and the plastic strain produced by five rockfall impacts of 15 m/s is less than that produced by one rockfall impact of 25 m/s. When the rockfall impact velocity is small (15 m/s), the plastic strain is not generated in the first few impacts, but when the rockfall impact velocity is large (25 m/s), the plastic strain is generated at the second impact. When the rockfall impact velocity is 25 m/s, the plastic strain produced by five impacts is 0.058. When the rockfall impact velocity is 15 m/s, the plastic strain produced by five impacts is 0.00556, which is only 9.59% of the rockfall impact velocity at 25 m/s. When the rockfall impact velocity is 20 m/s, the plastic strain produced by five impacts is 0.0464, which is 79.93% of the rockfall impact velocity at 25 m/s.
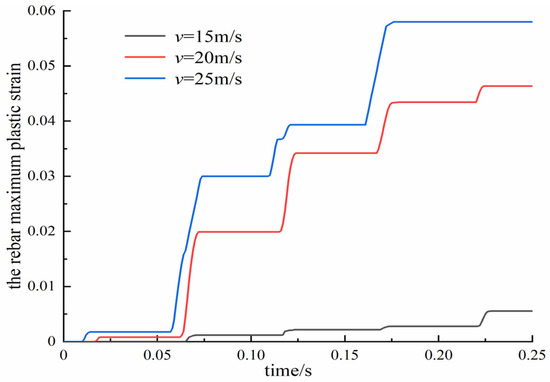
Figure 14.
The time–history curve of the rebar maximum plastic strain with different rockfall impact velocities.
- (4)
- The vertical displacement of the shed roof
The calculation results of the vertical displacement of the shed roof with different rockfall impact velocities are shown in Figure 15, from which the following conclusions can be obtained. First of all, when the rockfall impact velocity is fixed, the vertical displacement of the shed roof gradually increases with an increasing impact number, and it has the rebound phenomenon. When the rockfall impact velocity is small, the displacement rebound is greater. When the rockfall impact velocity is large, the displacement rebound is reduced. Meanwhile, when increasing the rockfall impact velocity, the vertical displacement of the shed roof increases significantly.
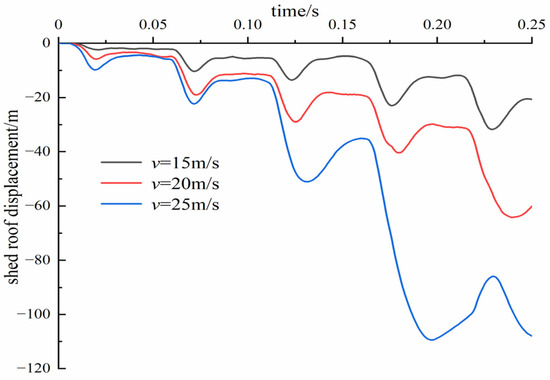
Figure 15.
The time–history curve of the vertical displacement of the shed roof with different rockfall impact velocities.
- (5)
- The maximum axial force of the rebar
The calculation results of the maximum axial force of the rebar with different rockfall impact velocities are shown in Figure 16, from which the following conclusions can be obtained. First of all, when the rockfall impact velocity is fixed, in the first few impacts, the axial force of the rebar basically shows a trend of increasing from zero to the maximum and then decreasing to zero. However, after several subsequent impacts, the axial force of the rebar will not recover to zero, because of the plastic deformation of the rebar, so a certain axial force remains. Comparing with the upper and lower rebars, the axial force of the lower rebars is obviously greater than that of the upper rebars, which indicates that the lower rebars bear greater tensile stress. What is more, comparing the calculation results with three rockfall impact velocities, it can be seen that the greater the rockfall impact velocity is, the greater the variation in the rebar axial force is.

Figure 16.
The maximum axial force of the rebar with different rockfall impact velocities.
- (6)
- The plastic strain of the shed tunnel
The calculation results of the plastic strain contour of the shed tunnel with different rockfall impact velocities are shown in Figure 17, from which the following conclusions can be obtained. After many impacts, large plastic deformation occurs in the shed tunnel, which mainly concentrates in and around the center of the shed tunnel. The greater the rockfall impact velocity is, the greater the plastic zone is and the greater the damage caused by the rockfall to the shed tunnel is. The plastic strain of the shed tunnel is sensitive to the rockfall impact velocity, and the damage range of the shed tunnel produced by five impacts of the rockfall with 15 m/s is far less than that produced by five impacts of rockfall at 25 m/s. When the rockfall impact velocity is 25 m/s, the shed tunnel almost completely fails after five impacts.
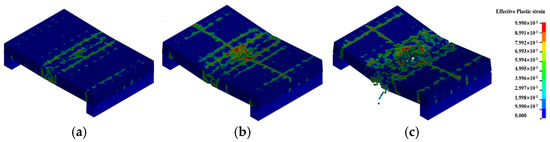
Figure 17.
The plastic strain contour of the shed tunnel with the rockfall impact velocity. (a) v = 15 m/s and after five impacts (b) v = 20 m/s and after five impacts (c) v = 25 m/s and after four impacts.
3.2.3. Effect of the Rockfall Shape
Assume the rockfall mass is all 137.31 kg; accordingly, three kinds of rockfall shapes are spheres with a radius of 0.25 m, cuboid 1 with 0.403 m × 0.403 m × 0.403 m and cuboid 2 with 0.570 m × 0.570 m × 0.201 m, respectively. The contact faces of the latter two rockfalls are 0.403 m × 0.403 m and 0.570 m × 0.570 m, respectively. The other calculation parameters are shown in Table 3.
- (1)
- The impact force on the buffer layer
The following results can be obtained from the calculation results shown in Figure 18 and Table 6. First of all, for the spherical rockfall, with an increasing impact number, the peak impact force increases rapidly from 311.36 kN of the first impact to 445.18 kN of the second impact, with an increase of 42.98%. And the growth rate of the subsequent impacts is lower than that of the second one. The peak impact force reaches 484.25 kN at the fifth impact, which increases by 8.78% compared with the second impact. For the cuboid rockfall, the peak impact force of the first impact is the largest, but that of the subsequent impacts decreases rapidly. When the bottom surface is 0.403 m × 0.403 m, the impact force generated by the first impact is the largest, reaching 1,180.86 kN, and then it decreases with an increasing impact number. It reaches the minimum of 518.67 kN at the fifth impact, which is only 43.92% of the first one. When the bottom surface is 0.570 m × 0.570 m, the peak impact force produced by the first impact is 1,960.09 kN, which is much greater than the subsequent ones. The peak impact force produced after the second impact reaches the minimum of 1090.65 kN, which is only 55.64% of the first one. Meanwhile, it can also be found that the impact force generated by the cuboid rockfall is much greater than that of the spherical rockfall, and the greater the contact area of the cuboid is, the greater the impact force is.

Figure 18.
The time–history curve of the impact force on the buffer layer with different rockfall shapes.
Table 6.
Results of the peak impact force on the buffer layer with different rockfall shapes (unit: kN).
- (2)
- The impact depth in the buffer layer
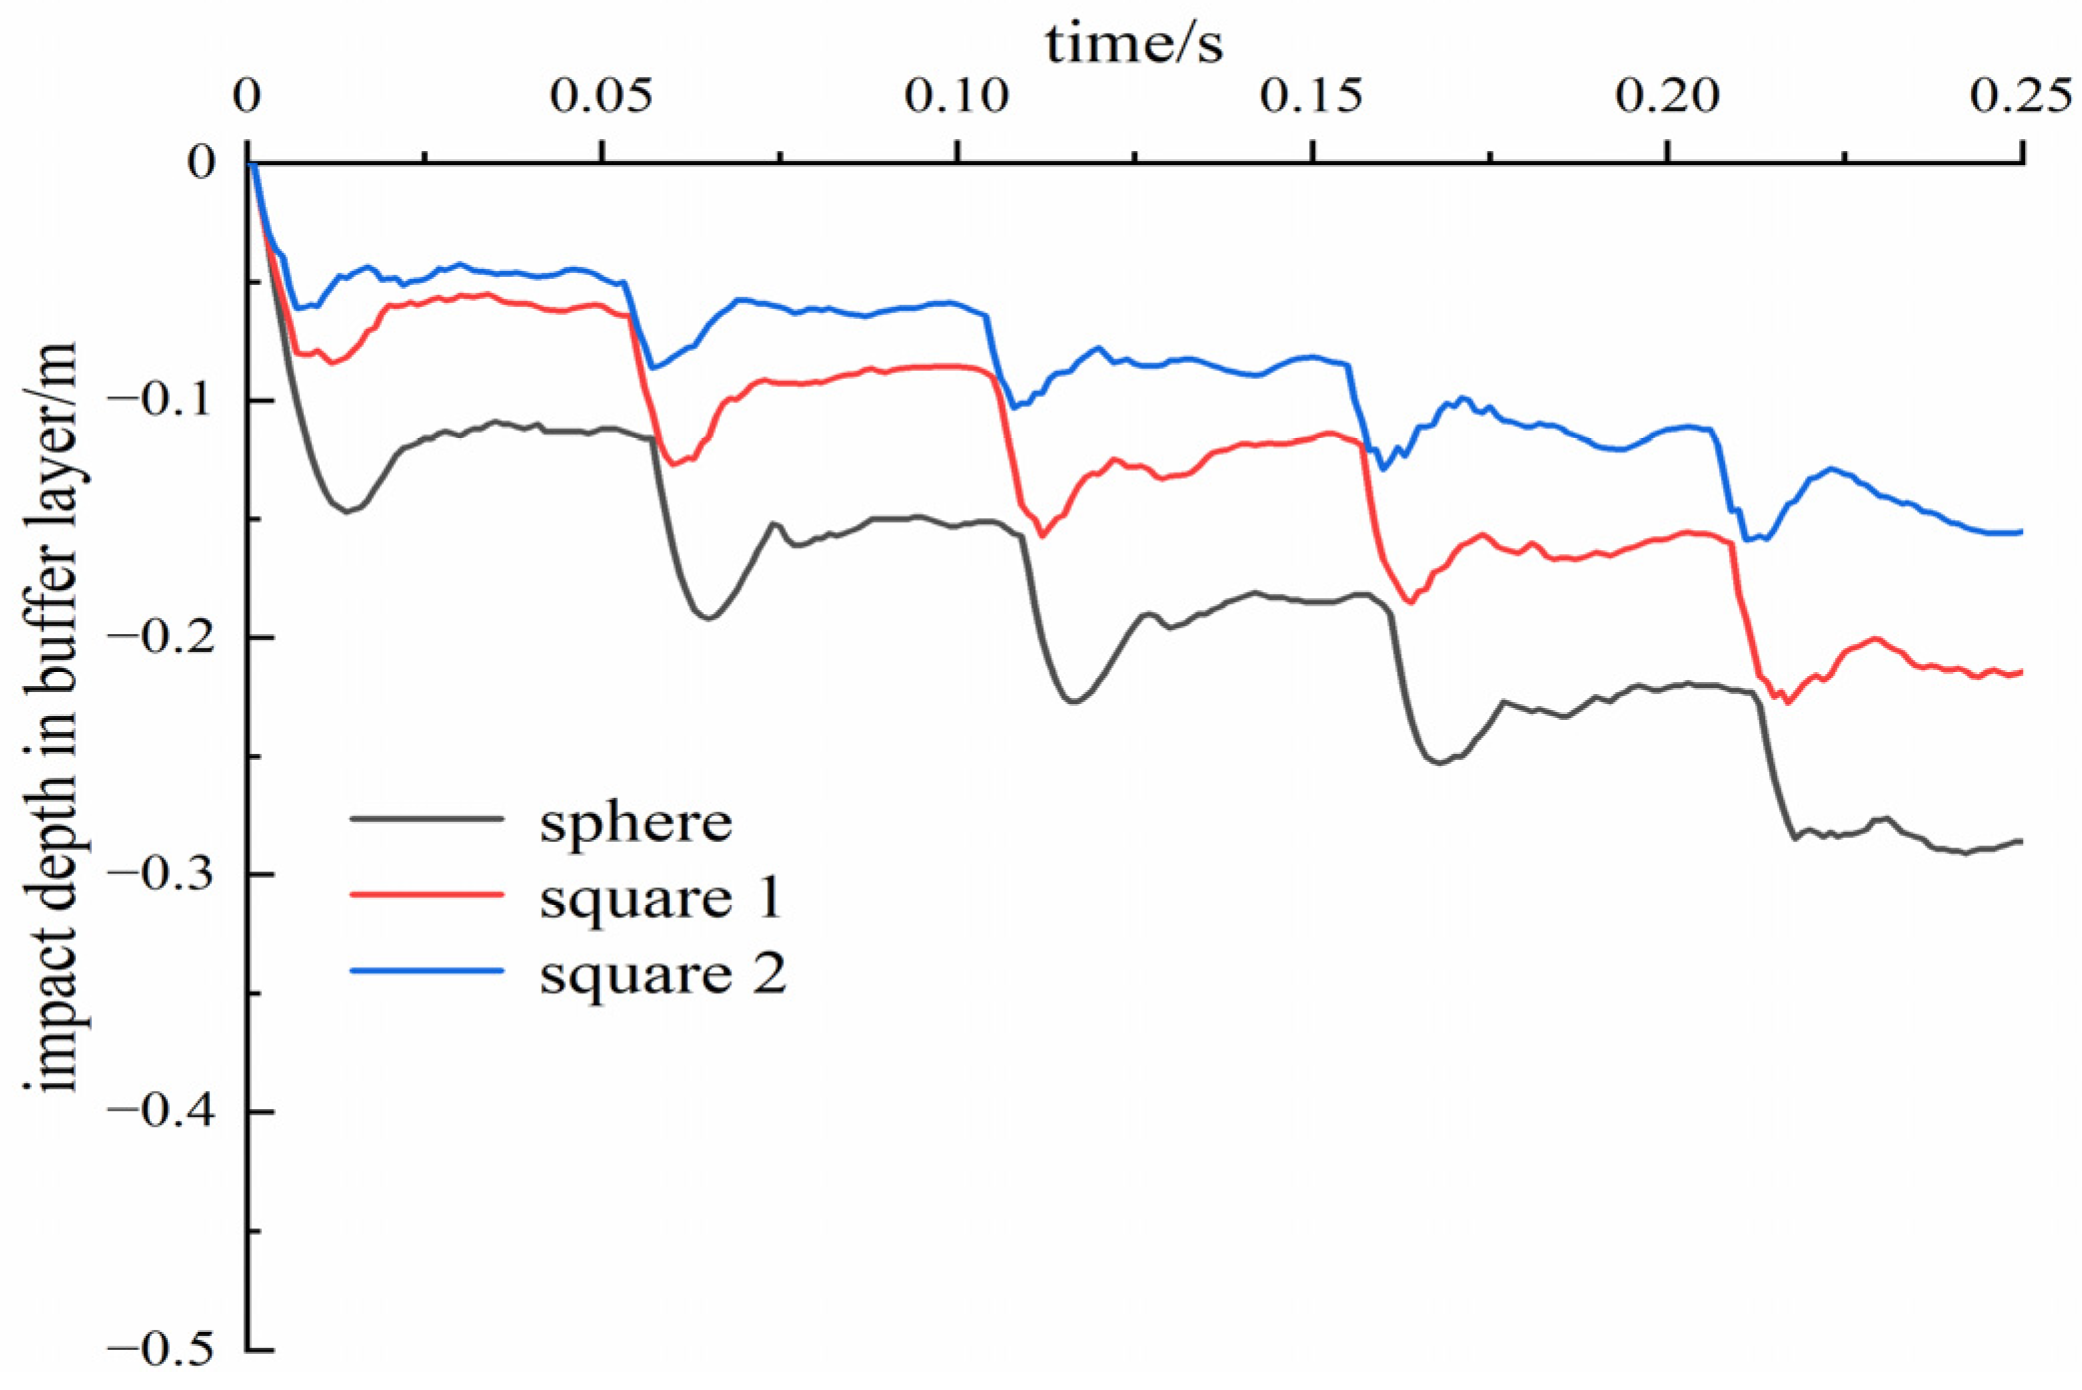
The calculation results of the time–history curve of the impact depth in the buffer layer with different rockfall shapes are shown in Figure 19, from which the following conclusions can be obtained. First of all, with an increasing impact number, the maximum impact depth gradually increases, but its increase extent is less than that of the first impact. When the rockfall shape is spherical, the impact depth of the first impact is 0.0115 m, and that of the second impact is 0.039 m, which is only 33.91% of the first one. For the cuboid rockfall, when its bottom surface is 0.403 m × 0.403 m, the impact depth generated by the first impact is 0.081 m, and that of the second impact is 0.033 m, which is only 40.74% of the first one. When its bottom surface is 0.570 m × 0.570 m, the impact depth generated by the first impact is 0.069 m, and that of the second impact is 0.026 m, which is only 37.68% of the first one. Meanwhile, the rebound displacement caused by the cuboid rockfall is much greater than that of the spherical one. Finally, the impact depth caused by the cuboid rockfall is less than that of the spherical one. For the cuboid rockfall, the greater the contact area, the lower the impact depth.
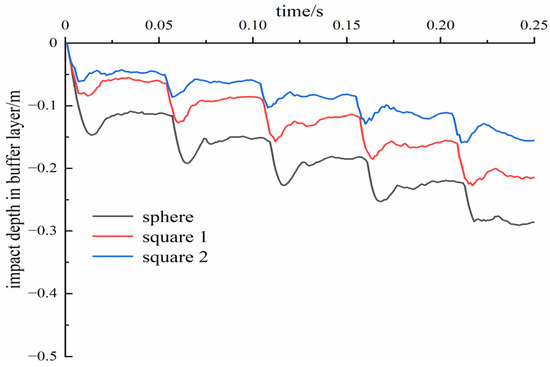
Figure 19.
The time–history curve of the impact depth in the buffer layer with different rockfall shapes.
- (3)
- The maximum plastic strain of the rebar
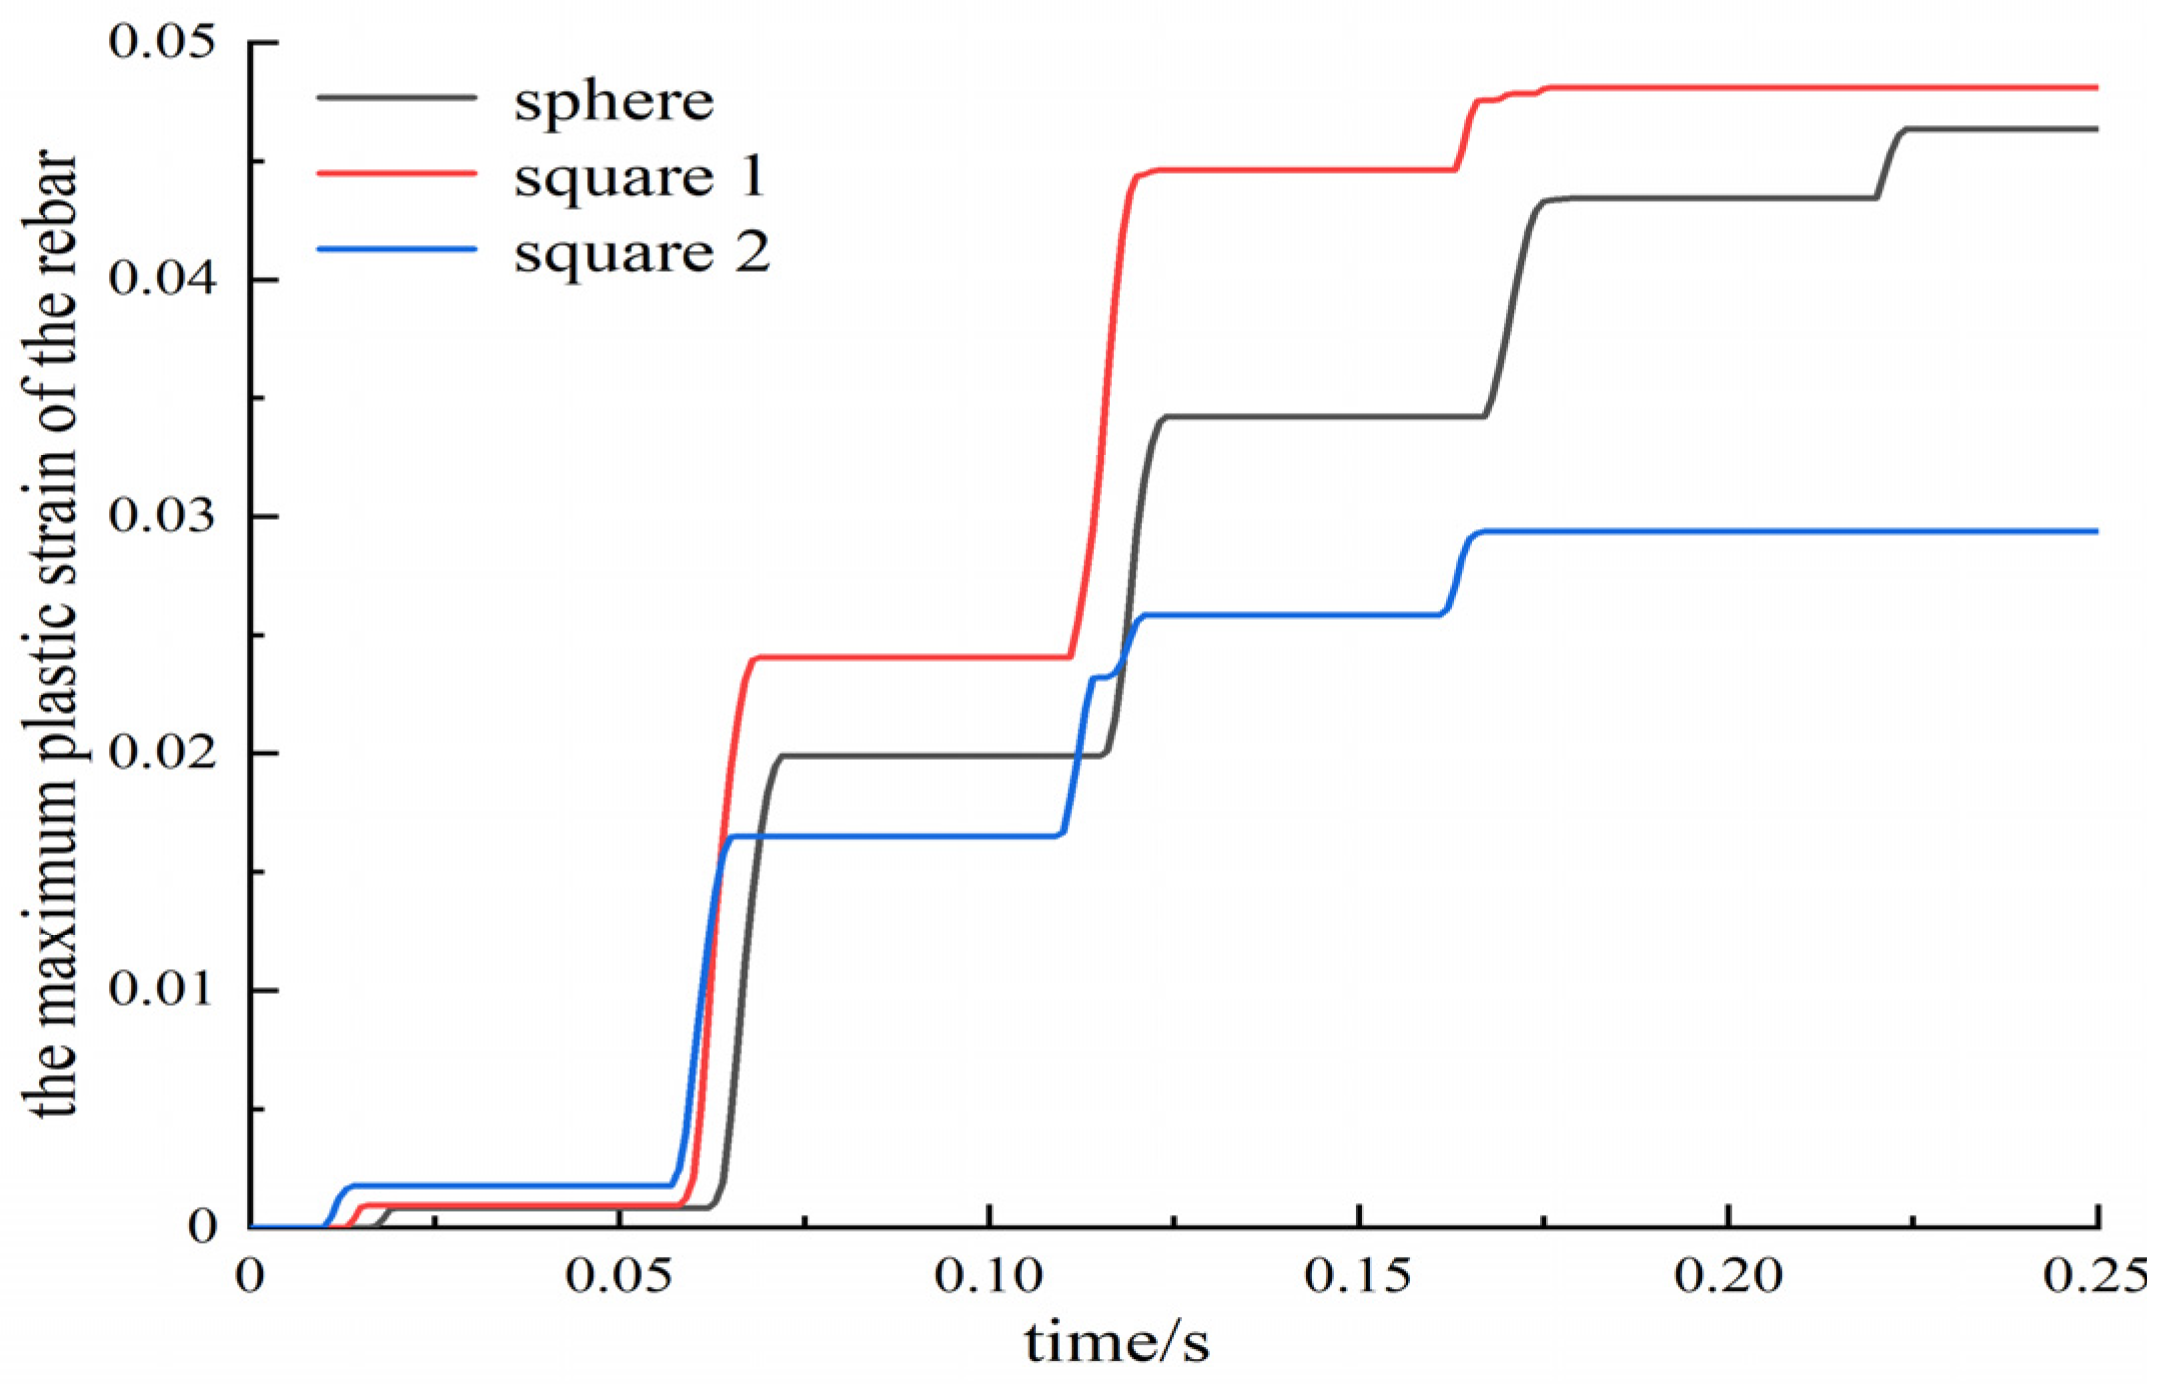
The calculation results of the time–history curve of the maximum plastic strain of the rebar with different rockfall shapes are shown in Figure 20, from which the following conclusions can be obtained. First of all, the maximum plastic strain of the rebar shows a monotonically increasing trend on the whole. The plastic strain of the rebar increases rapidly first and then tends to be stable. Second, when the rockfall mass and impact velocity are fixed, the rockfall shape has a significant effect on the maximum plastic strain of the rebar. Particularly, for cuboid rockfall, the greater the contact force, the lower the maximum plastic strain of the rebar. When the rockfall is spherical, the plastic strain produced by five impacts is 0.0464. When the rockfall is cuboid with a bottom surface of 0.403 m × 0.403 m, the plastic strain produced by five impacts is 0.0481, which is 103.66% of the spherical rockfall. When the rockfall is cuboid with a bottom surface of 0.570 m × 0.570 m, the plastic strain produced by five impacts is 0.0294, which is 63.36% of the spherical rockfall.

Figure 20.
The time–history curve of the maximum plastic strain of the rebar with different rockfall shapes.
- (4)
- The vertical displacement of the shed roof
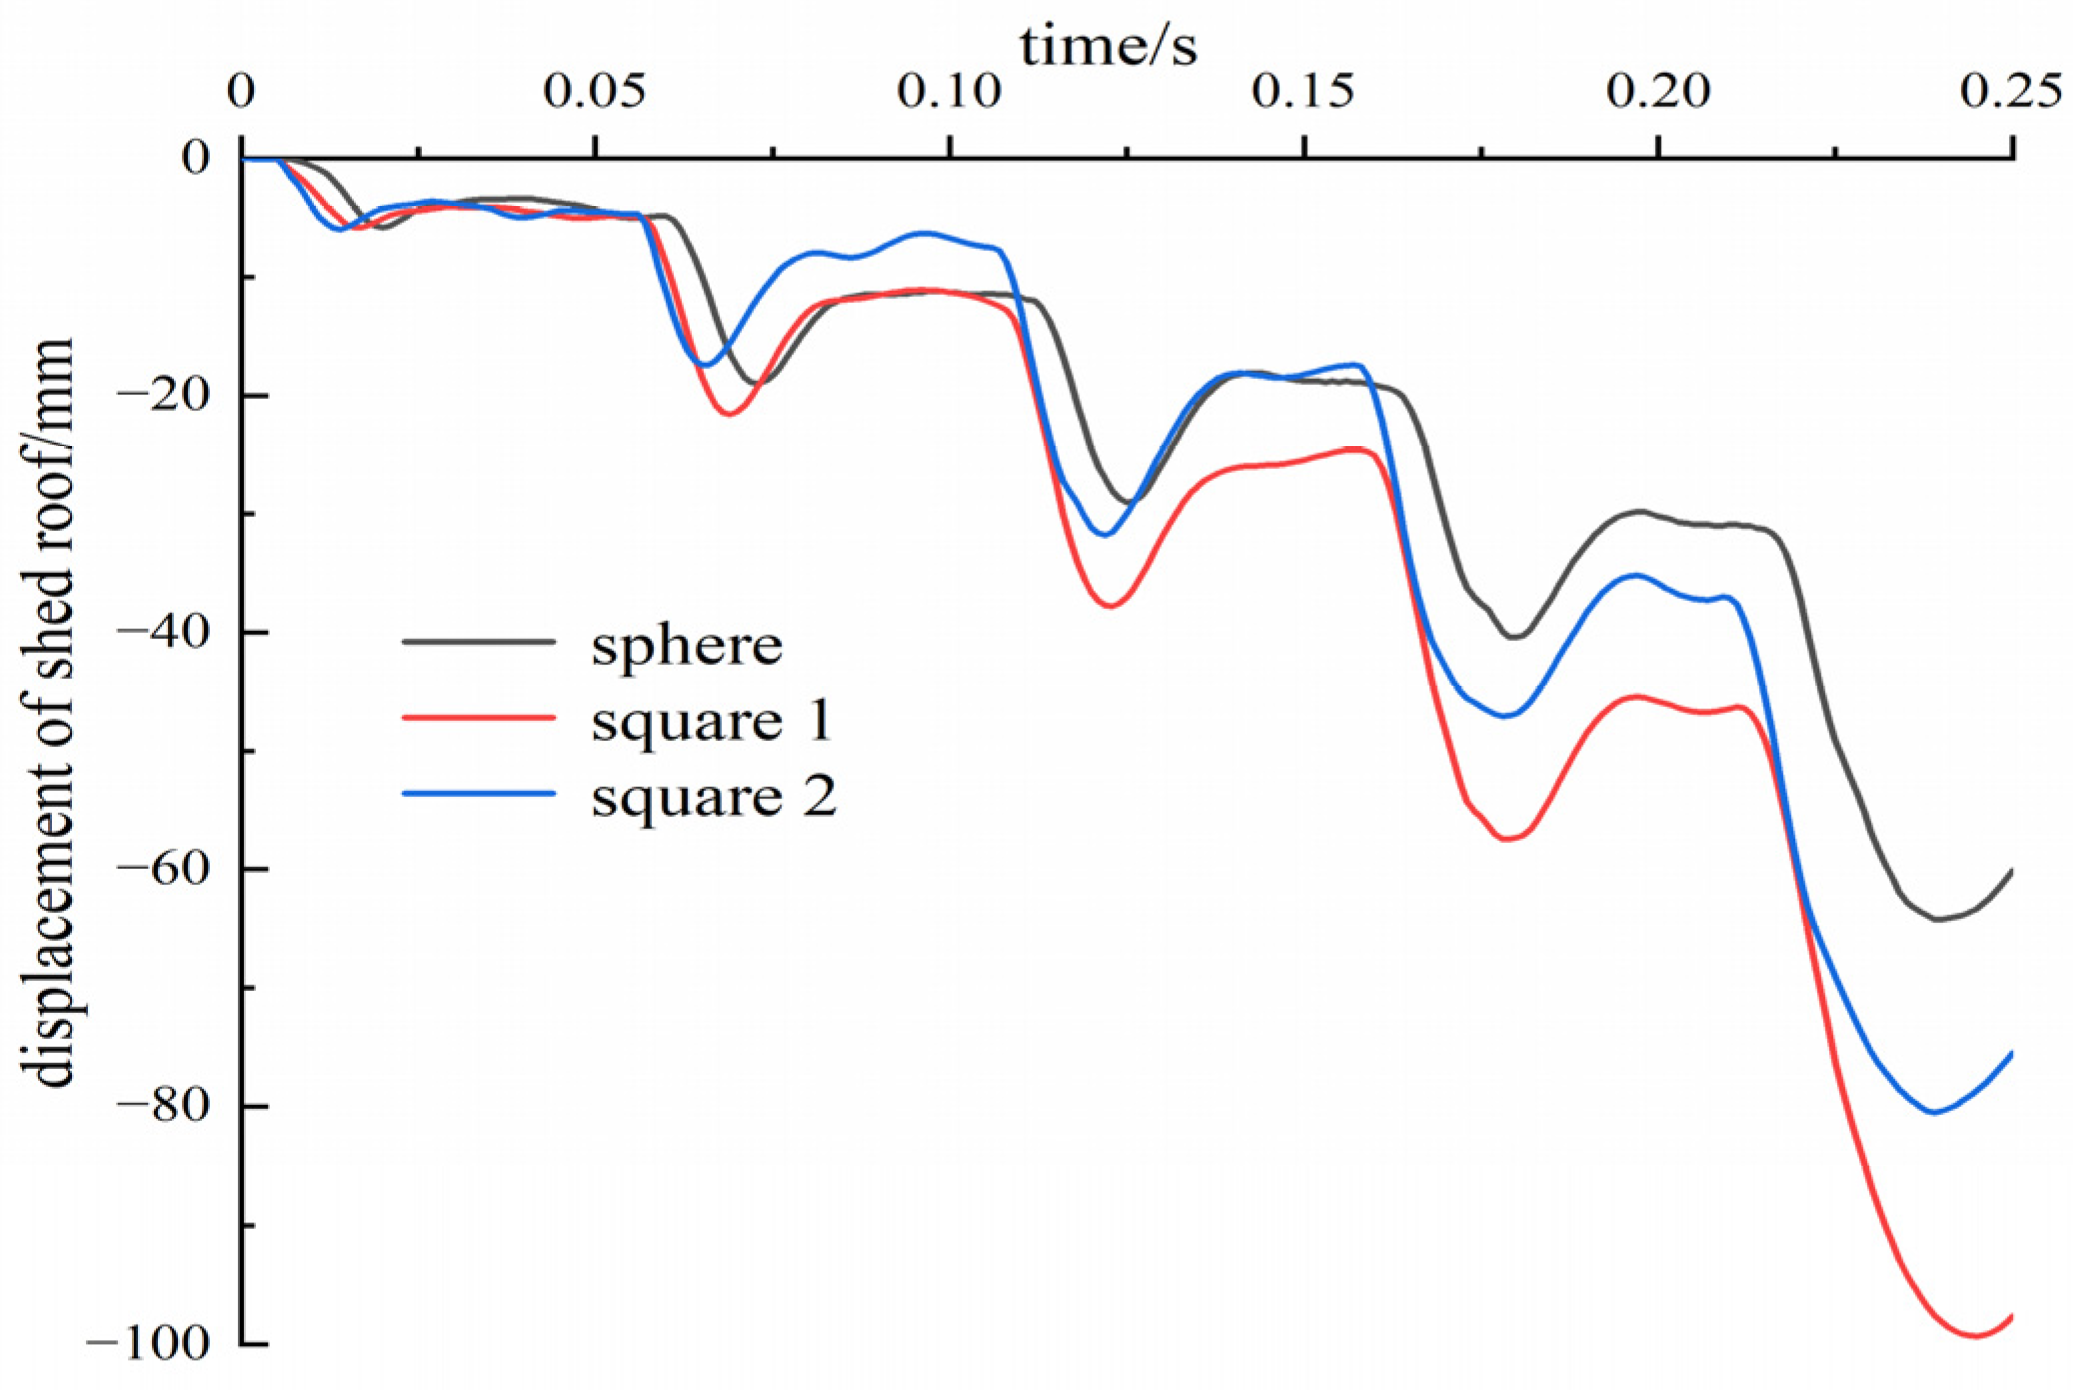
The calculation results of the vertical displacement of the shed roof with different rockfall shapes are shown in Figure 21, from which the following conclusions can be obtained. First of all, it can be seen that with an increasing impact number, the vertical displacement of the shed roof gradually increases. When the rockfall is spherical, the rebound ratio of each impact is large. However, when the rockfall is cuboid, the proportion of rebound is relatively small. Moreover, it can also be seen that when the rockfall is cuboid, the vertical displacement of the shed roof increases faster than that of spherical rockfall. Meanwhile, the greater the contact area, the slower the vertical displacement of the shed roof increases.
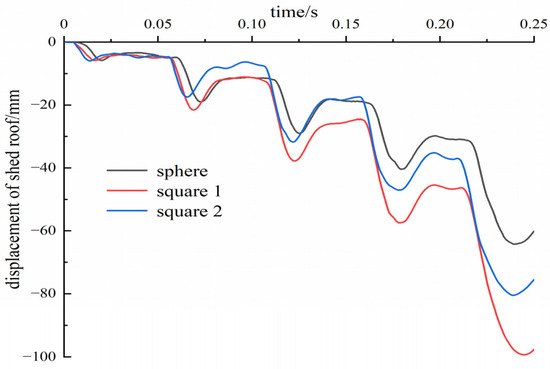
Figure 21.
The time–history curve of the vertical displacement of the shed roof with different rockfall shapes.
- (5)
- The maximum axial force of the rebar
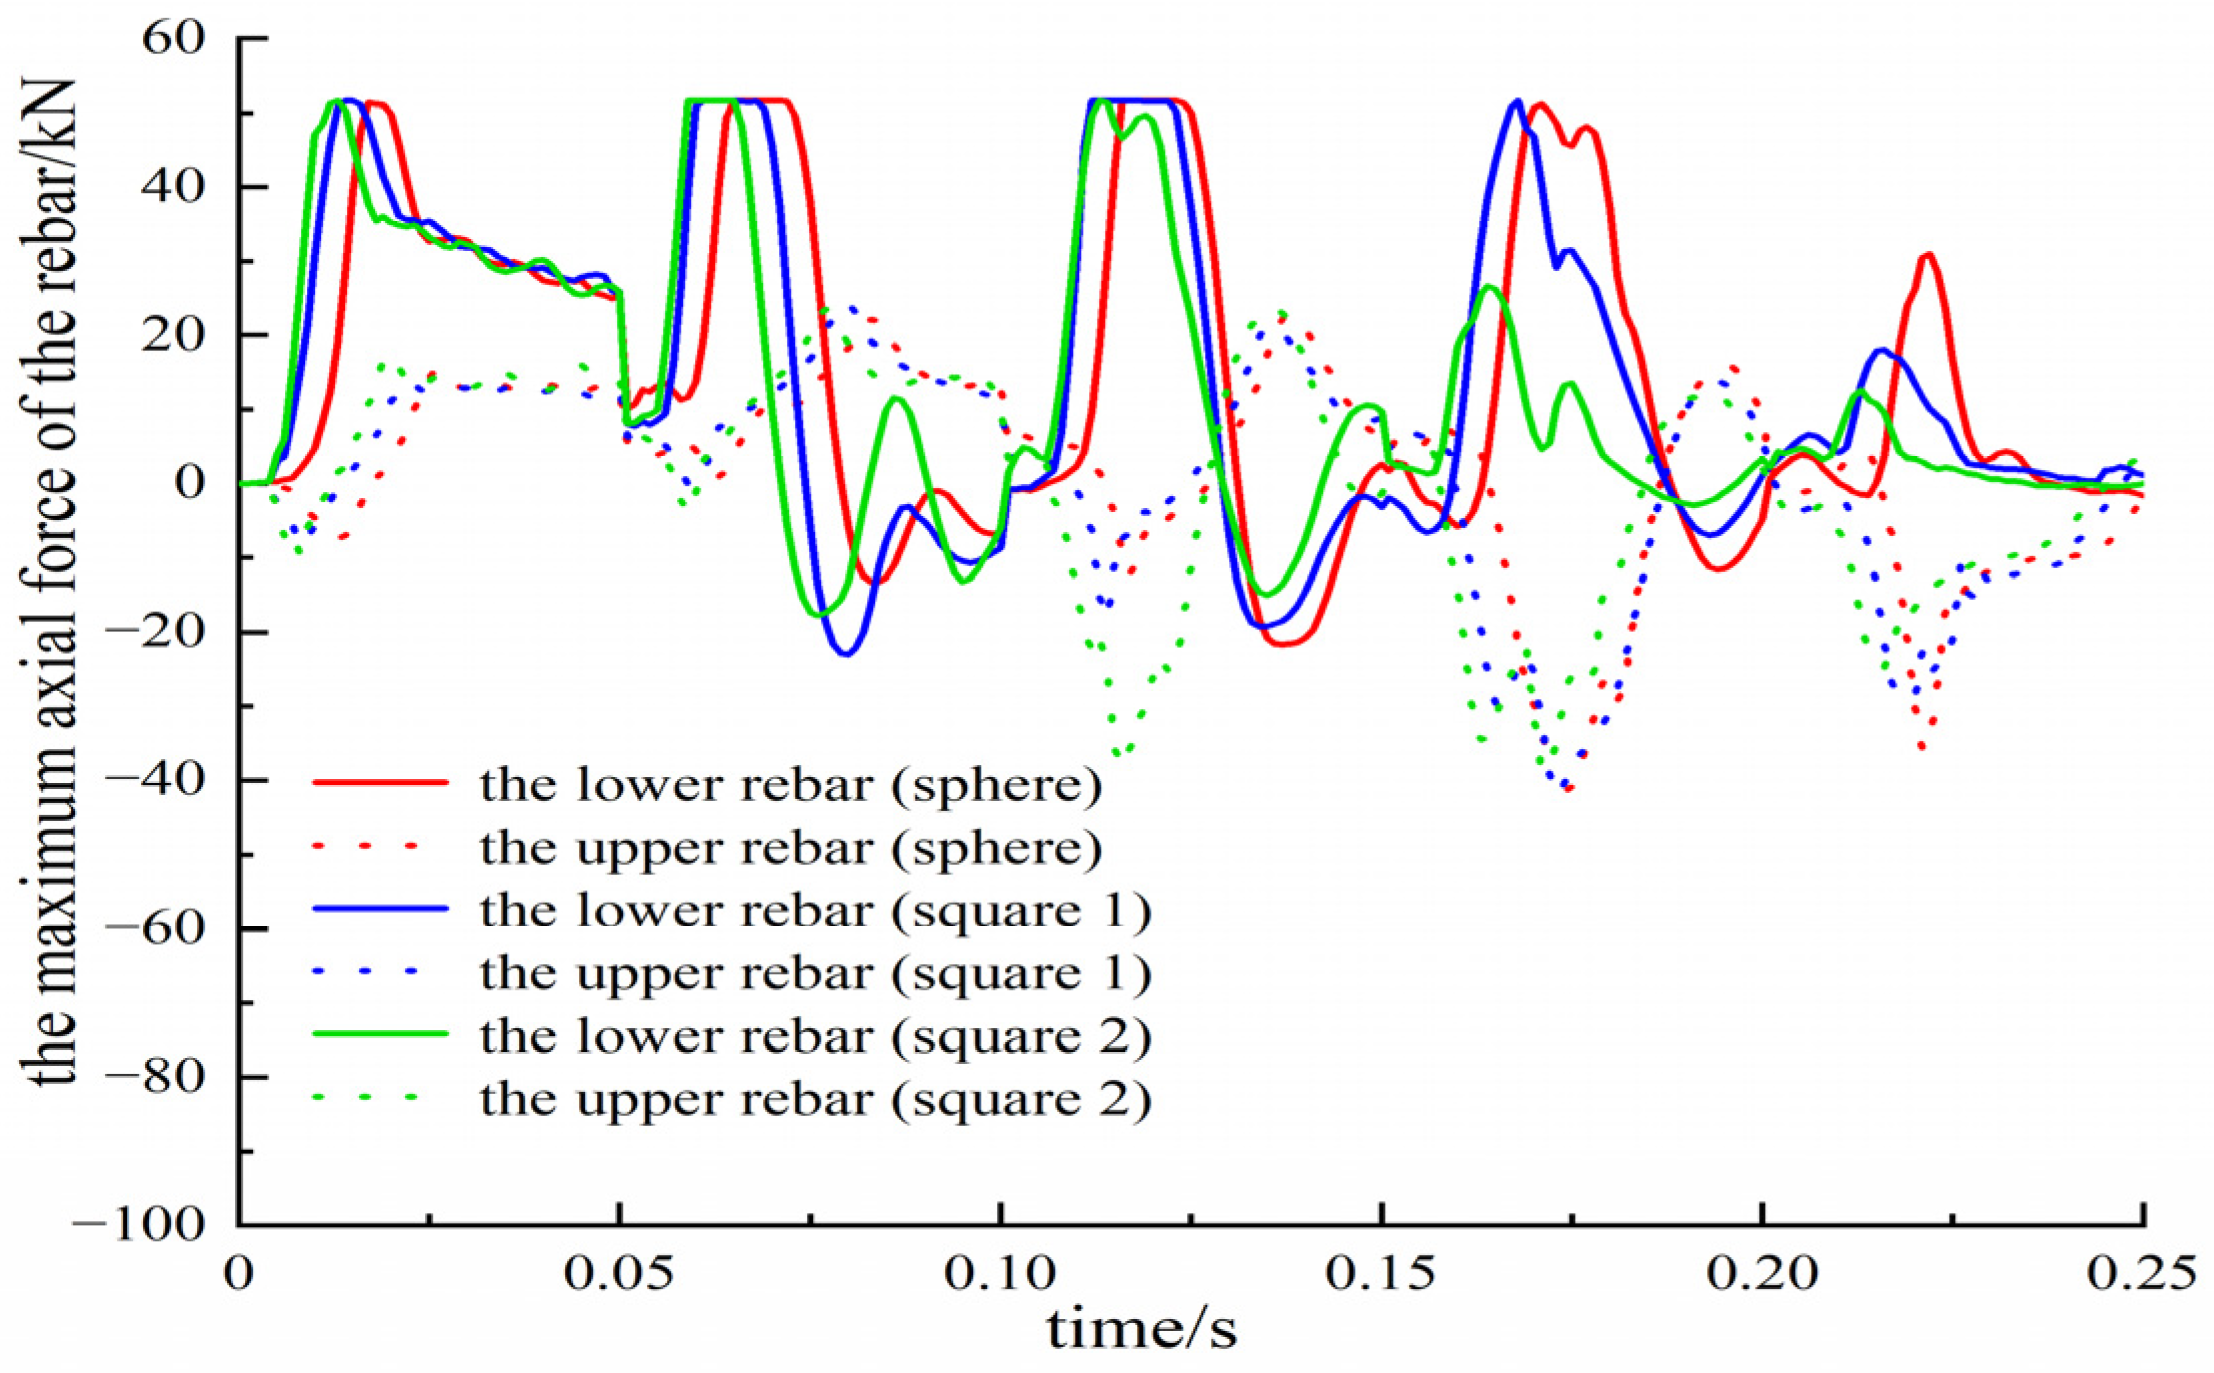
The calculation results of the maximum axial force of the rebar with different rockfall shapes are shown in Figure 22, from which the following conclusions can be obtained. First of all, when the rockfall shape is fixed, the upper and lower layers of the rebars fluctuate in two states of tension and compression. The lower rebar is mainly subjected to tension, while the upper rebar is mainly subjected to compression, which is because the lower rebar bears the tensile stress of the lower part of the shed-tunnel structure. Meanwhile, it can be seen that the rockfall shape has a small effect on the axial force of the rebar.
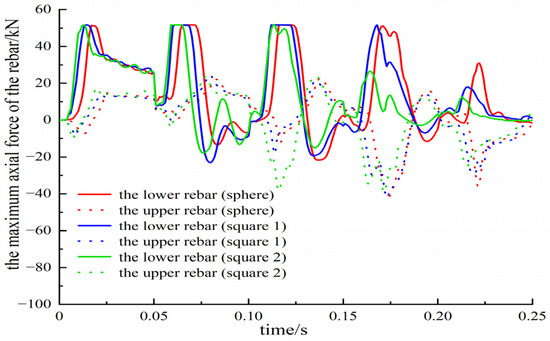
Figure 22.
The maximum axial force of the rebar with different rockfall shapes.
- (6)
- The plastic strain of the shed tunnel
The calculation results of the plastic strain contour of the shed tunnel with different rockfall shapes are shown in Figure 23, from which the following conclusions can be obtained. After many impacts, large plastic deformation occurs in the shed tunnel, which mainly concentrates in and around the center of the shed tunnel. The plastic strain of the shed tunnel is sensitive to the rockfall shape, and the plastic deformation of the shed tunnel produced by the cuboid rockfall is far less than that produced by the spherical rockfall. For the cuboid rockfall, the less contact area there is, the greater the plastic deformation and damage to the shed tunnel. When the impact number reaches five, the shed tunnel almost completely fails.
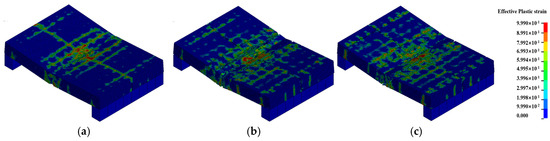
Figure 23.
The plastic strain contour of the shed tunnel with the rockfall shape. (a) Sphere and after five impacts; (b) square 1 and after five impacts; (c) square 2 and after four impacts.
3.2.4. Effect of the Rockfall Impact Angle
- (1)
- The impact force on the buffer layer
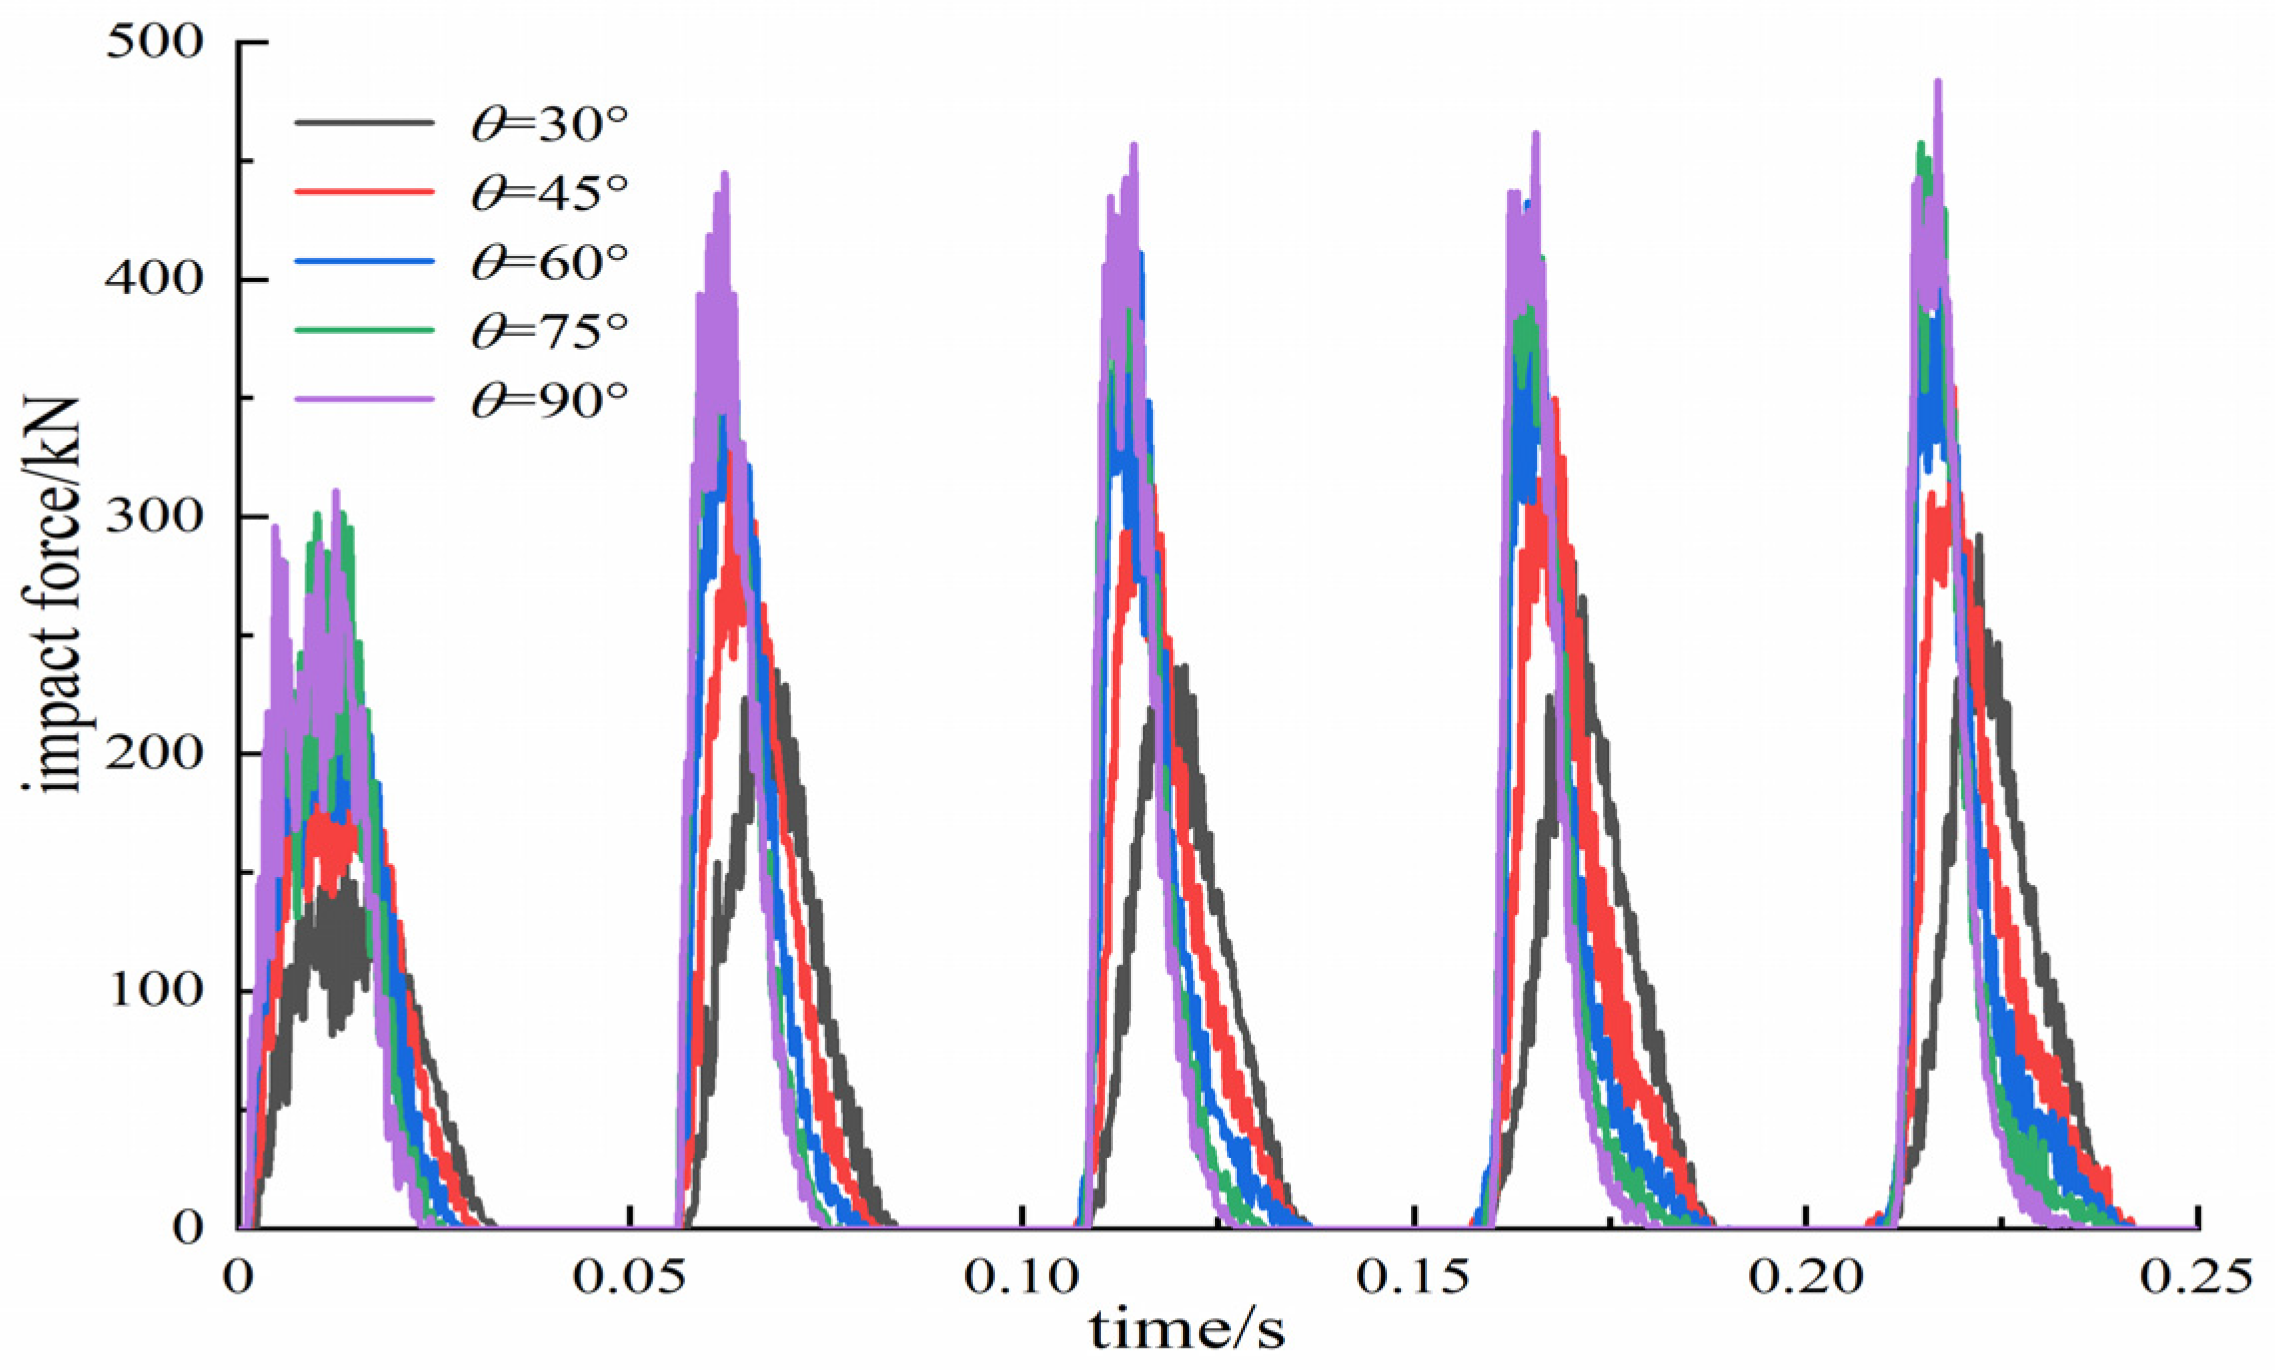
The following results can be obtained from the calculation results shown in Figure 24 and Table 7. First of all, with an increasing impact number, the peak impact force increases rapidly from the second impact and then tends to be stable. When the impact angle is 30°, the peak impact force increases from 153.25 kN of the first impact to 339.96 kN of the second one, an increase of 53.40%. It reaches 292.45 kN at the fifth impact, which increases by 24.40% compared with the second one. When the impact angle is 45°, the peak impact force increases from 215.55 kN of the first impact to 333.96 kN of the second one, an increase of 54.93%. It reaches 354.67 kN in the fifth impact, which increases by 6.20% compared with the second one. When the impact angle is 60°, the peak impact force increases by 45.47% from 268.76 kN of the first impact to 390.97 kN in the second impact. The peak impact force reaches 432.65 kN at the fourth impact, which increases by 10.66% compared with the second impact. When the impact angle is 75°, the peak impact force increases from 301.69 kN of the first impact to 409.63 kN of the second impact, an increase of 35.78%. The peak impact force reaches 457.75 kN at the fifth impact, an increase of 11.75% compared with the second one. When the impact angle is 90°, the peak impact force increases from 311.36 kN of the first impact to 445.18 kN of the second one, an increase of 42.98%. The peak impact force reaches 484.25 kN at the fifth impact, which increases by 8.78% compared with the second one. Moreover, it can be seen that the greater the impact angle is, the greater the peak impact force is.
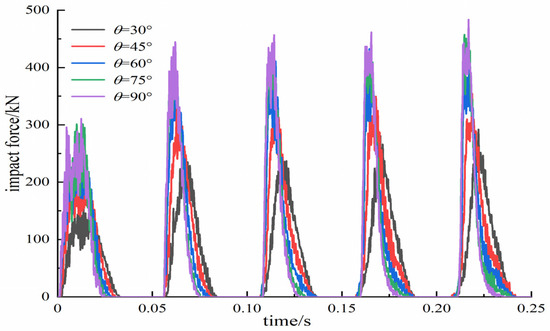
Figure 24.
The time–history curve of the impact force on the buffer layer with different rockfall impact angles.
Table 7.
Results of the peak impact force on the buffer layer with different rockfall impact angles (unit: kN).
- (2)
- The impact depth in the buffer layer
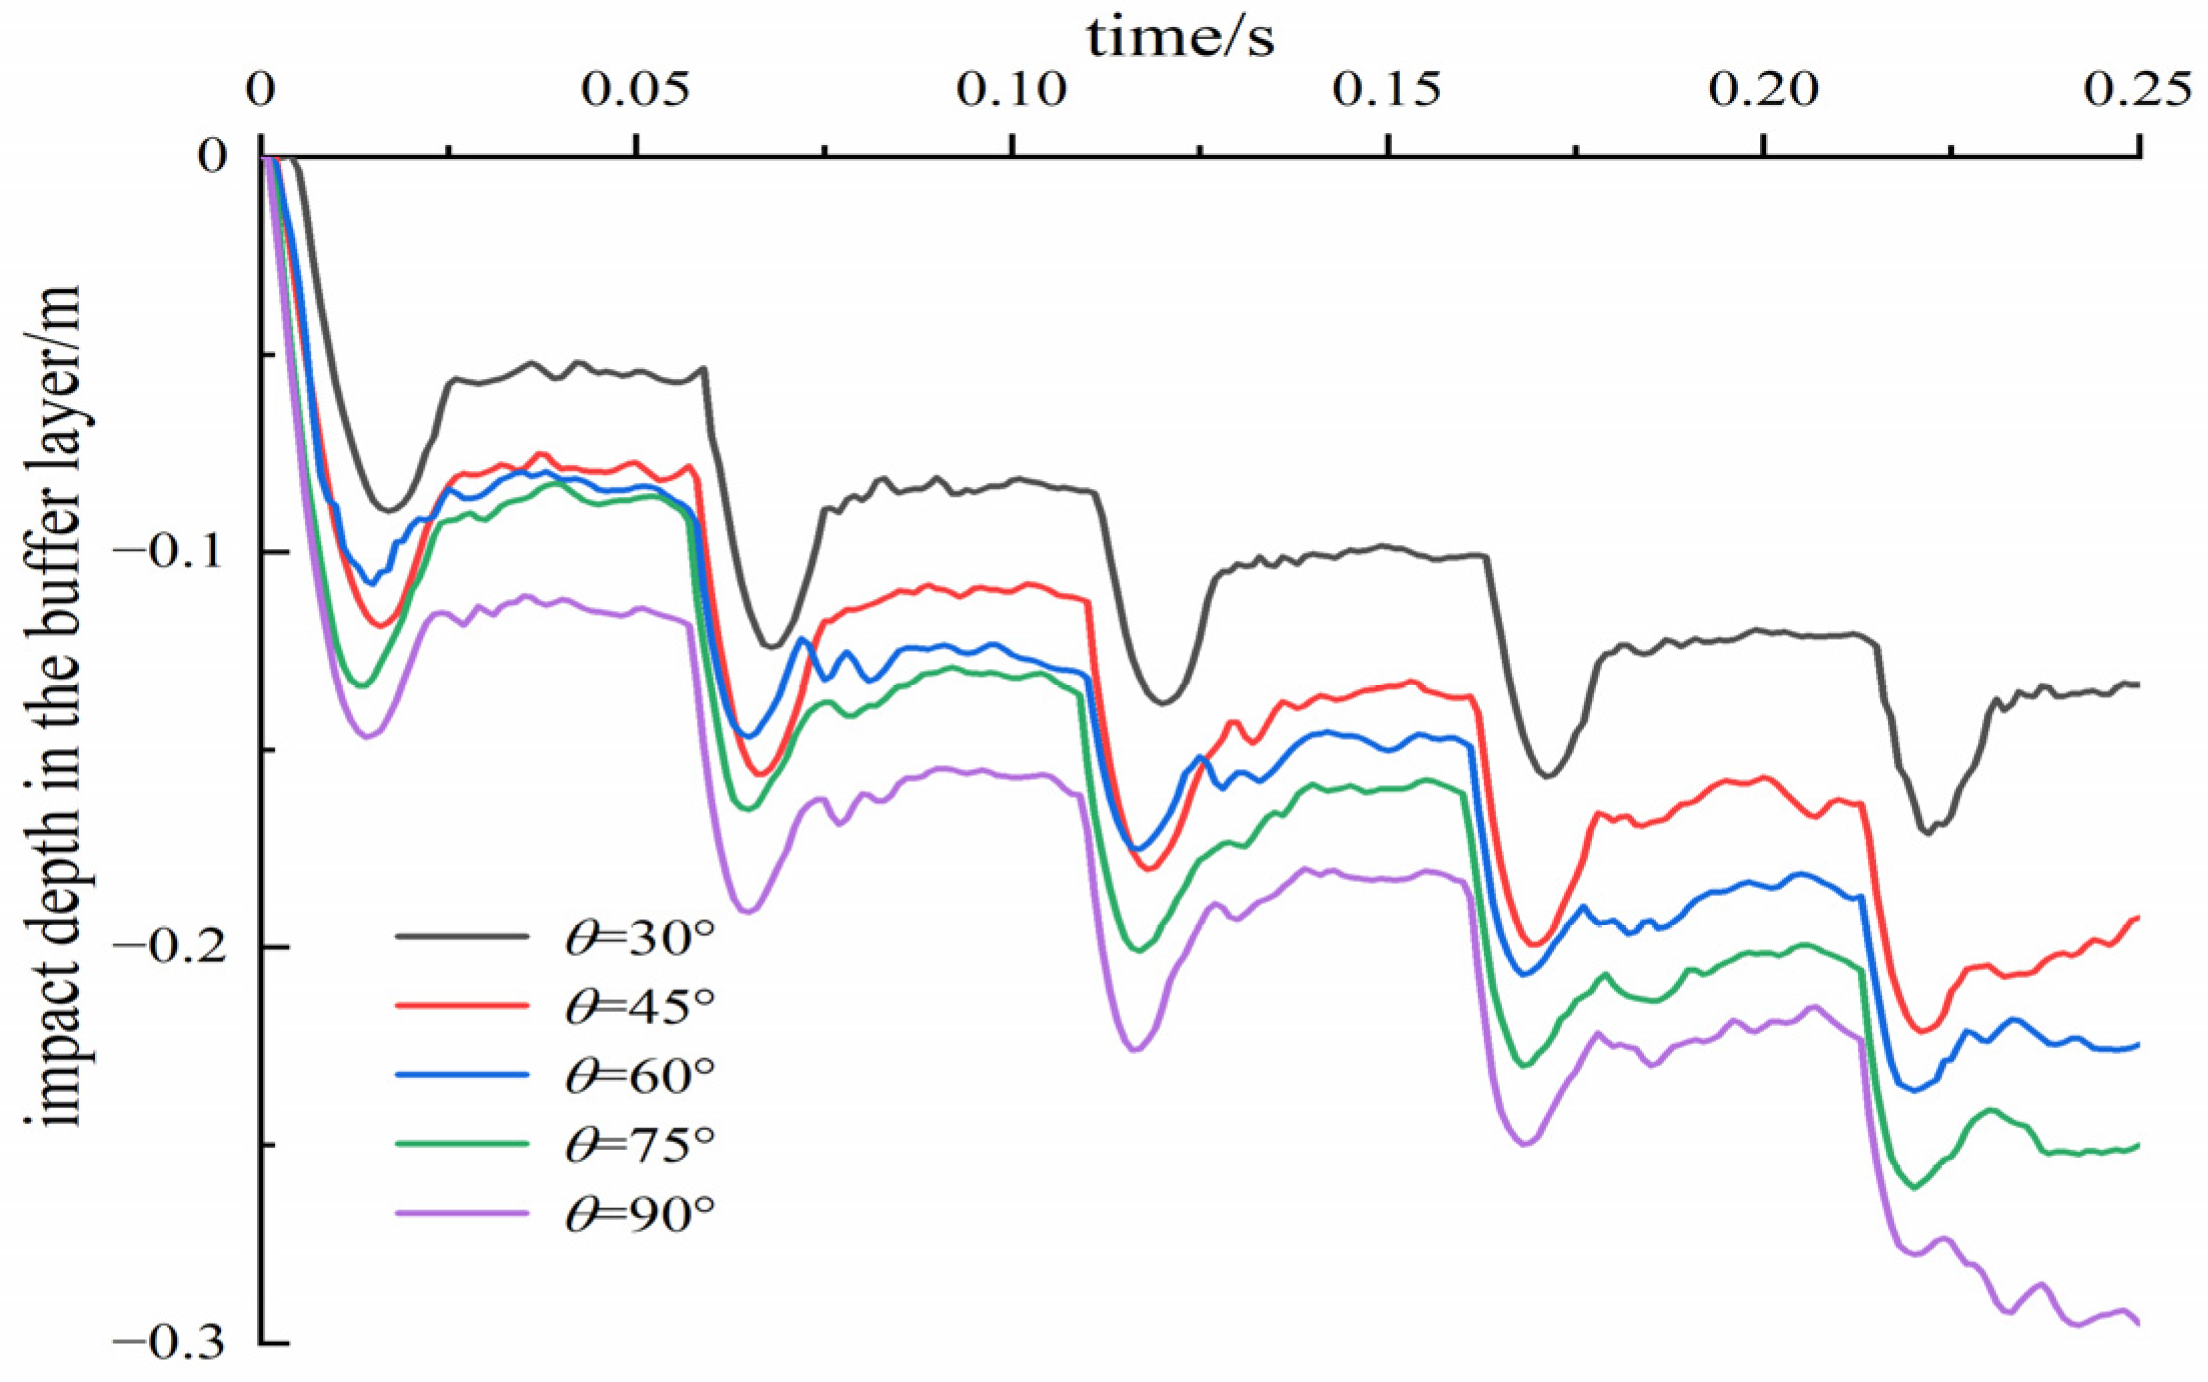
The calculation results of the time–history curve of the impact depth in the buffer layer with different rockfall impact angles are shown in Figure 25, from which the following conclusions can be obtained. First of all, with an increasing impact number, the maximum impact depth gradually increases, but its increase extent is less than that of the first impact. When the rockfall impact angle is 30°, the impact depth of the first impact is 0.056 m, and that of the second impact is 0.027 m, which is only 48.21% of the first one. When the rockfall impact angle is 45°, the impact depth of the first impact is 0.082 m, and that of the second impact is 0.027 m, which is only 32.93% of the first one. When the rockfall impact angle is 60°, the impact depth of the first impact is 0.084 m, and that of the second impact is 0.044 m, which is only 52.38% of the first one. When the rockfall impact angle is 75°, the impact depth of the first impact is 0.086 m, and that of the second impact is 0.045 m, which is only 52.33% of the first one. When the rockfall impact angle is 90°, the impact depth of the first impact is 0.115 m, and that of the second impact is 0.039 m, which is only 33.91% of the first one. Moreover, it can also be found that the greater the impact angle is, the greater the impact depth of the buffer layer is.
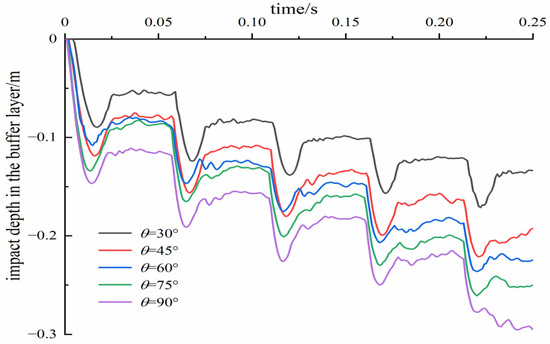
Figure 25.
The time–history curve of the impact depth in the buffer layer with different rockfall impact angles.
- (3)
- The maximum plastic strain of the rebar
The calculation results of the time–history curve of the maximum plastic strain of the rebar with different rockfall impact angle are shown in Figure 26, from which the following conclusions can be obtained. First of all, the maximum plastic strain of the rebar shows a monotonically increasing trend on the whole. The plastic strain of the rebar increases rapidly first and then tends to be stable. Second, it can also be found that the greater the rockfall impact angle is, the faster the maximum plastic strain of the rebar increases. The maximum plastic strain of the rebar is sensitive to the rockfall impact angle. When the impact angle is small (30°), the plastic strain is nearly not generated, but when it is large (90°), the plastic strain is generated in the first impact. When the rockfall impact angle is 90°, the plastic strain produced by five impacts is 0.06187. When the rockfall impact angle is 30°, the plastic strain produced by five impacts is 0.0001931, which is only 0.31% of the rockfall impact angle of 90°. When the rockfall impact angle is 45°, the plastic strain produced by five impacts is 0.01445, which is 23.36% of the rockfall impact angle of 90°. When the rockfall impact angle is 75°, the plastic strain produced by five impacts is 0.04636, which is 74.93% of the rockfall impact angle of 90°.
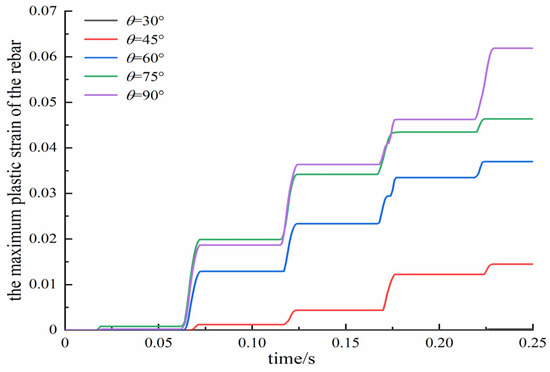
Figure 26.
The time–history curve of the maximum plastic strain of the rebar with different rockfall impact angles.
- (4)
- The vertical displacement of the shed roof
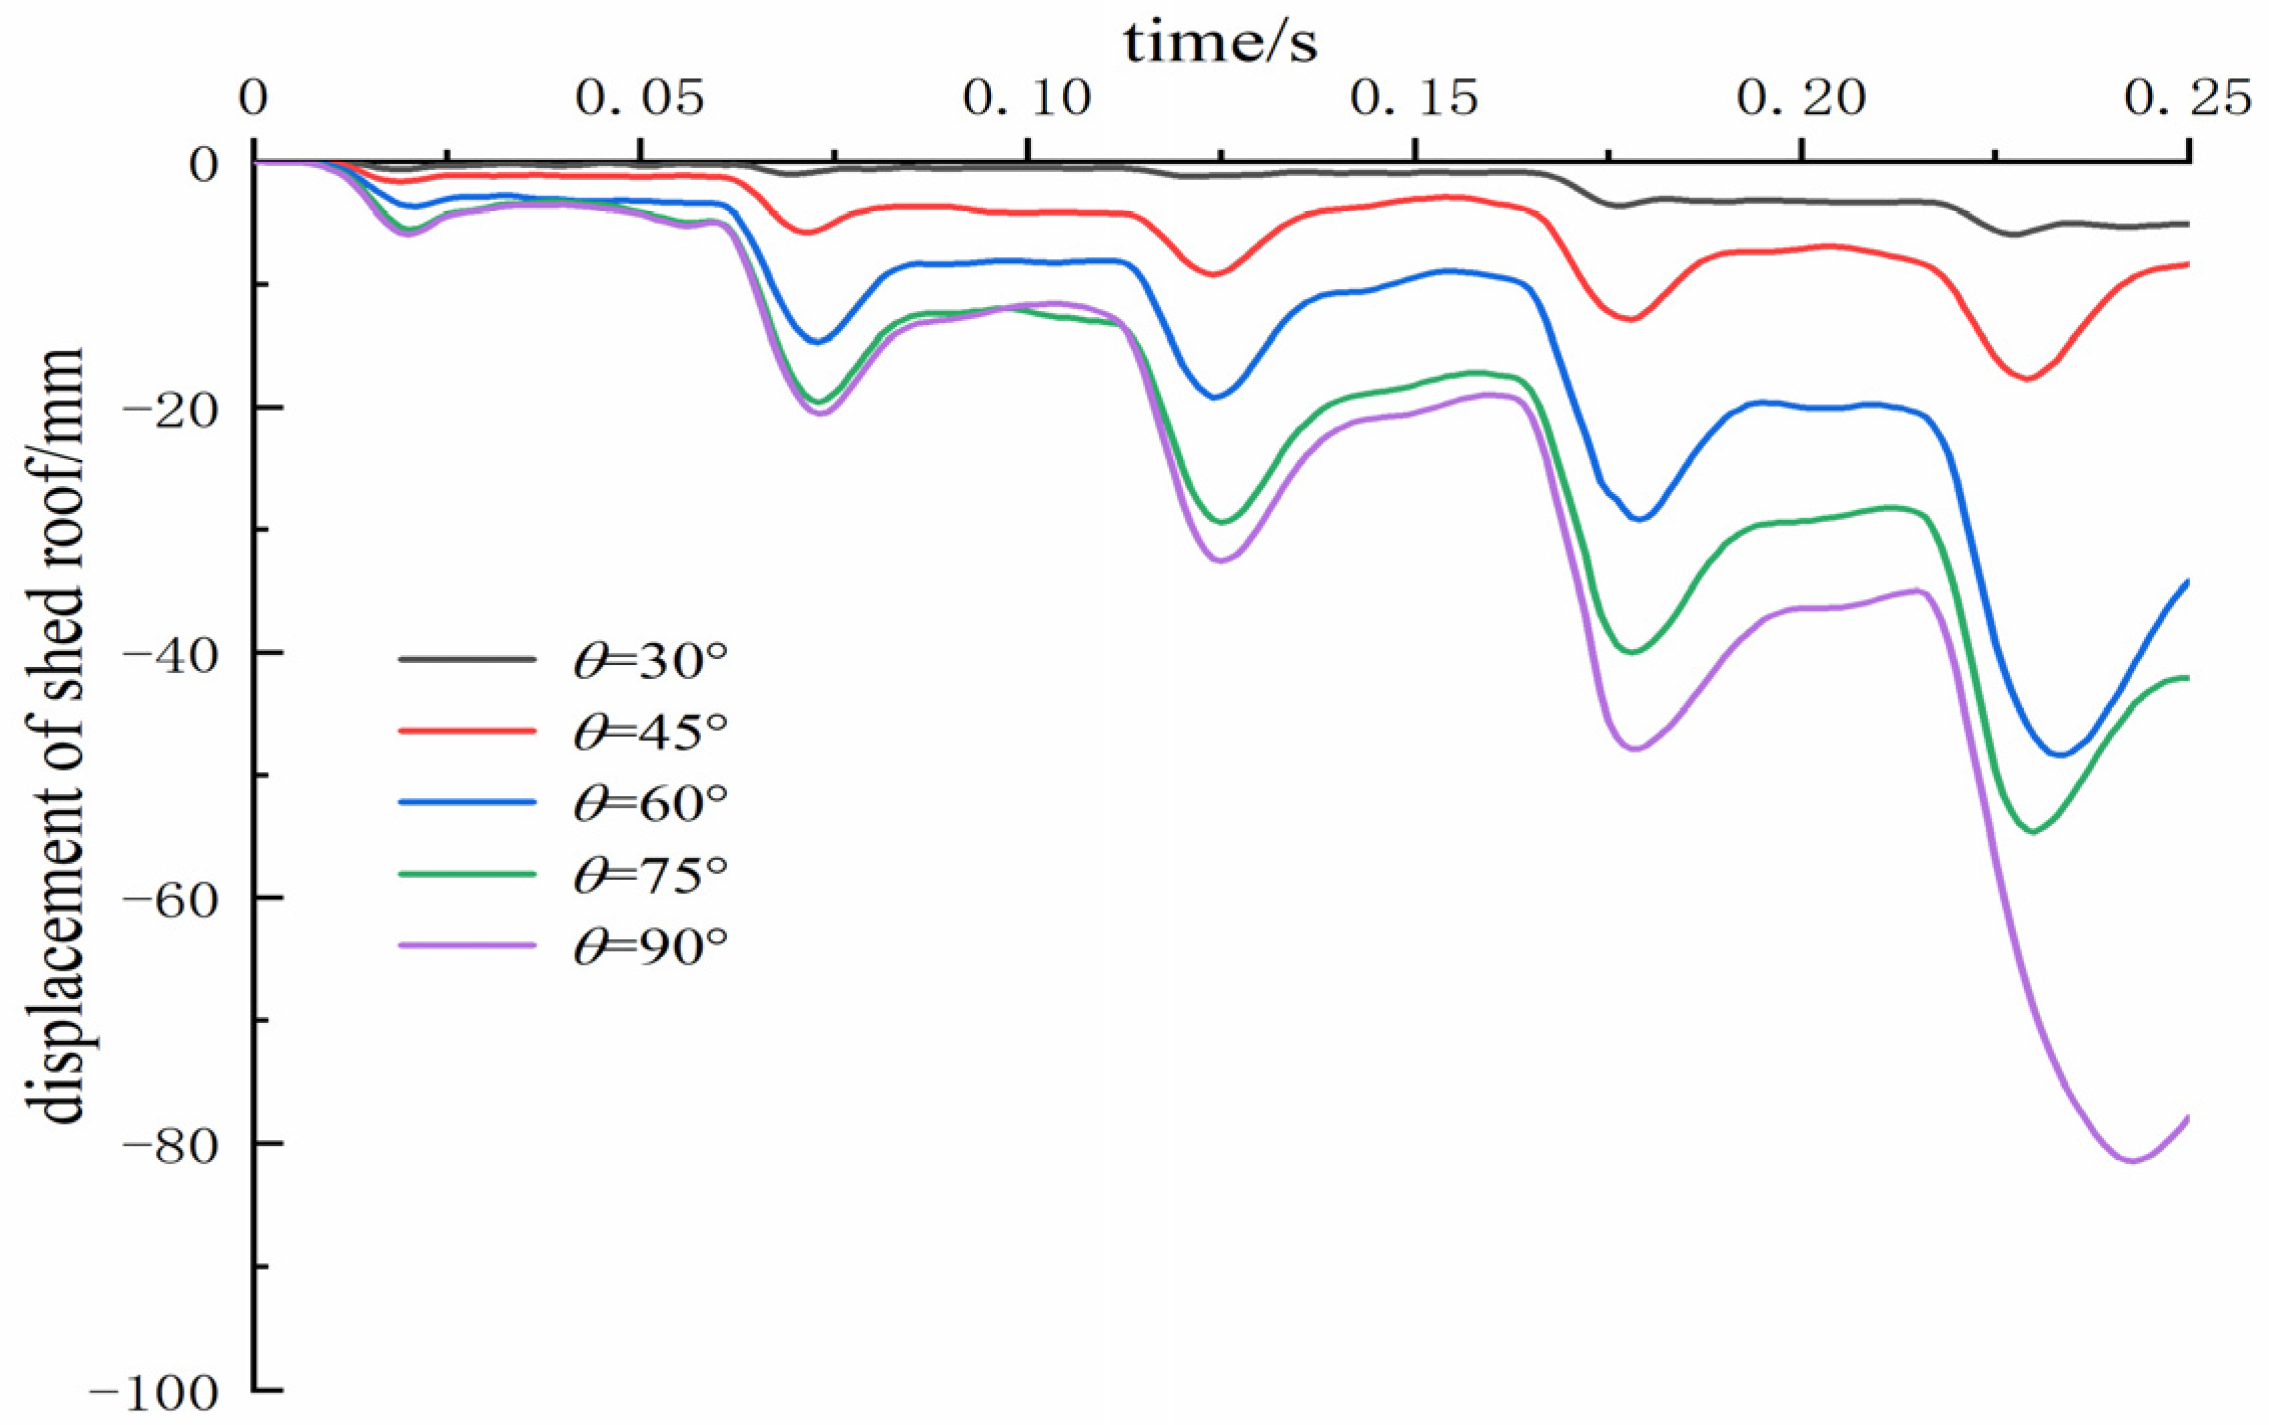
The calculation results of the vertical displacement of the shed roof with different rockfall impact angles are shown in Figure 27, from which the following conclusions can be obtained. First of all, it can be seen that with an increasing impact number, the vertical displacement of the shed roof gradually increases. When the rockfall impact angle is small, the rebound ratio of each impact is large. However, when the rockfall impact angle is large, the proportion of rebound is relatively small. Moreover, it can also be seen that the greater the impact angle is, the faster the vertical displacement of the shed roof increases.
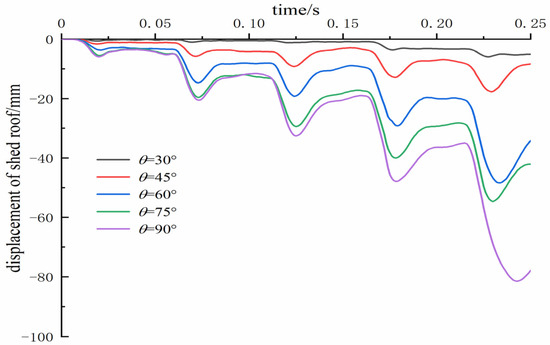
Figure 27.
The time–history curve of the vertical displacement of the shed roof with different rockfall impact angles.
- (5)
- The maximum axial force of the rebar
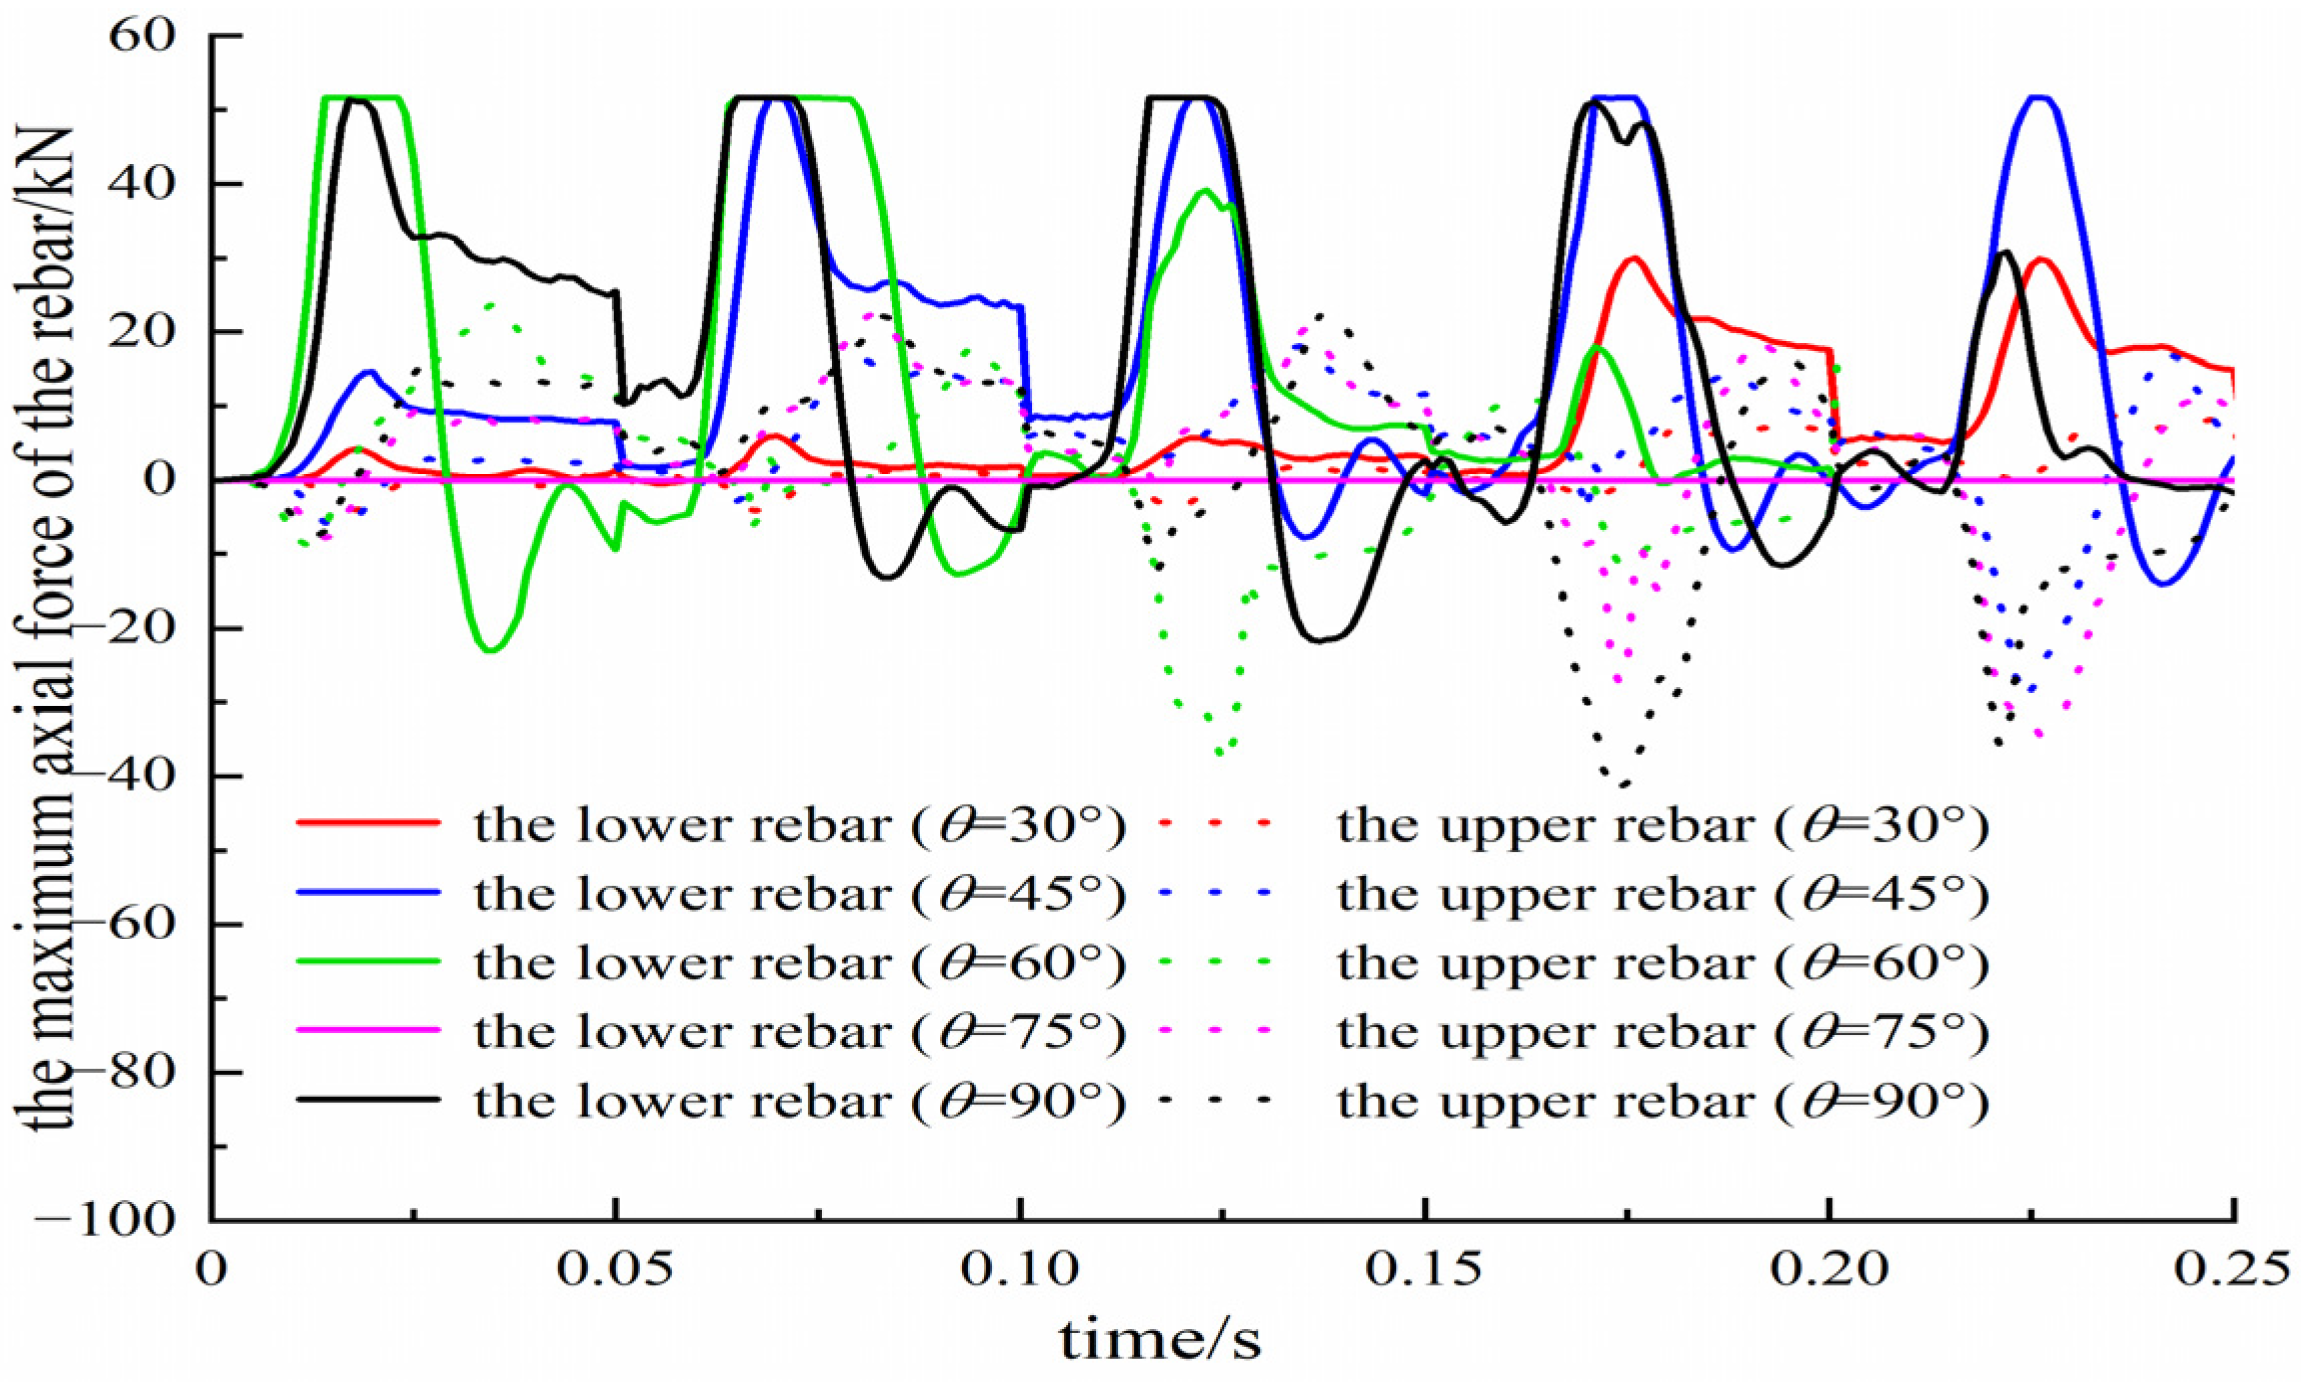
The calculation results of the maximum axial force of the rebar with different rockfall impact angles are shown in Figure 28, from which the following conclusions can be obtained. First of all, when the rockfall impact angle is fixed, the upper and lower layers of the rebars fluctuate in two states of tension and compression. The lower rebar is mainly subjected to tension, while the upper rebar is mainly subjected to compression, which is because the lower rebar bears the tensile stress of the lower part of the shed-tunnel structure. Meanwhile, it can be seen that the impact angle has a small effect on the axial force of the rebar.
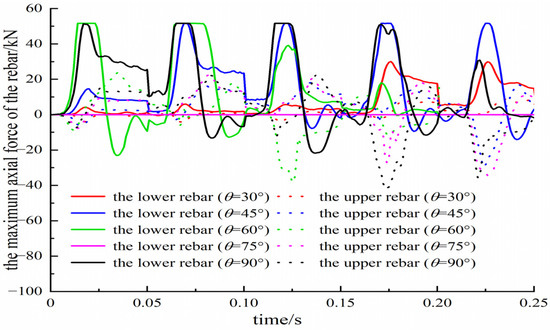
Figure 28.
The maximum axial force of the rebar with different rockfall impact angles.
- (6)
- The plastic strain of the shed tunnel
The calculation results of the plastic strain contour of the shed tunnel with different rockfall impact angles are shown in Figure 29, from which the following conclusions can be obtained. After many impacts, large plastic deformation occurs in the shed tunnel, which mainly concentrates in and around the center of the shed tunnel. The greater the rockfall impact angle is, the greater the plastic zone is and the greater the damage caused by the rockfall to the shed tunnel is. The maximum plastic strain of the shed tunnel is sensitive to the rockfall impact angle, and the plastic strain of the shed tunnel produced by five impacts of the rockfall impact angle 30° is far less than that produced by five impacts of the 90° angle rockfall impact.

Figure 29.
The plastic strain contour of the shed-tunnel with the rockfall impact angle after five impacts. (a) θ = 30° (b) θ = 45° (c) θ = 60° (d) θ = 75° (e) θ = 90°.
3.3. Mechanism Analysis of the Shed-Tunnel Structure’s Dynamic Response to Repeated Rockfall Impacts
According to the simulation results in Section 3.2, the dynamic response of the shed-tunnel structure under repeated rockfall impacts is significantly different from that under single rockfall impacts. First, when the number of rockfall impacts reaches a critical value, the dynamic response of the shed-tunnel structure, such as the displacement of the shed-tunnel roof, will have a sudden change, as shown in Figure 8, Figure 15, Figure 21 and Figure 27. It indicates that the shed tunnel has obvious damage, which is the result of the cumulative damage caused by repeated rockfall impacts. It shows that the cumulative damage caused by repeated rockfall impacts is not a simple accumulation of single rockfall impacts but that there is a mutating effect. Next, the mutating effect caused by repeated rockfall impacts is also closely related to the rockfall mass and impact velocity, and when it reaches a certain critical value, the corresponding mutating effect starts to appear. As illustrated in Section 3.2, when the rockfall mass is 70.3 kg and 137.3 kg, respectively, there is almost no mutating effect under the same impact number. When the rockfall mass is 237.26 kg, the displacement of the shed-tunnel structure has an obvious mutating effect at the fourth impact. Moreover, the effect of the impact number on the impact force is studied. From Section 3.2.1, it can be seen that when the rockfall mass is small, the impact force gradually increases with the impact number. This is because the buffer layer is loose in the initial stage, so its energy dissipation effect is large, and the corresponding rockfall impact force is small. With an increasing impact number, the buffer layer is gradually compacted, its energy dissipation effect is also gradually weakened, and then the impact force gradually increases. However, when the rockfall mass increases further, such as m = 237.26 kg, with an increasing impact number, the shed-tunnel structure will be damaged, resulting in it being unable to withstand the rockfall impact, and the impact force will reduce. It can also be seen from Figure 11 that when m = 70.3 kg and 137.31 kg, respectively, the shed-tunnel structure has no obvious damage, while when m = 237.26 kg, it has obvious damage.
Therefore, when the impact force in each rockfall impact is large enough to make the shed tunnel incur plastic deformation, the shed tunnel will be damaged. So, the cumulative damage effect caused by repeated rockfall impacts will eventually lead to the destruction of the shed-tunnel structure. Therefore, in practical engineering, we should pay more attention to the cumulative damage of the shed-tunnel structure under repeated rockfall impacts.
4. Conclusions
The shed-tunnel structure is one of the main protective measures against rockfall in mountainous areas, and, therefore, its dynamic response under rockfall impact attracts much attention. However, the existing research mainly focuses on single rockfall impacts, which cannot illustrate the shed-tunnel structure dynamic response under the repeated impacts of rockfall often encountered in practical engineering. Meanwhile, the often-used numerical methods, such as the continuous or discontinuous method, cannot perfectly simulate the shed-tunnel structure’s failure mode under the repeated impacts of rockfall. Therefore, in view of the advantages of the FEM-SPH method, this study focuses on the dynamic response of the shed-tunnel structure under the repeated impacts of rockfall with it. This model is first verified with the model test, and then parametric sensitivity analysis is adopted to study the effect of the following four factors, e.g., rock mass, shape, impact angle and impact velocity, on the dynamic response of the shed-tunnel structure under repeated rockfall impacts.
In all, this research provides a new way to study the dynamic response of the reinforced concrete shed-tunnel structure under repeated rockfall impacts, which can be used in the rockfall-prone area.
Author Contributions
Conceptualization, H.Z., Z.L. and H.L.; methodology, H.L.; numerical simulation and formal analysis, H.Z. and Z.L.; investigation, H.Z. and Z.L.; writing, H.Z. and H.L. All authors have read and agreed to the published version of the manuscript.
Funding
This research was funded by the National Key Research and Development Plan of China, grant number [2019 YFC1509701].
Data Availability Statement
The data presented in this study are available in the article.
Conflicts of Interest
Author Hao Zhao was employed by the company Hongda Blasting Engineering Group Co., Ltd. The remaining authors declare that the research was conducted in the absence of any commercial or financial relationships that could be construed as a potential conflict of interest.
References
- Corominas, J.; Copons, R.; Moya, J.; Vilaplana, J.M.; Altimir, J.; Amigó, J. Quantitative assessment of the residual risk in a rockfall protected area. Nat. Hazards 2005, 2, 343–357. [Google Scholar] [CrossRef]
- Vishal, V.; Siddique, T.; Purohit, R.; Phophliya, M.K.; Pradhan, S.P. Hazard assessment in rockfall-prone Himalayan slopes along National Highway-58, India: Rating and simulation. Nat. Hazards 2017, 85, 487–503. [Google Scholar] [CrossRef]
- Dorren, L.K.A. A review of rockfall mechanics and modelling approaches. Prog. Phys. Geog. 2003, 27, 69–87. [Google Scholar] [CrossRef]
- Li, L.P.; Lan, H.X. Probabilistic modeling of rockfall trajectories: A review. Bull. Eng. Geol. Environ. 2015, 74, 1163–1176. [Google Scholar] [CrossRef]
- Lee, J.; Barbato, M.; Lee, D.K. Rockfall hazard analysis based on the concept of functional safety with application to the highway network in South Korea. Rock Mech. Rock Eng. 2021, 54, 6633–6647. [Google Scholar] [CrossRef]
- Yan, J.H.; Chen, J.P.; Tan, C.; Zhang, Y.S.; Liu, Y.Q.; Zhao, X.H.; Wang, Q. Rockfall source areas identification at local scale by integrating discontinuity-based threshold slope angle and rockfall trajectory analyses. Eng. Geol. 2023, 313, 106993. [Google Scholar] [CrossRef]
- Park, H.; Jang, H.; Kim, B.; Moon, J. Study on a standardized rockfall-protection fence for various rockfall impact energy using finite element analysis. J. Comput. Struct. Eng. Inst. Korea 2020, 33, 297–302. [Google Scholar] [CrossRef]
- Liu, Q.; Liu, X.F.; Huang, W.; Tan, W.; Wang, T.; Yuan, S.Y.; He, P. Study on the combination measurement of rockfall embankments and rock shed on steep slopes. Proc. Inst. Civ. Eng.-Geotech. Eng. 2021, 176, 388–401. [Google Scholar] [CrossRef]
- Yoshida, H.; Nomura, T.; Wyllie, D.; Morris, A. Rock fall sheds—Application of Japanese designs in North America. In Proceedings of the First North American Landslide Conference, Vail, CO, USA, 3–8 June 2007. [Google Scholar]
- Delhomme, F.; Mommessin, M.; Mougin, J.P.; Perrotin, P. Behavior of a structurally dissipating shed-tunnel: Experimental analysis and study of punching effects. Int. J. Solids Struct. 2005, 42, 4204–4219. [Google Scholar] [CrossRef]
- Prisco, C.D.; Vecchiotti, M. Design charts for evaluating impact forces on dissipative granular soil cushions. J. Geotech. Geoenviron. Eng. 2010, 136, 1529–1541. [Google Scholar] [CrossRef]
- Kawahara, S.; Muro, T. Effects of dry density and thickness of sandy soil on impact response due to rockfall. J. Terramechanics 2006, 43, 329–340. [Google Scholar] [CrossRef]
- Sun, J.H.; Chu, Z.J.; Liu, Y.F.; Luo, W.M.; Wang, M. Performance of used tire cushion layer under rockfall impact. Shock Vib. 2016, 2016, 8760592. [Google Scholar] [CrossRef]
- Zhao, P.; Yuan, S.; Li, L.P.; Ge, Q.; Liu, J.; Du, L.H. Experimental study on the multi-impact resistance of a composite cushion composed of sand and geofoam. Geotext. Geomembr. 2021, 49, 45–56. [Google Scholar] [CrossRef]
- Zhao, P.; Xie, L.Z.; Li, L.P.; Liu, Q.; Yuan, S. Large-scale rockfall impact experiments on a RC shed-tunnel with a newly proposed cushion layer composed of sand and EPE. Eng. Struct. 2018, 175, 386–398. [Google Scholar] [CrossRef]
- Shen, W.G.; Zhao, T.; Dai, F. Influence of particle size on the buffer efficiency of soil cushion layer against rockfall impact. Nat. Hazards 2021, 108, 1469–1488. [Google Scholar] [CrossRef]
- Wu, J.L.; Ma, G.T.; Zhou, Z.H.; Mei, X.F.; Hu, X.W. Experimental investigation of impact response of RC slabs with a sandy soil cushion layer. Adv. Civ. Eng. 2021, 2021, 1562158. [Google Scholar] [CrossRef]
- Zhao, P.; Liu, J.; Zhang, Y. Experimental and numerical investigations on buffer performance of geofoam subjected by the impact of falling rocks with respect to different shapes. Geotext. Geomembranes 2023, 51, 108–124. [Google Scholar] [CrossRef]
- Yu, Z.X.; Zhao, L.; Liu, Y.P.; Zhao, S.C.; Xu, H.; Chan, S.L. Studies on flexible rockfall barriers for failure modes, mechanisms and design strategies: A case study of Western China. Landslides 2020, 16, 347–362. [Google Scholar] [CrossRef]
- Shi, S.Q.; Wang, M.; Peng, X.Q.; Yang, Y.K. A new-type flexible shed-tunnel under the impact of rock block: Initial experimental insights. Nat. Hazards Earth Syst. Sci. 2013, 13, 3329–3338. [Google Scholar] [CrossRef]
- Wang, M.; Liu, Y.F.; Cui, L.M.; Yao, W.L. A flexible three-module rock shed for rockfall protection: Design and full-scale experimental investigation. Int. J. Civ. Eng. 2022, 21, 51–66. [Google Scholar] [CrossRef]
- Olsson, R. Analytical model for delamination growth during small mass impact on plates. Int. J. Solids Struct. 2010, 47, 2884–2892. [Google Scholar] [CrossRef]
- Wang, D.P.; Liu, Y.; Pei, X.J.; Si, S. Elasto-plastic dynamic responses of reinforced concrete slabs under rockfall impact. J. Southwest Jiaotong Univ. 2016, 51, 1147–1153. (In Chinese) [Google Scholar]
- Chen, T.J.; Zhang, G.C.; Xiang, X. Research on rockfall impact process based on viscoelastic contact theory. Int. J. Impact Eng. 2023, 173, 104431. [Google Scholar] [CrossRef]
- Shen, W.G.; Zhao, T.; Dai, F.; Jiang, M.J.; Zhou, G.G.D. DEM analyses of rock block shape effect on the response of rockfall impact against a soil buffer layer. Eng. Geol. 2018, 249, 60–70. [Google Scholar] [CrossRef]
- Ouyang, C.J.; Liu, Y.; Wang, D.P.; He, S.M. Dynamic analysis of rockfall impacts on geogrid reinforced soil and EPS absorption cushions. KSCE J. Civ. Eng. 2019, 23, 37–45. [Google Scholar] [CrossRef]
- Lucy, L.B. A numerical approach to the testing of the fission hypothesis. Astron. J. 1977, 82, 1013–1024. [Google Scholar] [CrossRef]
- Gingold, R.A.; Monaghan, J.J. Smoothed particle hydrodynamics: Theory and application to non-spherical stars. Mon. Not. R. Astron. Soc. 1977, 181, 375–389. [Google Scholar] [CrossRef]
- Zhong, H.Q.; Lyu, L.; Yu, Z.X.; Liu, C. Study on mechanical behavior of rockfall impacts on a shed slab based on experiment and SPH–FEM coupled method. Structures 2021, 33, 1283–1298. [Google Scholar] [CrossRef]
- Liu, C.; Liao, H.J. Buffer capacity of steel shed with two layer absorbing system against the impact of rockfall based on coupled SPH-FEM method. Sustainability 2022, 14, 13680. [Google Scholar] [CrossRef]
- Wang, W.; Wu, Y.J.; Wu, H.; Yang, C.Z.; Feng, Q.S. Numerical analysis of dynamic compaction using FEM-SPH coupling method. Soil Dyn. Earthq. Eng. 2021, 140, 106420. [Google Scholar] [CrossRef]
- Wang, Z.T.; Chen, W.S.; Hao, H.; Dong, Y.K.; Huang, Z.J. Numerical prediction of blast fragmentation of reinforced concrete slab using ALE-FEM-SPH coupling method. Finite Elem. Anal. Des. 2023, 220, 103948. [Google Scholar] [CrossRef]
- Johnson, G.R. Linking of Lagrangian particle methods to standard finite element methods for high velocity impact simulations. Nucl. Eng. Des. 1994, 150, 265–274. [Google Scholar] [CrossRef]
- Liu, X.B.; Li, J.; Liu, G.H.; Lian, W.; Yang, H.W.; Wang, D.; Liu, P.L. Analysis of FEM-SPH coupling for perforation penetration variation under different geology-engineering conditions. Comput. Part. Mech. 2024, 11, 867–883. [Google Scholar] [CrossRef]
- Japan Road Association. Handbook for Rockfall Measures; Japan Road Association: Tokyo, Japan, 2000. (In Japanese) [Google Scholar]
- Labiouse, V.; Desoeudres, F.; Montani, S. Experimental study of rock sheds impacted by rock blocks. Struct. Eng. Int. 1996, 3, 171–175. [Google Scholar] [CrossRef]
- Ministry of Railways Second Survey and Design Institute. Railway Engineering Design Technical Manual Tunnel (Revised Edition); Railway Publishing House: Beijing, China, 1999. (In Chinese) [Google Scholar]
- Yang, Q.X.; Guan, B.S. Test and research on calculating method of falling stone impulsive force. J. China Railw. Soc. 1996, 18, 101–106. (In Chinese) [Google Scholar]


Disclaimer/Publisher’s Note: The statements, opinions and data contained in all publications are solely those of the individual author(s) and contributor(s) and not of MDPI and/or the editor(s). MDPI and/or the editor(s) disclaim responsibility for any injury to people or property resulting from any ideas, methods, instructions or products referred to in the content. |
© 2024 by the authors. Licensee MDPI, Basel, Switzerland. This article is an open access article distributed under the terms and conditions of the Creative Commons Attribution (CC BY) license (https://creativecommons.org/licenses/by/4.0/).