Article

Study on the Susceptibility of Steel Arches with Letting Pressure Nodes Based on Incremental Dynamic Analysis

School of Civil Engineering, Southwest Forestry University, Kunming 650224, China
*
Author to whom correspondence should be addressed.
Buildings 2024, 14(10), 3189; https://doi.org/10.3390/buildings14103189
Submission received: 31 August 2024 / Revised: 4 October 2024 / Accepted: 5 October 2024 / Published: 7 October 2024
(This article belongs to the Section Building Structures)

Abstract

:
When soft rock tunnels pass through fractured fault zones, they are particularly susceptible to extrusion and large-scale deformations, especially during seismic events. To address these challenges, this study introduces an innovative yield-support steel arch design featuring a circumferential letting pressure node at its core. This design delivers incremental support resistance within the deformation zone and a susceptibility curve is applied to evaluate the damage probability of the steel arch with a letting pressure node under seismic loading conditions. Measurements of the surrounding rock pressure and structural forces on the steel arch with the letting pressure node were conducted at the Baoshan Jewel Mountain Tunnel in China. The field experiment results revealed a 23% reduction in the surrounding rock pressure and an 11% decrease in the internal forces of the support structure. These findings demonstrate the successful application of the letting pressure node-supported steel arch in mitigating large deformations in soft rock environments. Additionally, using finite element software ANSYS 2022, a seismic time-history analysis was conducted, employing the relative deformation rate of the letting pressure node steel arch as the damage index and the peak ground acceleration (PGA) as the strength parameter to generate the incremental dynamic analysis (IDA) curve. According to the susceptibility curve derived from the incremental dynamic analysis, at the design ground motion level of 8 degrees, the letting pressure node steel arch has a 94% probability of exceeding its normal service life limit and experiencing damage. The findings of this study offer a novel approach to addressing large deformations in soft rock tunnels. The proposed susceptibility curves for steel arches with letting pressure nodes provide a robust foundation for predicting the damage probability of yielding support structures under seismic conditions.

1. Introduction

Excavation in tunnels with crushed soft rock presents significant engineering challenges, as conventional support systems frequently encounter severe issues. The most critical among these is the occurrence of large deformations, such as soft rock extrusion, which results in the overstressing, twisting, and eventual failure of steel arches, ultimately slowing down the construction process [1,2,3,4,5,6]. To address these challenges, several scholars have proposed the application of reinforced support measures, including the implementation of thicker layers of sprayed concrete post-excavation or the incorporation of double-layer high-strength steel arches [7,8]. Moreover, high-strength steel arches are utilized to manage large deformations, offering enhanced structural resilience under significant pressures. Furthermore, high-strength anchor cable support systems have been implemented to address large deformations, providing rapid and robust reinforcement capabilities [9,10,11]. However, these strong support methods, including anchor cable systems, often overly constrain the early-stage deformation of surrounding rock, which hinders the release of deformation energy. Additionally, high-strength anchor cable supports lead to increased construction costs and, in some cases, fail to effectively solve the problem of large deformation [12,13,14].
In layered support systems, the first layer involves spraying a thin yet strong-bonded layer of concrete to facilitate the release of deformation energy from the surrounding rock. The second layer incorporates high-stiffness, high-strength steel arches to compensate for the insufficient strength of the initial concrete layer [15,16,17]. Layered support effectively addresses the issue of unreleased deformation energy in the surrounding rock. However, determining the optimal thickness of the first concrete layer remains challenging, and the improper timing of the second layer of support can lead to potential collapse incidents [18,19].
In recent years, both domestic and international scholars have increasingly focused on yield support systems. These systems allow for a controlled amount of displacement while maintaining the structural bearing capacity and safety, thereby releasing part of the pressure exerted by the surrounding rock and dissipating the energy accumulated from dynamic loads. This approach also utilizes the inherent bearing capacity of the surrounding rock to reduce structural stress [20,21]. Notable innovations include the yield anchors introduced by St-Pierre et al. [22], constant-resistance large-deformation anchors by He and Guo [23], and yield-support large-deformation anchors [24,25,26]. These methods have proven to be highly effective in controlling large deformations in soft rock, eliminating the need to calculate the shotcrete thickness or manage the timing of support installations. Yielding anchors automatically extend once the applied force reaches a threshold value, at which point the yielding mechanism is activated. These anchors combine the advantages of both conventional anchors and yielding devices, although they present the challenge of anchor failure due to excessive pressure build-up [27,28]. Previous studies on yield support have primarily concentrated on full-section excavation methods [29,30], which often result in the compromised stability of the surrounding rock. In the case of soft rock tunnels, a three-step excavation method is typically employed, as it operates under a distinct mechanical mechanism compared to full-section excavation.
A restrictor support system designed to control the release of deformation energy from the surrounding rock, combined with U-type retractable steel arches, has been successfully applied in soft rock tunnels. This approach has significantly enhanced the adaptability of yield support across various excavation schemes [31,32]. Building on this principle, several scholars have developed various types of yield support systems, including the energy dissipation limiter by Qiu et al. [33], the adaptive joint steel arch by He et al. [34], and the support resistance damper by Li et al. [35]. Current studies have applied the yield support scheme, rooted in the theory of yield support, to control large deformations caused by extrusion in soft rock tunnels [36,37,38,39,40]. However, the efficacy of yield support systems in tunnels located within strong earthquake zones or near fault lines remains unverified, and the associated damage probabilities have yet to be determined.
Earthquakes are unpredictable, sudden, and highly destructive natural disasters [41,42]. Tunnels located in strong seismic or fracture zones are subject to post-excavation stress adjustments, and aftershock activity during the construction phase may exacerbate deformation in the surrounding rock and support systems, heightening the associated risks. Notable examples include the Dujiashan Tunnel on Guanggan Road, which traverses the core fault zone of the 5.12 earthquake, and the Niigata Tunnel, where the aftershock-induced deformation of the surrounding rock triggered a new cave-in [43,44,45,46]. In light of these risks, numerous scholars have conducted comprehensive risk assessments of tunnels to identify potential hazards, including ground vibrations, structural damage probabilities, and other relevant concerns. Based on these assessments, suitable measures can be implemented to enhance the seismic performance of tunnel structures. Some research efforts have focused on refining existing techniques, while others propose innovative approaches. Drawing on real-world data, Pitilakis and Tsinidis [47], as well as Lee et al. [48], developed seismic solution methods based on displacement, providing a capacity spectrum approach. However, this method is relatively complex. With advancements in computational technology, the dynamic response of underground structures to seismic loading can now be simulated numerically, and this approach has been increasingly adopted in seismic design. Incremental Dynamic Analysis (IDA) has been employed for collapse susceptibility [49,50,51]. Bertero [52] was the first to propose the continuous increase of seismic waves applied to a structure, using IDA to assess the seismic performance across the elastic, plastic, and slip stages of the structural response. This method was adopted by FEMA-350 in 2000 [53] as a standard modeling and analysis technique for assessing the overall collapse resistance of building structures. However, it requires extensive numerical calculations followed by statistical analysis, which limits its practical application in real-world seismic structural assessments. In response, both domestic and international scholars have made various improvements to address the limitations of IDA in practical applications [54,55,56]. Building upon Incremental Dynamic Analysis, a susceptibility analysis of tunnel structures and the resulting susceptibility curves can be used to derive the damage probability of structures under seismic loading [57,58].
The aforementioned studies demonstrate that yield support is extensively utilized in soft rock tunnels, with detailed descriptions of its mechanical characteristics. However, yield support is not universally applicable in tunnels with complex geological conditions, where controlling deformation remains challenging, often resulting in the failure of pressure-relief elements. In light of these challenges, this paper proposes a novel yield-supported steel arch with a letting pressure node design. This system utilizes controlled compression deformation to reduce surrounding rock pressure and structural stress, thereby addressing large deformations caused by twisting damage in tunnel support structures. Furthermore, the letting pressure node steel arch allows for easier deformation control by accommodating the reserved deformation amount based on actual tunnel construction requirements. In tunnels near fault zones, structural susceptibility analysis using Incremental Dynamic Analysis (IDA) has proven effective in estimating the damage probability of structures under seismic conditions. Additionally, the weak self-supporting capacity of the surrounding rock in soft rock tunnels results in rapid and substantial deformation during the post-excavation stress adjustment phase, a phenomenon that becomes even more pronounced under seismic action. This significantly increases the structural risk. Therefore, this study integrates these two factors to validate the load-bearing capacity of the steel arch with a letting compression node under seismic conditions and to calculate the damage probability of the structure. This study conducted a series of experiments in the Jewel Mountain Tunnel, with monitoring data confirming the feasibility of the letting pressure node steel arch. To determine the damage probability of the letting pressure node steel arch under seismic loading, experimental monitoring data were integrated with Incremental Dynamic Analysis (IDA) using finite element analysis. The structural susceptibility analysis was conducted based on the IDA curves to derive the damage probability of the letting pressure node steel arch. The results successfully addressed the large deformation challenges in the Jewel Mountain Tunnel and introduced a novel approach for managing large deformations in water-rich soft rock tunnels in northwestern Yunnan, China. By integrating structural susceptibility analysis under seismic conditions, this study bridges a critical gap in the existing research. It provides a basis for predicting the damage probability of steel arches with letting compression nodes under different ground-shaking intensities and contributes positively to the development of technologies and support structures that ensure safe tunnel operation. This is a new application of yielding braced structures in earthquake engineering to more accurately predict the behavior of tunnel structures during seismic activities.

2. Letting Pressure Node Steel Arch Model

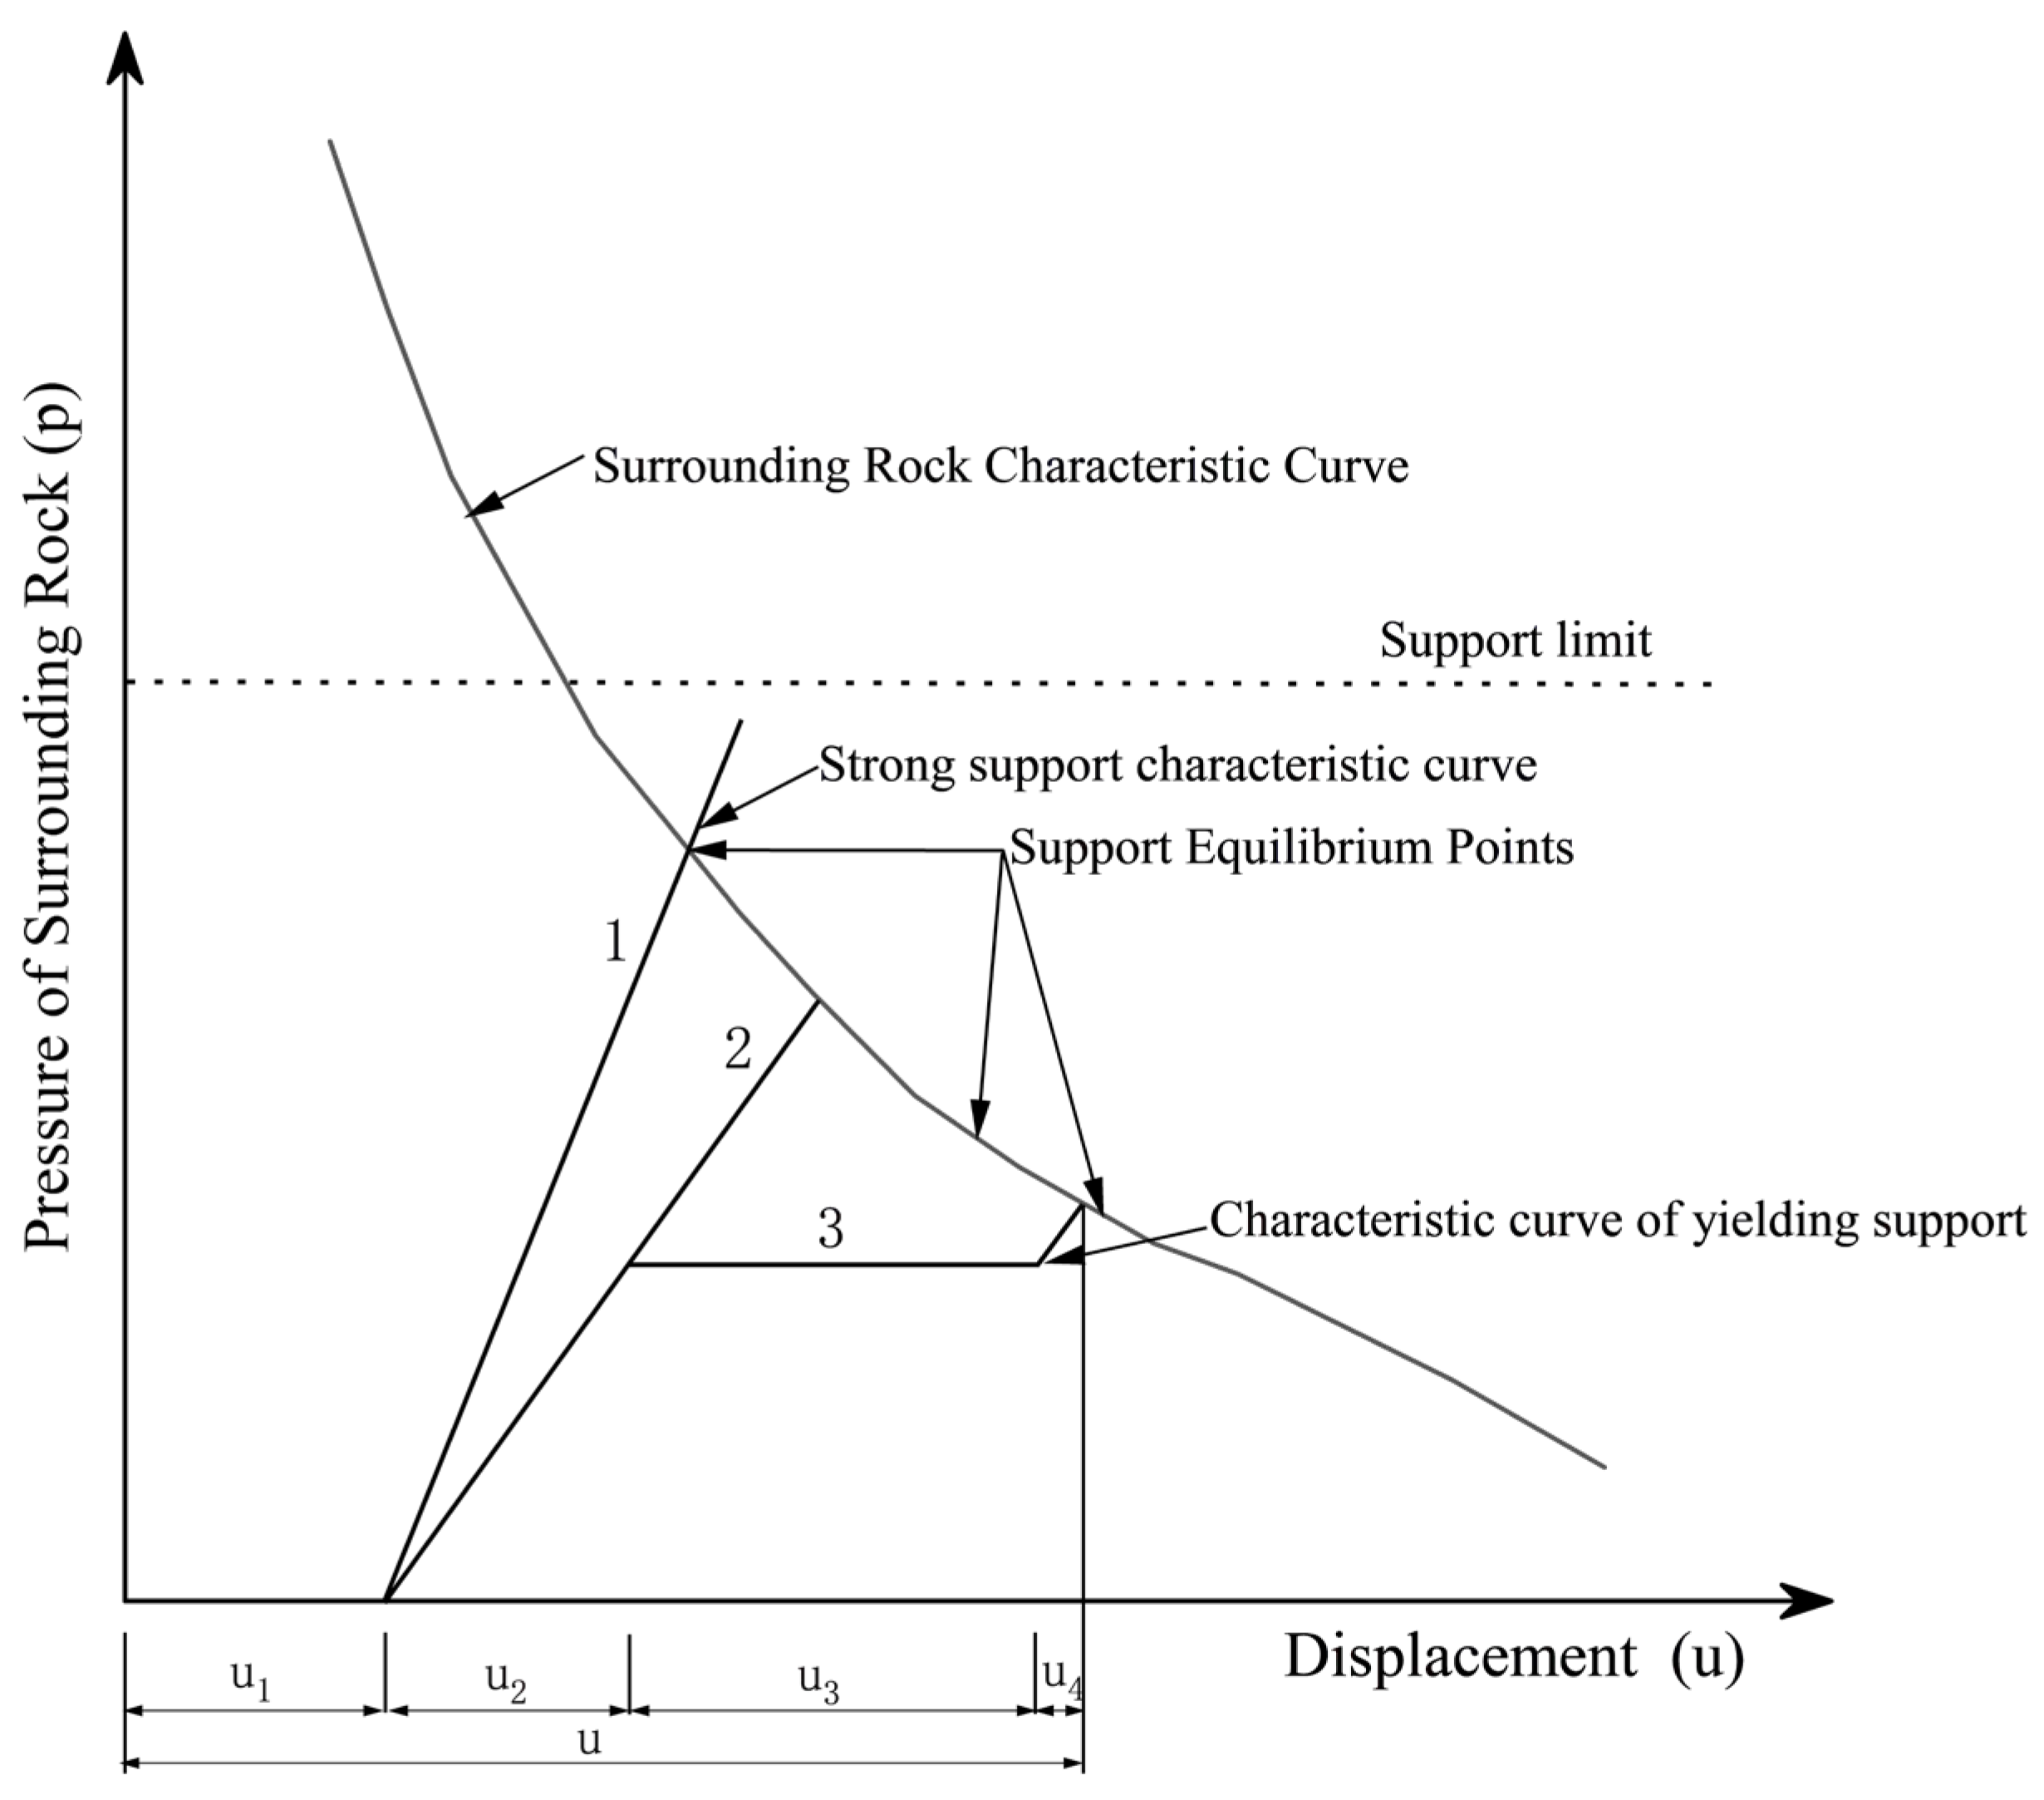
2.1. Principle of Yielding Support

In traditional tunnel excavation, the immediate application of strong support systems often disregards the self-stabilizing capacity of the surrounding rock. This approach subjects the support system to excessive pressure from the peripheral rock, potentially exceeding the support’s capacity and causing the deformation of the structure. Yielding support, by contrast, controls the deformation of the surrounding rock while providing timely structural support. Under stable load conditions, yielding support allows the structure to release pressure from the surrounding rock by permitting controlled displacement. This reduces the rock pressure and ensures the stability of the tunnel. The principle of yielding support is illustrated in Figure 1.
In Figure 1, Curve 1 represents the strong support characteristic, Curve 2 corresponds to the conventional support characteristic, and Curve 3 illustrates the yielding support characteristic. Curves 2 and 3 share identical material properties; however, Curve 3 includes an additional yielding support phase compared to Curve 2. Both strong support and yielding support are considered timely in their application, meaning that the starting point of the surrounding rock displacement is identical [59]. In the early stages, both Curves 1 and 3 exhibit small displacement changes and rapid fluctuations in the surrounding rock pressure. Curve 3 (yielding support) reaches a specific threshold, after which the incremental changes diminish until it intersects with the surrounding rock characteristic curve to reach an equilibrium. In Figure 1, the peripheral pressure at the equilibrium point for yielding support is significantly lower than that of strong support, resulting in reduced pressure on the support structure, thus making it a safer option compared to strong support [60]. Moreover, Curve 1 closely approaches the support limit curve, indicating that strong support induces a higher stress state in the structure, presenting a certain level of risk. The principle of the letting pressure node steel arch discussed in this paper is derived from the yielding support mechanism, as illustrated in Figure 1.

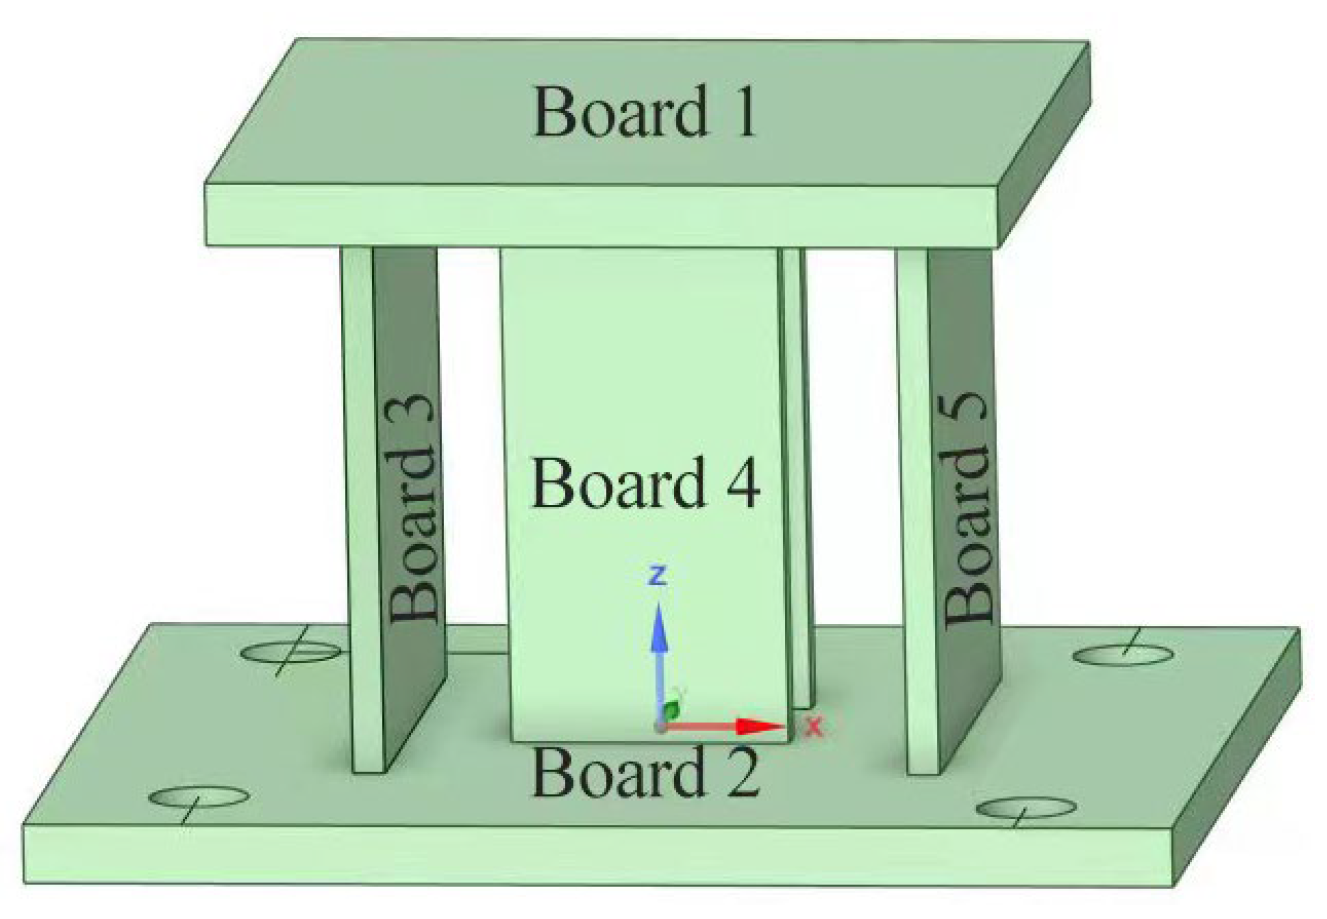
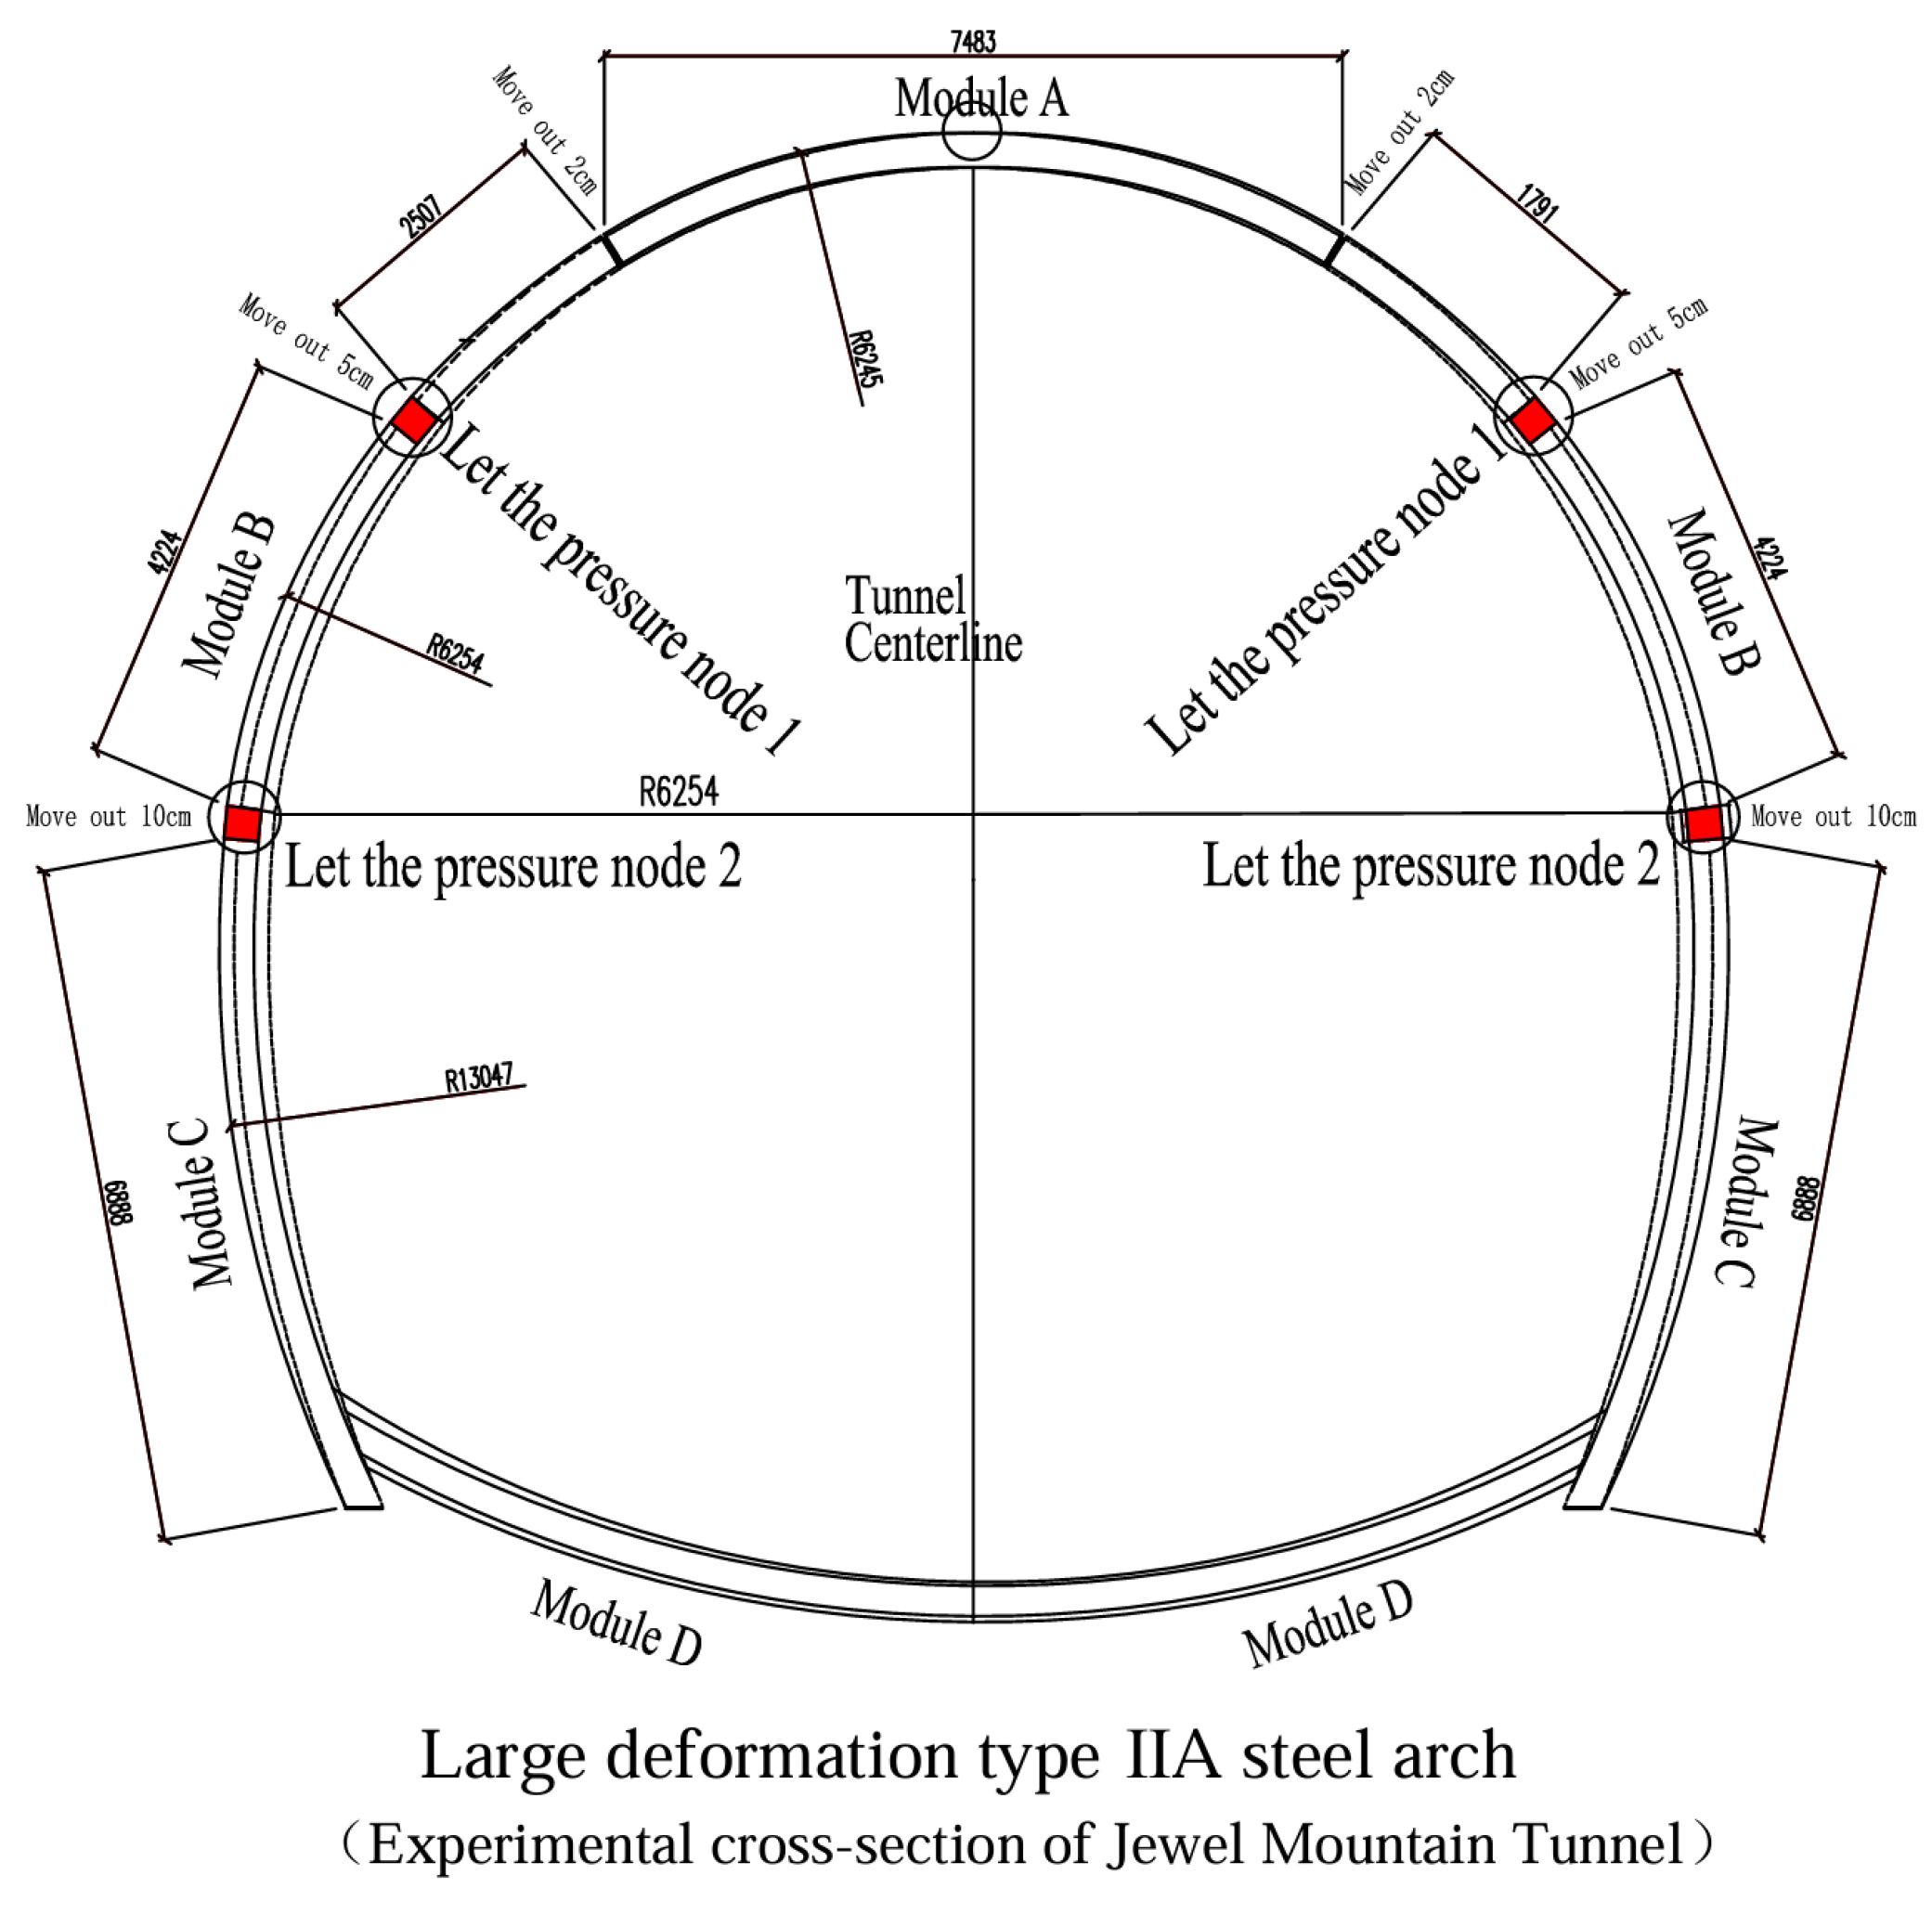
2.2. Structural Design

The restrictor is employed to limit the internal force of the bearing while releasing a portion of the surrounding rock pressure. This is achieved through its excellent yield deformation capacity and post-peak residual properties. Structurally, it is composed of upper and lower steel connecting plates welded to vertical steel plates [61]. When vertical force is applied to the upper steel plate, the vertical steel plate begins to bend and undergo plastic deformation once its maximum bearing capacity is reached. Building on the previous study, this paper optimizes the yield deformation capacity of the vertical steel plate by selecting LY160 for the compression node, as LY160 is a low-yield, soft steel with a superior seismic performance and high tensile strength. With a tensile strength ranging from 470 to 630 MPa, LY160 also exhibits excellent toughness and plasticity, with an elongation of ≥22%. Therefore, the compressive deformation of the letting pressure node is achieved through LY160’s enhanced plasticity [62]. The upper and lower connecting plates between the compression node are fabricated from Q235 steel, known for its excellent stiffness and strength. Notably, Q235 steel is also used for the steel arch in the Jewel Mountain Tunnel. The assembly diagram is shown in Figure 2. The dimensions of each steel plate are provided in Table 1, with a spacing of 35 mm between the plates.

2.3. Bolt Design

High-strength bolts are used at the connection point between the nodes and the steel arch. According to the “Steel Structure Design Standard”, its shear bearing capacity [63]:
N = 0.9 k N f μ ρ
where, k, for the hole type coefficient, the standard hole to take is 1.0; N f , for the number of force transfer friction surfaces, take 2; μ, for the anti-slip coefficient, the surface to take is 0.3; and ρ, for the design value of high-strength bolts preload, M20 mm, 10.9-grade, take the value of 155 kN.
According to formula (1), the design shear capacity for each bolt is calculated to be 83.7 KN. The connection plate of the pressure node is secured with four high-strength bolts. The ultimate bearing capacity of the I180 I-beam in the steel arch, which is connected to the plate, is 260 KN. Therefore, the maximum load borne by each bolt is 65 KN, which is well below the design shear capacity of 83.7 KN. Consequently, the bolts are not expected to undergo shear failure.

2.4. Finite Element Model Parameters

Figure 3 illustrates the design scheme of the yielding support, where letting pressure nodes are installed on both sides of the arch shoulder and arch waist of the steel arch. Taking the steel arch between Module B and Module C in Figure 3 as an example, the finite element model of the steel arch compression node is developed in ANSYS, as depicted in Figure 4. The dimensions of the I-beam are provided in Table 2. The upper and lower plates, along with the non-node components, are made of Q235 steel, with an elastic modulus of 206 GPa, a density of 7850 kg/m3, a Poisson’s ratio of 0.3, and a yield strength of 235 N/mm2. The nodes, however, are made of LY160, which has an elastic modulus of 199 GPa, a density of 7850 kg/m3, a Poisson’s ratio of 0.25, and a yield strength of 180 N/mm2. An ideal elastic–plastic constitutive model is applied, incorporating both seismic loads and the measured maximum surrounding rock pressure at the letting pressure node of the steel arch. Seismic time-history analysis is then conducted using the dynamics module.

3. Project Examples

3.1. Background

Western China has numerous mountain tunnels, and the experimental site for this study is located in Baoshan, China. The experimental site is part of the Dabao Expressway Laoying to Banqiao Section Rerouting Project, which is associated with the Baoshan Longying Expressway. The project’s starting point (EK0+000) is located north of Laoying Village, Wayao Town, in Baoshan City’s Longyang District, connecting seamlessly to the G56 Hangzhou-Rui Expressway. The route spans 16.10 km, passing through major interchanges and towns, including the Old Camp Interchange, the Hangzhou-Rui Expressway, and the towns of Big Artemisia Village, Ajaba, Shi Jiazhuang, and Board Bridge Town in Qingbaizhuang. A hub interchange connects the route to Baoshan’s southeast high-speed transit system.
The Dabao Expressway rerouting project, from K8+025 to K16+050, crosses two high-risk, extra-long tunnels: the Jewel Hill and Sujiazhuang Tunnels. These tunnels, composed of water-rich, weathered sandstone and mudstone, traverse shallow-buried sections, backslope cores, and strongly weathered zones of soft rock. The significant deformation of the soft rock and the presence of a local section within the 0.45 s characteristic period of the seismic response spectrum, combined with the tunnels being located in a typical 8-degree seismic zone, present additional geological challenges. Large deformations and seismic vulnerabilities present significant geological hazards and safety risks for tunnel excavation in this project.

3.2. Palm Surface Condition

The Jewel Mountain Tunnel spans from pile number K6+650 to K10+095, with a total length of 3441.356 m. The experimental section K6+810 to K6+839, utilizing the letting pressure node steel arch, was investigated using geological prediction exploration. The geological sketch, as shown in Figure 5a, reveals highly fractured rock with poor overall integrity. The result of the on-site excavation, as depicted in Figure 5b, shows that the palm surface primarily consists of strongly weathered black mudstone and shale, classified as soft rock. The palm surface is dominated by strongly weathered black mudstone and shale, which is soft rock. It is structurally fractured, prone to loosening and softening when exposed to water, and exhibits an extremely poor self-stabilizing capacity. Based on the radar detection results, combined with the site’s surrounding rock conditions, exploration design, and the Highway Tunnel Design Code [64], the surrounding rock classification for the test section K6+810 to K6+839 is V1.

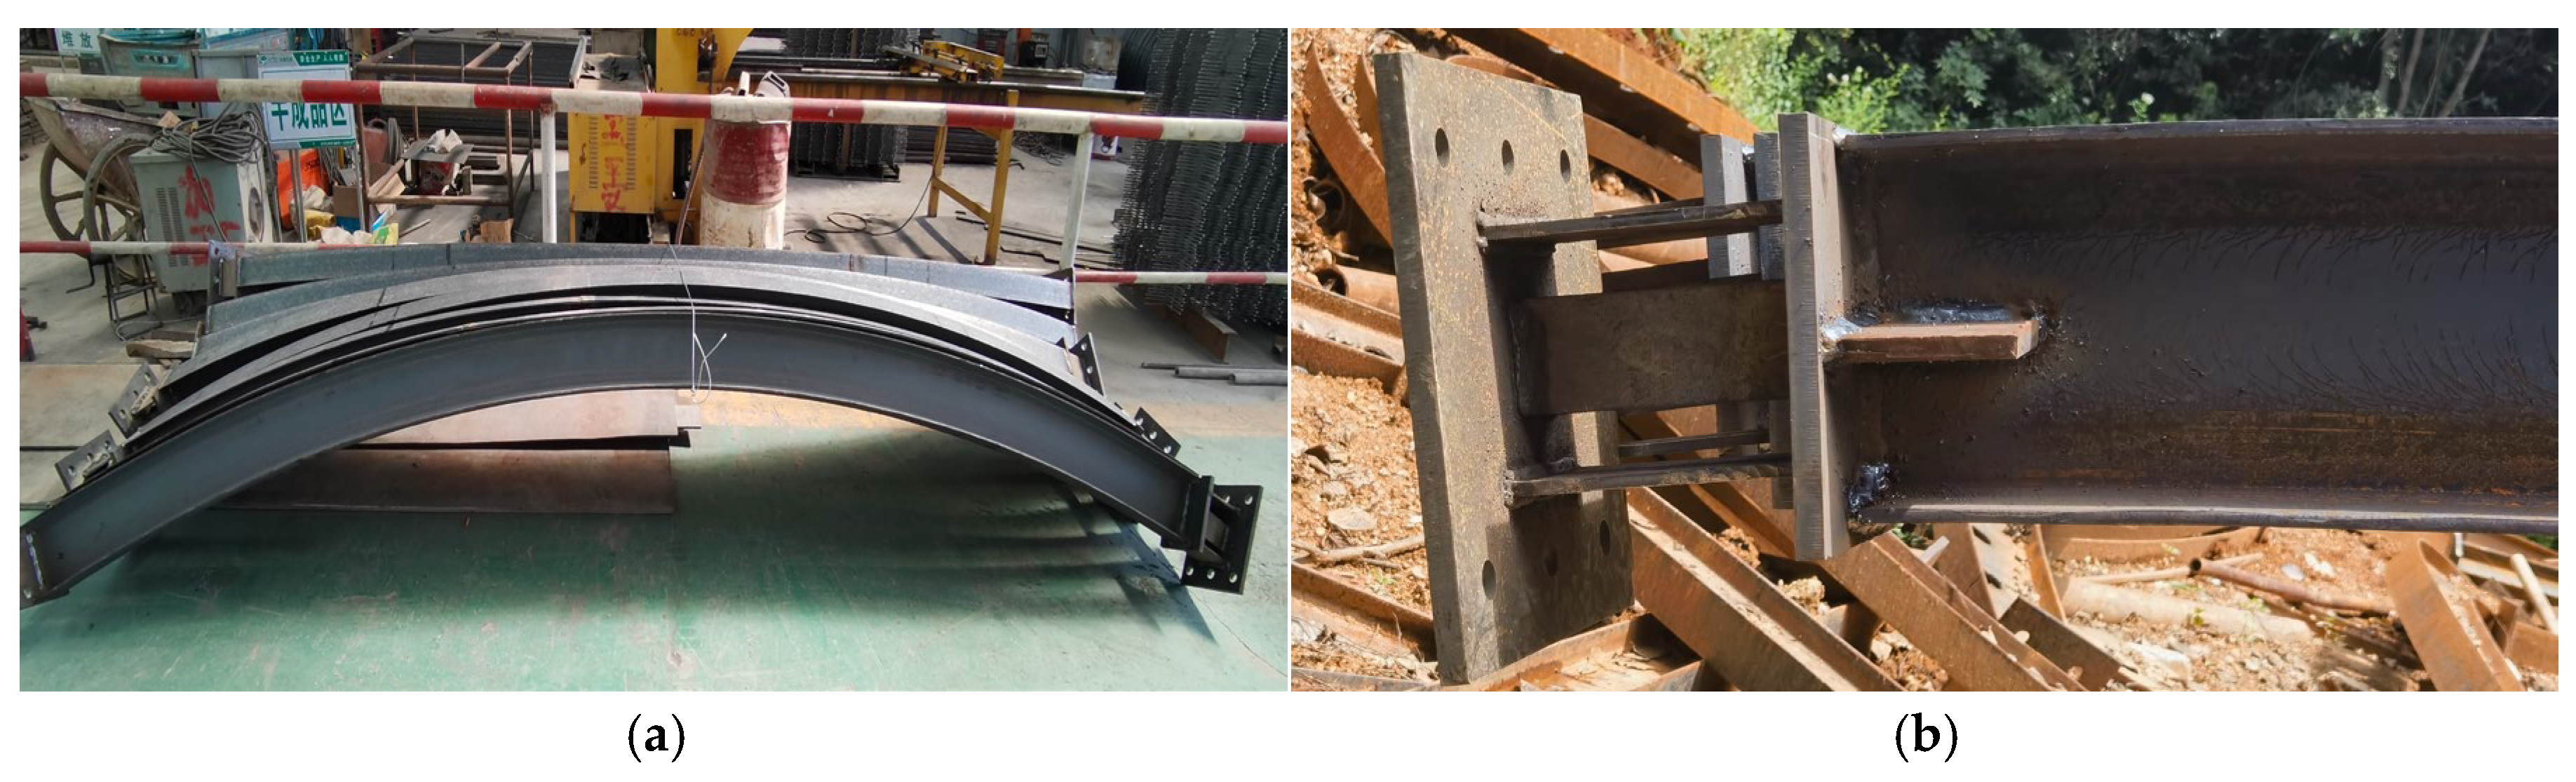
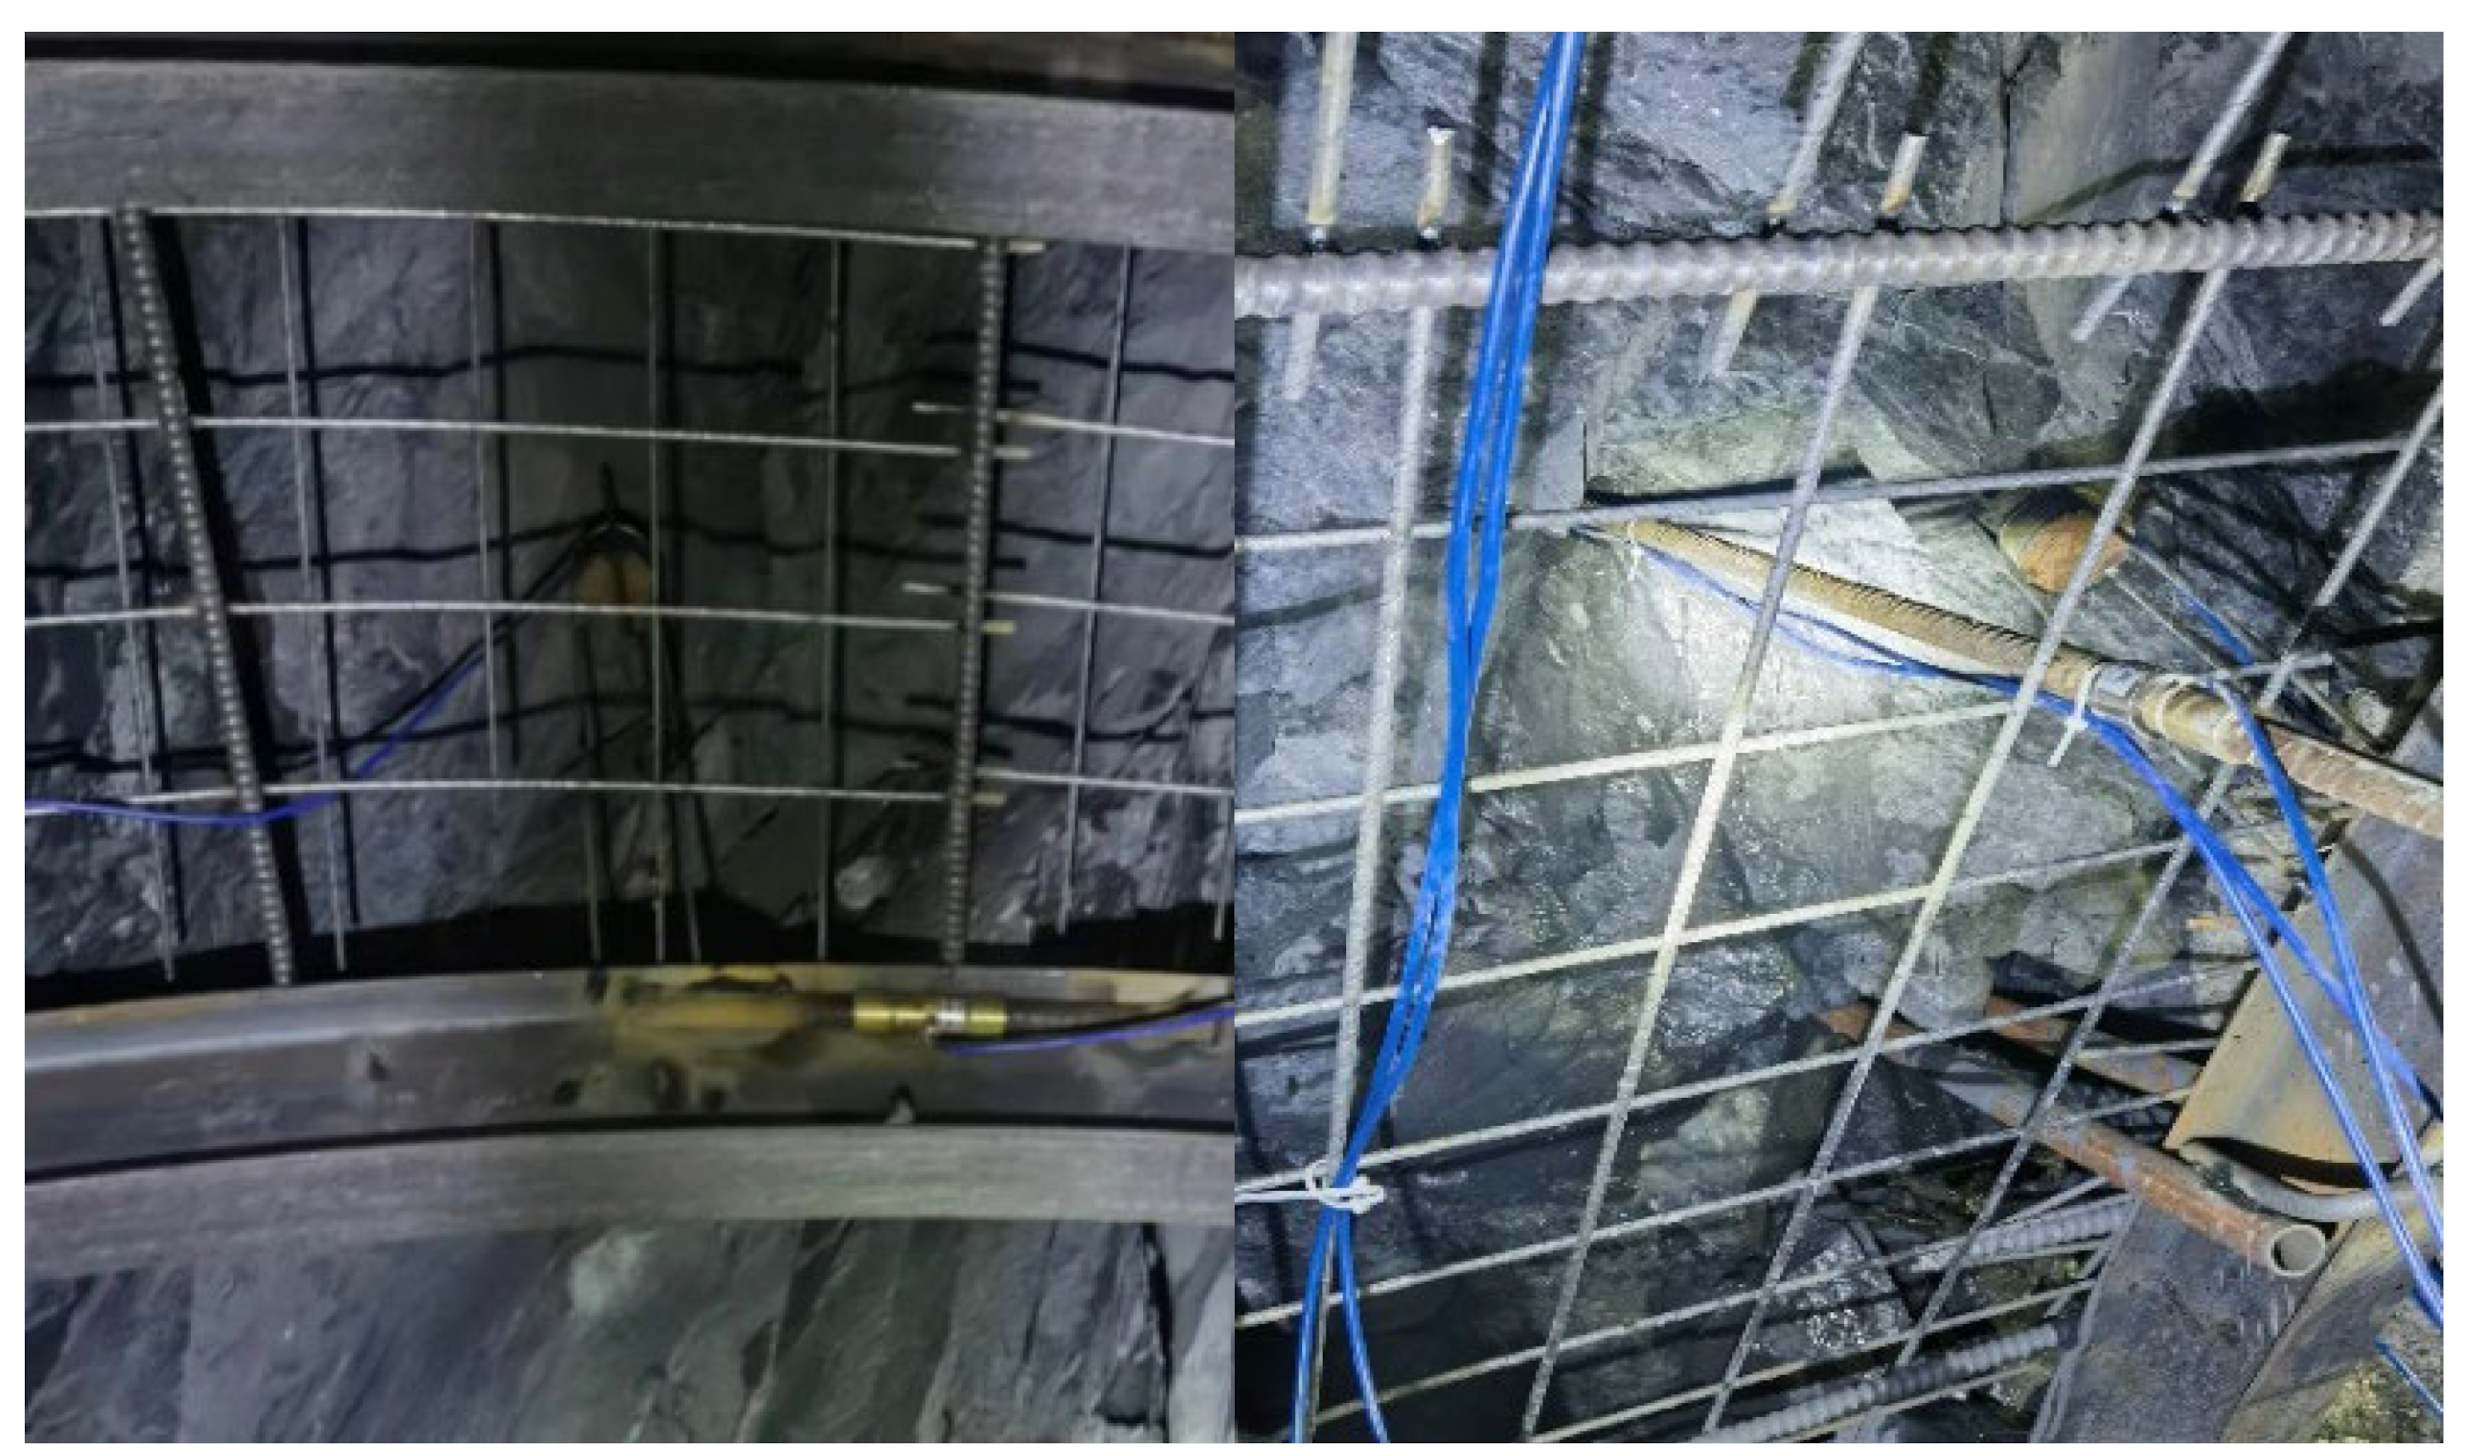
3.3. Fabrication of Steel Arches and Installation of Instruments

The letting pressure node steel arch is fabricated according to the specific conditions of the construction site, with a design height of 18.7 cm. To match the curvature of the Jewel Mountain Tunnel’s steel arch, any excess length is trimmed. Each unit of the letting pressure node steel arch is depicted in Figure 6a, with the node welding connections illustrated in Figure 6b.
After assessing the conditions in the K6+810 to K6+839 section, the installation of the letting pressure node steel arch was carried out. Pressure boxes, rebar meters, and anchor meters were installed at the top, shoulder, and waist of the arch to monitor both the surrounding rock stress and the structural stress of the arch. The on-site installation is depicted in Figure 7.

3.4. Conversion Formula and Instrument Breakdown

3.4.1. Monitoring Frequency

Data acquisition uses the JTM-V10A handheld intelligent readout to collect frequency information.

3.4.2. Conversion Formula

(1)
The envelope stress conversion equation is:
P = K F i F 0
where P is the stress (MPa); K is the calibration coefficient; Fi is the real-time relative strain value on day i; and F0 is the initial relative strain value.
(2)
The steel arch internal force conversion equation is:
P = K F i F 0
F = P × S
where P is the steel arch stress (MPa); F is the monitored steel arch internal force (N); K is the calibration coefficient; Fi is the real-time relative strain value on day i; F0 is the initial relative strain value; and S is the cross-section area of the sensor steel bar (mm2).
(3)
To differentiate the data collection and analysis under varying stress conditions at the arch top, arch shoulder, and arch waist, the installed steel gauges and pressure boxes were systematically numbered in this study. The specific numbering and installation details of the instrumentation are presented in Table 3 and Table 4.

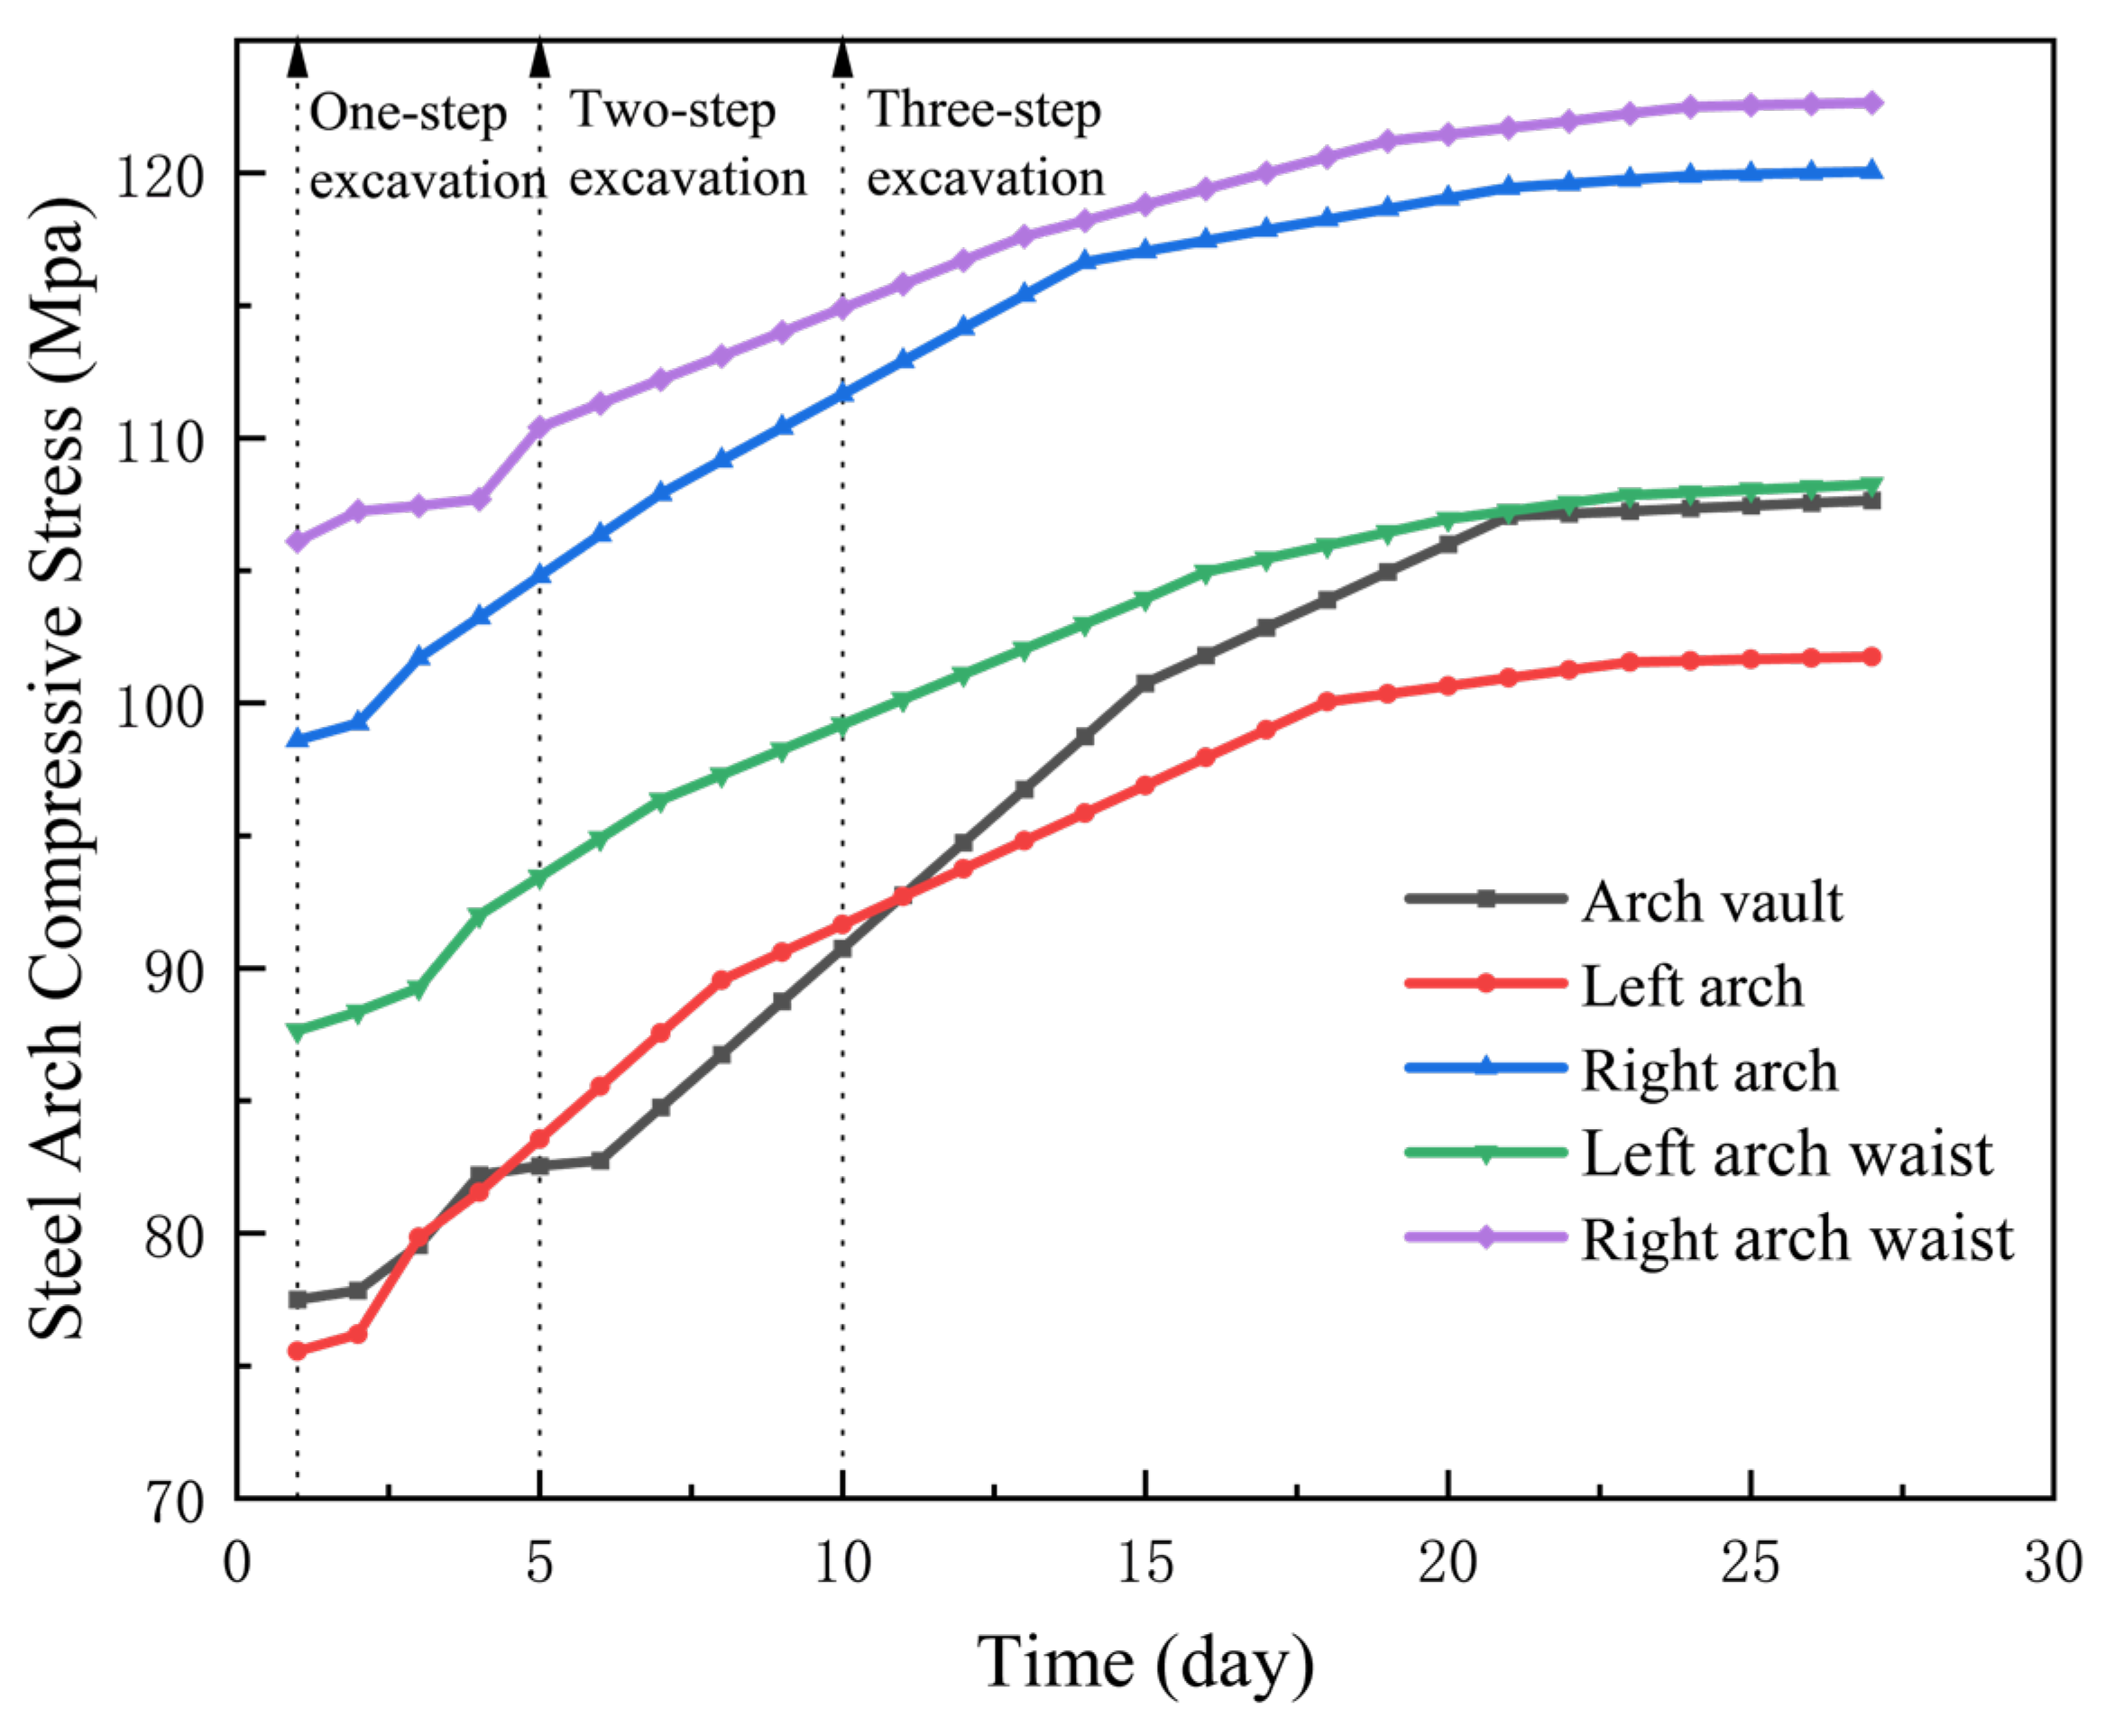
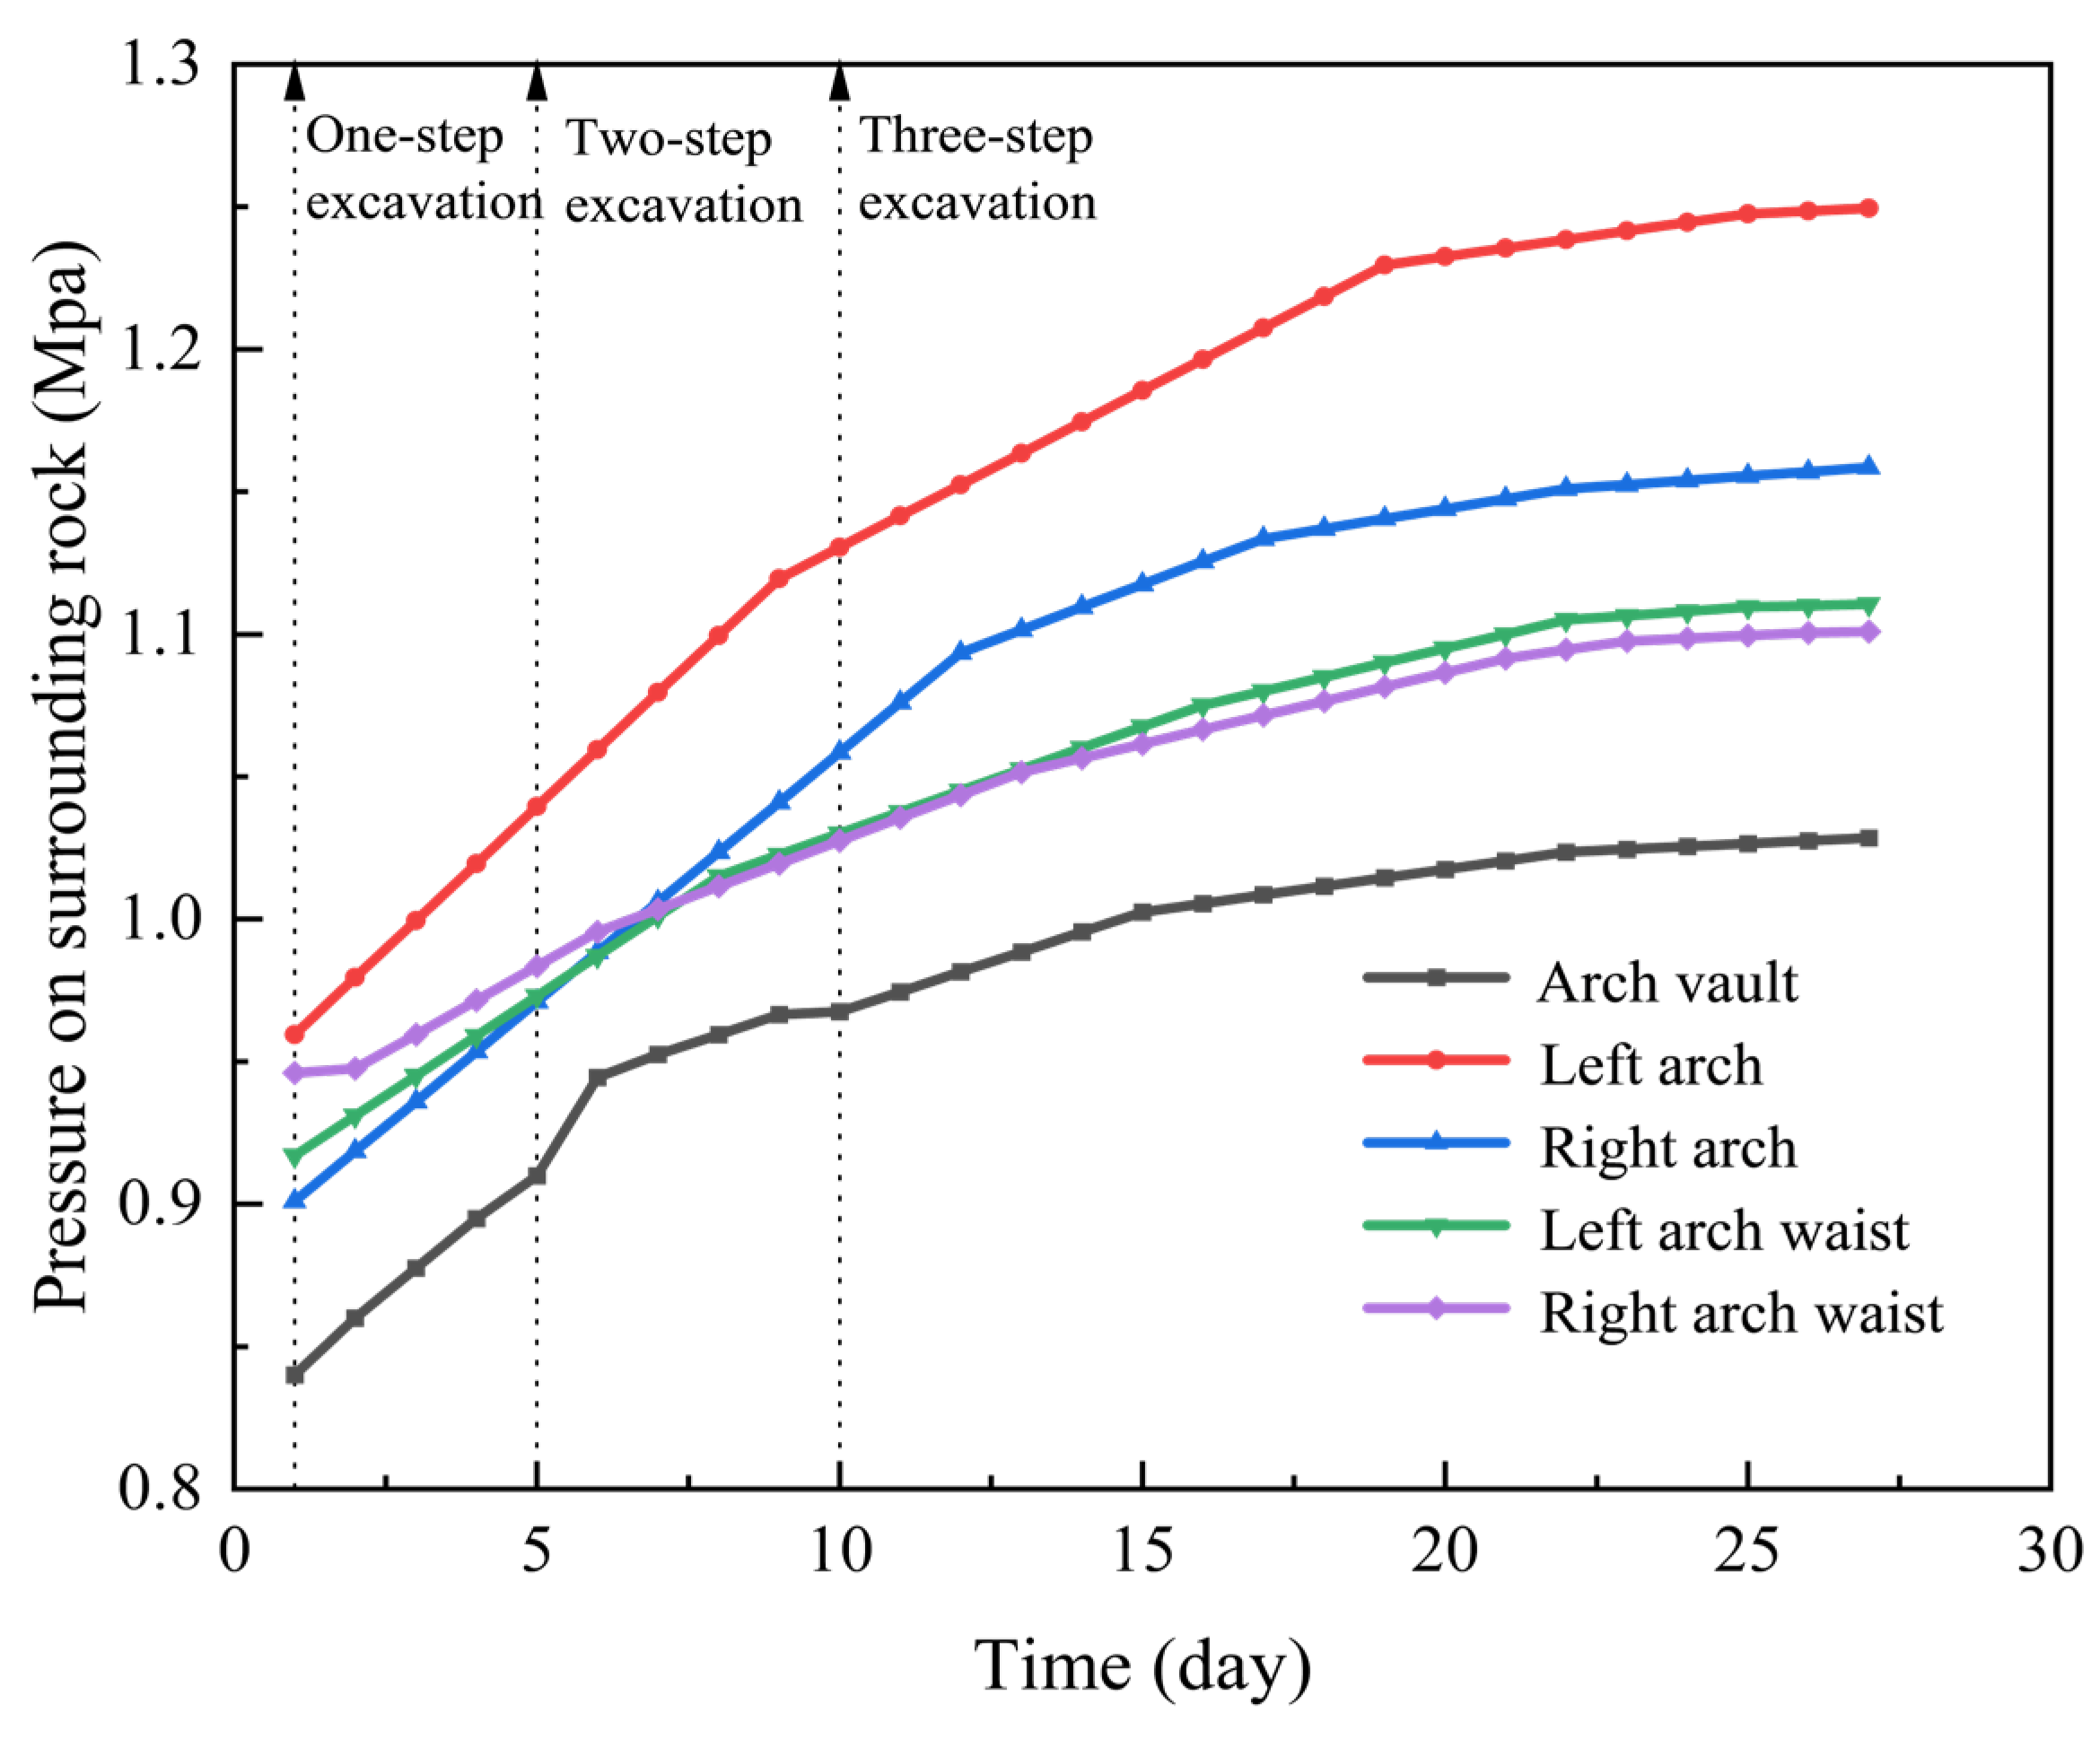
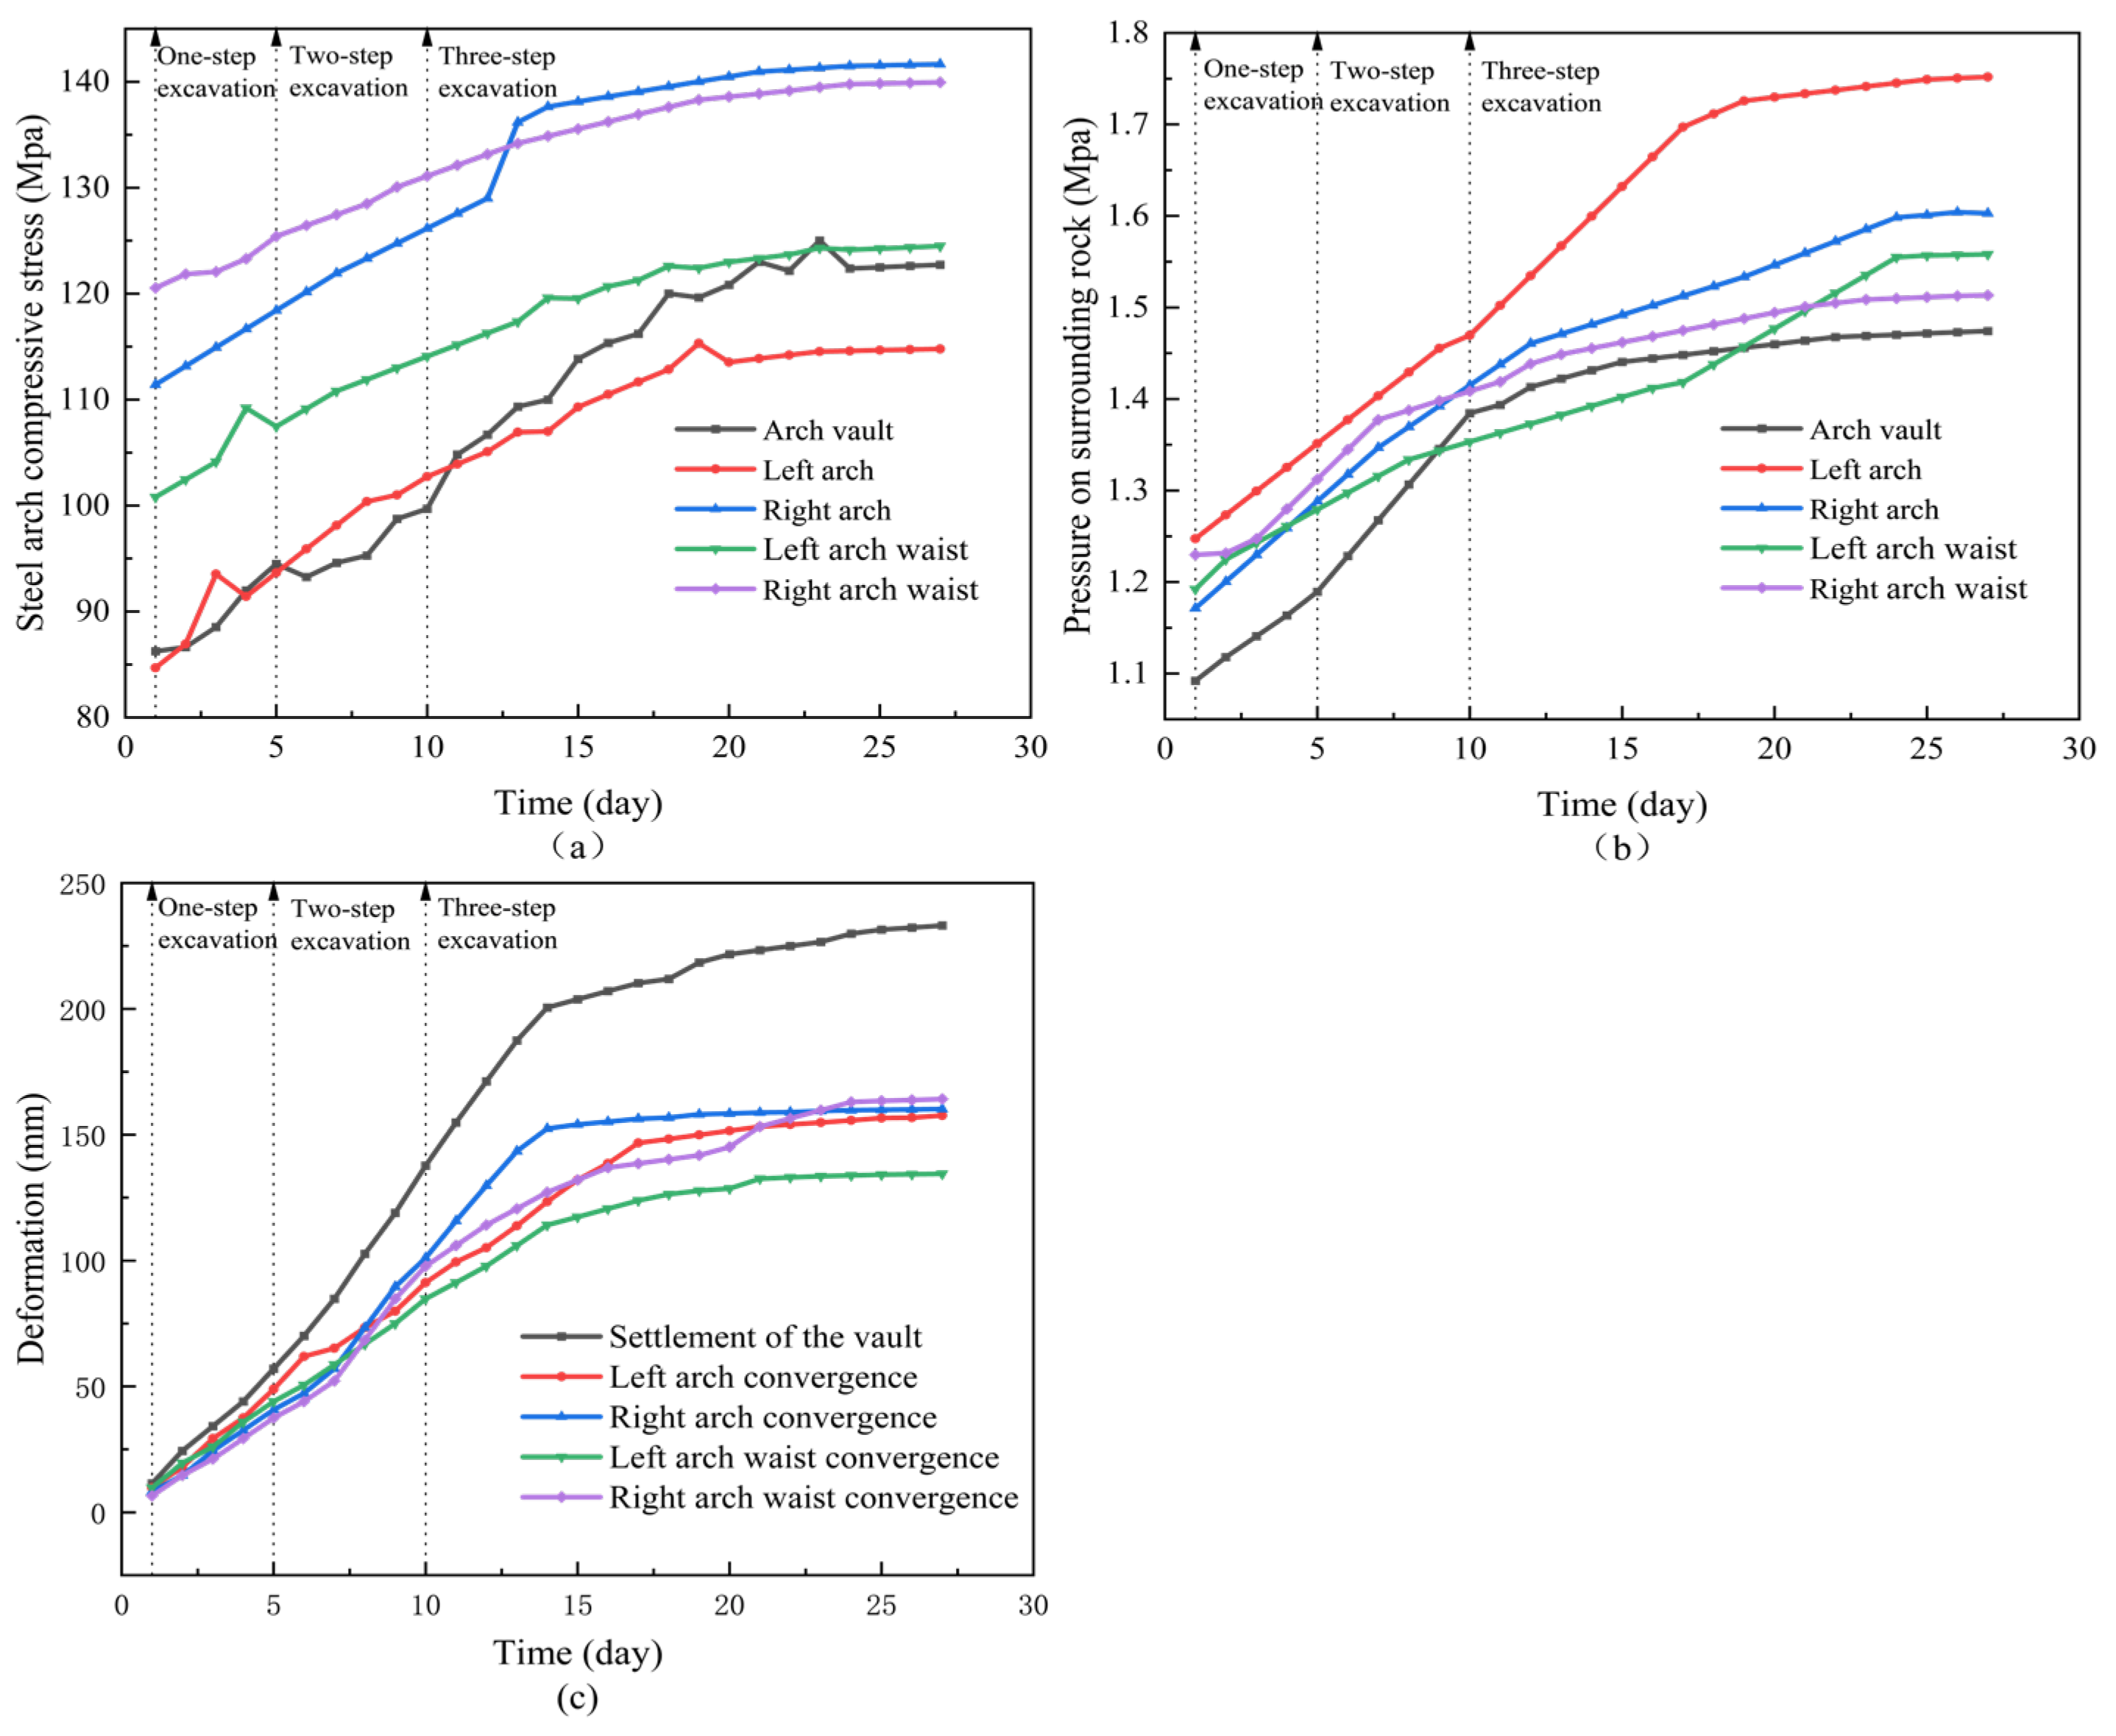
3.4.3. Monitoring Data

In the K6+810 to K6+839 section of the Jewel Mountain Tunnel, a three-bay steel arch was employed for testing, with a spacing of 0.8 m between each bay. Φ42 small conduits were installed within the arch for additional support, spaced 0.5 m apart in the circumferential direction and 1.2 m in the longitudinal direction. Each conduit measured 4.0 m in length, with 16 conduits per ring, constructed using a three-stage method. The geological conditions consist of medium–strongly weathered carbonaceous slate, a type of soft rock, with significant extrusion and large deformation observed. The timely installation of steel arches is crucial for managing soft rock deformation, and monitoring the surrounding rock pressure on the steel support is essential to assess the effectiveness of the support design. This also provides a foundation for optimizing the parameters of the support structure. In this study, the steel arch test section at the letting pressure node was equipped with monitoring instruments, including a reinforcing bar meter, pressure box, anchor meter, and reflector, installed at the top of the arch, the arch shoulder, and the arch waist, as illustrated in Figure 8. Monitoring data were recorded daily until the rate of change stabilized, continuing for a total duration of 27 days.
The collected data are presented in a graphical form: the steel arch time curve is illustrated in Figure 9, the perimeter rock pressure time curve is depicted in Figure 10, and the deformation results are shown in Figure 11.
In Figure 9, the time-course curve of the stress in the let-pressure node steel arch can be divided into three distinct stages. The first stage (0–2 days) corresponds to the initial support phase, during which the let-pressure node steel arch works in conjunction with the sprayed shotcrete. As the excavation progresses, the structural stress gradually increases. The let-pressure node, linked with the steel arch, begins to compress and deform under the surrounding rock pressure. The second stage (2–10 days) occurs after the second step of excavation. Once the compression deformation of the node stabilizes, the let-pressure node steel arch begins to provide greater resistance and stiffness, resulting in a rapid increase in stress. In the third stage, excavation disturbances after the third step led to another increase in stress. Eventually, the stress at the pressure node stabilized, with the maximum recorded stress at the right arch waist reaching 122.65 MPa, well below the 180 MPa yield limit of the soft steel.
According to Figure 10, the pressure curve of the surrounding rock can be divided into three distinct stages. During the first stage of excavation, the stress in the surrounding rock gradually increases due to the spatial influence of the excavation surface. In the second stage, following the second step of excavation, the surrounding rock is disturbed, causing a further release of pressure. In the third stage, after the third step of excavation, the surrounding rock continues to release pressure until it eventually stabilizes, indicating that the compression deformation of the letting pressure has also stabilized. The distribution of stress data across various monitoring points shows that the maximum surrounding rock pressure at the left arch point is 1.24 MPa.
The deformation rate of the front pressure is significant, with a maximum rate of 3.5 cm/day, and the maximum settlement of the arch reaching 49.3 cm, as illustrated in Figure 11. The permitted horizontal convergence and arch settlement for the Jewel Mountain Tunnel are within 49 cm. The deformation of the structure, as discussed in this study, remains below the specified limit, ensuring structural safety and confirming the validity of the design for the letting pressure node height. After more than a month of monitoring, the deformation of the let-pressure bearing tends to stabilize, with no additional cracking or damage observed. The overall continuity of the initial bearing capacity is well maintained. As shown in Figure 12, a pressure box and reinforcement gauge were installed on the plain steel arch at section K6+841. The data collected from this section verify the feasibility of the let-pressure node steel arch.
In Figure 12a, the force on the steel arch under strong support is highest at the right arch waist before the thirteenth day. After 13 days, a sudden change occurs, followed by stabilization, with the maximum force on the right arch reaching 141.6 MPa. The curve for the strongly supported steel arch indicates multiple stress fluctuation points during tunnel excavation, reflecting a state of structural instability. In Figure 12b, the rate of increase in the surrounding rock pressure escalates rapidly during the first 10 days of monitoring. After this period, the rate of increase slows and eventually stabilizes. The curve of the peripheral rock pressure shows that after the first stage of excavation, the peripheral rock is disturbed, leading to increased pressure. Following the third stage of excavation, different growth rates are observed at various locations, with the maximum pressure reaching 1.75 MPa at the left arch. Along the tunnel’s direction, the distribution of the peripheral rock pressure is uneven, indicating the presence of localized bias pressure. The deformation of the vault in Figure 12c is notably larger compared to the arch shoulder and waist. As tunnel excavation progresses, the vault deformation continues to increase, before gradually slowing and eventually stabilizing. At this point, the vault settlement reaches 23.3 cm.
Based on the field-monitored stress time data, the final values were extracted and are presented in Figure 13. This figure illustrates the distribution of the surrounding rock pressure and steel arch stress along the tunnel profile for both the let-pressure support scheme and the strong support scheme. As depicted in Figure 13a, the stresses on the structure under strong support are uneven, with higher stresses observed on the right side compared to the left, resulting in structural instability. In contrast, the steel arch structure with the let-pressure node exhibits a more uniform distribution of stress along the tunnel contour. In Figure 13b, the surrounding rock pressure under strong support is significantly higher on the left side than on the right, indicating a clear bias. In contrast, the surrounding rock pressure distribution in the yield support scheme is uniform. Additionally, the interaction between the initial support and surrounding rock allows the letting pressure node to reduce the overall stiffness of the support system, thereby preventing the overstressing of the initial shotcrete. This ensures that no additional tensile stresses are generated in the shotcrete, effectively preventing concrete cracking.
To comprehensively demonstrate the effectiveness of the let-pressure node steel arch, this paper calculates the differences in the peripheral rock pressure, structural stress, and deformation between the let-pressure support scheme and the strong support scheme. The differences in these three aspects were analyzed using statistical methods, with the results presented in Table 5. The average reduction in the peripheral rock pressure in the tunnel with the let-pressure node steel arch is 0.39 MPa, while the maximum peripheral rock pressure in the tunnel with the strong support structure is 1.75 MPa. This indicates that the let-pressure node steel arch effectively reduces peripheral rock pressure by 23%. Regarding structural stress, the let-pressure node steel arch reduces the stress on the steel arch under strong support by an average of 14.83 MPa. Compared to the maximum structural stress of 141.7 MPa under strong support, the let-pressure node steel arch effectively reduces the stress on the support structure by 11%. Finally, to verify whether the structure adheres to the principles of let-pressure support, the amount of deformation is a crucial consideration. The average deformation of the let-compression support scheme in this study increased by 142.65 mm, indicating that the letting pressure node releases part of the surrounding rock pressure through controlled compression deformation, thereby reducing structural stress.

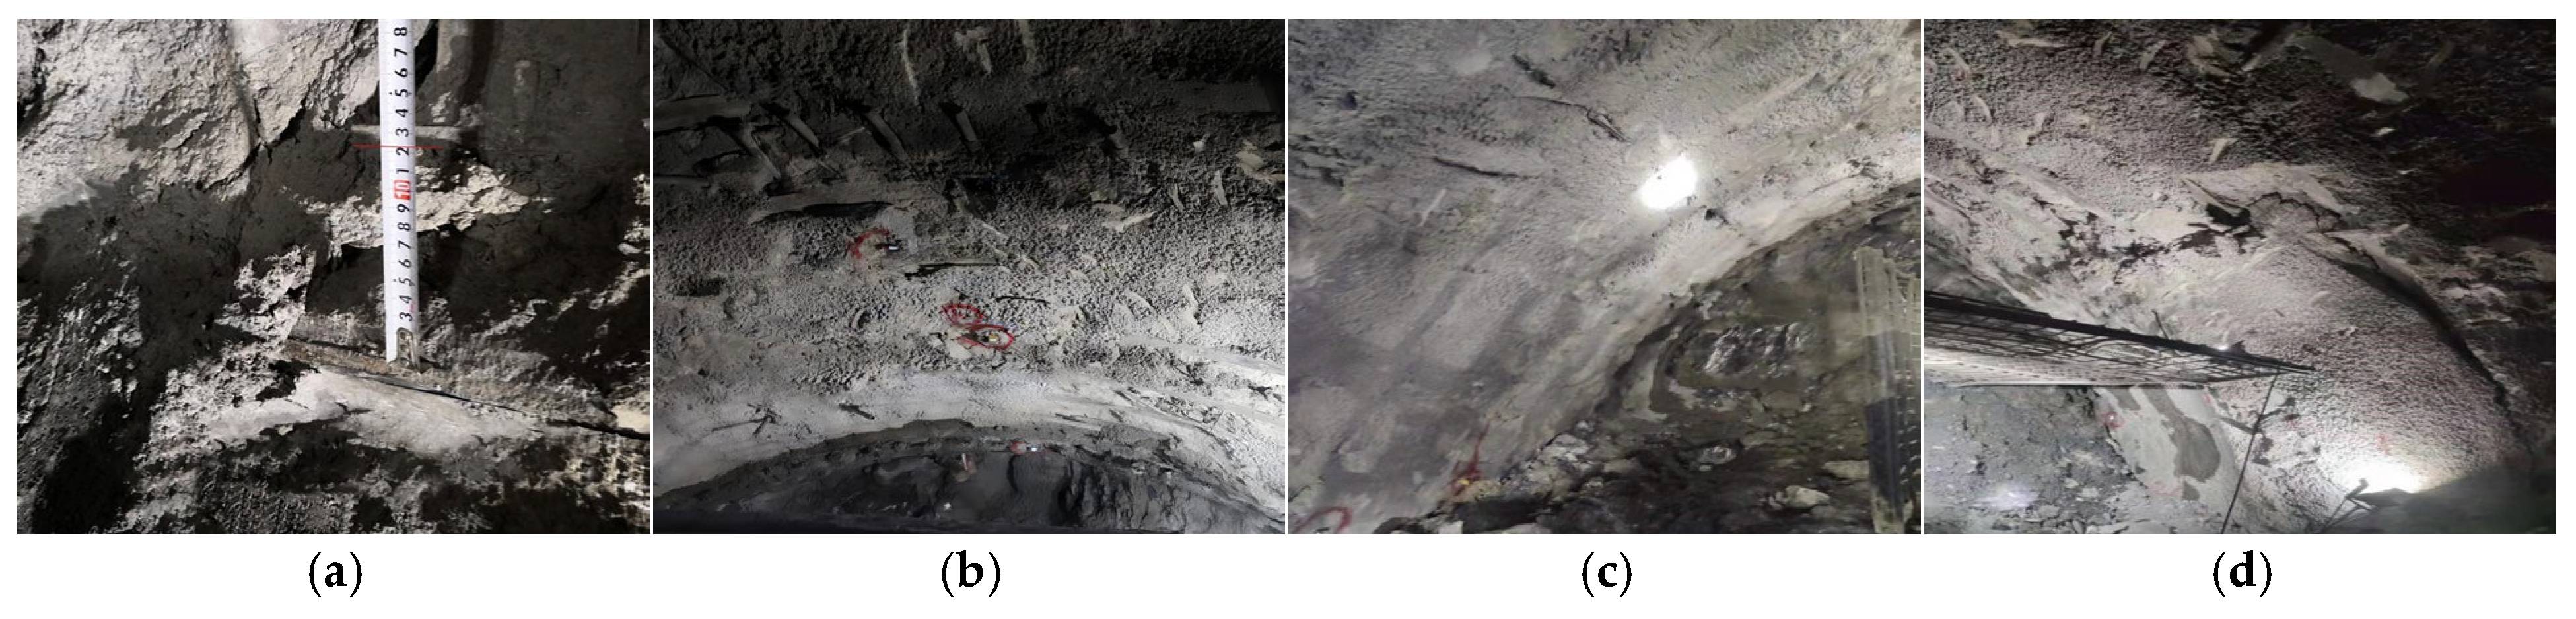
3.5. Post-Experimental Structural Performance Situation

One week after conducting the experiments (17–24 February 2024) to investigate the deformation of the letting pressure nodes, the concrete at these nodes was removed, as illustrated in Figure 14a. For instance, at the node between Unit A and Unit B on the right side of the third bay of the arch, deformation occurred, as depicted in Figure 14a. The designed net height of the section was 18.7 cm, and after one week of the installation experiment, the remaining net height measured 12 cm, resulting in a cumulative deformation of 6.7 cm, indicating significant compression deformation. As shown in Figure 14b, the concrete of the arch showed no signs of damage, and the overall compressive performance of the structure remained satisfactory. In Figure 14c, no concrete dislodging was observed on the left side during the compressive deformation of the letting pressure node. In Figure 14d, deformation on the right side of the node occurred due to pressure, resulting in slight concrete shedding around the node. However, aside from the node deformation, no further deformations were observed in the steel arch, and the overall performance of the structure remained strong.
The results of the test section K6+810 to K6+839 of the Jewel Mountain Tunnel demonstrate that by releasing the surrounding rock pressure, the issues of large tunnel deformation and damage to the initial support are effectively addressed. The application of the let-deformation steel arch allowed for the successful one-time safe completion of the initial support.

4. Structural Dynamic Stability

4.1. Type I Power Stabilization

When a structural member is subjected to seismic loading, internal forces are generated, and the structure deforms. The critical loads and destabilization modes for the same material can vary depending on the size of the structure and the stress fields. Based on the above formulation, it is necessary to establish dynamic equilibrium equations for structural eigenvalue buckling analysis on the deformed geometry. This requires the application of the time-freezing method [65], whereby, after obtaining the stresses and deformations from the dynamic loading analysis, the structure’s state is frozen at that moment in time. The resulting structural morphology is then used as the pre-buckling state for the eigenvalue buckling analysis. During ground-shaking, the structural state at each moment in the time-history calculation is frozen as the pre-buckling state. The characteristic equation of dynamic instability at time t is then established according to Equation (5). This allows the determination of buckling eigenvalue curves corresponding to the seismic response process, enabling an assessment of whether dynamic buckling occurs throughout the entire duration of ground shaking. This process constitutes the first type of dynamic stabilization problem, which is essentially dynamic buckling.
K 0 + α K s σ + γ K d σ t = 0
where [K0] is the initial elastic stiffness matrix of the structure; α is the dynamic buckling coefficient; [K] is the effect on the stiffness matrix caused by the constant load; γ is the scaling factor of the input seismic wave; and [K] is the effect of the dynamic load on the stiffness matrix of the structure at moment.
After applying the seismic wave, the member vibrates from time 0 to time t, and the time is discretized into n × Δt intervals. For each interval, the corresponding Equation (5) is obtained, and the n eigenvalues corresponding to each equation are calculated. The eigenvalue curves are then plotted over the duration of dynamic loading, where the exact moment of dynamic buckling can be clearly identified on the curve, revealing the value of the buckling coefficient. This method accounts for the effects of damping forces, inertial forces, and structural deformation, and identifies the most critical moment of instability from the dynamic eigenvalue curve.

4.2. Type II Power Stabilization

The second type of stabilizing instability is assessed similarly to the B-P criterion, representing dynamic instability in the Lyapunov sense. With advances in computing, this criterion has become widely accepted and utilized. The macroscopic response of the system is used to evaluate its dynamic stability. When a small change in load results in a significant change in the dynamic response of the component, structural instability is deemed to have occurred, and the corresponding load is identified as the critical instability load for the structural dynamic response. In the seismic response analysis of structures, the application of incremental dynamic analysis (IDA) [66,67] allows for solving dynamic stability problems.
The first type of dynamic stability determination is of theoretical significance and does not account for real-world conditions. In contrast, the second type of stability determination method is more practical, as it considers geometric nonlinearity, material nonlinearity, and other characteristics of the finite element structure. By incrementally increasing the dynamic load in the nonlinear analysis, this approach better aligns with engineering design requirements.

5. Incremental Dynamic Analysis of Tunnel Steel Arch under Seismic Action

5.1. Principles of IDA Analysis

(1)
Incremental Dynamic Analysis (IDA) is a method based on dynamic elastic–plastic time-history analysis. It utilizes the initial seismic acceleration value Eϒ and adjusts the ground motion intensity (Intensity Measure, IM) to generate a set of different seismic accelerations. In this study, amplitude modulation was performed using the equal-step method [68]. In this study, the equal-step method was used to amplitude-modulate the PGA values (0.1 g, 0.2 g, 0.3 g…, 0.9 g, 1 g, and 1.1 g).
(2)
The Eϒ values obtained from amplitude modulation, along with the measured maximum surrounding rock pressure, were sequentially applied to the finite element model. Using finite element software ANSYS2022, the time-history analysis of the structure was conducted for a total of 55 working conditions. Additionally, the maximum seismic response of the structure under different seismic intensities, represented by the structural damage index (Damage Measure, DM), was obtained.
(3)
Finally, the intensity measure (IM) and the calculated structural damage index (DM) were plotted to generate the IDA curve for a single seismic event.
(4)
Given the inherent uncertainty of seismic events, to comprehensively evaluate the seismic performance of the compression structure, various seismic waves representing typical cases can be selected for incremental dynamic analysis (IDA). This allows for the generation of a series of IDA curves.

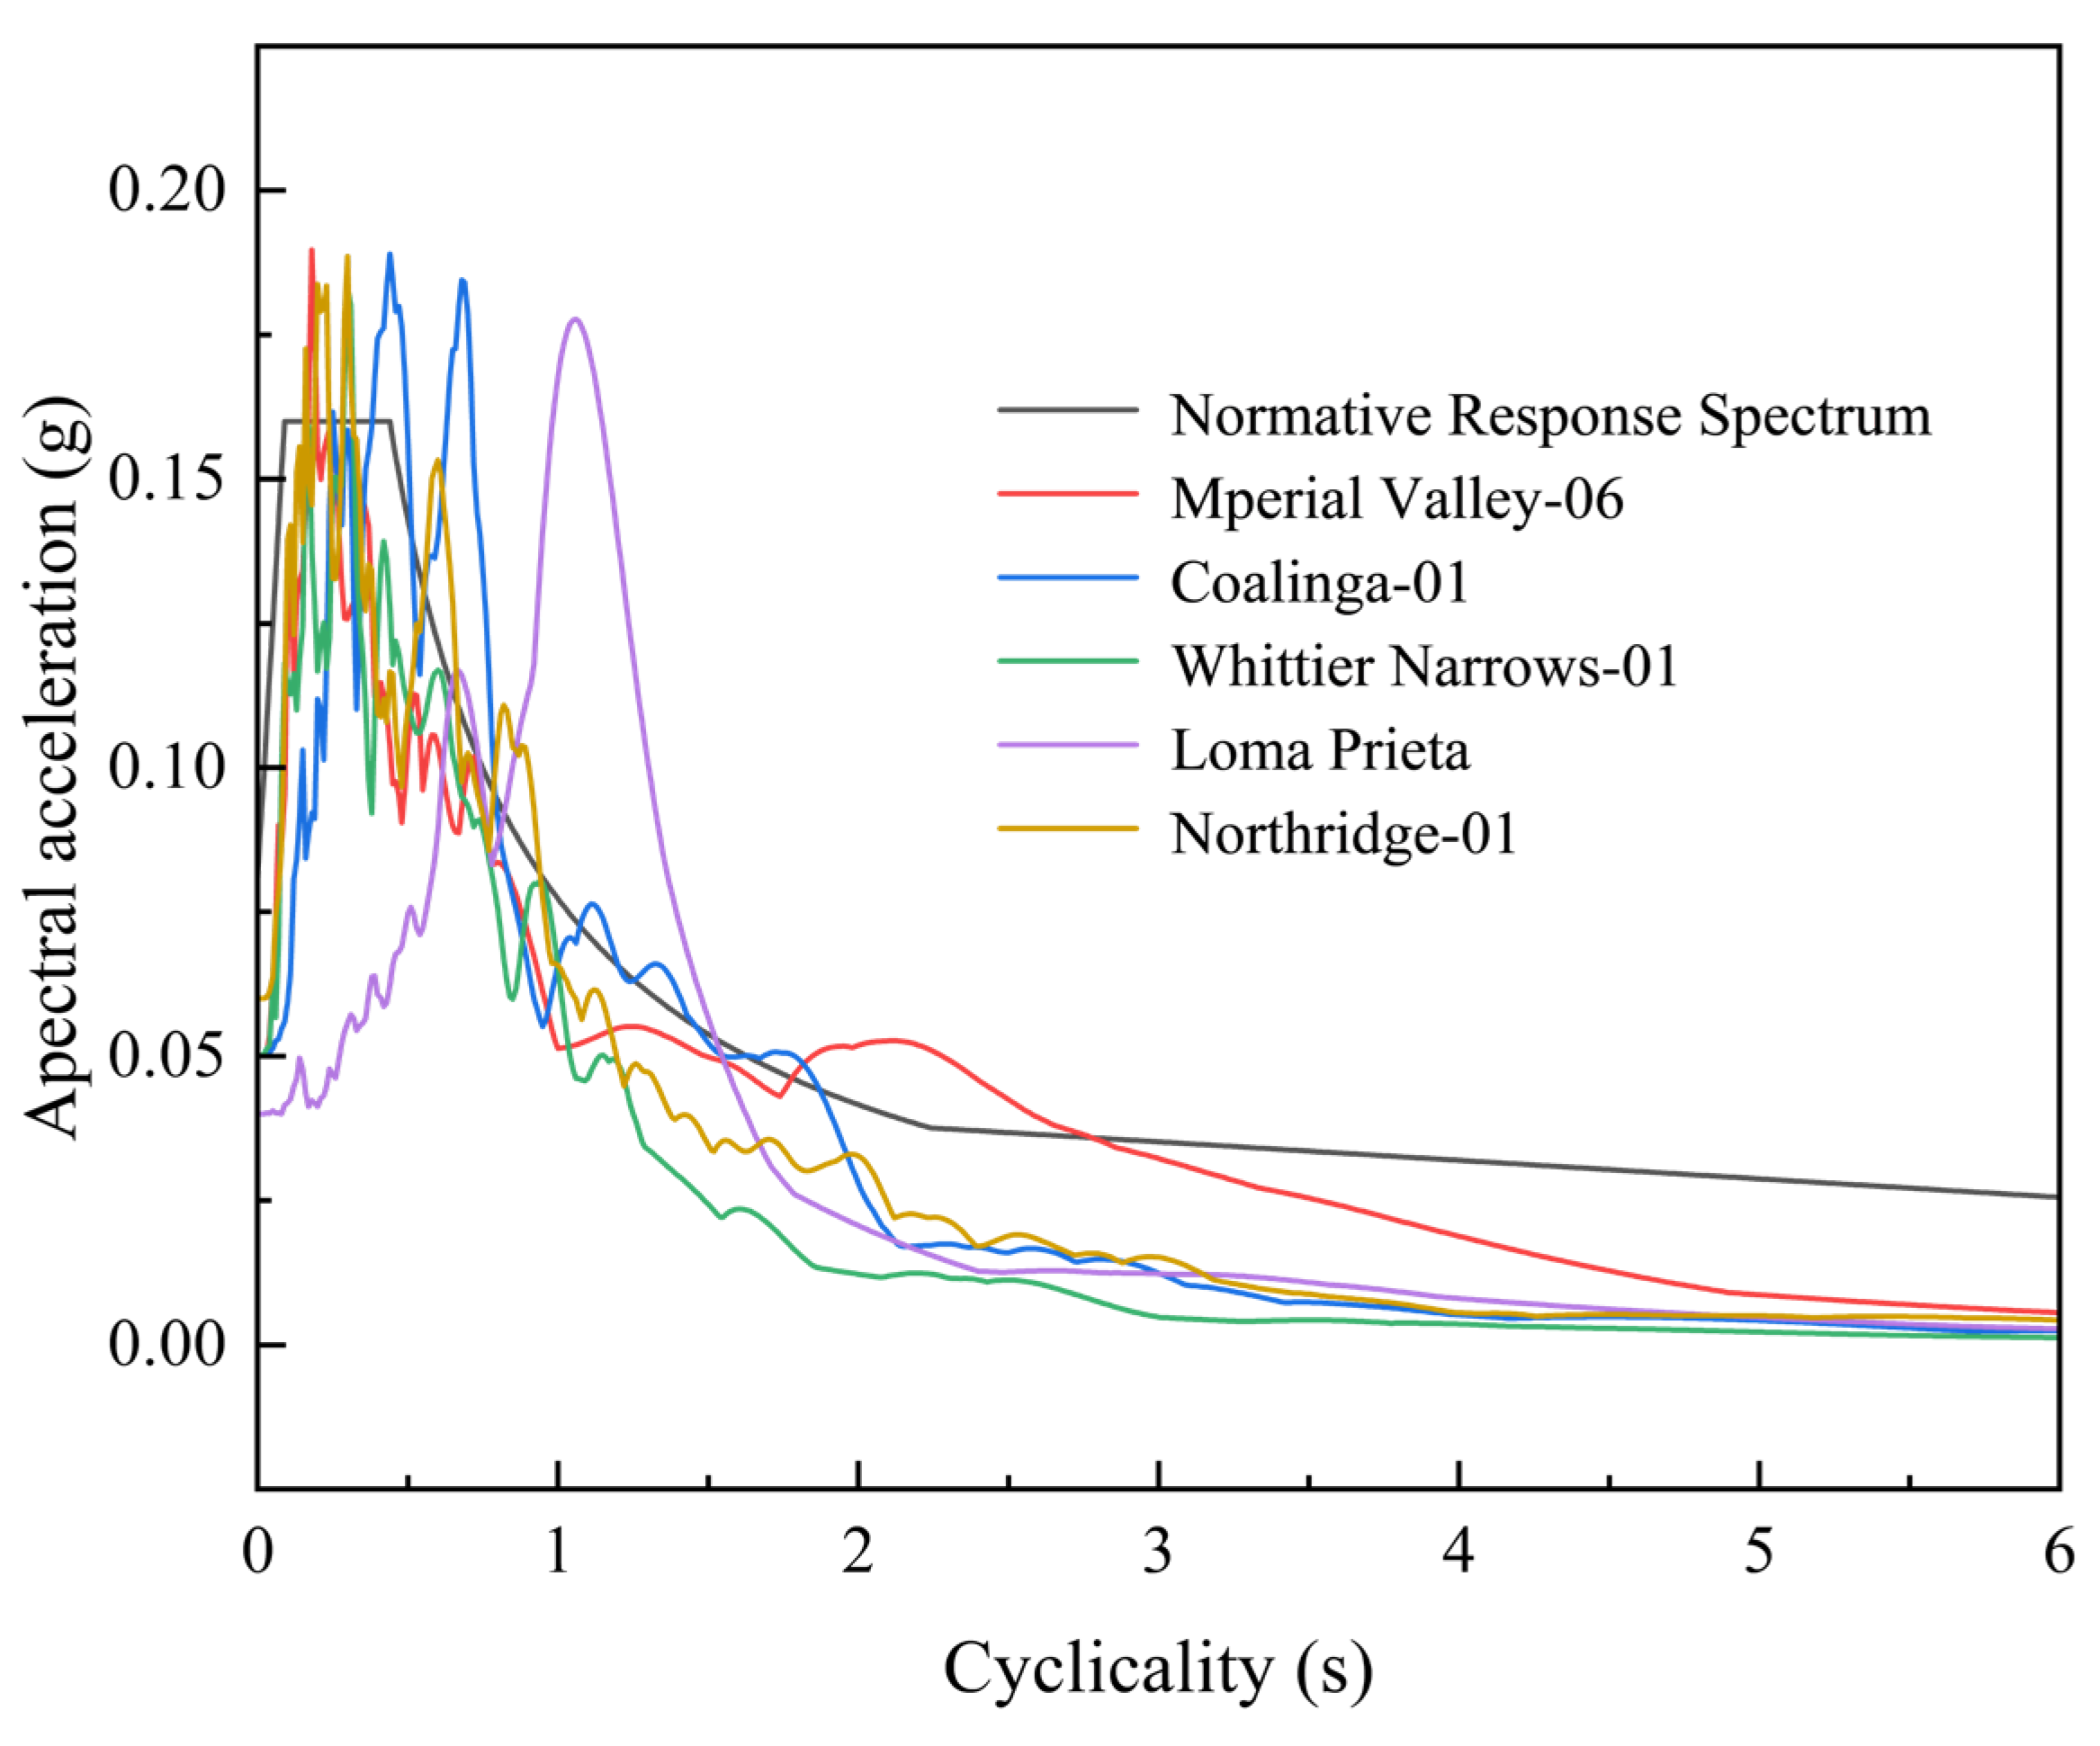
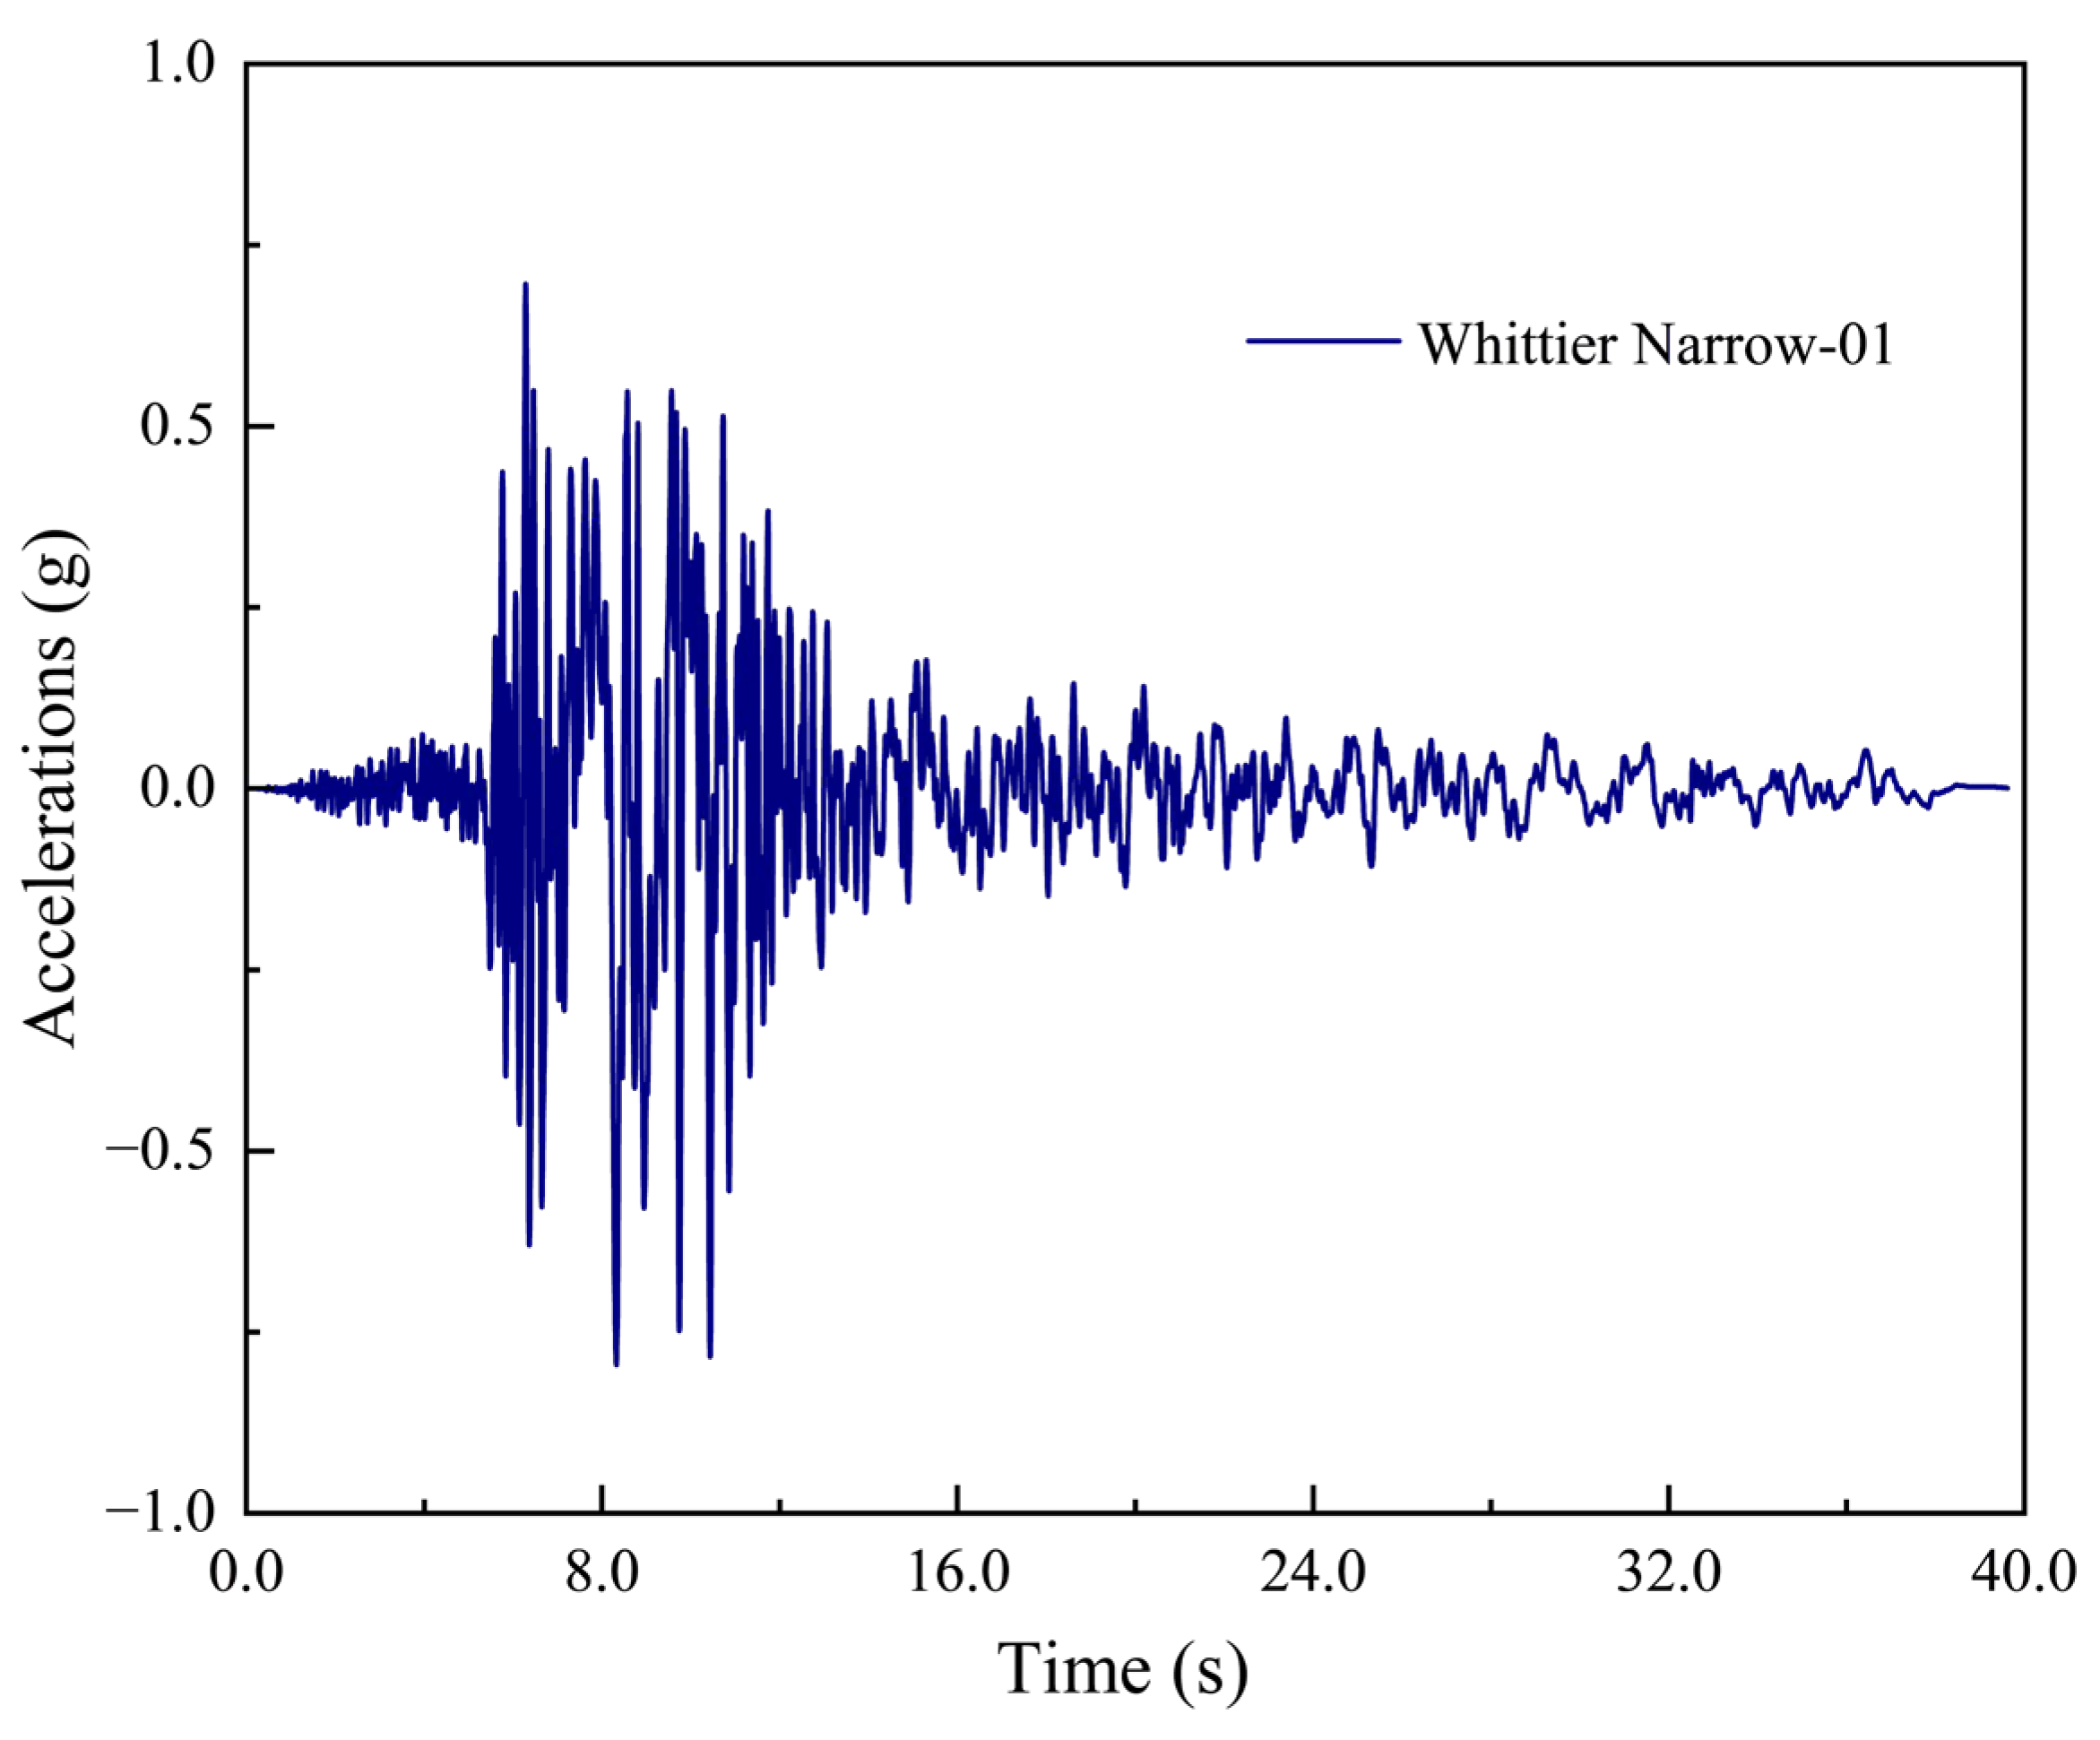
5.2. Selection of Ground Vibration Intensity Parameters and Seismic Wave Selection

The primary seismic strength parameters of the structure include peak ground acceleration (PGA), peak ground velocity (PGV), and the spectral acceleration Sa (T1, 5%), corresponding to a 5% structural damping ratio and the fundamental period. According to the related literature [69], PGA, as the most widely used ground-shaking intensity index, accounts for 65.96%, while PGV and peak ground displacement (PGD) contribute 14.89% and 6.38%, respectively. Other ground-shaking intensity parameters are rarely employed in practice. PGV is more pertinent to the seismic response during medium to long structural periods and exhibits a more uniform distribution across period changes [70].
In this study, PGA is used as the intensity measure (IM) to generate the corresponding IDA curves. Five seismic waves, as detailed in Table 6, were selected to analyze the dynamic time history of the tunnel, from which the incremental dynamic analysis (IDA) curves were derived. The ground vibration characteristics should align with the site conditions. The Jewel Mountain Tunnel is located in a Class III loess site with a basic seismic intensity of 8 degrees, a peak ground acceleration (PGA) of 0.2 g, and a characteristic period of 0.45 s. Based on these parameters, the acceleration response spectrum was designed and plotted. Figure 15 compares the selected average response spectrum of the ground motion record with the design response spectrum for an 8-degree multiple-occurrence earthquake. The average response spectrum closely aligns with the design spectrum, validating the selection of ground motion records.
The Whittier Narrow-01 seismic wave record was processed using the SeismoSignal software 2018, where the seismic waveform was analyzed to obtain the PGA time history curve, as illustrated in Figure 16.

5.3. Determination of Damage Metrics (DM)

In the current practice of incremental dynamic analysis (IDA) for tunnels, the diameter deformation rate and damage index are commonly employed as damage indicators [71].
In highway tunnels, tricentric circular arch tunnels are common cross-sectional forms, according to the characteristics of the cross-sectional shape of highway tunnels, and the strength at the nodes is smaller than that of steel arches, the relative deformation rate of the tunnel is used as a damage indicator. That is, the ratio of the deformation of the letting pressure node to the diameter of the tunnel is used as the damage indicator:
ξ = Δ l 2 D
where ξ is the relative deformation rate (‰) of the tunnel letting pressure steel arch; Δ l is the deformation of the steel arch under different seismic effects (cm); and D is the diameter of the Jewel Mountain Tunnel, which is taken as 6.25 m.
The damage indicator limits refer to the quantitative thresholds for each damage state obtained from a numerical simulation of mountain tunnels by Chen [72], as shown in Table 7.

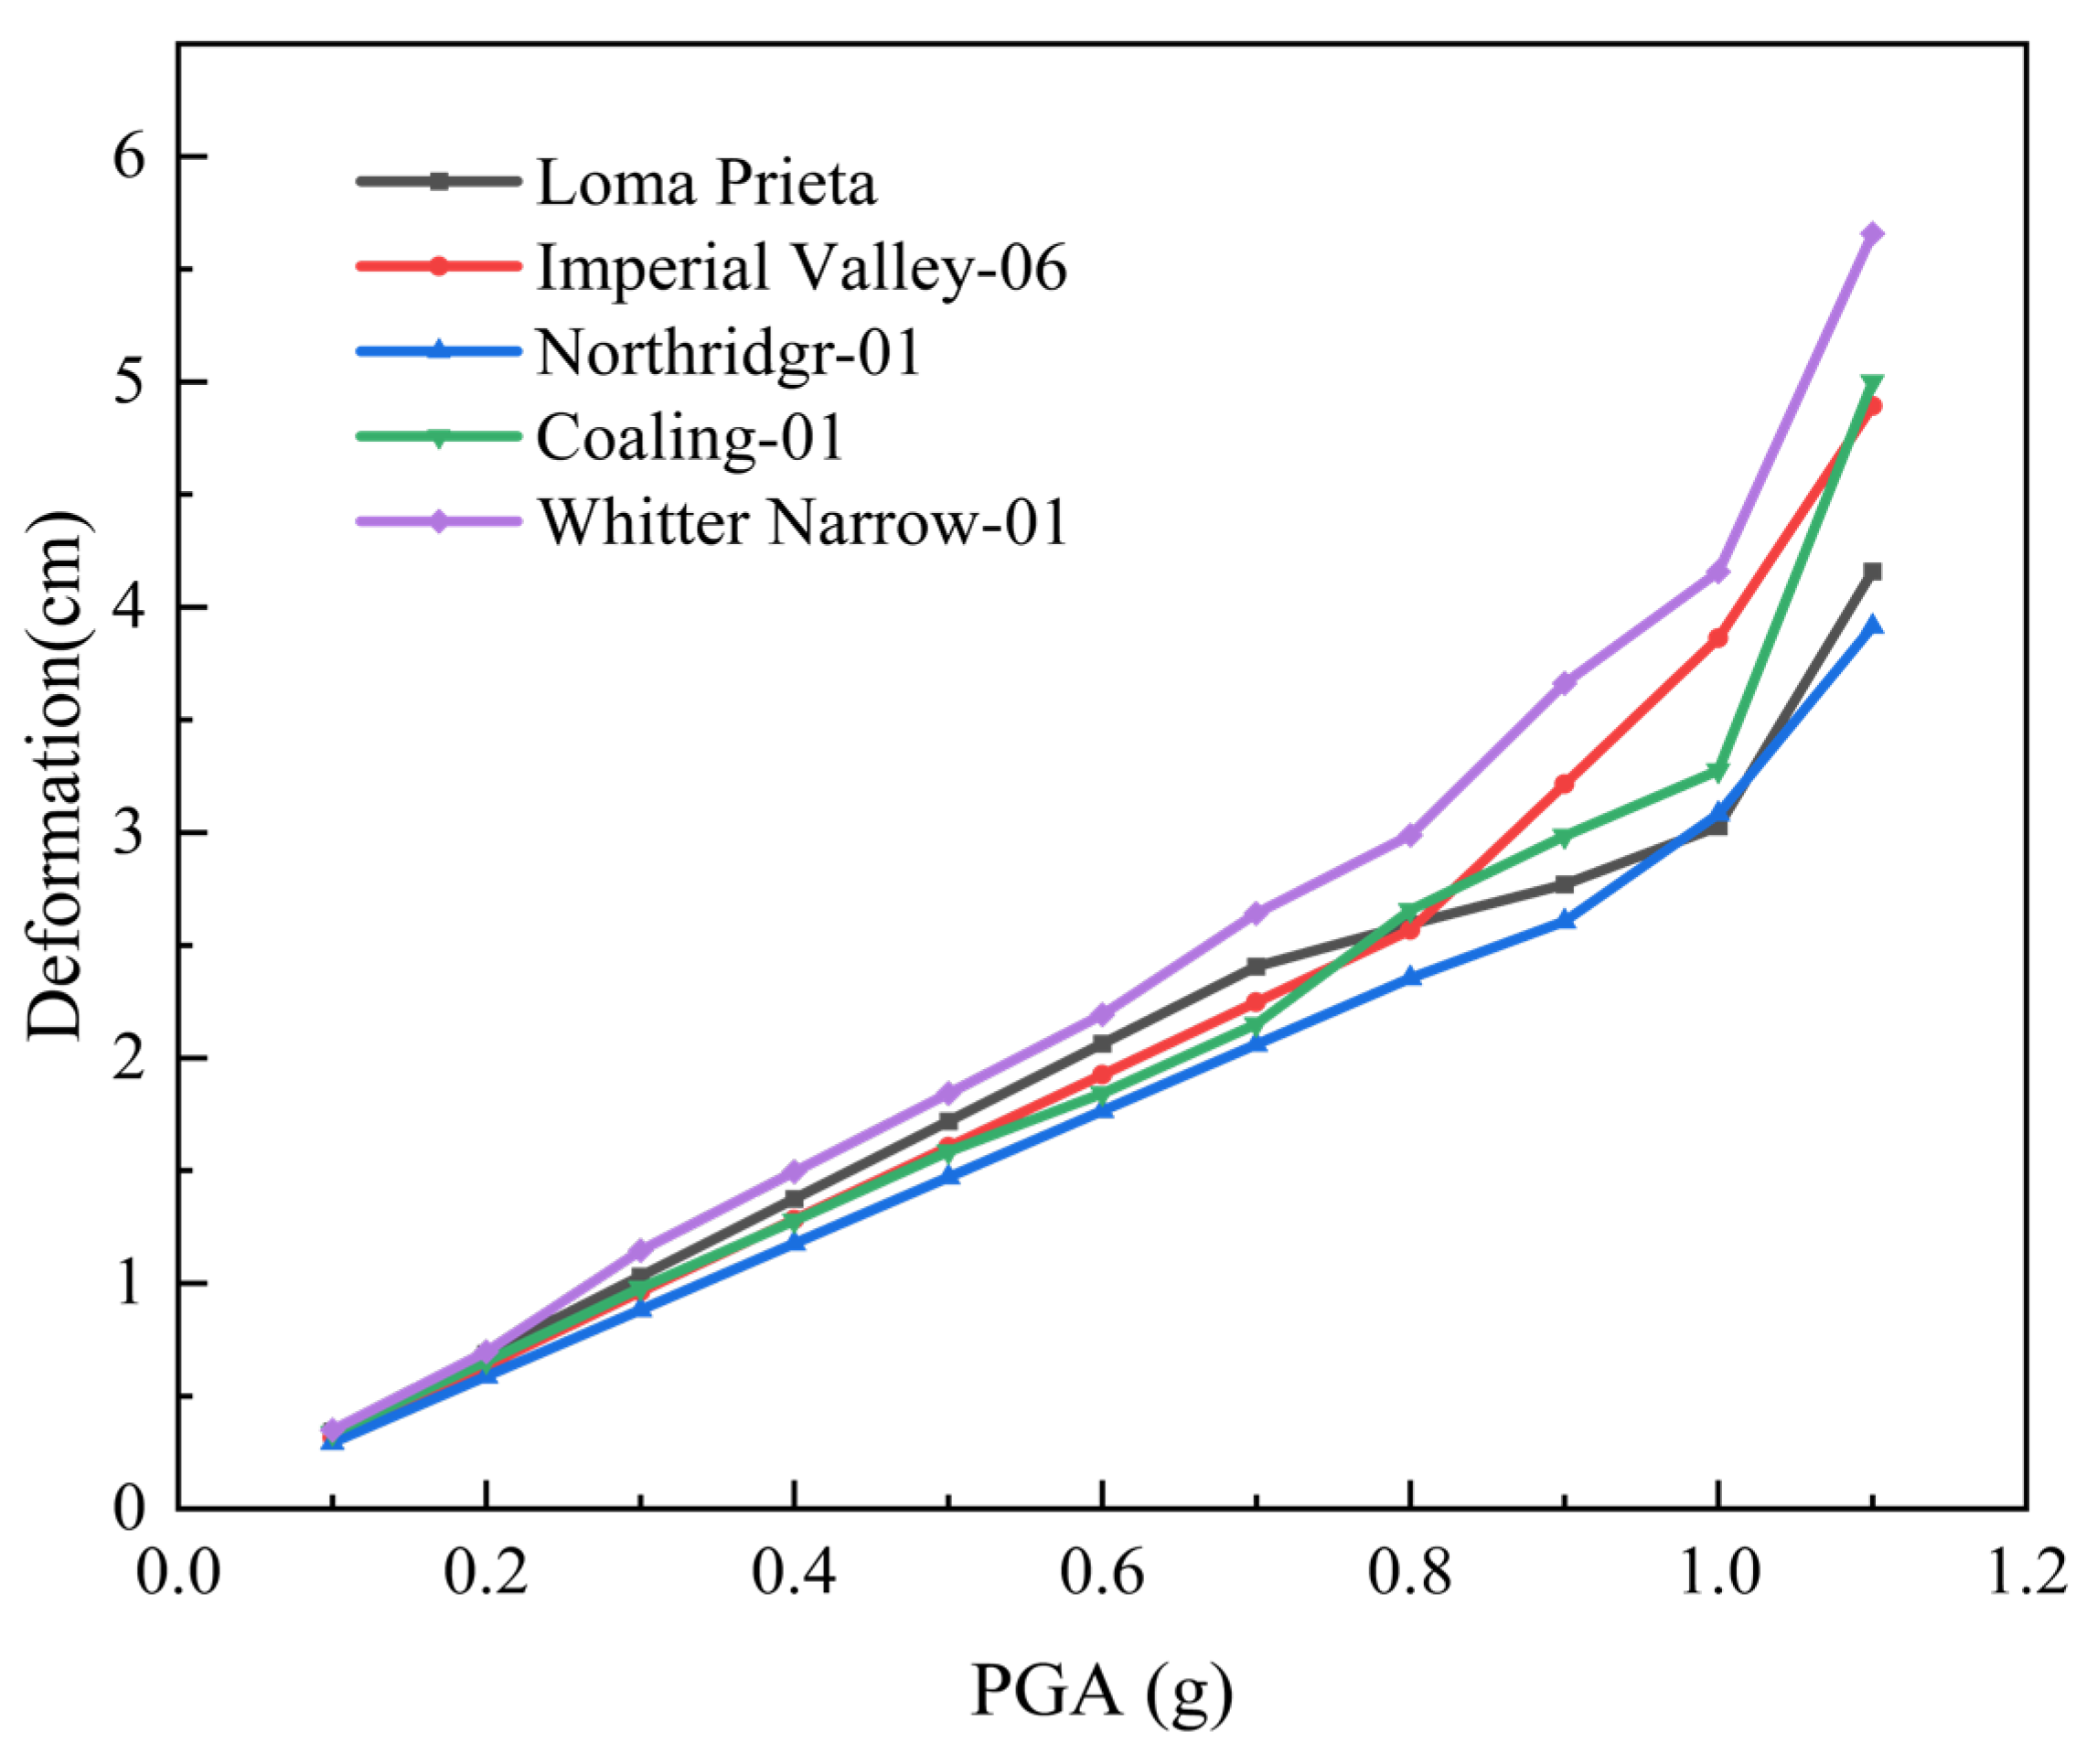
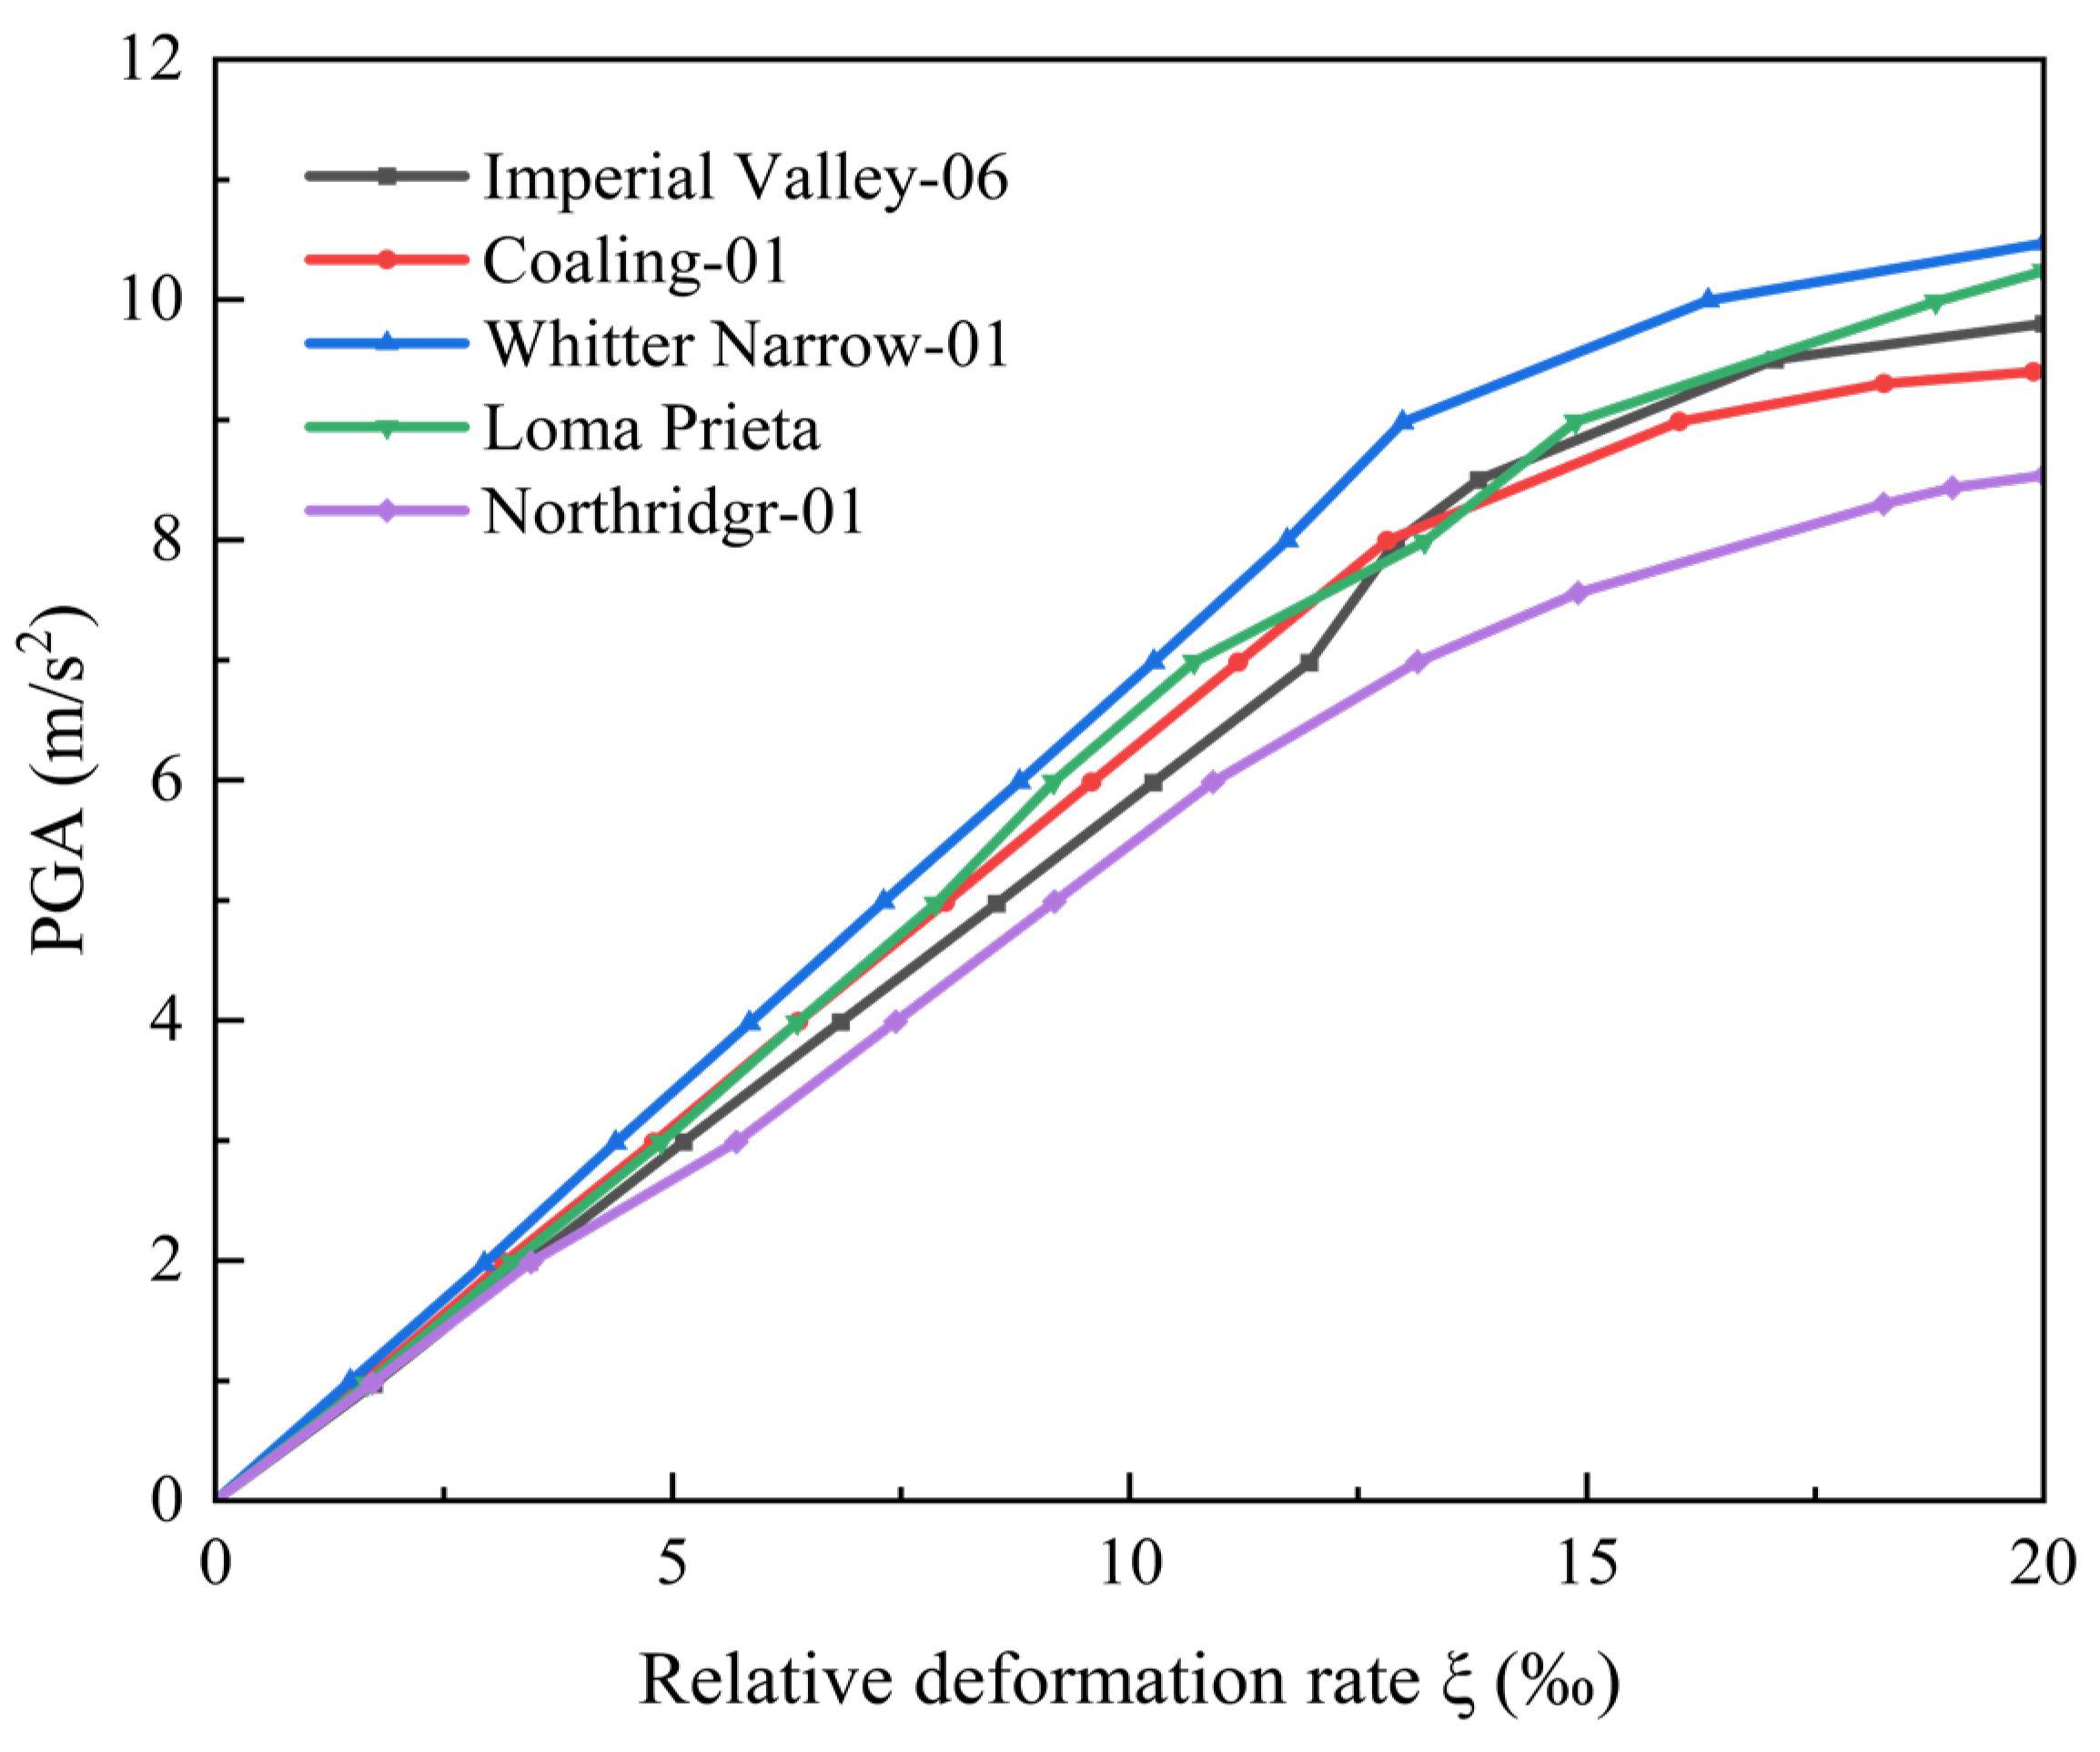
5.4. Plotting of IDA Curves

In this study, the finite element analysis software ANSYS 2022 is employed to perform an incremental dynamic analysis (IDA) on the let-pressure steel arch. The two base plates at the nodes of the finite element model, as shown in Figure 4, are fixed, and the maximum peripheral rock pressure of 1.25 MPa, as described in Section 3.4.3, is applied to the model. In ANSYS, an elastic–plastic time-history analysis of the steel arch is performed by applying amplitude-modulated seismic waves. The analysis concludes when the structure reaches the second mode of dynamic instability, and the underlying force principle is illustrated in Figure 17.
The constant load dynamic time-history analysis of the let-pressure node steel arch was conducted using ANSYS, with the arrangement of the monitoring points illustrated in Figure 18 below. The Node ID numbers of the monitoring points (A1~A9) selected on the upper surface of the finite element model are 830, 2780, 4436, 5094, 5822, 6427, 6825, 7126, and 7862.
The Whittier Narrow-01 seismic wave, with an amplitude modulation ranging from 0.1 g to 0.5 g, was selected as the ground motion. Data from the selected monitoring points were then extracted. The Node ID of each monitoring point was used as the horizontal coordinate and the corresponding deformation as the vertical coordinate to plot the curve shown in Figure 19.
Due to the structural symmetry, only monitoring points A1 through A5 were selected for analysis in this study. As shown in Figure 19, the time-history curves of the five monitoring points are similar, with larger deformations observed at the letting deformation node, particularly between segments A1 and A2. This indicates that the deformation at the node is greater compared to other areas of the steel arch when subjected to seismic loads. This is attributed to the use of soft steel at the node, which has a lower stiffness than Q235 steel. Therefore, stiffening ribs are welded at the let-pressure node and the steel arch’s abdominal connecting plate to enhance the overall structural stability and stiffness.
To gain a clearer understanding of the damage to steel arches under seismic loading, simulations were performed in ANSYS, with the results presented in Figure 20. The failure modes of matrix tensile and compressive stresses were taken as the maximum stress value of the matrix at the initial stage of damage. The Active Table in the damage evolution equation was used to define the material damage properties, and the structural stiffness matrix was set to be reduced to 0.5.
The cloud diagrams above clearly demonstrate that most of the damage variables at the structural nodal joints under seismic loading reach a value of 1, indicating complete structural failure. The specific damage probabilities are detailed below.
The completed dynamic analysis data from ANSYS will use PGA as the x-axis and the deformation of the letting pressure node steel arch as the y-axis to establish the structural instability curve, as shown in Figure 21.
In this study, equal-step modulation was applied. As indicated by the destabilization curves in Figure 21, no substantial increase in deformation is observed in the steel arch at the letting pressure node when the structure experiences a ground acceleration of 1.0 g. However, upon reaching 1.1 g, the deformation sharply increases from 4.157 cm to 5.658 cm. According to the second law of dynamic stability, this significant change implies that a minor increase in load triggers a large shift in the dynamic response of the component, marking the initiation of structural instability. At this point, the Incremental Dynamic Analysis (IDA) can be terminated, as the structure is deemed to have failed.
Given the inherent uncertainty of earthquakes, it is essential to select multiple seismic waves for analysis from a probabilistic perspective. Therefore, the incremental dynamic analysis (IDA) curves of multiple seismic waves were selected, as shown in Figure 22. Using the seismic wave Whittier Narrow-01 as an example, when the relative deformation rate of the tunnel’s let-pressure steel arch is below 12.5‰, the relative deformation rate increases linearly with the peak ground acceleration (PGA), indicating that the structure is in the elastic stage. When the relative deformation rate exceeds 12.5‰, the rate of increase slows, indicating that the structure has entered the elastic–plastic deformation stage. As the ground-shaking intensity (PGA) continues to rise, the relative deformation rate of the tunnel also gradually increases. However, after the PGA exceeds 10 m/s2, the growth rate slows, and the structure enters the plastic stage. At this point, the relative deformation rate at the letting pressure nodes of the steel arch reaches 15.7‰, and according to the destruction probability range in Table 7, the structure has reached a moderate level of damage. When the PGA increases to 11 m/s2, the relative deformation rate of the steel arch at the letting pressure node exceeds 16‰, indicating that the structure has undergone complete failure.
As shown in Figure 22, the overall trend of the curves is similar. The IDA curves for each seismic wave exhibit a general increase as the seismic intensity rises. The relative deformation rate of the tunnel (ξ) increases linearly up to 12.5‰, after which the slope changes and the rate of increase slows down.

6. IDA-Based Fragility Analysis

6.1. Earthquake Vulnerability

Vulnerability analysis from a macroscopic point of view presents the relationship between the increasing intensity of seismic waves and the degree of structural damage, and from a probabilistic point of view, depicts the different degrees of damage to the structure, the IDA, and vulnerability to be analyzed in conjunction with the structure in the role of different intensities of ground shaking. The structure can show the probability of reaching a different state of damage from the point of view of the probabilistic expression, which can be expressed as the following Equation (7).
P f = P C D 1
where P f is the probability of damage, C is the ability of the structure to resist earthquakes, and D is the ability of the structure to respond under seismic action; C and D are mutually independent variables, both obeying normal distribution. In probability theory, let R = C − D, then the random variable quantity R~N(μ, σ), where
μ = μ C μ D
σ = σ C 2 + σ D 2
where μ C and σ C are the mean and standard deviation of the structure’s ability to resist earthquakes, respectively, and μ D and σ D are the mean and standard deviation of the response capacity under earthquakes.
Based on Equation (7) and the normally distributed probability density function, the damage probability of the structure can also be written as:
P f = 0 1 σ 2 π e X μ 2 σ 2 d X
The above equation is not easy to calculate, and this paper introduces a new random variable Y to transform R into a standard normally distributed random variable transformed relational equation, as shown in Equation (11).
Y = R μ σ
Equation (10) should further read
P f = Φ Y μ σ = Φ l n C l n D σ C 2 + σ D 2
where Φ is the standard normal distribution function; C is the ability of the structure to resist earthquakes; D is the ability of the structure to respond under seismic action; σ C   is the standard deviation of the structure’s ability to resist earthquakes; and σ D   is the standard deviation of the ability to respond under earthquakes.
It is assumed that there is an exponential correlation between the damage index DM and the ground vibration intensity index IM of its structure [73], and the relationship is shown in Equation (13).
D M = a · I M b
Taking logarithms on both sides of Equation (13), the following relation (14) can be obtained.
l n D M = l n a + b l n I M = A + B l n I M
where A and B are constants, which can be derived from the linear regression method of the model response data under the action of ground-shaking.

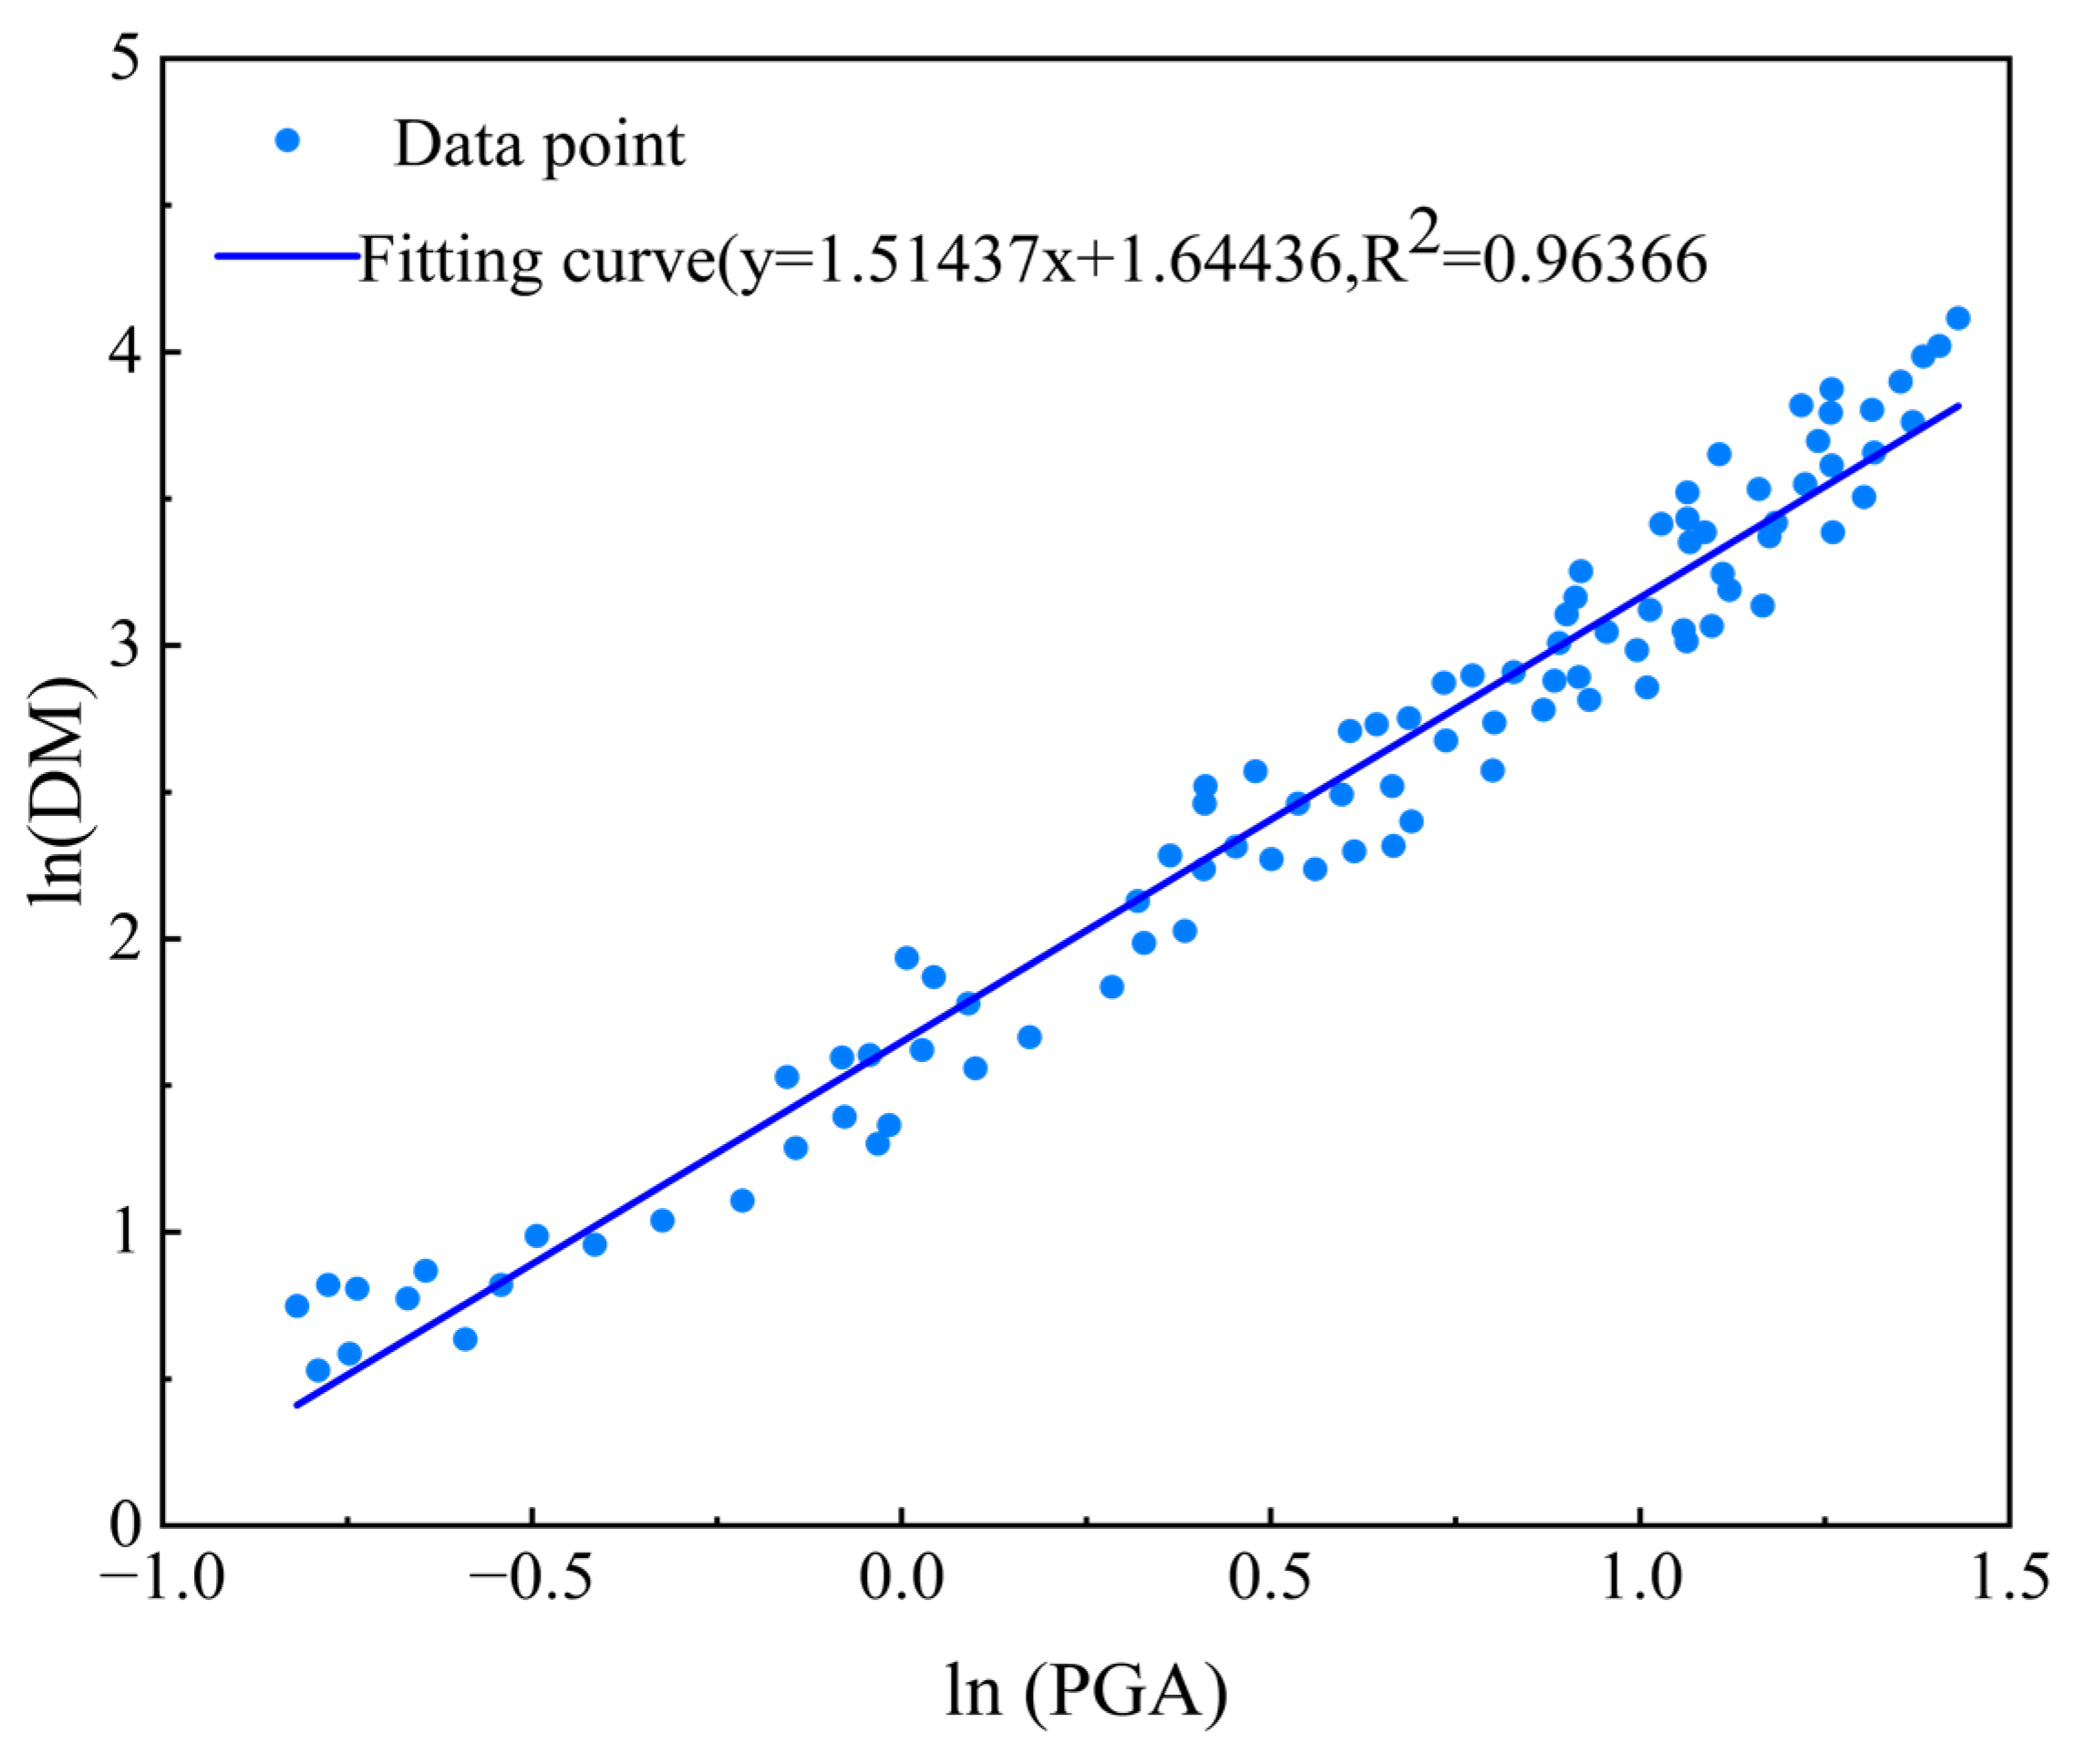
6.2. Linear Regression Analysis

According to Equation (14), the logarithm of the ground vibration intensity (PGA) is used as the independent variable, while the logarithm of the relative deformation rate of the tunnel’s let-compression steel arch, obtained from finite element dynamic time-history analysis, is used as the dependent variable. A power linear regression analysis is performed on the incremental points to evaluate the reasonableness of selecting PGA as the intensity measure (IM). The damage measure (DM) is assumed to follow a conditional log-normal distribution with respect to the IM. The regression results, plotted in ORIGIN, are presented in Figure 23. As shown in Figure 23, the logarithmic values of the ground vibration intensity and relative deformation rate exhibit a strong linear relationship, with a linear correlation coefficient of 0.96, indicating a good fit. This confirms that selecting PGA as the IM is reasonable.
From Equation (14) it follows that (15) is
l n D M = 1.64436 + 1.514 l n I M

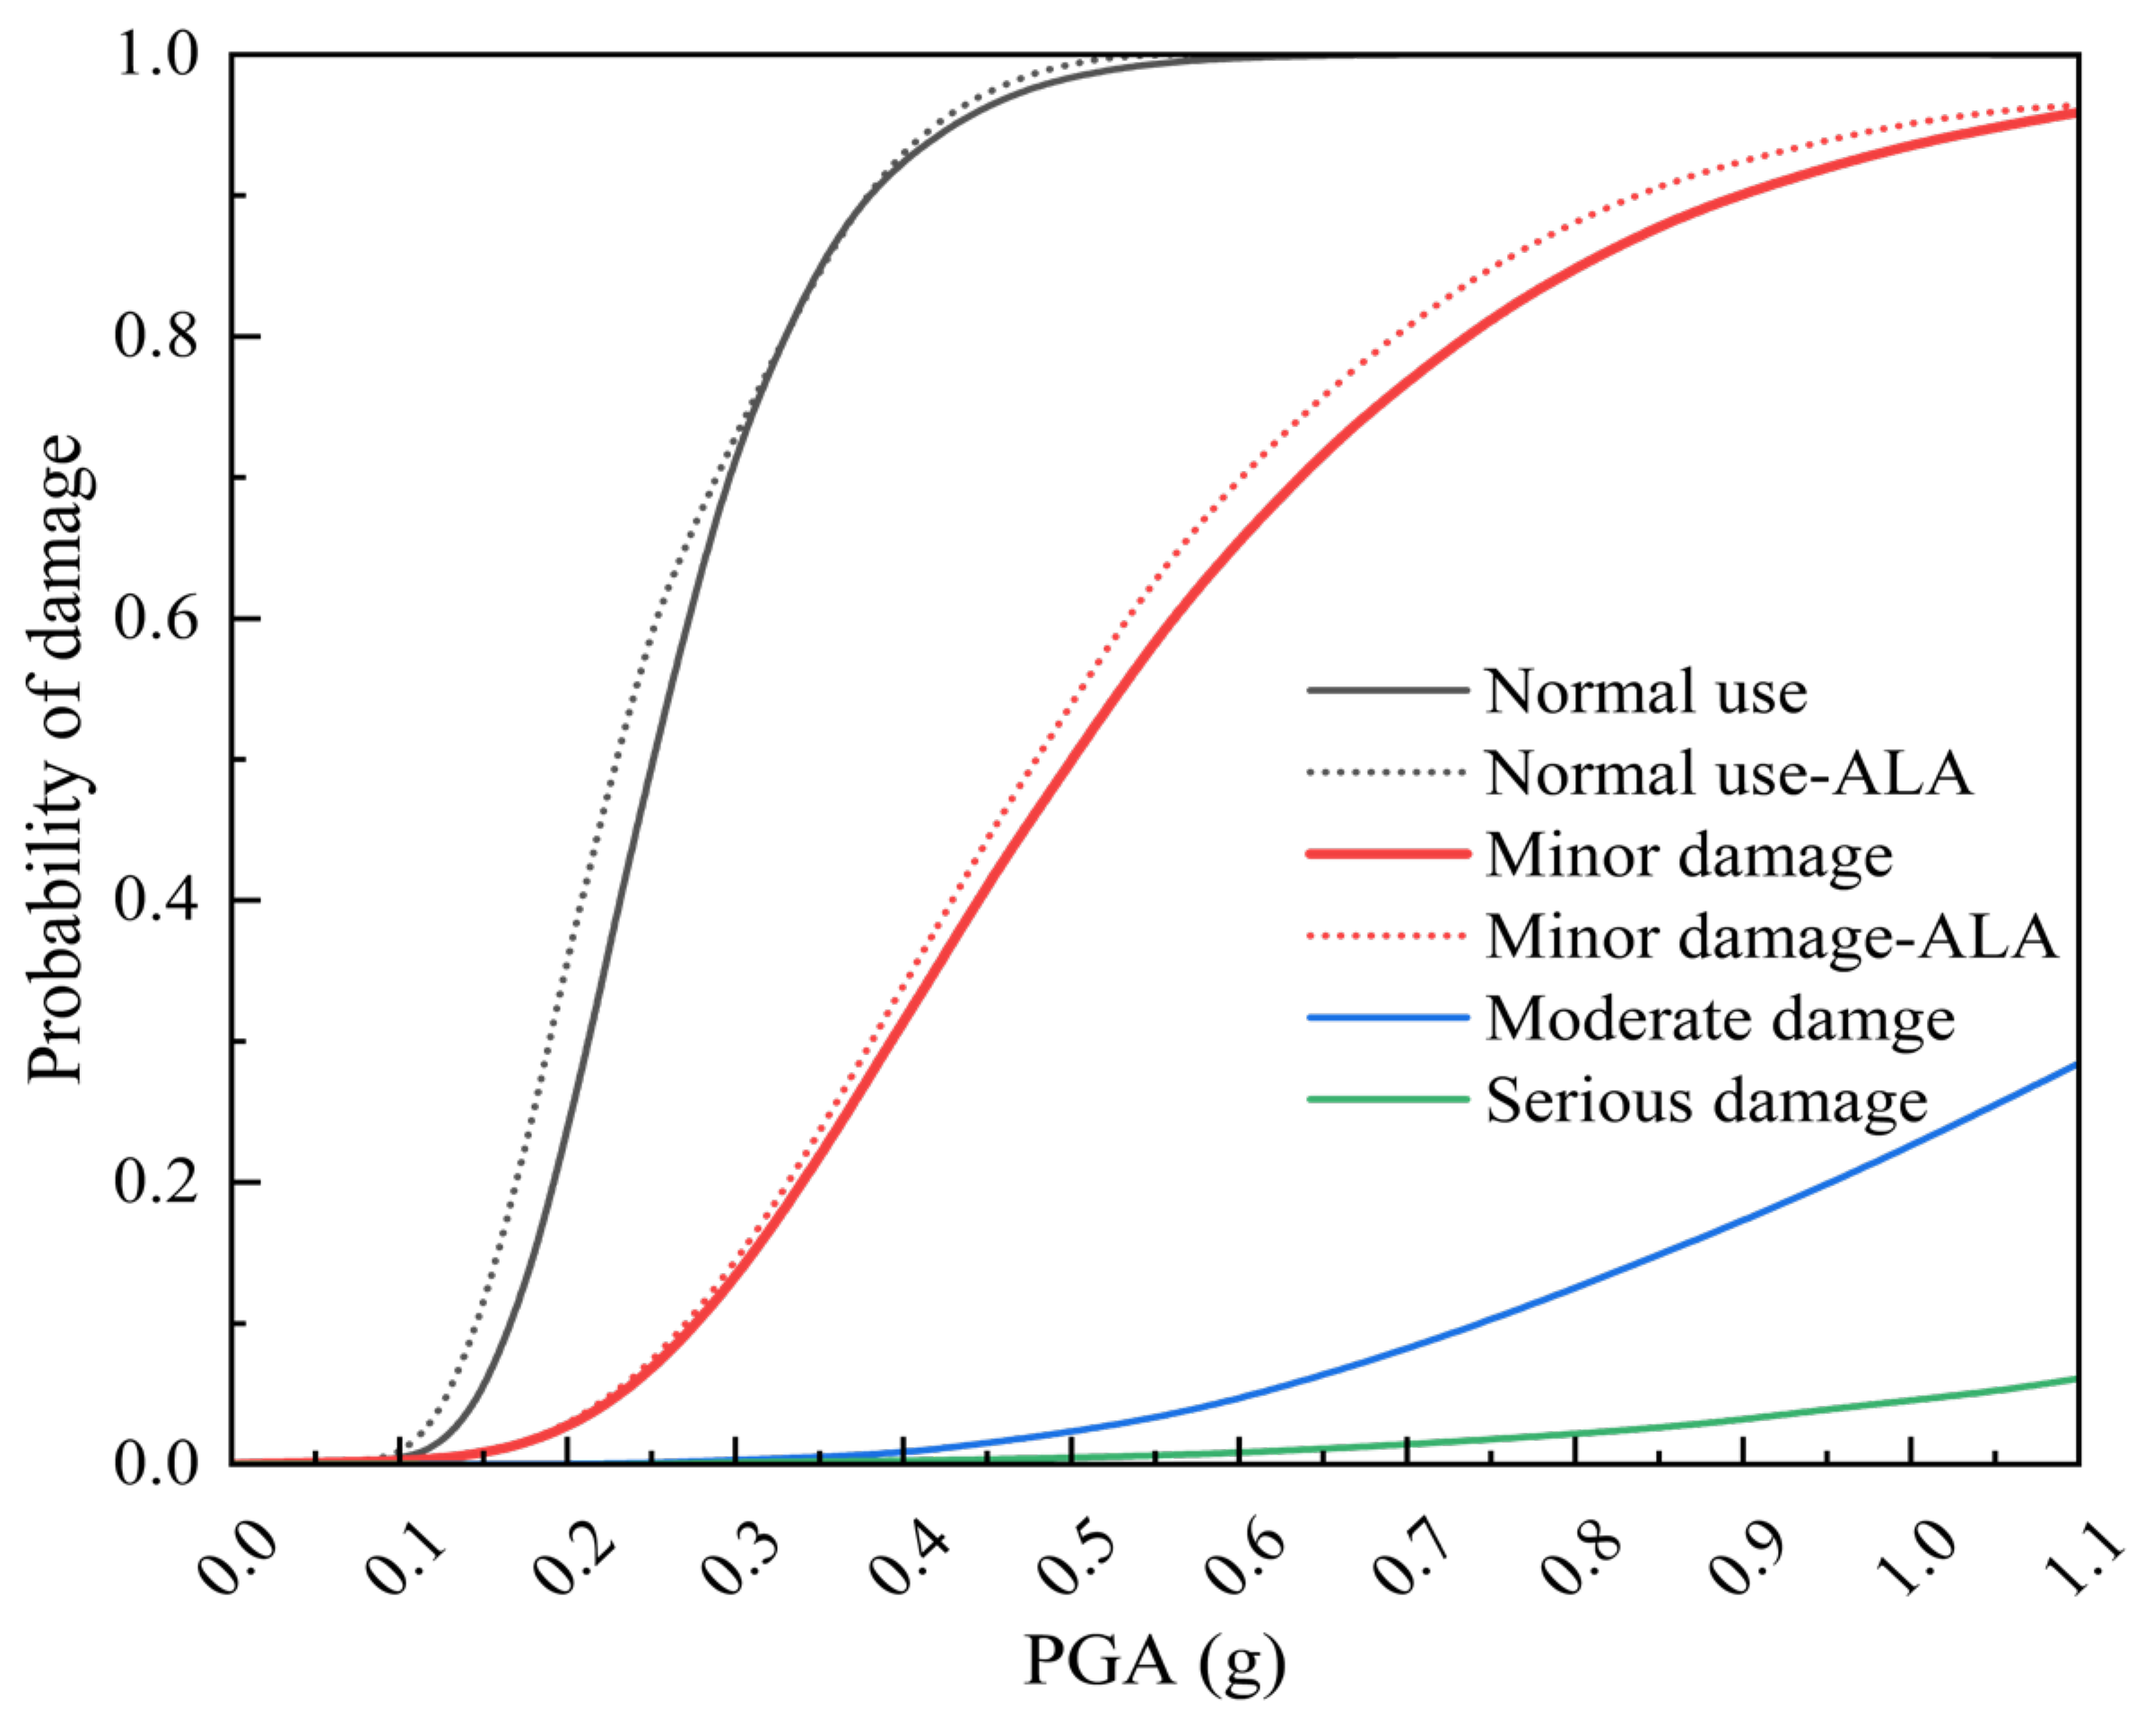
6.3. Perishability Curve Establishment

By substituting the fitted relation from Equation (15) into the susceptibility function in Equation (12), and using the probability of exceeding various damage states and the damage index from Table 6, the seismic susceptibility curves for the tunnel structure under different damage states can be derived. Additionally, the failure probability of the tunnel structure under varying peak ground accelerations can be determined.
As shown in Figure 24, the exceeding probability of each damage state of the tunnel increases with the seismic intensity. For the 8-degree design ground-shaking level [74], the corresponding PGA is 0.4 g, with a 50-year exceeding probability of 2%. First, the peak ground velocity corresponding to rare seismic events is determined, and the damage probability of the tunnel’s let-pressure steel arch under various seismic levels is derived from the susceptibility curve, as shown in Table 8. Table 8 indicates that, under the 8-degree design ground shaking level, there is a 94% likelihood that the let-pressure steel arch will exceed the normal use limit state, with a probability of slight damage. This highlights the importance of considering the structural seismic resistance under adverse geological conditions, particularly when the tunnel passes through near-fault regions.
To validate the numerical analysis of the susceptibility curves, the curves derived in this study were compared with the empirical susceptibility curves for well-constructed structures, as outlined in the American Lifelines Alliance (ALA) code [75]. Given that the ALA lacks a comprehensive database of structural damage statistics, the comparison is limited to the empirical curves for normal use and minor damage. As shown in Figure 25, the normal-use fragility curves obtained in this study generally align with the ALA results. However, the slight-damage fragility curves are marginally lower than those of the ALA, with a maximum deviation of no more than 12%. Given that the ALA’s empirical susceptibility curves are based on earthquake damage statistics, which carry significant uncertainty and predominantly focus on structural damage at weak sites, this deviation is theoretically reasonable. This further confirms that the results obtained in this study have a practical reference value.

7. Conclusions

For soft rock tunnels, seismic activity further exacerbates surrounding rock deformation, increasing the risk to structural integrity. Therefore, understanding extrusion deformation and the structural support capacity under seismic conditions in soft rock tunnels located in high-seismicity regions has become a critical area of research. To address the issue of significant tunnel extrusion deformation, this paper introduces a novel support scheme grounded in yield support theory—namely, the let-pressure node steel arch support system. At the Jewel Mountain Tunnel, pressure boxes, steel bar meters, and reflectors were installed at the letting pressure node and arch top to monitor the surrounding rock pressure, steel arch forces, and deformation. The collected data were analyzed to assess the forces and deformation at the letting pressure nodes of the steel arch, thereby validating the feasibility of this approach. To further investigate the damage probability and support capacity of the steel arch at letting pressure nodes under seismic loads, this paper develops a seismic susceptibility analysis method grounded in incremental dynamic analysis (IDA) for the steel arch at the tunnel letting pressure node. The analysis considers the characteristics of existing yield support systems and employs peak ground acceleration (PGA) as the ground vibration index and the relative deformation rate of the letting pressure node as the structural damage index, using logarithmic fitting to validate the ground vibration and deformation correlation. Using this method, the seismic performance of the tunnel can be efficiently assessed via susceptibility curves, and the following conclusions were drawn from large deformation experiments and susceptibility analysis.
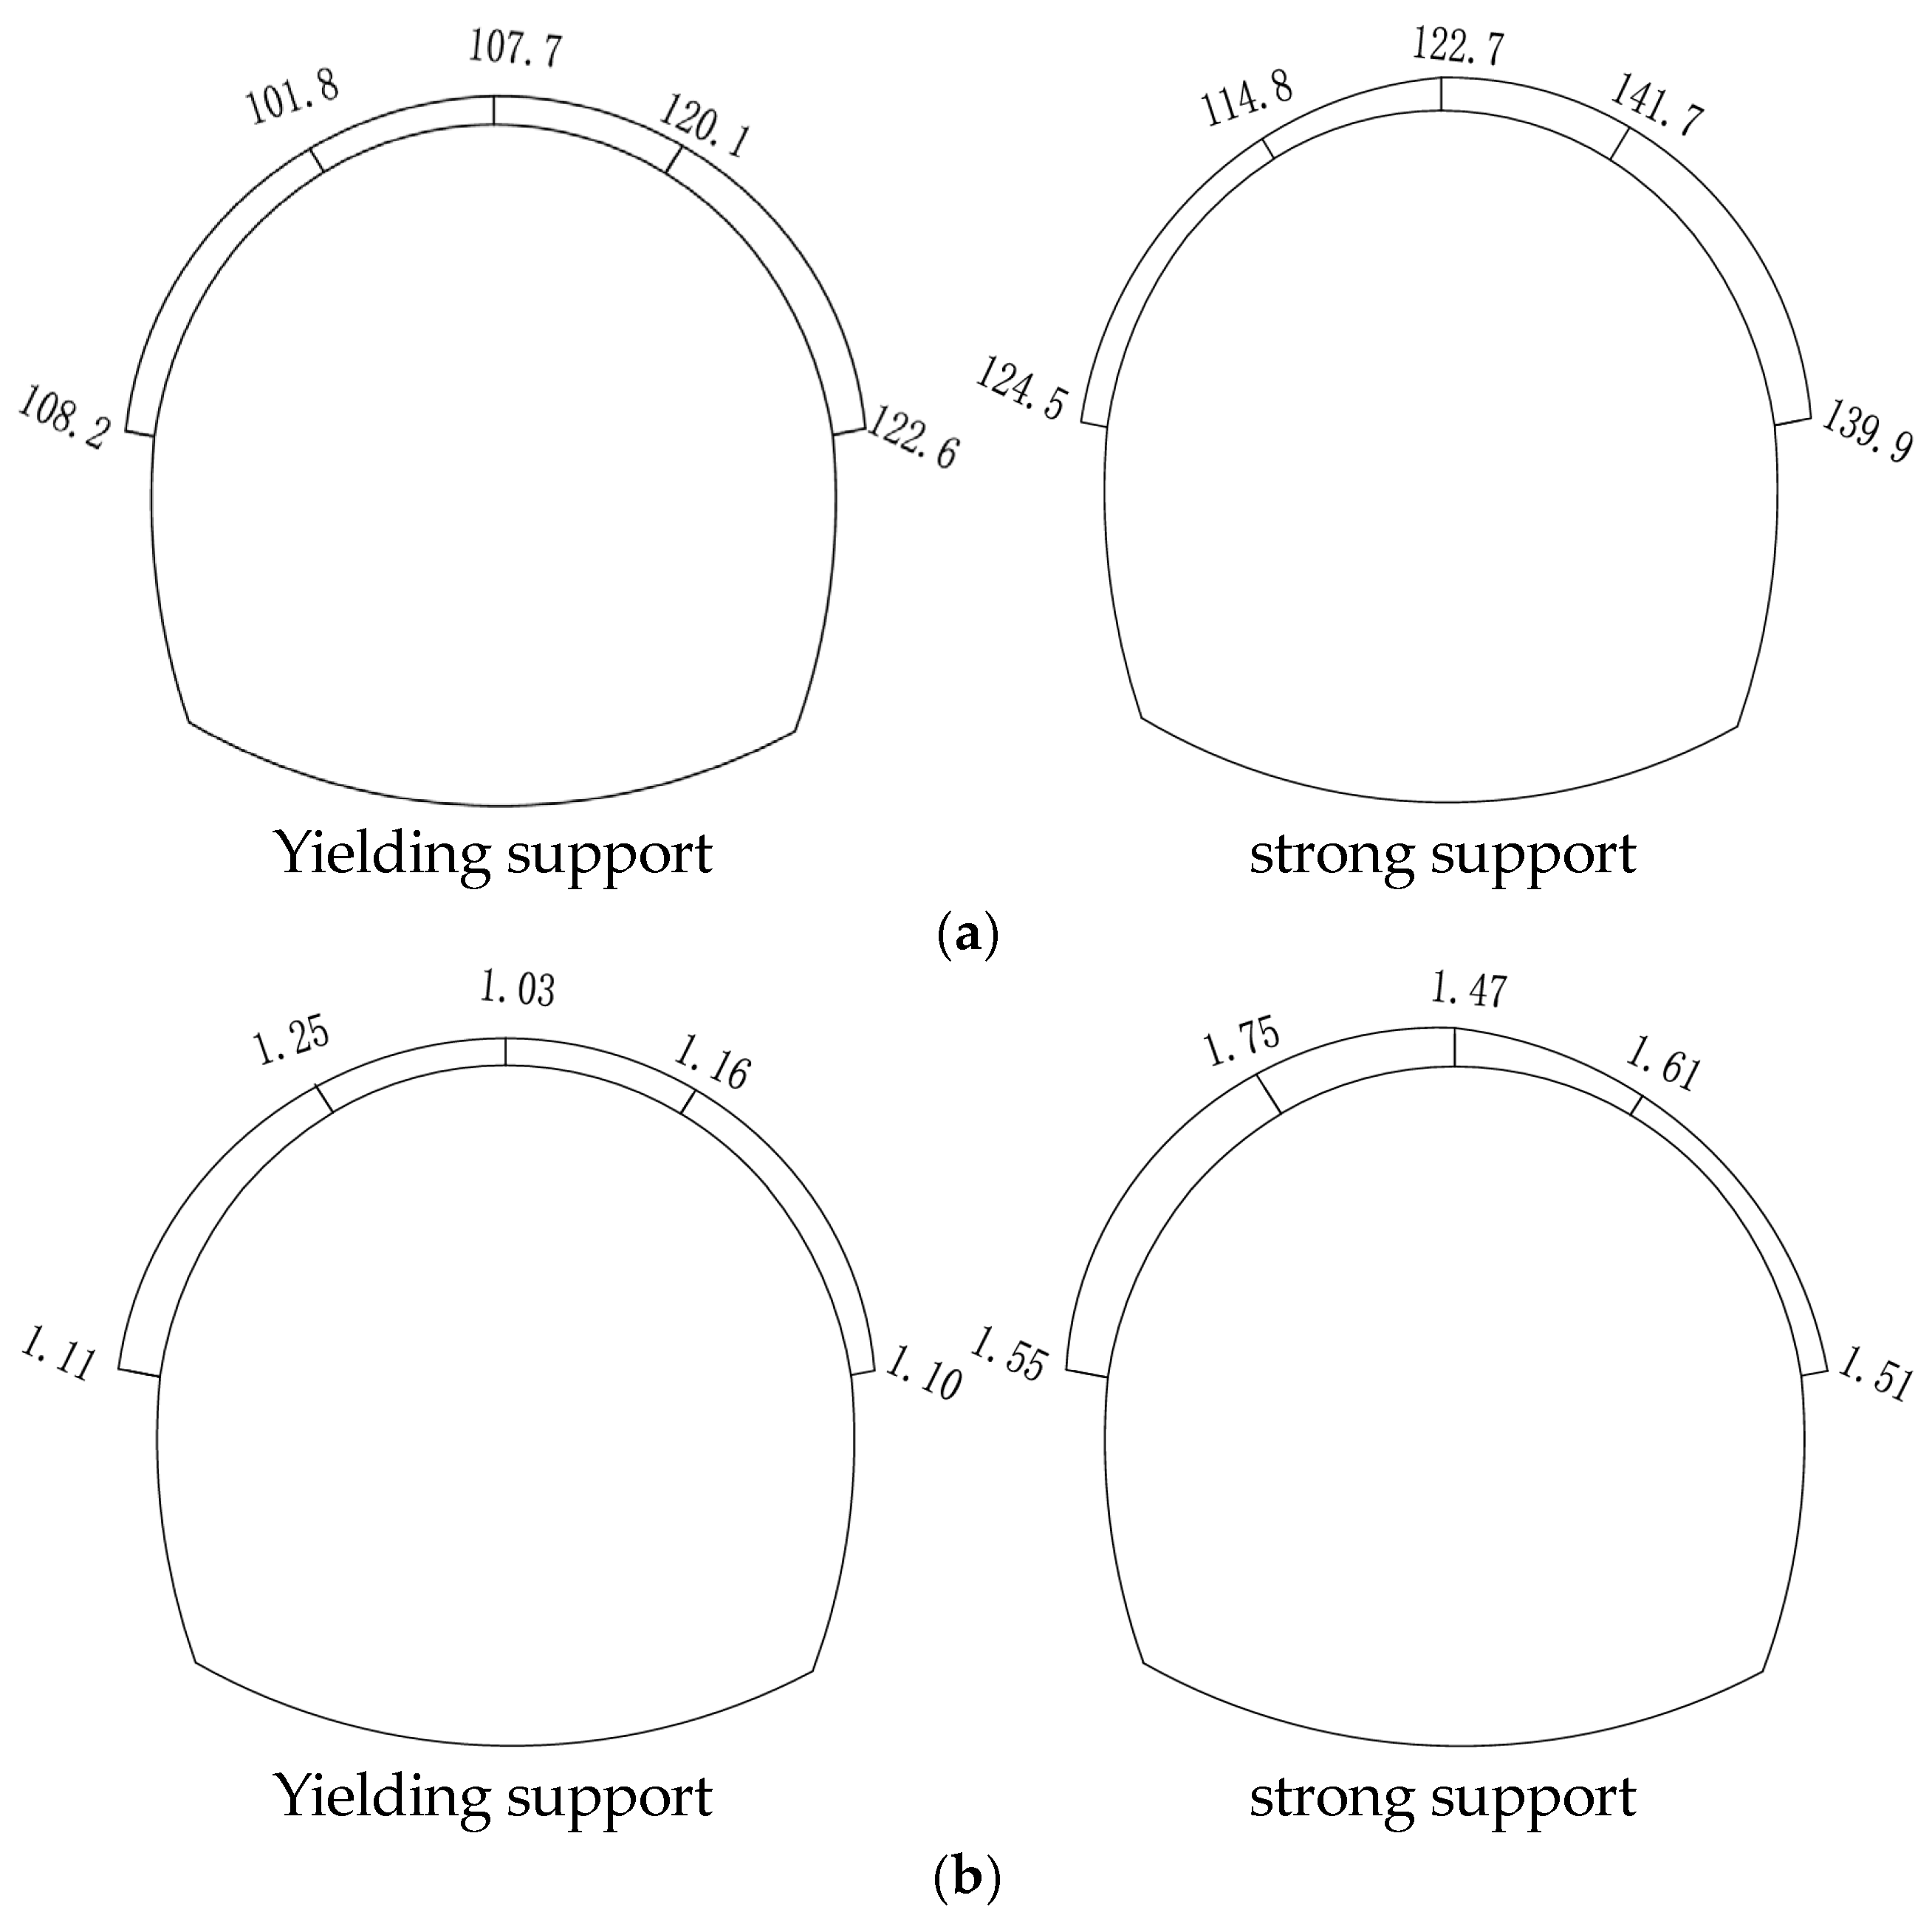
  • Compared to traditional strong support methods, the let-pressure node steel arch effectively reduces the surrounding rock pressure by allowing for greater rock displacement, optimizing structural forces and enhancing the self-stabilizing capacity of the surrounding rock. In the Jewel Mountain Tunnel, the surrounding rock pressure was reduced by 23%, and structural forces were lowered by 11%. The project was completed without requiring later arch replacement, effectively addressing the issue of large deformation and saving both time and costs associated with arch replacement.
  • An incremental dynamic analysis (IDA) was conducted on the yielding steel arch. The relative deformation rate remained below 12.5‰ in the elastic phase and exceeded 12.5‰ in the plastic phase. As the peak ground acceleration (PGA) increased, the deformation rate of the yielding steel arch also rose. When the PGA reached 11 m/s2, the relative deformation rate surpassed 16‰, indicating complete structural failure and a total loss of the support capacity.
  • The fragility curve of the steel arch at the letting pressure node, derived from the fragility analysis via incremental dynamic analysis (IDA), presents the damage probability of the structure under varying seismic intensities. This study considers the damage probability of the steel arch at the relief node during rare earthquakes, showing that there is a 94% probability of exceeding the normal use limit under an 8-degree design seismic intensity.
First, the let-pressure node steel arch has been successfully implemented in the Jewel Mountain Tunnel and has also yielded positive results in the Haba Snow Mountain Tunnel experiments, offering a new solution for mitigating large deformations in soft rock tunnels over a period of up to 8 years. Second, based on experimental data and incremental dynamic analysis (IDA), the susceptibility of the let-pressure node steel arch was evaluated, and the damage probability under different seismic intensities was calculated. This study fills a gap by jointly considering these two factors and provides a valuable reference for the rapid seismic performance assessment of similar yielding support structures.

Author Contributions

Conceptualization, K.D. and Q.Z.; methodology, K.D.; software, K.D.; validation, X.P., R.M. and J.K.; formal analysis, R.M.; investigation, Q.Z.; resources, Q.Z.; data curation, K.D. and X.P.; writing—original draft preparation, K.D.; writing—review and editing, K.D. and Q.Z.; visualization, X.P.; supervision, R.M.; project administration, J.K.; funding acquisition, Q.Z. and K.D. All authors have read and agreed to the published version of the manuscript.

Funding

This study was supported by the Key R&D Program (Social Development) of Yunnan Provincial Science and Technology Department (2018BC008), Yunnan Jiaotou Science and Technology R&D Project (LYGS-FSHT-2023-10).

Data Availability Statement

The collected datasets generated and/or utilized for analysis during this study are available upon request from the corresponding authors.

Conflicts of Interest

The authors declare no competing interests.

References

  1. Kimura, F.; Okabayashi, N.; Kawamoto, T. Tunnelling through squeezing rock in two large fault zones of the Enasan Tunnel II. Rock Mech. Rock Eng. 1987, 20, 151–166. [Google Scholar] [CrossRef]
  2. Hoek, E.; Brown, E.T. Practical Estimates of Rock Mass Strength. Int. J. Rock Mech. Min. Sci. 1997, 34, 1165–1186. [Google Scholar] [CrossRef]
  3. Peterson, R.W.; Dutton, P.L.; Wand, A.J. First and Second Tube of the Tauern Tunnel. Geomech. Tunnelbau 2010, 3, 334–343. [Google Scholar]
  4. Napoli, M.L.; Festa, A.; Barbero, M. Practical classification of geotechnically complex formations with block-in-matrix fabrics. Eng. Geol. 2022, 301, 106595. [Google Scholar] [CrossRef]
  5. Zhou, Z.; He, C.; Chen, Z.; Wang, B.; Li, T.; Jiang, C. Analysis of interaction mechanism between surrounding rock and supporting structures for soft-rock tunnels under high geo-stress. Acta Geotech. 2023, 18, 4871–4897. [Google Scholar] [CrossRef]
  6. Wu, K.; Shao, Z.; Qin, S.; Wei, W.; Chu, Z. A critical review on the performance of yielding supports in squeezing tunnels. Tunn. Undergr. Space Technol. 2021, 115, 103815. [Google Scholar] [CrossRef]
  7. Langford, J.C.; Vlachopoulos, N.; Diederichs, M. Revisiting support optimization at the Driskos tunnel using a quantitative risk approach. J. Rock Mech. Geotech. Eng. 2016, 8, 147–163. [Google Scholar] [CrossRef]
  8. Lin, M.G.; Zuo, X.Q.; Huang, B. Control Technology of Deformation of Soft Surrounding Rock in Highway Tunnel. J. Highway 2021, 66, 408–411. [Google Scholar]
  9. Tan, X.; Zuo, C.; Liu, D.; Ding, S.; Li, H. Analysis of Bolt and Shotcrete Support in Soft Large-Deformation Tunnel. Sci. Technol. Eng. 2015, 15, 228–232+243. (In Chinese) [Google Scholar]
  10. Tahmasebinia, F.; Yang, A.; Feghali, P.; Skrzypkowski, K. A Numerical Investigation to Calculate Ultimate Limit State Capacity of Cable Bolts Subjected to Impact Loading. Appl. Sci. 2022, 13, 15. [Google Scholar] [CrossRef]
  11. Chen, Z.; Guo, X.; Yu, J.; Long, W.; Wang, R. Research on Rapid Support Technology of High Strength Prestressing Anchor Cable in Soft Rock Tunnel—Take Muzailing Highway Tunnel as an Example. Tunn. Constr. 2024, 44, 1669–1678. (In Chinese) [Google Scholar]
  12. Barla, G.; Bonini, M.; Semeraro, M. Analysis of the behaviour of a yield-control support system in squeezing rock. Tunn. Undergr. Space Technol. 2011, 26, 146–154. [Google Scholar] [CrossRef]
  13. Barla, G.; Debernardi, D.; Sterpi, D. Time-Dependent Modeling of Tunnels in Squeezing Conditions. Int. J. Géoméch. 2012, 12, 697–710. [Google Scholar] [CrossRef]
  14. Xu, C.; Xia, C.; Du, S. Simplified solution for viscoelastic-plastic interaction between tunnel support and surrounding rock based on MC and GZZ strength criteria. Comput. Geotech. 2021, 139, 104393. [Google Scholar] [CrossRef]
  15. Alexeyeva, L.A.; Ukrainets, V.N.; Girnis, S.R. Stress-Strain State of a Shallow Tunnel Supported by a Three-Layer Shell Affected by Transport Loads. Mech. Solids 2022, 57, 1781–1792. [Google Scholar] [CrossRef]
  16. Liu, Z.; Zhu, J.; Wu, J.; Kuang, L.; Tang, S. Adaptation Analysis of Layered Initial Support in Extruding Large Deformation Tunnels. Tunn. Constr. 2023, 43, 131–140. (In Chinese) [Google Scholar]
  17. Wang, B.; Guo, X.; He, C.; Wu, D. Analysis of the Characteristics and Development Trend of the Current High Stress Tunnel Support Technology in China. Mod. Tunn. Technol. 2018, 55, 1–10. [Google Scholar]
  18. Awaji, D.; Hase, R.; Matsuo, K.; Okubo, S.; Nakamura, J. Expanding Underground-Knowledge and Passion to Make a Positive Impact on the World Triple Layered Tunnel Supports System against Extremely High Squeezing Ground Condition; CRC Press: Boca Raton, FL, USA, 2023. [Google Scholar]
  19. Anagnostou, G.; Cantieni, L. Design and Analysis of Yielding Support in Squeezing Ground. In Proceedings of the ISRM Congress, Lisbon, Portugal, 9–13 July 2007; p. 181. [Google Scholar]
  20. Mezger, F.; Ramoni, M.; Anagnostou, G. Options for deformable segmental lining systems for tunnelling in squeezing rock. Tunn. Undergr. Space Technol. 2018, 76, 64–75. [Google Scholar] [CrossRef]
  21. Zhou, B.; Li, K.; Xie, X.; Xu, J.; Liu, L. Optimization of Soft Rock Tunnel Support Letting Pressure System and Evaluation of Safety State Vulnerability. J. Tongji Univ. 2024, 52, 1040–1048. (In Chinese) [Google Scholar]
  22. St-Pierre, L.; Hassani, F.P.; Radziszewski, P.H.; Ouellet, J. Development of a Dynamic Model for a Cone Bolt. Int. J. Rock Mech. Min. Sci. 2009, 46, 107–114. [Google Scholar] [CrossRef]
  23. He, M.C.; Guo, Z.B. Mechanical Properties of Constant Resistance Large Deformation Anchors and Their Engineering Appli-cations. J. Rock Mech. Eng. 2014, 33, 1297–1308. [Google Scholar]
  24. Ayaydin, N.; Leitner, A. Tauern Tunnel First and Second Tubes from the Consultant’s Viewpoint. Geomech. Tunn. 2009, 2, 14–23. [Google Scholar] [CrossRef]
  25. Dong, J.; Xu, B.; Wu, X. Mechanical Characterization of Graded Letting Pressure Support Structure for High Geostress Soft Rock Tunnel. China J. Highw. Transp. 2024, 37, 342–355. [Google Scholar]
  26. Sun, Y.; Li, G.; Zhang, J. Investigation on jet grouting support strategy for controlling time-dependent deformation in the roadway. Energy Sci. Eng. 2020, 8, 2151–2158. [Google Scholar] [CrossRef]
  27. Zhang, B.; Zhang, Z.; Wang, B.; Zhou, L. Experimental Study of Application of Yielding Bolt to Large Deformation Tunnel. Rock Soil Mech. 2016, 37, 2047–2055. (In Chinese) [Google Scholar]
  28. Zhu, X.; Yang, S.; Xia, H.; Xia, Q.; Guofeng, Z.; Wei, L. Joint Support Technology and Its Engineering Application to Deep Soft Rock Tunnel with Strong Creep. Geotech. Geol. Eng. 2020, 38, 3403–3414. [Google Scholar] [CrossRef]
  29. Vlachopoulos, N.; Diederichs, M.S. Improved Longitudinal Displacement Profiles for Convergence Confinement Analysis of Deep Tunnels. Rock Mech. Rock Eng. 2009, 42, 131–146. [Google Scholar] [CrossRef]
  30. Tian, H.; Chen, W.; Yang, D.; Wu, G.; Tan, X. Numerical analysis on the interaction of shotcrete liner with rock for yielding supports. Tunn. Undergr. Space Technol. 2016, 54, 20–28. [Google Scholar] [CrossRef]
  31. Schubert, W. Design of Ductile Tunnel Linings. In Proceedings of the ARMA US Rock Mechanics/Geomechanics Symposium, San Francisco, CA, USA, 29 June–2 July 2008; p. ARMA–08-146. [Google Scholar]
  32. Tan, X.; Chen, W.; Liu, H.; Chan, A.H.C.; Tian, H.; Meng, X.; Wang, F.; Deng, X. A combined supporting system based on foamed concrete and U-shaped steel for underground coal mine roadways undergoing large deformations. Tunn. Undergr. Space Technol. 2017, 68, 196–210. [Google Scholar] [CrossRef]
  33. Qiu, W.; Wang, G.; Gong, L.; Shen, Z.; Li, C.; Dang, J. Development and Application of a Resistance-Limiting and Energy-Consuming Support Structure Adapted to Large Deformation in Tunnels. J. Rock Mech. Eng. 2018, 37, 1785–1795. (In Chinese) [Google Scholar]
  34. He, M.C.; Wang, B.; Tao, Z.G.; Qiao, Y.F.; Xiao, Y.M. Axialcompression Behavior of Adaptive Steel Arch Joint for Large-Deforma-Tion Tunnels. China J. Highw. Transp. 2018, 34, 1–10. [Google Scholar]
  35. Li, S.; Lu, W.; Wang, Q.; Sun, H.; Jiang, B.; Qin, Q. Study on failure mechanism and mechanical properties of casing joints of square steel confined concrete arch. Eng. Fail. Anal. 2018, 92, 539–552. [Google Scholar] [CrossRef]
  36. Kovári, K. Design Methods with Yielding Support in Squeezing and Swelling Rocks. In Proceedings of the World Tunnel Congress, Budapest, Hungary, 23–28 May 2009; pp. 1–10. [Google Scholar]
  37. Li, C.; Wang, G.; Qiu, W.; Gong, L.; Zhao, Y.; Wang, Q. Research and Application of Support Resistant Limiting Dampers in the Tunnel with High Horizontal Geostress. Mod. Tunn. Tech 2020, 57, 15–24. [Google Scholar]
  38. Entfellner, M.; Hamdi, P.; Wang, X.; Wannenmacher, H.; Amann, F. Investigating High-Strength Expanded Polystyrene (HS-EPS) as yielding support elements for tunnelling in squeezing ground conditions. Tunn. Undergr. Space Technol. 2023, 140, 105261. [Google Scholar] [CrossRef]
  39. Fan, J.; Guo, Z.; Qiao, X.; Tao, Z.; Wang, F. Constant Resistance and Yielding Support Technology for Large Deformations of Surrounding Rocks in the Minxian Tunnel. Adv. Civ. Eng. 2020, 2020, 8850686. [Google Scholar] [CrossRef]
  40. Wu, K.; Song, J.; Zheng, X.; Zhao, N.; Shao, Z.; Chu, Z. The deformation coordination-dominated design of yielding supports applied in large deformation tunnels. Acta Geotech. 2024, 19, 2499–2513. [Google Scholar] [CrossRef]
  41. Roy, N.; Sarkar, R. A Review of Seismic Damage of Mountain Tunnels and Probable Failure Mechanisms. Geotech. Geol. Eng. 2016, 35, 1–28. [Google Scholar] [CrossRef]
  42. Baeza-Faundez, S. Use of Deterministic and Probabilistic Slope Stability Analyses to Evaluate Tunnel Location in Land-Slide-Prone Areas. Master’s Thesis, Colorado School of Mines, Golden, CO, USA, 2022. [Google Scholar]
  43. Sun, B.; Deng, M.; Zhang, S.; Wang, C.; Cui, W.; Li, Q.; Xu, J.; Zhao, X.; Yan, H. Optimal selection of scalar and vector-valued intensity measures for improved fragility analysis in cross-fault hydraulic tunnels. Tunn. Undergr. Space Technol. 2023, 132, 104857. [Google Scholar] [CrossRef]
  44. Du, W. Stability Analysis and Treatment Measures for Highway Tunnels with Fractured Rock Body. Master’s Thesis, Southwest Jiaotong University, Chengdu, China, 2012. (In Chinese). [Google Scholar]
  45. Ashford, S.A.; Kawamata, Y. Performance of Transportation Systems during the 2004 Niigata Ken Chuetsu, Japan, Earthquake. Earthq. Spectra 2006, 22, 111–132. [Google Scholar] [CrossRef]
  46. Zhai, C.; Liu, W.; Xie, L. Research Progress on Urban Seismic Resilience Assessment. J. Build. Struct. 2018, 39, 1–9. (In Chinese) [Google Scholar]
  47. Pitilakis, K.; Tsinidis, G. Earthquake Geotechnical Engineering Design Performance and Seismic Design of Underground Structures; Springer: Cham, Switzerland, 2013. [Google Scholar]
  48. Lee, T.-H.; Park, D.; Nguyen, D.D.; Park, J.-S. Damage analysis of cut-and-cover tunnel structures under seismic loading. Bull. Earthq. Eng. 2015, 14, 413–431. [Google Scholar] [CrossRef]
  49. Shao, J.H.; Tang, B.J. Seismic Performance Evaluation of Steel Frame-Steel Plate Shear Wall Using Pushover and IDA. Appl. Mech. Mater. 2014, 578–579, 354–358. [Google Scholar] [CrossRef]
  50. Eads, L.; Miranda, E.; Krawinkler, H.; Lignos, D.G. An efficient method for estimating the collapse risk of structures in seismic regions. Earthq. Eng. Struct. Dyn. 2012, 42, 25–41. [Google Scholar] [CrossRef]
  51. Dong, Z.; Kuo, C.; Yin, J.; Wen, S.; Liu, G.; Gou, Y. Examination of Longitudinal Seismic Vulnerability of Shield Tunnels Utilizing Incremental Dynamic Analysis. Front. Earth Sci. 2021, 9, 779879. [Google Scholar] [CrossRef]
  52. Bertero, V.V. Strength and Deformation Capacities of Buildings under Extreme Environments. Struct. Eng. Struct. Mech. 1977, 53, 29–79. [Google Scholar]
  53. Fema 350 Recommended Seismic Design Criteria for New Steel Moment-Frame Buildings; Federal Emergency Management Agency: Washington, DC, USA, 2000.
  54. Vamvatsikos, D.; Cornell, C.A. Direct Estimation of Seismic Demand and Capacity of Multidegree-of-Freedom Systems through Incremental Dynamic Analysis of Single Degree of Freedom Approximation. J. Struct. Eng. 2005, 131, 589–599. [Google Scholar] [CrossRef]
  55. Wang, M.; Wang, Z.; Liu, F. Improved Method for Incremental Dynamic Analysis and Its Application. Dizhen Gongcheng Yu Gongcheng Zhendong 2012, 32, 30–35. [Google Scholar]
  56. Huang, J.; Zhao, X.; Zhao, M.; Du, X.; Wang, Y.; Zhang, C.; Zhang, C. Effect of peak ground parameters on the nonlinear seismic response of long lined tunnels. Tunn. Undergr. Space Technol. 2019, 95, 103175. [Google Scholar] [CrossRef]
  57. Andreotti, G.; Lai, C. Use of fragility curves to assess the seismic vulnerability in the risk analysis of mountain tunnels. Tunn. Undergr. Space Technol. 2019, 91, 103008. [Google Scholar] [CrossRef]
  58. Jiang, J.; Xun, Z.; Bai, X.; Liu, D.; Zhao, K.; Du, X. Seismic damage mechanics and vulnerability analysis for the immersed tunnel subjected transverse earthquake records. Soil Dyn. Earthq. Eng. 2024, 182, 108703. [Google Scholar] [CrossRef]
  59. Dong, B.; Yang, J.; Ying, B. Analysis of tunnel steel arch node letting pressure performance. Tunn. Constr. 2021, 41, 1524–1529. [Google Scholar]
  60. Barla, G. Squeezing rocks in tunnels. ISRM News J. 1995, 2, 44–49. [Google Scholar]
  61. Shen, Z.; Wang, G.; Qiu, W.; Wang, H. Mechanical Characteristics of Deeply Buried Old Loess Tunnel Support Restrictor and Its Application Research. J. China Railw. Soc. 2024, 46, 194–204. [Google Scholar]
  62. Wang, C.; Gao, R.; Xia, P. Characterization of dynamic mechanical properties of LY100, LY160 low-yield-point steels. J. Constr. Steel Res. 2024, 222, 108934. [Google Scholar] [CrossRef]
  63. National Standard of the People’s Republic of China Steel Structure Design Code; China Planning Press: Beijing, China, 2018.
  64. Specifications for Design of Highway Tunnels Section 1 Civil Engineering; PRC Ministry of Transport (MOT): Beijing, China, 2019.
  65. Han, L. Dynamic Buckling and Bifurcation of Elastoplastic Systems; Science Publishing House: Beijing, China, 2000. [Google Scholar]
  66. Vamvatsikos, D.; Cornell, C.A. Incremental Dynamic Analysis. Earthq. Eng. Struct. Dyn. 2002, 31, 491–514. [Google Scholar] [CrossRef]
  67. Khorami, M.; Alvansazyazdi, M.; Shariati, M.; Zandi, Y.; Jalali, A.; Tahir, M. Seismic Performance Evaluation of Buckling Re-strained Braced Frames (Brbf) Using Incremental Nonlinear Dynamic Analysis Method (Ida). Earthq. Struct 2017, 13, 531–538. [Google Scholar]
  68. Wang, X.; Wang, B.C.; Du, Y.; Al, E. Seismic Response and Strength Parameter Analysis of Tunnel Lining Based on Incremental Dynamics Approach. J. Railw. Stand. Des. 2020, 64, 134–141. [Google Scholar]
  69. Huang, Z.K.; Zhang, D.M. Recent advance in Seismic Fragility Research of Underground Structures. J. Tongji Univ. 2021, 49, 49–59+115. [Google Scholar] [CrossRef]
  70. Fang, L.; Pan, Y.Y.; Li, Z.Q.; Wang, L. Analysis of probabilistic seismic losses over the whole life cycle of continuous girder bridges for high-speed railroads. J. Railw. Sci. Eng. 2020, 17, 815–822. [Google Scholar] [CrossRef]
  71. Dong, Z.F.; Wang, J.J.; Yao, Y.C. Evaluation of Seismic Design Methods for a Deeply-Buried Shield Tunnel. J. Vib. Shock. 2012, 31, 79–85. [Google Scholar]
  72. Chen, X.T. Research on Seismic Damage Mode of Mountain Ridge Tunnel and Its Performance Indexes; Chongqing Jiao Tong University: Chongqing, China, 2020. [Google Scholar]
  73. Gong, L.S. Building Structural Design Manual Series: Seismic Design Manual for Buildings, 2nd ed.; China Construction Industry Press: Beijing, China, 2003. [Google Scholar]
  74. Yang, C. Determination Method of Seismic Action with Arbitrary Exceeding Probability; Structural Engineering Committee of Chinese Mechanics Society, Editorial Committee of Engineering Mechanics of Chinese Mechanics Society, Xinjiang University; Shanghai Pudong Architectural Design and Research Institute Co.: Shanghai, China, 2013; Volume III. [Google Scholar]
  75. Alliance, A.L. Seismic Fragility Formulations for Water Systems, Part 1-Guideline; ASCEFEMA: Reston, VA, USA, 2005; pp. 1–103. [Google Scholar]
Figure 1. Schematic diagram of the principle of yielding support.
Buildings 14 03189 g001
Figure 2. The pressure node diagram.
Buildings 14 03189 g002
Figure 3. Installation of steel arch at letting pressure node.
Buildings 14 03189 g003
Figure 4. Finite element model diagram of letting pressure steel arch.
Buildings 14 03189 g004
Figure 5. Situation of the palm face of Jewel Mountain Tunnel. (a) Geologic sketch of the palm face. (b) Pictures from the scene.
Buildings 14 03189 g005
Figure 6. Pressure node steel arch site diagram; (a) Pressure node steel arch assembly diagram; (b) Pressure node detail.
Buildings 14 03189 g006
Figure 7. Graphs of monitoring data from field installations. (a) Reinforcement gauge installation. (b) Pressure Box Installation.
Buildings 14 03189 g007
Figure 8. Layout of monitoring points.
Buildings 14 03189 g008
Figure 9. Let-pressure steel arch time curve.
Buildings 14 03189 g009
Figure 10. Time-course curve of perimeter rock pressure.
Buildings 14 03189 g010
Figure 11. Section deformation monitoring map.
Buildings 14 03189 g011
Figure 12. Strongly supported field monitoring data. (a) Time–distance curve of the surrounding rock under strong support, (b) Time–distance curve of steel arch under strong support; (c) Strongly supported deformation curve.
Buildings 14 03189 g012
Figure 13. Distribution of (a) peripheral rock pressure and (b) structural stresses along the tunnel contour line (Unit: MPa).
Buildings 14 03189 g013
Figure 14. Deformation of the new yielding support. (a) Let-pressure node deformation diagram; (b) Vault deformation diagram; (c) Deformation diagram of the left side of the node; (d) Deformation diagram of the right side of the node.
Buildings 14 03189 g014
Figure 15. Comparison of canonical response spectra with selected seismic waves.
Buildings 14 03189 g015
Figure 16. Seismic Wave Whittier Narrow01 Acceleration (PGA) Velocity TimeCourse Curves.
Buildings 14 03189 g016
Figure 17. Finite Element Model Schematic.
Buildings 14 03189 g017
Figure 18. Arrangement of main monitoring points.
Buildings 14 03189 g018
Figure 19. Deformation curve of monitoring point.
Buildings 14 03189 g019
Figure 20. Structural Damage Cloud Map.
Buildings 14 03189 g020
Figure 21. Structural instability curves.
Buildings 14 03189 g021
Figure 22. IDA curve under PGA.
Buildings 14 03189 g022
Figure 23. Linear regression analysis of injury indicators.
Buildings 14 03189 g023
Figure 24. Pressure node steel arch fragility curve.
Buildings 14 03189 g024
Figure 25. Comparison of seismic susceptibility curves.
Buildings 14 03189 g025
Table 1. Material Properties.
NameLength
(mm)
Width
(mm)
Thickness
(mm)
Height
(mm)
MaterialsProperties
Board 12001801616Q235Carbon structural steel
Board 22902501616Q235Carbon structural steel
Board 31501208151LY160Low-yield structural steel
Board 4150708151LY160Low-yield structural steel
Board 51501208151LY160Low-yield structural steel
Table 2. I180 I-beam dimensions.
Section Height
(mm)
Section Width
(mm)
Flange
Thickness (mm)
Web Thickness
(mm)
Cross-Sectional Area (mm2)Length of Steel Arch (m)
1809410.76.525086.25
Table 3. Technical breakdown of pressure boxes.
PlacementInstrument
Number
Instrument ModelLead Wire Length (m)Range
(Mpa)
K-Value
Arch vault (Monitoring point 1)53781TY30160–300.00129
Left arch
(Monitoring point 3)
33107TY30140–300.00175
Right arch
(Monitoring point 2)
64844TY30140–300.00432
Left girdle
(Monitoring point 5)
31804TY30120–300.00312
Right gridle
(Monitoring point 4)
46937TY30120–300.00303
Table 4. Reinforcing steel meter technical details.
PlacementInstrument
Number
Instrument ModelLead Wire Length (m)Range
(Mpa)
K-Value
Arch vault (Monitoring point 1)30812GJ20160–2000.1222
Left arch
(Monitoring point 3)
62238GJ20140–2000.1245
Right arch
(Monitoring point 2)
39184GJ20140–2000.1354
Left girdle
(Monitoring point 5)
56183GJ20120–2000.1334
Right gridle
(Monitoring point 4)
62037GJ20120–2000.1256
Table 5. Tunnel Support Performance Indicators.
Yield Support Performance IndicatorsIndicatorsStatistics
NumberMeanVarianceMinMaxRange
Pressure on surrounding rockS1270.390.0050.250.450.20
S2270.410.0070.290.510.22
S3270.370.0030.270.450.18
S4270.350.0020.280.440.16
S5270.380.0010.270.410.14
Synthesize−0.39
Steel arch stressA12712.547.4078.5317.759.22
A22711.882.1539.1414.975.83
A32718.0314.53612.8221.618.79
A42715.391.16613.1517.204.05
A52716.320.92114.4317.292.86
Synthesize−14.83
DeformationD127147.596599.0529.59260.54250.95
D227176.5610,427.3298.22323.19314.97
D327131.844566.0316.85214.77207.92
D427162.617153.2088.22255.52247.30
D52794.682957.085.48177.86172.38
Synthesize+142.65-
Marginal notes: S1~S5 are the differences in perimeter rock pressure between the letting pressure support scheme and the strong support scheme for the arch top, left arch, right arch, left arch waist, and right arch waist; A1~A5 is the stress difference of steel arch; D1~D5 is the difference of deformation amount; where ‘+’ represents an increase and ‘−’ represents a decrease.
Table 6. Selected seismic waves.
Serial NumberName of the Seismic Wave and Time of OccurrenceStationEarthquake FractionDegree of EarthquakeIntensity of EarthquakesPGA
(g)
1Imperial Valley-06, 1979EI Centro Array #3E031406.5380.267 g
2Coalinga-01, 1983Parkfield-Cholame2WAC020006.3680.110 g
3Whittier Narrow-01, 1987Carson-Water StWAT1805.9980.110 g
4Loma Peieta, 1989APEEL2-Redwood CityA020436.9380.274 g
5Northridge-01, 1994Carson-Water StWAT2706.6980.088 g
Table 7. Definitions of Each Limit State.
Damage StateState DescriptionRelative Deformation Rate ξ
(‰)
This Article Takes Values
(‰)
Normal use of DS1Structurally undamaged and fully functional[0,2)-
Minor impairment DS2Minor structural damage, can be repaired for normal access[2,5)3
Moderate impairment DS3Temporary reinforcement to restore partial functionality[9,16)14
Severely impaired DS4Partially collapsed, irreparable[16,+∞)16
Table 8. Damage probability at different limit states.
DMThe PGA Normal UseMinor DamageModerate ImpairmentSerious Damage
Relative deformation rate ξ0.400.940.360.020.00
Disclaimer/Publisher’s Note: The statements, opinions and data contained in all publications are solely those of the individual author(s) and contributor(s) and not of MDPI and/or the editor(s). MDPI and/or the editor(s) disclaim responsibility for any injury to people or property resulting from any ideas, methods, instructions or products referred to in the content.

