Abstract
Loneliness among young adults is a growing concern worldwide, posing serious health risks. While the human ecological framework explains how various factors such as socio-demographic, social, and built environment characteristics can affect this feeling, still, relatively little is known about the effect of built environment characteristics on the feelings of loneliness that young people experience in their daily life activities. This research investigates the relationship between built environment characteristics and emotional state loneliness in young adults (aged 18–25) during their daily activities. Leveraging the Experience Sampling Method, we collected data from 43 participants for 393 personal experiences during daily activities across different environmental settings. The findings of a mixed-effects regression model reveal that built environment features significantly impact emotional state loneliness. Notably, activity location accessibility, social company during activities, and walking activities all contribute to reducing loneliness. These findings can inform urban planners and municipalities to implement interventions that support youngsters’ activities and positive experiences to enhance well-being and alleviate feelings of loneliness in young adults. Specific recommendations regarding the built environment are (1) to create spaces that are accessible, (2) create spaces that are especially accessible by foot, and (3) provide housing with shared facilities for young adults rather than apartments/studios.
1. Introduction
Loneliness is a pervasive issue affecting people worldwide. Approximately 33 percent of adults reported experiencing feelings of loneliness. Loneliness influences a person’s health, both physically and mentally, and could, in the long term, affect someone’s quality of life. Loneliness is defined by De Jong Gierveld, van Tilburg, and Dykstra [1] 1as “the negative outcome of a cognitive evaluation of a discrepancy between (the quality and quantity of) existing relationships and relationship standards” (p. 495). Weiss [2] distinguishes emotional loneliness from social loneliness based on the type of intimate relationships a person has. Emotional loneliness is the lack of good quality intimate relations, whereas social loneliness is the lack of a wider network of relations [3]. Also, a distinction can be made based on the duration of the feelings of loneliness. State loneliness is the temporal feeling of loneliness experienced in a daily setting. This can be caused by a situation, such as a bad day or sad situation, as well as other situational effects, such as the environment and the weather. Trait loneliness is where the feeling of loneliness is long term and more general [4].
Loneliness occurs in all age groups, but recent findings indicate that loneliness is particularly concerning among young people [5]. For example, in the Netherlands, young people in the age category of 15 to 25 years of age are the ones who reported the most feelings of strong emotional loneliness (14 percent) in 2021 [6]. These feelings can have severe consequences, including an increased risk of depression and mortality [7].
Despite its significance, research on loneliness in young adults remains limited [8,9]. While this age group is in a transition from childhood into adolescence and adulthood, evolving social and emotional needs could leave them at increased risk for feelings of loneliness. However, little is known about the feelings of loneliness that young people experience in their daily life [4]. Moreover, measuring loneliness only as a trait of someone, as is typically carried out using loneliness scales [3,10,11] may not provide a complete picture and might limit the knowledge needed as a starting point to design environmental interventions to combat loneliness. Instead, we explore state levels of loneliness: how it fluctuates over time, locations, and settings. Do young adults feel lonely consistently, or are there specific contexts where loneliness is more pronounced?
Our research adopts the human ecological theory [12], which emphasizes the interplay of various factors influencing human behavior. While the human ecological framework explains how various factors such as socio-demographic, social, and built environment characteristics can affect these feelings, still, relatively little is known about the effect of built environment characteristics on the feelings of loneliness that young people experience in their daily life activities. In this study, we therefore aim to identify specifically the built environment characteristics that impact emotional state loneliness in young adults, controlling for individual and household characteristics, social environment factors, and broader contextual factors. Understanding these influences can inform targeted environmental interventions to combat loneliness.
As state loneliness tends to differ from time to time and in different settings, the Experience Sampling Method, or ESM, is used to collect data on the different experiences that individuals have during their activities at different locations. For this study, 43 young adults participated in short 2 min momentary surveys via a mobile phone app, twice a day for a week, leading to 393 measured experiences during their daily activities. A mixed-effects regression model is used to analyze the data.
This article first presents a literature review, from which a conceptual model is derived. Then, the study design and measurement approach are addressed. Subsequently, the findings of the study are presented and discussed, and finally, the limitations of the study are reviewed, and recommendations for future research are given.
2. Literature Review
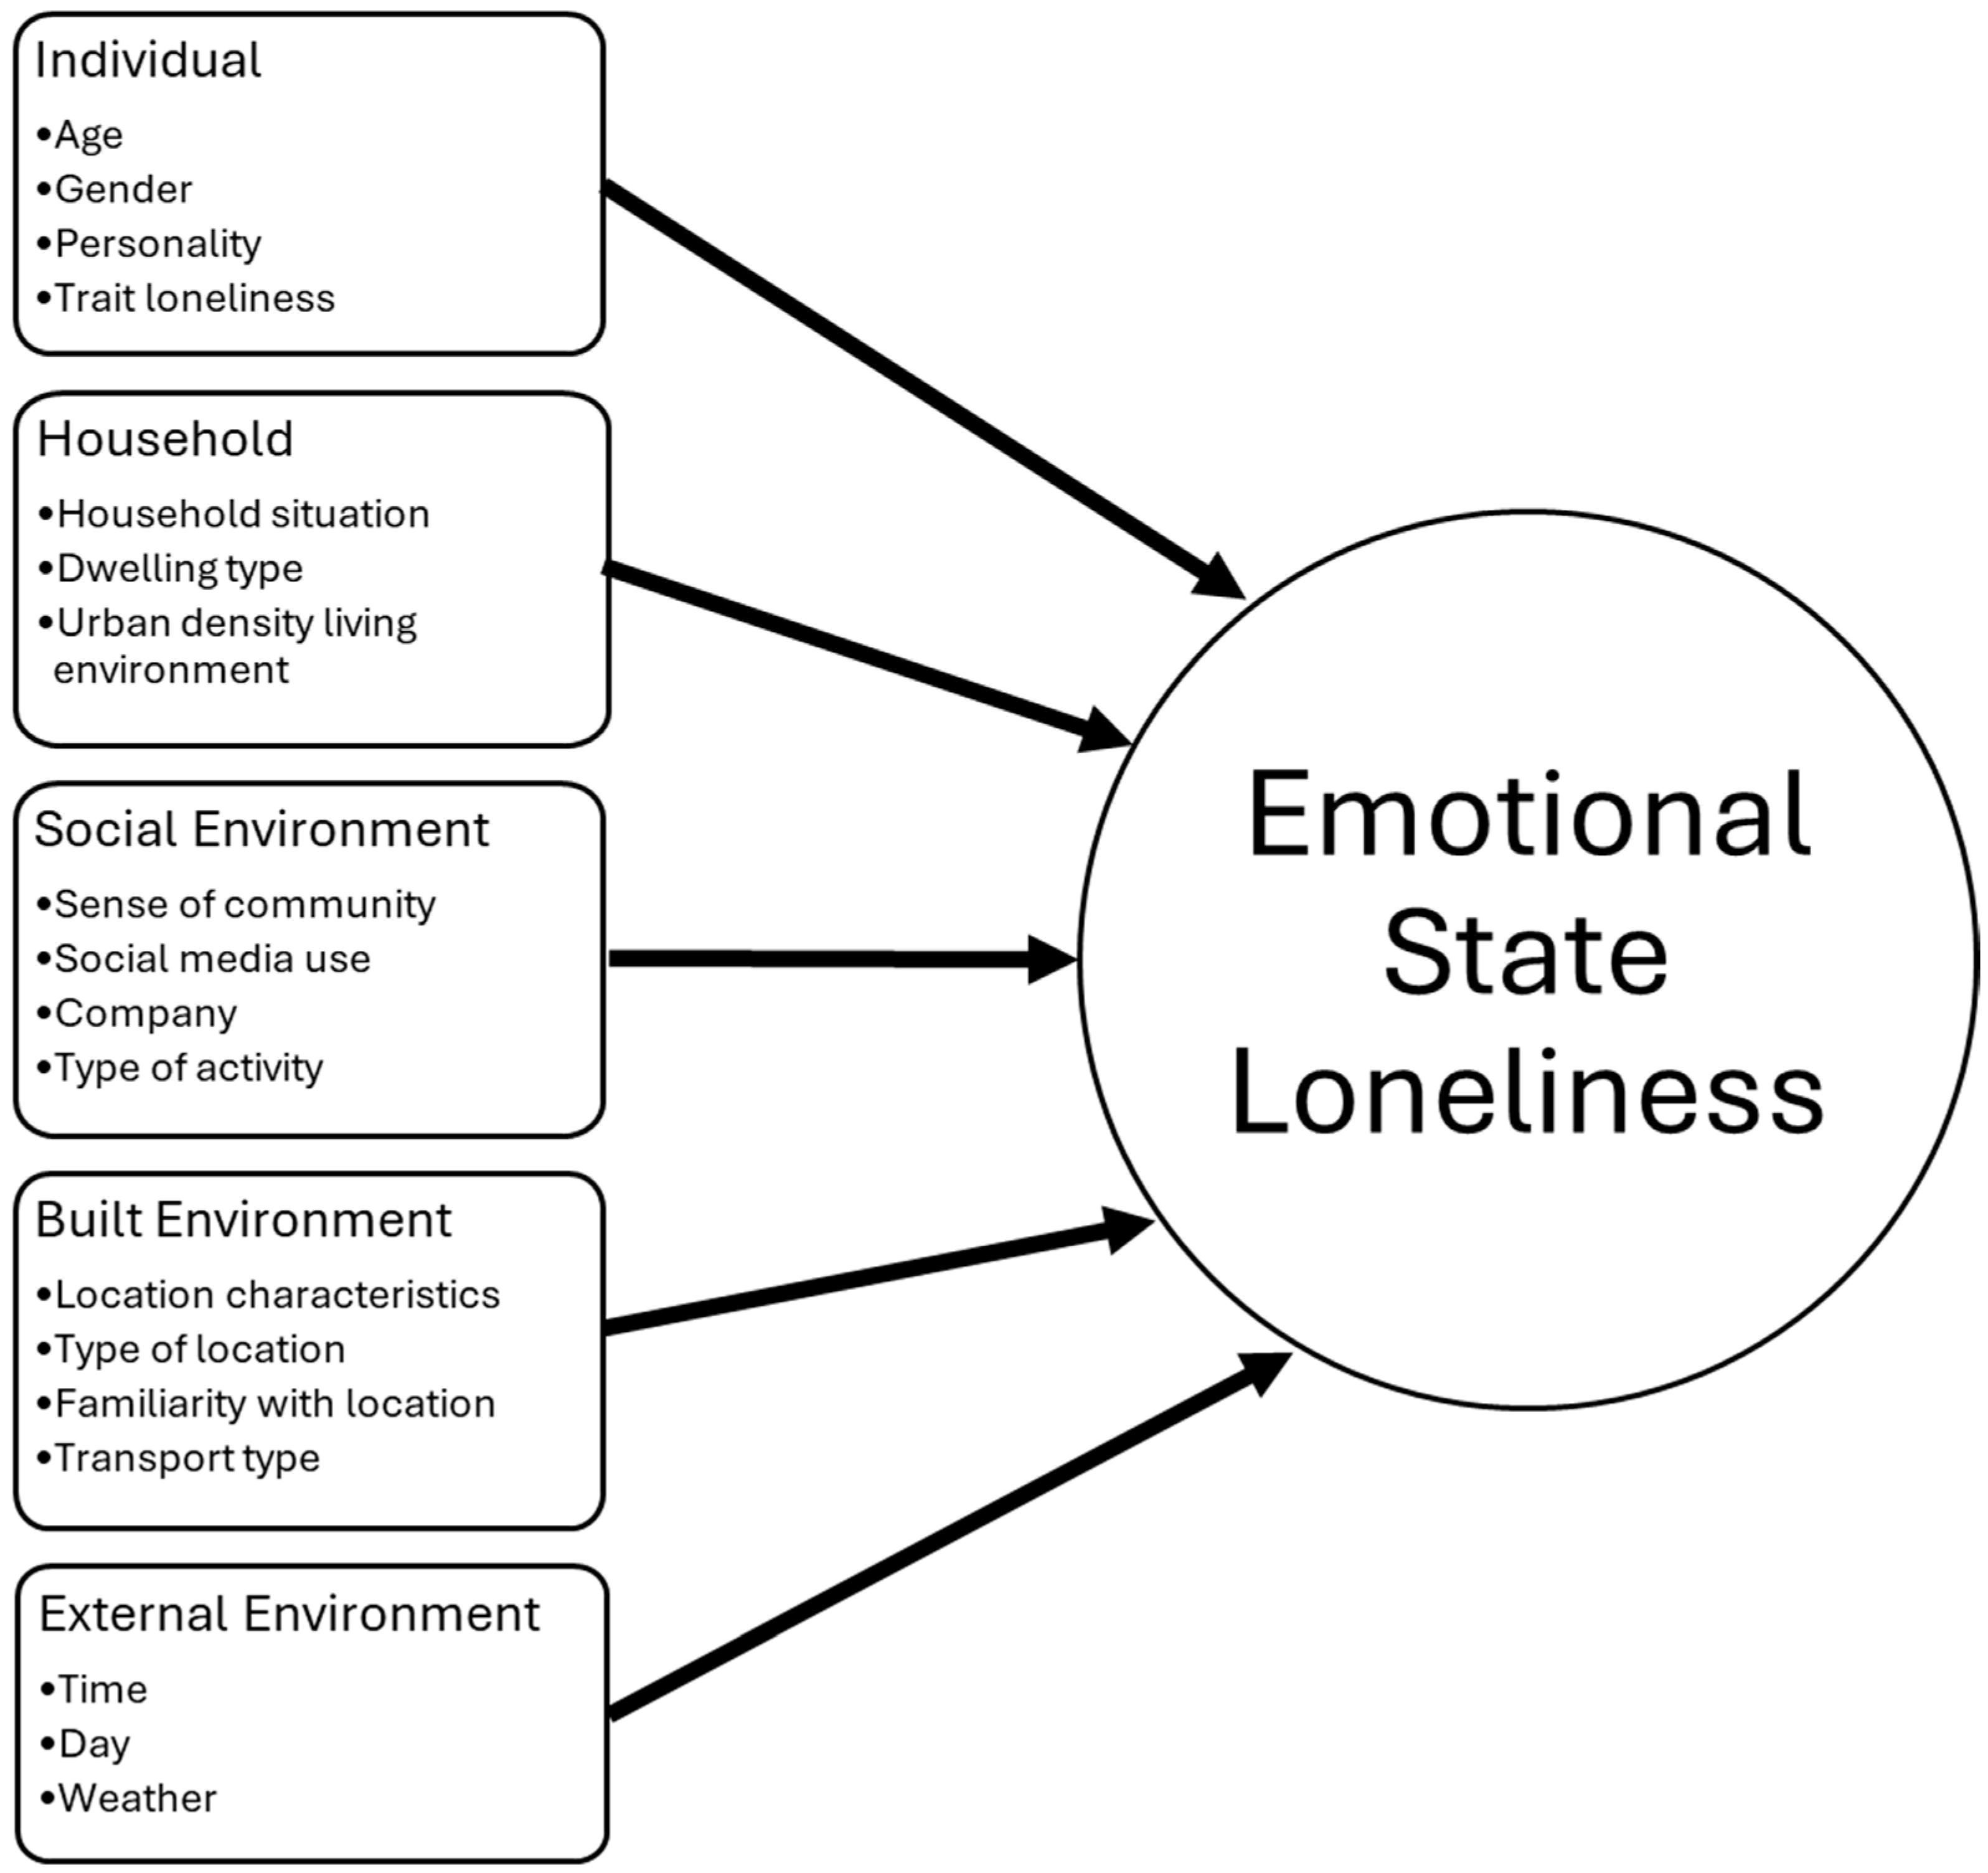
The feeling of loneliness and what induces this feeling is a complex phenomenon. The human ecological theory is a widely used framework to describe and explain various factors influencing human behavior, including physical activity, mental well-being, and loneliness [12,13]. Five different layers of behavioral influence are recognized: the individual layer, the household layer, the social environment, the built environment, and external factors. It is important to note that some of these factors, such as personal characteristics, remain quite stable over time and, thus, do not vary per individual when investigating their influence on state loneliness during daily activities, while other factors, such as social and built environment factors, might differ for each of the activities that a young adult participates in. In this literature review, both types of factors are addressed.
2.1. Individual and Household Factors Influencing State Loneliness
At the individual level, a person’s age, gender, personality traits, and trait loneliness are assumed to influence feelings of state loneliness during daily activities. Most of the current-day research focuses on the older age groups of the population, as social loneliness was most visible in this age group over the years [6]. However, some studies conclude that loneliness is experienced similarly throughout all ages [14], whereas others state that loneliness is dependent on age [15]. Where the feeling of loneliness itself is still up for discussion, the influencing factors of the feeling of loneliness are known to vary with age. For older adults in the population, the roots of loneliness lie in, among other things, the limitation in mobility and the declining health of both the person themselves and their surroundings [16]. In youth, the feeling of loneliness seems to stem from the insecurity and acceptance of their peers and their changes in identity and social networks [17]. However, even though age is an important factor in loneliness over time [14], no large differences are expected within the age group of young adults.
Trait loneliness is considered a continuous feeling of loneliness or “baseline” loneliness [4]. Having a higher level of trait loneliness results in a stronger feeling of “wanting to be alone”, but in doing so, people isolate themselves further. As a result, the levels of temporary, state loneliness that might be experienced during daily activities increase as well [18].
For gender, it was found that in general, women tend to be lonelier than men [3]; however, recent research suggests that men tend to have more difficulty fulfilling their emotional needs. Specifically for young adults, the research indicates that for living with roommates, which is oftentimes part of a young adult’s university experience, men seem to be easily satisfied with whom they live, whereas women tend to have more difficulty living with others for longer periods [19].
Personality traits have been linked to how one perceives the world and the feeling of loneliness [20]. In particular, intrapersonal factors play a role in the feeling of loneliness over time when growing up. These factors include, for example, introversion and emotional instability [5,21]. However, it seems that for the feeling of a certain emotion in a moment itself, such as state loneliness, the personality characteristics are of little influence [22]. This is confirmed in work researching the determinants of well-being and general life satisfaction [23].
For the influences of the household layer on feelings of state loneliness among young adults, there is still limited knowledge. As mentioned, the presence of and the connection an individual has with their roommates seem to have a significant effect on their mental health [24]. People living with a partner see a reduction in social interaction outside of their household; however, this might not influence a person’s loneliness [25]. Overall, living with roommates decreases the feeling of loneliness among young adults.
The housing situation of the household is a main factor influencing the feeling of loneliness [26]. The lack of affordable housing can be a determinant of loneliness as well [27]. The dwelling type, such as a small apartment [28,29], the duration of residence, presence, and satisfaction with the facilities in the neighborhood are especially of significance [30]. In some research, this was contradicted after adjusting for the socio-demographic characteristics [31].
2.2. Social Environment Factors Influencing State Loneliness
For the social environment, a social network of friends [1], a sense of community [32], social media use, and the company present during daily activities may influence emotional state loneliness.
A social network seems to influence feelings of emotional loneliness the most. A strong connection with at least four different people in a young adult’s network can provide some protection against the feeling of loneliness. These connections must not be all the same; diversity in connection makes for a stronger and longer-lasting bond [1]. In adolescents, the only real connection that was significant was the connection to their best friend. As young adults build upon that base, this might be true for this age group as well [33].
A community is defined as a group of individual units that bond over a relationship of mutual interdependence. In humans, these relations are commonly interpersonal groups, such as a network of friends or neighbors [32]. The sense of community is defined as “the bond between the various residents in a neighborhood” [34]. This differs from place attachment, as the community forms the bond and social safety net for those within the community. People who experience little to no sense of community are at risk for social exclusion and, as a result, feeling lonely [33]. Socially, the feeling of belonging and the sense of community contain three different items to reduce the feeling of loneliness. They are defined as networks, norms, and trust. Whenever there is shared hurt or exclusion within the community, it will reflect on a person’s emotional feeling of loneliness [33].
The passive consumption of social media has an increasing effect on the feeling of loneliness in young adults [5]. Online connections seem to reduce the feeling of social loneliness. The connections made online seem to be enough for the feeling of a wide and diverse network of friends. For emotional loneliness, however, online/Internet friends are not beneficial, and face-to-face contact is required. The forming of intimate connections requires time and resources, which people who make friends online seem to lack.
In contrast to the amount and quality of friends one has, the company during the daily activities may vary. The company surrounding young adults during activities might have a significant influence on loneliness. In research focusing on adolescents, it was measured that the participants felt significantly lonelier when in the presence of their peers at school than when they were alone [8]. The presence of peers, especially in a forced location, induces loneliness. The type of feedback one gets from their company is also important to the momentary feeling of loneliness [18]. Receiving feedback and rejection was related to an increase in state loneliness, whereas positive interaction was associated with less state loneliness.
2.3. Built Environment Factors Influencing State Loneliness
The built environment, in connection with the community and its social structure, can be an important predictor of feelings of social isolation and social loneliness.
Familiarity with the environment influences the momentary experiences of individuals during activities [23]. If, for example, a person had a traumatizing experience in a certain location, they are more likely to avoid the place altogether. “Place attachment” describes the bond an individual has with a meaningful setting. When positively correlated, it has many benefits, increasing life satisfaction and well-being. A detachment from such an important place can have detrimental health and social effects [35]. A person’s experience and relationship to the surrounding environment are strongly related to their nature and well-being [36]. Additionally, place attachment can create a feeling of freedom and control, which allows people to use an environment freely. This is connected to productivity, health, and general well-being [36]. Therefore, it might be interesting to determine whether this will influence the state feelings of loneliness as well.
Most of the available research mentions that the presence, availability, and quality of (community) facilities are the main determinants of the feeling of loneliness [21,26,27,30]. It is said that facilities accommodate the environments that promote social connection and, therefore, prevent alienation.
A field less researched is the influence of the aesthetics of the built environmental settings in which activities take place on loneliness. The aesthetics of built environment characteristics could influence the feeling of loneliness in young adults; however, this requires more in-depth research [37].
A positive relation was found between lower levels of loneliness and the presence of nature [38,39]. In particular, active engagement and interaction with green spaces seem to have a positive effect [26]. Having a natural environment present can help with attention restoration and mental health [40]. Specifically, in highly urbanized areas, green spaces are important in promoting social inclusion and reducing the feeling of overcrowding, both of which can influence the feeling of loneliness [39].
Access to good and, especially, safe transport makes people more satisfied with their environment [25]. Being satisfied with the environment affects the momentary well-being of a person. Since well-being is one of the most important predictors of both social and emotional loneliness, having access to safe transport might influence the feeling of loneliness [41]. Most of the research on loneliness focuses on the benefits of walking infrastructure [25,42]. Especially for young adults, the walkability and public transport network are important for an increased feeling of connectedness. Also, cycling has proven to increase the number of social interactions a person has [21]. The transport types a person uses to get to an activity might influence their emotional state.
2.4. External Environment Factors Influencing State Loneliness
First, the time of the day might influence the feeling of loneliness. The human body relies on the presence of hormones, such as cortisol and melatonin, to function properly during the day. When the natural rhythm of the body is disrupted, the hormone levels change, which can result in mood swings and increased loneliness.
There is a correlation between the type of day and the type of activities that take place. Most people have a set activity pattern on weekdays, wherein mostly a higher level of loneliness is present. On the weekends, people tend to be less lonely, as people can both choose their own company and the type of activity they partake in [4].
Weather can directly influence the experience of a social interaction, where a cold temperature has a more negative influence, and a warm temperature has a more positive influence on loneliness. Also, the amount of daylight is important. There is a connection between the lack of sunlight and winter depression, where people have heightened levels of loneliness and sadness during the winter months.
2.5. Conceptual Model of Factors Influencing Emotional State Loneliness
To summarize, for the individual layer, trait loneliness seems to be an important influence for feelings of emotional state loneliness during daily activities. Gender tends to make a difference as well, although it seems to have more influence on social loneliness than on emotional loneliness. The influence of personality traits is still unclear, as the literature is still contradictive on this subject. Personality seems to influence the feeling of social loneliness, but the influence on emotional loneliness is rather limited. As the target group for this research, young adults have a limited age difference, no significant influence is expected from the age variable.
For the household layer, the socio-demographic variables seem to be most important. Even though household composition has not received that much attention in research, it is one of the variables of interest, as there is no age group with as much variation in household composition as young adults. Dwelling type is of importance; however, it is often correlated with socio-demographic characteristics (if a household has a lower socioeconomic status, it is more likely to live in an apartment or smaller housing unit).
For the social environment, friends and the sense of community seem to influence emotional state loneliness the most. A healthy relationship with both friends and a sense of community can offer protection from isolation. Also, the type of activity the young adult is participating in influences whether the experience has a positive or negative effect on that person [8]. This is possibly correlated with the company present during the activity. Having a high level of restriction in undertaking different activity types is related to higher levels of emotional loneliness [41]. Social media is an important variable for emotional loneliness, as prolonged use hinders the formation of intimate connections.
For the built environment, the type of location, perceived environment, and transportation type and infrastructure could be of importance. The type of location should fit the activity type. High scores of the perceived environment and transportation types with physical activity seem to increase the subjective well-being of an individual [25]. Furthermore, familiarity with the environment is important; it might provoke earlier experienced emotions, influencing the emotional state of the individual [23].
The external factors can influence both the activities and the feeling of loneliness greatly. The time of day can make some difference because of the shift in hormone levels; however, this might not be the case for everybody. The type of day influences both the activities that are undertaken and the company a person is with. The weather influences the way both the activities and companies are experienced at a social level.
All these factors that are assumed to influence the emotional state loneliness in young adults during their daily activities are presented in the conceptual model in Figure 1.
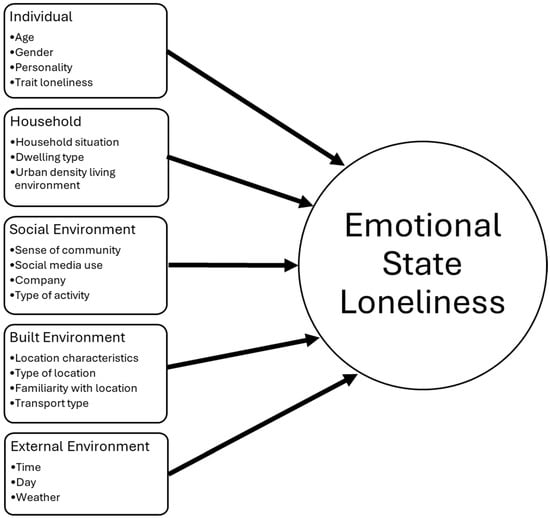
Figure 1.
Conceptual model of factors influencing emotional state loneliness in young adults during daily activities.
3. Methodology
3.1. Study Design and Data Collection
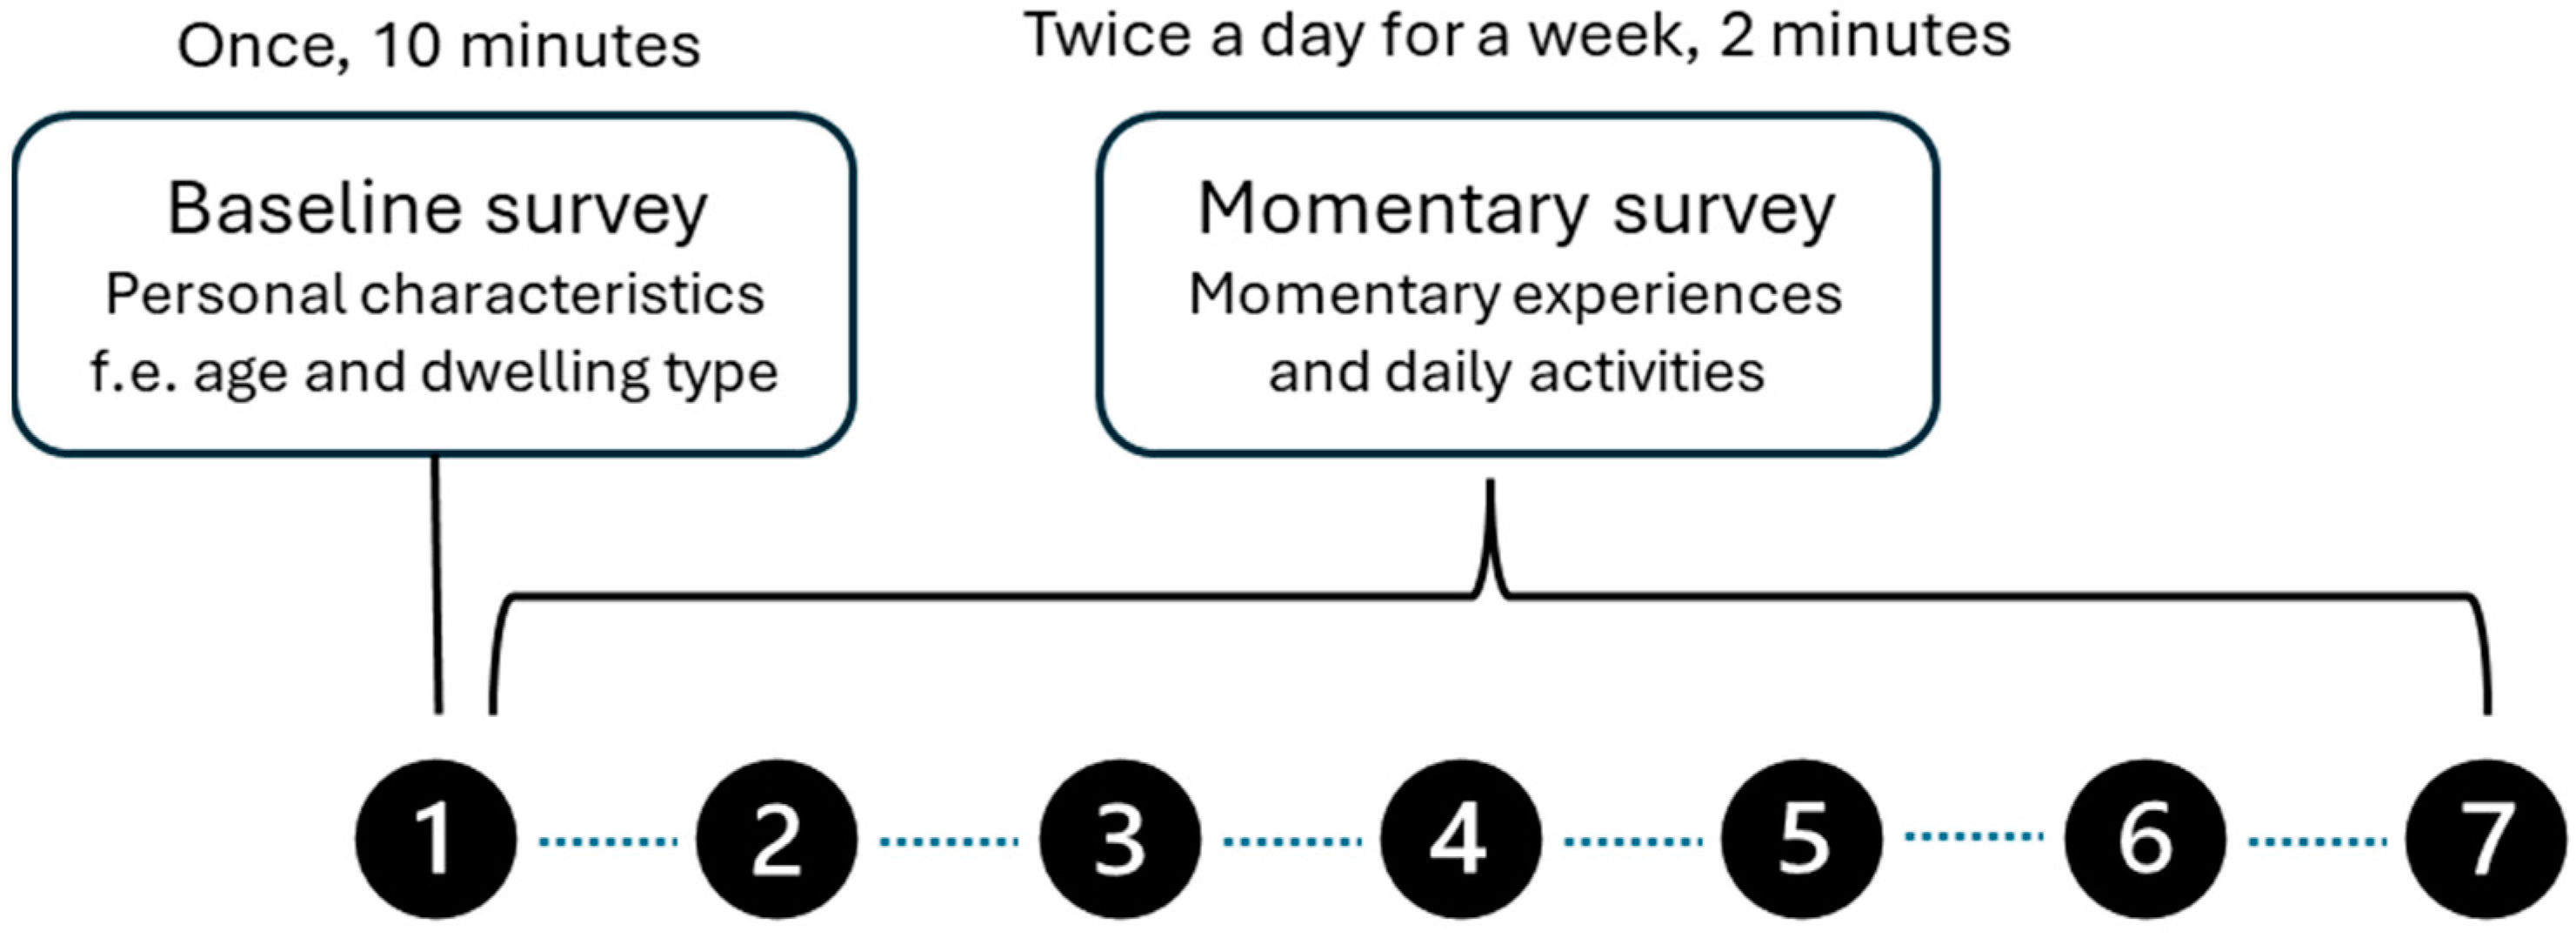
To measure all the variables and relationships as proposed in the conceptual model, data are collected via two types of surveys (see Figure 2 for an overview of the data collection procedure). First, a baseline survey was conducted at the start of the research among all participants, and subsequently, a series of short momentary surveys were held among the participants during their daily activities using the Experience Sampling Method (ESM). The ESM is a procedure for studying people’s daily life activities, experiences, and emotions throughout the day in real-world settings [25]. Specifically, participants in an ESM study are asked to provide self-reports of their emotions, feelings, and sometimes the environment at different moments during their daily life activities for longitudinal data collection. The participants receive automatic notifications, for example, at random intervals within a day, generally through an app/tool on their mobile phone, to answer a set of (short) questions [18]. The main benefit is that the data are collected in a real-world setting, and this minimizes memory biases and maximizes ecological validity [23].
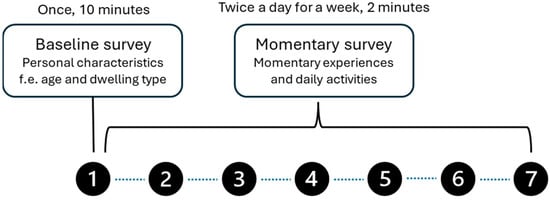
Figure 2.
Overview of data collection procedure.
The participants of the study were recruited mainly through student networks and social media. As the target group was between the ages of 18 and 25, other people were excluded from the study. A total of 43 participants completed, besides the baseline survey, a week of momentary surveys, resulting in 393 different momentary experiences. The surveys were filled out between April and May 2023. The research approach was approved by the ethical review board of Eindhoven University of Technology (ERB2023BE21).
Specifically, in the baseline survey, the following measures were included: Trait loneliness was measured with the 6-item De Jong Gierveld scale, or DJG scale. This scale is a multi-dimensional tool that recognizes overall, emotional, and social loneliness (De Jong Gierveld and Van Tilburg, 2006). As this research focuses on the differences in the types of loneliness, a unidimensional loneliness tool would not suffice. Originally, the DJG scale consisted of 11 differently framed questions; however, the 6-item scale is more user friendly and provides equally insightful results (De Jong Gierveld and Van Tilburg, 2006). The 6-item scale consists of 3 questions focusing on social loneliness, namely (1) “There are plenty of people I can rely on”, (2) “There are many people I can trust completely”, and (3) “There are enough people I feel close to”, and 3 questions focusing on emotional loneliness, namely (1) “I experience a general sense of emptiness”, (2) “I miss having people around”, and (3) “I often feel rejected”. All the questions can be answered on a five-point scale from strongly agree (=5) to strongly disagree (=1). The questions were coded so that high scores indicated a high feeling of loneliness. The 6-item loneliness scale is reliable, as Cronbach’s alpha coefficient reached an overall value of 0.76, which is sufficient. The 3-item emotional loneliness scale scored 0.74, and the 3-item social loneliness scale scored 0.73.
Personality traits that are related to feelings of loneliness are neuroticism and extraversion, two of the “big five” of personality traits [20]. To gain insight into the level of both neuroticism and extraversion of a participant, the three corresponding questions often used in the mini IPIP test are included [43]. These questions include “I am relaxed most of the time” and can be answered using the five-point Likert scale. The use of the mini IPIP seems valid, as the questions concerning extraversion have a Cronbach’s alpha value of 0.77, and the questions regarding conscientiousness have a Cronbach’s alpha of 0.69.
For the household layer, socio-demographic variables (study time, work time, obtained level of education, nationality, partner status, and house), the dwelling type, household composition (number of members and relationship with the members), and urban density are measured. Note that some household layer variables are measured in a more specific way than indicated in the conceptual model to adapt the questions to the specific target group of young adults.
Social media (social media applications, and time spent) and the sense of community are measured for the social environment layer. The sense of community is measured using four different items: support, safety, activity, and friendships within the neighborhood (Chipuer et al., 1999). It consists of questions such as “Everybody is willing to help each other in my neighborhood” (1 = strongly disagree; 5 = strongly agree). This measure shows good to high reliability, with a Cronbach’s alpha support of 0.70.
Secondly, the momentary survey measurements using the ESM approach asked questions about the current feeling of loneliness and a participant’s mood during daily activities. In our study, the respondents received short surveys at random time intervals twice a day for a week. The ESM was implemented by using the PIEL survey application [44].
In these short surveys, emotional state loneliness is measured by using the emotional loneliness questions from the 6-item De Jong Gierveld scale. These questions have been adjusted to fit the “present time”. As with the previous DJG tool, all answers are given on a 5-item Likert scale. The statements the participants must answer are “I experience a sense of emptiness”, “I miss having people around me,” and “I feel rejected”. Only using the 3-item emotional loneliness scale retrieved from the original DJG 6-item scale is reliable, as its Cronbach’s alpha coefficient scores 0.74 [3].
As other emotions and the mood a person is going through at a specific moment might influence feelings of emotional loneliness, mood questions are asked as well. Specifically, the model of basic emotions is used [45]. This model identifies four basic emotions on the arousal and hedonic parameters: fear, anger, sadness, and joy. The levels of comfort and relaxation are added as well to gain further insight into the person’s state of mind.
The social environment variables measured in the momentary survey include the type of company and the activity type.
For the built environment, the familiarity with the environment, the type of transport, the location type, and the perception of the location are measured. To measure the perception of the location variables, an adjusted version of Weijs-Perrée et al.’s [21] measurement approach is used. Herein, a participant’s perception of the location variables is measured. This includes a list of factors, such as aesthetic quality, atmosphere, smell, accessibility, traffic safety, natural elements, noise, cleanliness, and the maintenance of the space. In this study, the diversity in the activities of that location and social safety are added [21].
The external factor layers consist of the time, day, and weather. Both the time and day are automatically gathered when the participant fills in the questionnaire, and the weather variables are retrieved from KMNI, the Dutch weather station.
The momentary surveys took approximately 1 to 2 min to complete. For each of the surveys, a period of an hour was set for the participants to open the survey. Upon finishing the survey, the participants were requested to send their results to the researcher.
3.2. Data Analysis
As the data have a multilevel structure (the momentary experiences are clustered in participants), a mixed-effects regression model (MRM) can be used [46]. The MRM is used when data are clustered or when they contain both fixed and random effects [10]. The advantage of the MRM is that the participants can miss a momentary survey without it causing a problem. The disadvantage is that these types of models can be computationally intensive [47]. Additionally, in contrast to other analysis types, the MRM provides information in personal clusters. An understanding of these cluster-specific effects provides more insight into the specifics of the overall model. For this research type, the MRM is the preferred model for analyzing the obtained data, which is in line with the methodology of similar research, such as that of [18,23,48].
The official formula for the MRM model is as follows:
where the following are true:
Yij = β0 + β1Xij + uj + ϵij
Yij is the dependent variable for individual i in cluster j;
β0 is the overall intercept (fixed effect);
β1 is the slope coefficient for the predictor Xij (fixed effect);
uj is the random effect for cluster j;
ϵij is the residual error for individual i in cluster j.
At its core, this model is a linear regression executed per cluster. This creates two different layers in the model. There is the first (or highest) layer, which takes into account the total dataset. Furthermore, there is the second (or lower) layer, which regards the cluster-specific regression [10]. As the regression is executed per cluster, the regression coefficients per variable can either be the same between clusters (fixed effects) or vary (random effects). There is a possibility of fixing both the intercept and the slope if it makes sense in the dataset, but usually both are allowed to vary per cluster. For the total model, both the random and fixed effects are taken into account.
Using R, the mixed model suitability is checked. The intra-class correlation for this dataset had a value of 0.53, suggesting that filtering the data per cluster and, thus, using mixed models is beneficial. Furthermore, the design effect obtained a value of 5.3. As the dataset is artificially inflated by 5.3 when treating it as a linear regression, the use of the MRM is preferred. Creating a model in which the experiences are clustered per respondent, or per person “ID”, resulted in the best model fit.
In mixed models, there might be variables in the regressions that do not follow the same slopes within the cluster. Therefore, random variables are introduced. After visual and statistical comparison of the possible random variables, only the emotion variables “scared”, “sad”, and “happy” were deemed random. All other variables are treated as fixed variables.
To optimize the model, there are two different methods of deriving the optimal model: the “top–down” and the “step-up” method. As the top–down method is supported most in the literature, this is the chosen method. The top–down method entails the making of a full model, removing variables step by step, and comparing these models in terms of the AIC and BIC scores and the R-squared values. This resulted in an optimal model with a total R-squared value of 0.483.
4. Results
4.1. Descriptive Statistics
An overview of the descriptive statistics of the individual and household characteristics of the participants can be found in Table 1. The age range for the participants was set between 18 and 25 years old. The average age of the participants was 22 years old (standard deviation (SD): 1.65). Most of the participants have their homes in urban central (72%) or suburban (26%) areas. This is in line with the expectations, as the research was conducted in and around the city of Eindhoven. The participants tend to be highly educated, with 53% already having obtained a BSc (Bachelors degree in general) or university level of education. Furthermore, the participants tended to be slightly lonely, with an average of 9.13 on a 0-24 range scale (SD: 3.44). On the social loneliness scale (5.37, SD: 1.92), the scores were higher than on the emotional loneliness scale (3.77, SD: 1.99). Even though social loneliness score is higher, the focus in this study is on emotional loneliness, as this is the highest-growing type of loneliness among the young adult age group.

Table 1.
Individual and household characteristics of the sample (N = 43).
Table 2 shows the descriptive statistics of the gathered momentary experiences and activity settings. The social layer consists of the activity types and the company. The types of activity mostly recorded are studying/working (33%), chores (45%), and social activities (22%). For the company, most activities were completed either alone (27%) or with a familiar company (54%).

Table 2.
Descriptive statistics of the momentary experiences (N = 393).
Within the built environment layer, the location type, transportation type, familiarity with the location, and location attributes were measured. For the location type, most of the momentary surveys were filled in at home (40%), followed closely by school/work (29%). Since most of the participants were said to be students, this is a realistic number. As the participants are Dutch, the most used transportation type is by bike (56%). Most of the location attributes were rated just above average, except for natural elements (2.31) and lack of noise (2.17).
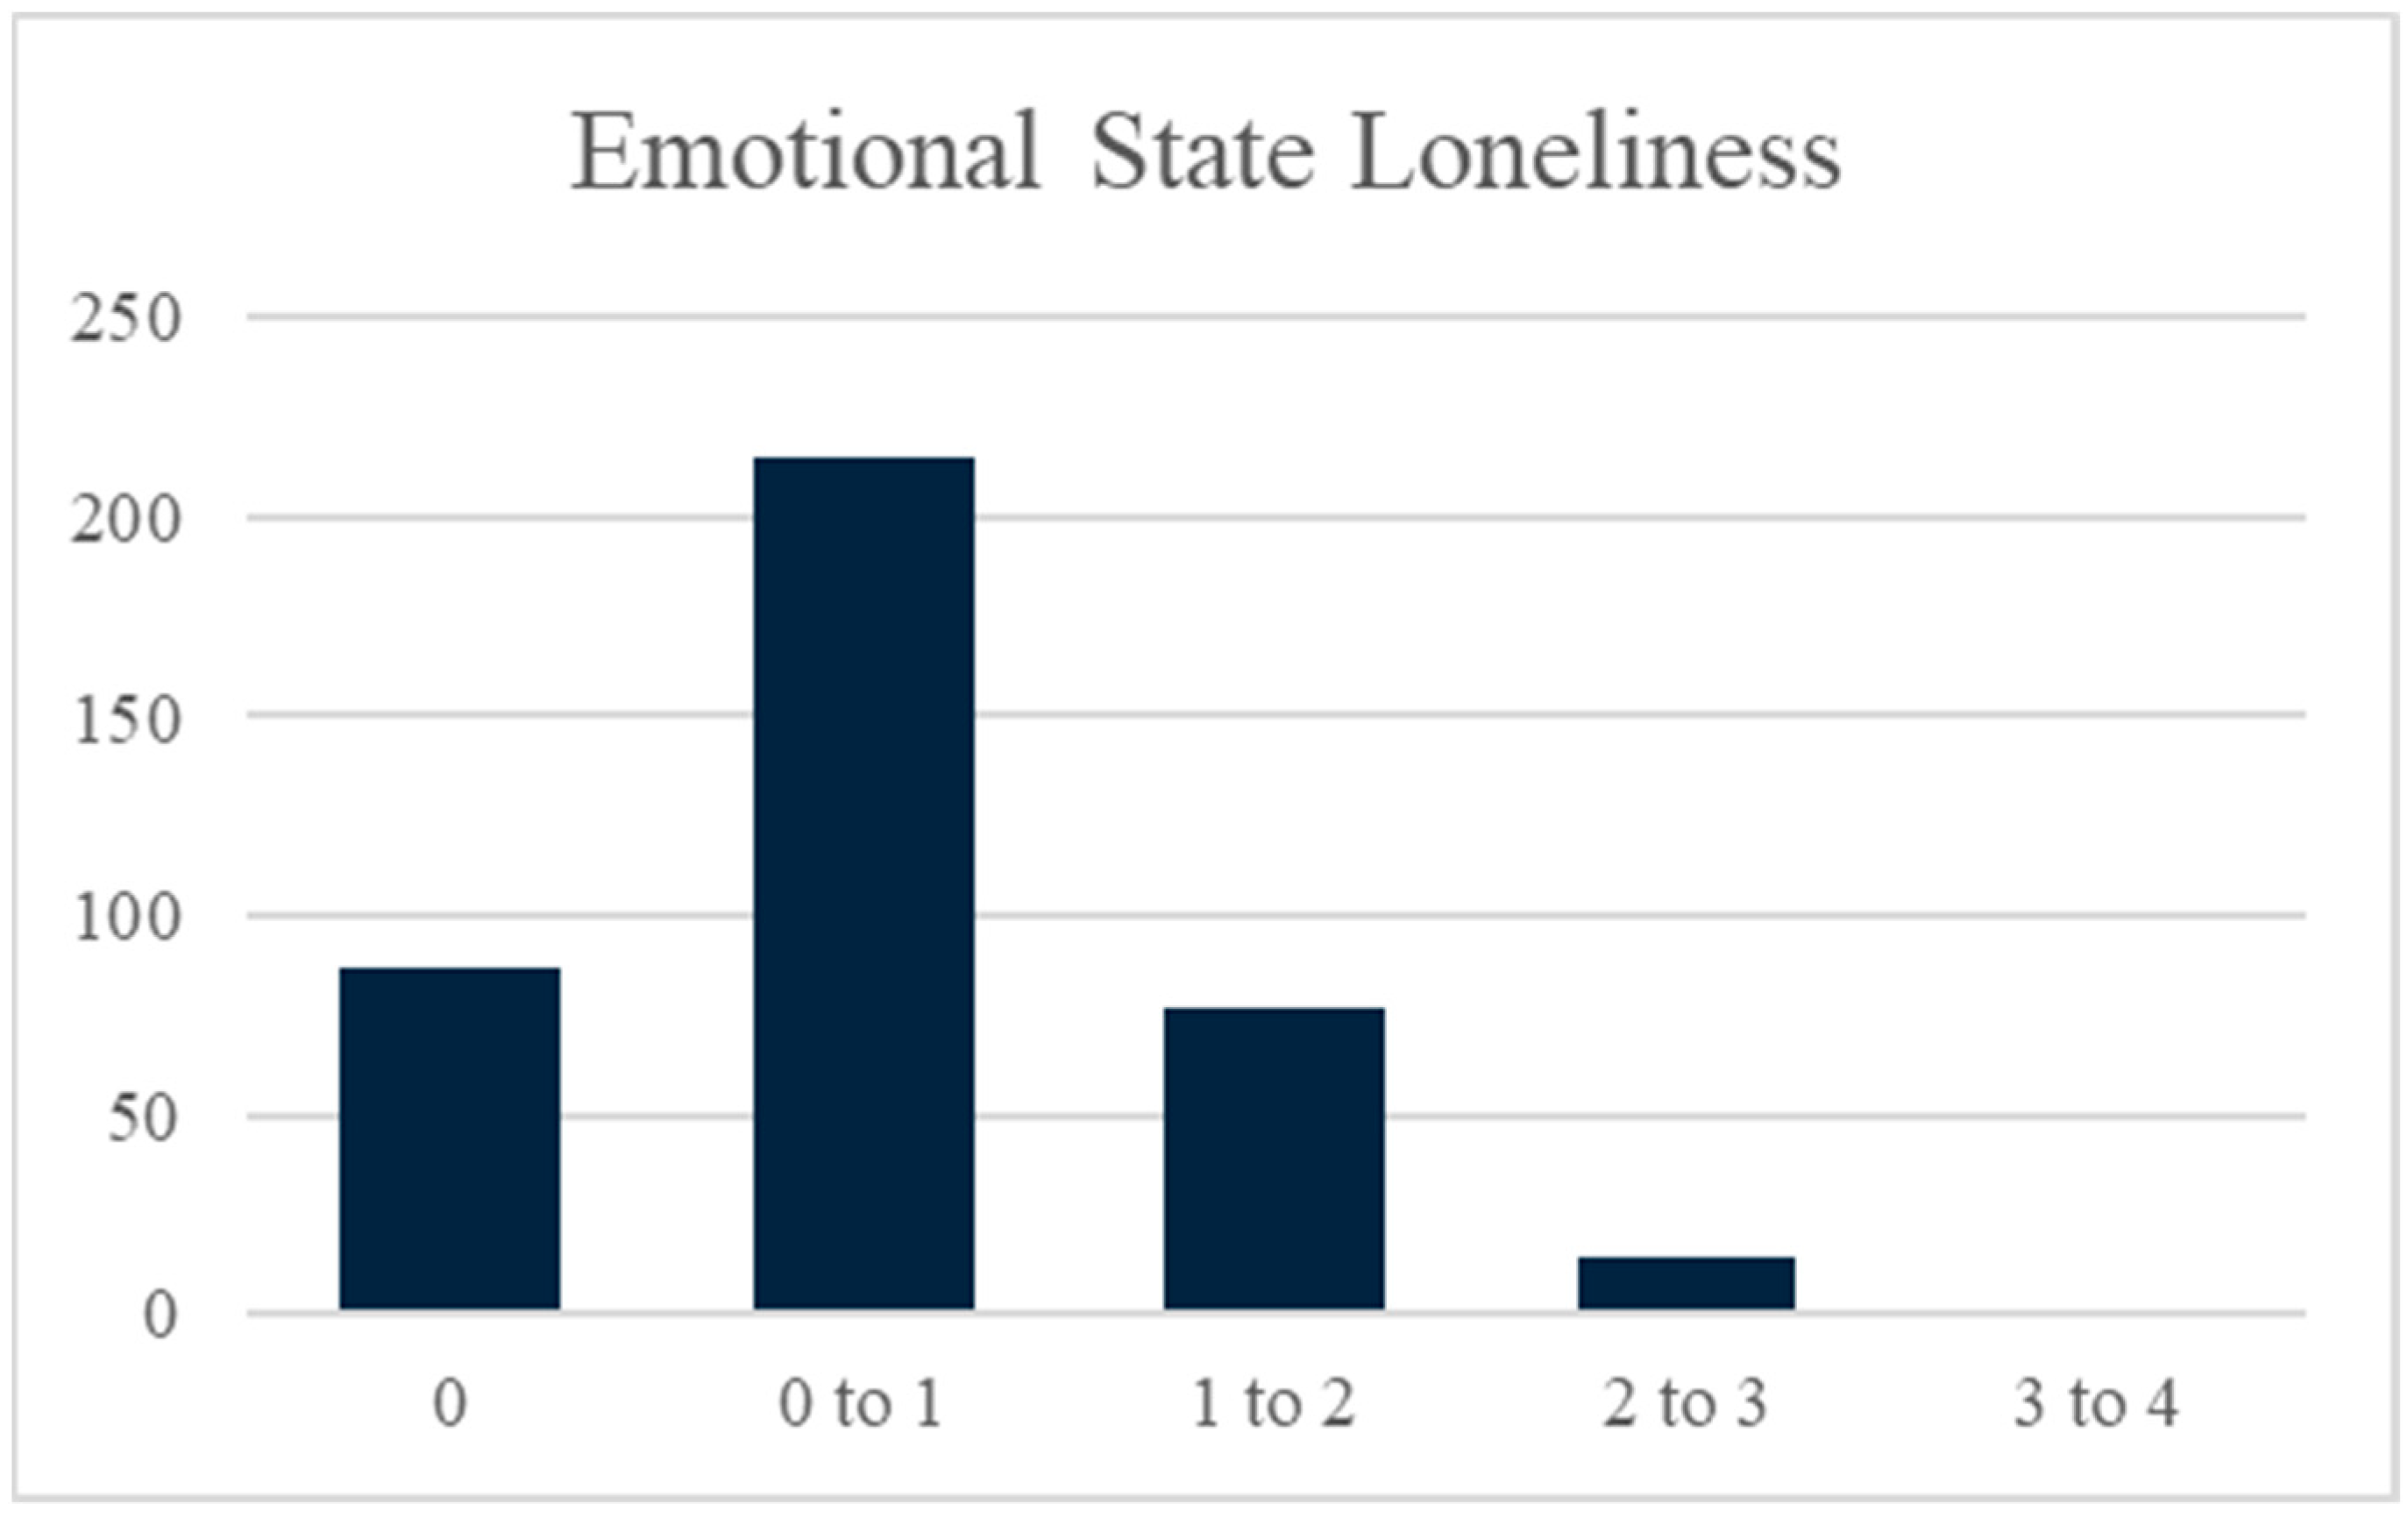
Finally, momentary emotional loneliness was measured using three items (“I experience a sense of emptiness”, “I miss having people around me”, and “I feel rejected”) on a 5-point Likert scale. Most of the respondents score low in feelings of loneliness, and the distribution of the loneliness scores is similar for all three items. When executing a Cronbach’s alpha test, this resulted in a value of 0.71, suggesting a good internal consistency reliability. Figure 3 presents the scores on the dependent variable in this study, with the feelings of emotional state loneliness in the range of 0 to 4 (mean value of 0.82; SD 0.63). It indicates that overall, the participants feel slightly lonely in their momentary experiences.
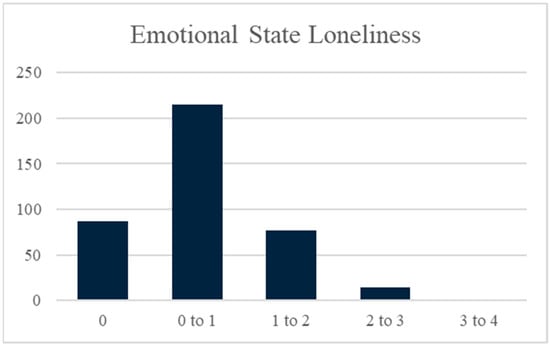
Figure 3.
Descriptive statistics dependent variables.
4.2. Bivariate Analysis
When estimating a mixed-effects regression model (MRM) to predict emotional state loneliness among young adults during their daily activities, the variables should be checked for a linear relationship and multicollinearity. To check for multicollinearity, a correlation matrix of the independent variables was calculated. The magnitude of this correlation coefficient should not exceed the 0.70 value.
Due to the small sample size, the chances of multicollinearity increase. Therefore, some variables have been combined and recoded to provide better results. Separate significance tests, such as independent sample t-tests, Pearson’s correlations, and ANOVA, were executed to aid in the recoding of these variables.
Specifically, for the baseline survey data, the different levels of education were combined into the dummy variables “low education” and “high education”. Furthermore, the dwelling type variables were recoded into two dummy variables: “apartment/studio” and “housing with shared facilities”. The study time per week was divided into “0–24 h” and “25+ h” dummies. The work time per week was divided into “0 h”, “0–24 h”, and “25+ h” dummies. The household situation was divided into “family”, “roommates”, and “on my own”. The time spent on social media was divided into “0–2 h” and “2+ h” dummies.
For the momentary survey data, several other dummies were created. The company type was divided into “familiar company”, “non-familiar company”, and “alone”. The activity types were combined into “studying/working”, “chores”, and “social activities”. Lastly, the location types were divided into “home”, “school/work”, “facilities”, “on the road”, “outdoor”, and “house of a friend/relative”.
4.3. Mixed-Effects Regression Model
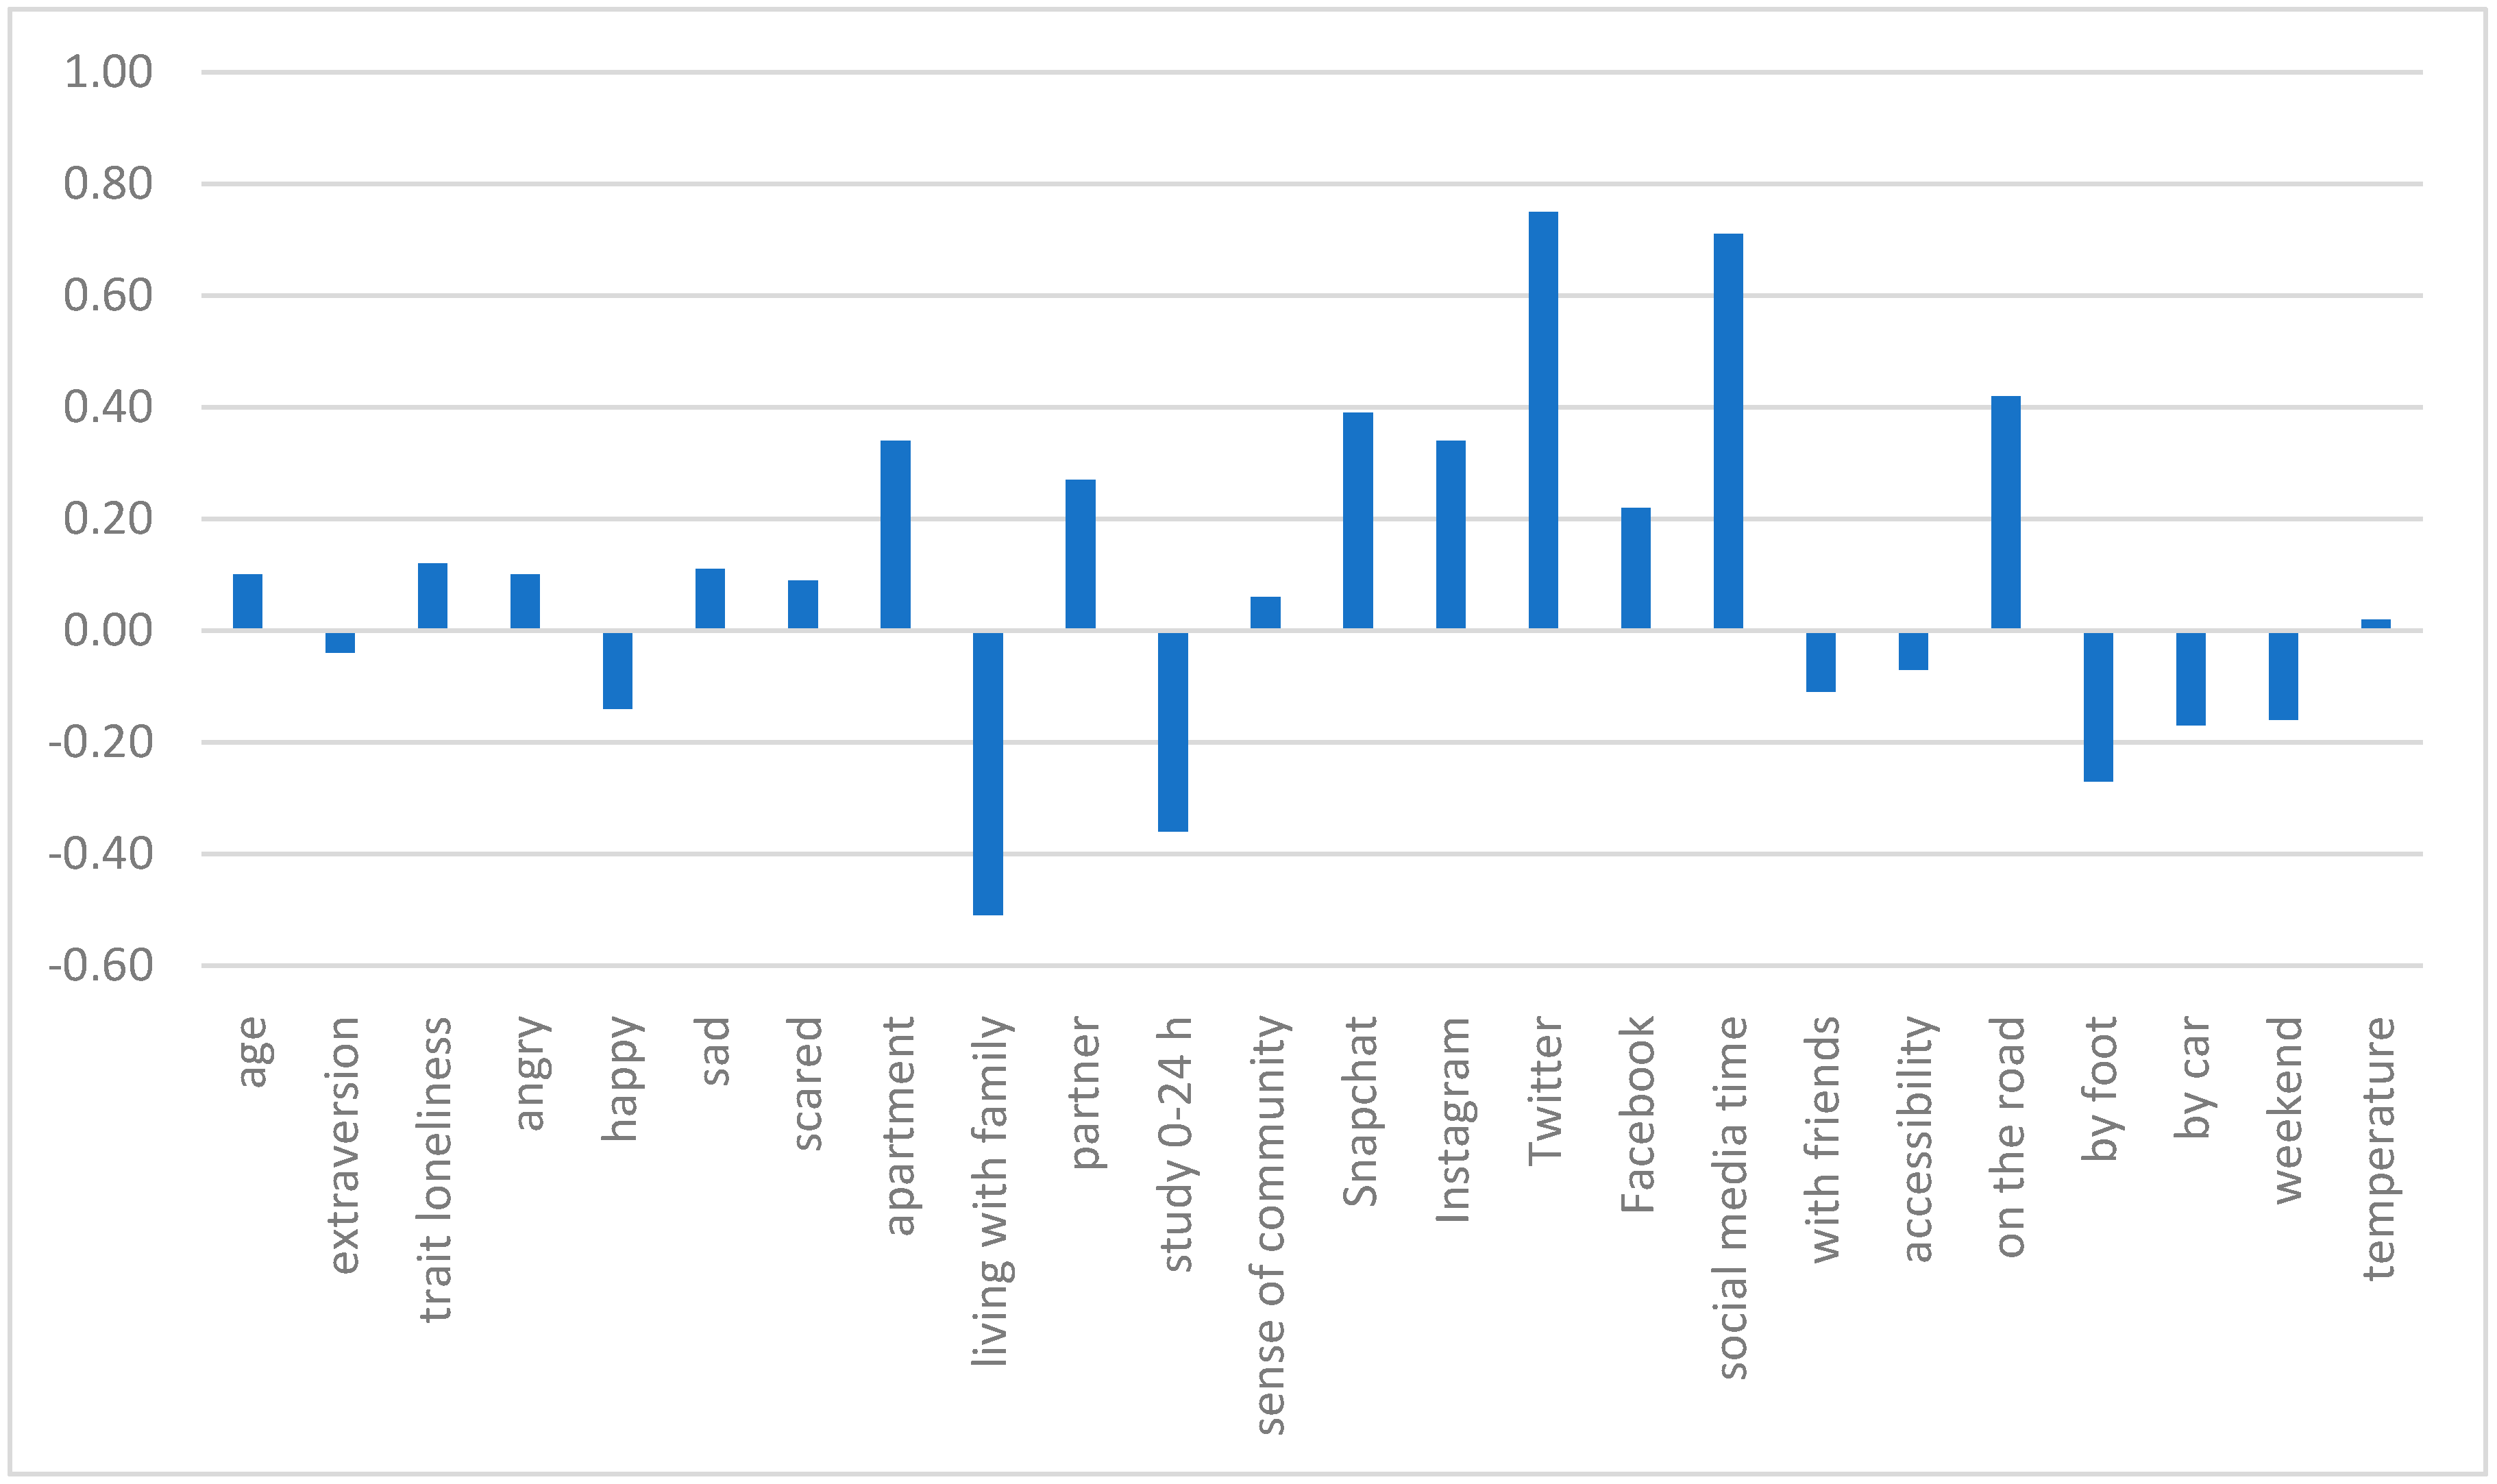
After performing the top–down removal of insignificant attributes, the model that was supported both by the AIC, BIC, Bayes factor, and the highest R-squared value was selected as the optimal model. The results can be found in Table 3 and Figure 4. Only variables with a t-value higher than 1.65 were accepted as significant.

Table 3.
Findings of the mixed-effects regression model (N = 393).
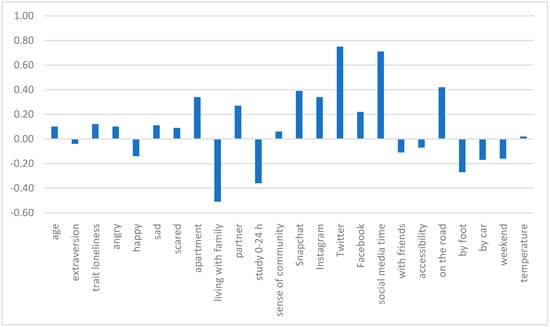
Figure 4.
Estimated effects on emotional state loneliness.
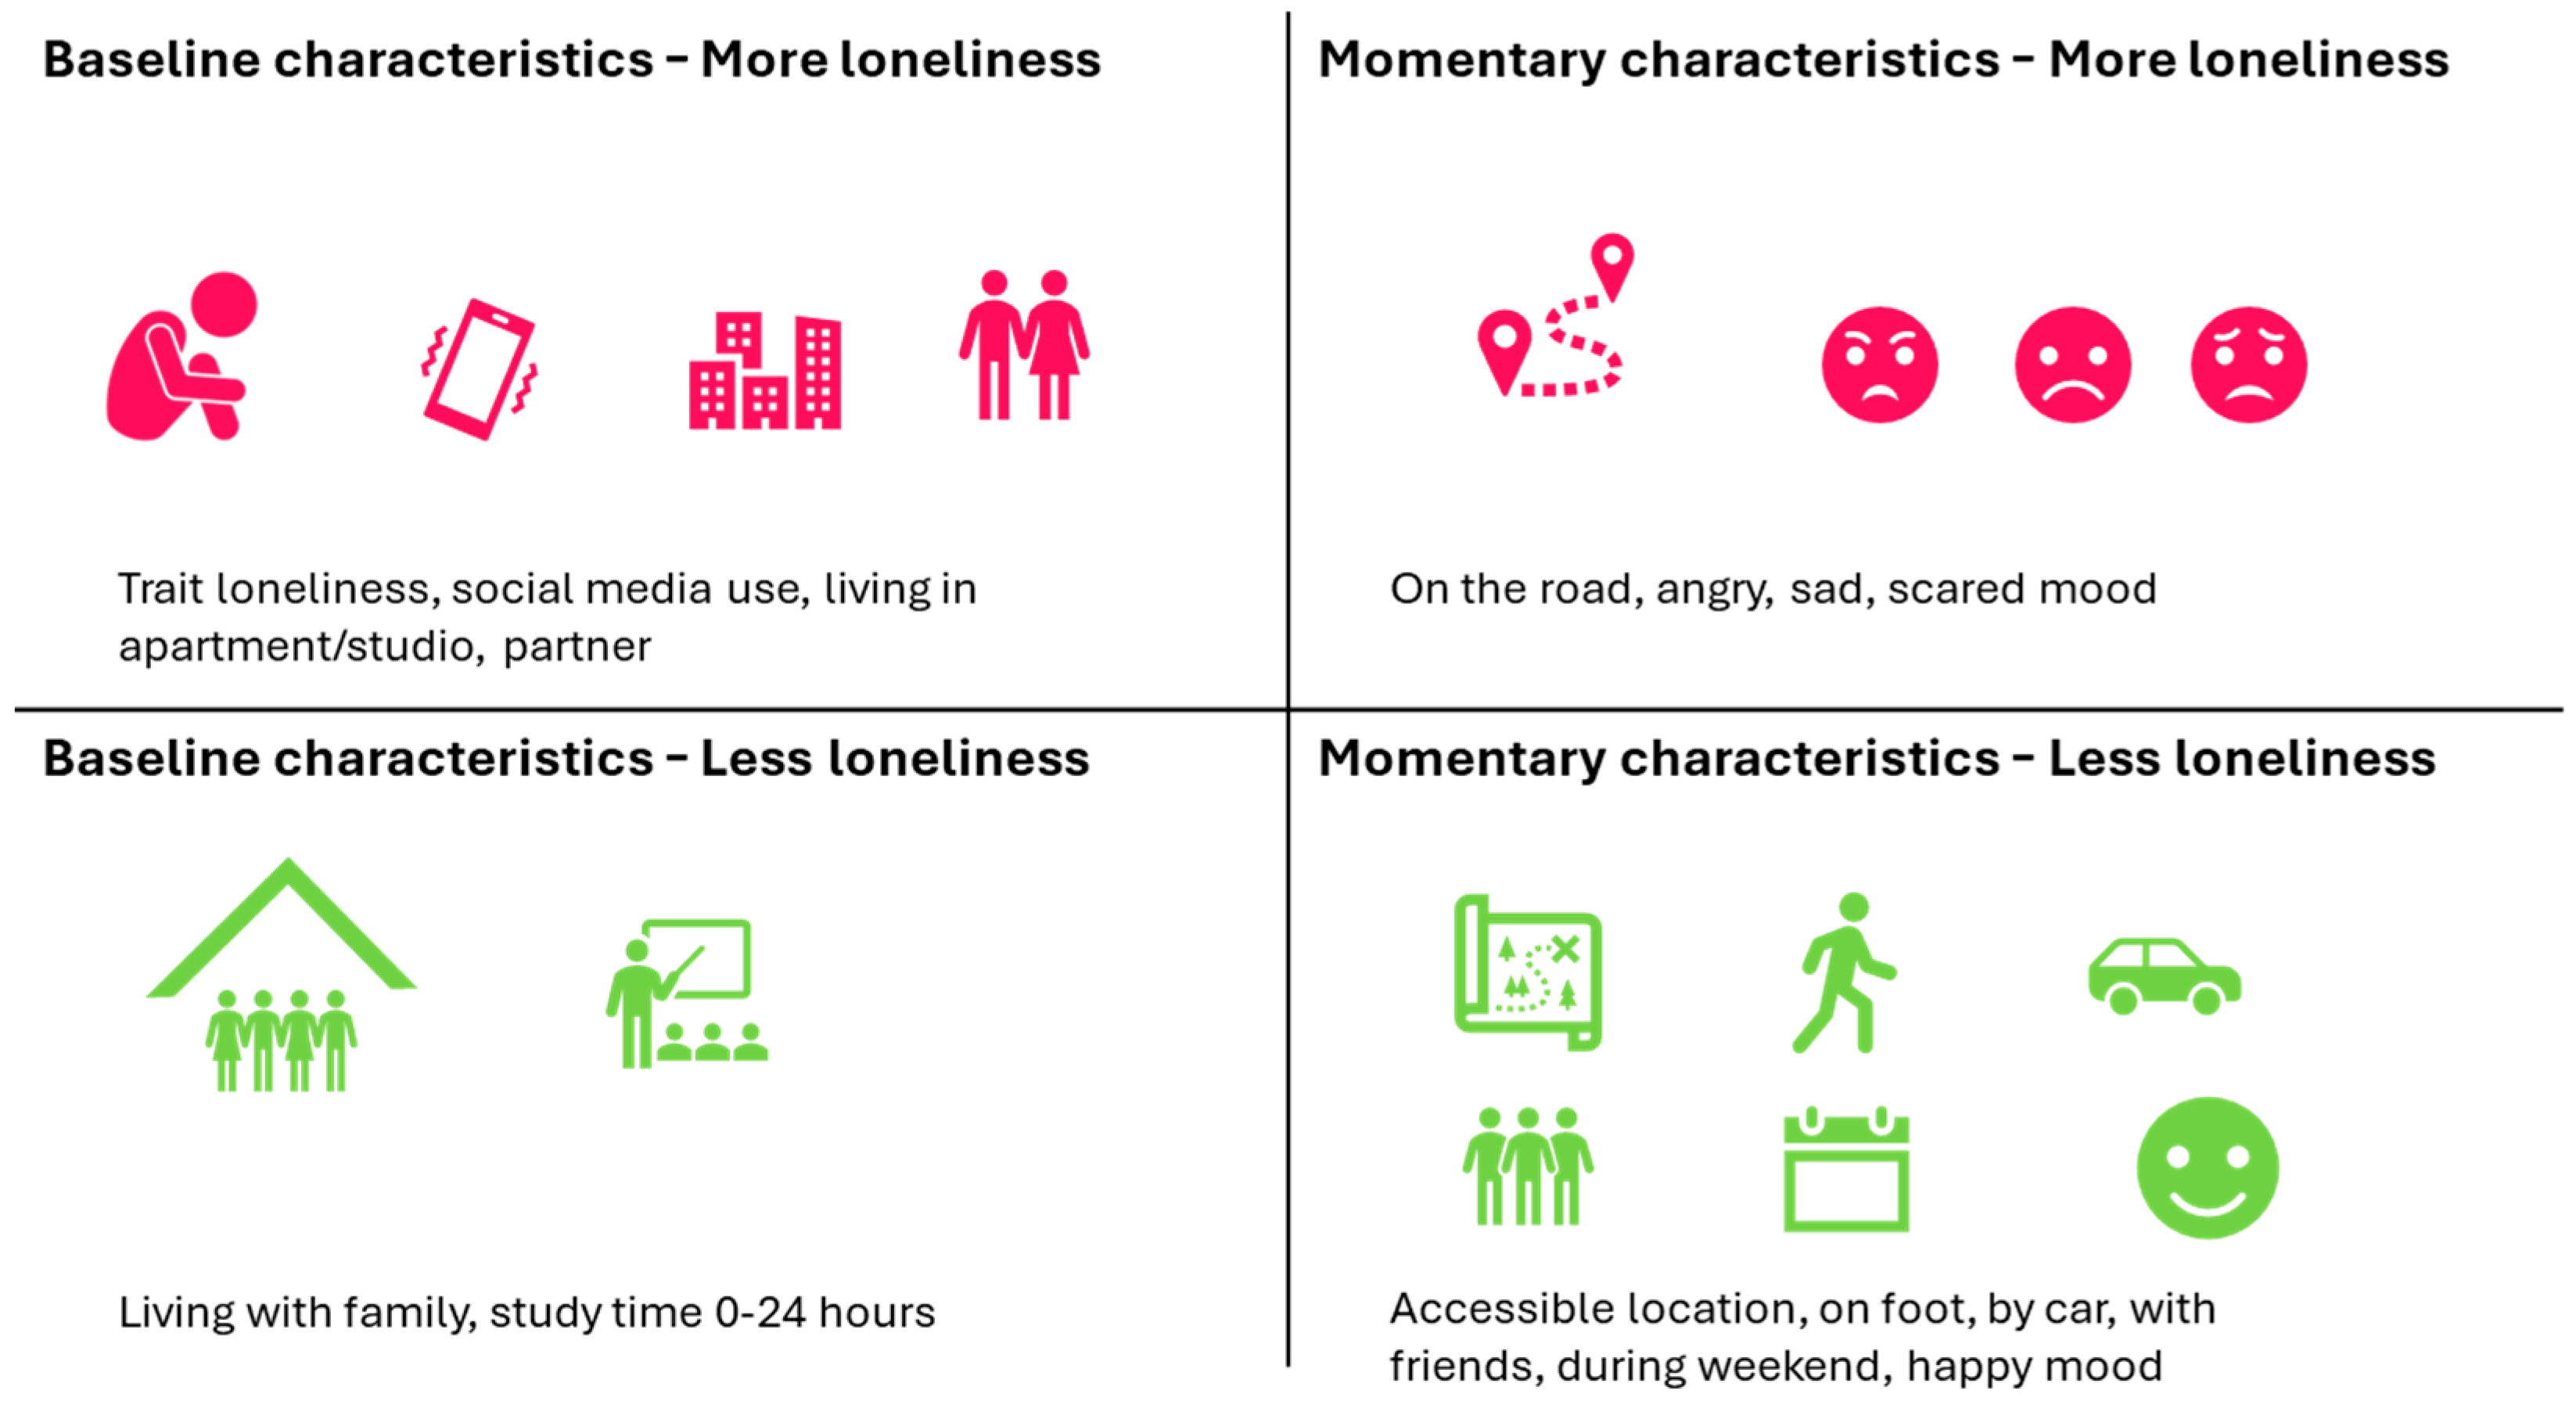
The results show that for the influence of the mood variables on feelings of state loneliness during daily activities, only the basic emotions supported by the literature were significant. While the variables “relaxed” and “comfortable” were added for this research, they did not show significant associations with emotional state loneliness. Of the basic emotions, only “happy” has a decreasing influence on the feeling of loneliness (−0.14, t-value: −3.14). The other emotions—“angry”, “sad”, and “scared”—increased emotional loneliness.
The types of activities performed seem to have no significant influence on the emotional state loneliness. The company during an activity, however, does appear to have an influence; the presence of friends has a reducing effect (−0.11, t-value: −1.77) on state loneliness.
For the perceptions of the location, the accessibility (−0.07, t-value: −2.39) of a location influences the momentary feeling of loneliness. Better access reduces emotional state loneliness. Individuals tend to feel lonely when “on the road” from one location to another (0.42, t-value: 3.08). As for the transportation types, both traveling by foot and by car decrease the feeling of loneliness. Herein, the effect of traveling by foot (−0.27, t-value: -2.54) is higher than by car (−0.17, t-value: −1.71).
Lastly, the external factors “weekend day” (−0.16, t-value: −3.19) and “average temperature” (0.02, t-value: 2.57) influence emotional state loneliness.
Furthermore, the model controlled for the influence of personal characteristics. As expected, higher levels of baseline emotional loneliness translate into higher levels of momentary emotional loneliness (0.12, t-value: 4.12). Having a more extravert personality type seems to lower emotional state loneliness (−0.04, t-value −2.54), which is in line with the literature. Interestingly, the older participants tend to feel lonelier than their younger counterparts, with loneliness increasing by 0.10 per year of age (t-value: 3.56).
For the dwelling type, living in an apartment/studio increases the feeling of loneliness (+0.34, t-value: 2.85). This might be caused by the lack of socialization that is associated with living in a studio or apartment. For the household situation, living with family has the biggest effect on decreasing the momentary feeling of loneliness (−0.51, t-value: −1.91). Having a partner seems to increase emotional state loneliness (0.27, t-value 2.77), which contrasts with the current literature.
Furthermore, the usage of all social media application types seems to increase emotional state loneliness, with Twitter having the highest impact (+0.75, t-value: 4.18).
5. Conclusions and Discussion
In a sample of well-educated Dutch young adults between the ages of 18 and 25, the activity setting, which includes both the social and built environments, was found to significantly influence feelings of emotional state loneliness. The study was conducted in a primarily urban environment.
Both the physical features of the built environment, such as accessibility, the location type, and the activity setting it facilitates are of influence in explaining feelings of state loneliness among young adults during their daily activities. The main findings are summarized in Figure 5. If the aim is to reduce the emotional state loneliness in young adults and to facilitate them to create the necessary intimate connections, the focus should be on the accessibility of the built environment. Overall, 48% of the variance in emotional state loneliness can be explained by the activity setting variables. Surprisingly, even though the model controlled for the personal characteristic variables, their influence on emotional state loneliness is limited.
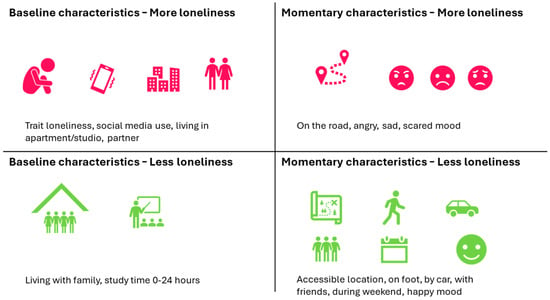
Figure 5.
Most important influencing factors on emotional state loneliness in young adults.
These findings provide a first insight into which built environment characteristics influence emotional state loneliness in the young adult target group. Furthermore, this research provides insights into the different types of loneliness and their relationship, and it provides evidence that the Experience Sampling Method can be used in similar research to gain meaningful findings.
This research shows the built environment characteristics that influence feelings of emotional state loneliness in young adults during their daily activities when controlling for individual and household factors, social environment characteristics, and external factors. Specifically, the findings indicate that the accessibility of a location has a significant effect on state loneliness feelings. This was expected, as higher scores of accessibility result in a more diverse and open location. In contrast to our expectations and the existing literature, the lack of “diversity in activities” and the lack of “natural elements” of a location are not significantly related to state loneliness. The diversity in activities, specifically, seemed to be important [42]. A possibility could be that all the location attributes scored relatively high, resulting in little variance to conclude from.
Some variables that were found to influence trait loneliness in other studies did not seem to affect emotional state loneliness. This could be explained by the momentary character of state loneliness in contrast to trait loneliness. Familiarity with the environment, of which the literature suggested that the feeling of togetherness that it emulates would decrease loneliness [23,35], seemed to have no effect. It could be a possibility that emotional loneliness has no relation to location familiarity.
Regarding transportation type, the hypothesis was that commuting in a way that induces physical activity would decrease emotional loneliness [25]. This is partially true, as walking activities decrease the feeling of momentary emotional loneliness. However, traveling by car does as well (to some extent). As most of the participants did not have the opportunity to travel by car, there might be a positive relation with this transportation type, as it offers more freedom than the participants are used to; however, this would require further research. In the literature study, the relationship between the location type and activity type was suggested as being influential on one another [49]. This could be an explanation of why not both the location and activity variables were significant. However, since understanding this relationship was not the aim of this research, no conclusions can be drawn.
For the contextual factors, the type of day and the average temperature are the variables that influence feelings of state loneliness. As the literature suggested, weekend days do indeed decrease the feeling of momentary emotional loneliness [4]. A possible explanation is the freedom of activities a person can choose from in contrast to the strict working hours on weekdays. The temperature levels show the opposite effect, as higher temperatures seem to increase loneliness. However, these results might not be accurate, as the research was performed over one month; therefore, the temperature differences might not be representative for the entire year.
Our models also contained mood variables as predictors of emotional state loneliness. We included four basic emotions on the arousal and hedonic parameters—fear, anger, sadness, and joy—based on [45] and added comfort and relaxation. This approach is somewhat limited when compared to some other methods such as the Profile of Mood States (POMS) [50] or the Positive and Negative Affect Schedule (PANAS) [51]. However, we selected only the main emotions to keep the momentary surveys short. Moreover, the mood variables are treated as independent variables in the models, while they can also be affected by the environment and activity setting. We do, however, consider them important in explaining momentary feelings of loneliness.
The research further controls for the influence of the respondent-level characteristics. For the personality types, the hypothesis that an extravert personality decreases the feeling of momentary emotional loneliness [20] seems to be correct, as it shows significant results in the model. The dwelling type influences the feeling of loneliness according to the findings. As found in the literature, the apartment/studio dwelling type increases the feeling of loneliness [28,29]. This could be due to the lack of financial means or the lack of social contact that is associated with living in an apartment/studio. Housing with shared facilities seems to decrease this for the young adult age group. A possible explanation might be the presence of neighbors without it being as “packed” and on a mass scale as an apartment can be. This finding suggests that for this age group, investing in housing with higher social value, such as row houses and houses with shared facilities, could be a long-term improvement over the production of apartments/studios.
Social media was important for the momentary emotional loneliness score. The use of application types mostly increased momentary emotional loneliness, as expected in the literature [5]. Applications such as Snapchat, Facebook, and Instagram, where there is a very passive user engagement, increase the feeling of loneliness, with Twitter scoring the worst. A reason might lie in the passive/argumentative nature of the social media platform.
As previous research generally did not often focus on a specific type of loneliness, creating insights into the different loneliness types was attempted in this study. For trait loneliness, the hypothesis was that it influences the feeling of state loneliness, both emotional and social loneliness [4,18]. Emotional trait loneliness seems to influence emotional state loneliness; however, social trait loneliness does not seem related. These findings suggest that state and trait loneliness are linked; however, the connection between social and emotional loneliness needs further research.
Interestingly, the influence of the control variables (the respondent-level variables) were significant in the model but, when removed, only altered the goodness of fit for the overall model slightly. This might suggest that even though they are relevant for overall loneliness, the respondent-level variables have little influence on feelings of state loneliness.
Overall, the findings from this study suggest that the built environment directly influences the emotional state loneliness in young adults during their daily activities. The built environment features influence loneliness in the activity settings it facilitates and in the built environment features, such as accessibility. If the aim is to reduce emotional state loneliness in young adults and to facilitate them to create the necessary intimate connections, it is important for urban planners to (1) create spaces that are accessible, (2) make places more walkable, and (3) provide housing with shared facilities for young adults rather than apartments or studios.
5.1. Limitations
Even though the model provides significant results, this research has some limitations to consider. This study provides a first insight into the type of method used and the first findings considering specific loneliness types for this unique target group.
Firstly, the dataset is slightly biased because all the participants are from a similar kind of environment, highly educated, and have high extraversion scores. This results in a dataset, although fully within the parameters of the research design, that does not cover the entire width of the loneliness problem of young adults in the Netherlands. Additionally, the dataset has a limited number of participants. Even though the total number of observations is sufficient for the use of the Experience Sampling Method, a higher number of participants would increase the insights on the influence of the control variables, as these are consistent for each participant.
Secondly, the data are self-rated by the participants; therefore, there is the possibility of mis-rating the perceived environments and the severity of the amount of loneliness. In this setup, the researchers are dependent on the perceived personal and social values an individual has. These values might be intertwined with their perceived value of loneliness, which could influence the findings.
Thirdly, due to the lack of location imaging or geo-location, the real-time characteristics of the perceived environment cannot be considered. When incorporating more specific visual analysis, specific setting characteristics that beneficially influence the individuals could be identified. This could help decrease the level of participant-dependent grading of the environment, which could increase the objective nature of the findings.
Lastly, this research was only conducted for a limited amount of time, because of which the effect of variables such as weather and temperature did not become clear. To gain insight into the full scope of influence of the various characteristics of the environment that influence the feeling of emotional state loneliness, long-term research should be conducted.
5.2. Further Research and Recommendations
This study provides a first insight into the importance of built environment characteristics for the feelings and possible prevention of emotional state loneliness amongst the age group of young adults. For municipalities, this information could imply some changes in urban planning.
Currently, there is a large demand for housing for the age group of young adults. Creating studios/apartments, although financially attractive, may have an adverse effect on loneliness for the very group they are trying to facilitate. Focusing on housing with shared facilities could be beneficial for the population long term. Additionally, the target group could benefit from the presence of vibrant city areas. These areas should be reachable by bike or on foot to enable the age group to enjoy the facilities present in the area. Even though no specific findings showed a link between accessibility and walkability, this is an area of interest, as other studies have shown a connection between these features and the feeling of loneliness [52].
For follow-up research, a long-term version of the research could be conducted to identify time-bound effects such as the seasonal variance in the use of spaces and diversity in activities. In addition, future research could focus on feelings of trait loneliness among this age group rather than state loneliness. Lastly, more practical follow-up research could consist of determining what “building blocks” the two significant location variables exist of and applying these in practice. Another option could be to use location tracking to collect more detailed information about the environment.
Author Contributions
Conceptualization, D.G., A.K. and P.v.d.B.; methodology, D.G., A.K. and P.v.d.B.; formal analysis, D.G.; writing—original draft preparation, D.G.; writing—review and editing, A.K. and P.v.d.B.; visualization, D.G. and P.v.d.B.; supervision, A.K. and P.v.d.B. All authors have read and agreed to the published version of the manuscript.
Funding
No funding was received for this research.
Data Availability Statement
Data is available upon reasonable request.
Conflicts of Interest
The authors declare no conflict of interest.
References
- De Jong Gierveld, J.; van Tilburg, T.G.; Dykstra, P.A. Loneliness and social isolation. In The Cambridge Handbook of Personal Relationships; Cambridge University Press: Cambridge, UK, 2006; pp. 485–500. [Google Scholar]
- Weiss, R.S. Loneliness: The Experience of Emotional and Social Isolation; The MIT Press: Cambridge, MA, USA, 1973. [Google Scholar]
- De Jong Gierveld, J.; Van Tilburg, T. A 6-item scale for overall, emotional, and social loneliness: Confirmatory tests on survey data. Res. Aging 2006, 28, 582–598. [Google Scholar] [CrossRef]
- van Roekel, E.; Verhagen, M.; Engels, R.C.M.E.; Scholte, R.H.J.; Cacioppo, S.; Cacioppo, J.T. Trait and state levels of loneliness in early and late adolescents: Examining the differential reactivity hypothesis. J. Clin. Child Adolesc. Psychol. 2018, 47, 888–899. [Google Scholar] [CrossRef] [PubMed]
- Fardghassemi, S.; Joffe, H. Young adults’ experience of loneliness in London’s most deprived areas. Front. Psychol. 2021, 12, 660791. [Google Scholar] [CrossRef]
- CBS. Vooral Jongeren Emotioneel Eenzaam in 2021. Available online: https://www.cbs.nl/nl-nl/nieuws/2022/39/vooral-jongeren-emotioneel-eenzaam-in-2021 (accessed on 1 October 2024).
- Lara, E.; Moreno-Agostino, D.; Martín-María, N.; Miret, M.; Rico-Uribe, L.A.; Olaya, B.; Cabello, M.; Haro, J.M.; Ayuso-Mateos, J.L. Exploring the effect of loneliness on all-cause mortality: Are there differences between older adults and younger and middle-aged adults? Soc. Sci. Med. 2020, 258, 113087. [Google Scholar] [CrossRef]
- van Roekel, E.; Scholte, R.H.J.; Engels, R.C.M.E.; Goossens, L.; Verhagen, M. Loneliness in the daily lives of adolescents: An experience sampling study examining the effects of social contexts. J. Early Adolesc. 2015, 35, 905–930. [Google Scholar] [CrossRef]
- Marquez, J.; Goodfellow, C.; Hardoon, D.; Inchley, J.; Leyland, A.H.; Qualter, P.; Simpson, S.A. Loneliness in young people: A multilevel exploration of social ecological influences and geographic variation. J. Public Health 2022, 45, 109–117. [Google Scholar] [CrossRef] [PubMed]
- UCLA: Statistical Consulting Group. Mixed Effects Logistic Regression|R Data Analysis Examples. 2021. Available online: https://stats.oarc.ucla.edu/r/dae/mixed-effects-logistic-regression/ (accessed on 3 October 2024).
- Marcoen, A.; Goossens, L.; Caes, P. Loneliness in pre-through late adolescence: Exploring the contributions of a multidimensional approach. J. Youth Adolesc. 1987, 16, 561–577. [Google Scholar] [CrossRef] [PubMed]
- Bronfenbrenner, U. The Ecology of Human Development; Harvard University Press: Cambridge, MA, USA, 1979. [Google Scholar]
- Kousoulis, A.A.; Goldie, I. A visualization of a socio-ecological model for urban public mental health approaches. Front. Public Health 2021, 9, 654011. [Google Scholar] [CrossRef] [PubMed]
- Hawkley, L.C. Loneliness and health. Nat. Rev. Dis. Primers 2022, 8, 22. [Google Scholar] [CrossRef] [PubMed]
- Barreto, M.; Victor, C.; Hammond, C.; Eccles, A.; Richins, M.T.; Qualter, P. Loneliness around the world: Age, gender, and cultural differences in loneliness. Personal. Individ. Differ. 2021, 169, 110066. [Google Scholar] [CrossRef]
- Victor, C.R.; Scambler, S.J.; Bowling, A.; Bond, J. The prevalence of, and risk factors for, loneliness in later life: A survey of older people in Great Britain. Ageing Soc. 2005, 25, 357–375. [Google Scholar] [CrossRef]
- Qualter, P.; Vanhalst, J.; Harris, R.; Van Roekel, E.; Lodder, G.; Bangee, M.; Maes, M.; Verhagen, M. Loneliness across the life span. Perspect. Psychol. Sci. 2015, 10, 250–264. [Google Scholar] [CrossRef] [PubMed]
- Mote, J.; Gonzalez, R.; Kircos, C.; Gard, D.E. The relationship between state and trait loneliness and social experiences in daily life. J. Early Adolesc. 2020, 35, 905–930. [Google Scholar]
- Henninger, W.R.; Osbeck, A.; Eshbaugh, E.; Madigan, C. Perceived social support and roommate status as predictors of college student loneliness. J. Coll. Univ. Stud. Hous. 2016, 42, 46–59. [Google Scholar]
- Wang, B.; Dong, X. The association between personality and loneliness: Findings from a community-dwelling Chinese aging population. Gerontol. Geriatr. Med. 2018, 4, 233372141877818. [Google Scholar] [CrossRef]
- Weijs-Perrée, M.; Dane, G.; van den Berg, P.; van Dorst, M. A multi-level path analysis of the relationships between the momentary experience characteristics, satisfaction with urban public spaces, and momentary- and long-term subjective wellbeing. Int. J. Environ. Res. Public Health 2019, 16, 3621. [Google Scholar] [CrossRef]
- Eid, M.; Diener, E. Global judgments of subjective well-being: Situational variability and long-term stability. Soc. Indic. Res. 2004, 65, 245–277. [Google Scholar] [CrossRef]
- Birenboim, A. The influence of urban environments on our subjective momentary experiences. Environ. Plan. B Urban Anal. City Sci. 2018, 45, 915–932. [Google Scholar] [CrossRef]
- Erb, S.E.; Renshaw, K.D.; Short, J.L.; Pollard, J.W. The importance of college roommate relationships: A review and systemic conceptualization. J. Stud. Aff. Res. Pract. 2014, 51, 43–55. [Google Scholar] [CrossRef]
- Weijs-Perrée, M.; Dane, G.; van den Berg, P. Analyzing the relationships between citizens’ emotions and their momentary satisfaction in urban public spaces. Sustainability 2020, 12, 7921. [Google Scholar] [CrossRef]
- Hsueh, Y.C.; Batchelor, R.; Liebmann, M.; Dhanani, A.; Vaughan, L.; Fett, A.K.; Mann, F. A systematic review of studies describing the effectiveness, acceptability, and potential harms of place-based interventions to address loneliness and mental health problems. Int. J. Environ. Res. Public Health 2022, 19, 4766. [Google Scholar] [CrossRef] [PubMed]
- Thompson, S.M.; Kent, J.L. Human health and a sustainable built environment. In Encyclopedia of Sustainable Technologies; Elsevier: New York, NY, USA, 2017; pp. 71–80. [Google Scholar]
- Wee, L.; Tsang, Y.Y.T.; Tay, S.M.; Cheah, A.; Puhaindran, M.; Yee, J.; Lee, S.; Oen, K.; Koh, C.H.G. Perceived neighborhood environment and its association with health screening and exercise participation amongst low-income public rental flat residents in Singapore. Int. J. Environ. Res. Public Health 2019, 16, 1384. [Google Scholar] [CrossRef]
- Morgan, T.; Wiles, J.; Park, H.J.; Moeke-Maxwell, T.; Dewes, O.; Black, S.; Williams, L.; Gott, M. Social connectedness: What matters to older people? Ageing Soc. 2021, 41, 1126–1144. [Google Scholar] [CrossRef]
- van den Berg, P.; Kemperman, A.; de Kleijn, B.; Borgers, A. Ageing and loneliness: The role of mobility and the built environment. Travel Behav. Soc. 2016, 5, 48–55. [Google Scholar] [CrossRef]
- Curl, A.; Kearns, A.; Mason, P.; Egan, M.; Tannahill, C.; Ellaway, A. Physical and mental health outcomes following housing improvements: Evidence from the GoWell study. J. Epidemiol. Community Health 2015, 69, 12–19. Available online: http://www.jstor.org/stable/43282023 (accessed on 1 October 2024). [CrossRef] [PubMed]
- McLaren, L.; Hawe, P. Ecological perspectives in health research. J. Epidemiol. Community Health 2005, 59, 6–14. [Google Scholar] [CrossRef] [PubMed]
- Chipuer, H.M.; Pretty, G.H.; Delorey, E.; Miller, M.; Powers, T.; Rumstein, O.; Barnes, A.; Cordasic, N.; Laurent, K. The neighbourhood youth inventory: Development and validation. J. Community Appl. Soc. Psychol. 1999, 9, 355–368. [Google Scholar] [CrossRef]
- Haans, A. Environmental Psychology: The Person in the Environment; Eindhoven University of Technology: Eindhoven, The Netherlands, 2021. [Google Scholar]
- Scannell, L.; Gifford, R. The experienced psychological benefits of place attachment. J. Environ. Psychol. 2017, 51, 256–269. [Google Scholar] [CrossRef]
- Raymond, C.M.; Brown, G.; Weber, D. The measurement of place attachment: Personal, community, and environmental connections. J. Environ. Psychol. 2010, 30, 422–434. [Google Scholar] [CrossRef]
- Scharf, T.; de Jong Gierveld, J. Loneliness in urban neighbourhoods: An Anglo-Dutch comparison. Eur. J. Ageing 2008, 5, 103–115. [Google Scholar] [CrossRef]
- Bower, M.; Kent, J.; Patulny, R.; Green, O.; McGrath, L.; Teesson, L.; Jamalishahni, T.; Sandison, H.; Rugel, E. The impact of the built environment on loneliness: A systematic review and narrative synthesis. Health Place 2023, 79, 102962. [Google Scholar] [CrossRef] [PubMed]
- Hammoud, R.; Tognin, S.; Bakolis, I.; Ivanova, D.; Fitzpatrick, N.; Burgess, L.; Smythe, M.; Gibbons, J.; Davidson, N.; Mechelli, A. Lonely in a crowd: Investigating the association between overcrowding and loneliness using smartphone technologies. Sci. Rep. 2021, 11, 24134. [Google Scholar] [CrossRef] [PubMed]
- Zijlema, W.L.; Triguero-Mas, M.; Smith, G.; Cirach, M.; Martinez, D.; Dadvand, P.; Gascon, M.; Jones, M.; Gidlow, C.; Hurst, G.; et al. The relationship between natural outdoor environments and cognitive functioning and its mediators. Environ. Res. 2017, 155, 268–275. [Google Scholar] [CrossRef] [PubMed]
- Dahlberg, L.; McKee, K.J. Correlates of social and emotional loneliness in older people: Evidence from an English community study. Aging Ment. Health 2014, 18, 504–514. [Google Scholar] [CrossRef] [PubMed]
- Domènech-Abella, J.; Mundó, J.; Leonardi, M.; Chatterji, S.; Tobiasz-Adamczyk, B.; Koskinen, S.; Ayuso-Mateos, J.L.; Haro, J.M.; Olaya, B. Loneliness and depression among older European adults: The role of perceived neighborhood built environment. Health Place 2020, 62, 102280. [Google Scholar] [CrossRef]
- Donnellan, M.B.; Oswald, F.L.; Baird, B.M.; Lucas, R.E. The Mini-IPIP scales: Tiny-yet-effective measures of the Big Five factors of personality. Psychol. Assess. 2006, 18, 192–203. [Google Scholar] [CrossRef]
- Lau, S.C.L.; Connor, L.T.; King, A.A.; Baum, C.M. Multimodal ambulatory monitoring of daily activity and health-related symptoms in community-dwelling survivors of stroke: Feasibility, acceptability, and validity. Arch. Phys. Med. Rehabil. 2022, 103, 1992–2000. [Google Scholar] [CrossRef]
- Gu, S.; Wang, F.; Patel, N.P.; Bourgeois, J.A.; Huang, J.H. A model for basic emotions using observations of behavior in Drosophila. Front. Psychol. 2019, 10, 781. [Google Scholar] [CrossRef]
- Caruana, E.J.; Roman, M.; Hernández-Sánchez, J.; Solli, P. Longitudinal studies. J. Thorac. Dis. 2015, 7, E537–E540. [Google Scholar]
- Gibbons, R.D.; Hedeker, D.; Dutoit, S. Advances in analysis of longitudinal data. Annu. Rev. Clin. Psychol. 2010, 6, 79–107. [Google Scholar] [CrossRef]
- Verhagen, S.J.W.; Hasmi, L.; Drukker, M.; van Os, J.; Delespaul, P.A.E.G. Use of the experience sampling method in the context of clinical trials. Evid. Based Ment. Health 2016, 19, 86–89. [Google Scholar] [CrossRef] [PubMed]
- Wicker, A.W.; Altman, I.; Chemers, M.; Stokols, D.; Wrightsman, L.S. An Introduction to Ecological Psychology; Brooks/Cole Publishing Company: Belmont, CA, USA, 1997. [Google Scholar]
- McNair, D.M.; Lorr, M.; Droppleman, L.F. Profile of Mood States; Educational and Industrial Testing Service: San Diego, CA, USA, 1971. [Google Scholar]
- Watson, D.; Clark, L.A.; Tellegen, A. Development and validation of brief measures of positive and negative affect: The PANAS scales. J. Personal. Soc. Psychol. 1988, 54, 1063–1070. [Google Scholar] [CrossRef] [PubMed]
- Bergefurt, L.; Kemperman, A.; van den Berg, P.; Borgers, A.; van der Waerden, P.; Oosterhuis, G.; Hommel, M. Loneliness and life satisfaction explained by public-space use and mobility patterns. Int. J. Environ. Res. Public Health 2019, 16, 4282. [Google Scholar] [CrossRef] [PubMed]
Disclaimer/Publisher’s Note: The statements, opinions and data contained in all publications are solely those of the individual author(s) and contributor(s) and not of MDPI and/or the editor(s). MDPI and/or the editor(s) disclaim responsibility for any injury to people or property resulting from any ideas, methods, instructions or products referred to in the content. |
© 2024 by the authors. Licensee MDPI, Basel, Switzerland. This article is an open access article distributed under the terms and conditions of the Creative Commons Attribution (CC BY) license (https://creativecommons.org/licenses/by/4.0/).

