Article

Effect of Corrosion on Fatigue Failure of Composite Girders with Corrugated Web on Steel Bottom Plate

Department of Civil Engineering, Lanzhou Jiaotong University, Lanzhou 730070, China
*
Author to whom correspondence should be addressed.
Buildings 2024, 14(10), 3221; https://doi.org/10.3390/buildings14103221
Submission received: 7 September 2024 / Revised: 23 September 2024 / Accepted: 3 October 2024 / Published: 10 October 2024
(This article belongs to the Section Building Structures)

Abstract

:
Corrosive environments can adversely affect the fatigue performance of bridges and other building structures. In order to determine the influence of corrosion on the fatigue failure of concrete composite girders with a corrugated web on a steel bottom plate (hereinafter referred to as CGCWSB), a scaled model test was conducted on a CGCWSB with a span of 30 m, which served as the structural prototype. Through the model test, theoretical analysis, and numerical simulation, the influence of uniform corrosion and pitting corrosion on the fatigue failure of the CGCWSB was determined, and the propagation law of pitting fatigue crack was determined. The results show that (1) the uniform corrosion caused the stress of the CGCWSB to become larger and the performance of the CGCWSB was reduced, the stress growth of the test girder after corrosion was about 10%, the corrosion rate was 9%, the pitting unevenness coefficient was 1.25, and the relative corrosion life was 26.34 years; (2) the fatigue failure of the non-corroded girder belongs to the weld fatigue failure, and the fatigue failure of the corroded girder was the coexistence of weld fatigue failure and pitting fatigue failure; (3) uniform corrosion did not create a new fatigue source, but it did result in the test girder’s fatigue failure ahead of time. Pitting corrosion did, however, create a new fatigue source; (4) an exponential correlation was present between the propagation length of a pitting crack and the number of equal load cycles. The ultimate failure mode of a pitting fatigue crack was when the crack length reached the thickness of the plate and the component was torn and destroyed; (5) following corrosion, the fatigue life of the test girder was found to be reduced by 10.65%, which suggests that salt corrosion had a significant impact on the fatigue life of the composite girder. This research work can provide a reference for the design and promotion of the use of the CGCWSB.

1. Introduction

A structural design was proposed by French company Campenon Bemard to change stiffened flat steel webs to corrugated steel webs in 1975. In 1986, the Cognac Bridge, the world’s first composite box girder bridge with corrugated steel webs, was built [1]. The completion of this bridge marks the birth of this composite box girder structure. In 1988, the ACSI Association promoted the corrugated steel web composite box girder extensively and soon drew the attention of bridge engineers worldwide. Subsequently, such bridges are widely used in bridge construction, such as Altwipfergrund Bridge in Germany, Tronko Bridge in Norway, Ilsun Bridge in South Korea, Caracas Bridge and Coniche Bridge in Venezuela, BR-06L/R large bridge in Tehran, Iran, and so on. Japan constructed the first corrugated steel web composite box girder bridge in 1993, and it has rapidly progressed in Japan. In 2005, this kind of bridge entered China, which built the first corrugated steel web composite box girder bridge: Long March Bridge. In recent years, the corrugated steel web composite box girder has been greatly developed in the field of bridges with its unique structure and force characteristics [2]. In the traditional corrugated steel web composite girders, reinforced concrete slabs are utilized as the bottom plate. When the girder is subjected to bending moments, the concrete of the bottom plate will exhibit cracking due to its inability to withstand tensile stress. Cracks could speed up the invasion of corrosive ions, as demonstrated by Idiart et al. [3]. That is to say, cracks will accelerate the corrosion process of the girder, thus reducing the service life of the girder in the corrosive environment. In order to solve this problem, Chinese scholars use flat steel plate to replace the concrete bottom plate of the traditional composite box girder, which further reduces the structural deadweight and has a wide range of application prospects.
Corrosion fatigue of steel is an important factor affecting the durability of steel bridges and will also become a core problem affecting the service life of the CGCWSB. At present, the research on the fatigue performance of corrugated steel web composite girders mainly focuses on the traditional corrugated steel web composite box girder bridges [4,5,6,7], while there is relatively less research on the fatigue performance of the CGCWSB [8,9,10,11]. Liu Wangzong [8] and Chen Pengfei [9] conducted a model test to examine the fatigue damage to the composite girder and analyzed the fatigue damage of the composite box girder using finite element software (ANSYS 18.2 software used by Liu Wangzong and MIDAS FEA 3.0 software used by Chen Pengfei). ANSYS 18.2 software was used to verify the accuracy of fatigue test accuracy for composite girders based on model tests, which were analyzed by Li Penghao [10] and Song Shaogang [11]. These studies examined the fatigue properties and damage of composite girders, but they did not take into account the impact of a corrosive environment. Zhou Cheng [12] studied the constant amplitude fatigue characteristics of this new composite girder in a corrosive environment, and verified it with ABAQUS 6.14 software, but did not consider the effect of pitting. Ning Xin [13] studied the constant multistage fatigue damage of this new composite girder in a corrosive environment and analyzed the fatigue damage using ABAQUS 6.14 software and n-CODE 13.1. Like Zhou Cheng, Ning Xin did not consider the effect of pitting corrosion.
From the research results of the comprehensive conceptual literature, the current status of research on these kinds of girders can be summarized from the following three aspects: (1) in research methods, mainly model tests and numerical simulations [8,9,10,11,12,13]; (2) in theoretical analysis methods, where the fatigue damage analysis theory [7,13], the hot-spot stressing method [14], and the notched-stressing method [15] are mainly used; and (3) in research results, where we have obtained the corresponding fatigue damage prediction model [8,9], fatigue performance [10,11], and other results. However, there still exist the following defects: (1) lack of numerical simulation of the crack development process in the research method; (2) lack of research related to fracture mechanics in the theoretical analysis method; and (3) lack of corrosive environment effects in the research results, especially pitting corrosion on the fatigue fracture process.
In light of the aforementioned considerations, a CGCWSB bridge with a span of 30 m was selected as the structural prototype, and a model test was devised accordingly. The model test and related research results yielded the corrosion rate and pitting non-uniformity coefficient, and the corrosion life corresponding to the corrosion test was determined. Subsequently, the basic parameters, including the variation in bottom plate thickness and the initial crack of the corroded composite girder, were determined based on the model test and the Paris crack propagation modified model. The impact of uniform corrosion and pitting corrosion on the fatigue failure of the test girder and the propagation of fatigue cracks due to pitting corrosion were analyzed in turn. Subsequently, the findings were subjected to numerical simulation for analysis and verification. Compared with the previous research work, this research work adds the following three points: (1) the numerical simulation method of fatigue crack extension is added; (2) the fracture mechanics method is added to study the fracture process analysis of this kind of combined girder; and (3) the influence of pitting effect on fatigue fracture is added. This provides a better reference value for the design and manufacture and popularization of this kind of girder.

2. Model Test

2.1. Material and Dimensional Parameters

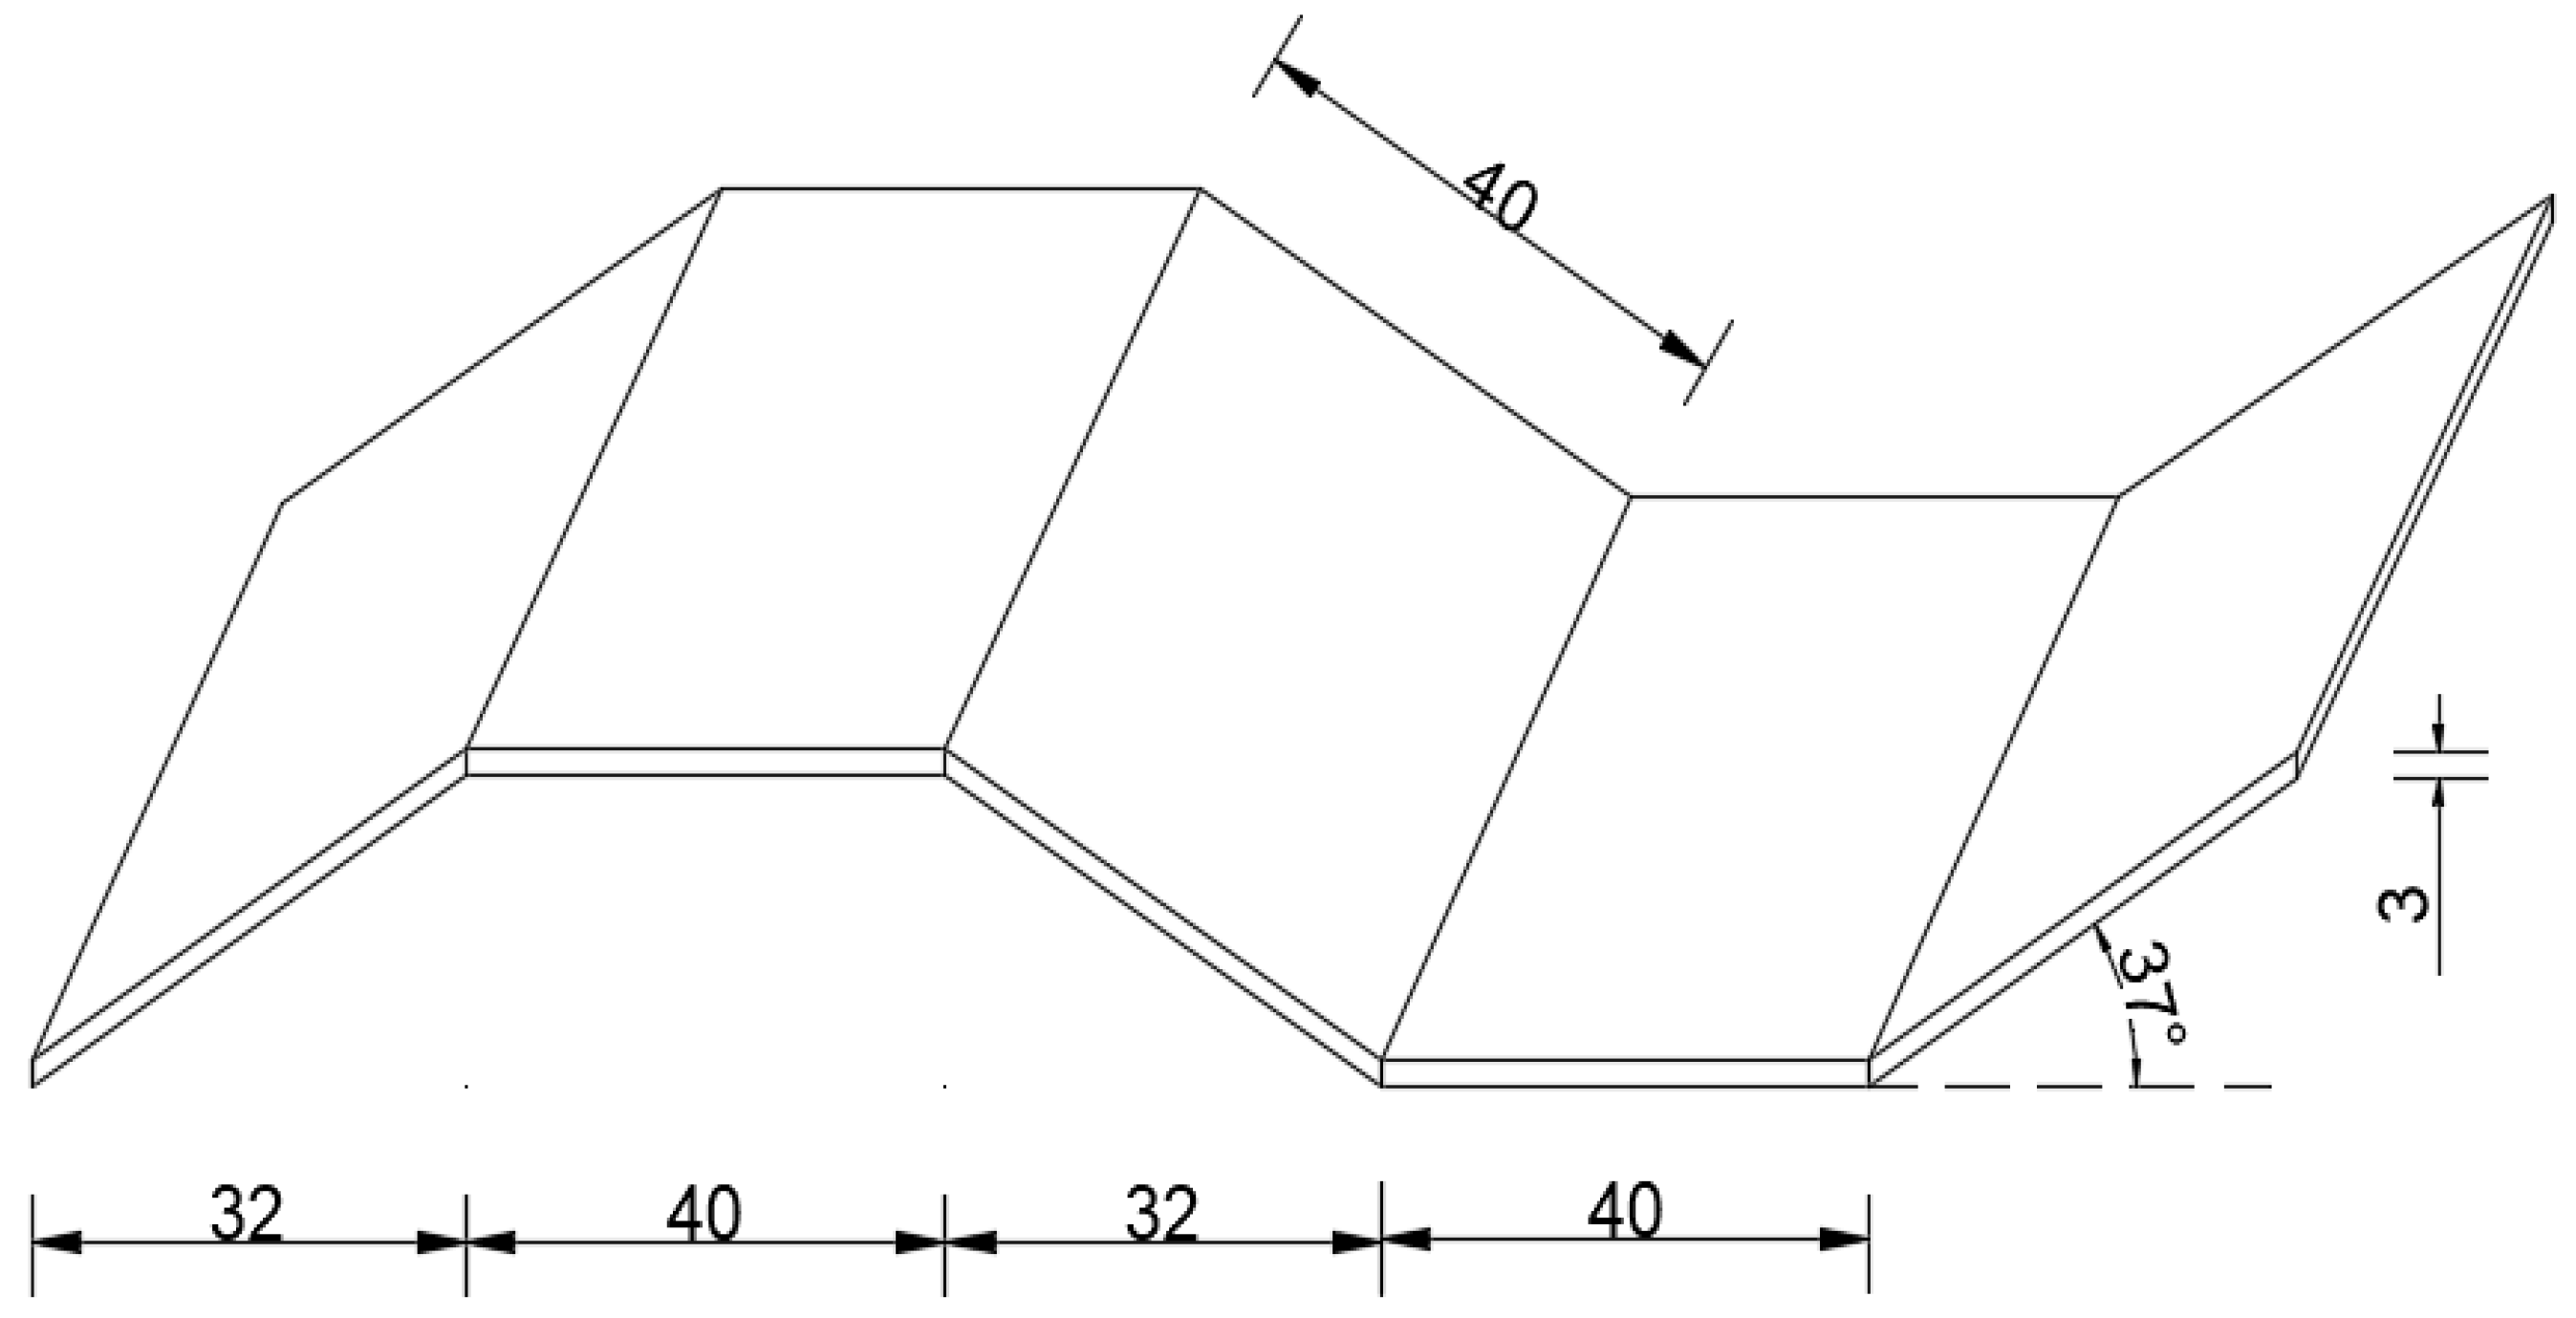
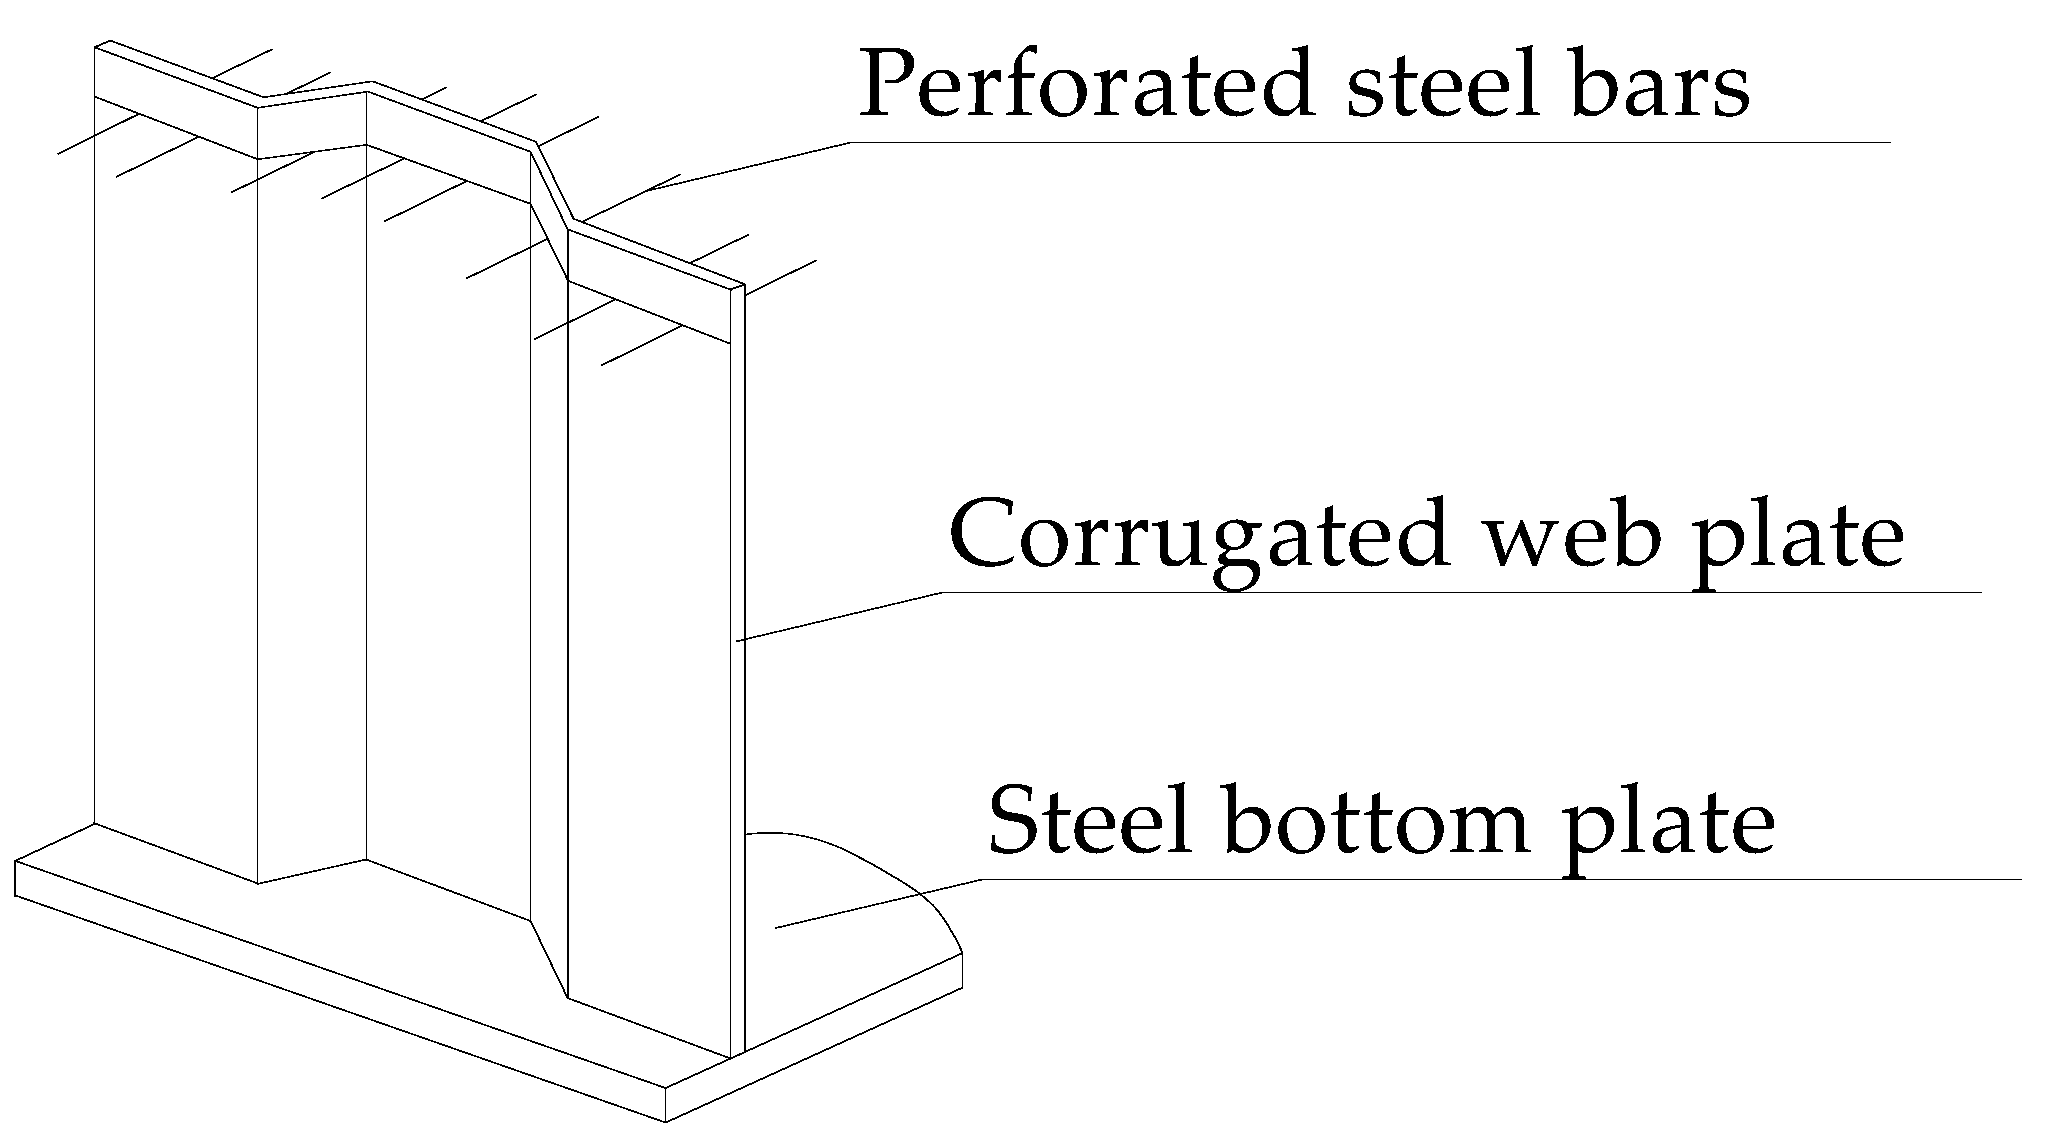
A 30 m CGCWSB was selected as the structural prototype for the design and fabrication of two scaled-down composite box girder models. The box girder model was composed of two distinct materials: the top plate and diaphragm plate were constructed from C50 concrete, with the top plate measuring 1000 mm in width and 50 mm in thickness, the end diaphragm plate measuring 150 mm thick, and the middle diaphragm plate measuring 100 mm thick; and the corrugated web and bottom plate steel models were constructed with Q345, with the steel plate comprising corrugated web steel plate measuring 3 mm in thickness and the bottom plate flat steel plate measuring 5 mm in thickness, 580 mm in width, and 5 mm in thickness. The box girder model had a span of L = 3.4 m, a calculated span of L0 = 3.2 m, and a girder height of h = 400 mm. The bottom plate girder end was simply supported, and five diaphragms were located at the L/4 and mid-span section. The corrugated web and bottom plates were welded and assembled in a factory setting. In contrast, the corrugated web and concrete bottom plates were assembled in a test laboratory setting, utilizing embedded shear connectors. The cross-sectional dimensions are illustrated in Figure 1, the corrugated steel web is depicted in Figure 2, and the embedded connectors are shown in Figure 3.

2.2. Salt Corrosion Test

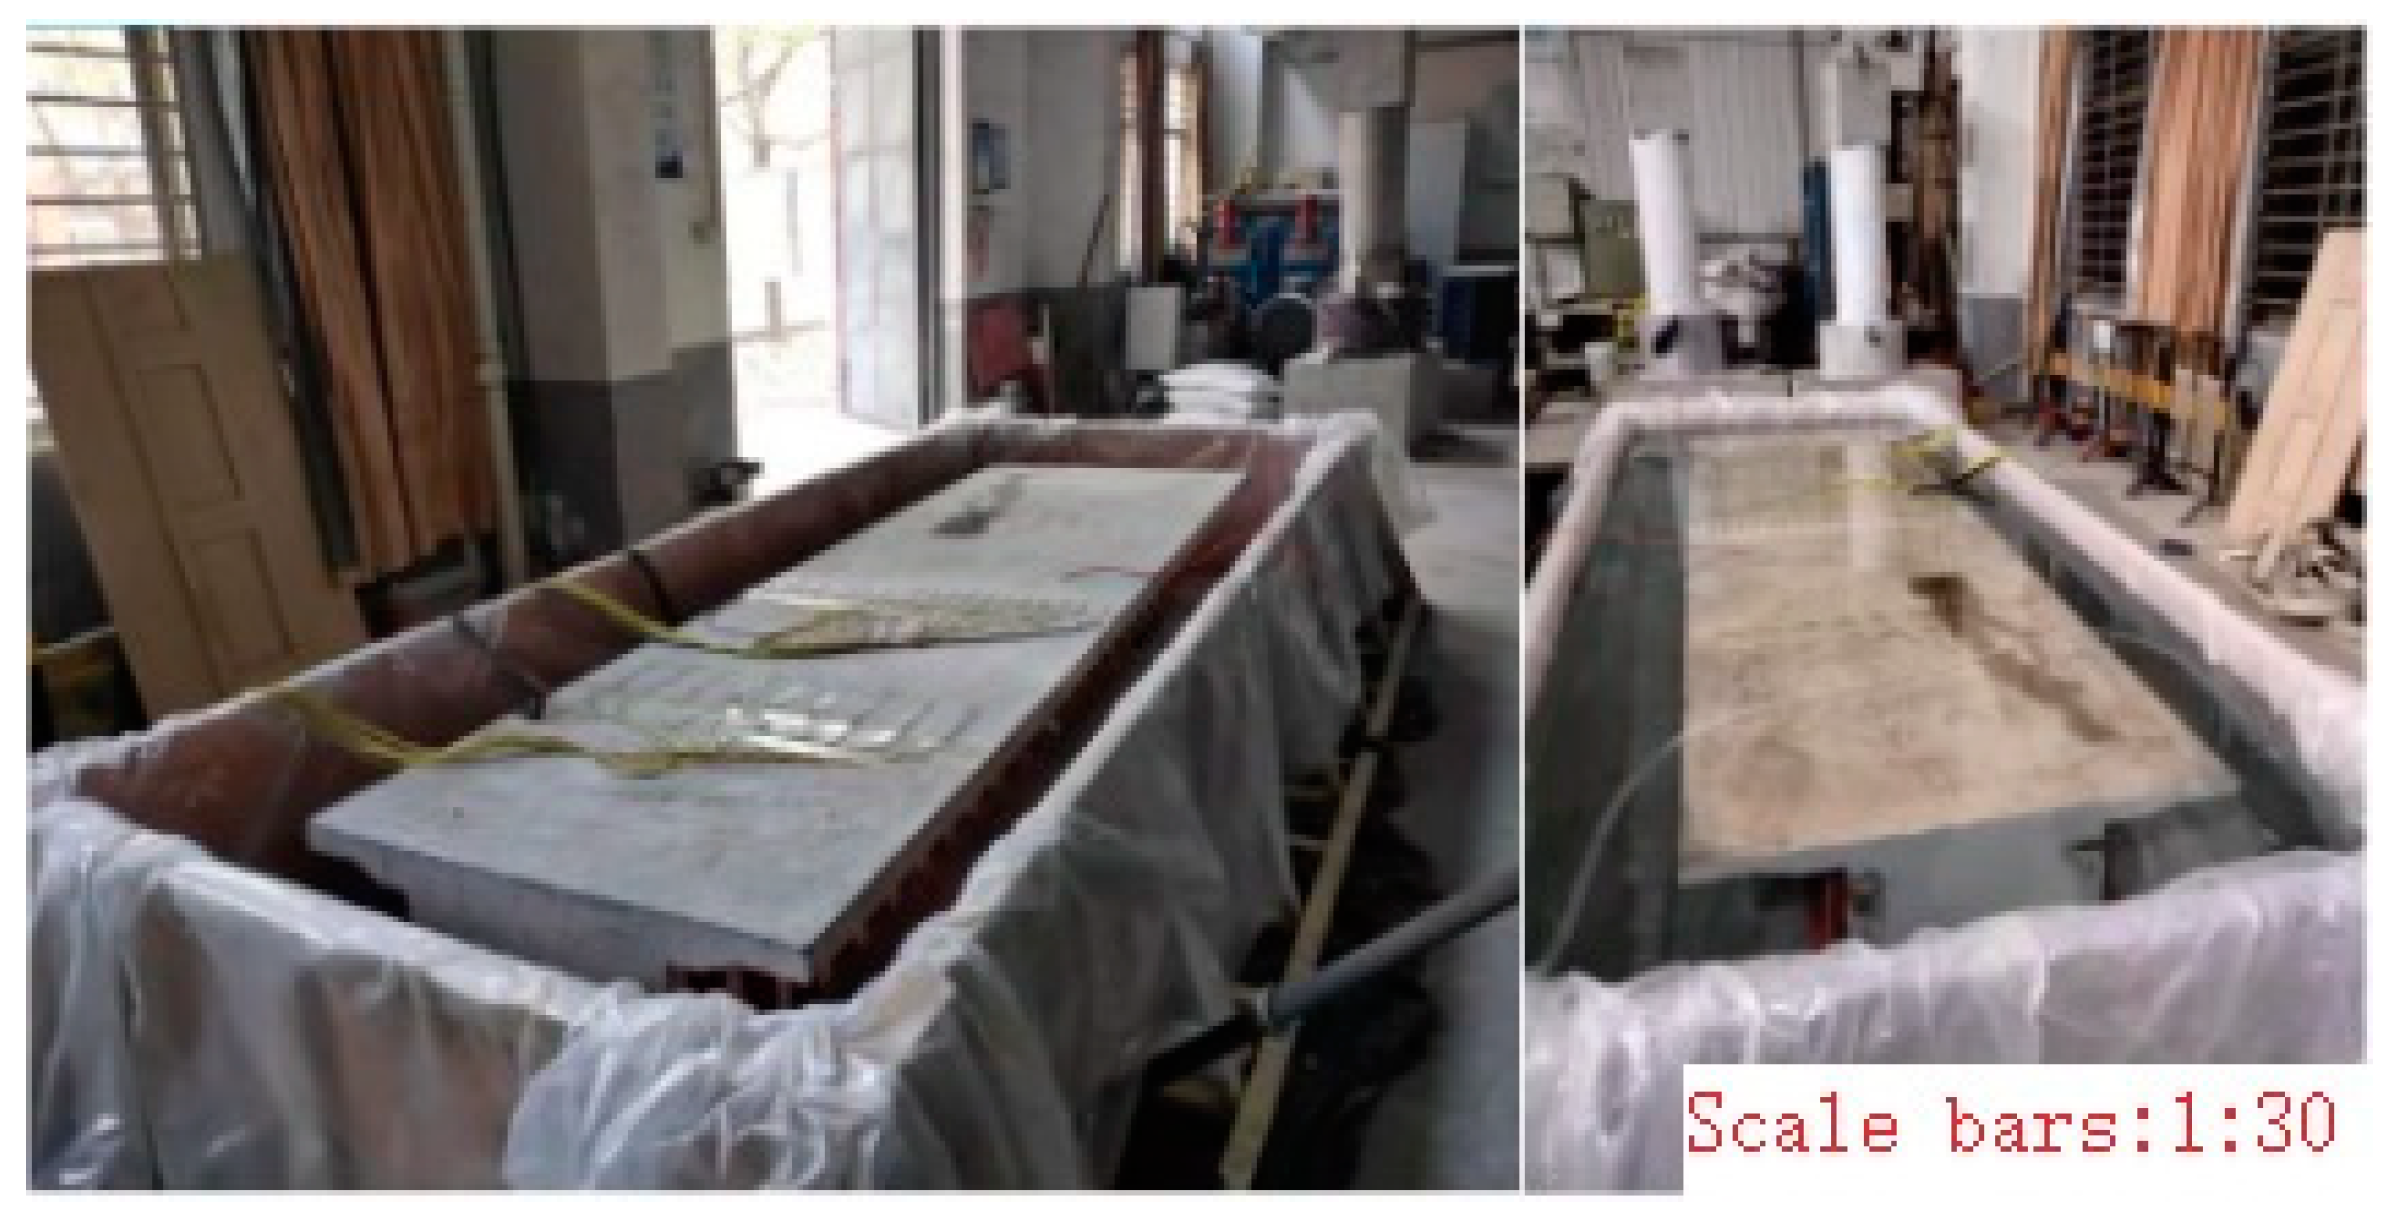
The salt corrosion test adopts long-term immersion method, according to the relevant requirements in the full immersion test method for metallic materials [16]. The general NaCl solution concentration for a steel corrosion test is taken as 2%, 3.5%, and 5%, while the NaCl solution concentration for chloride salt erosion test for concrete structure is higher, such as the NaCl solution concentration of concrete in salt erosion tests in the literature [17] is 5%, 10%, and 16%, respectively. Given that the composite girder material comprises two distinct materials, namely steel and concrete, the NaCl solution concentration for the salt erosion test of the two materials was selected as 6%. One piece of the test girder was immersed in the NaCl solution, which was designated as 2# girders as illustrated in Figure 4. The remaining unimmersed test girders were designated as 1# girders. The chloride salt erosion cycle of reinforced concrete is lengthy, extending throughout the service life of the structure. Considering the chloride salt concentration and the findings of previous chloride salt erosion tests, the immersion period for this corrosion test was 18 months.

2.3. Test Girder Loading

Both test girders underwent fatigue and static tests for the same load rating. There are two types of fatigue loading tests: the fatigue characteristic test and the fatigue failure test. The fatigue load utilizes sinusoidal loads, and the load frequency is determined to be 3 Hz. Specification [18]’s fatigue load calculation model I was used to calculate the fatigue loads of the original bridge. Using the constant load stress value as the lower limit for loading the composite girder model, we assumed the stress value when working with constant load and live load on the girder model as the upper limit value. For 2 million cycles, the fatigue test load was subjected to loads with upper and lower limits of 53.5 kN and 16.5 kN, respectively. The fatigue failure test exhibited an increase in load amplitude and a graded result. Table 1 shows the loading conditions, and Figure 5 displays the fatigue test. Static loading was followed by each level of fatigue loading cycle, which had a maximum load of 80 kN. Test data were collected every 10 kN after static loading.

2.4. Measurement Points for Test Girder

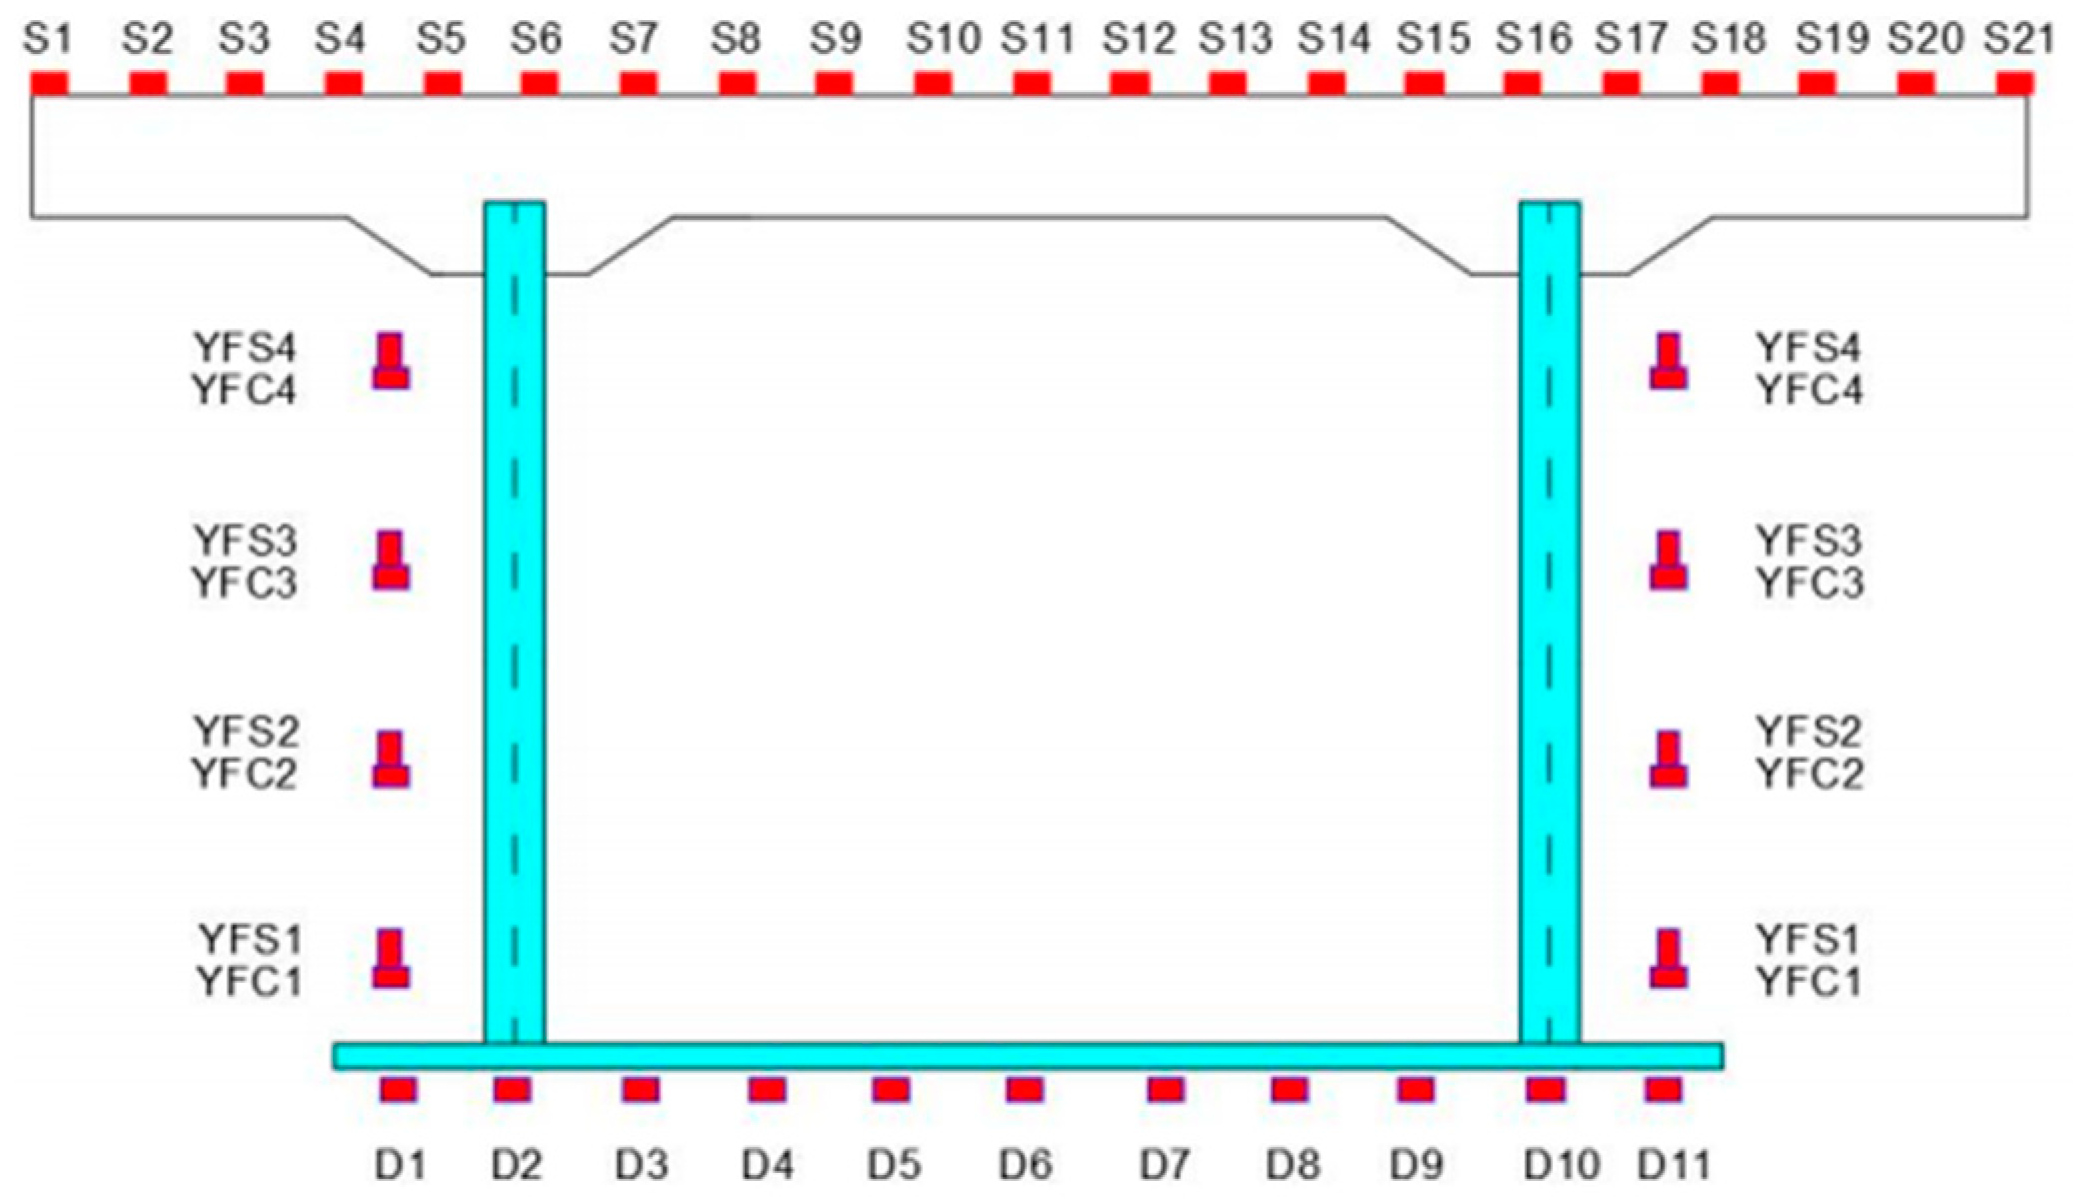
Figure 6 demonstrates the placement and naming of strain gauges in the middle portion of the test girder.

3. Test Results and Analysis

3.1. Corrosion and Stress Results

3.1.1. Appearance of Corrosion on Test Girders

Figure 7 depicts the appearance of test girder 2# following corrosion. After corrosion, test girders tend to show salt crystallization on the top plate, corrosion and the peeling of paint on the web, and rust on the bottom plate. As the salt crystallization in the top slab was not severe, it was possible to overlook the corrosive effect of chloride salts on the concrete. Due to the protective effect of the coating layer, corrosion did not have a severe effect on the steel web. Significant corrosion was present at the bottom plates, which was the focus of the post-corrosion test girder performance analysis.

3.1.2. Top Plate Reinforcement Corrosion Results

The concrete top slab was smashed after the fatigue test to determine the corrosion results of the reinforcing bars in the top slab of the 2# test girders, as shown in Figure 8. It can be seen that there was no obvious corrosion phenomenon of the test girder reinforcement, i.e., the effective bearing area of the reinforcement was not reduced. As the corrosion ion was chloride ion, the influence of chloride salt on concrete could be ignored, so it can could be considered that the effective bearing area of the top plate of the test girder after corrosion was not reduced. Combined with the appearance of the corrosion test girder, it can be considered that the corrosion of chloride salt on the steel bottom plate wave web concrete combination girder was mainly the corrosion of the steel bottom plate. In the process of calculation and analysis, the reduction in the effective bearing area of the test girder was mainly the reduction in the effective bearing area of the bottom plate.

3.1.3. Stress Results before and after Corrosion of Steel Bottom Plate

Stress analysis was performed based on the test data collected in Figure 6. The static test values were all adopted as the stress results under 80 kN, the fatigue characteristic test stress values were taken as the results after 1 million and 2 million times of fatigue loading, and the fatigue failure test stress values were taken as the results after 2.8 million and 4 million times of fatigue loading as shown in Figure 9.
From Figure 9, it can be seen that the stress of the 2# test girder was larger than that of the 1# test girder, and the stress growth after corrosion was around 10%. If combined with the stress calculation formula of the three-point loaded girder, the result can be used to calculate the corrosion rate of the girder and other parameters. It can be seen from Figure 9a that for the two test girders after 2 million times in the fatigue test, the respective stress values were relatively close, indicating that corrosion led to the phenomenon of the test girder appearing to reduce the effective bearing area, while the fatigue loading did not affect the test girder the reduction in the effective bearing area. From Figure 9b, it can be seen that for the two test girders after 2.8 million times and 4 million times of fatigue loading, the respective stress value difference was larger, indicating that the test girder in the fatigue failure test appeared in the phenomenon of effective bearing area reduction; the specific number of cycles needs to be determined through calculation.

3.2. Analysis of Corrosion Results of Test Girders

Corrosion phenomena of steel by chloride salts usually include uniform corrosion and pitting. Uniform corrosion can be expressed by the corrosion rate, and the most important parameter of the pitting pit is the depth of the pitting pit, which can be expressed by the pitting inhomogeneity coefficient, and in addition, the depth of the pitting pit can be used to calculate the corrosion age in the corrosive environment corresponding to the corrosion test. Since the girder volume was generally large and weighing was not easy to manipulate, the results of the stress analysis in Figure 9 were back-calculated so as to determine the corrosion rate of the girder bottom plate under uniform corrosion. Again, because of the large size of the girders, the pitting pit depth results were not easy to find and measure, so the pitting unevenness coefficient of the pitting pits was determined through referring to the research results of previous years.

3.2.1. Corrosion Rate of Test Girders

The weight loss method [19] was used to represent the uniform corrosion of the girder. The corrosive ions in the solution are mainly chloride ions, and the effect of chloride salts on the concrete roof is negligible. The weight loss after corrosion was mainly the reduction in the vertical height h (i.e., the thickness of the plate) of the steel bottom plate, so the corrosion rate of the steel can be defined by the definition of the “loss of thickness rate”, namely:
η s = m 0 m s m 0 = h w h f h w = Δ h h w
where, ηs is the corrosion rate of steel, hw, hf are the thickness of steel plate before and after corrosion, unit: mm, and Δh is the thickness change in the steel plate before and after corrosion, unit: mm.
According to Equation (1), the change in the thickness of the bottom plate can be used to determine the change in the moment of inertia of the cross-section. Due to the existence of the “fold effect” of the waveform web, the combination of the girder cross-section to meet the “assumption of the proposed flat cross-section”, that is, ignoring the contribution of the waveform web to the bending stiffness of the top concrete cross-section, is converted to a steel cross-section, and the combination of the girder corrosion of the moment of inertia [20] of the bending is calculated as follows:
I f = b 1 h w 1 1 η s 3 12 + b 1 h w 1 1 η s e f 1 2 + b 2 h 2 12 + b 2 h 2 e f 2 2
where If is the bending moment of inertia of the girder after corrosion, unit: mm4; i is the number of the plates composing the girder, the bottom plate is numbered as 1, and the top plate is numbered as 2; efi is the coordinate of the center of the cross-section after corrosion of each plate, unit: mm; and bi is the width of each plate, unit: mm.
The analytical results in Figure 9 show that the stress growth of the test girder after corrosion was around 10%. Combining the inverse calculation with Equation (2), it can be determined that the corrosion rate of the test girder was around 9%, and the thickness of the steel bottom plate after corrosion was 4.55 mm.

3.2.2. Pitting Inhomogeneity Coefficient

Characterizing the pitting depth of steel using the ratio of the maximum pitting depth to the uniform corrosion depth [21], the pitting depth result can be expressed as follows:
R p = d max d c
where Rp is the pitting inhomogeneity coefficient; dmax is the maximal pitting depth; and dc is the uniform corrosion depth.
From Equation (1), the uniform corrosion depth of the girder can be expressed by the variation of the thickness of the bottom plate Δh, i.e., Δh = dc. Substituting Equation (3) into Equation (1) gives the maximum pitting depth of the girder, shown in the following:
d max = h R p η s
According to the relevant data in the research results of Su Han et al. [22], the pitting inhomogeneity coefficient Rp = 1.25 was selected, i.e., the initial depth of the pitting pit was selected to be 0.5625 mm.

3.2.3. Age of Corrosion

We determined the significance of the combination of the girder corrosion rate and pitting unevenness coefficient in addition to determining the impact of corrosion on the performance of the combination of girders. It was most important to determine the normal use of the environment to accelerate the experiment corresponding to corrosion life. Corrosion life can be calculated according to the point deep pit depth prediction model, as shown in Table 2. It can be seen from this that most of the corrosion life calculation values were greater than 20 years, and the average value of the data for more than 20 years could be obtained as a relative corrosion life of 26.34 years.

3.3. Fatigue Failure Results of Test Girders

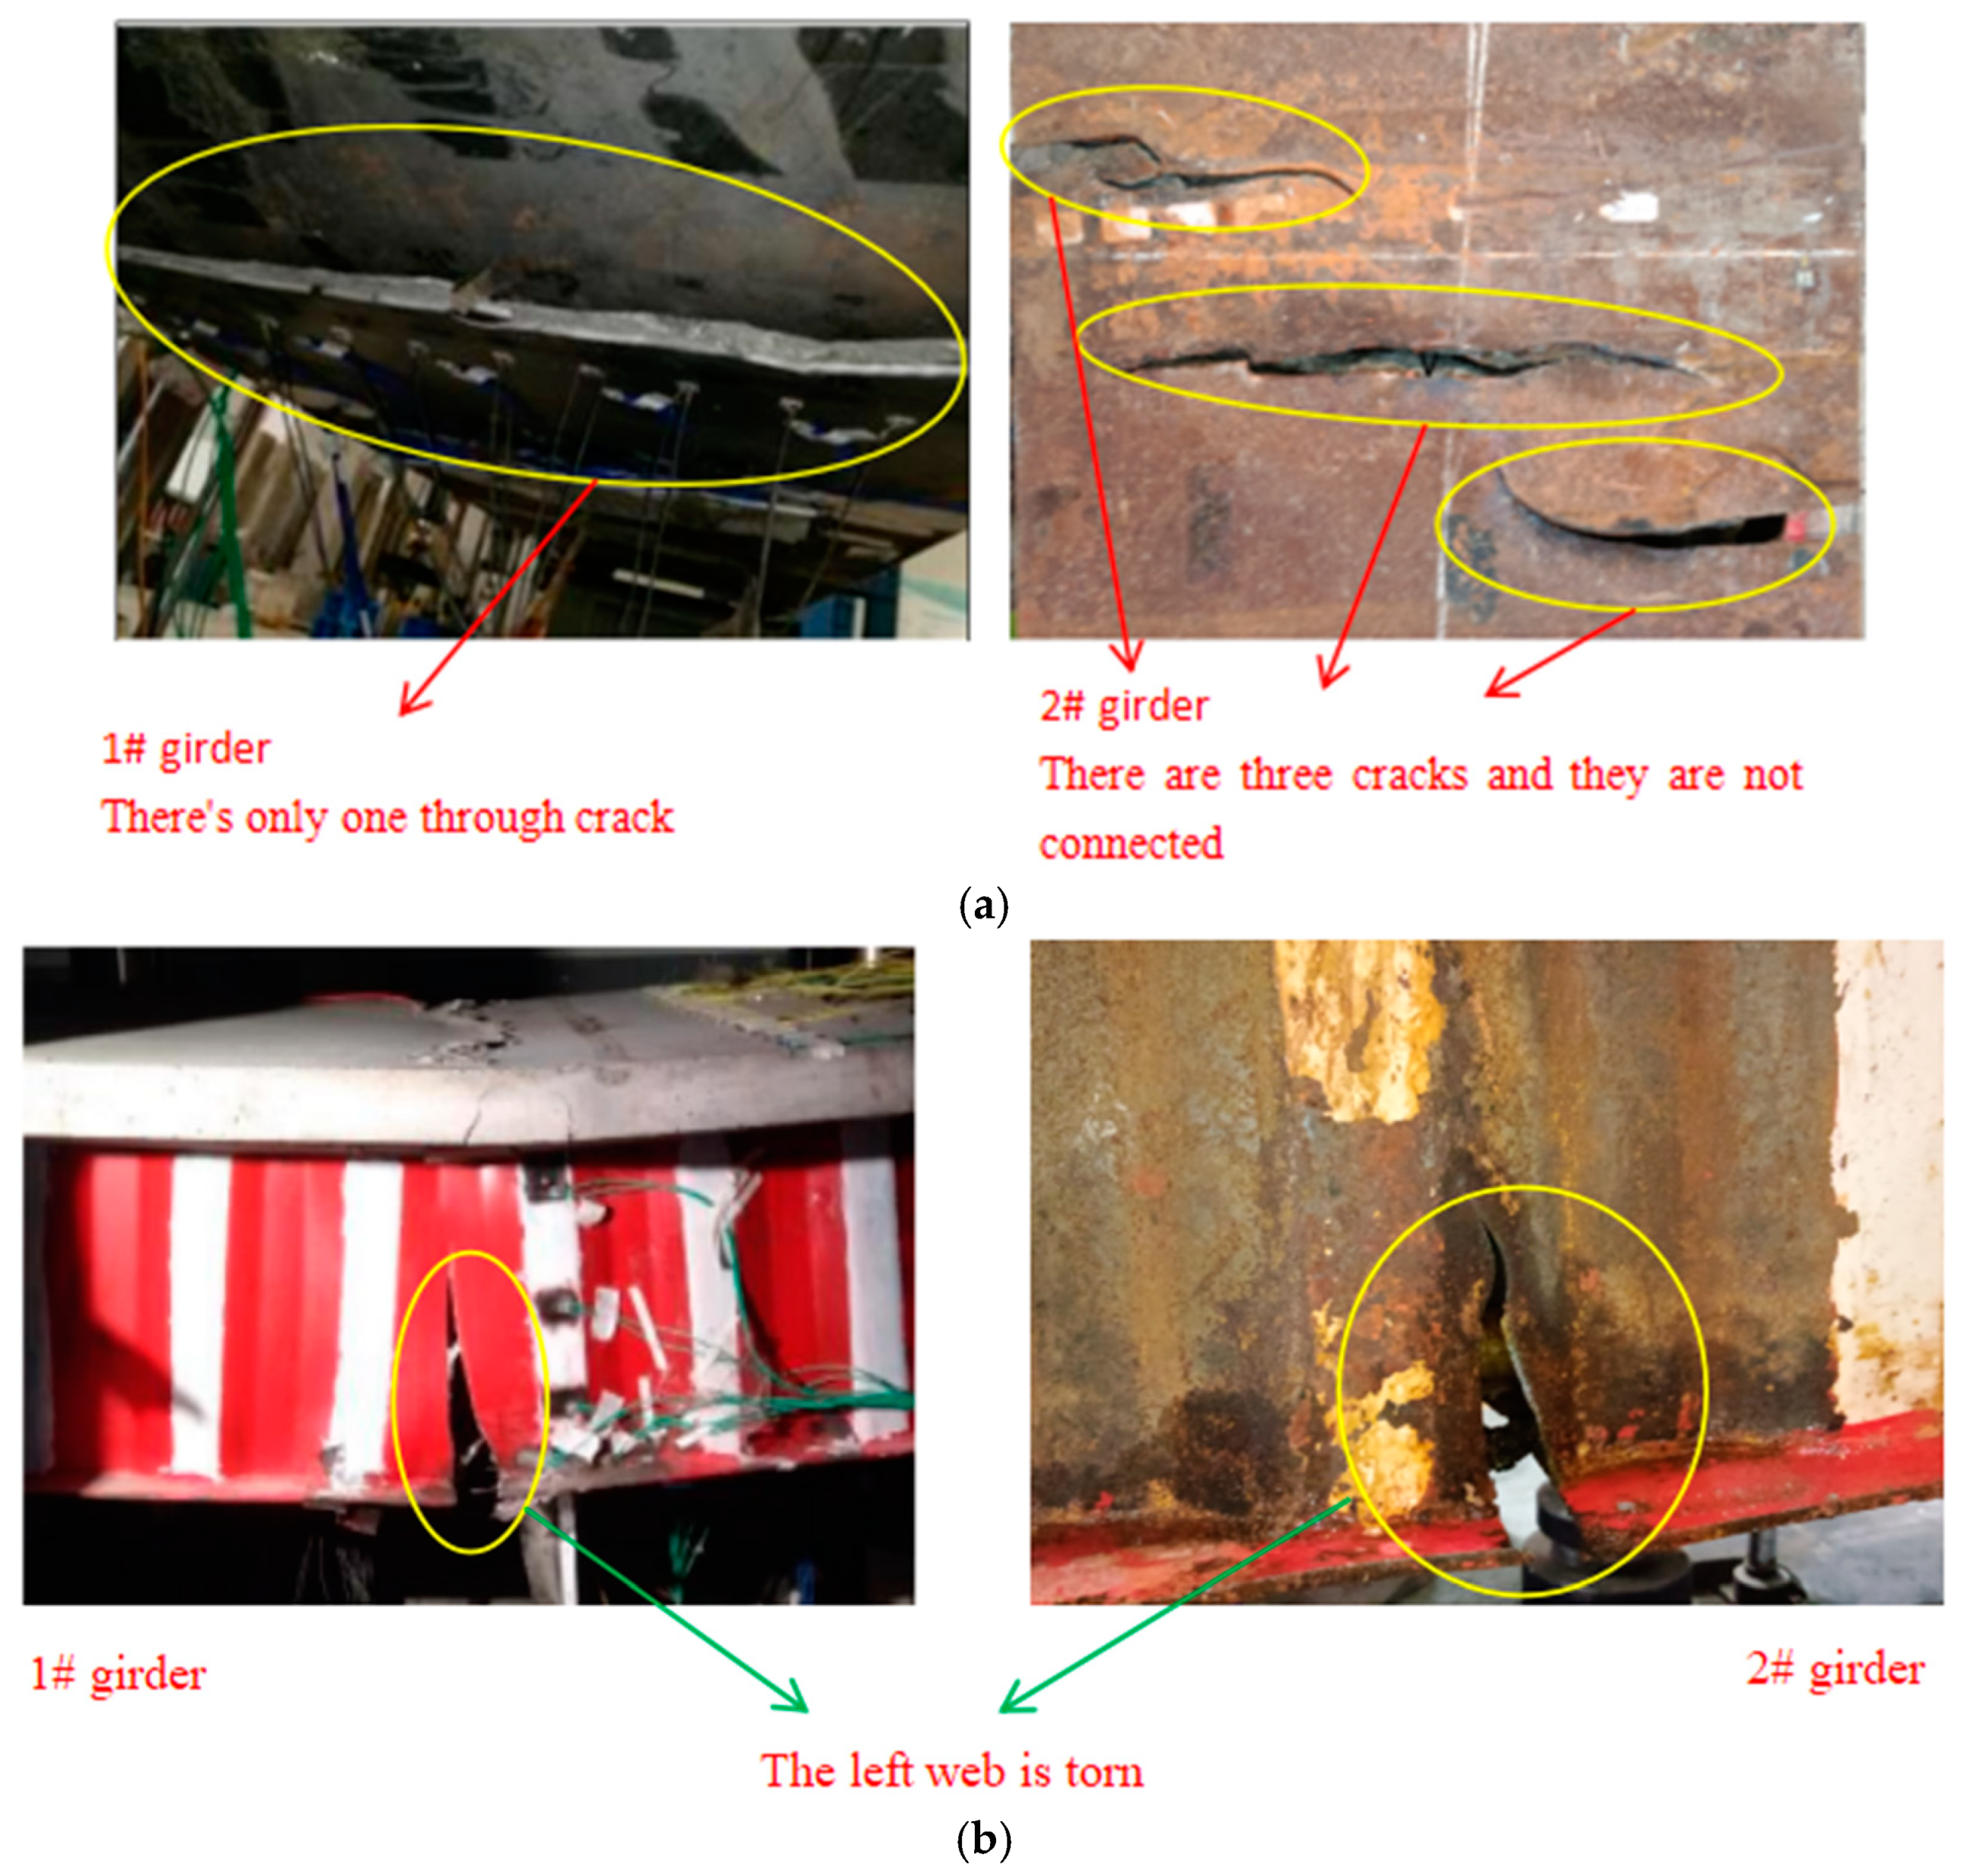
The final failure of the test girder is shown in Figure 10.
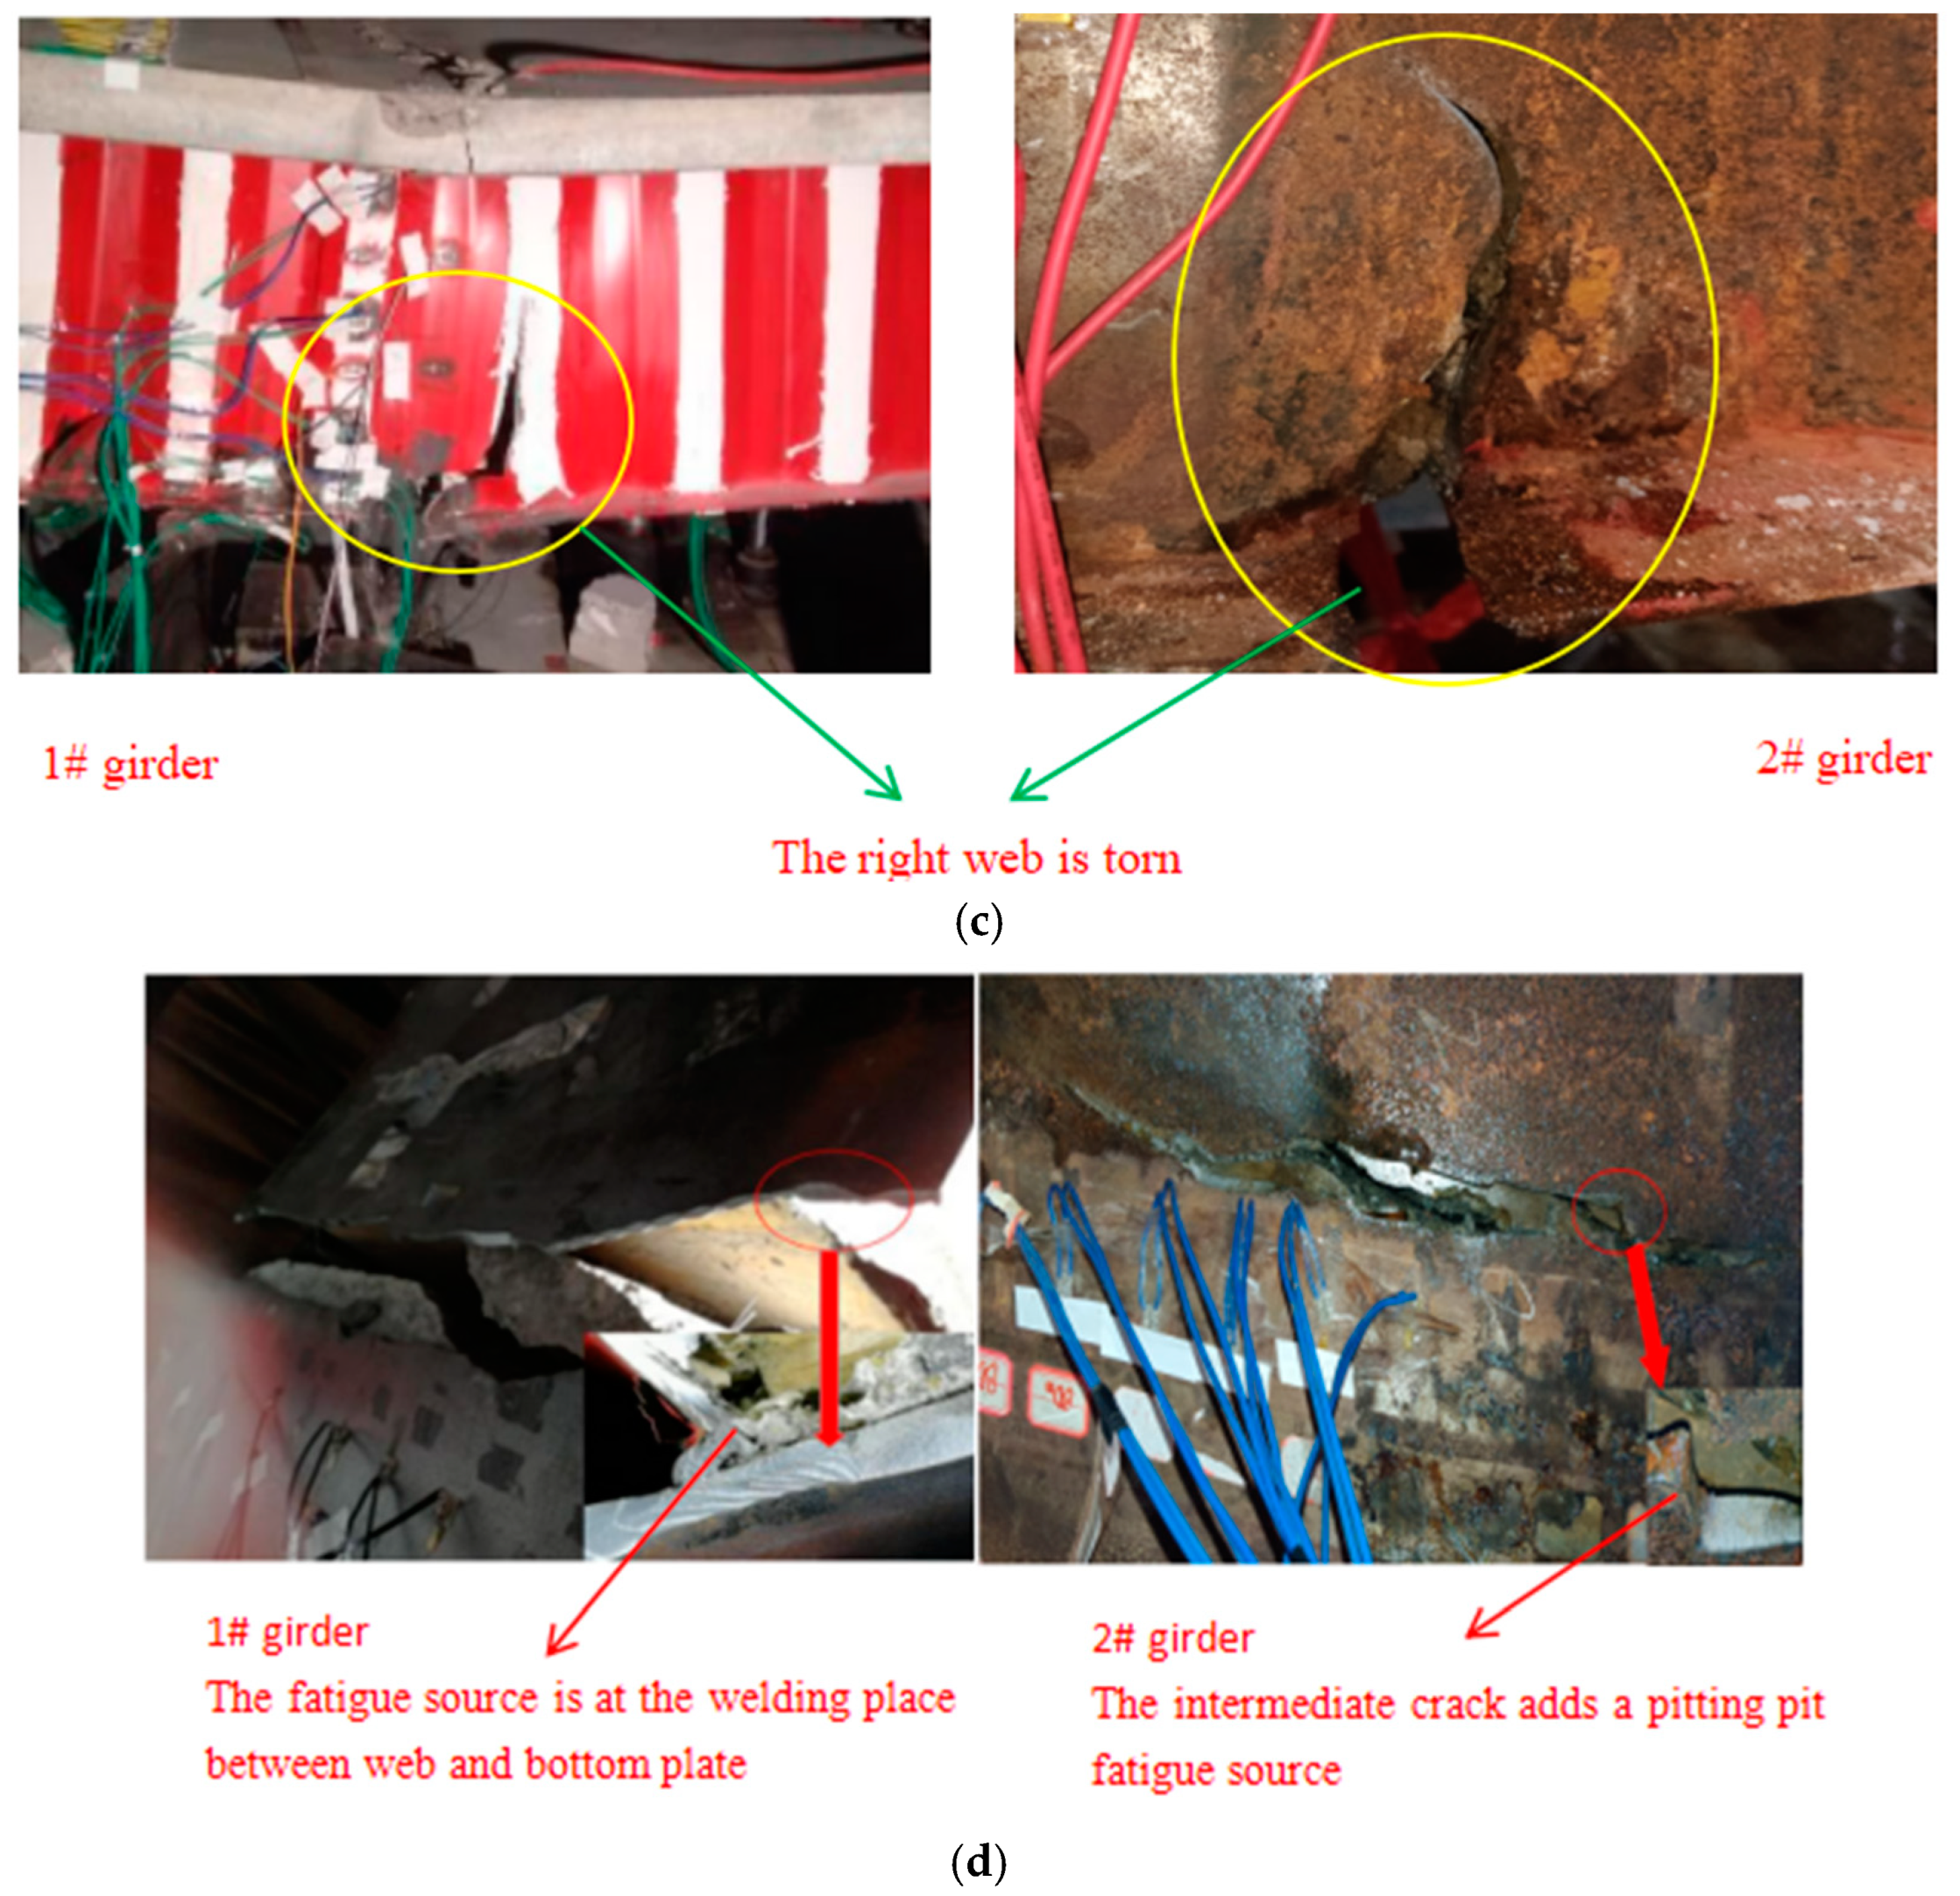
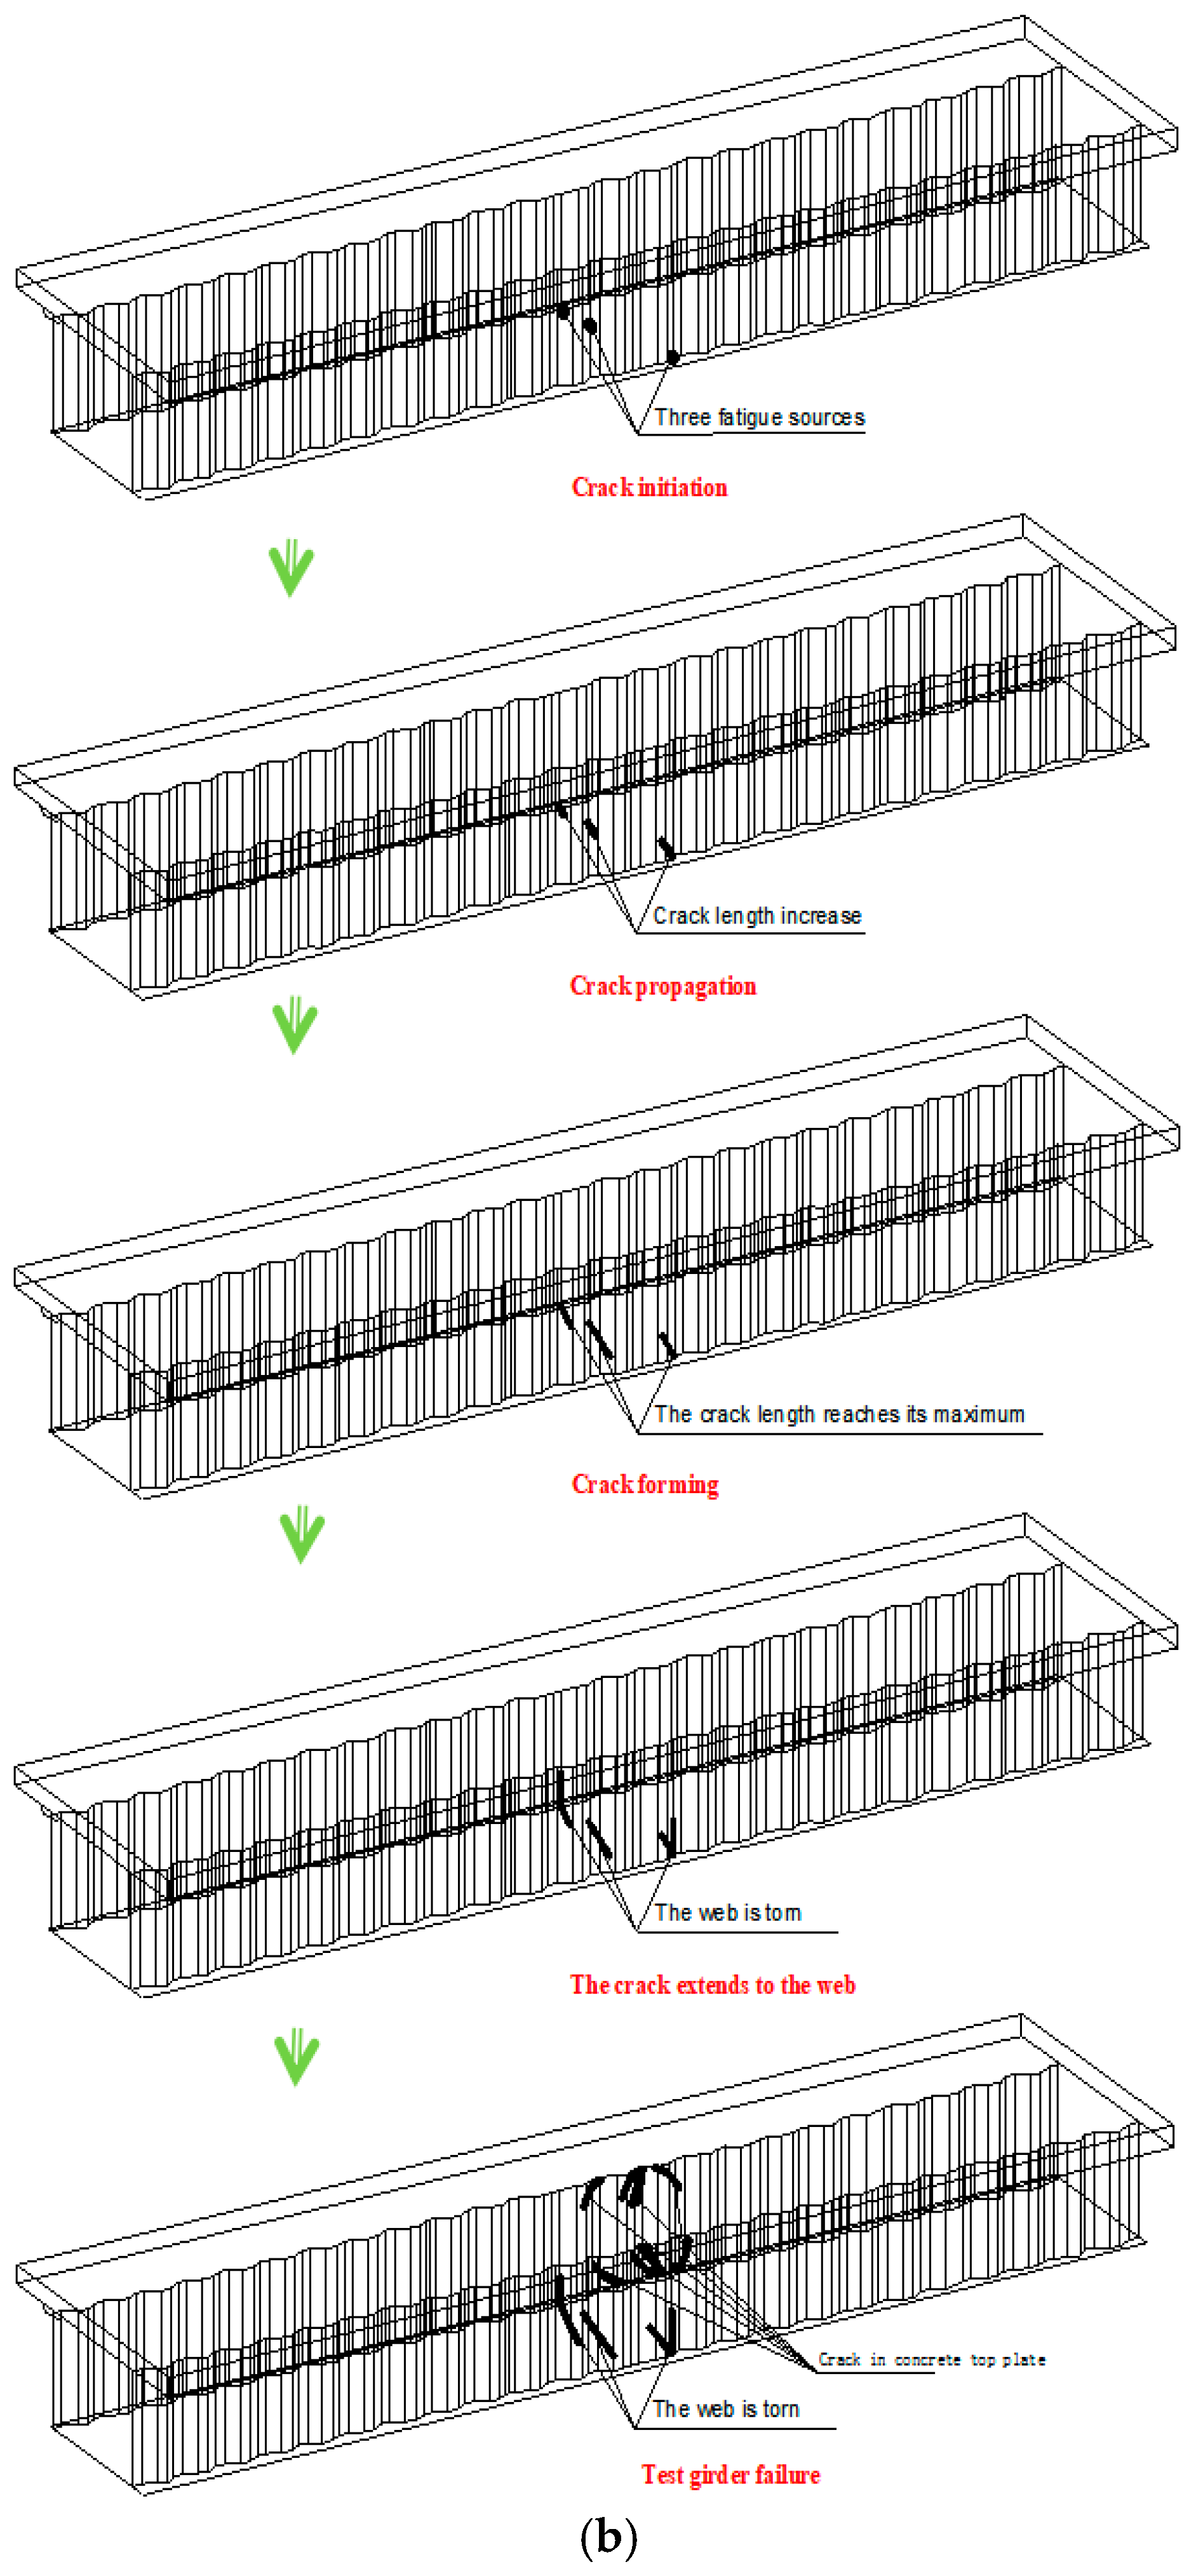
As can be seen from Figure 10, the final failure of the 1# test girder had only one through crack at the bottom of the girder, and the left and right side webs were torn at the moment of the failure of the test girder, forming an upward-developing crack; from the position of the fatigue cracks, the fatigue source of the 1# test girder was located at the welded joints at the interface of the bottom plate and the web, which indicated that the fatigue failure of the test girder was a welded joint fatigue failure and its failure process conformed to the general rule of welded joint fatigue failure. The final failure of the 2# test girder produced three cracks at the bottom of the girder, and in comparison with the failure result of the test girder of 1#, the test girder of 2# also showed the phenomenon that the web plates on both sides were torn at the moment of the failure of the test girder, and tearing cracks upward along the cross-section of the girder were formed, and the form of its failure was still that the fatigue source was located in the welded joints at the interface of the bottom plate and the web plate. The failure was still in the form of fatigue failure of the welded joints located at the interface between the bottom plate and the web plate; the end of the middle crack was far away from the web plate and was not through, which indicated that a pitting pit was formed after salt corrosion and became the fatigue source of fatigue failure, and combined with the position of the “fatigue source” at the corrosion fatigue fracture, it also explained that this fatigue crack formation was due to the fact that the pitting pit had become the fatigue source of fatigue failure. The location of the corrosion fatigue fracture is also shown. Comparing the failure forms of the two test girders, it can be seen that the fatigue failure form of the non-corroded CGCWSB was the weld fatigue failure at the interface between the bottom plate and the web, while the fatigue failure form of the corroded CGCWSB was the coexistence of weld fatigue failure and the pitting fatigue failure phenomenon. From the above analysis, it can be concluded that uniform corrosion does not affect the weld joints at the interface to become the fatigue source of fatigue failure, while pitting corrosion will form a new fatigue source.
Compared with the non-corroded test girder, pitting fatigue failure was a unique phenomenon of the post-corrosion test girder. Combined with the test phenomenon, the three fatigue cracks of the corroded test girder appeared almost simultaneously, so it can be assumed that pitting fatigue failure also determines the fatigue life of the test girder and must focus on analyzing the law of pitting fatigue crack expansion. When the law of pitting fatigue crack expansion is determined, the process and law of pitting fatigue failure of the test girder is also determined.

3.4. Analysis of the Expansion Pattern of Pitting Fatigue Cracks

From a fracture mechanics [27] point of view, the life of a crack-containing member is determined via the rate of fatigue crack extension, which Paris considers to be exponentially related to the stress intensity factor amplitude, with the expression:
d a d N = C Δ K Ι m
where C and m are material parameters; a is the fatigue crack length; N is the number of fatigue load cycles; and ΔKI is the stress intensity factor amplitude for type I cracks.
We can also integrate Equation (5):
a 1 1 m 2 a 0 1 m 2 = 1 m 2 C 1 Δ σ m N
where a0 is the initial fatigue crack length and a1 is the fatigue crack length from the load cycle to N1.
Equation (6), derived from the Paris formula, can be used for crack extension calculations for constant amplitude fatigue loading, but the stress amplitude Δσ for multistage loading is not a constant value and a correction to this equation is required.
Take two-stage loading as an example; according to the principle of crack equivalence, the number of first-stage load actions is converted into the equivalent number of second-stage load actions, i.e., it is considered that the crack length produced via the first-stage load action N1 times is equal to the crack length produced via the second-stage load action n2 times, which is available according to Equation (6):
1 m 2 C 1 Δ σ 1 m N 1 = 1 m 2 C 1 Δ σ 2 m n 2
The simplification leads to the following:
n 2 = Δ σ 1 Δ σ 2 m N 1
where n2 is the number of equivalent cycles of the first level of loading.
Substituting Equation (8) into Equation (6) yields the crack extension equation under two-stage loading as follows:
a 2 1 m 2 a 0 1 m 2 = 1 m 2 C 1 Δ σ 2 m n 2 + N
In a similar fashion, if it is the fatigue crack extension under k-level loading, the 1–(k − 1) level loading is equated to the k level equivalent cycle number, and the fatigue crack extension equation under k-level loading can be known from Equation (9) as follows:
a k 1 m 2 a 0 1 m 2 = 1 m 2 C 1 Δ σ k m n k + N
In accordance with the load equivalent methodology outlined in Equation (9), the load cycle times of the fatigue test were substituted with equivalent values in order to calculate the fatigue life and crack propagation law of the composite girder (2# test girder) following corrosion. This is illustrated in Table 3.
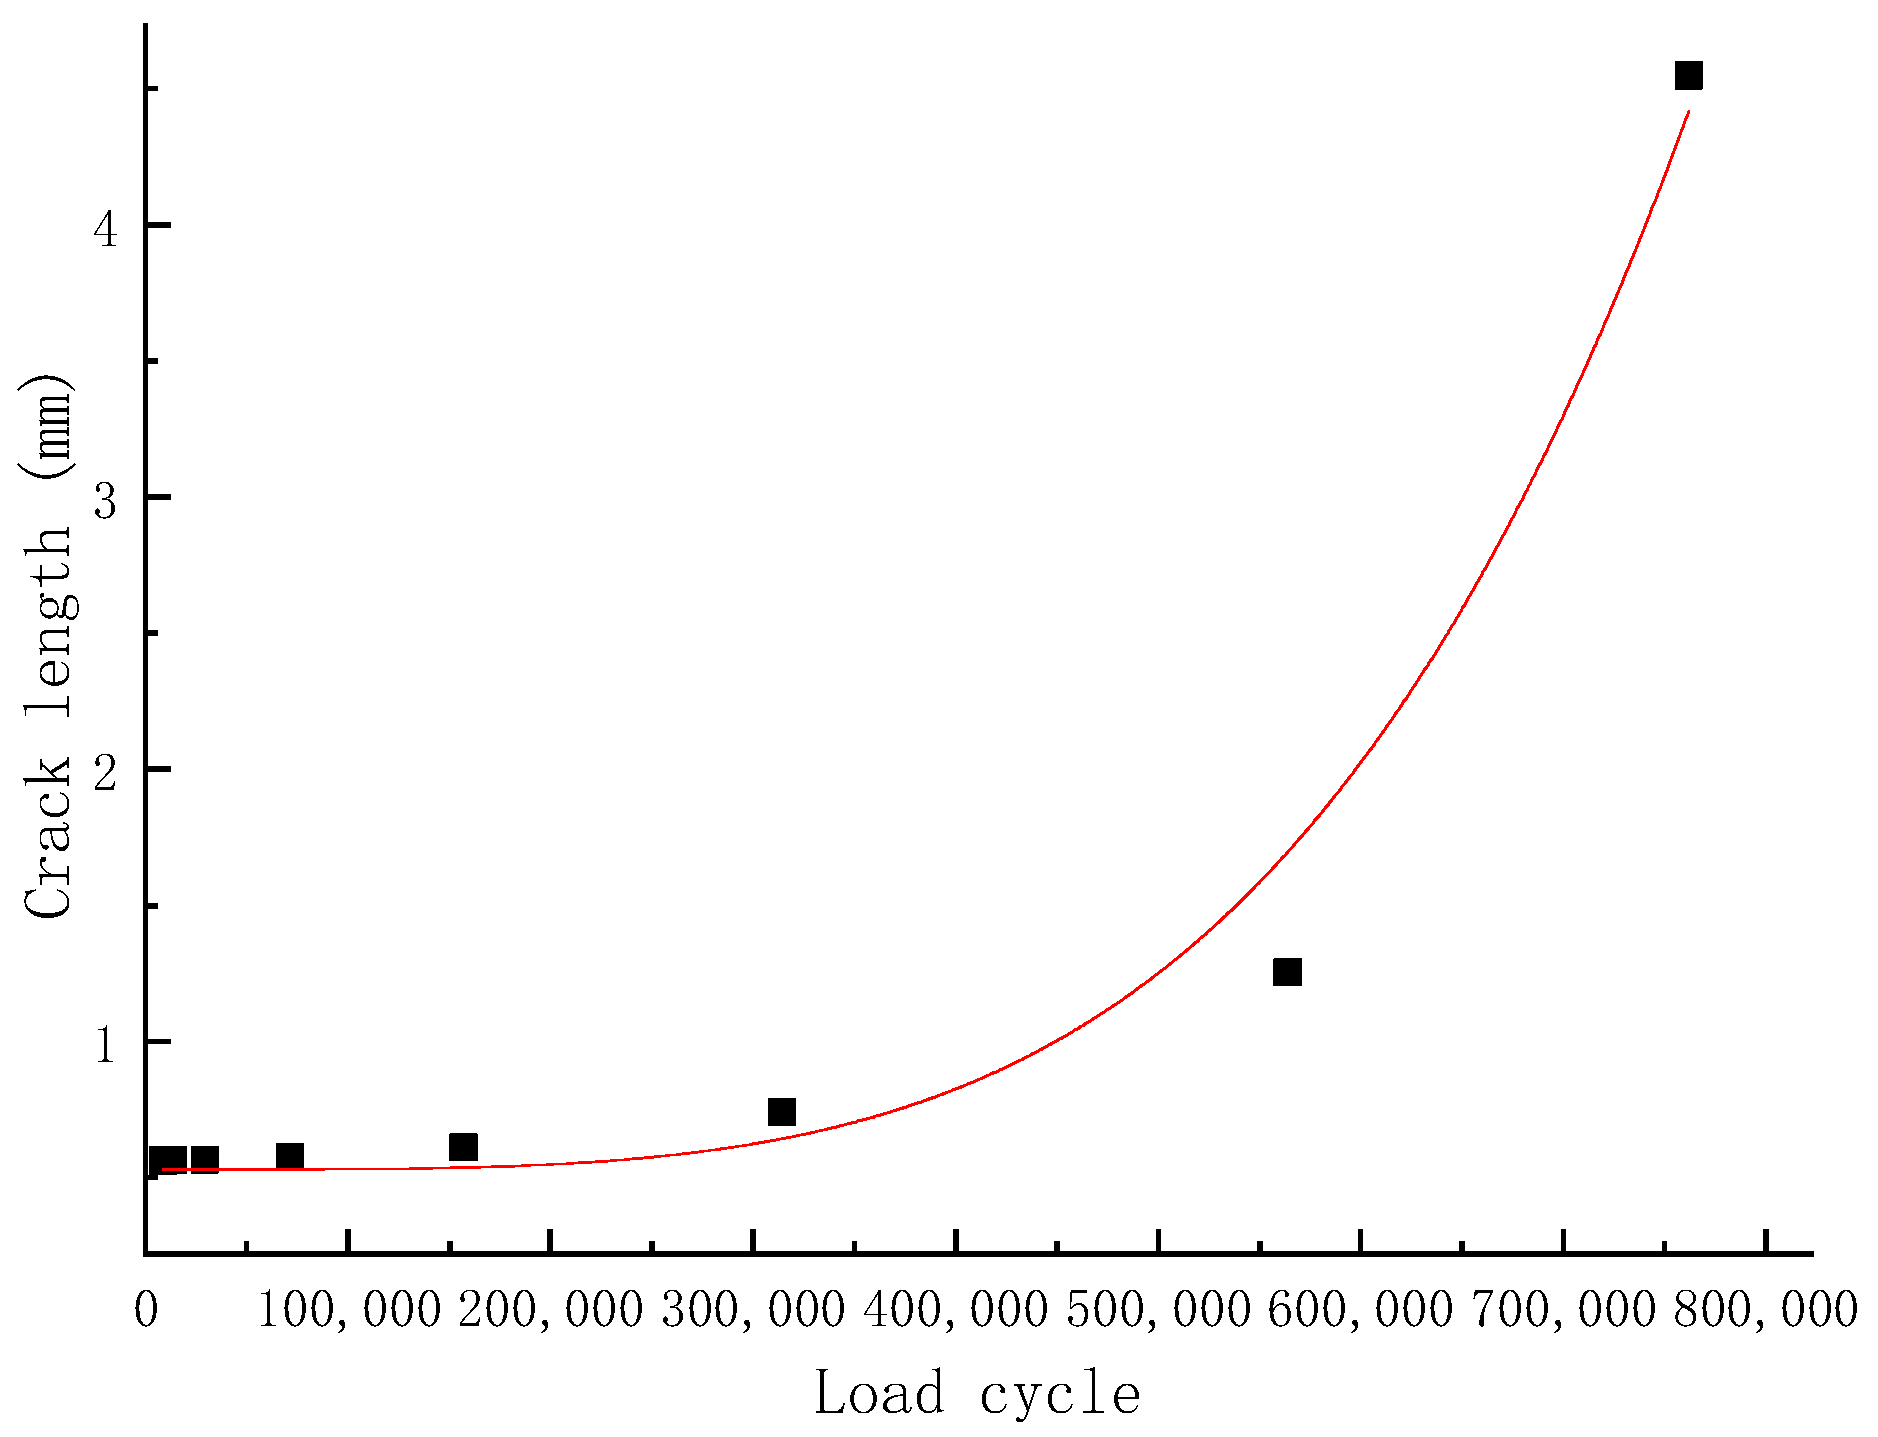
It can be seen from Table 3 that the growth of cracks and the number of equivalent load cycles as a whole shows an exponential relationship. When the number of equivalent load cycles was less than 157,100 times, the cracks basically did not grow; when the number of equivalent load cycles were in the range of 157,100–564,000 times, the cracks began to grow and the growth rate gradually increased; when the number of equivalent load cycles was greater than 564,000 times, the cracks began to grow rapidly, and the member entered the rapid failure stage. When the number of equivalent load cycles was greater than 564,000, the crack started to grow rapidly and the member entered into the stage of rapid destruction. When the number of equivalent load cycles reached 762,000, the length of the crack reached the thickness of the plate, the crack opened up, and the member was torn and destroyed.
Fitting the data in Table 3 yielded the relationship between the crack length a, and the number of load cycles N fitted to the post-corrosion composite girder as shown in Figure 11 as follows:
a = 1.1535 × 10 23 N 4 + 0.5305
Following the loading conditions outlined in Table 1, the fatigue life of the #1 test girder was determined to be 5,146,000 cycles, while the fatigue life of the #2 test girder was found to be 4,598,000 cycles, representing a reduction of 10.65%. It is evident that the corrosive environment has a detrimental impact on the service life of the composite girders.

3.5. Fatigue Failure Analysis

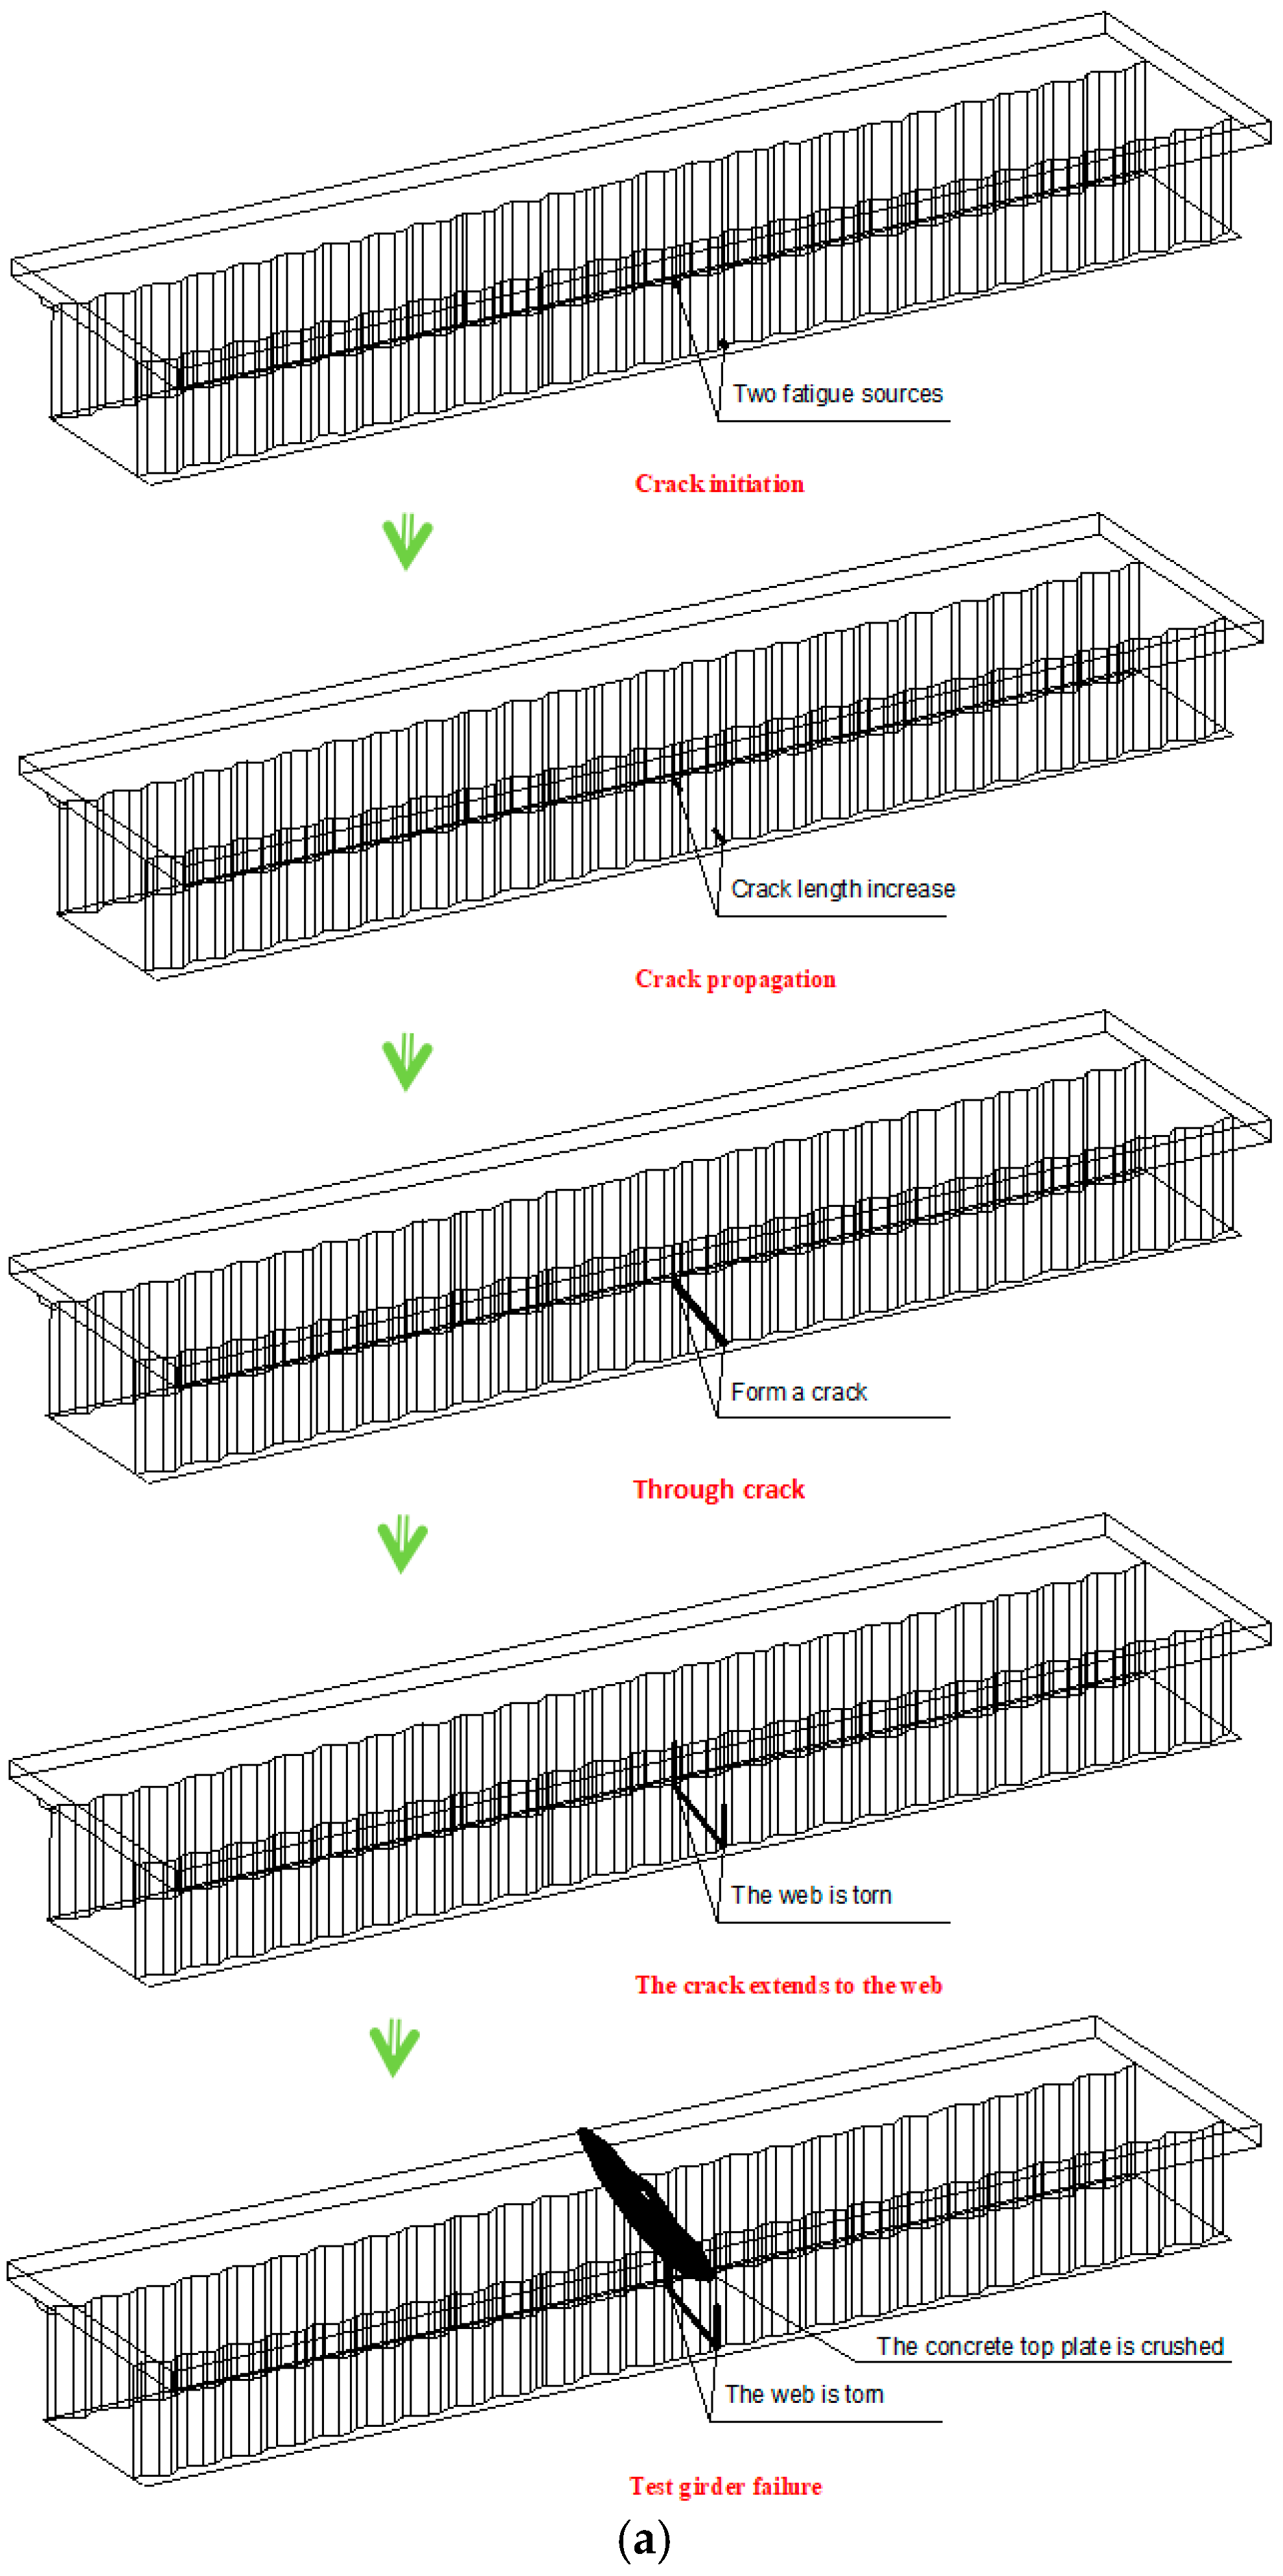
In light of the aforementioned test and analysis results, it can be posited that the fatigue failure process of the girder, both before and after corrosion, is illustrated in Figure 12. The fatigue failure of the test girder, both before and after corrosion, can be observed to occur in five stages: crack initiation, crack propagation, crack formation, crack propagation to the web, and ultimate failure of the test girder. The 1# test girder exhibited a single fatigue source and a single crack at the conclusion of the fatigue failure process. The second test girder exhibited three distinct fatigue sources, resulting in the formation of three cracks at the conclusion of the test. This indicates that pitting corrosion gives rise to a novel fatigue source.
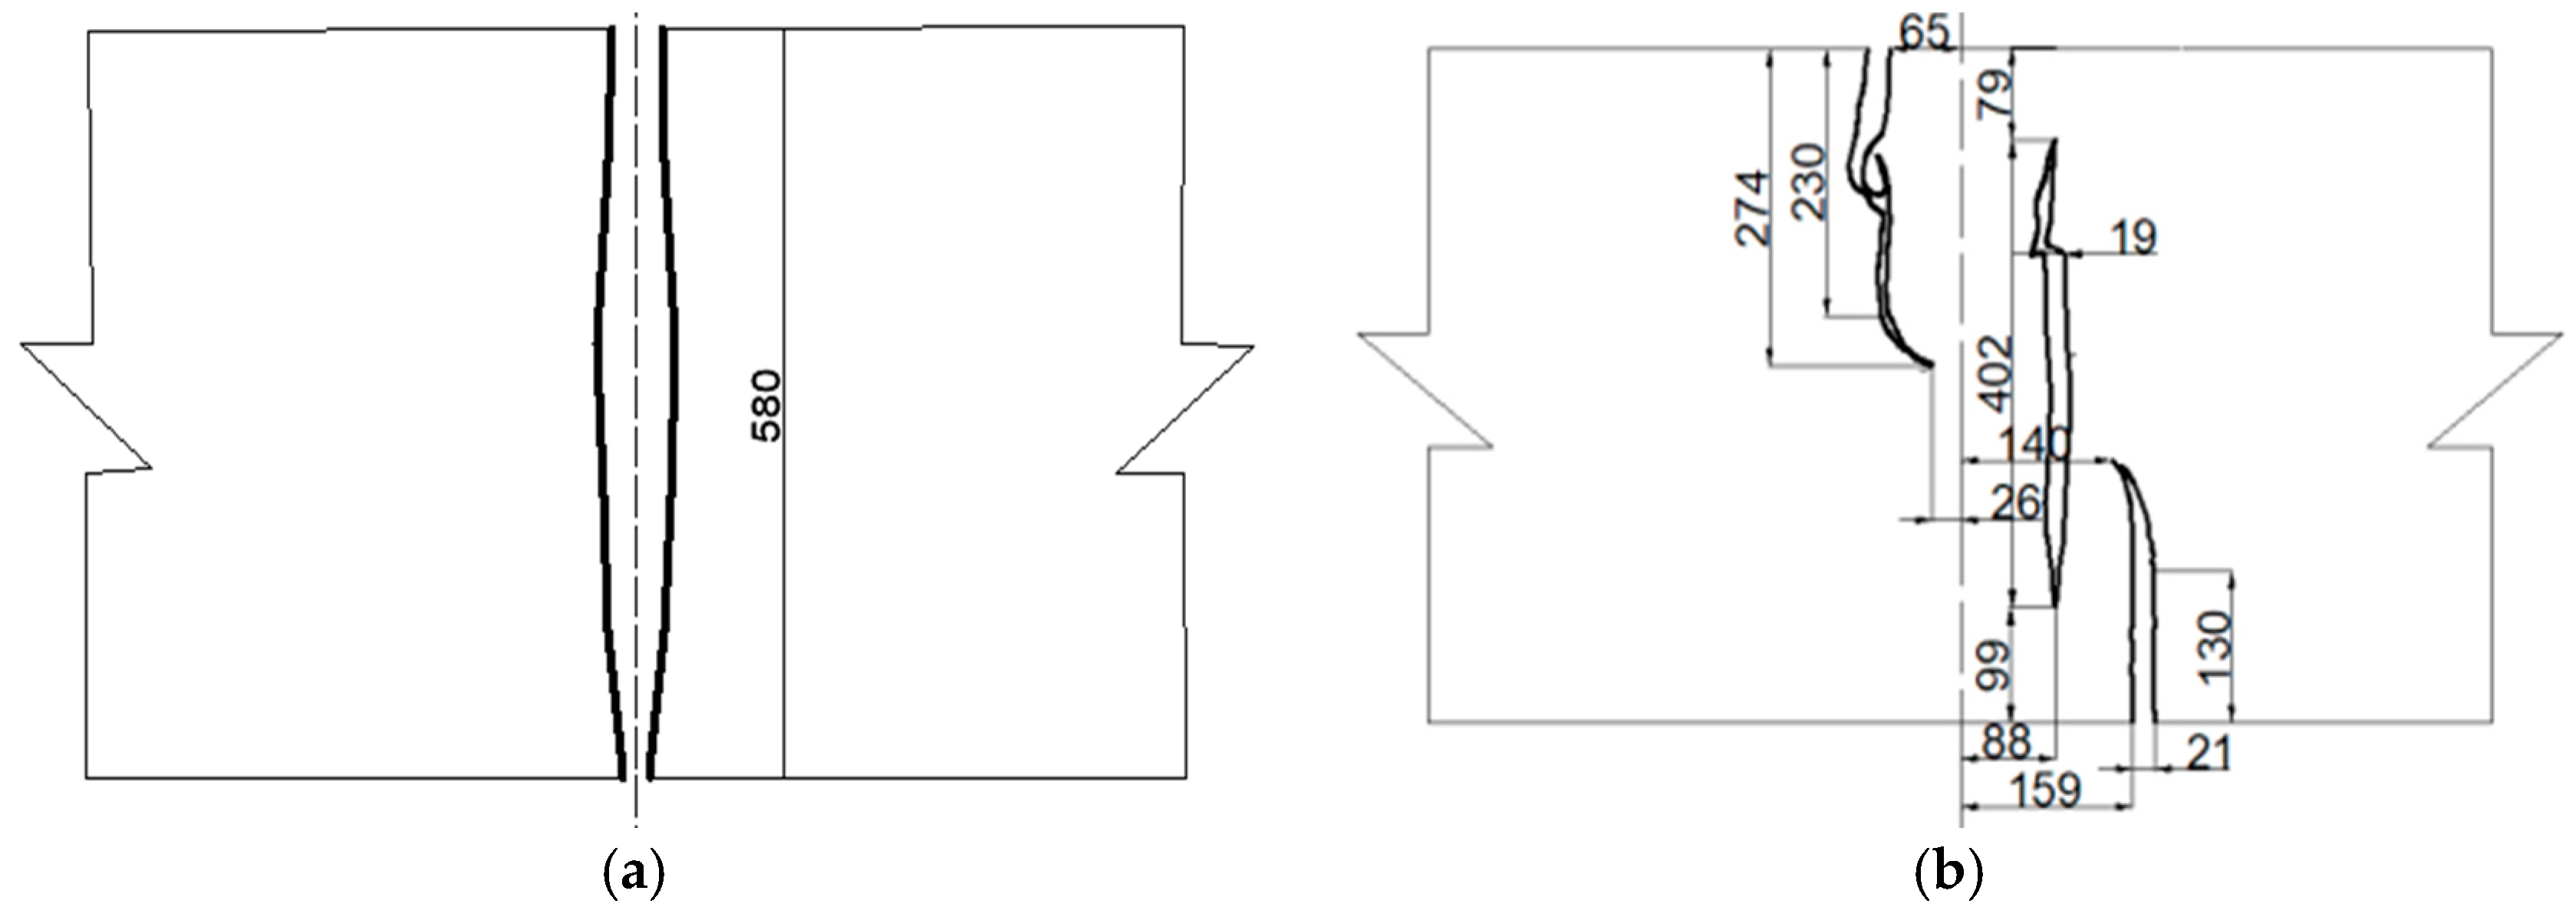
As illustrated in Figure 13, the field measurement results indicate that the crack size of the bottom plate following the failure of the test girder was as follows. It can be observed that the bottom plate of the 1# girder had a through crack with a length of 580 mm. The bottom plate of the second girder exhibited three cracks with lengths of 274 mm, 402 mm, and 193 mm, respectively. The cracks in the middle were located 79 mm and 99 mm from both ends of the bottom plate, respectively, and were situated a considerable distance from the web plate. This indicates that the pitting action resulted in the formation of a new fatigue source in the bottom plate.

4. Numerical Simulation

The numerical simulation process comprised two principal stages: firstly, the simulation of corrosion of the test girder under uniform corrosion conditions; and secondly, the simulation of crack propagation in the steel bottom plate under pitting corrosion.

4.1. Numerical Simulation of Test Girders under Uniform Corrosion

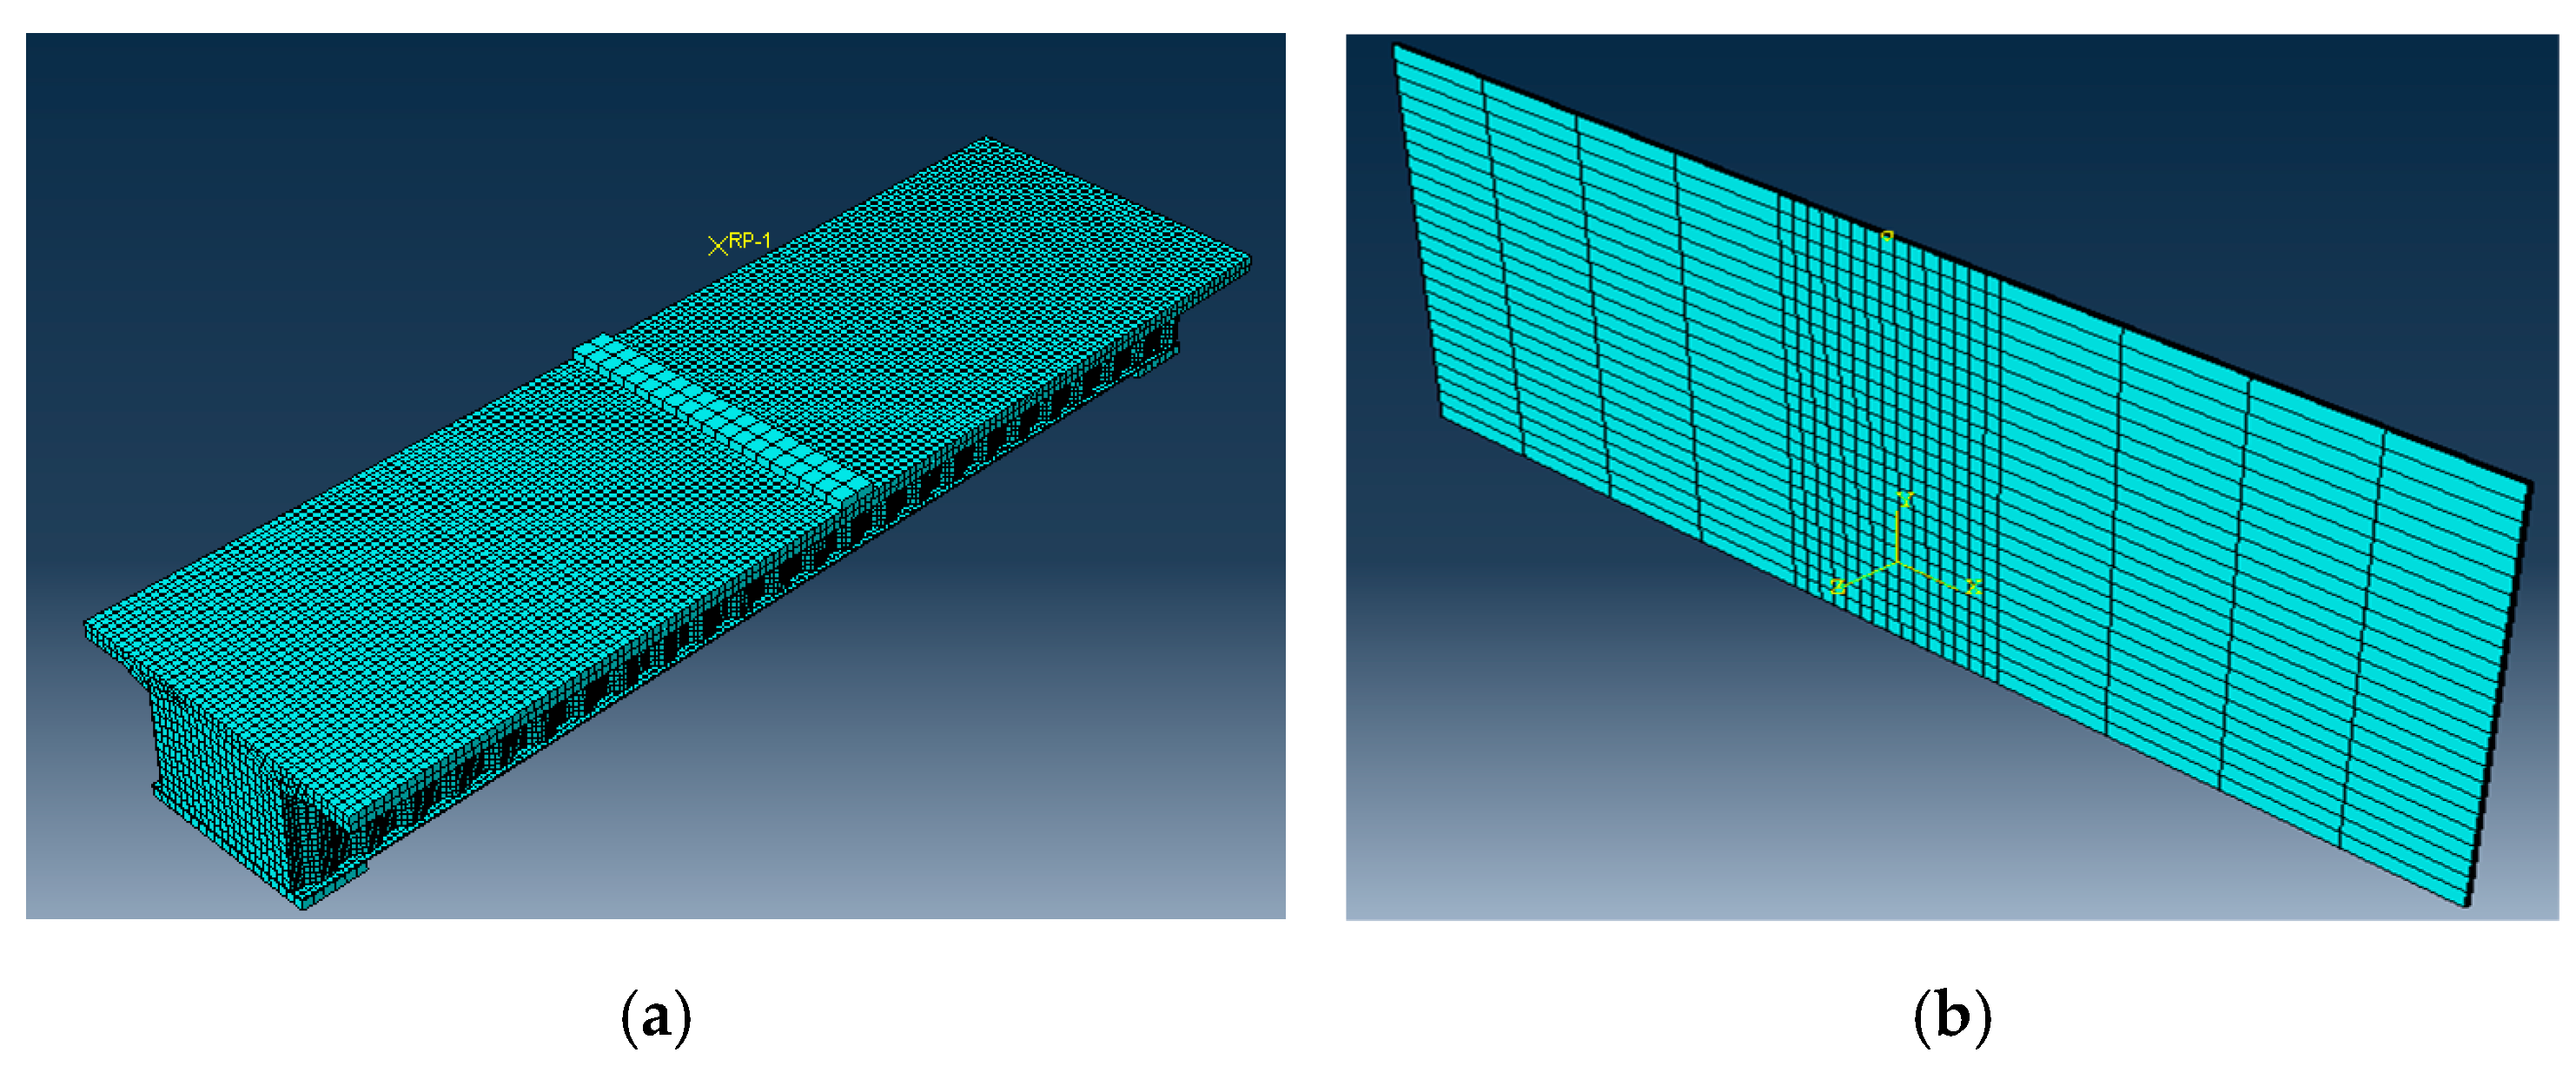
The test girder solid model was established using ABAQUS finite element software, and the resulting calculation data were imported into the fatigue calculation software Fe-safe for analysis. This was conducted in order to determine the failure location of the welded joints under uniform corrosion, and thus verify the conclusion that uniform corrosion will not affect the welded joints to become a fatigue source. In accordance with the analytical methodology outlined in Equation (1), the modeling approach entailed modifying the bottom plate thickness parameter. Prior to corrosion, the test girder bottom plate had a thickness of 5 mm, while after corrosion, it had a thickness of 4.55 mm. The remaining cross-sectional data are illustrated in Figure 2. The concrete and steel plate are represented with C3D8R units, while the reinforcement bars are represented with T3D2 units. The material parameters of concrete are modulus of elasticity 3.45 × 10⁵ MPa, Poisson’s ratio 0.1667, and the material parameters of steel are modulus of elasticity 2.06 × 10⁶ MPa, Poisson’s ratio 0.28. The resulting finite element model is depicted in Figure 14a.

4.2. Numerical Simulation of Crack Propagation in Steel Bottom Plate under Pitting Corrosion

The ABAQUS software stipulates that the crack tip can only terminate on the cell boundary. Consequently, if the actual bottom plate width is selected, the software will be unable to locate the crack tip in the calculation. In light of the location of the pitting fatigue source of the test girders after corrosion, the plate width was 420 mm, the plate length was 1000 mm, and the plate thickness was 4 mm. A crack solid extension finite element model was constructed with a depth of 55 mm and a crack depth of 0.5625 mm, situated in the center of the upper edge of the plate. The boundary conditions were fixed at one end, and the load was a tensile stress amplitude. According to Table 1, the stress amplitude of the loading conditions can be calculated using Equation (2) and the three-point loading girder stress formula. This is necessary for the crack extension region, where the mesh density should be increased. The number of load cycles can be calculated using the number of equivalent cycles, and the final number of equivalent cycles was 762,000. The model is shown in Figure 14b. The results may be employed to substantiate the precision and viability of the pitting fatigue crack extension calculation methodology.

4.3. Analysis of Numerical Simulation Results

4.3.1. Location of Fatigue Failure of Composite Girder under Uniform Corrosion

Based on the fatigue calculation results of the 1# and 2# test girder simulations, the maximum damage location of the test girders was determined as shown in Figure 15.
It can be seen from Figure 15 that the maximum damage location obtained from the simulation was consistent with the test results of the fatigue damage location of the weld joints of the two test girders, which were at the weld joints at the interface between the bottom plate and the web in the middle of the span, which indicates that the weld joints there were the weak points of the fatigue damage of the composite girders, which was in line with the general rule of the fatigue damage of welding of this type of box girder. The simulation results of the maximum damage location of the test girders of No. 1# and No. 2# were the same, which proves that the homogenous corrosion of the maximum damage location of 1# and 2# test girders was the same, which proves the correctness of the conclusion that uniform corrosion does not affect the welded joints to be the fatigue source. The damage to the 2# test girder was larger than that to the 1# test girder, which indicates that uniform corrosion increased the fatigue damage of the test girders under the same level of load and led to the early destruction of the test girders.

4.3.2. Expansion Patterns of Pitting Fatigue Cracks

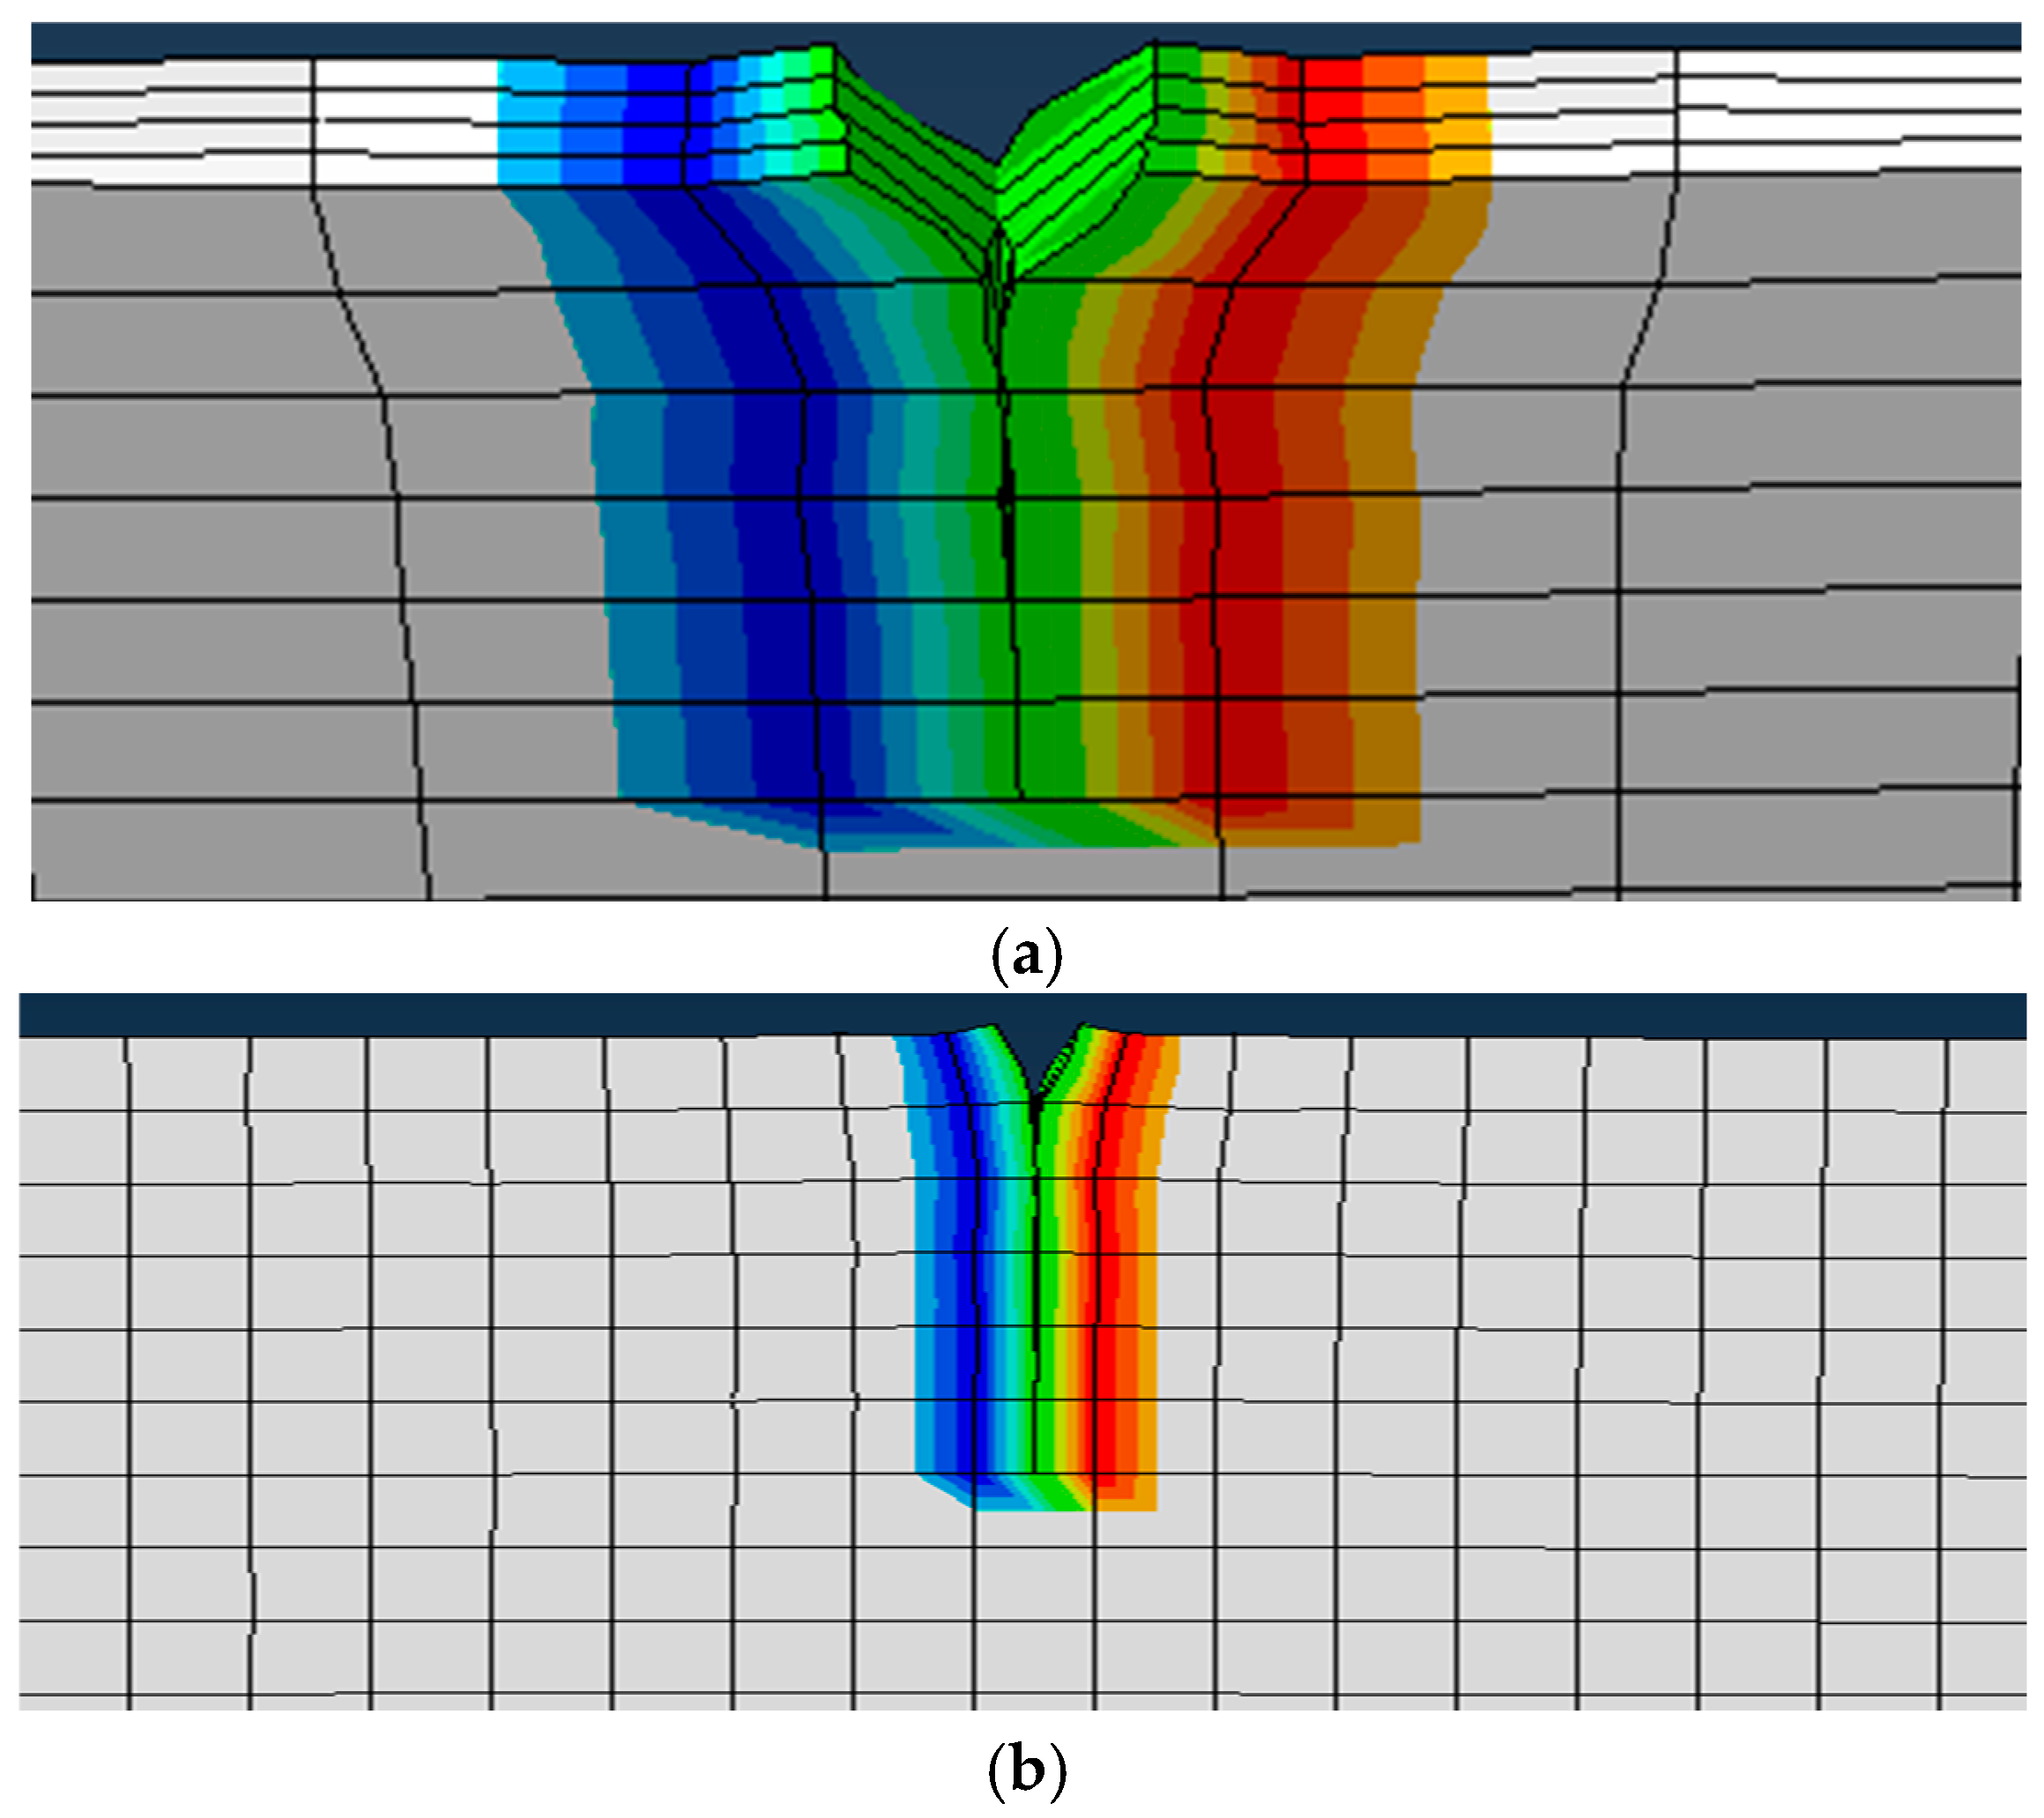
According to the results of pitting fatigue crack expansion of the test girder bottom plate simulated in Figure 14b, the expansion pattern of the pitting fatigue crack is as shown in Figure 16. It can be seen from this figure that pitting fatigue cracks started to expand from the pitting pit, and with the increase in the number of fatigue loading cycles the crack expanded along the plate thickness and plate width direction at the same time. When the tip of the crack expanded to the plate thickness, the crack gradually opened up, and the displacement and velocity of the opening increased. When it reached the specified number of cycles, the crack displacement stopped, and at the same time, stopped expanding in the direction of the plate width, and, combining with the test phenomenon, it can be seen that at this time the test girder combined with the test phenomenon, and it can also be seen that the fatigue failure of the test girder occurred at this time, indicating that the pitting fatigue failure of the test girder was determined by the thickness of the plate, i.e., the fatigue failure of the test girder occurred when the crack expanded to the plate thickness. The cycle number of numerical simulation adopted the equivalent cycle number, and the calculated cycle number of crack initiation was around 590,000 times, which is similar to the cycle number of crack initiation and rapid growth calculated in Table 2, with an error of 4.6%, which also shows the feasibility and accuracy of the calculation method.

5. Conclusions

The following conclusions can be drawn from the analysis:
(1)
Uniform corrosion will lead to greater stress in the test girder bottom plate and reduced performance of the composite girder in use; this is the same as the conclusions of references [12,13]. The stress growth of the test girder after corrosion is about 10%, the corrosion rate is 9%, the pitting non-uniformity coefficient is 1.25, and the relative corrosion life is 26.34 years.
(2)
The fatigue failure of the uncorroded test girder is due to weld joint fatigue failure; this is the same as the conclusions of references [8,9]. The fatigue failure of the test girder after corrosion is the coexistence of weld joint fatigue failure and pitting fatigue failure.
(3)
Uniform corrosion does not affect the weld at the interface as a fatigue source for fatigue failure, but it can lead to premature fatigue failure in the test girders, whereas pitting corrosion creates a new fatigue source.
(4)
The expansion of pitting fatigue cracks and the number of equivalent load cycles as a whole shows an exponential relationship, the rate of which is slow at the early stage, basically does not expand, in the middle of the expansion rate is gradually accelerated. In the latter part, the cracks begin to grow rapidly, and the component enters the rapid destruction stage. The final failure pattern of pitting fatigue cracks is that the crack length reaches the plate thickness, the crack opens, and the member is torn.
(5)
The fatigue life of the 1# test girder is 5,146,000 cycles, and the fatigue life of the 2# test girder is 4,598,000 cycles, which is a reduction of 10.65%. It indicates that the corrosive environment seriously affects the service life of the composite girder.

6. Discussion

(1)
The effect and significance of the non-uniform coefficient of pitting corrosion are as follows:
The non-uniform coefficient of pitting corrosion synthesizes the most important characteristic parameters of the two corrosion phenomena and provides a more concise description and expression method for the evaluation of the corrosion degree of bridge structures. If the pitting non-uniform coefficient is used with the corrosion rate and other parameters, it can not only provide a more concise description and expression method in the parameter calculation of fatigue cracks but also provide a more concise numerical description in the difficult evaluation of long-term corrosion planning of girders. Only two percentage values can be used to represent the corrosion degree of bridges. After perfecting the position function of pitting pit distribution, a series of mechanical calculation and failure location predictions can be made via combining these two percentage values. It can promote the prediction and evaluation of the long-term durability of girders.
(2)
The advantages and disadvantages of the finite element modeling method are as follows:
The advantage of this modeling method is that it is practical, concise and fast, and can be simple and clear for separate discussions about the impact of uniform corrosion and pitting on the fatigue failure; that is, it can be clear that these two kinds of corrosion phenomena of the respective influence of the law, but also through the pitting uneven coefficient of the integration of the analysis, are a kind of practical and fast simulation method. However, this modeling method can only determine the location of pitting pits according to the test results and cannot go beyond the experiment and accurately predict the damage point location of the girder structure.
(3)
Strategies to mitigate corrosion and protect the structure can be regarded as follows:
From the research results, the effect of corrosion on the fatigue performance of girders cannot be ignored; the main reason for this is that the corrosive environment will accelerate the corrosion of steel, and uniform corrosion and pitting corrosion in the natural environment generally exists at the same time, so these effects should be mitigated from the following three points: first of all, attention should be paid to environmental protection, as far as possible, from the service environment of the structure, such as bridges, to mitigate the corrosive ions content in the atmosphere or the ocean; secondly, corrosion-resistant materials should be used to build bridge structures, such as stainless steel, corrosion-resistant concrete, and other materials; and finally, the bridge structure should be taken to isolate the corrosion of protective measures, such as epoxy paint, polyurethane paint, fluorocarbon paint, epoxy resin, and other materials used to protect the bridge structure.
(4)
Methods to improve predictive modeling for structural health monitoring are as follows:
From the conclusions drawn from the modeling tests, numerical simulations, and theoretical calculation processes, it is clear that the changes in the stress data of the steel plate at the bottom of the test girder are due to corrosion. Uniform corrosion will cause the stress increase in the bottom steel plate of the test girder, and pitting corrosion will cause local defects in the bottom steel plate, so the change in the stress data of the bottom steel plate has an important role for the method of perfecting the prediction model for structural health monitoring. From the theoretical calculation process, the stress increase in the bottom steel plate is due to corrosion causing the thickness of the steel plate to become smaller, that is to say, corrosion will change the cross-section size and geometric parameters of the volume. Therefore, it is recommended to add two parameters, pitting non-uniformity coefficient and corrosion rate, into the prediction model of structural health monitoring, and to use the structural-measured data to compare with the calculated data during structural health monitoring. The changes in stress and other data due to corrosion are fully considered in the calculation process of health testing. For example, in the bearing capacity test, the corresponding section calculation of structural resistance should be multiplied using a multiplier related to the corrosion rate parameter, and it is recommended to take (1—corrosion rate); in the fatigue-related testing of the structure, the pitting unevenness coefficient should be included in the calculation of fatigue details, i.e., it is recommended to calculate the depth parameter of the pitting pits using the pitting unevenness coefficient, and to add this depth parameter to the initial length of the crack.
(5)
The direction of development of this research can be regarded as follows:
First, the current research work is mainly a study of the effect of corrosion on the fatigue performance of the structure, while the study on the effect of corrosion on the fatigue details of such beams is not yet complete. Therefore, studies on the change in fatigue detail properties after corrosion, such as the mechanical and microscopic properties of welded joints after corrosion, and the effect of the change in these properties on the overall structure, should be supplemented in the later studies. Secondly, more advanced simulation means should be adopted in the simulation method, and the method of multiphysical field coupling should be used for simulation in modeling, for example, the change in structural properties under corrosive environment, and electrochemical reactions can be included in the simulation means. Of course, the control equation and parameter selection of the electrochemical reaction are also included here. Finally, ultrasonic flaw detection, X-ray flaw detection, and more advanced microcrack extension observation means should be added to the test means, which can provide more powerful data support for the establishment of theoretical and numerical models and can also provide more accurate guarantee for the selection of parameters.

Author Contributions

Formal analysis, G.W.; Investigation, X.J.; Writing—original draft, P.H. All authors have read and agreed to the published version of the manuscript.

Funding

This research was funded by Gansu Province Major Science and Technology Special Plan Project (No. 19ZD2GA002); Research on the Lifetime Design and Application Technology of Highway Concrete Bridges in Gansu Province (No. 2020 05); and Gansu Provincial Science and Technology Program Project Funding (No. 21JR7RA306). The above project fund is supported by: Gansu Provincial Department of Transportation.

Data Availability Statement

Conflicts of Interest

The authors declare no conflict of interest.

References

  1. Chen, Y.; Wang, Y. Design and Construction of Prestressed Concrete Bridges with Corrugated Steel Web Plates; Beijing Renmin Tong Publishing House: Beijing, China, 2009. [Google Scholar]
  2. Zhang, Z. Research on Bending Mechanical Properties and Model Test of Steel Base Plate Wave Web-Concrete Combined Box Girder. Ph.D. Thesis, Lanzhou Jiaotong University, Lanzhou, China, 2023. [Google Scholar]
  3. Idiart, A.E.; Carlos, M.L.; Ignacio, C. Chemo-Mechanical Analysis of Concrete Cracking and Degradation Due to External Sulfate Attack:A Meso-Scale Model. Cem. Concr. Compos. 2011, 33, 411–423. [Google Scholar] [CrossRef]
  4. Kotaki, N.; Ichikawa, A.; Sasaki, E.; Miki, C.; Hosaka, T. A proposal of steel girder bridges with of ripple web and their fatigue performance. Proc. Jpn. Soc. Civ. Eng. 2004, 2004, 233–244. [Google Scholar] [CrossRef] [PubMed]
  5. Saki, Y.; Yamada, S.; Sato, T. Fatigue Test on the Joint in the Corrugated Steel Web PC Box Girder; Topy Steel Structures Co., Ltd.: Toyohashi, Japan, 2004. [Google Scholar]
  6. Wang, Z.; Wang, Q.; Chen, Y.; Shi, X.; Ouyang, W. Research progress on fatigue characteristics of corrugated steel web girders. Highw. Transp. Sci. Technol. 2010, 27, 64–71. [Google Scholar]
  7. Yuan, S.; Dong, J.; Wang, Q. Fatigue damage analysis of corrugated steel web combined box girder based on finite element. J. Sichuan Univ. 2016, 48, 77–82. [Google Scholar]
  8. Liu, W. Experimental Research on Fatigue Damage of Corrugated Steel Web Combined Box Girder. Ph.D. Thesis, Lanzhou Jiaotong University, Lanzhou, China, 2018. [Google Scholar]
  9. Chen, P. Research on Fatigue Damage and Model Test of Combined Box Girder with Corrugated Web and Steel Bottom Plate. Ph.D. Thesis, Lanzhou Jiaotong University, Lanzhou, China, 2021. [Google Scholar]
  10. Li, P. Research on Fatigue Test of Corrugated Steel Web Combined Box Girder. Ph.D. Thesis, Lanzhou Jiaotong University, Lanzhou, China, 2018. [Google Scholar]
  11. Song, S. Fatigue Performance Analysis and Model Test Research of Corrugated Web Steel Bottom Plate Combination Box Girder. Ph.D. Thesis, Lanzhou Jiaotong University, Lanzhou, China, 2021. [Google Scholar]
  12. Zhou, C. Effect of Chloride Salt Corrosion on the Fatigue Performance of Combined Box Girder with Corrugated Web and Steel Bottom Plate and Model Test Research. Ph.D. Thesis, Lanzhou Jiaotong University, Lanzhou, China, 2023. [Google Scholar]
  13. Ning, X. Study on Fatigue Damage and Modeling Test of Combined Box Girder with Wave Web and Steel Bottom Plate under Chloride Salt Corrosion Condition. Ph.D. Thesis, Lanzhou Jiaotong University, Lanzhou, China, 2023. [Google Scholar]
  14. Peng, K.; Li, L.; Pei, B. Fatigue Analysis of girder with Corrugated Steel Webs Using Hot Spot Stress Method. J. Hunan Univ. (Nat. Sci.) 2018, 45, 74–82. [Google Scholar] [CrossRef]
  15. Huang, J.; Wang, M.; Yang, H.; Li, L. Study on fatigue analysis of girder with corrugated steel webs using notch stress method. J. Railw. Sci. Eng. 2021, 18, 425–431. [Google Scholar] [CrossRef]
  16. JB/T 7901-1999; Test Method for Homogeneous Corrosion Total Immersion of Metallic Materials in Laboratory. State Bureau of Machinery Industry: Beijing, China, 1999.
  17. Liu, F. Research on the Resistance of Ultra-High Performance Concrete to Chloride Salt Erosion under Dry and Wet Cycling. Ph.D. Thesis, Xi’an University of Technology, Xi’an, China, 2023. [Google Scholar]
  18. JTG D64-2015; Design Specification for Highway Steel Structure Bridges. People’s Transportation Press: Beijing, China, 2015.
  19. Yu, D. Study on Corrosion and Its Influence on Mechanical Properties of Steel Bridge Structure. Ph.D. Thesis, East China Jiaotong University, Nanchang, China, 2016. [Google Scholar]
  20. Zhang, X. Mechanics of Materials; China Machine Press: Beijing, China, 2022. [Google Scholar]
  21. Yu, X. Corrosion Fatigue Test on Bridge Parallel Steel Wires and Fatigue Life Assessment of Suspenders. Ph.D. Thesis, Southeast University, Dhaka, Bangladesh, 2019. [Google Scholar] [CrossRef]
  22. Su, H.; Zhao, L.; Wu, J.; Du, J. Study on fatigue performance of butt welds of corroded Q345qDNH weathering steel. J. Build. Struct. 2021, 42 (Suppl. 2), 473–481. [Google Scholar]
  23. Southwell, C.R.; Buitman, J.D.; Hummer, J.C. Estimating the Service Life of Steel in Seawater; Seawater Corrosion Handbook; Noyes Data Corporation: Park Ridge, NJ, USA, 1979; pp. 374–387. [Google Scholar]
  24. Kong, Z.Z.; Xu, S.H.; Liu, D.F. Study on post-corrosion performance of welded joints in steel structures. J. North China Inst. Water Resour. Hydropower 2010, 31, 46–49. [Google Scholar]
  25. Albrecht, P.; Naeemi, A.H. Performance of Weathering Steel in Bridges; NCHRP: Washington, DC, USA, 1984. [Google Scholar]
  26. Liang, C.; Hou, W. Corrosion study of carbon steel and low alloy steel after 16 years of atmospheric exposure. Chin. J. Corros. Prot. 2005, 25, 2–7. [Google Scholar]
  27. Ding, S.; Sun, L. Fracture Mechanics; Machinery Industry Press: Beijing, China, 1997. [Google Scholar]
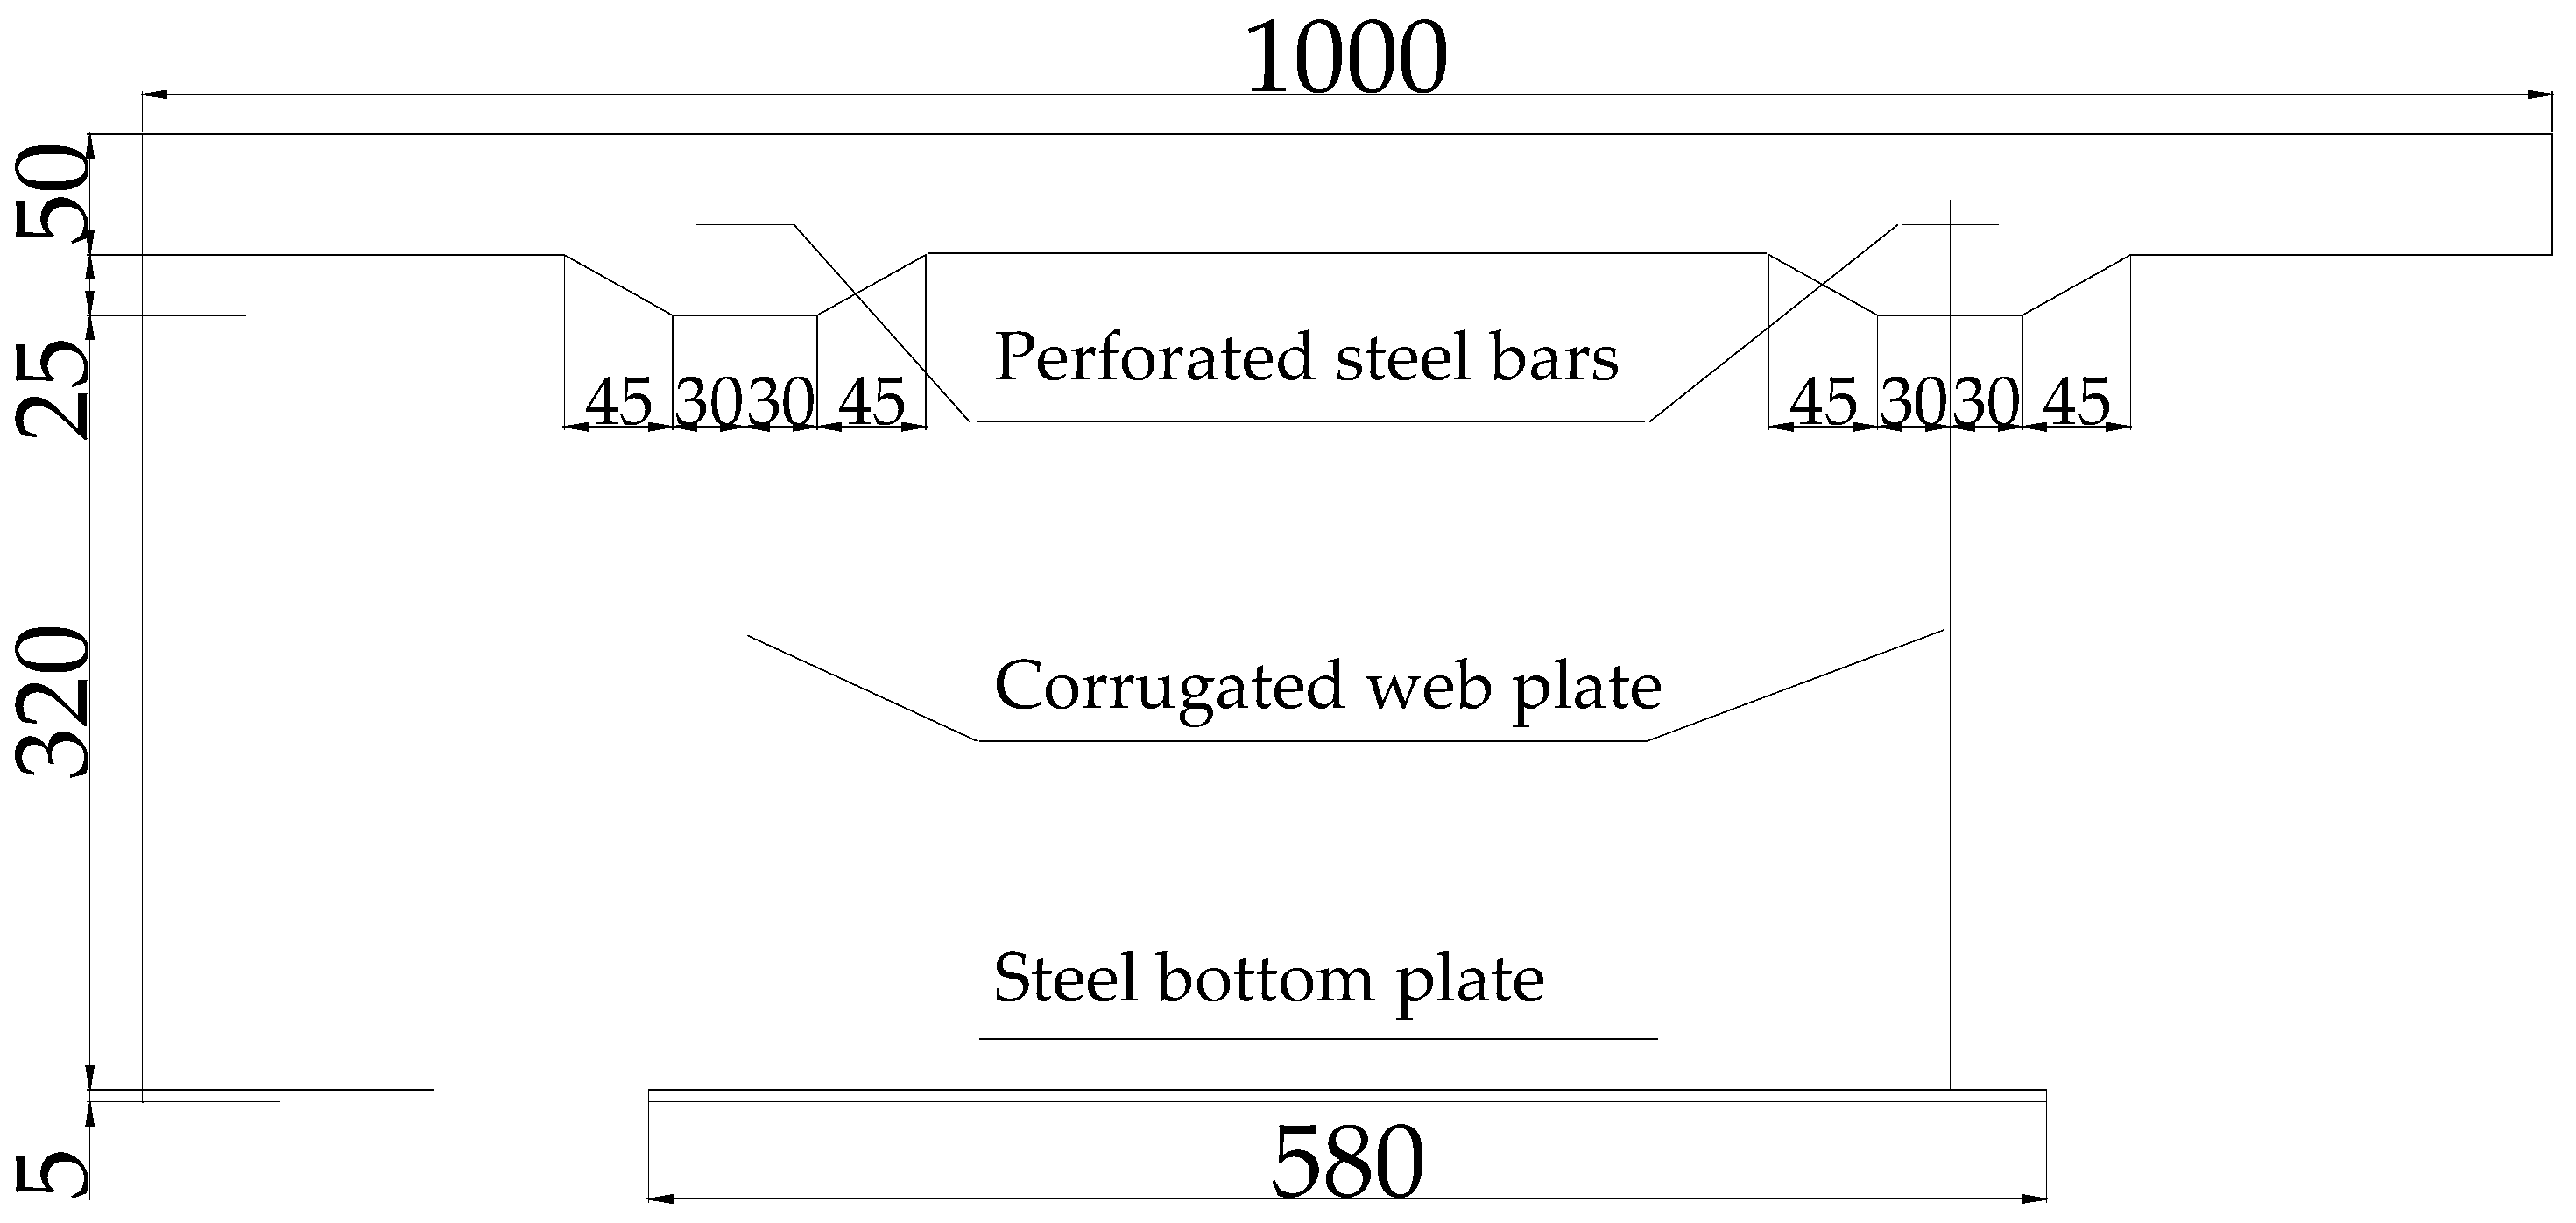
Figure 1. Cross-sectional dimension of geometric modeling (unit: mm).
Buildings 14 03221 g001
Figure 2. Unit ripple size of web plate (unit: mm).
Buildings 14 03221 g002
Figure 3. Schematic diagram of shear connection parts.
Buildings 14 03221 g003
Figure 4. Girder corrosion test.
Buildings 14 03221 g004
Figure 5. Girder fatigue test. (a) Stress–strain sampling system. (b) Fatigue loading system. (c) Test girder loading.
Buildings 14 03221 g005
Figure 6. Layout of strain gauge across the fracture surface.
Buildings 14 03221 g006
Figure 7. Surface of the girder after the corrosion test. (a) Top plate salt crystallization. (b) The corrugated web has corroded and peeling paint. (c) Bottom plate corrosion.
Buildings 14 03221 g007aBuildings 14 03221 g007b
Figure 8. Corrosion of reinforcement.
Buildings 14 03221 g008
Figure 9. Bottom plate stress. (a) Fatigue characteristic test stresses. (b) Stresses for fatigue failure testing.
Buildings 14 03221 g009
Figure 10. Test girder failure pattern and fatigue source. (a) Cracks at the bottom of the girder. (b) Cracks in the left web. (c) Right web crack. (d) Fatigue source.
Buildings 14 03221 g010aBuildings 14 03221 g010b
Figure 11. a-N curve of test girder 2#.
Buildings 14 03221 g011
Figure 12. Test girder fatigue crack development stage. (a) The 1# test girder fatigue crack development stage. (b) The 2# test girder fatigue crack development stage.
Buildings 14 03221 g012aBuildings 14 03221 g012b
Figure 13. Crack size. (a) Crack size of 1# girder bottom plate. (b) Crack size of 2# girder bottom plate.
Buildings 14 03221 g013
Figure 14. Finite element model. (a) Finite element model of girder. (b) Finite element model of crack propagation.
Buildings 14 03221 g014
Figure 15. Simulation results of maximum failure location. (a) 1# test girder damage location. (b) 2# test girder damage location.
Buildings 14 03221 g015
Figure 16. Simulation results of pitting crack morphology. (a) Opening patterns of pitting fatigue cracks. (b) Pitting cracks develop laterally.
Buildings 14 03221 g016
Table 1. Load stages for fatigue failure test.
Load RatingMedian Load (kN)Load Magnitude (kN)Number of Cycles (10,000)
1404840
2496440
3578240
4649840
57211440
68012840
78614430
89016020
99617620
10100192failure
Table 2. Corrosion years.
Point Deep Pit Depth Prediction ModelModel EquationFixed Number of Years
Biometrics ModelSouthwell [23] d = 0.076 + 0.038 t 24.64
justice for all [24] d = 0.095 t + 0.079 9.83
Index ModelAlbrecht and Naeemi [25] d = A t B 29.11
Liang C F and Hou W T [26] d = A t n 25.27
Table 3. Pitting fatigue crack length and number of load cycles.
Loading Amplitude
(kN)
Number of Loads N (million)Crack Length a
(mm)
nini + N
370.870.870.5626
480.491.370.5629
641.562.930.5648
824.217.130.5745
988.5815.710.6105
11415.7131.420.7401
12824.9756.401.2553
14419.8076.204.5489
Disclaimer/Publisher’s Note: The statements, opinions and data contained in all publications are solely those of the individual author(s) and contributor(s) and not of MDPI and/or the editor(s). MDPI and/or the editor(s) disclaim responsibility for any injury to people or property resulting from any ideas, methods, instructions or products referred to in the content.