
Effect of Corrosion on Fatigue Failure of Composite Girders with Corrugated Web on Steel Bottom Plate

Abstract
:1. Introduction
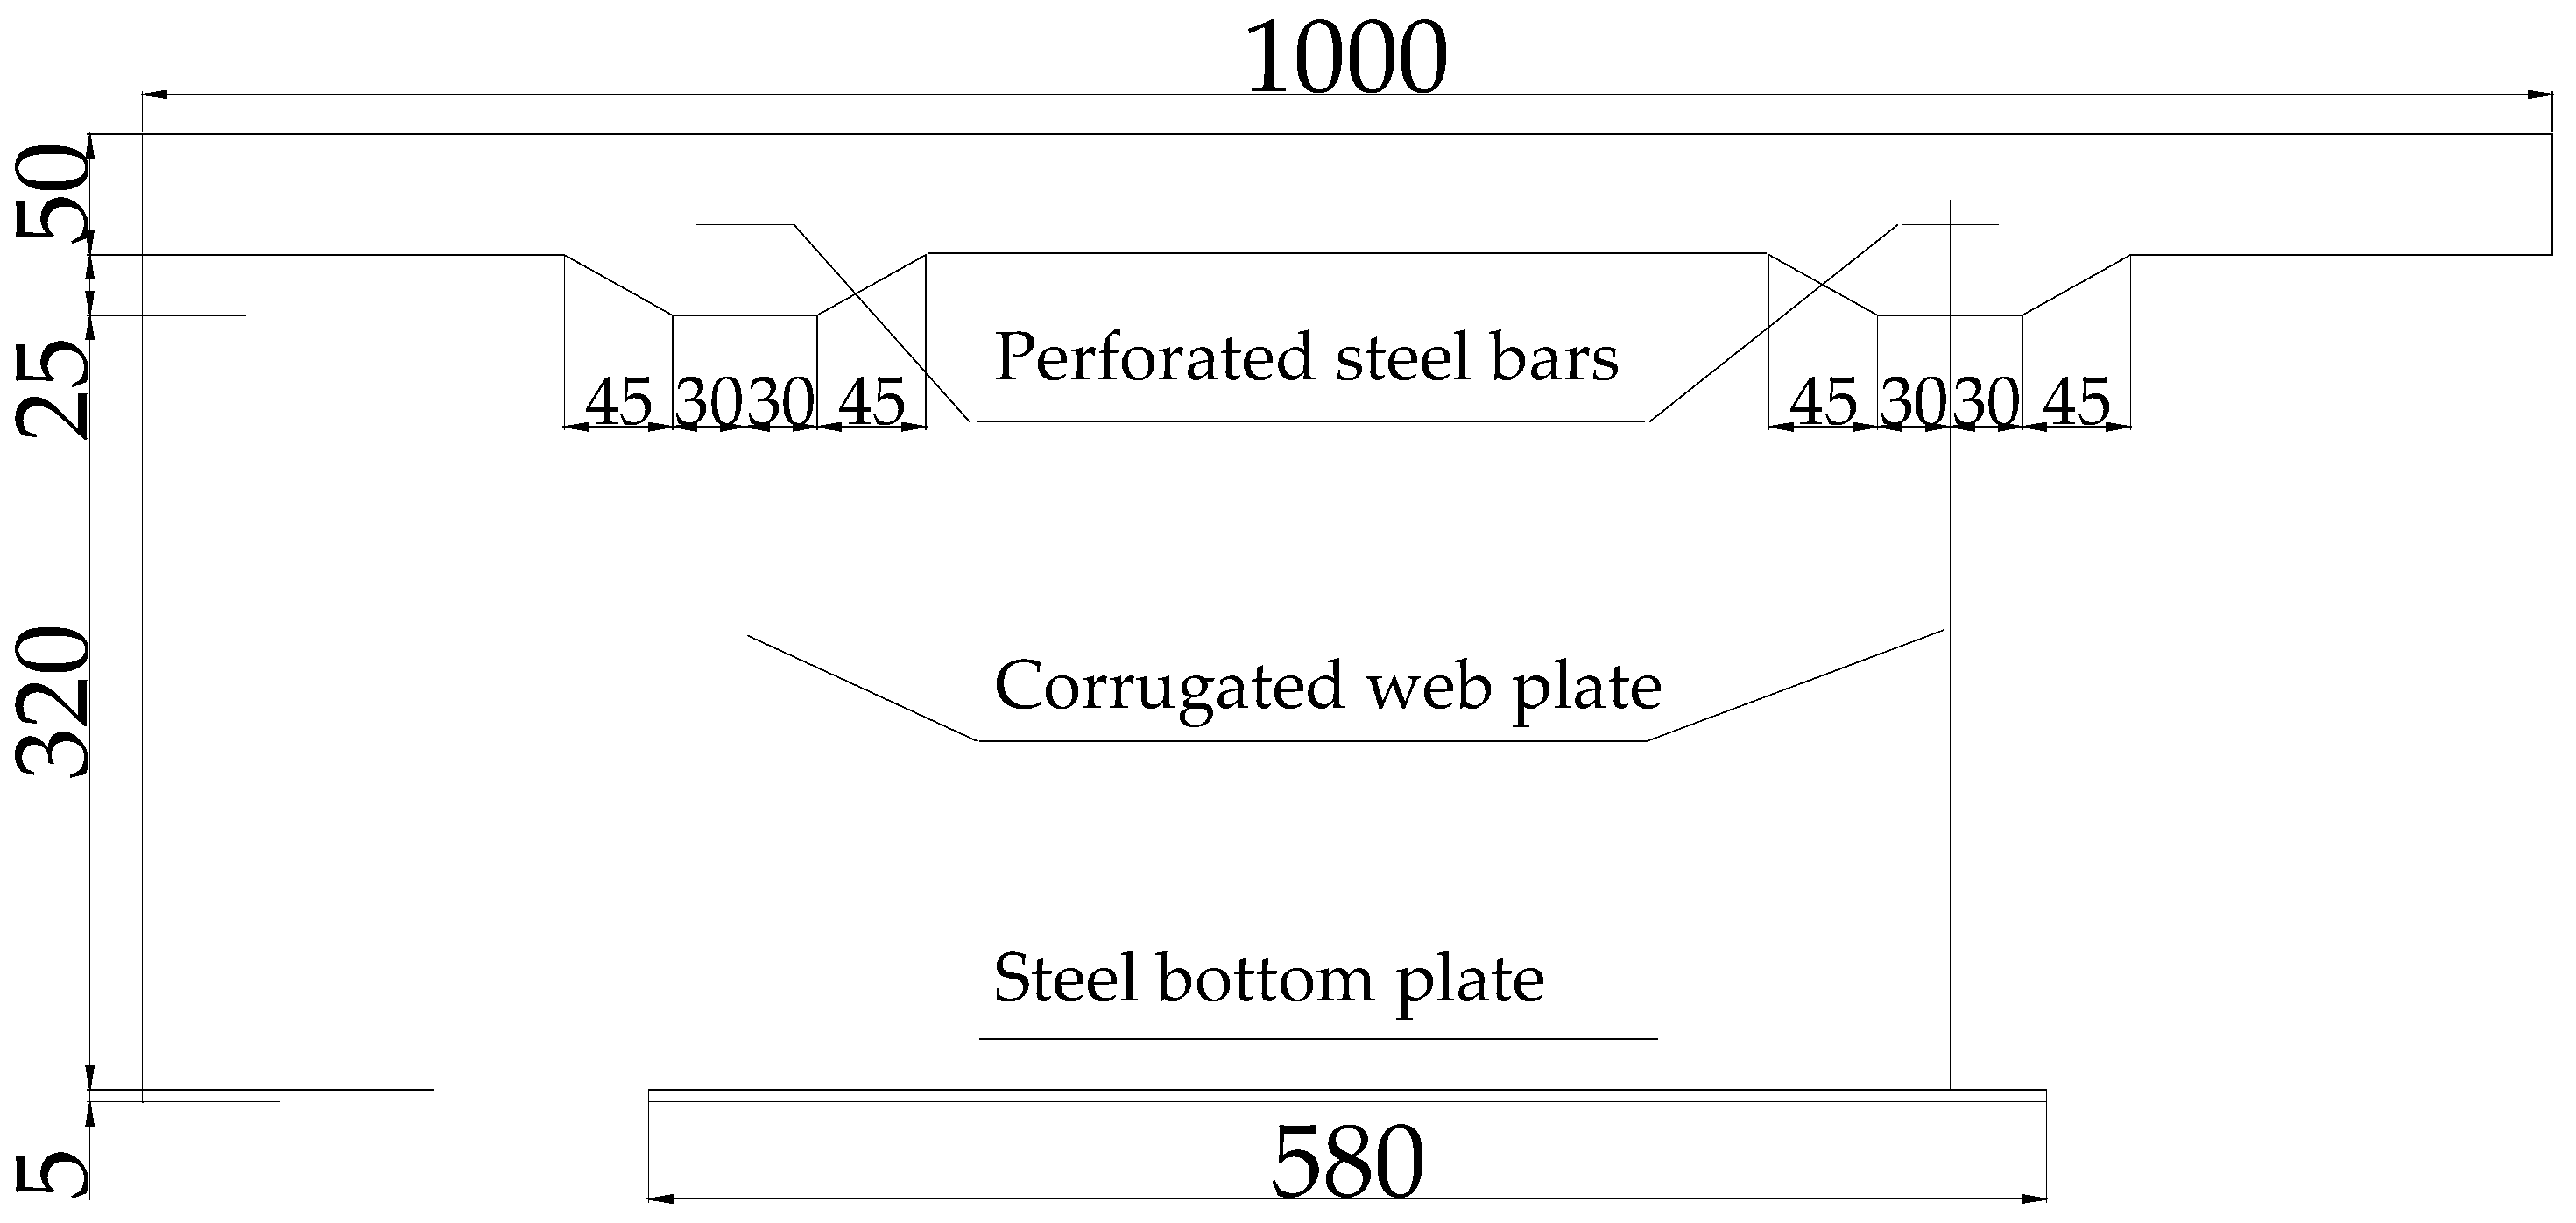
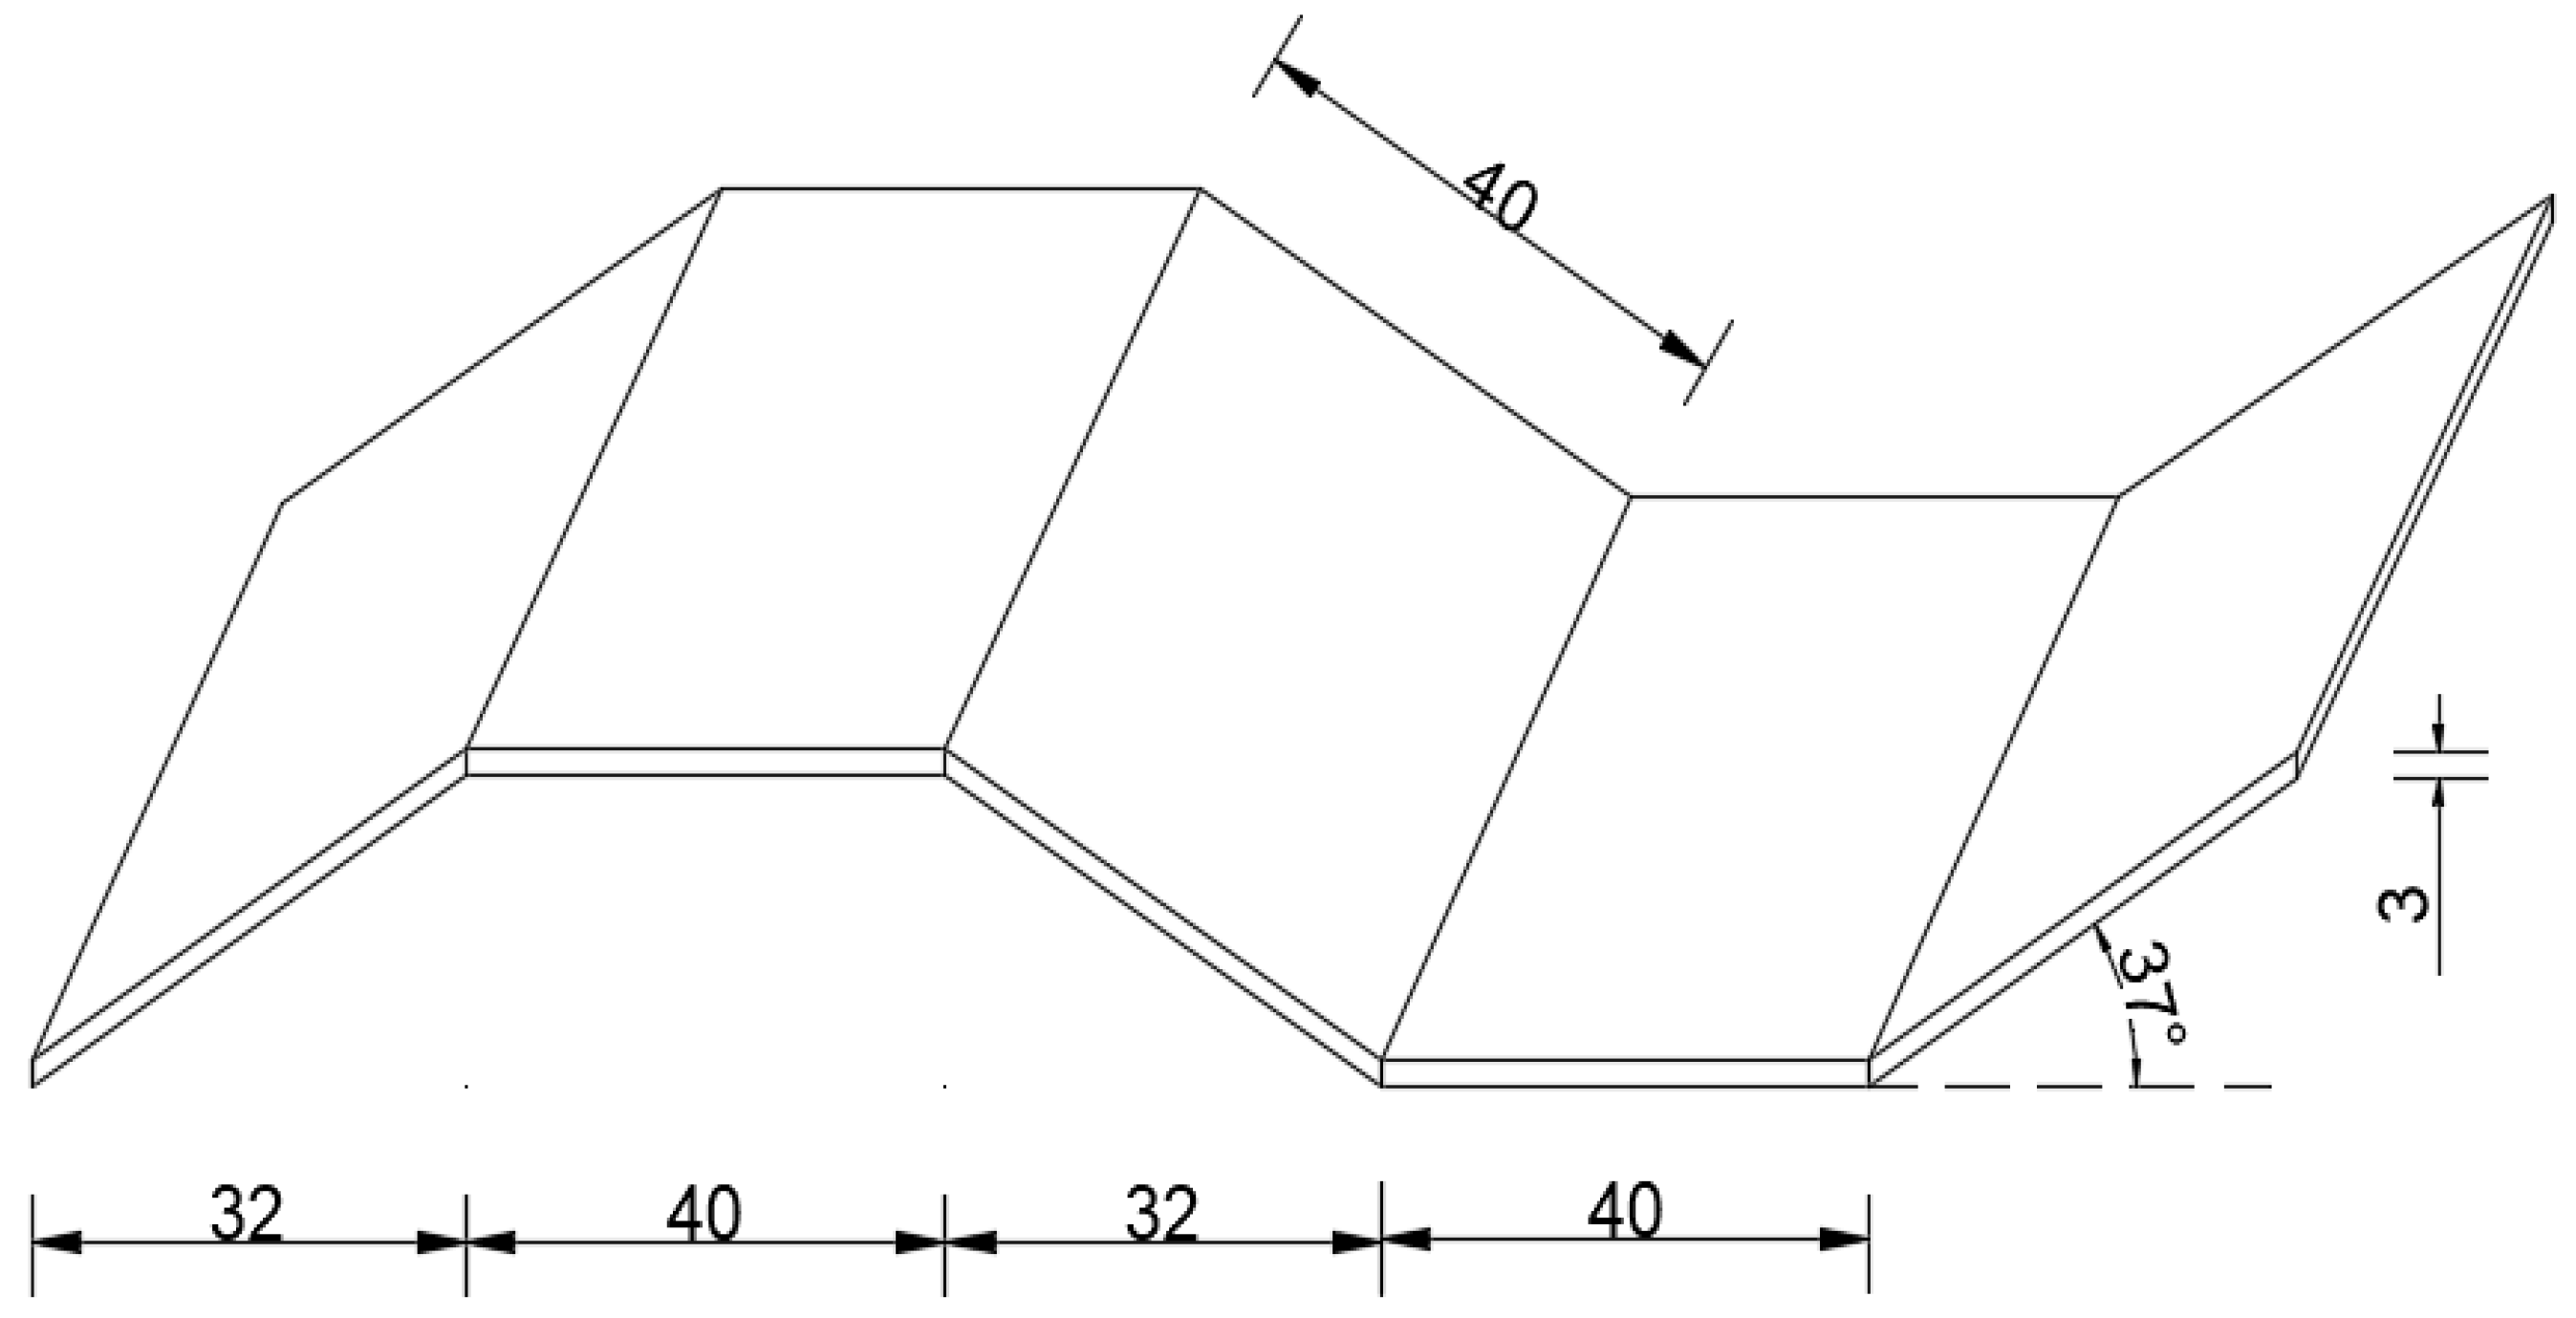
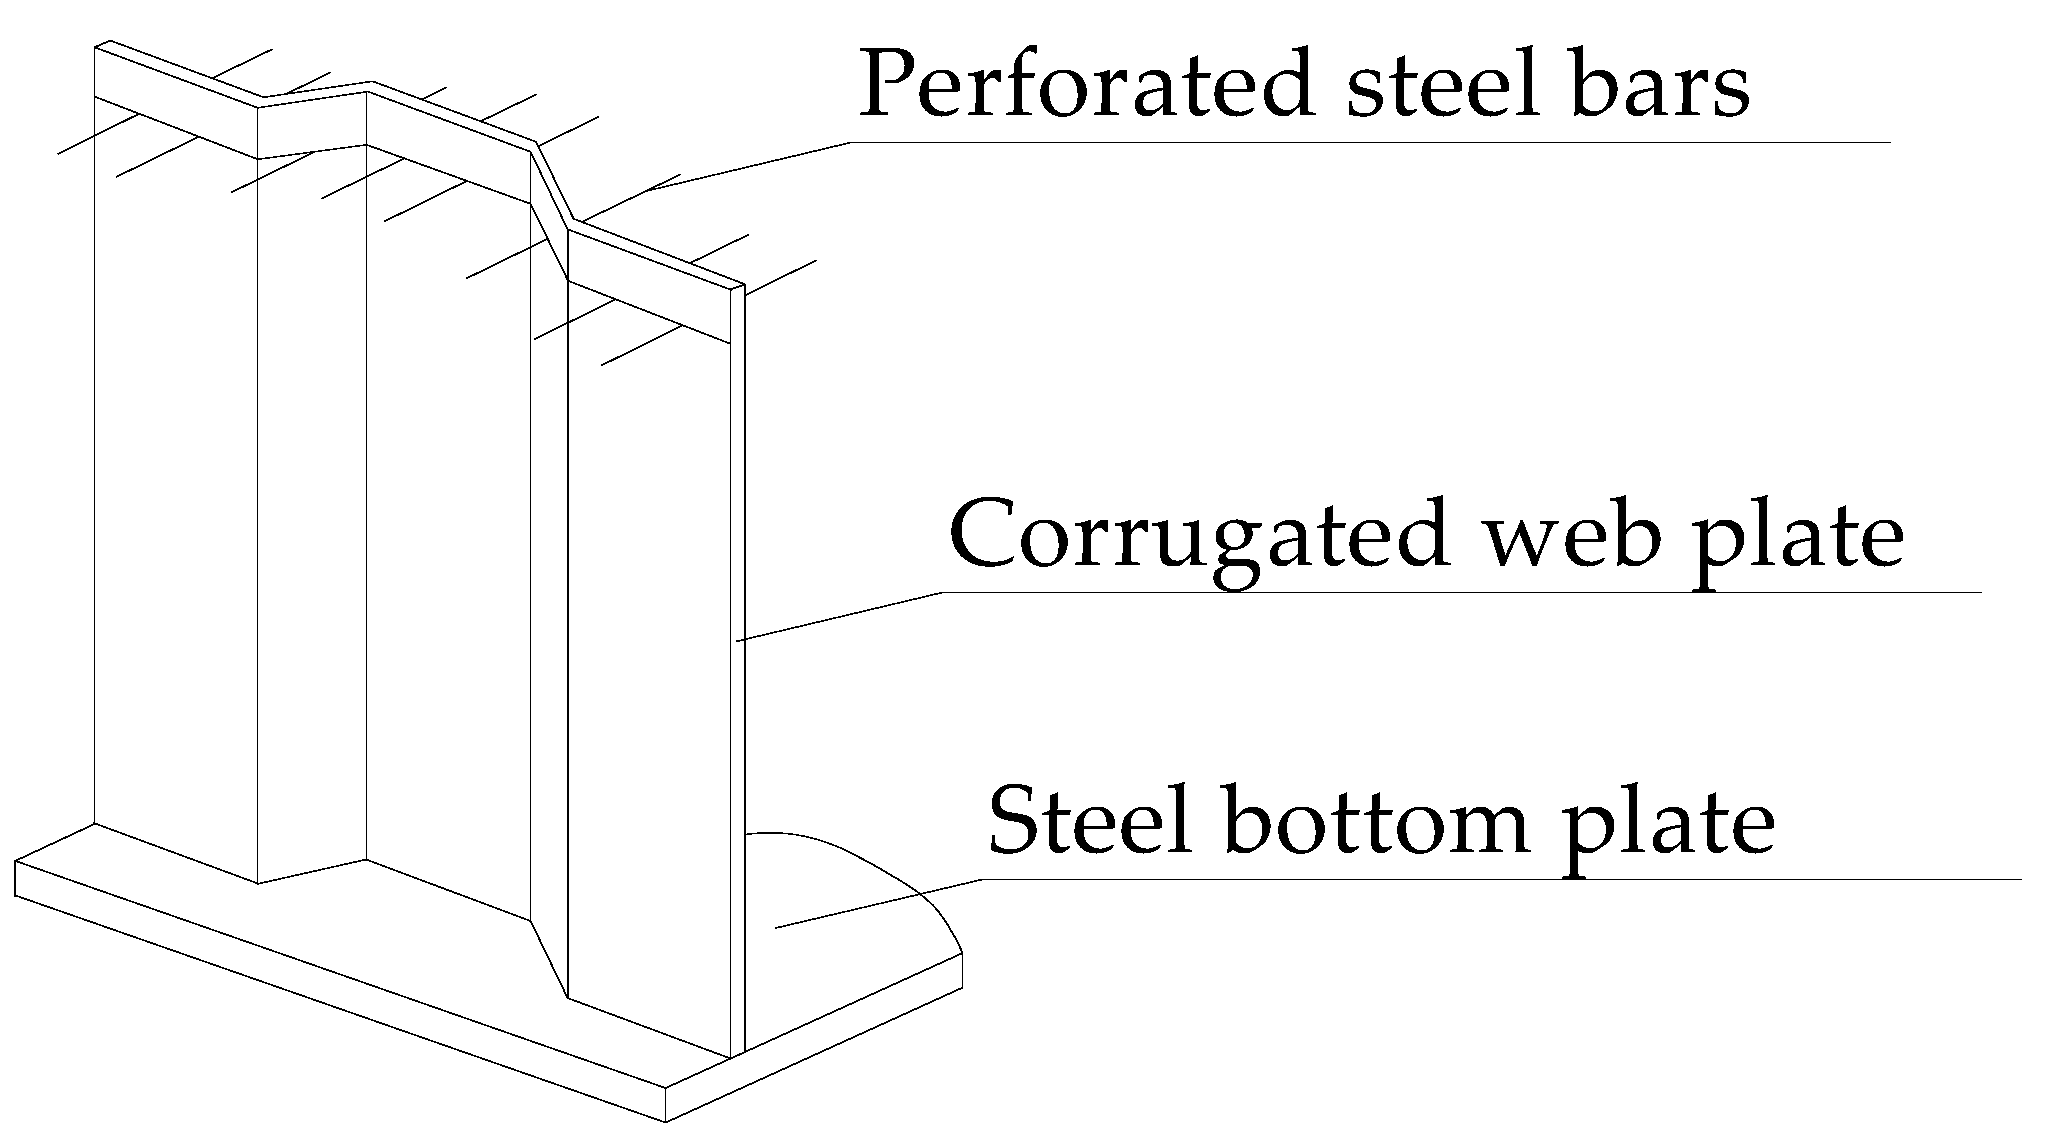
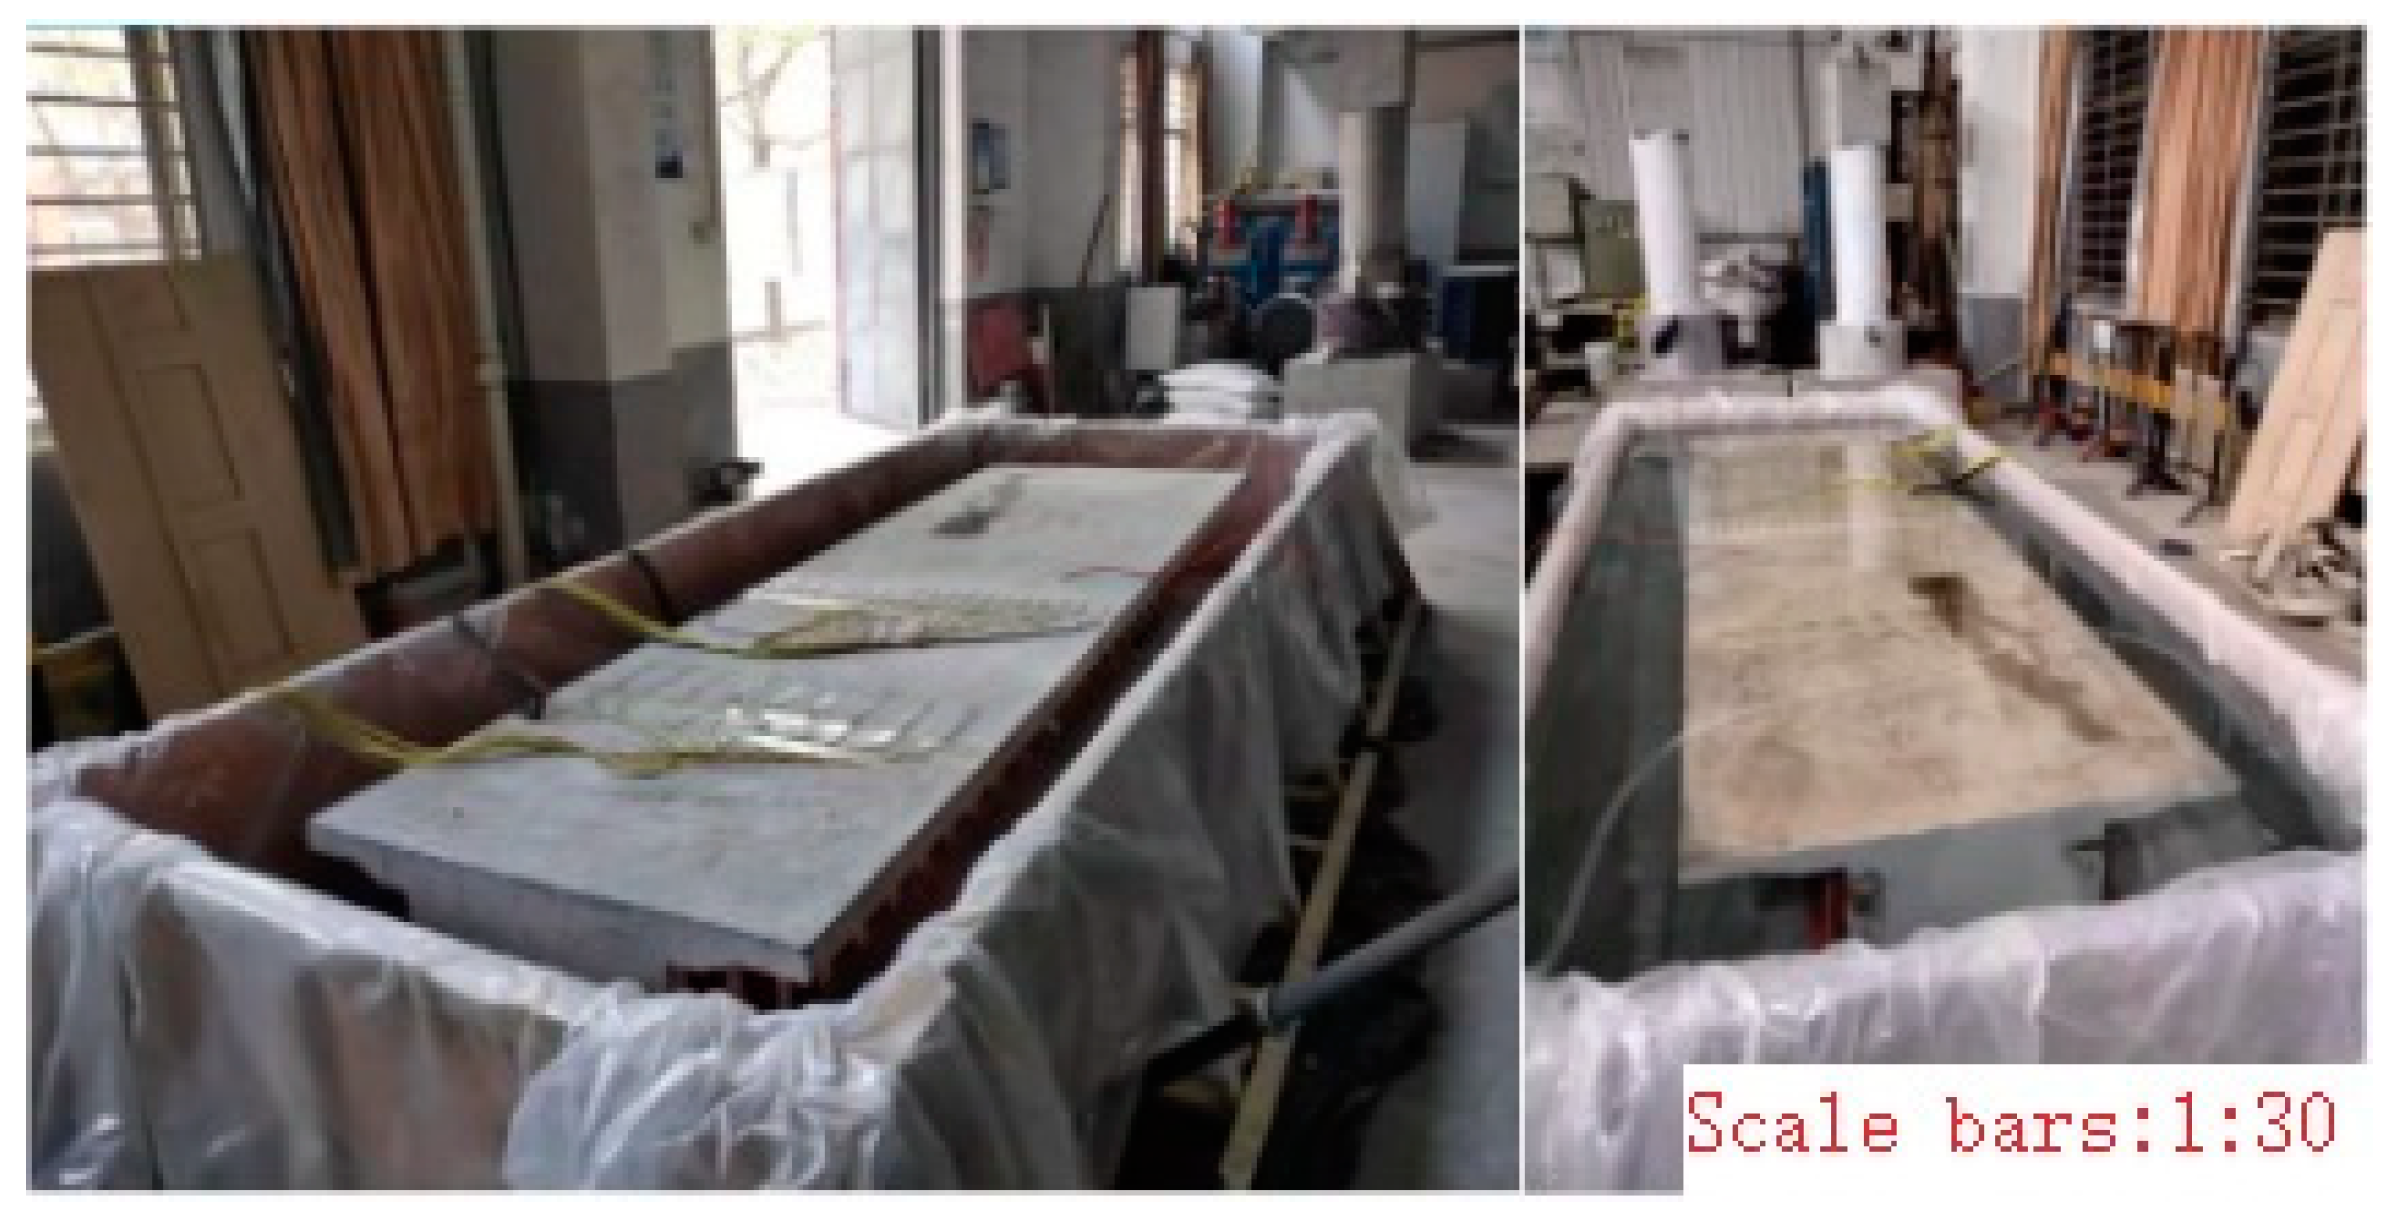
2. Model Test
2.1. Material and Dimensional Parameters
2.2. Salt Corrosion Test
2.3. Test Girder Loading
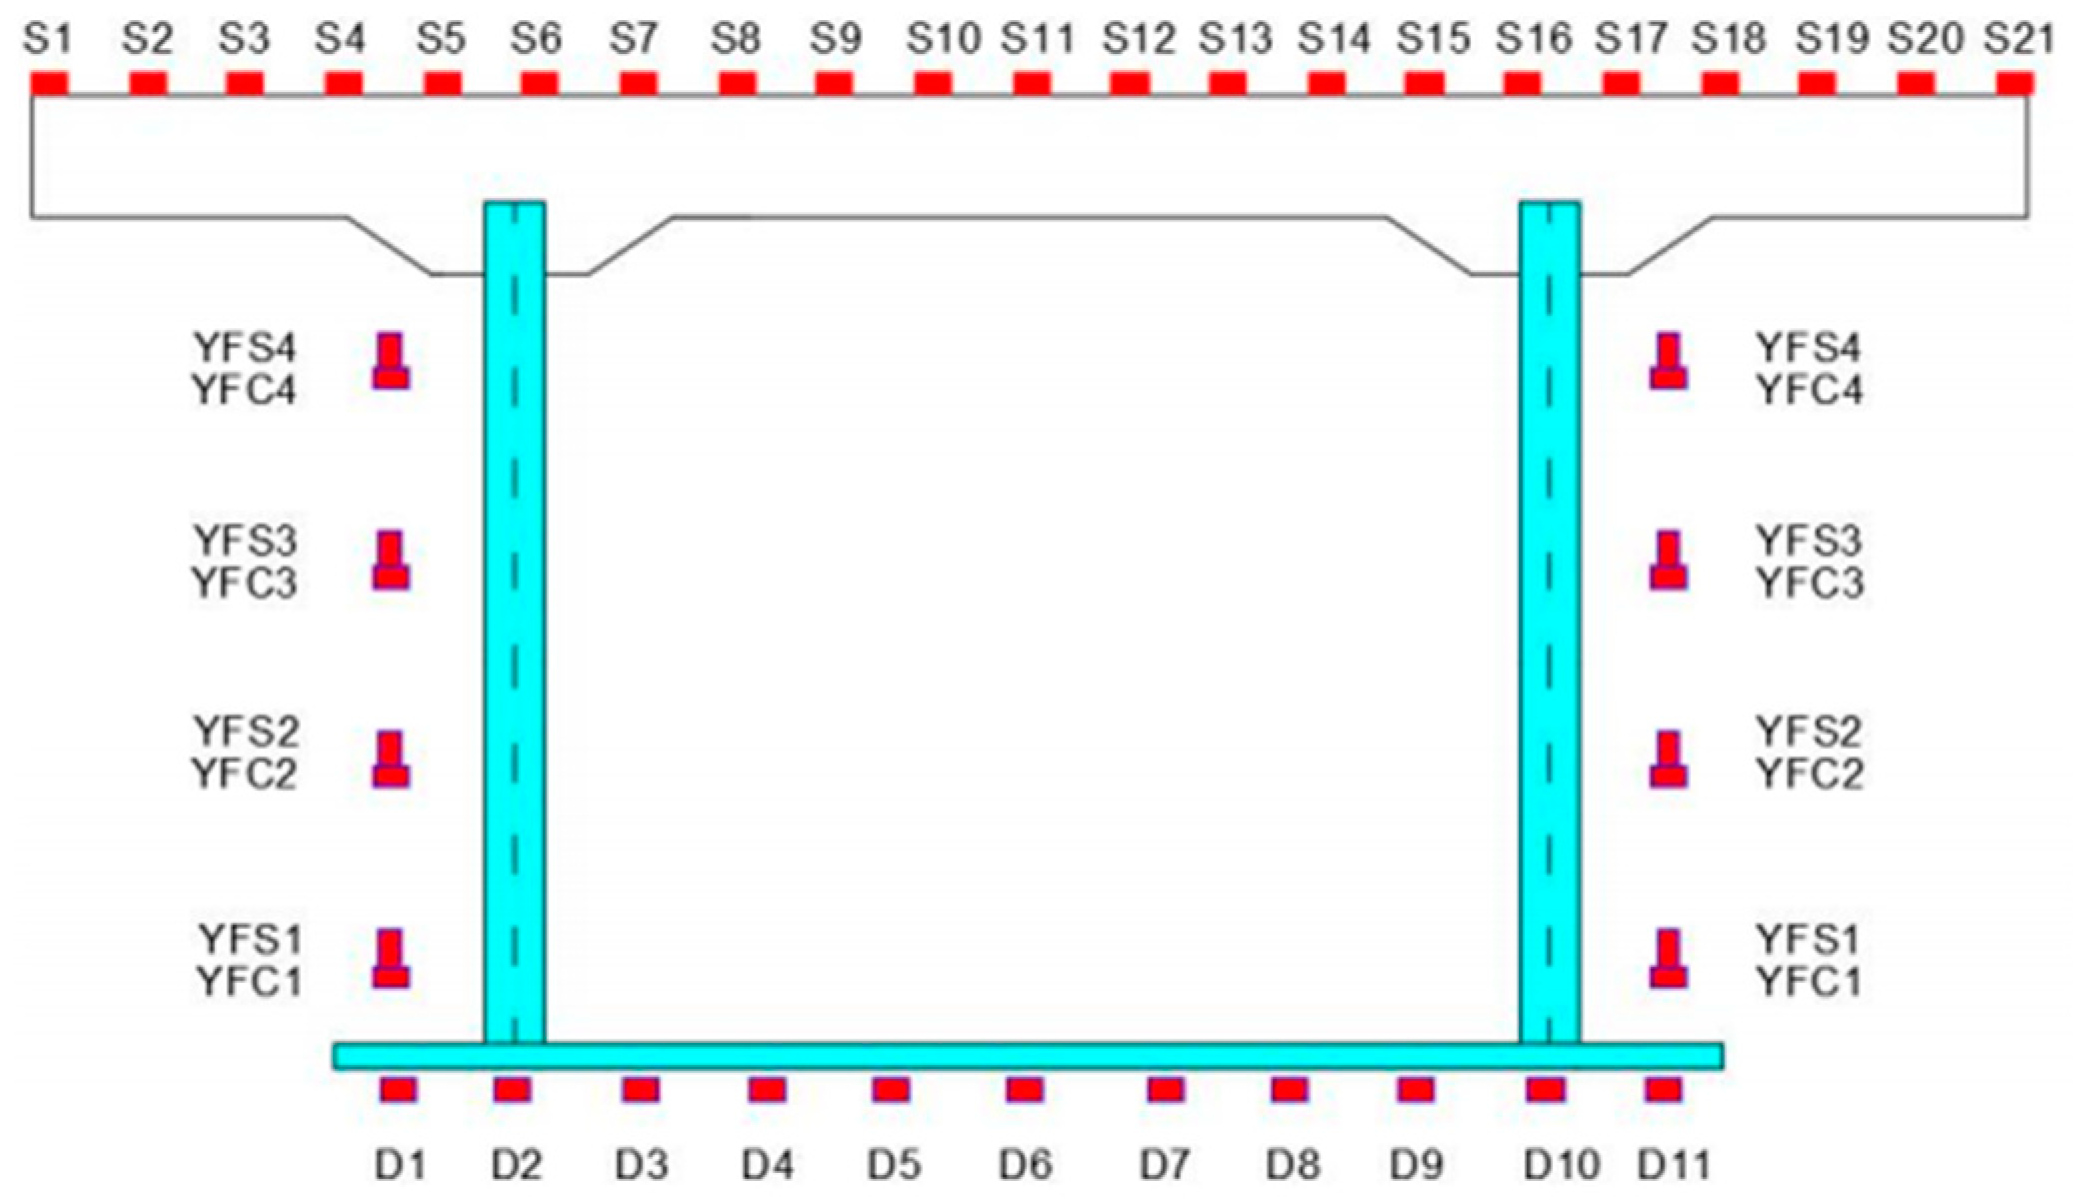
2.4. Measurement Points for Test Girder
3. Test Results and Analysis
3.1. Corrosion and Stress Results
3.1.1. Appearance of Corrosion on Test Girders
3.1.2. Top Plate Reinforcement Corrosion Results
3.1.3. Stress Results before and after Corrosion of Steel Bottom Plate
3.2. Analysis of Corrosion Results of Test Girders
3.2.1. Corrosion Rate of Test Girders
3.2.2. Pitting Inhomogeneity Coefficient
3.2.3. Age of Corrosion
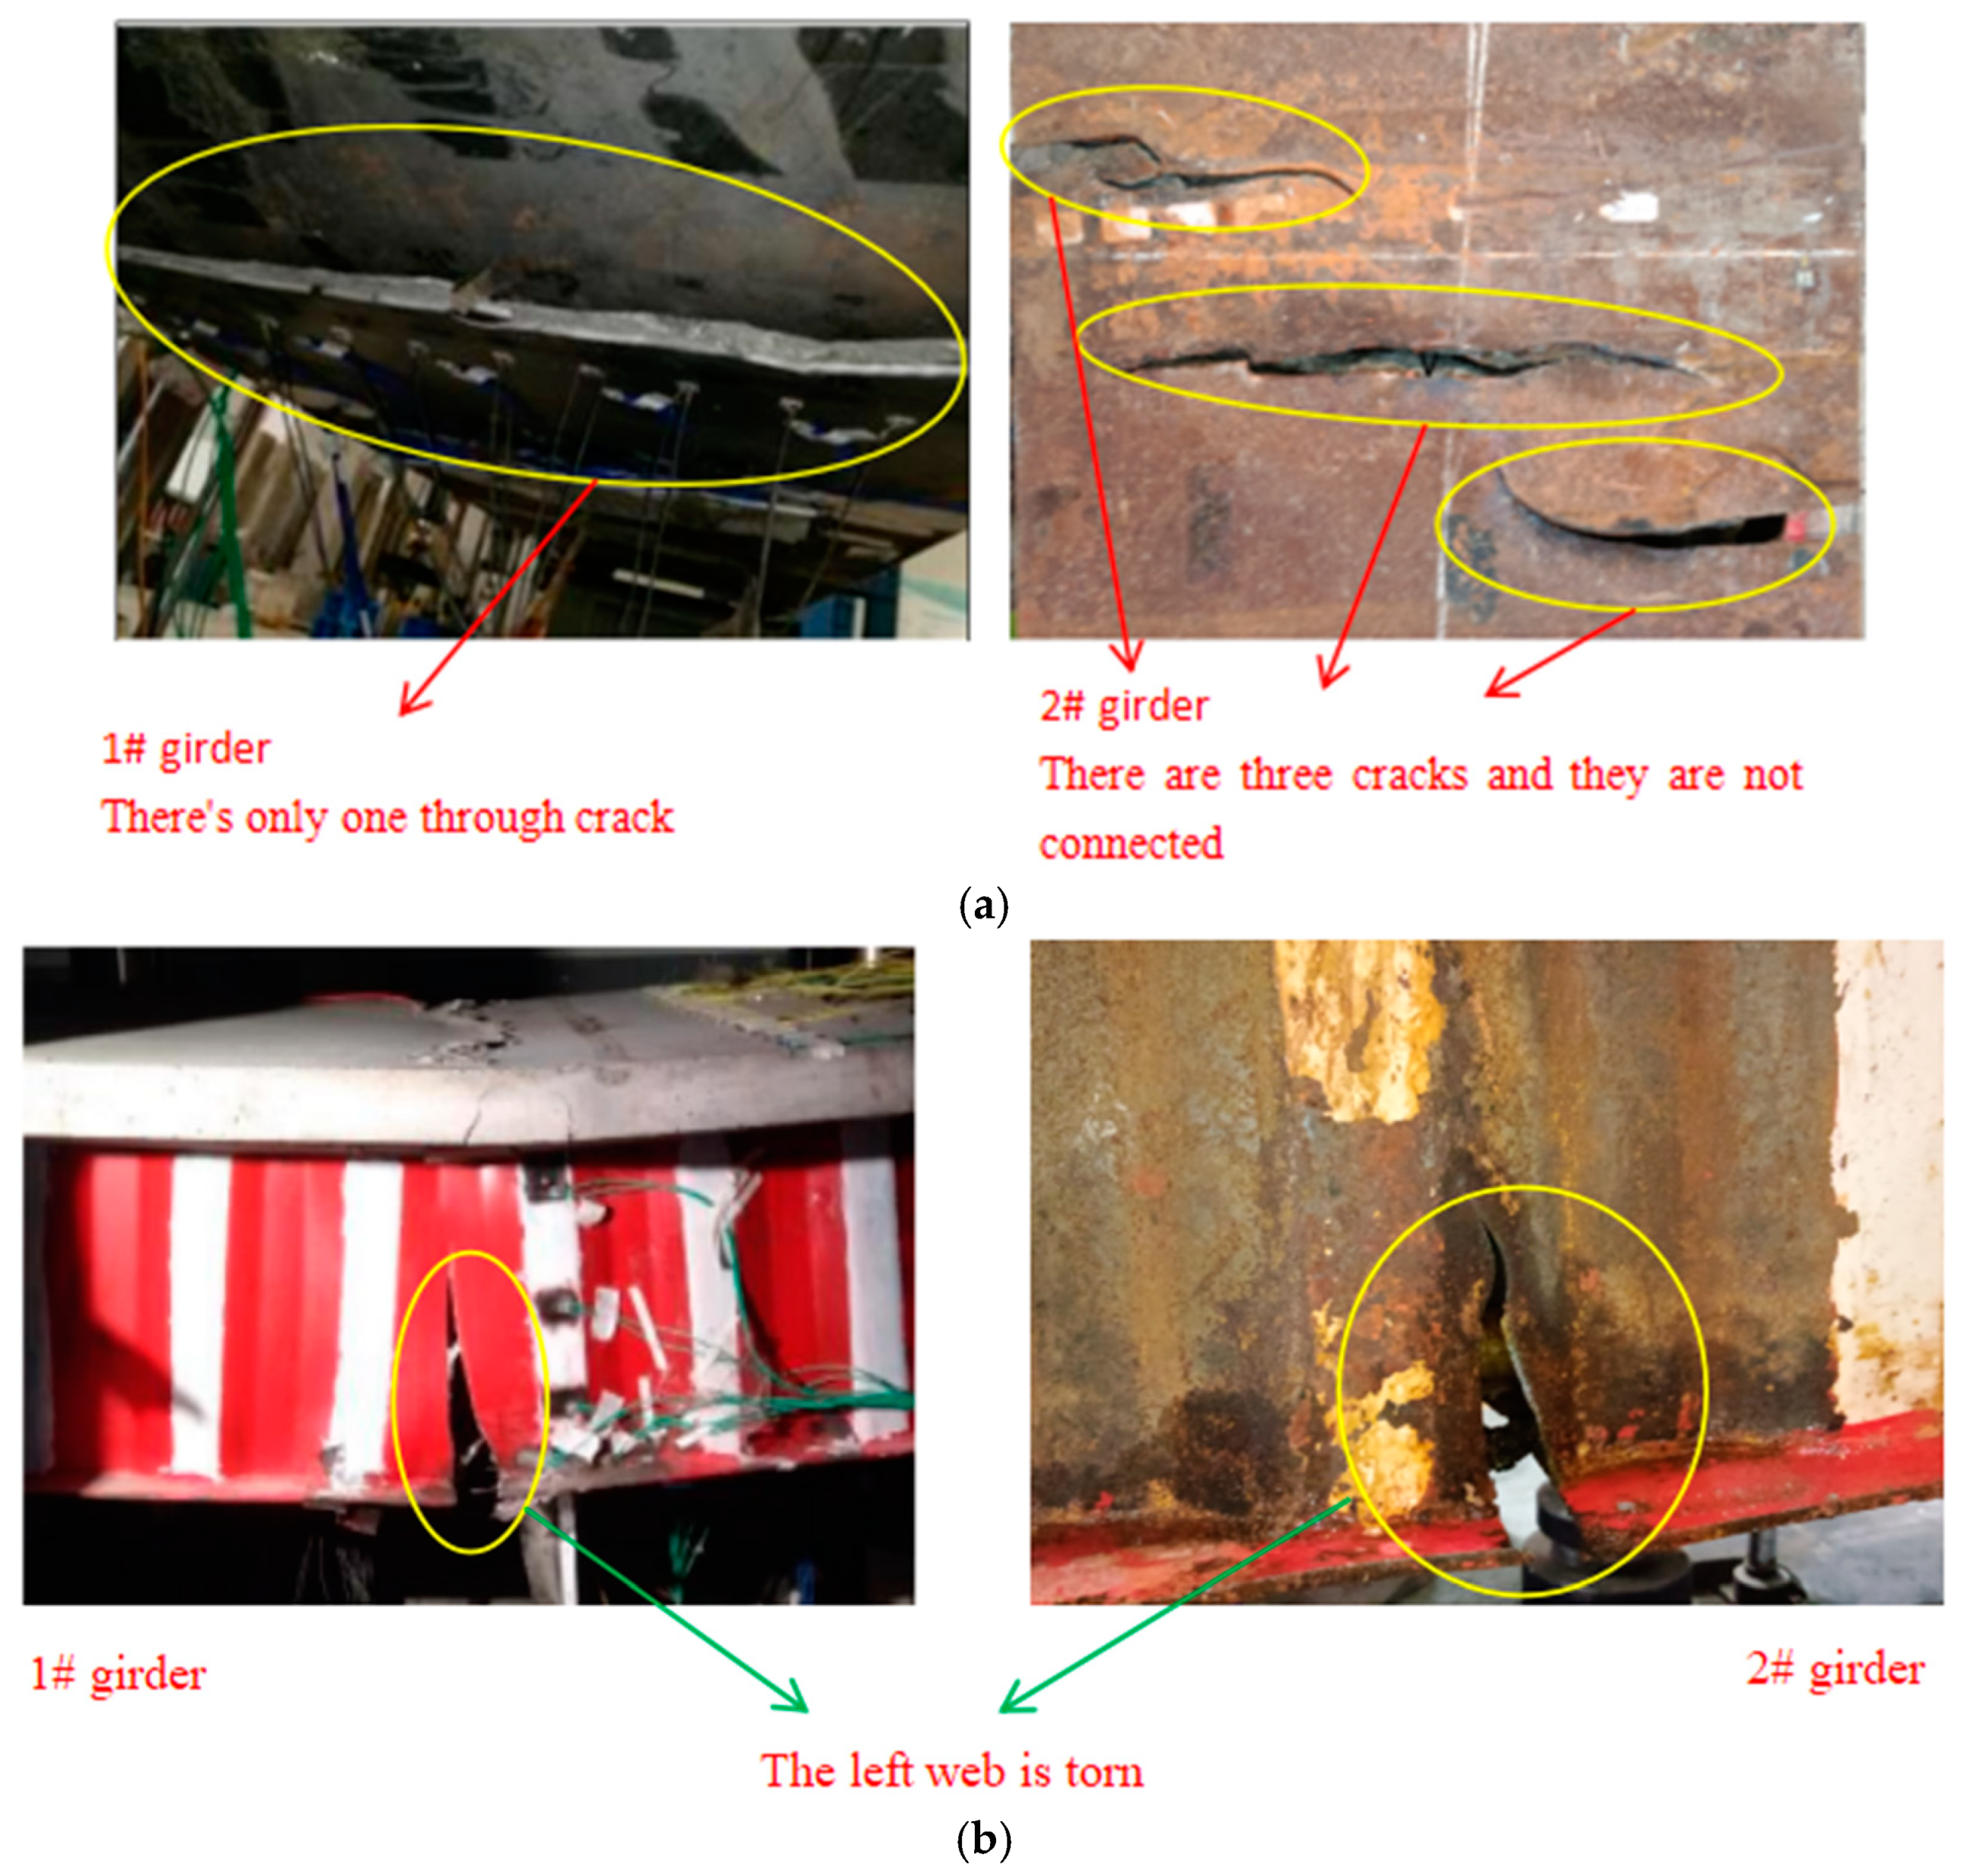
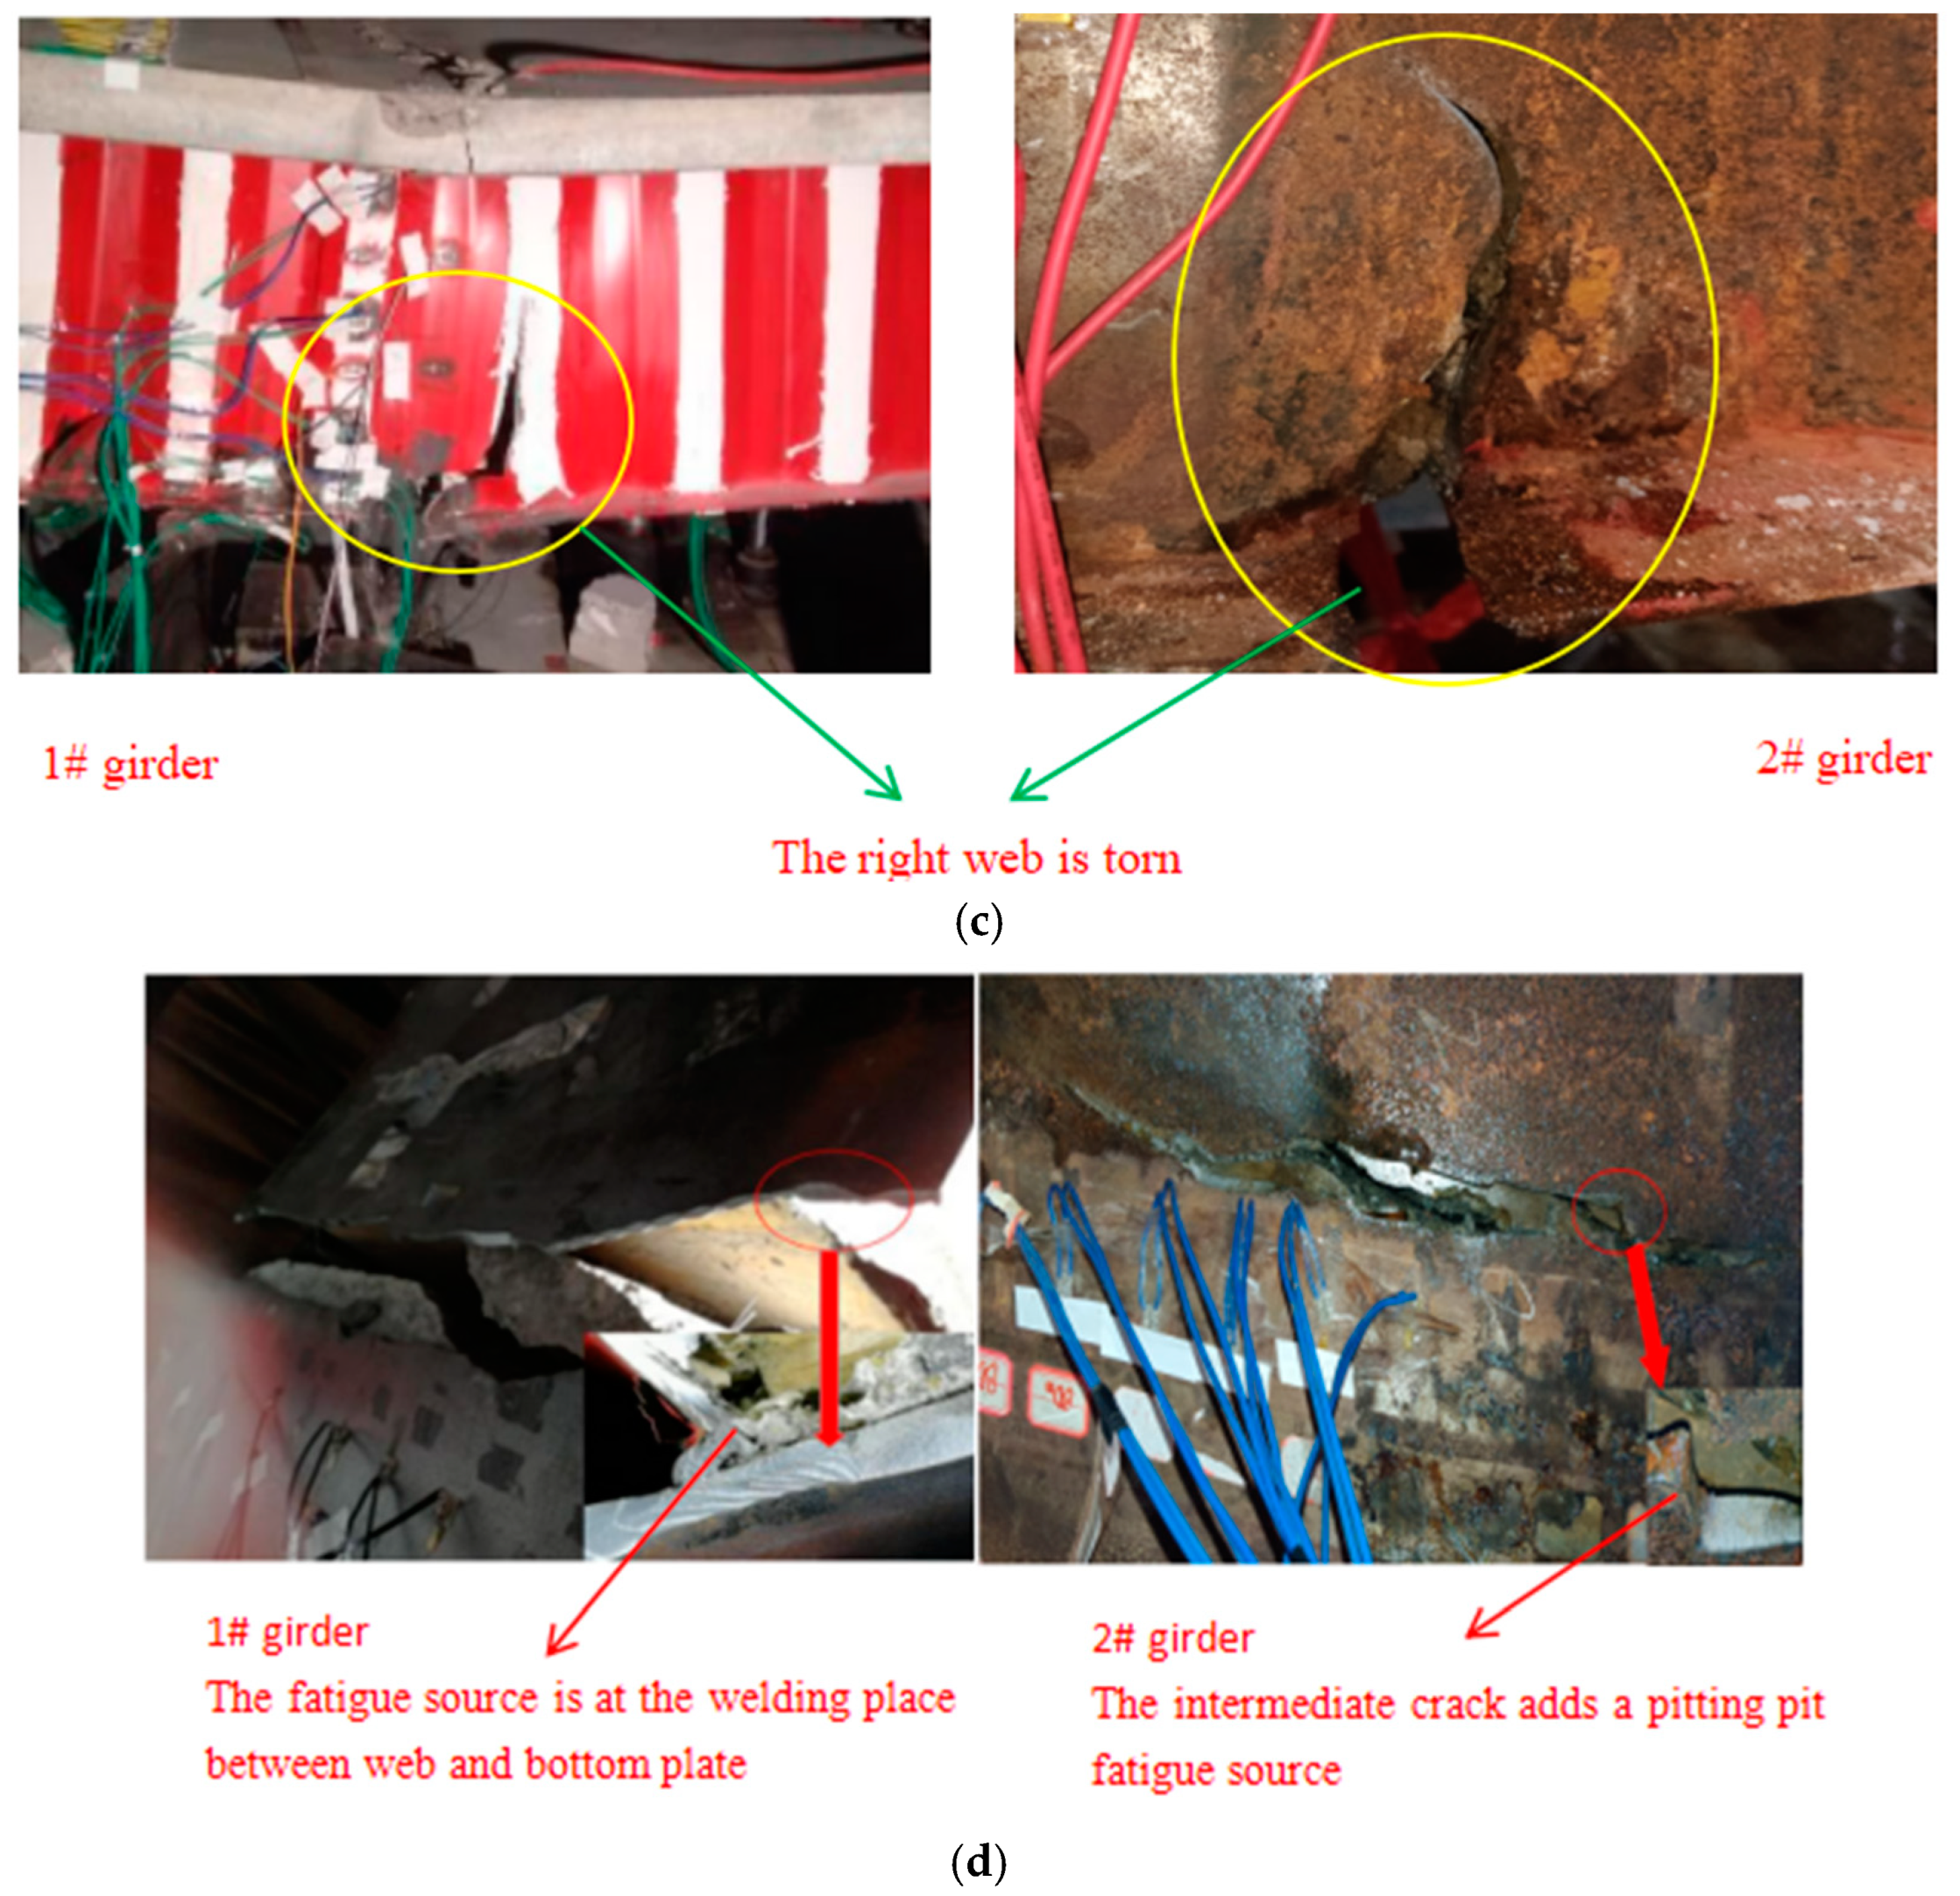
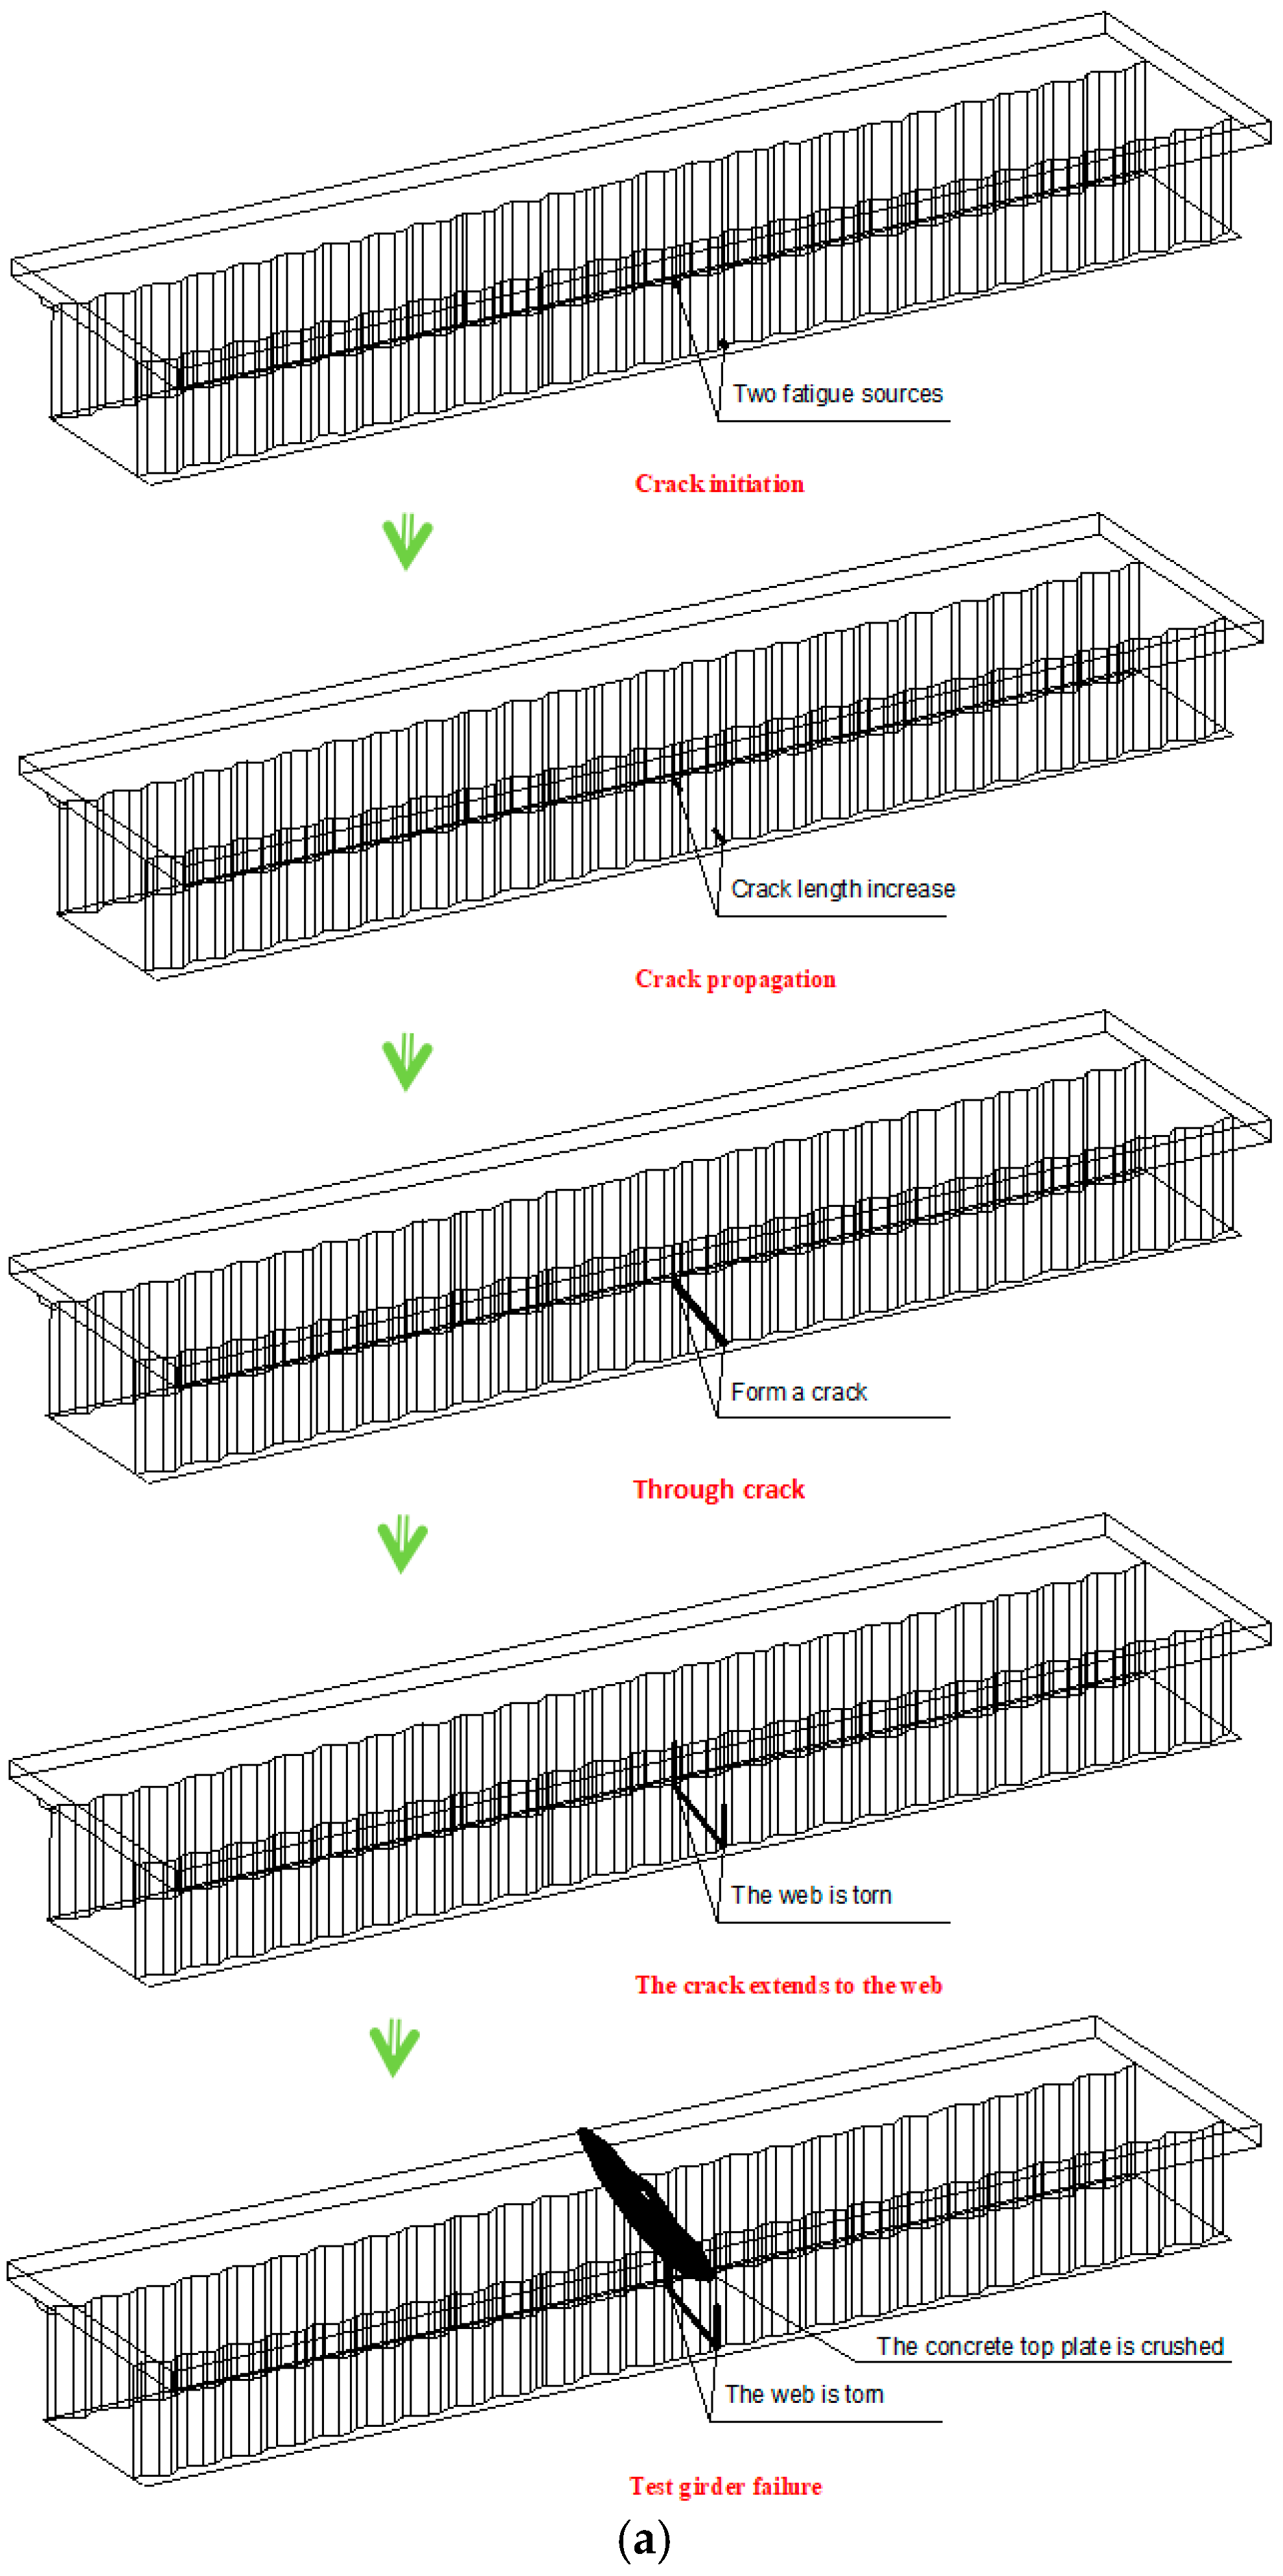
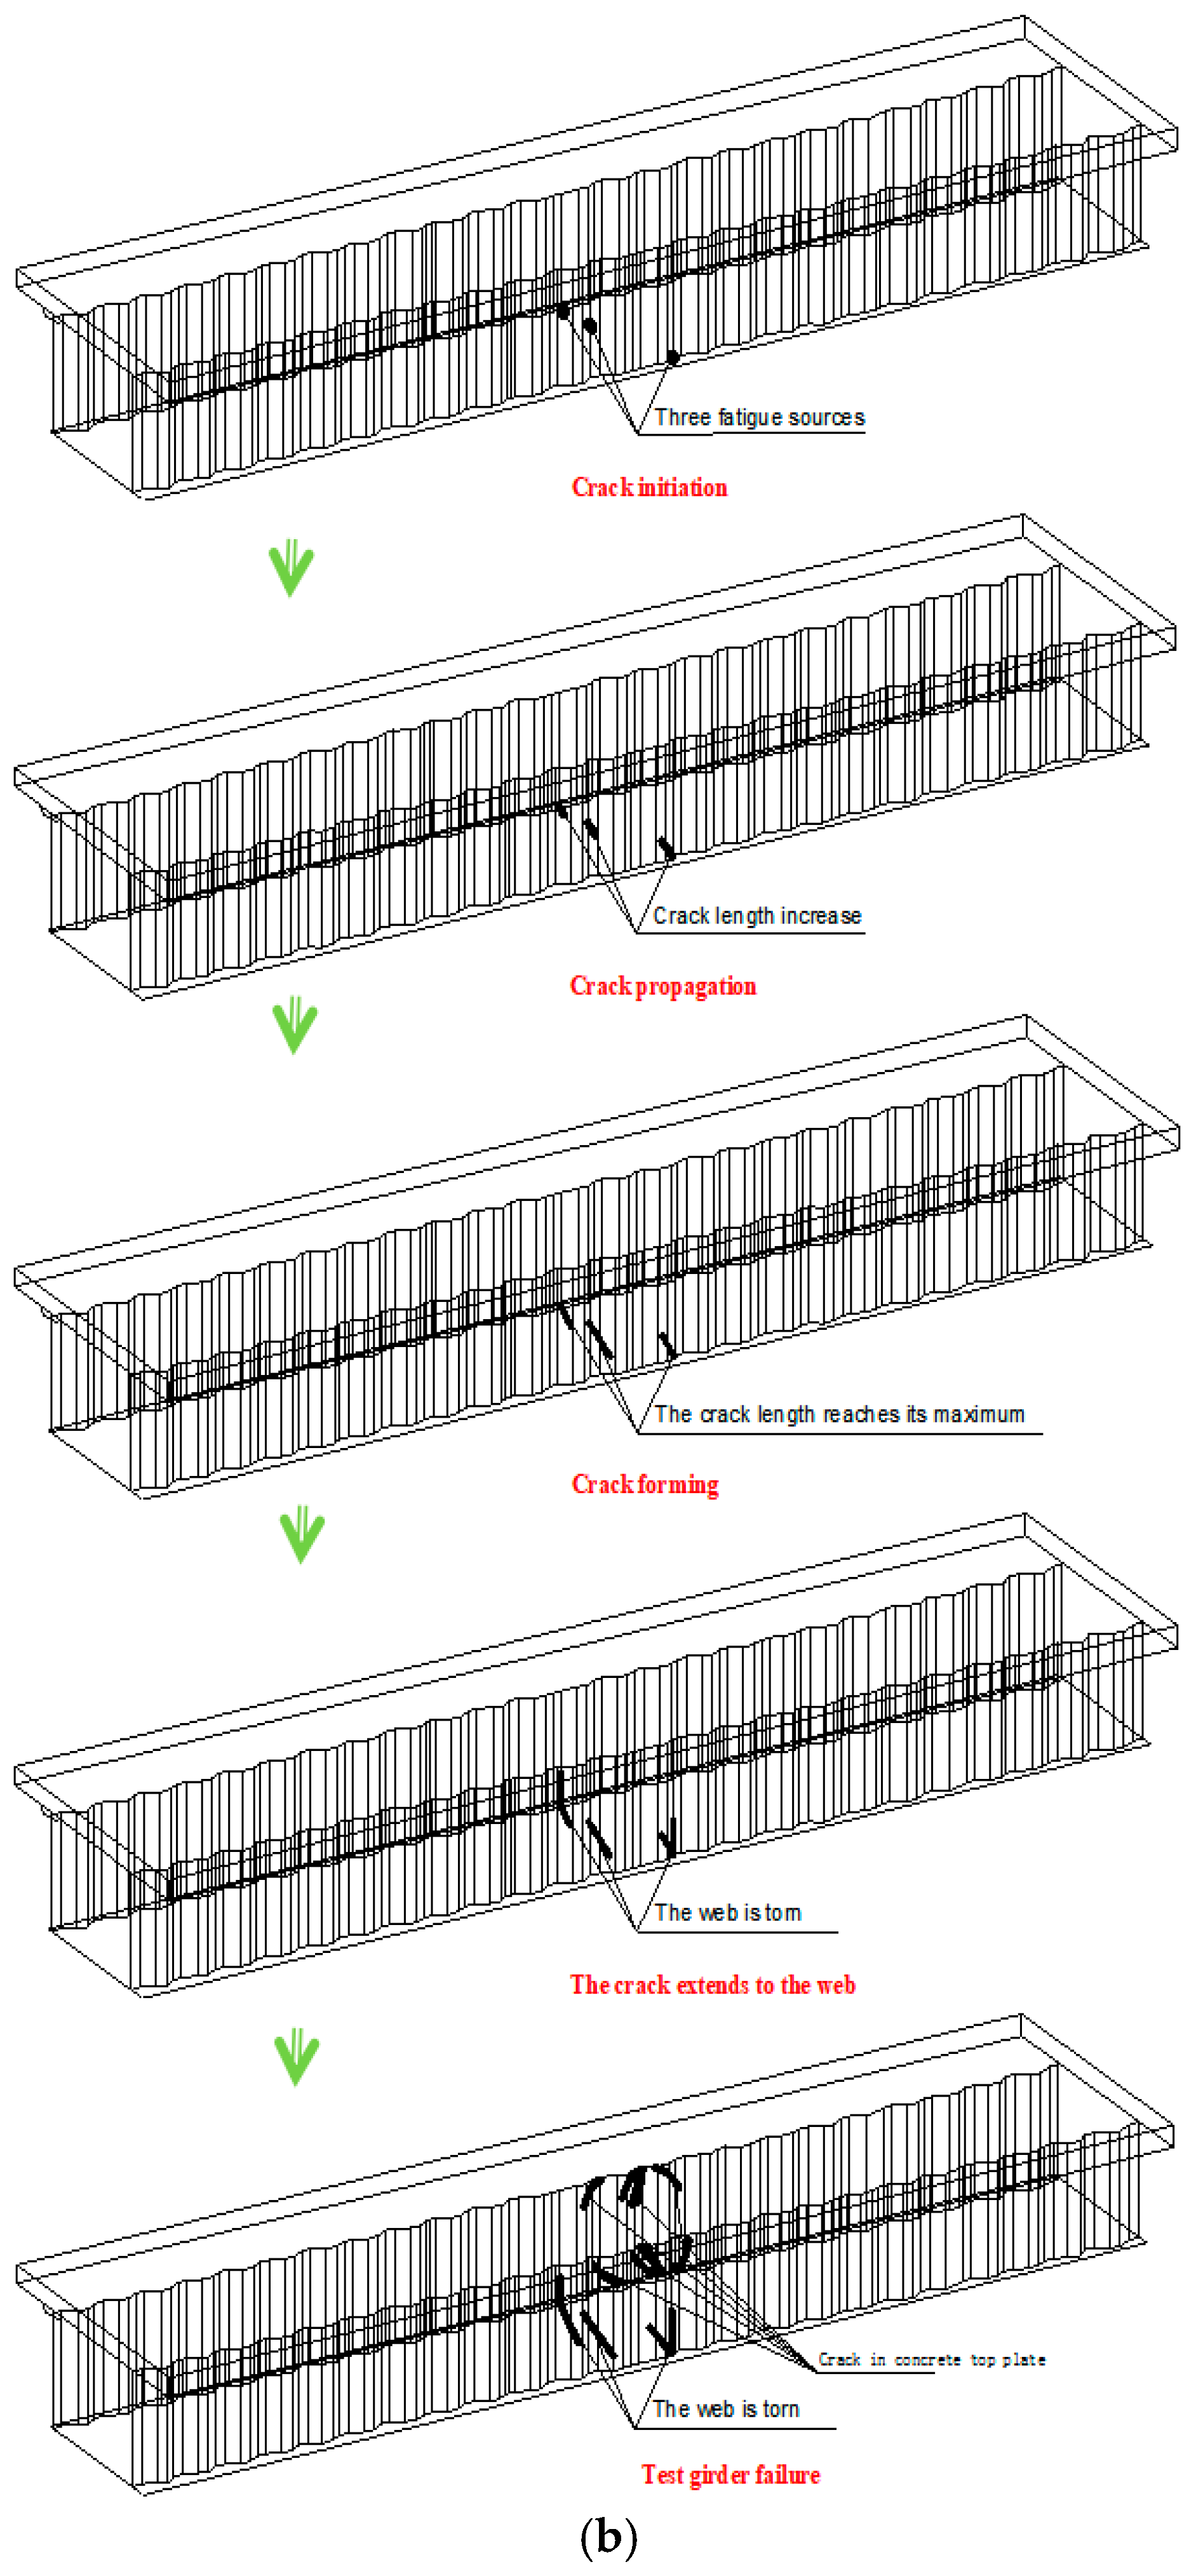
3.3. Fatigue Failure Results of Test Girders
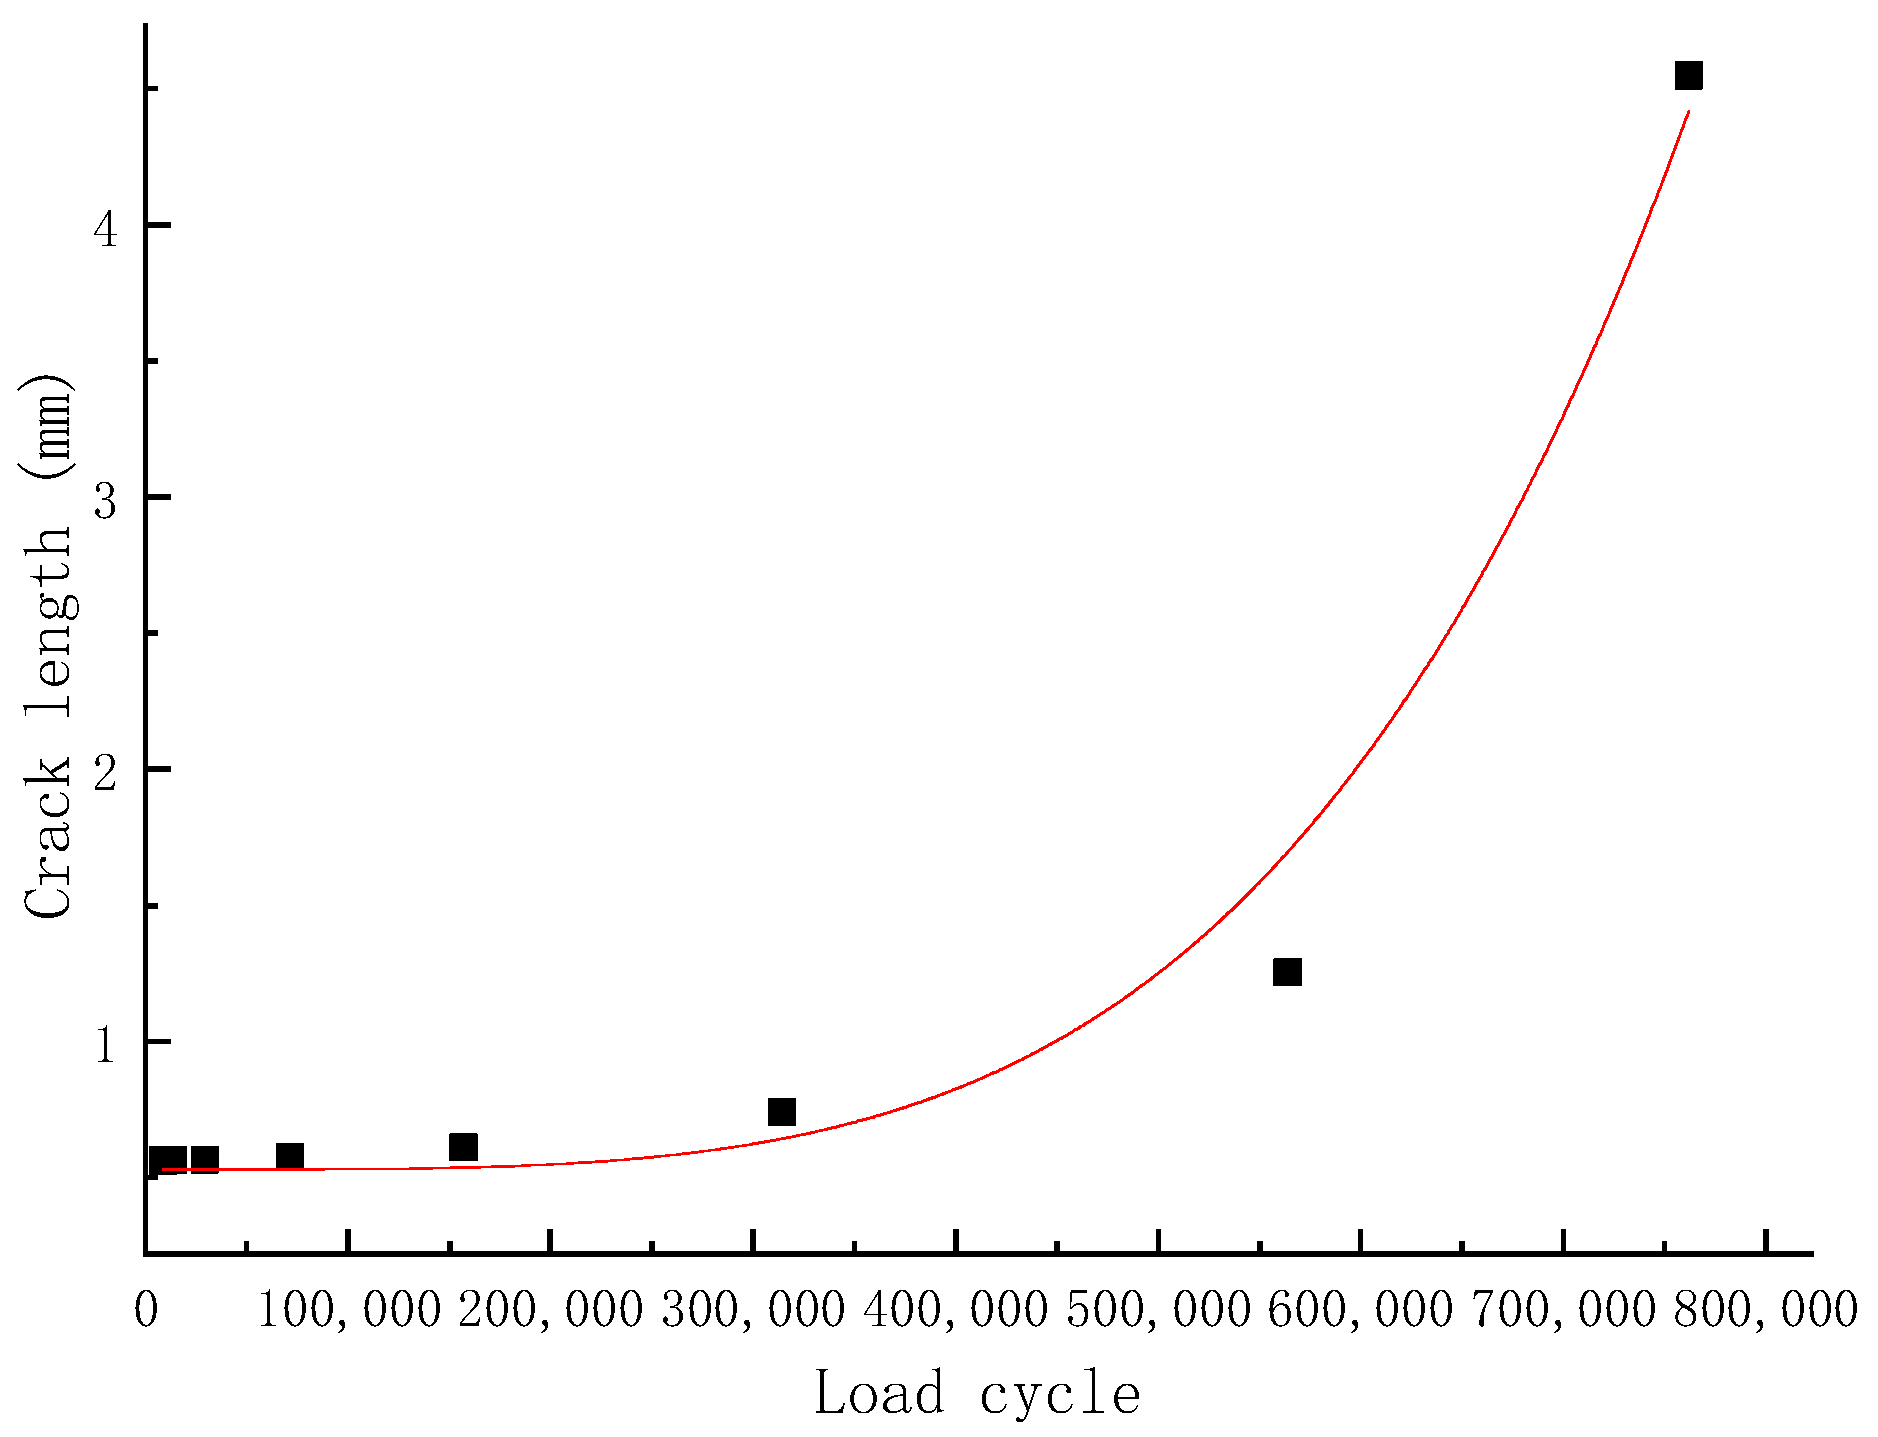
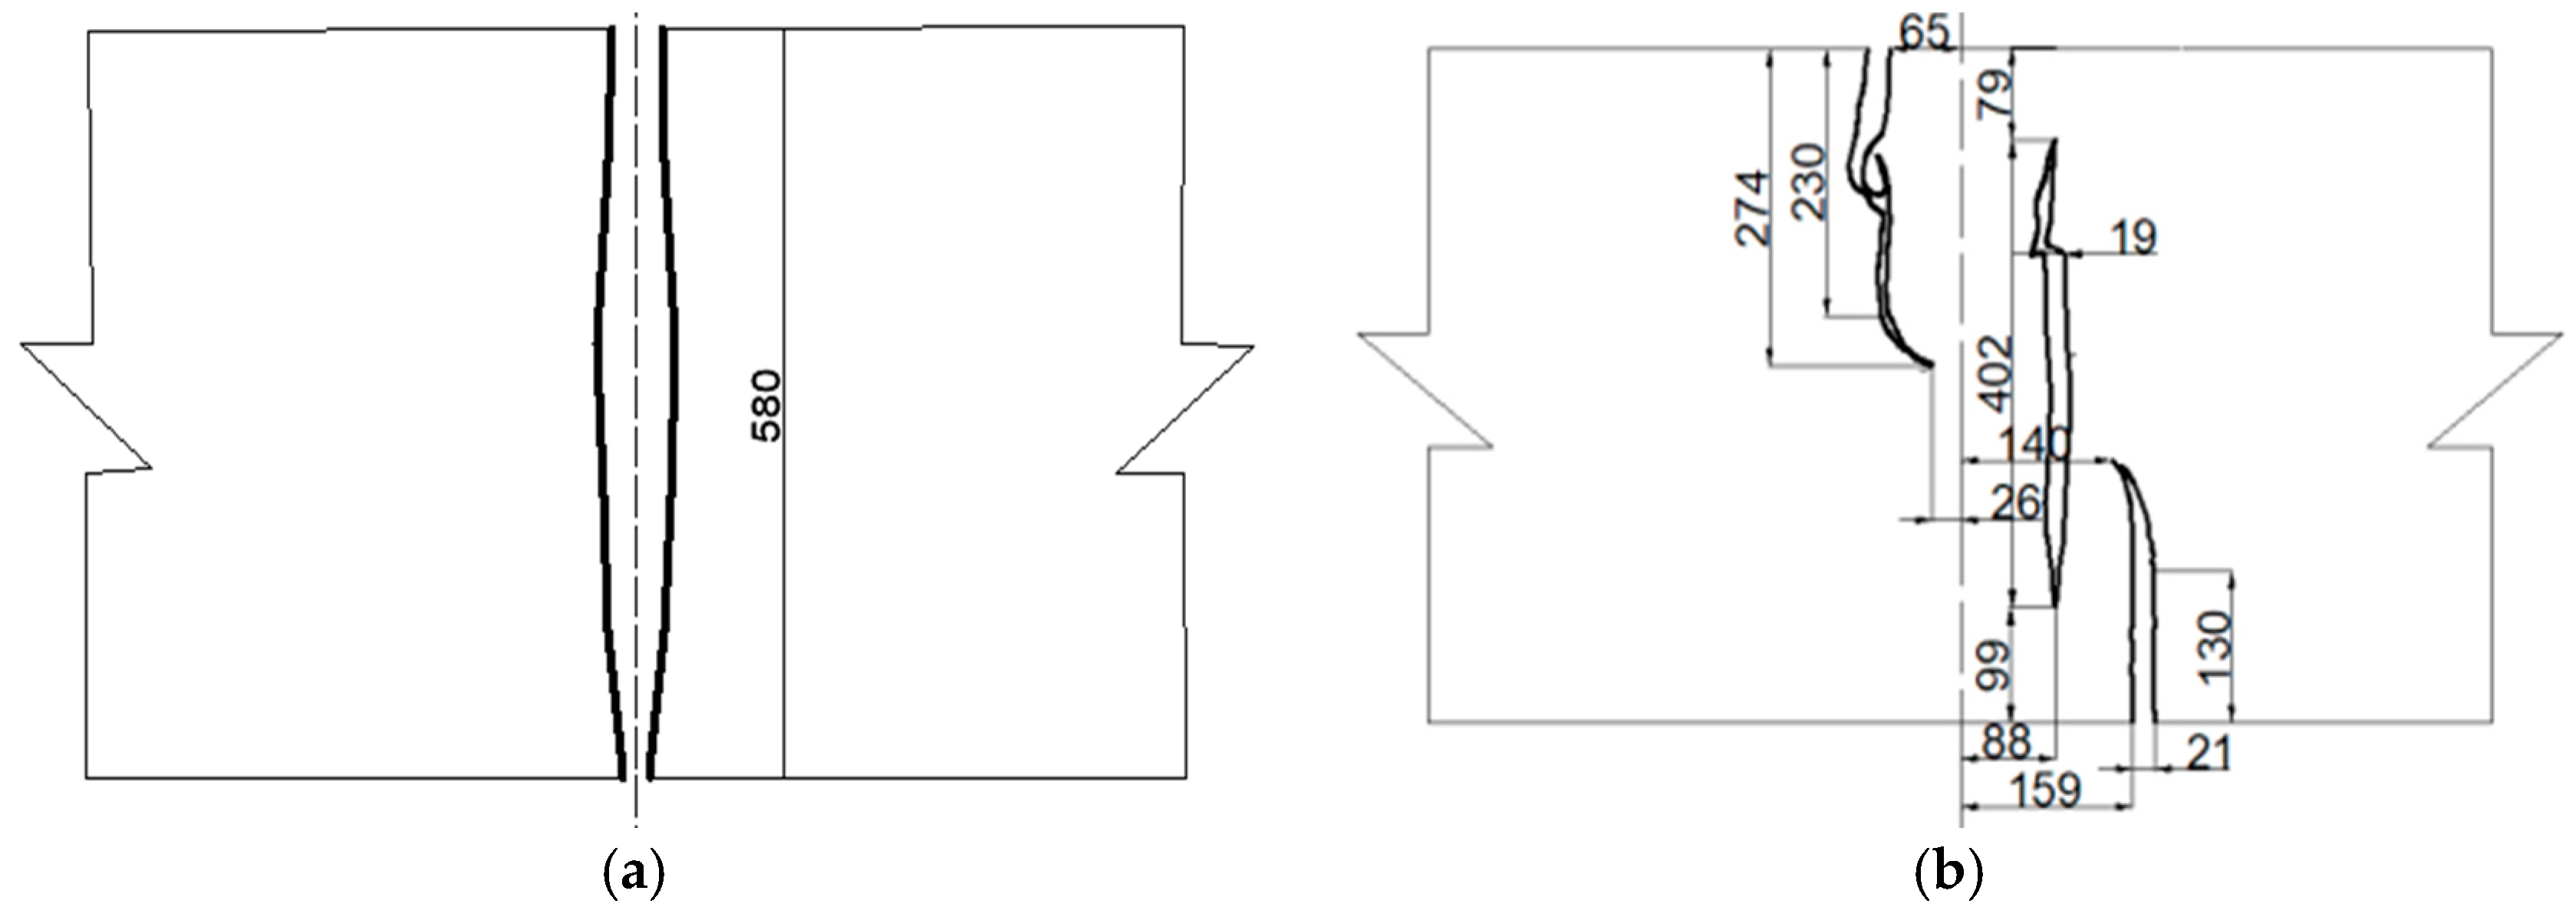
3.4. Analysis of the Expansion Pattern of Pitting Fatigue Cracks
3.5. Fatigue Failure Analysis
4. Numerical Simulation
4.1. Numerical Simulation of Test Girders under Uniform Corrosion
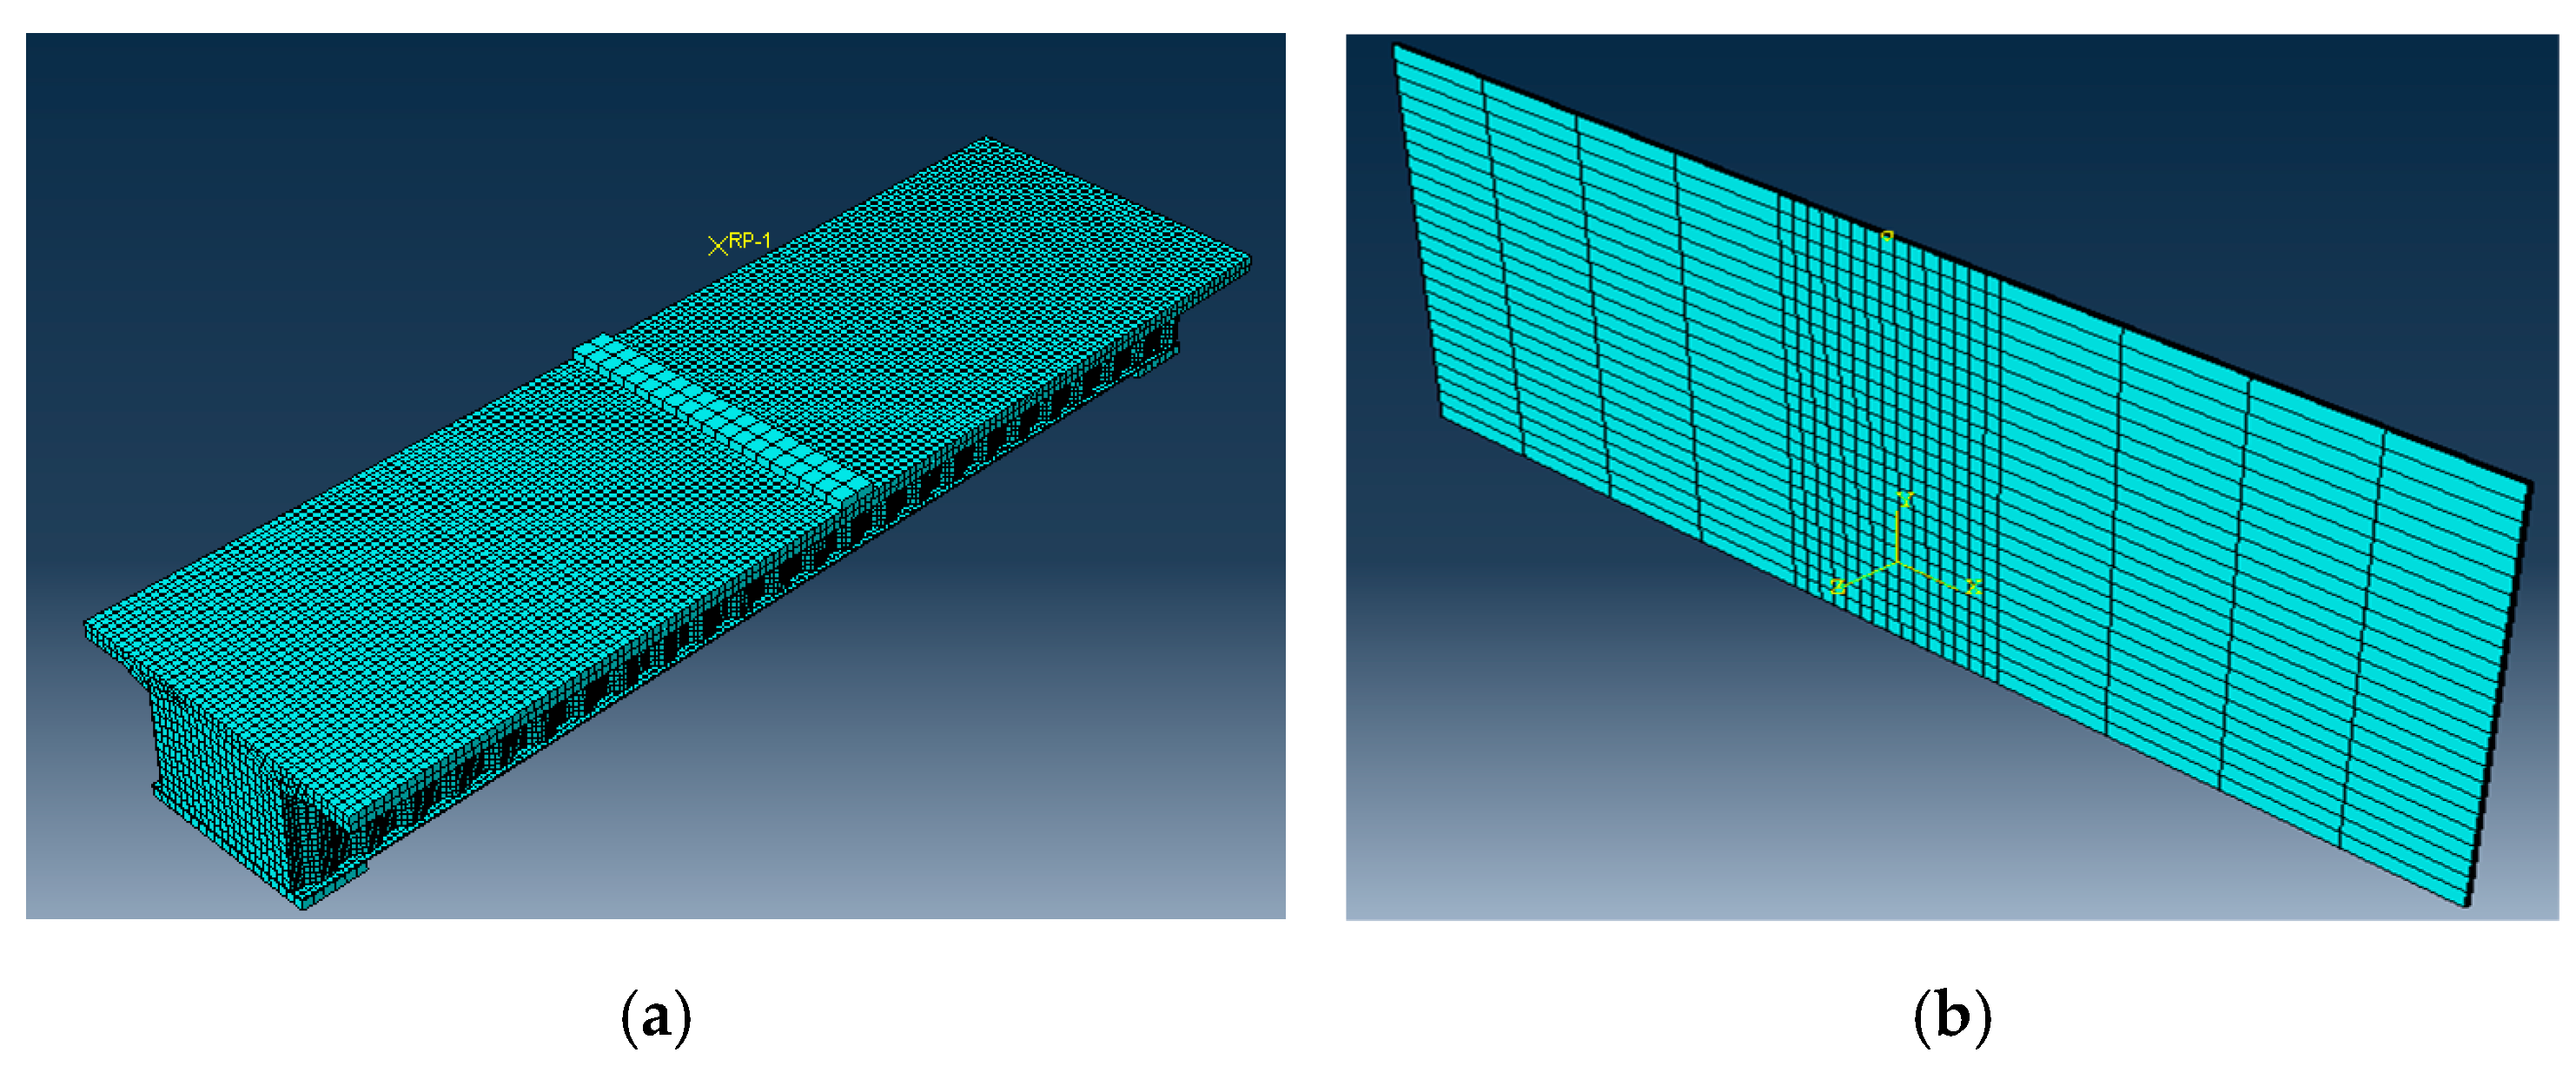
4.2. Numerical Simulation of Crack Propagation in Steel Bottom Plate under Pitting Corrosion
4.3. Analysis of Numerical Simulation Results
4.3.1. Location of Fatigue Failure of Composite Girder under Uniform Corrosion
4.3.2. Expansion Patterns of Pitting Fatigue Cracks
5. Conclusions
- (1)
- Uniform corrosion will lead to greater stress in the test girder bottom plate and reduced performance of the composite girder in use; this is the same as the conclusions of references [12,13]. The stress growth of the test girder after corrosion is about 10%, the corrosion rate is 9%, the pitting non-uniformity coefficient is 1.25, and the relative corrosion life is 26.34 years.
- (2)
- (3)
- Uniform corrosion does not affect the weld at the interface as a fatigue source for fatigue failure, but it can lead to premature fatigue failure in the test girders, whereas pitting corrosion creates a new fatigue source.
- (4)
- The expansion of pitting fatigue cracks and the number of equivalent load cycles as a whole shows an exponential relationship, the rate of which is slow at the early stage, basically does not expand, in the middle of the expansion rate is gradually accelerated. In the latter part, the cracks begin to grow rapidly, and the component enters the rapid destruction stage. The final failure pattern of pitting fatigue cracks is that the crack length reaches the plate thickness, the crack opens, and the member is torn.
- (5)
- The fatigue life of the 1# test girder is 5,146,000 cycles, and the fatigue life of the 2# test girder is 4,598,000 cycles, which is a reduction of 10.65%. It indicates that the corrosive environment seriously affects the service life of the composite girder.
6. Discussion
- (1)
- The effect and significance of the non-uniform coefficient of pitting corrosion are as follows:
- (2)
- The advantages and disadvantages of the finite element modeling method are as follows:
- (3)
- Strategies to mitigate corrosion and protect the structure can be regarded as follows:
- (4)
- Methods to improve predictive modeling for structural health monitoring are as follows:
- (5)
- The direction of development of this research can be regarded as follows:
Author Contributions
Funding
Data Availability Statement
Conflicts of Interest
References
- Chen, Y.; Wang, Y. Design and Construction of Prestressed Concrete Bridges with Corrugated Steel Web Plates; Beijing Renmin Tong Publishing House: Beijing, China, 2009. [Google Scholar]
- Zhang, Z. Research on Bending Mechanical Properties and Model Test of Steel Base Plate Wave Web-Concrete Combined Box Girder. Ph.D. Thesis, Lanzhou Jiaotong University, Lanzhou, China, 2023. [Google Scholar]
- Idiart, A.E.; Carlos, M.L.; Ignacio, C. Chemo-Mechanical Analysis of Concrete Cracking and Degradation Due to External Sulfate Attack:A Meso-Scale Model. Cem. Concr. Compos. 2011, 33, 411–423. [Google Scholar] [CrossRef]
- Kotaki, N.; Ichikawa, A.; Sasaki, E.; Miki, C.; Hosaka, T. A proposal of steel girder bridges with of ripple web and their fatigue performance. Proc. Jpn. Soc. Civ. Eng. 2004, 2004, 233–244. [Google Scholar] [CrossRef] [PubMed]
- Saki, Y.; Yamada, S.; Sato, T. Fatigue Test on the Joint in the Corrugated Steel Web PC Box Girder; Topy Steel Structures Co., Ltd.: Toyohashi, Japan, 2004. [Google Scholar]
- Wang, Z.; Wang, Q.; Chen, Y.; Shi, X.; Ouyang, W. Research progress on fatigue characteristics of corrugated steel web girders. Highw. Transp. Sci. Technol. 2010, 27, 64–71. [Google Scholar]
- Yuan, S.; Dong, J.; Wang, Q. Fatigue damage analysis of corrugated steel web combined box girder based on finite element. J. Sichuan Univ. 2016, 48, 77–82. [Google Scholar]
- Liu, W. Experimental Research on Fatigue Damage of Corrugated Steel Web Combined Box Girder. Ph.D. Thesis, Lanzhou Jiaotong University, Lanzhou, China, 2018. [Google Scholar]
- Chen, P. Research on Fatigue Damage and Model Test of Combined Box Girder with Corrugated Web and Steel Bottom Plate. Ph.D. Thesis, Lanzhou Jiaotong University, Lanzhou, China, 2021. [Google Scholar]
- Li, P. Research on Fatigue Test of Corrugated Steel Web Combined Box Girder. Ph.D. Thesis, Lanzhou Jiaotong University, Lanzhou, China, 2018. [Google Scholar]
- Song, S. Fatigue Performance Analysis and Model Test Research of Corrugated Web Steel Bottom Plate Combination Box Girder. Ph.D. Thesis, Lanzhou Jiaotong University, Lanzhou, China, 2021. [Google Scholar]
- Zhou, C. Effect of Chloride Salt Corrosion on the Fatigue Performance of Combined Box Girder with Corrugated Web and Steel Bottom Plate and Model Test Research. Ph.D. Thesis, Lanzhou Jiaotong University, Lanzhou, China, 2023. [Google Scholar]
- Ning, X. Study on Fatigue Damage and Modeling Test of Combined Box Girder with Wave Web and Steel Bottom Plate under Chloride Salt Corrosion Condition. Ph.D. Thesis, Lanzhou Jiaotong University, Lanzhou, China, 2023. [Google Scholar]
- Peng, K.; Li, L.; Pei, B. Fatigue Analysis of girder with Corrugated Steel Webs Using Hot Spot Stress Method. J. Hunan Univ. (Nat. Sci.) 2018, 45, 74–82. [Google Scholar] [CrossRef]
- Huang, J.; Wang, M.; Yang, H.; Li, L. Study on fatigue analysis of girder with corrugated steel webs using notch stress method. J. Railw. Sci. Eng. 2021, 18, 425–431. [Google Scholar] [CrossRef]
- JB/T 7901-1999; Test Method for Homogeneous Corrosion Total Immersion of Metallic Materials in Laboratory. State Bureau of Machinery Industry: Beijing, China, 1999.
- Liu, F. Research on the Resistance of Ultra-High Performance Concrete to Chloride Salt Erosion under Dry and Wet Cycling. Ph.D. Thesis, Xi’an University of Technology, Xi’an, China, 2023. [Google Scholar]
- JTG D64-2015; Design Specification for Highway Steel Structure Bridges. People’s Transportation Press: Beijing, China, 2015.
- Yu, D. Study on Corrosion and Its Influence on Mechanical Properties of Steel Bridge Structure. Ph.D. Thesis, East China Jiaotong University, Nanchang, China, 2016. [Google Scholar]
- Zhang, X. Mechanics of Materials; China Machine Press: Beijing, China, 2022. [Google Scholar]
- Yu, X. Corrosion Fatigue Test on Bridge Parallel Steel Wires and Fatigue Life Assessment of Suspenders. Ph.D. Thesis, Southeast University, Dhaka, Bangladesh, 2019. [Google Scholar] [CrossRef]
- Su, H.; Zhao, L.; Wu, J.; Du, J. Study on fatigue performance of butt welds of corroded Q345qDNH weathering steel. J. Build. Struct. 2021, 42 (Suppl. 2), 473–481. [Google Scholar]
- Southwell, C.R.; Buitman, J.D.; Hummer, J.C. Estimating the Service Life of Steel in Seawater; Seawater Corrosion Handbook; Noyes Data Corporation: Park Ridge, NJ, USA, 1979; pp. 374–387. [Google Scholar]
- Kong, Z.Z.; Xu, S.H.; Liu, D.F. Study on post-corrosion performance of welded joints in steel structures. J. North China Inst. Water Resour. Hydropower 2010, 31, 46–49. [Google Scholar]
- Albrecht, P.; Naeemi, A.H. Performance of Weathering Steel in Bridges; NCHRP: Washington, DC, USA, 1984. [Google Scholar]
- Liang, C.; Hou, W. Corrosion study of carbon steel and low alloy steel after 16 years of atmospheric exposure. Chin. J. Corros. Prot. 2005, 25, 2–7. [Google Scholar]
- Ding, S.; Sun, L. Fracture Mechanics; Machinery Industry Press: Beijing, China, 1997. [Google Scholar]


| Load Rating | Median Load (kN) | Load Magnitude (kN) | Number of Cycles (10,000) |
|---|---|---|---|
| 1 | 40 | 48 | 40 |
| 2 | 49 | 64 | 40 |
| 3 | 57 | 82 | 40 |
| 4 | 64 | 98 | 40 |
| 5 | 72 | 114 | 40 |
| 6 | 80 | 128 | 40 |
| 7 | 86 | 144 | 30 |
| 8 | 90 | 160 | 20 |
| 9 | 96 | 176 | 20 |
| 10 | 100 | 192 | failure |
| Point Deep Pit Depth Prediction Model | Model Equation | Fixed Number of Years | |
|---|---|---|---|
| Biometrics Model | Southwell [23] | 24.64 | |
| justice for all [24] | 9.83 | ||
| Index Model | Albrecht and Naeemi [25] | 29.11 | |
| Liang C F and Hou W T [26] | 25.27 | ||
| Loading Amplitude (kN) | Number of Loads N (million) | Crack Length a (mm) | |
|---|---|---|---|
| ni | ni + N | ||
| 37 | 0.87 | 0.87 | 0.5626 |
| 48 | 0.49 | 1.37 | 0.5629 |
| 64 | 1.56 | 2.93 | 0.5648 |
| 82 | 4.21 | 7.13 | 0.5745 |
| 98 | 8.58 | 15.71 | 0.6105 |
| 114 | 15.71 | 31.42 | 0.7401 |
| 128 | 24.97 | 56.40 | 1.2553 |
| 144 | 19.80 | 76.20 | 4.5489 |
Disclaimer/Publisher’s Note: The statements, opinions and data contained in all publications are solely those of the individual author(s) and contributor(s) and not of MDPI and/or the editor(s). MDPI and/or the editor(s) disclaim responsibility for any injury to people or property resulting from any ideas, methods, instructions or products referred to in the content. |
© 2024 by the authors. Licensee MDPI, Basel, Switzerland. This article is an open access article distributed under the terms and conditions of the Creative Commons Attribution (CC BY) license (https://creativecommons.org/licenses/by/4.0/).
Share and Cite
Han, P.; Wang, G.; Jin, X. Effect of Corrosion on Fatigue Failure of Composite Girders with Corrugated Web on Steel Bottom Plate. Buildings 2024, 14, 3221. https://doi.org/10.3390/buildings14103221
Han P, Wang G, Jin X. Effect of Corrosion on Fatigue Failure of Composite Girders with Corrugated Web on Steel Bottom Plate. Buildings. 2024; 14(10):3221. https://doi.org/10.3390/buildings14103221
Chicago/Turabian StyleHan, Pulu, Genhui Wang, and Xuejun Jin. 2024. "Effect of Corrosion on Fatigue Failure of Composite Girders with Corrugated Web on Steel Bottom Plate" Buildings 14, no. 10: 3221. https://doi.org/10.3390/buildings14103221