
Study on the Performance of High-Performance Mortar (HPM) Prepared Using Sodium-Silicate-Modified Graphite Tailing Sand


Abstract
1. Introduction
2. Materials and Methods
2.1. Cementitious Materials and Additives
2.2. Aggregates
2.3. Mixture Proportions and Preparation Process
2.3.1. Water Absorption Test
2.3.2. Mechanical Performance Testing and Ultrasonic Testing
2.3.3. Freeze–Thaw Cycle Test
2.3.4. Microscopic Testing
3. Results and Discussion
3.1. Water Absorption and Wet-Packing Density Analysis
3.2. Compressive Strength and Speed of Sound Analysis
3.3. Frost Resistance
3.3.1. Surface Erosion
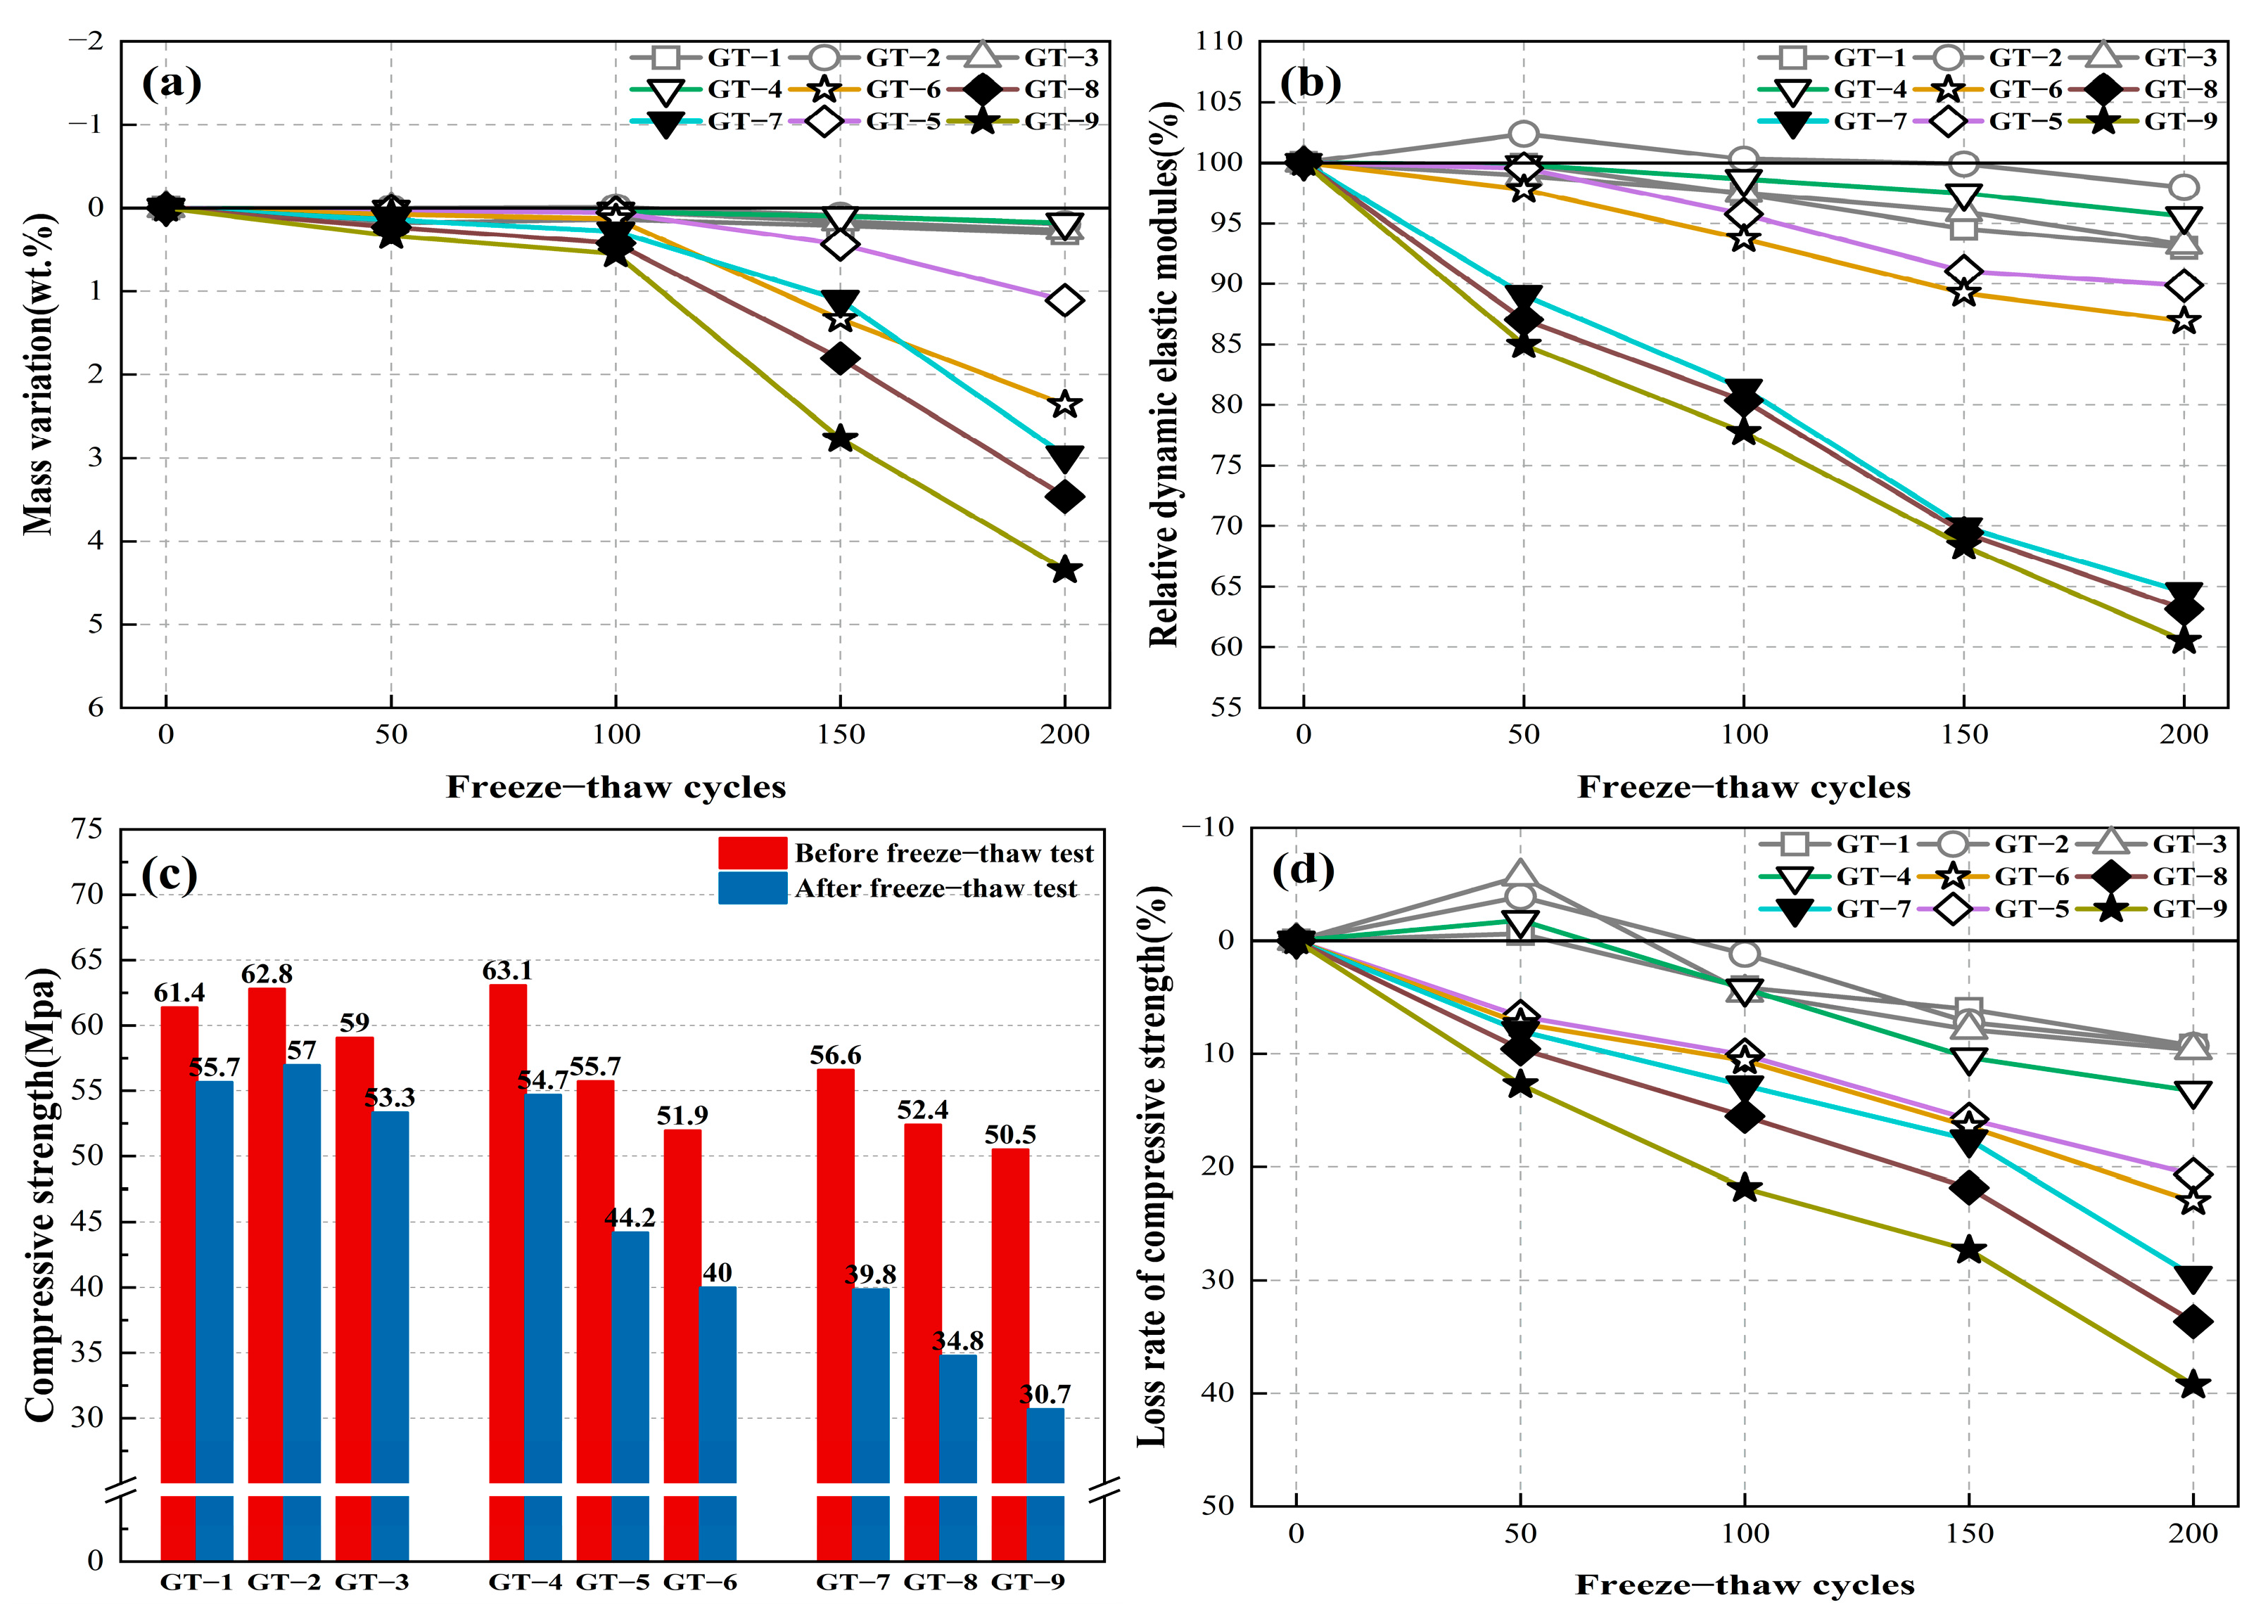
3.3.2. Mass Loss
3.3.3. RDME
3.3.4. The Strength Change
3.4. Freeze–Thaw Damage Mechanism
3.4.1. FTIR Analysis
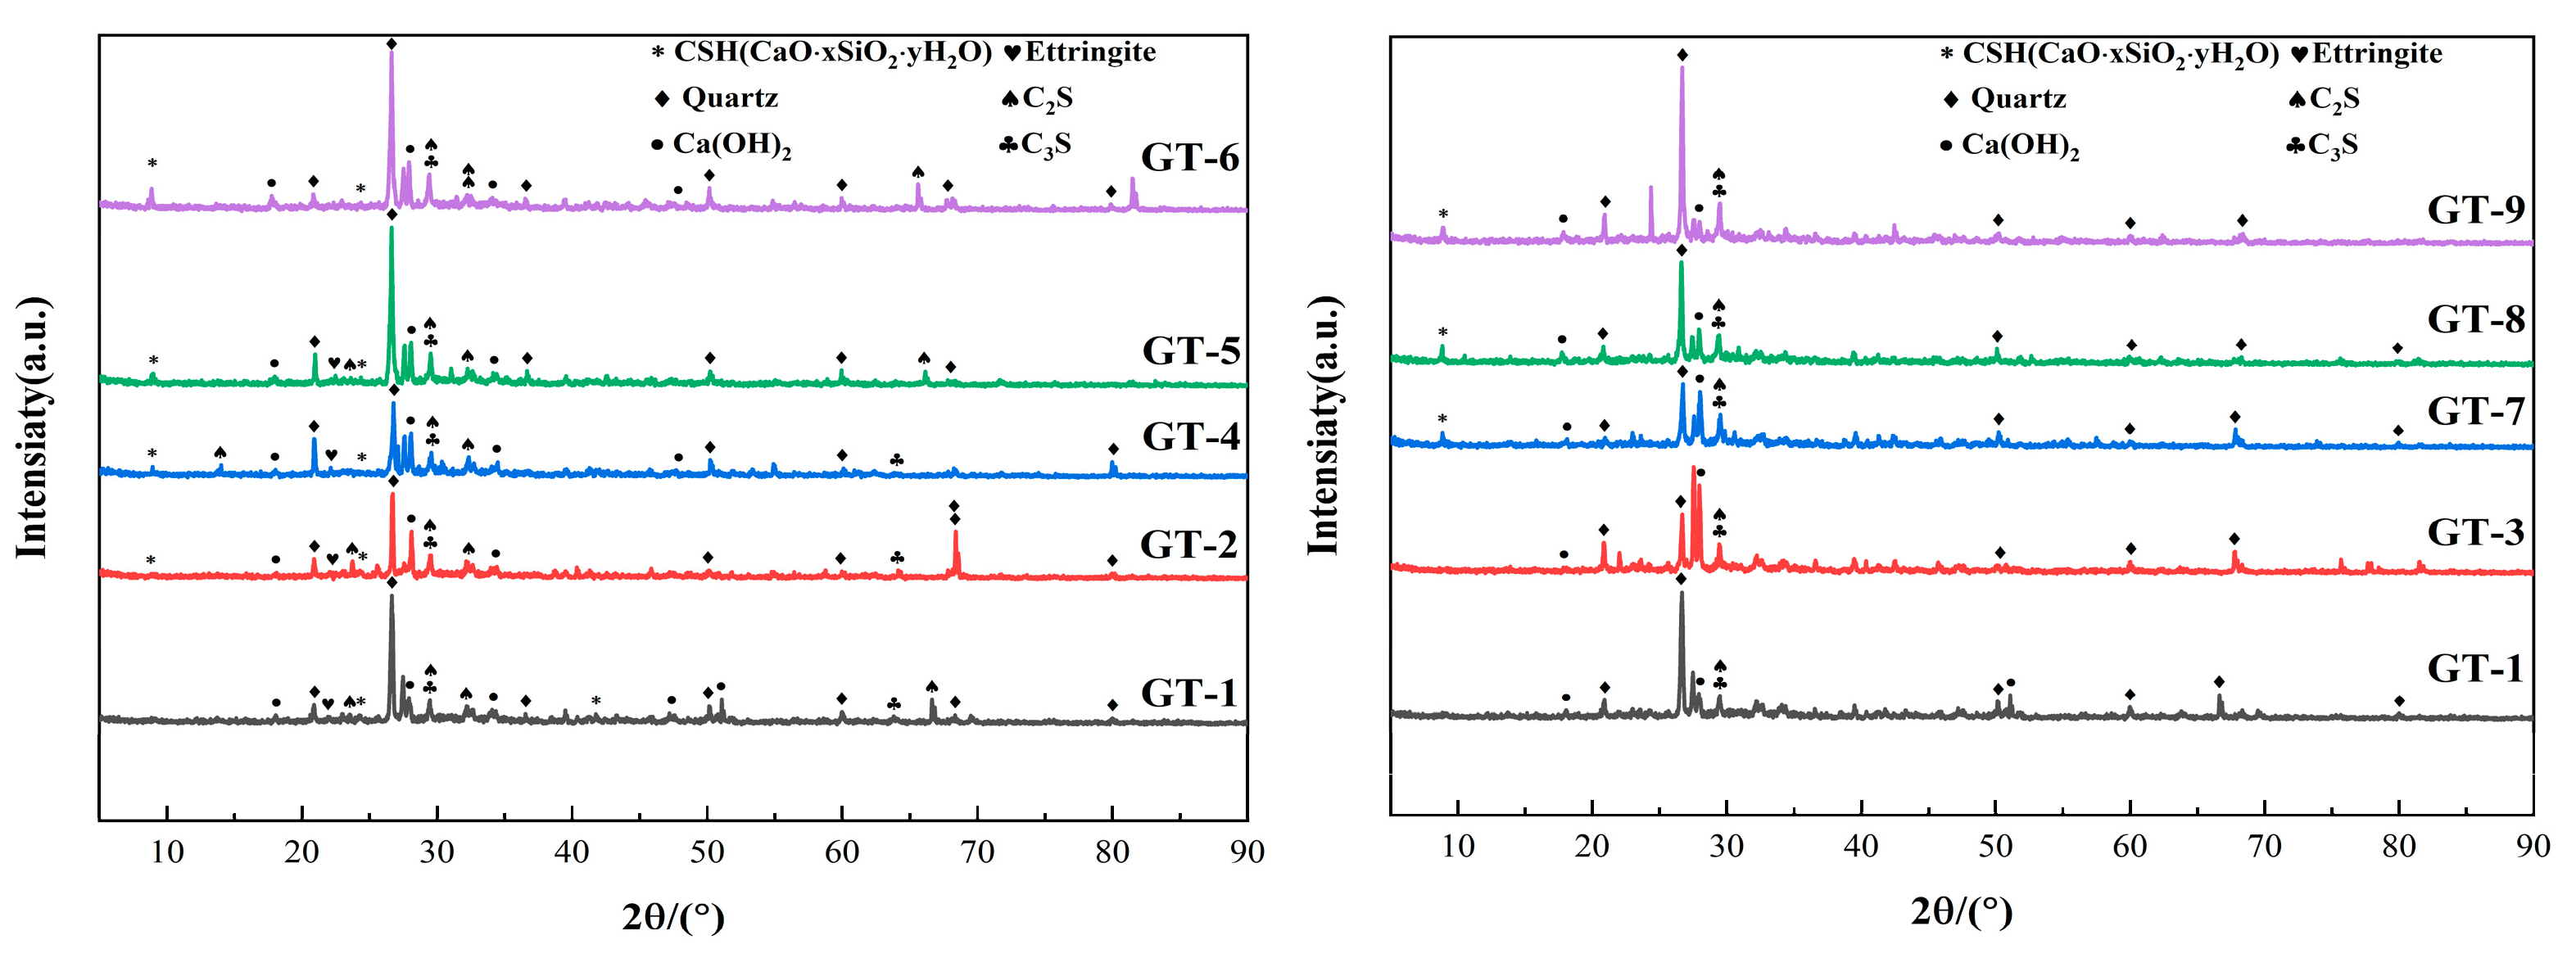
3.4.2. XRD Analysis
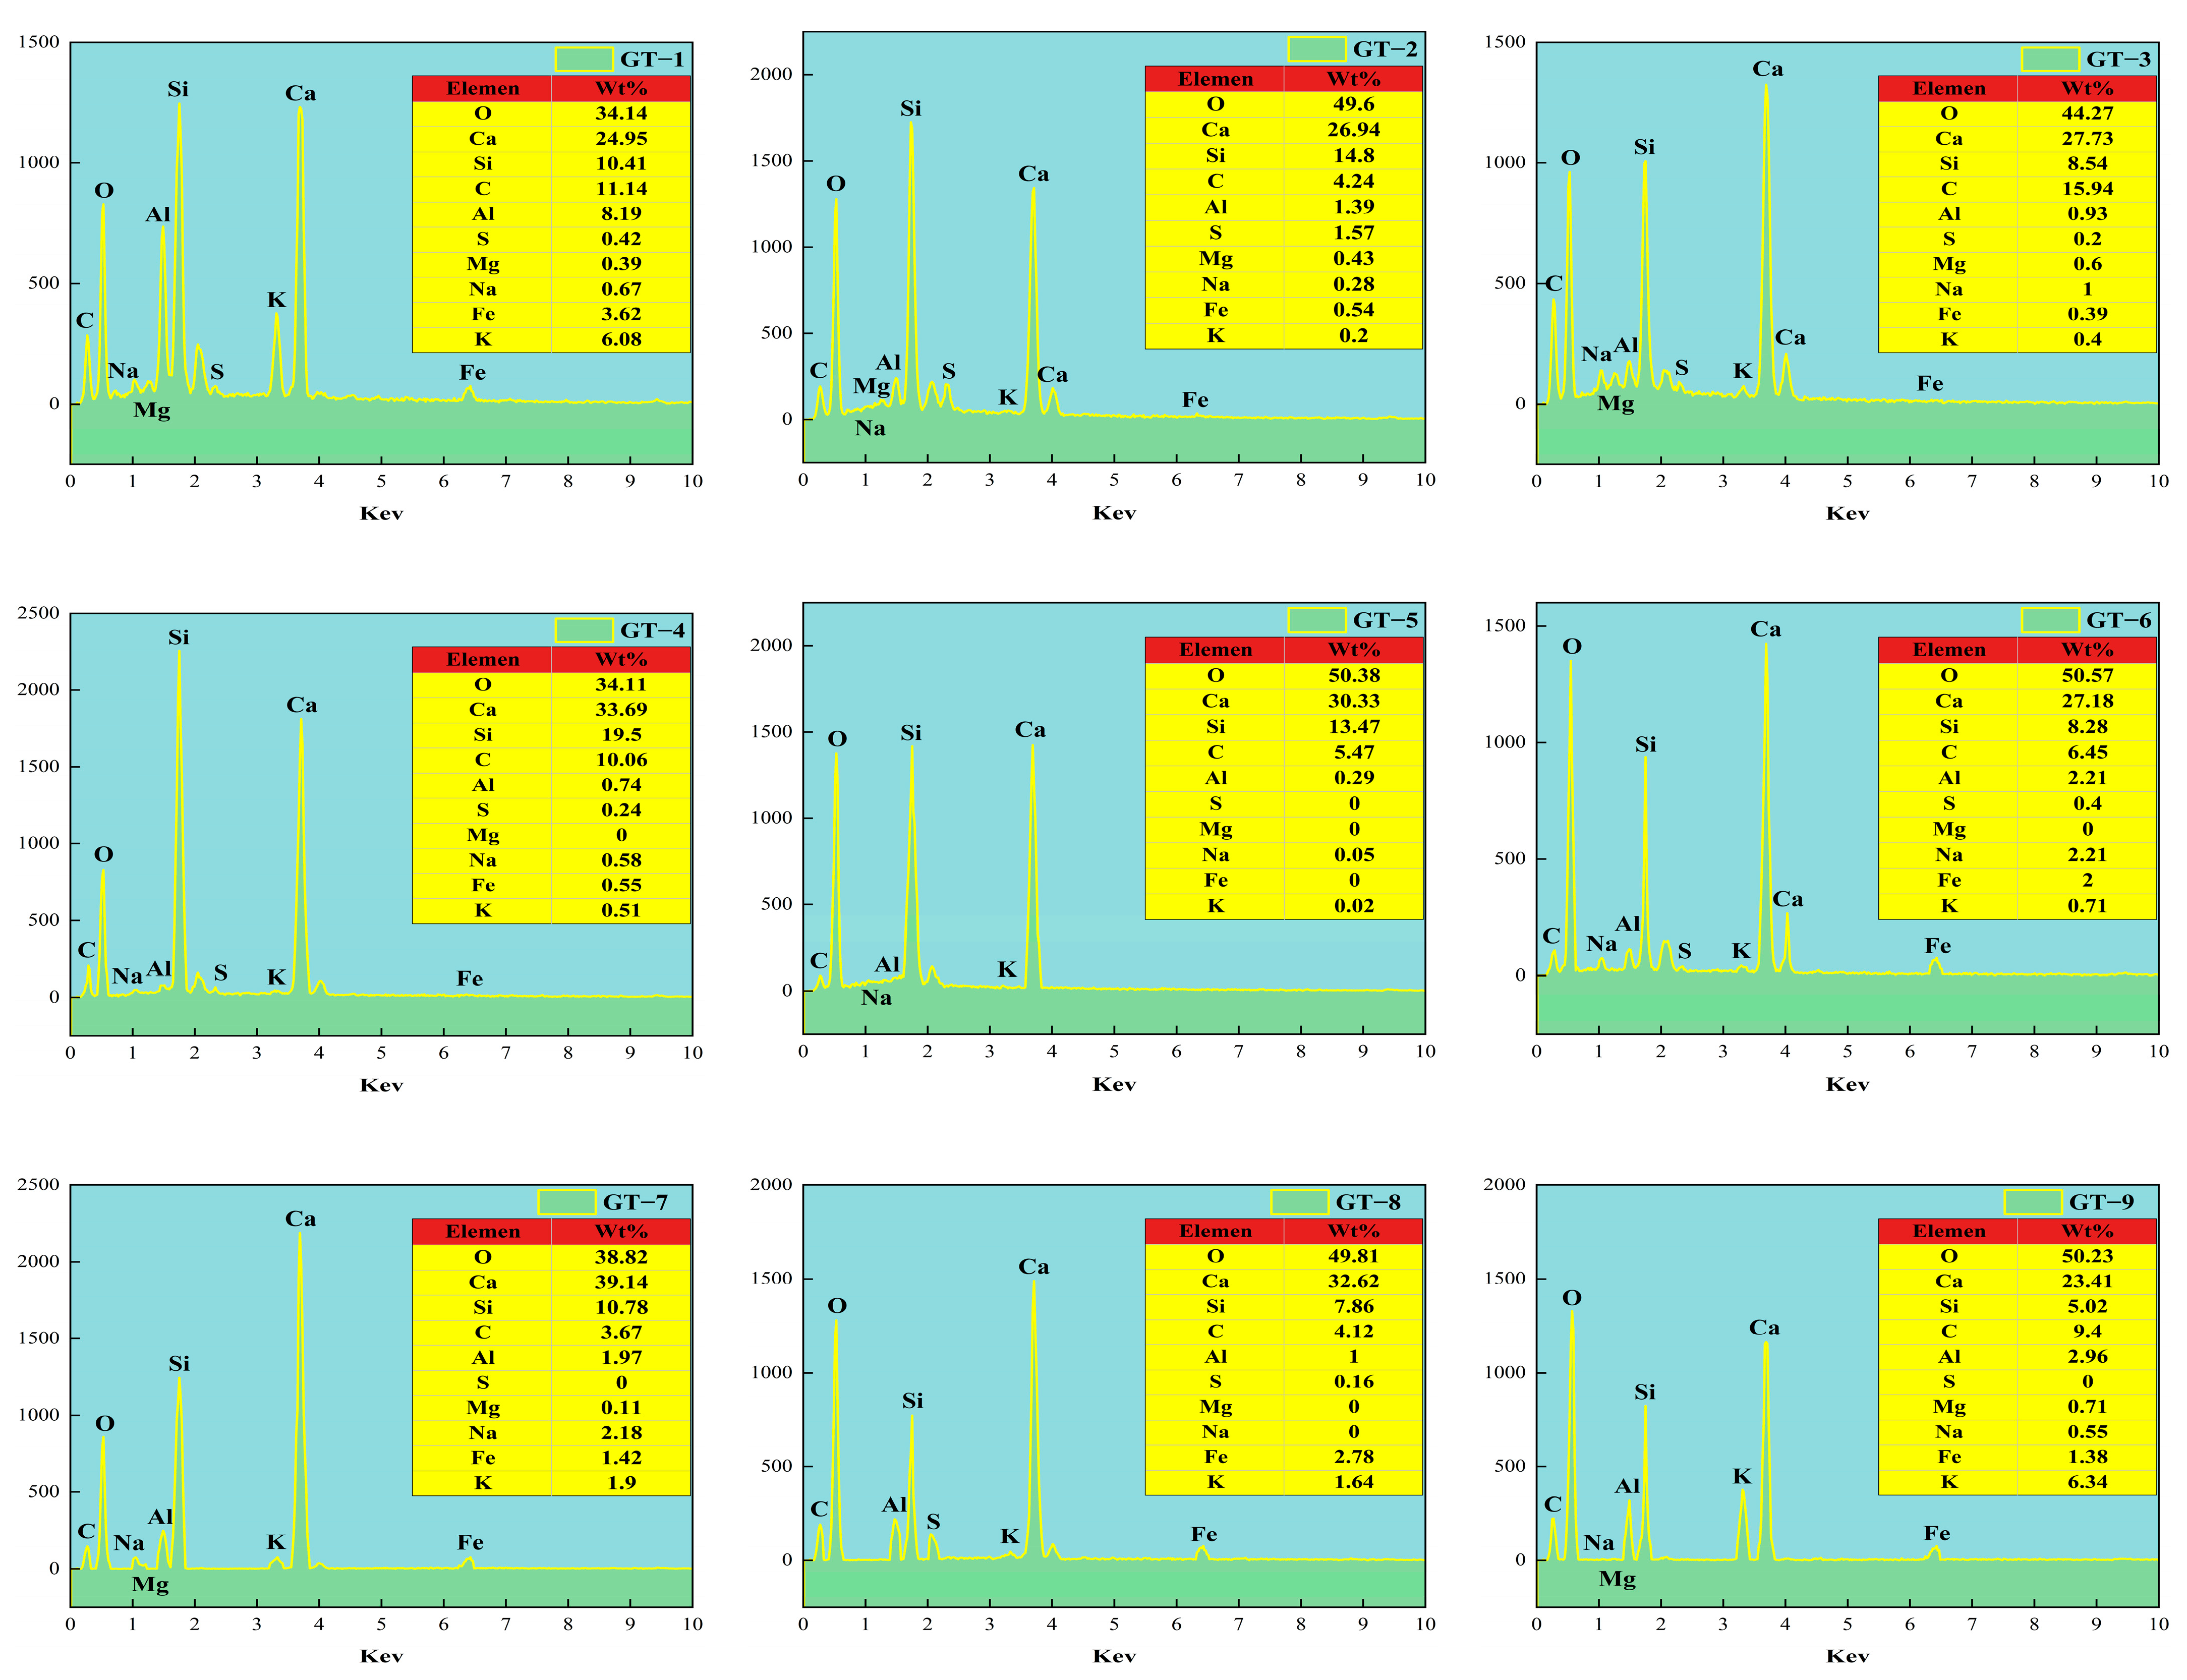
3.4.3. SEM/EDS Analysis
4. Conclusions
- The effect of SS (sodium silicate) and GT (graphite tailings) on the compressive capacity and internal densification of GT-HPM (graphite tailing high-performance mortar) was obvious. The optimum SS doping was 4%, and the GT substitution rate was 20%. The compressive strength of GT-4 reached a maximum of 63.05 Mpa, and the value of the sound velocity reached a maximum of 4.61 km/s. The compressive strength and the value of the sound velocity showed a quadratic polynomial relationship with the substitution rate of graphite tailing sand, and the fitting effect was good.
- Incorporation of 4% SS and 20% GT substitution rate significantly retarded the destructiveness of GT-HPM under freeze–thaw cycling. After 200 freeze–thaw cycles, the loss of compressive strength was 13.28%, the mass loss reached 0.17%, and the relative modulus of elasticity reached 95.57%, which improved the frost durability of GT-HPM.
- According to the microscopic mechanism, it was found that the microstructure of GT-4 was relatively dense without obvious cracks and pores. This was attributed to the fact that an appropriate amount of SS and GT would provide active Si for the hydrate gelling material for the second time, fill the pores and cracks, and optimize its pore structure. Excessive SS will lead to a high concentration of OH− and the formation of silica gel precipitation, which will affect the hydration reaction. While GT will hinder the hydration reaction due to its internal heavy metal content, reducing the performance of GT-HPM.
Author Contributions
Funding
Informed Consent Statement
Data Availability Statement
Conflicts of Interest
References
- Al-Noaimat, Y.A.; Chougan, M.; Al-kheetan, M.J.; Al-Mandhari, O.; Al-Saidi, W.; Al-Maqbali, M.; Al-Hosni, H.; Ghaffar, S.H. 3D printing of limestone-calcined clay cement: A review of its potential implementation in the construction industry. Results Eng. 2023, 18, 101115. [Google Scholar] [CrossRef]
- Liu, S.; Li, Q.; Zhang, J.; Zhao, K.; Wang, L.; Zhang, Z. Research on mechanical properties of high-strength thermal insulation mortar. Constr. Build. Mater. 2024, 420, 135260. [Google Scholar] [CrossRef]
- Ke, S.; Du, Y.; Fen, Z. Effect of bio-based internal curing agent on the performance of high-performance mortar. J. Build. Eng. 2022, 49, 104092. [Google Scholar]
- Djaknoun, S.; Ouedraogo, E.; Benyahia, A.A. Characterisation of the behaviour of high performance mortar subjected to high temperatures. Constr. Build. Mater. 2011, 28, 176–186. [Google Scholar] [CrossRef]
- Harbec, D.; Zidol, A.; Tagnit-Hamou, A.; Gitzhofer, F. Mechanical and durability properties of high performance glass fume concrete and mortars. Constr. Build. Mater. 2017, 134, 142–156. [Google Scholar] [CrossRef]
- Öz, H.Ö.; Güneş, M. The Effects of Synthetic Wollastonite Developed with Calcite and Quartz on High Performance Mortars; John Wiley Sons Ltd.: Hoboken, NJ, USA, 2021. [Google Scholar]
- Bernal, S.A.; Provis, J.L.; Rose, V.; Gutierrez, R.M.d. Evolution of binder structure in sodium silicate-activated slag-metakaolin blends. Cem. Concr. Compos. 2010, 33, 46–54. [Google Scholar] [CrossRef]
- Shi, Z.; Shi, C.; Wan, S.; Zhang, Z. Effects of alkali dosage and silicate modulus on alkali-silica reaction in alkali-activated slag mortars. Cem. Concr. Res. 2018, 111, 104–115. [Google Scholar] [CrossRef]
- Wang, P.; Liu, H.; Guo, H.; Yu, Y.; Guo, Y.; Yue, G.; Li, Q.; Wang, L. Study on preparation and performance of alkali-activated low carbon recycled concrete: Corn cob biomass aggregate. J. Mater. Res. Technol. 2023, 23, 90–105. [Google Scholar] [CrossRef]
- Wang, X.; Lan, Q.; Lin, H.; Wang, Y.; Wu, W.; Xu, L.; Fu, L.; Li, C. Effects of alkali activator on the chloride-ion permeability of one-part alkali-activated nickel slag concrete. Case Stud. Constr. Mater. 2024, 20, e02970. [Google Scholar] [CrossRef]
- Yang, H.; Wang, H.; Li, J.; Zhang, Z.; Huang, X.; Xue, Q. Strength evolution and microstructure of alkali-activated ultra-fine slag in low-temperature environments. Constr. Build. Mater. 2024, 435, 136852. [Google Scholar] [CrossRef]
- Ma, B.; Qi, H.; Tan, H.; Su, Y.; Li, X.; Liu, X.; Li, C.; Zhang, T. Effect of aliphatic-based superplasticizer on rheological performance of cement paste plasticized by polycarboxylate superplasticizer. Constr. Build. Mater. 2020, 233, 117181. [Google Scholar] [CrossRef]
- Meier, M.R.; Napharatsamee, T.; Plank, J. Dispersing performance of Superplasticizers Admixed to Aged Cement. Constr. Build. Mater. 2016, 139, 232–240. [Google Scholar] [CrossRef]
- Shi, C.; He, T.-S.; Zhang, G.; Wang, X.; Hu, Y. Effects of superplasticizers on carbonation resistance of concrete. Constr. Build. Mater. 2016, 108, 48–55. [Google Scholar] [CrossRef]
- Barma, S.D.; Baskey, P.K.; Rao, D.S.; Sahu, S.N. Ultrasonic-assisted flotation for enhancing the recovery of flaky graphite from low-grade graphite ore. Ultrason. Sonochem. 2019, 56, 386. [Google Scholar] [CrossRef] [PubMed]
- Vasumathi, N.; Kumar, T.V.V.; Ratchambigai, S.; Rao, S.S.; Raju, G.B. Flotation studies on low grade graphite ore from eastern India. Int. J. Min. Sci. Technol. 2015, 25, 415–420. [Google Scholar] [CrossRef]
- Tan, Y.; Wang, W.; Xu, Y.; Xing, C.; Liang, Z.; Zhang, J. Investigation on preparation and properties of carbon fiber graphite tailings conductive asphalt mixture: A new approach of graphite tailings application. Constr. Build. Mater. 2023, 402, 133057. [Google Scholar] [CrossRef]
- Zhang, J.; Wei, Q.; Zhang, N.; Zhang, S.; Zhang, Y. Comparative Study of Iron-Tailings-Based Cementitious Mortars with Incorporated Graphite Ore and Graphite Tailings: Strength Properties and Microstructure. Materials 2023, 16, 3743. [Google Scholar] [CrossRef]
- Du, C.; Lu, X.; Yi, F. Impact of modifiers on soil-water characteristics of graphite tailings. Sci. Rep. 2024, 14, 4186. [Google Scholar] [CrossRef]
- Zhen, Z.; Wu, X.; Ma, B.; Zhao, H.; Zhang, Y. Propagation network of tailings dam failure risk and the identification of key hazards. Sci. Rep. 2022, 12, 5580. [Google Scholar] [CrossRef]
- Liu, H.; Xue, J.; Li, B.; Wang, J.; Lv, X.; Zhang, J. Effect of graphite tailings as substitute sand on mechanical properties of concrete. Eur. J. Environ. Civ. Eng. 2022, 26, 2635–2653. [Google Scholar] [CrossRef]
- Xue, H.; Wang, J.; Jiang, Q. Mechanical properties and drying shrinkage of graphite tailing-basalt fiber cement mortar. Constr. Build. Mater. 2023, 409, 133898. [Google Scholar] [CrossRef]
- Zhang, Y.; Li, B.; Zhang, C.; Xu, H.; Li, K.; Zhao, C. Research on the mechanism of chlorine corrosion resistance of graphite tailings modified recycled coarse aggregate concrete: Corrosion product transformation and multi-scale mathematical characterization model. Corros. Sci. 2024, 233, 112099. [Google Scholar] [CrossRef]
- Quan, P.; Sun, Q.; Xu, Z.; Shi, M.; Gao, Z.; Wang, D.; Liu, D.; Yang, L.; Song, S. Study on the mechanical properties and strength formation mechanism of high-volume graphite tailings concrete. J. Build. Eng. 2024, 84, 108500. [Google Scholar] [CrossRef]
- Duan, H.; Liu, H.; Li, B.; Wang, Z.; Gao, H. Mechanical Properties and Mechanism Analysis of Graphite Tailings Environment-Friendly Concrete. Materials 2022, 15, 8870. [Google Scholar] [CrossRef]
- Wang, Z.-R.; Li, B.; Liu, H.-B.; Zhang, Y.-X.; Qin, X. Degradation characteristics of graphite tailings cement mortar subjected to freeze-thaw cycles. Constr. Build. Mater. 2020, 234, 117422. [Google Scholar] [CrossRef]
- GB/T 14684-2022; Sand for Construction. Standardization Administration of China: Beijing, China, 2022.
- Wu, H.; Shen, A.; Ren, G.; He, Z.; Wang, W.; Ma, B. An experimental investigation and optimization of the properties of concrete containing cellulose fiber based on system theory. Constr. Build. Mater. 2024, 411, 134463. [Google Scholar] [CrossRef]
- Ying, C.; Peng, L.; Fei, S.; Jian, Y.; Sasa, H.; Qianghui, L.; Zhiwu, Y.; Hailong, C. Study on the mechanical and rheological properties of ultra-high performance concrete. J. Mater. Res. Technol. 2022, 17, 111–124. [Google Scholar]
- Tsai, C.J. Investigate the mechanical behavior of alkali-activated slag mortar using sustainable waste sodium silicate-bonded sand as an alkali activator and carbon free aggregate. Constr. Build. Mater. 2024, 429, 136448. [Google Scholar] [CrossRef]
- Al-Kheetan, M.J.; Byzyka, J.; Ghaffar, S.H. Sustainable Valorisation of Silane-Treated Waste Glass Powder in Concrete Pavement. Sustainability 2021, 13, 4949. [Google Scholar] [CrossRef]
- GB/T 50081-2002; Standard Test Method for Mechanical Properties of Ordinary Concrete. Ministry of Construction of the People’s Republic of China: Beijing, China, 2003.
- GB/T 50082-2009; Standard for Test Methods of Long-Term Performance and Durability of Ordinary Concrete. General Administration of Quality Supervision, Inspection and Quarantine, Ministry of Construction of the People’s Republic of China: Beijing, China, 2009.
- Wang, H.; Wang, L.; Ren, Z.; Liu, S. Lead immobilization in tailings–based alkali–activated materials. Constr. Build. Mater. 2024, 428, 136246. [Google Scholar] [CrossRef]
- Liu, J.C.; Ji, H.; Kwan, A.K.H.; Ye, H. Optimization of alkali-activated binder reactive powder concrete based on concept of packing density. Powder Technol. 2024, 440, 119778. [Google Scholar] [CrossRef]
- Otsuki, N.; Miyazato, S.; Yodsudjai, W. Influence of Recycled Aggregate on Interfacial Transition Zone, Strength, Chloride Penetration and Carbonation of Concrete. J. Mater. Civ. Eng. 2003, 15, 443–451. [Google Scholar] [CrossRef]
- Jin, L.; Xie, C.; Yu, W.; Du, X. Effect of steel fiber content on failure strength and toughness of UHPC-CA at low temperature: An experimental investigation. J. Build. Eng. 2024, 94, 109976. [Google Scholar] [CrossRef]
- Babu, D.V. Assessing the performance of molarity and alkaline activator ratio on engineering properties of self-compacting alkaline activated concrete at ambient temperature. J. Build. Eng. 2018, 20, 137–155. [Google Scholar]
- Krizan, D.; Zivanovic, B. Effects of dosage and modulus of water glass on early hydration of alkali–slag cements. Cem. Concr. Res. 2002, 32, 1181–1188. [Google Scholar] [CrossRef]
- Ravikumar, D.; Peethamparan, S.; Neithalath, N. Structure and strength of NaOH activated concretes containing fly ash or GGBFS as the sole binder. Cem. Concr. Compos. 2010, 32, 399–410. [Google Scholar] [CrossRef]
- Liu, X.; Xie, X.; Liu, R.; Lyu, K.; Zuo, J.; Li, S.; Liu, L.; Shah, S.P. Research on the durability of nano-SiO2 and sodium silicate co-modified recycled coarse aggregate (RCA) concrete. Constr. Build. Mater. 2023, 378, 131185. [Google Scholar] [CrossRef]
- Wang, R.; Yu, J.; Liu, Q.; Kuang, D.; Gu, S. Influence of inorganic compounds on self-repairing capability and frost resistance of concrete incorporating ion chelating agent. J. Build. Eng. 2024, 91, 109754. [Google Scholar] [CrossRef]
- Zhang, H.; Sarker, P.K.; Xiao, L.; Ai, J.; He, B.; Ren, Q.; Zhu, X.; Zhang, Y. Durability of low-carbon geopolymer mortar: Different responses to cryogenic attack caused by water content and freeze-thaw mediums. Cem. Concr. Compos. 2023, 139, 105065. [Google Scholar] [CrossRef]
- Morsy, M.S.; Alsayed, S.H.; Al-Salloum, Y.; Almusallam, T. Effect of Sodium Silicate to Sodium Hydroxide Ratios on Strength and Microstructure of Fly Ash Geopolymer Binder. Arab. J. Sci. Eng. 2014, 39, 4333–4339. [Google Scholar] [CrossRef]
- Liu, H.; Bai, Q.; Ma, H.; Xin, Z.; Deng, S.; Jiang, C. Research on the preparation of eco-economical ultra-high performance concrete utilizing graphite tailings resources. Constr. Build. Mater. 2024, 438, 137102. [Google Scholar] [CrossRef]
- Wang, W.; Wang, B. Study on the influence of nano-silica substitution of reactive Si on the properties and hydration process of alkali-activated cementitious materials paste. Constr. Build. Mater. 2024, 443, 137759. [Google Scholar] [CrossRef]
- Wu, X.; Shen, Y.; Hu, L. Performance of geopolymer concrete activated by sodium silicate and silica fume activator. Case Stud. Constr. Mater. 2022, 17, e01513. [Google Scholar] [CrossRef]
- Zhu, Q.; Yuan, Y.X.; Chen, J.H.; Fan, L.; Yang, H. Research on the high-temperature resistance of recycled aggregate concrete with iron tailing sand. Constr. Build. Mater. 2022, 327, 126889. [Google Scholar] [CrossRef]
- Alventosa, K.M.; Wild, B.; White, C.E. The effects of calcium hydroxide and activator chemistry on alkali-activated metakaolin pastes exposed to high temperatures. Cem. Concr. Res. 2022, 154, 106742. [Google Scholar] [CrossRef]
- Huang, Y.; Kong, D.; Li, Y.; Zhou, S.; Shu, J.; Wu, B. Effect of different shapes of steel fibers and palygorskite-nanofibers on performance of ultra-high-performance concrete. Sci. Rep. 2024, 14, 8224. [Google Scholar] [CrossRef]
- Zhang, Z.; Cao, P.; Wang, Y.; Zhao, X.; Liu, J. Effect of Fe and Mn on the hydration activity of f-CaO in steel slag. Constr. Build. Mater. 2024, 421, 135719. [Google Scholar] [CrossRef]
- Wang, J.N.; Chen, F.X.; Yu, R.; Fan, D.Q.; Zhang, T.S. Effect of heavy metal (Mn, Pb and Cr) on the properties and hydration in low water/binder cement-based composites (LW/B-CC). Constr. Build. Mater. 2023, 386, 131567. [Google Scholar] [CrossRef]
- Yin, C.-Y.; Mahmud, H.B.; Shaaban, M.G. Stabilization/solidification of lead-contaminated soil using cement and rice husk ash. J. Hazard. Mater. 2006, 137, 1758–1764. [Google Scholar] [CrossRef]


| Setting Time (min) | Flexural Strength (MPa) | Compressive Strength (MPa) | Ignition Loss (%) | |||
|---|---|---|---|---|---|---|
| Initial | Final | 3d | 28d | 3d | 28d | |
| 260 | 315 | 4.7 | 8.2 | 25.2 | 51.2 | 4.1 |
| Ignition Loss (%) | Density (kg/m3) | Specific Surface Area (m2/kg) | Moisture Content (%) |
|---|---|---|---|
| 2.73 | 270 | 19,000 | 1.32 |
| Substance | SiO2 | Al2O3 | Fe2O3 | CaO | MgO | K2O | Na2O3 | TiO2 | SO3 | LOI |
|---|---|---|---|---|---|---|---|---|---|---|
| Cement | 22.68 | 4.7 | 4.07 | 59.64 | 4.03 | 1.15 | — | — | 3.08 | 4.1 |
| Silica fume | 97.27 | 0.07 | 0.15 | 0.01 | 0.01 | 0.01 | 0.01 | 0.27 | — | 2.73 |
| Modulus | °Bé | W (Na2O)% | W (SiO2)% | Density (g/cm3, 20 °C) |
|---|---|---|---|---|
| 2.5 | 50 | 14.12 | 33.11 | 1.5 |
| Tensile Strength (MPa) | Diameter (mm) | Length (mm) | Aspect Ratio |
|---|---|---|---|
| 1000 | 1 | 35 | 75 |
| Substance | SiO2 | SO3 | Al2O3 | CaO | Fe2O3 | K2O | MgO | TiO2 |
|---|---|---|---|---|---|---|---|---|
| 48.01 | 15.41 | 10.44 | 9.87 | 8.1 | 4.02 | 3.43 | 0.72 |
| Fineness Modulus | Apparent Density (kg/m3) | Packing Density (kg/m3) | Categorization | PH | |
|---|---|---|---|---|---|
| River Sand | 2.4 | 2594 | 1606 | Medium sand | 7 |
| Graphite tailings | 0.89 | 2857 | 1450 | Extra-fine sand | 8.8 |
| Mixture | RP (%) | GT | RS | C | ST | SF | W/B | WR | SS | SD (%) |
|---|---|---|---|---|---|---|---|---|---|---|
| GT-1 | 0 | 0 | 1200 | 960 | 96 | 240 | 0.2 | 19.2 | 0 | 0 |
| GT-2 | 0 | 0 | 1200 | 0.2 | 38.4 | 4 | ||||
| GT-3 | 0 | 0 | 1200 | 0.2 | 57.6 | 6 | ||||
| GT-4 | 20 | 240 | 960 | 0.2 | 38.4 | 4 | ||||
| GT-5 | 40 | 480 | 720 | 0.2 | 38.4 | 4 | ||||
| GT-6 | 60 | 720 | 480 | 0.2 | 38.4 | 4 | ||||
| GT-7 | 20 | 240 | 960 | 0.2 | 57.6 | 6 | ||||
| GT-8 | 40 | 480 | 720 | 0.2 | 57.6 | 6 | ||||
| GT-9 | 60 | 720 | 480 | 0.2 | 57.6 | 6 |
| Designation | Typical Surface Image of 0 Freeze–Thaw Test Samples | Typical Surface Image of 200 Freeze–Thaw Test Samples | Typical Surface Alteration Descriptions |
|---|---|---|---|
| GT-1 | 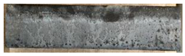 |  | Microcracks, softening |
| GT-2 | 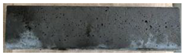 | 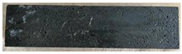 | Microcracks, micropores |
| GT-3 |  |  | Microcracks, surface peeling, and cracks |
| GT-4 | 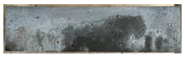 | 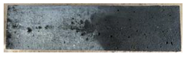 | Microcracks |
| GT-5 | 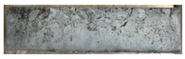 |  | Cracks, fissures, and spalling |
| GT-6 | 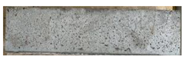 | 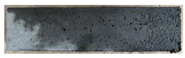 | Cracks, fissures, and moderate spalling |
| GT-7 | 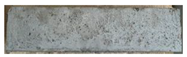 |  | Cracks, fissures, severe spalling, and softening |
| GT-8 | 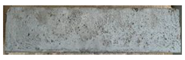 | 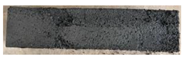 | Fissures, moderate spalling, and softening |
| GT-9 | 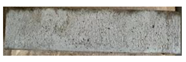 |  | Moderate crack, fissures, severe spalling, and softening |
| Species | Wavenumber | Type of Vibration |
|---|---|---|
| -OH | 3639 cm−1 | Stretching vibrations |
| H-O-H | 1645 cm−1 | Bending vibrations |
| O-C-O | 1427 cm−1 | Stretching vibrations |
| Si-O-T (T: Si or Al) | 784–795 cm−1 | Stretching vibrations |
| Si-O | 1117 cm−1 | Symmetric stretching vibration |
| Si-O | 462 cm−1 | In-plane bending vibration |
| Mixture | O | Ca | Si | C | Al | S | Mg | Na | Fe | K | Ca/Si |
|---|---|---|---|---|---|---|---|---|---|---|---|
| GT-1 | 34.14 | 24.95 | 10.41 | 11.14 | 8.19 | 0.42 | 0.39 | 0.67 | 3.62 | 6.08 | 2.40 |
| GT-2 | 49.6 | 26.94 | 14.8 | 4.24 | 1.39 | 1.57 | 0.43 | 0.28 | 0.54 | 0.2 | 1.82 |
| GT-3 | 44.27 | 27.73 | 8.54 | 15.94 | 0.93 | 0.2 | 0.6 | 1 | 0.39 | 0.4 | 3.25 |
| GT-4 | 34.11 | 33.69 | 19.5 | 10.06 | 0.74 | 0.24 | 0 | 0.58 | 0.55 | 0.51 | 1.73 |
| GT-5 | 50.38 | 30.33 | 13.47 | 5.47 | 0.29 | 0 | 0 | 0.05 | 0 | 0.02 | 2.25 |
| GT-6 | 50.57 | 27.18 | 8.28 | 6.45 | 2.21 | 0.4 | 0 | 2.21 | 2 | 0.71 | 3.28 |
| GT-7 | 38.82 | 39.14 | 10.78 | 3.67 | 1.97 | 0 | 0.11 | 2.18 | 1.42 | 1.9 | 3.63 |
| GT-8 | 49.81 | 32.62 | 7.86 | 4.12 | 1 | 0.16 | 0 | 0 | 2.78 | 1.64 | 4.15 |
| GT-9 | 50.23 | 23.41 | 5.02 | 9.4 | 2.96 | 0 | 0.71 | 0.55 | 1.38 | 6.34 | 4.66 |
Disclaimer/Publisher’s Note: The statements, opinions and data contained in all publications are solely those of the individual author(s) and contributor(s) and not of MDPI and/or the editor(s). MDPI and/or the editor(s) disclaim responsibility for any injury to people or property resulting from any ideas, methods, instructions or products referred to in the content. |
© 2024 by the authors. Licensee MDPI, Basel, Switzerland. This article is an open access article distributed under the terms and conditions of the Creative Commons Attribution (CC BY) license (https://creativecommons.org/licenses/by/4.0/).
Share and Cite
Jiang, R.; Wang, Z.; Du, Y.; Wen, Y. Study on the Performance of High-Performance Mortar (HPM) Prepared Using Sodium-Silicate-Modified Graphite Tailing Sand. Buildings 2024, 14, 3269. https://doi.org/10.3390/buildings14103269
Jiang R, Wang Z, Du Y, Wen Y. Study on the Performance of High-Performance Mortar (HPM) Prepared Using Sodium-Silicate-Modified Graphite Tailing Sand. Buildings. 2024; 14(10):3269. https://doi.org/10.3390/buildings14103269
Chicago/Turabian StyleJiang, Ruixin, Zhengjun Wang, Yingxin Du, and Yajing Wen. 2024. "Study on the Performance of High-Performance Mortar (HPM) Prepared Using Sodium-Silicate-Modified Graphite Tailing Sand" Buildings 14, no. 10: 3269. https://doi.org/10.3390/buildings14103269
APA StyleJiang, R., Wang, Z., Du, Y., & Wen, Y. (2024). Study on the Performance of High-Performance Mortar (HPM) Prepared Using Sodium-Silicate-Modified Graphite Tailing Sand. Buildings, 14(10), 3269. https://doi.org/10.3390/buildings14103269