Article

Evaluation of Overall Seismic Performance of RC Structures and Effectiveness of Seismic Isolation Technology Under Extreme Events: February 6, 2023, Earthquakes

Civil Engineering Department, Yildiz Technical University, 34220 Istanbul, Türkiye
Buildings 2025, 15(6), 990; https://doi.org/10.3390/buildings15060990
Submission received: 23 February 2025 / Revised: 16 March 2025 / Accepted: 18 March 2025 / Published: 20 March 2025

Abstract

:
Two large earthquakes with a series of aftershocks struck southeastern Türkiye within 9 h and had catastrophic consequences. Following the earthquake doublet, 11 provinces corresponding to approximately 1/7 of Türkiye were declared disaster zones. Even though the epicenters of the first event and second mainshocks were in Pazarcik and Elbistan with a magnitude ( M w ) of 7.7 and 7.6 with over 500 km of multiple-fault ruptures, Hatay province was the most heavily damaged province and had the highest number of casualties and collapsed buildings. A densely deployed strong ground motion array of the Disaster and Emergency Management Presidency of Turkey (AFAD) recorded the earthquake doublet of the two consequent mainshocks, including ground motions exhibiting near-fault features. A suite of recorded ground motions in Hatay province is incorporated to examine the destructiveness of ground motions on reinforced concrete Moment-Resisting Frame buildings and the effectiveness of seismic isolation technology to reduce the observed damage. Moreover, Turkish Seismic Design Code-2018 code provisions are elaborated to determine the characteristics of the investigated structures. Nonlinear response history analyses were conducted for 24 types of structures by following the design provisions. The inelastic hysteretic response features in the fixed-base and isolation systems are represented through an inelastic Single-Degree-of-Freedom Bouc–Wen hysteretic model. Extreme characteristics of near-fault ground motions on RC structures and seismically isolated systems resulted in excessive drift and displacement demands. Roof drifts of reinforced concrete Moment-Resisting-Frame buildings exceeded 4% roof drift in mid-rise buildings, compatible with the field observations in Antakya city center, where the displacement demand and ultimate base shear coefficient of seismically isolated structures considered in this study exceeded the elastic spectral coefficient values of the design spectrum in the proximity of fault ruptures.

1. Introduction

Türkiye has the highest seismicity and suffers the utmost among European countries based on historical and instrumental measurement data. Türkiye is located in plate boundaries where complex interactions of Eurasian, African, Arabian, and Anatolian plates yield crustal deformations, high seismicity, and destructive earthquakes. As a result, the 1500 km long lateral strike-slip North Anatolian Fault (NAF) and 700 km long left lateral strike-slip East Anatolian Transform Fault accommodate approximate annual slip rates of 2.5 cm (on NAF) and 1.0 cm (on EAF) [1,2,3,4,5,6,7,8,9,10,11,12,13]. The 1999 Gölcük and Düzce earthquakes, the 2011 Van Earthquakes [14], and the 2020 Elazig Sivrice and Bayrakli earthquakes are the major earthquakes that hit Türkiye in the last decades. On 6 February 2023, southeastern Türkiye was struck by a series of main shocks with epicenters located in Pazarcik, hit with M w = 7.7 at 04:17, and in the Elbistan district of Kahramanmaraş, hit with M w = 7.6 at 13:24 local time, respectively [15,16]. The first main shock ( M w = 7.7) was located eastward of the East Anatolian Fault and had a multi-segment rupture up to the northern part of the Dead Sea Fault (DSFZ). The fault rupture initiated on the Narli fault branch and was directed northward until its junction with the EAF. Afterwards, a bilateral rupture took place on the EAF. A total surface rupture during the earthquake exceeded 500 km [13,17,18,19,20]. In this study, the earthquake doublet term refers to the consequent two main shocks recorded above 7.5 magnitude. Both consequent earthquakes had multi-segment ruptures that do not match the M w = 7.5 provincial earthquake scenario used for earthquake preparedness of Kahramanmaraş. The 6 February 2023 Türkiye earthquakes were the most destructive earthquakes of the last century regarding death toll and financial losses. Apart from the officially reported 53,537 casualties and 107,213 injuries, direct and indirect economic losses officially have exceeded the USD 100 billion threshold in Türkiye. Due to widespread damage in a large geography corresponding to 1/7 of Türkiye, eleven provinces were declared disaster regions [15,16].
Building damage statistics were systematically examined through a reconnaissance study. Various types of buildings suffered during the February 6, 2023, Türkiye earthquakes. Among structural classes, reinforced concrete (RC) residentials have the highest percentage in the building inventory, and they require special attention due to their damage patterns and structural deficiencies. RC Moment-Resisting Frames (MRFs) are a commonly used seismic force-resisting system that consist of beams, columns, and beam–column joints. These members are detailed and proportioned to resist internal forces under multiple reversed cycles of earthquakes. Therefore, Turkish Seismic Design Code (TSDC)-2018 provisions relying on strength-based design methods should be overviewed carefully to understand the attributes of the extensive damage in reinforced concrete buildings during the 2023 earthquake doublet. Apart from conventional building damage statistics, the earthquake-affected regions have also transformed into a test bed for new technologies. Properly designed and constructed seismically isolated (SI) hospital buildings have outperformed the conventionally constructed hospital buildings in the disaster region. Since seismic isolation technology is an effective earthquake-resilient design strategy for new structures and retrofitting existing structures, it is essential to extend the applications for residential buildings, which were still limited in Türkiye. Hereafter, conventionally designed buildings will be named fixed-base buildings to distinguish them from SI buildings.
This study evaluates the destructiveness of waveforms in Hatay based on various earthquake-resistant structural systems. Among disaster zone provinces, Hatay has the highest number of official death tolls and building collapses. The seismic performance of buildings and observed damage patterns from site surveys in Hatay were addressed holistically with the nonlinear response history analysis to indicate the destructiveness of the near-fault ground motions in Antakya city center (Figure 1). Surprisingly, some of the collapsed buildings were found to be designed with the TSDC-2018 in Hatay [21]. This fact has created perturbation where the structural safety and the seismic design provisions are questioned by the engineering community. Therefore, a particular section is devoted to an overview of the strength-based design principles from the perspective of extreme earthquakes.
The novelty of this study is the comprehensive evaluation of extreme ground motion records through practice-oriented nonlinear response history analysis in Hatay. MATLAB (2023a version) routines of developed tools comply with the code provisions of the TSDC-2018 and incorporate the design perspective inherently for the investigated building typologies. Influences of the ground motion characteristics on the collapse of RC MRF structures are systematically sought for the 2023 earthquake doublet. The historical seismicity and seismotectonic structure of the disaster region, strong ground motion parameters, field observations from the site surveys, strength-based design principles of the TSDC-2018, inelastic modeling approaches, Bouc–Wen hysteretic model, and nonlinear response history analysis results of the 24 structural systems are described comprehensively in the flow of this study.

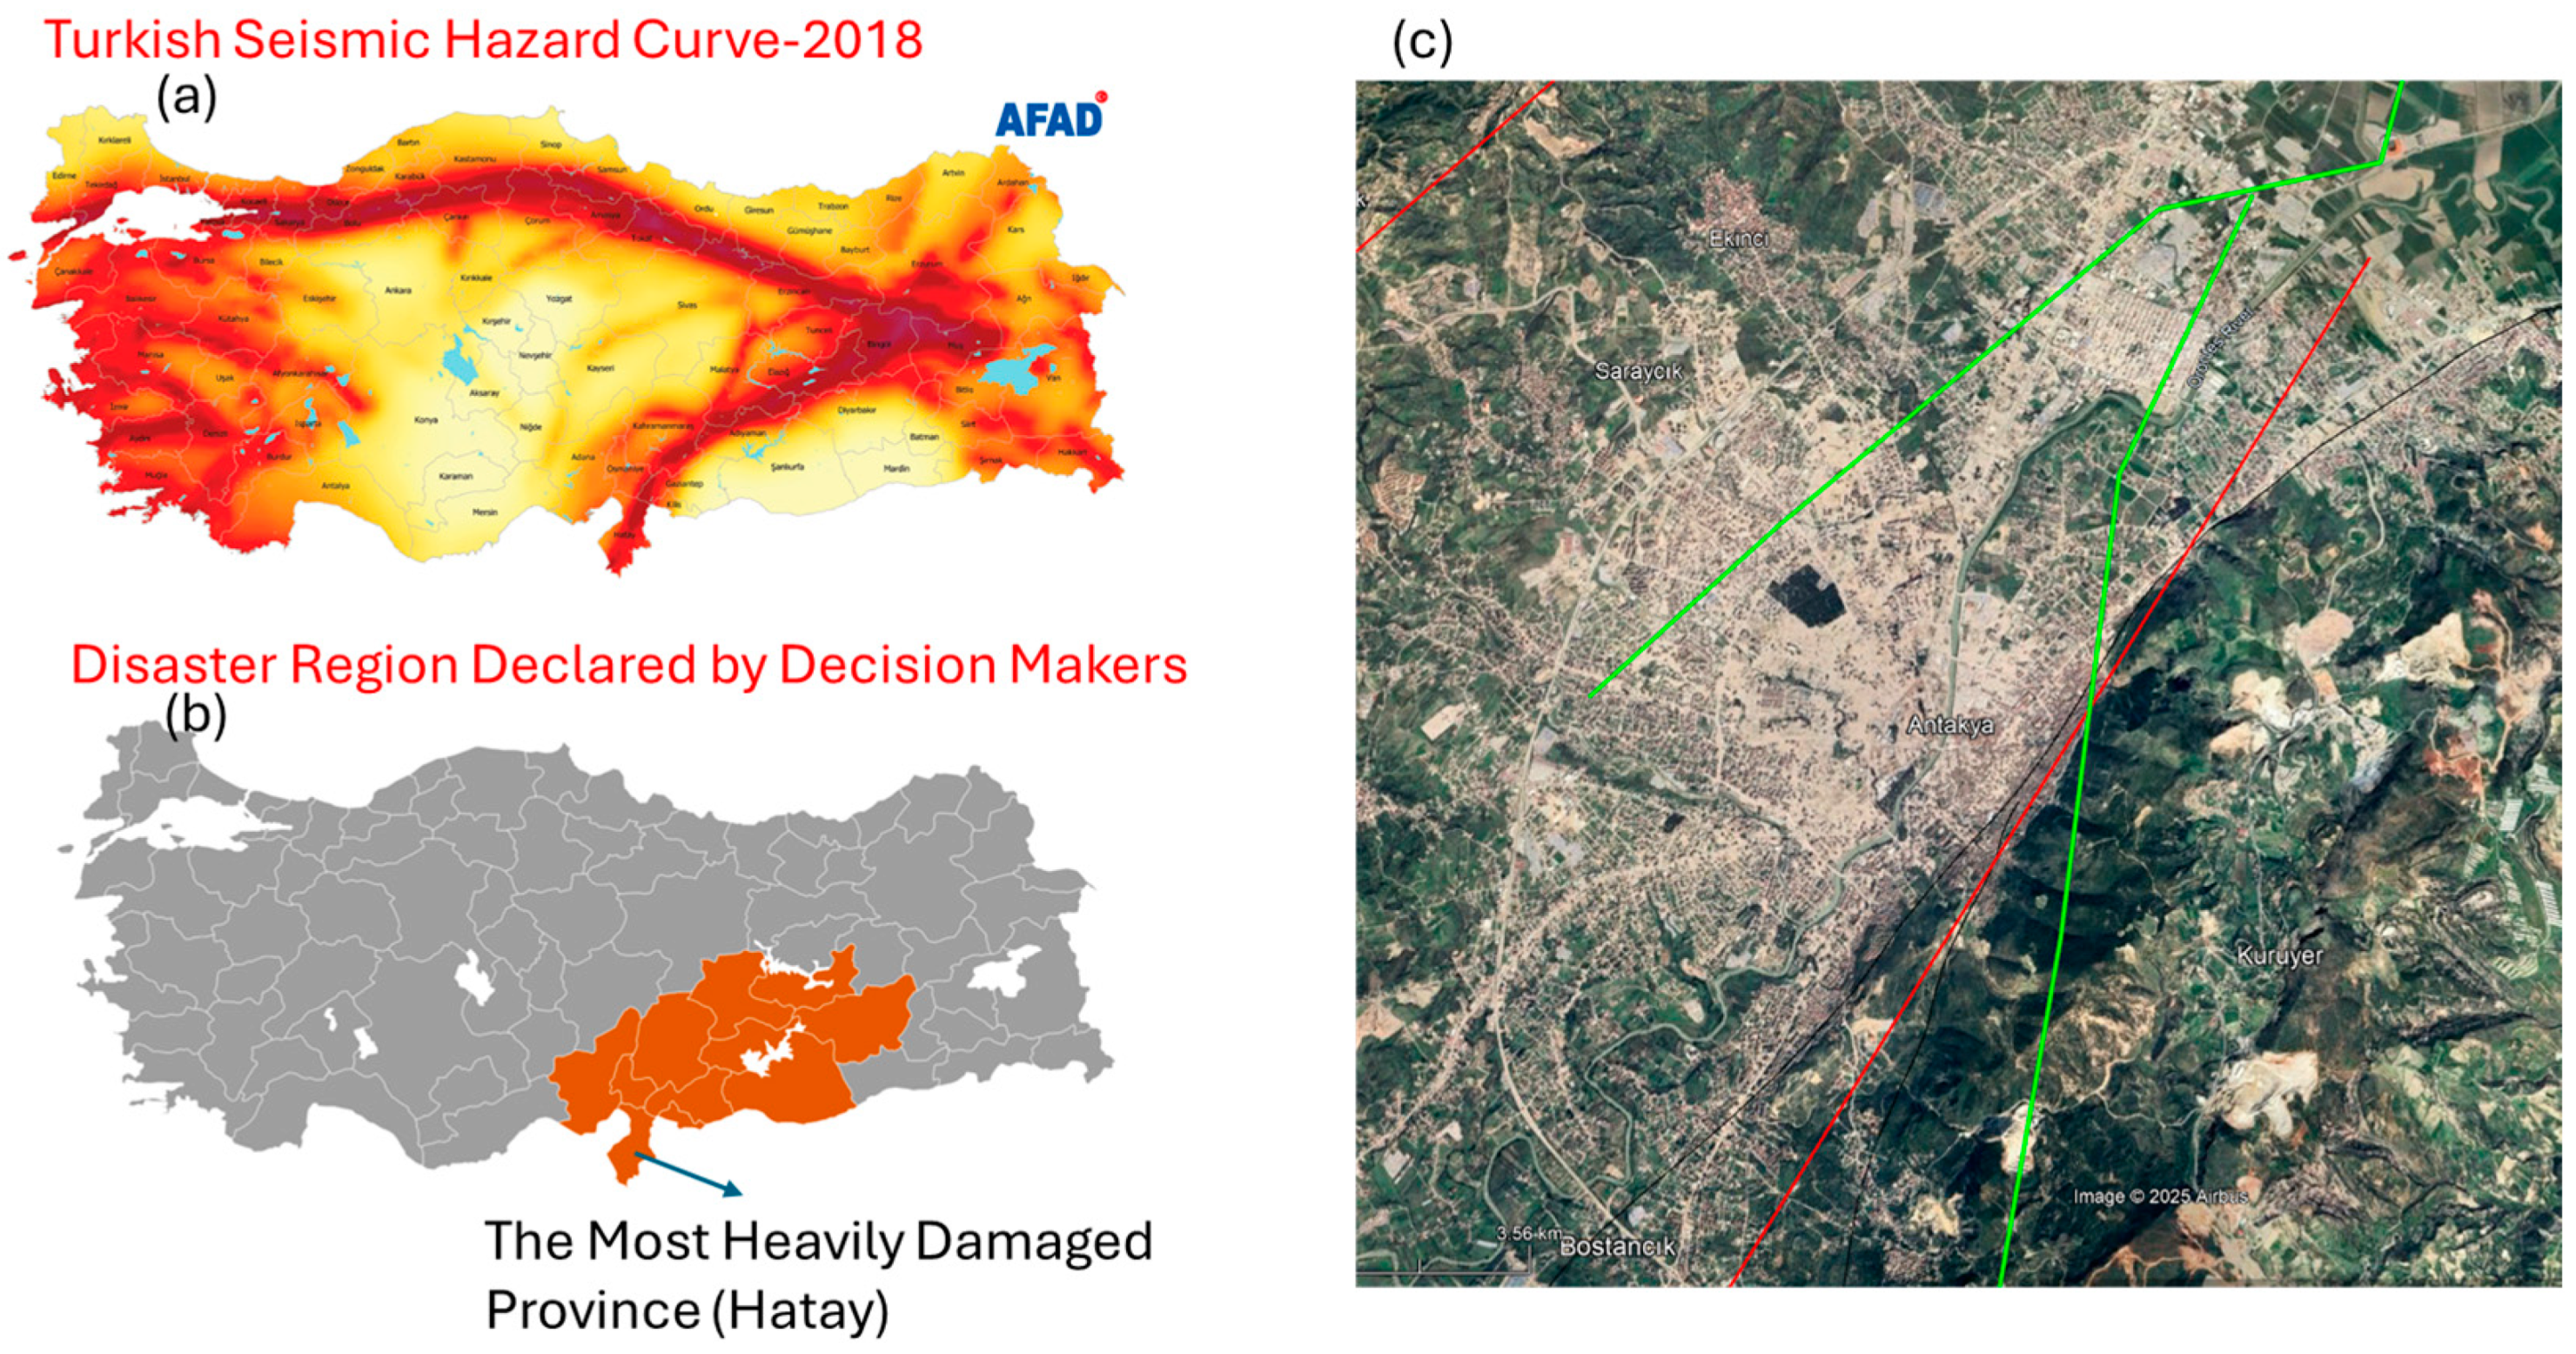
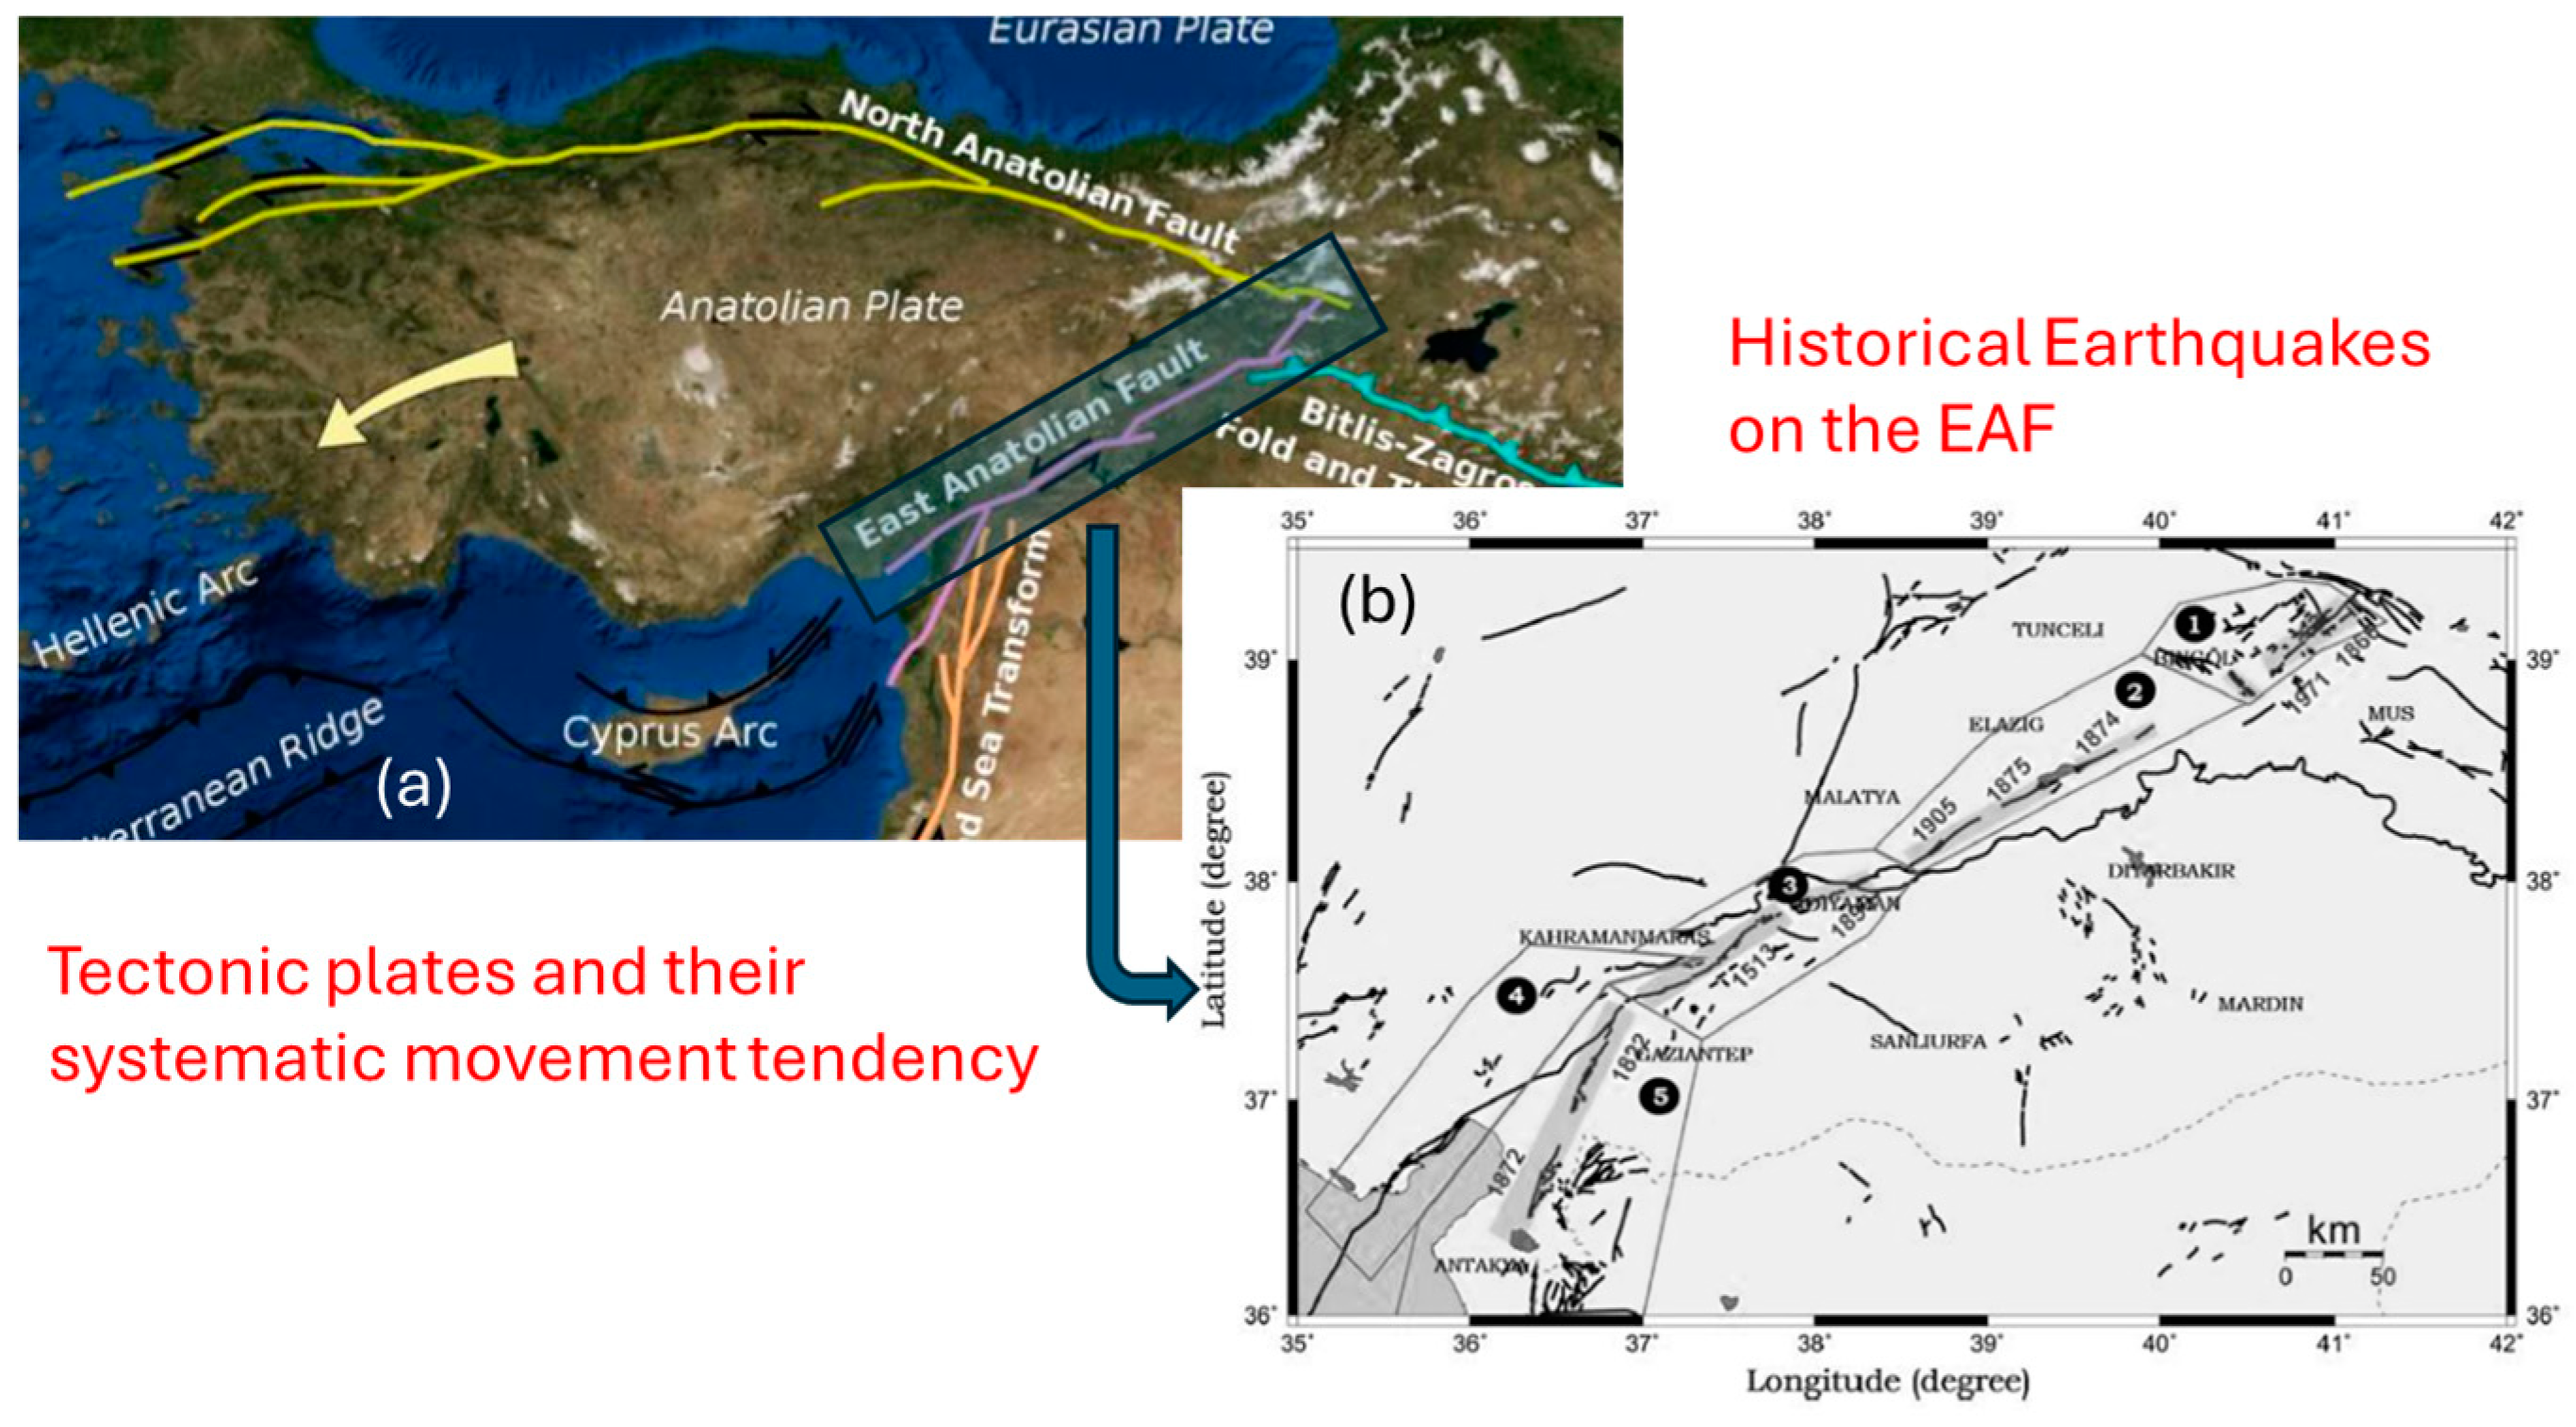
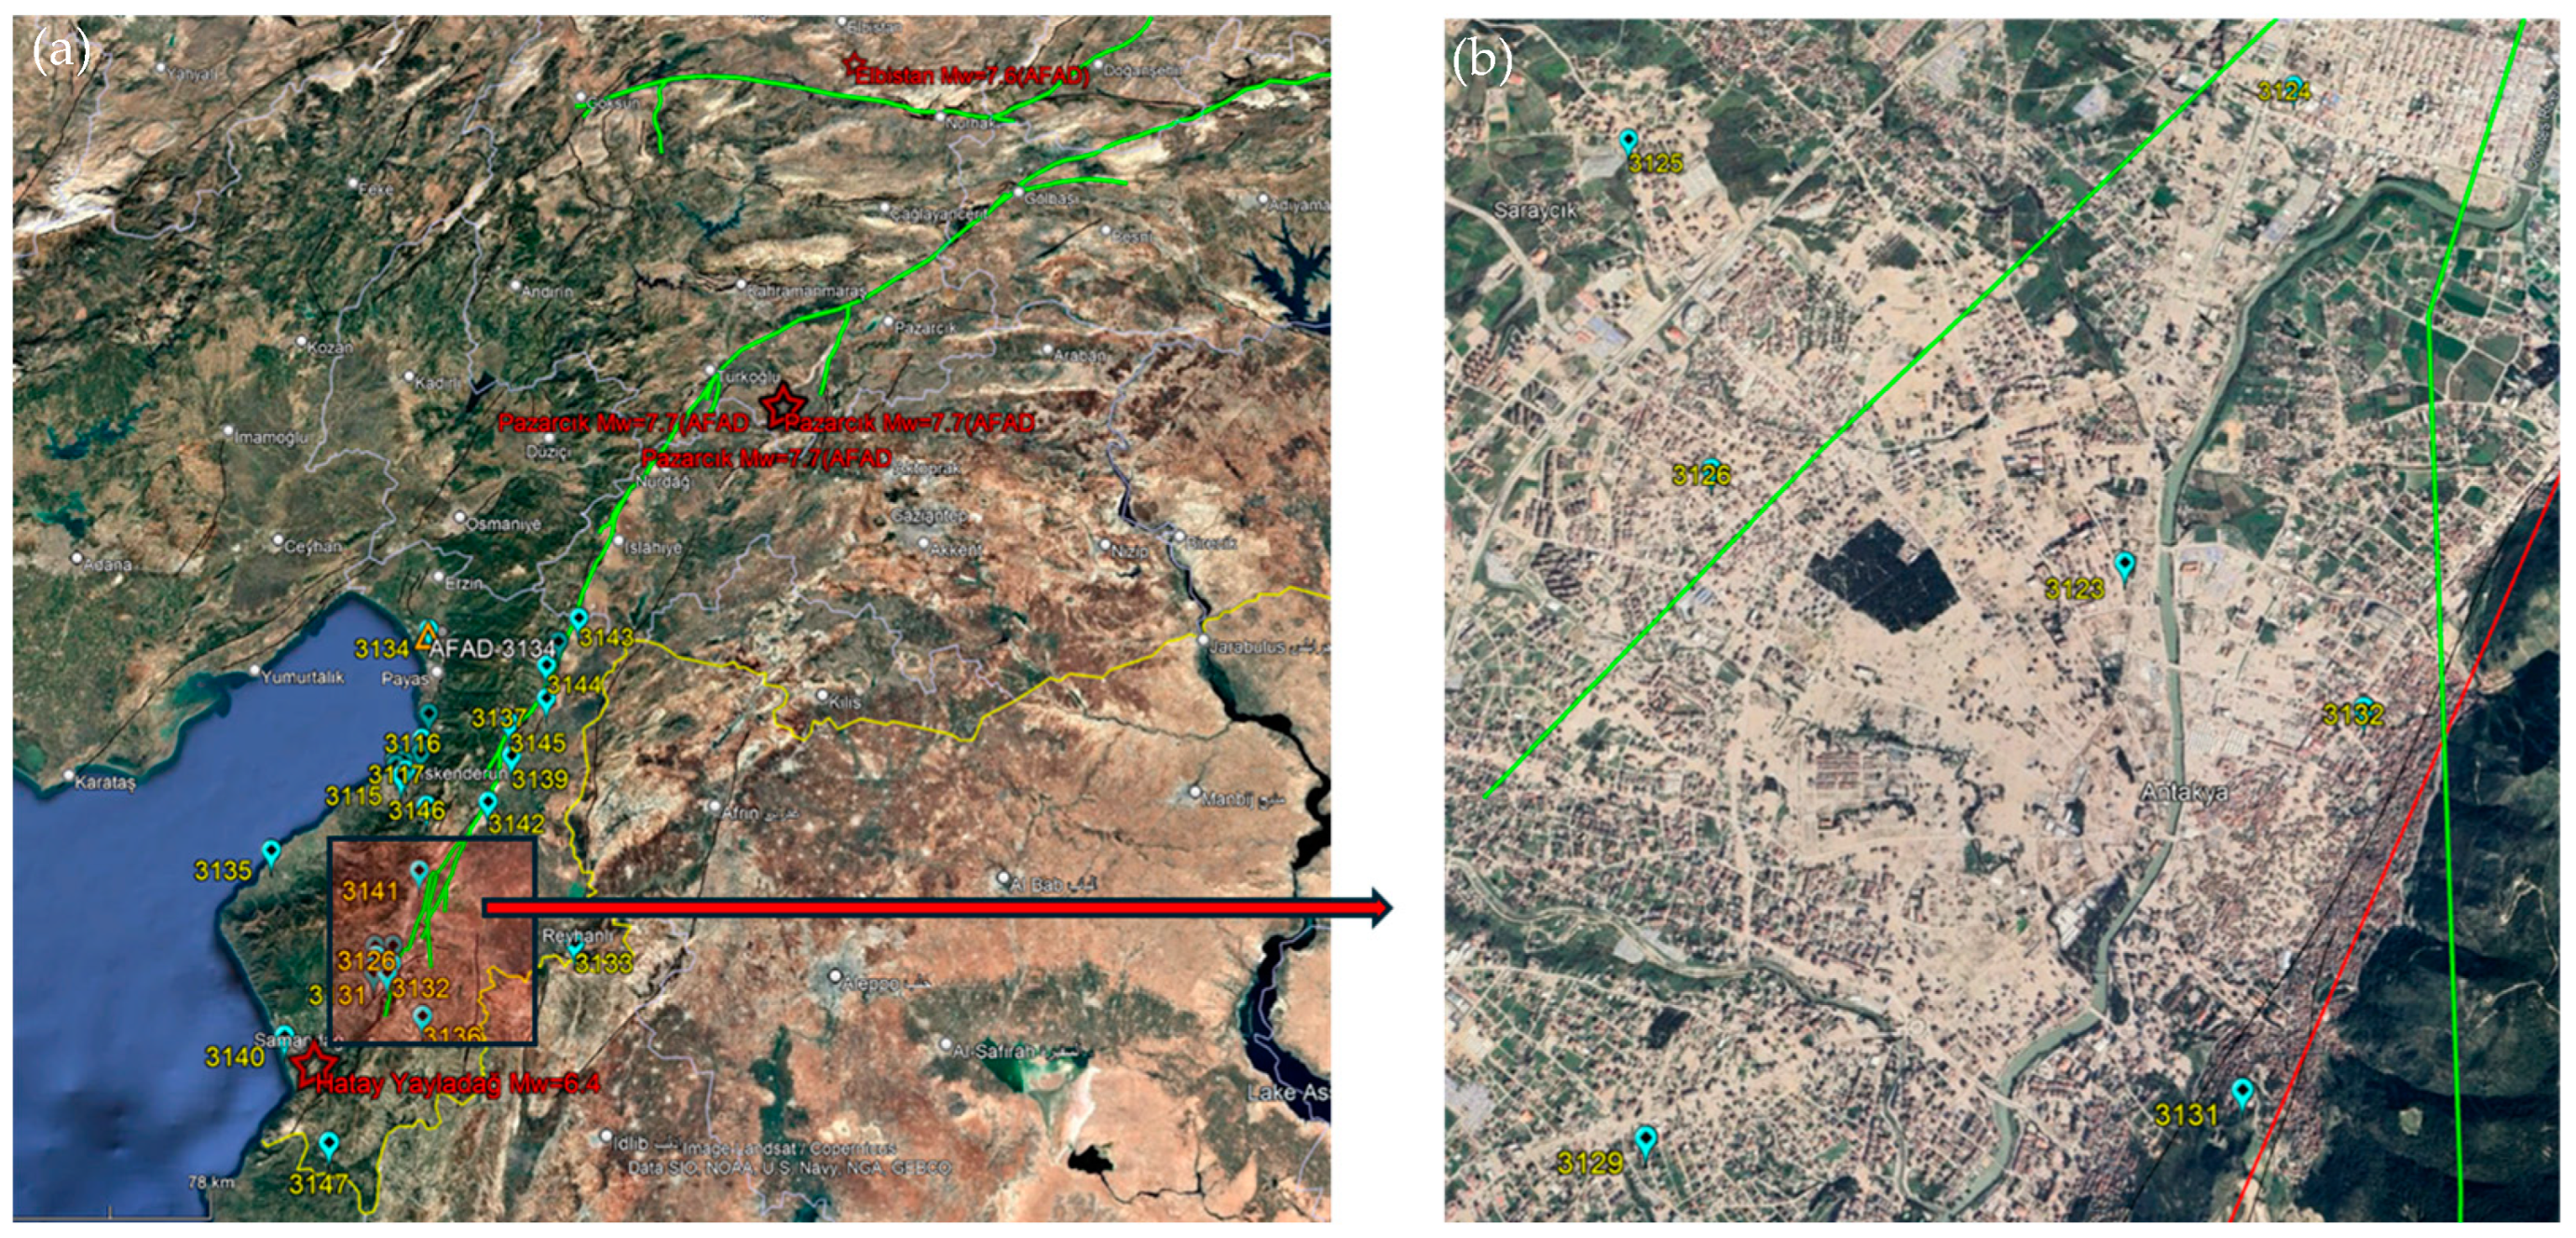
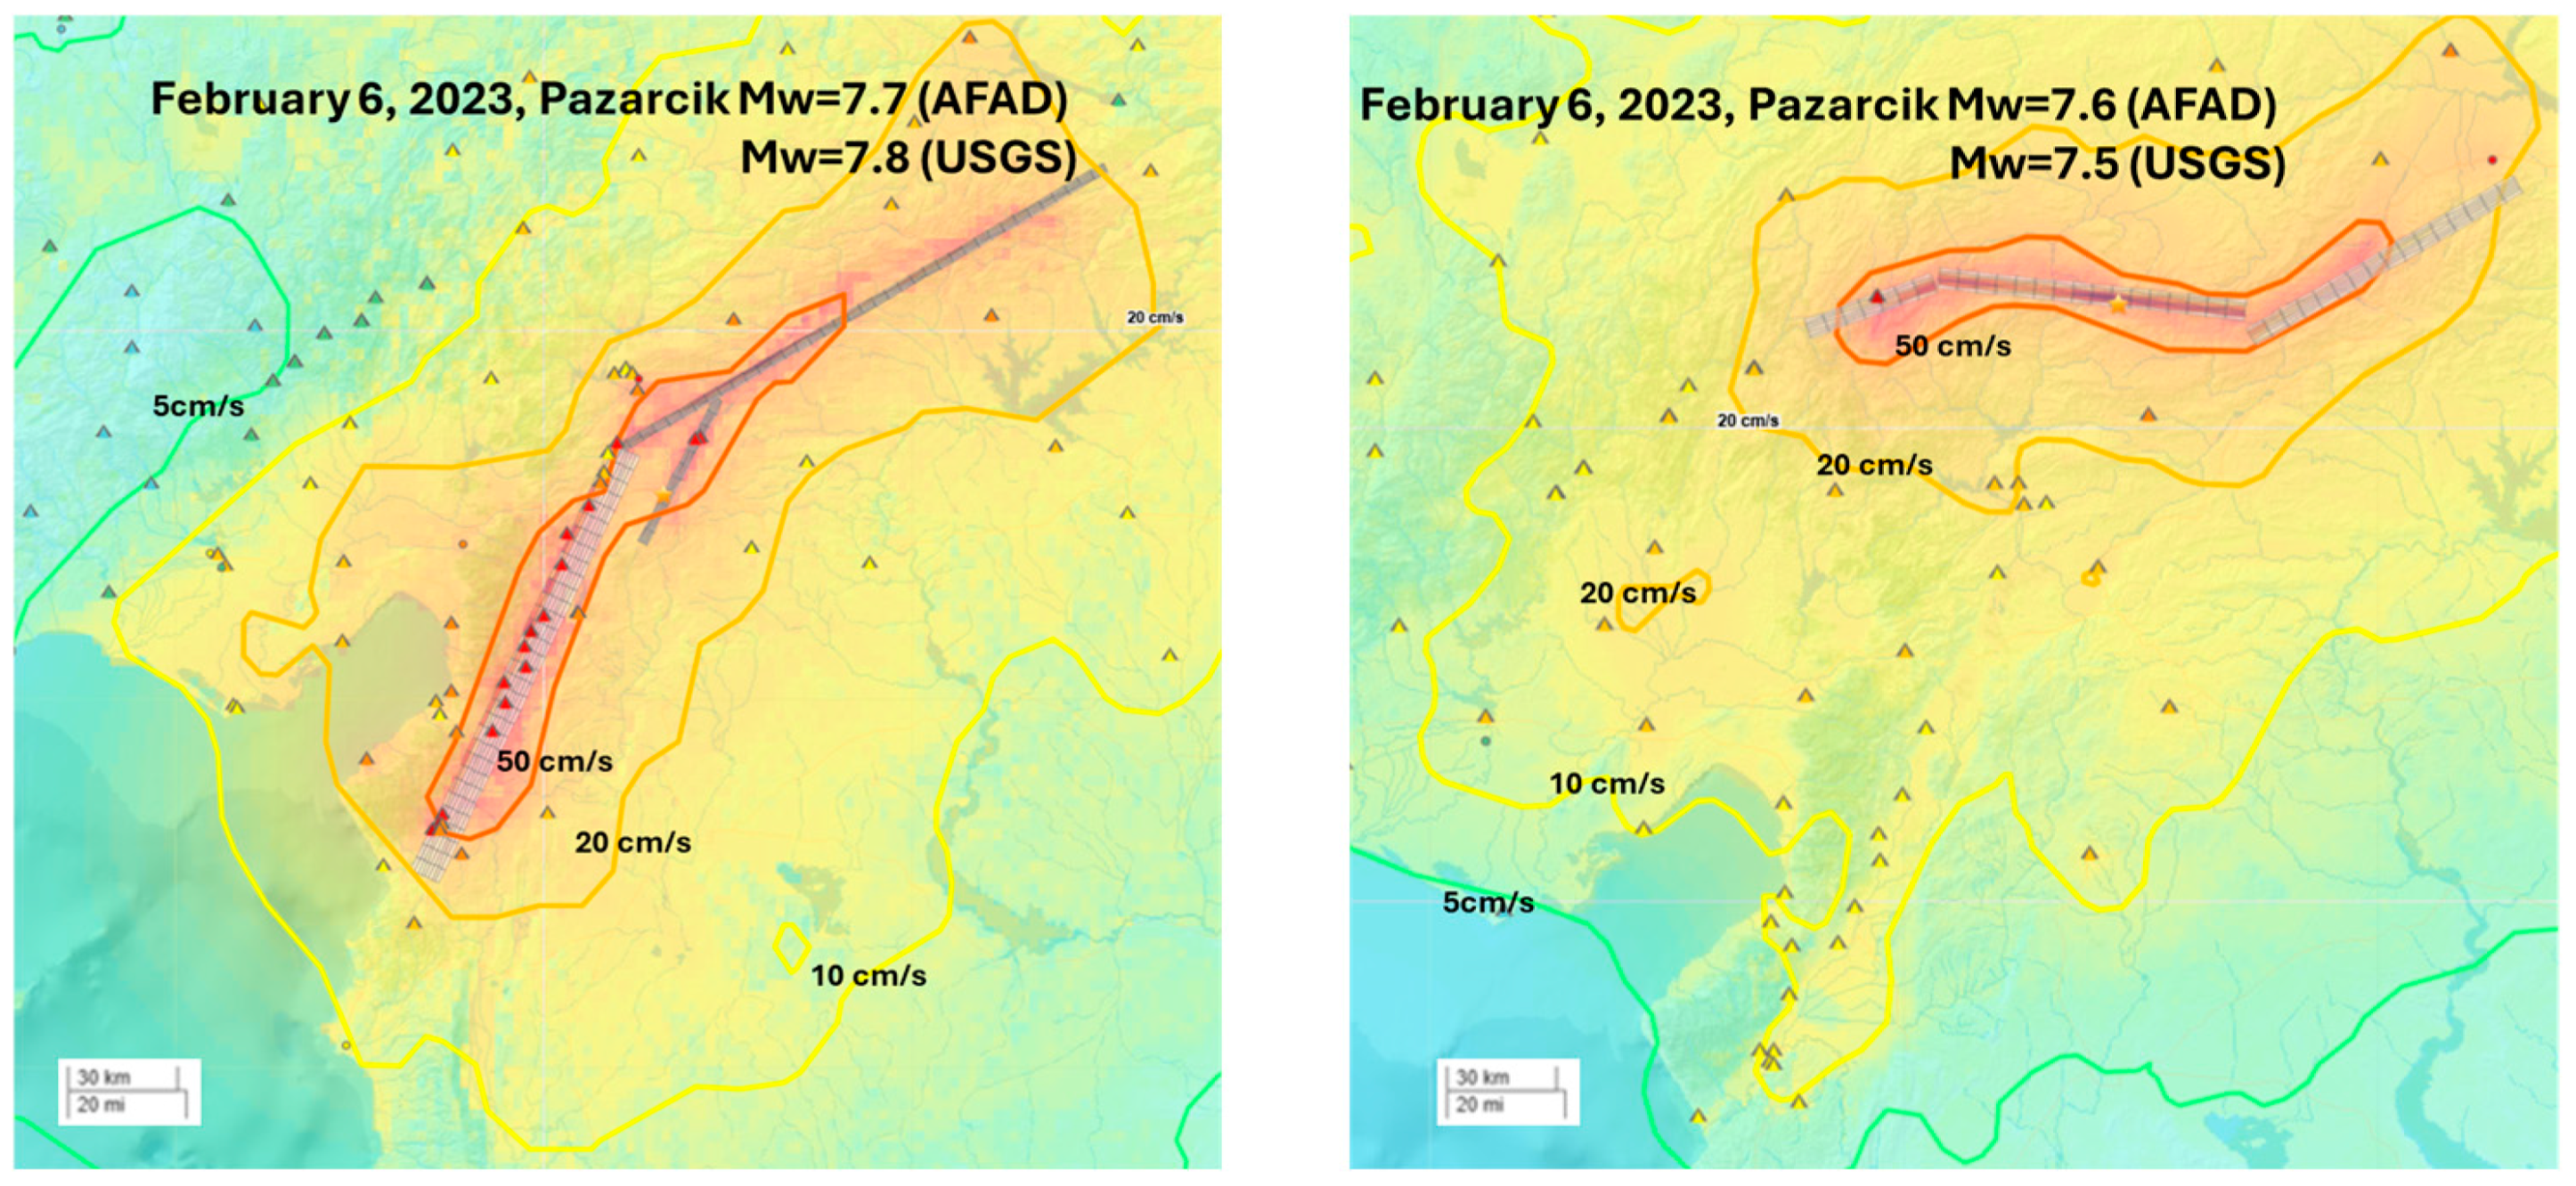
2. Seismicity and Seismotectonic of the Disaster Region

The seismotectonic of Türkiye shows two major active tectonic structures that cause a westward movement with a right-lateral strike-slip on the North Anatolian Fault (NAF) with a slip rate of 2–2.5 cm and the left-lateral strike-slip East Anatolian Fault (EAF) with 1 cm (Figure 2) [1,2,6,7,8,9,10,11,12,13]. In conformity with the historical records, EAF had varying seismicity where two damaging earthquakes took place on the EAF between 1114 and 1513 ( M s = 7.4) on the Gölbaşı-Türkoğlu strand of the transform fault. Then, large magnitude ( M s ) earthquakes with their estimates on the EAF and the Dead Sea Fault zone were listed as 1822 Aleppo, 1872 Amik Lake, and 1893 Malatya earthquakes 7.4, 7.2, and 7.1, respectively. The occurrence of the historic earthquakes on multi-fault segments is shown in Figure 2 [1,2,3,4,5,6,7,8,9,10,11,12,13].
The locations of three main shocks with their focal mechanism and nine aftershocks equal to or larger than M w = 5.5 that occurred during the 2023 Türkiye earthquake sequence between 6 February and 27 February 2023 are shown in Figure 3. Following the 2023 earthquake doublet, high seismicity in the disaster region was regularly assessed through the evaluation tools and having access to the Disaster and Emergency Management Presidency of Turkey (AFAD). Regarding AFAD catalogs, ref. [22] the number of recorded events has already passed 60,000, as illustrated in Figure 4.

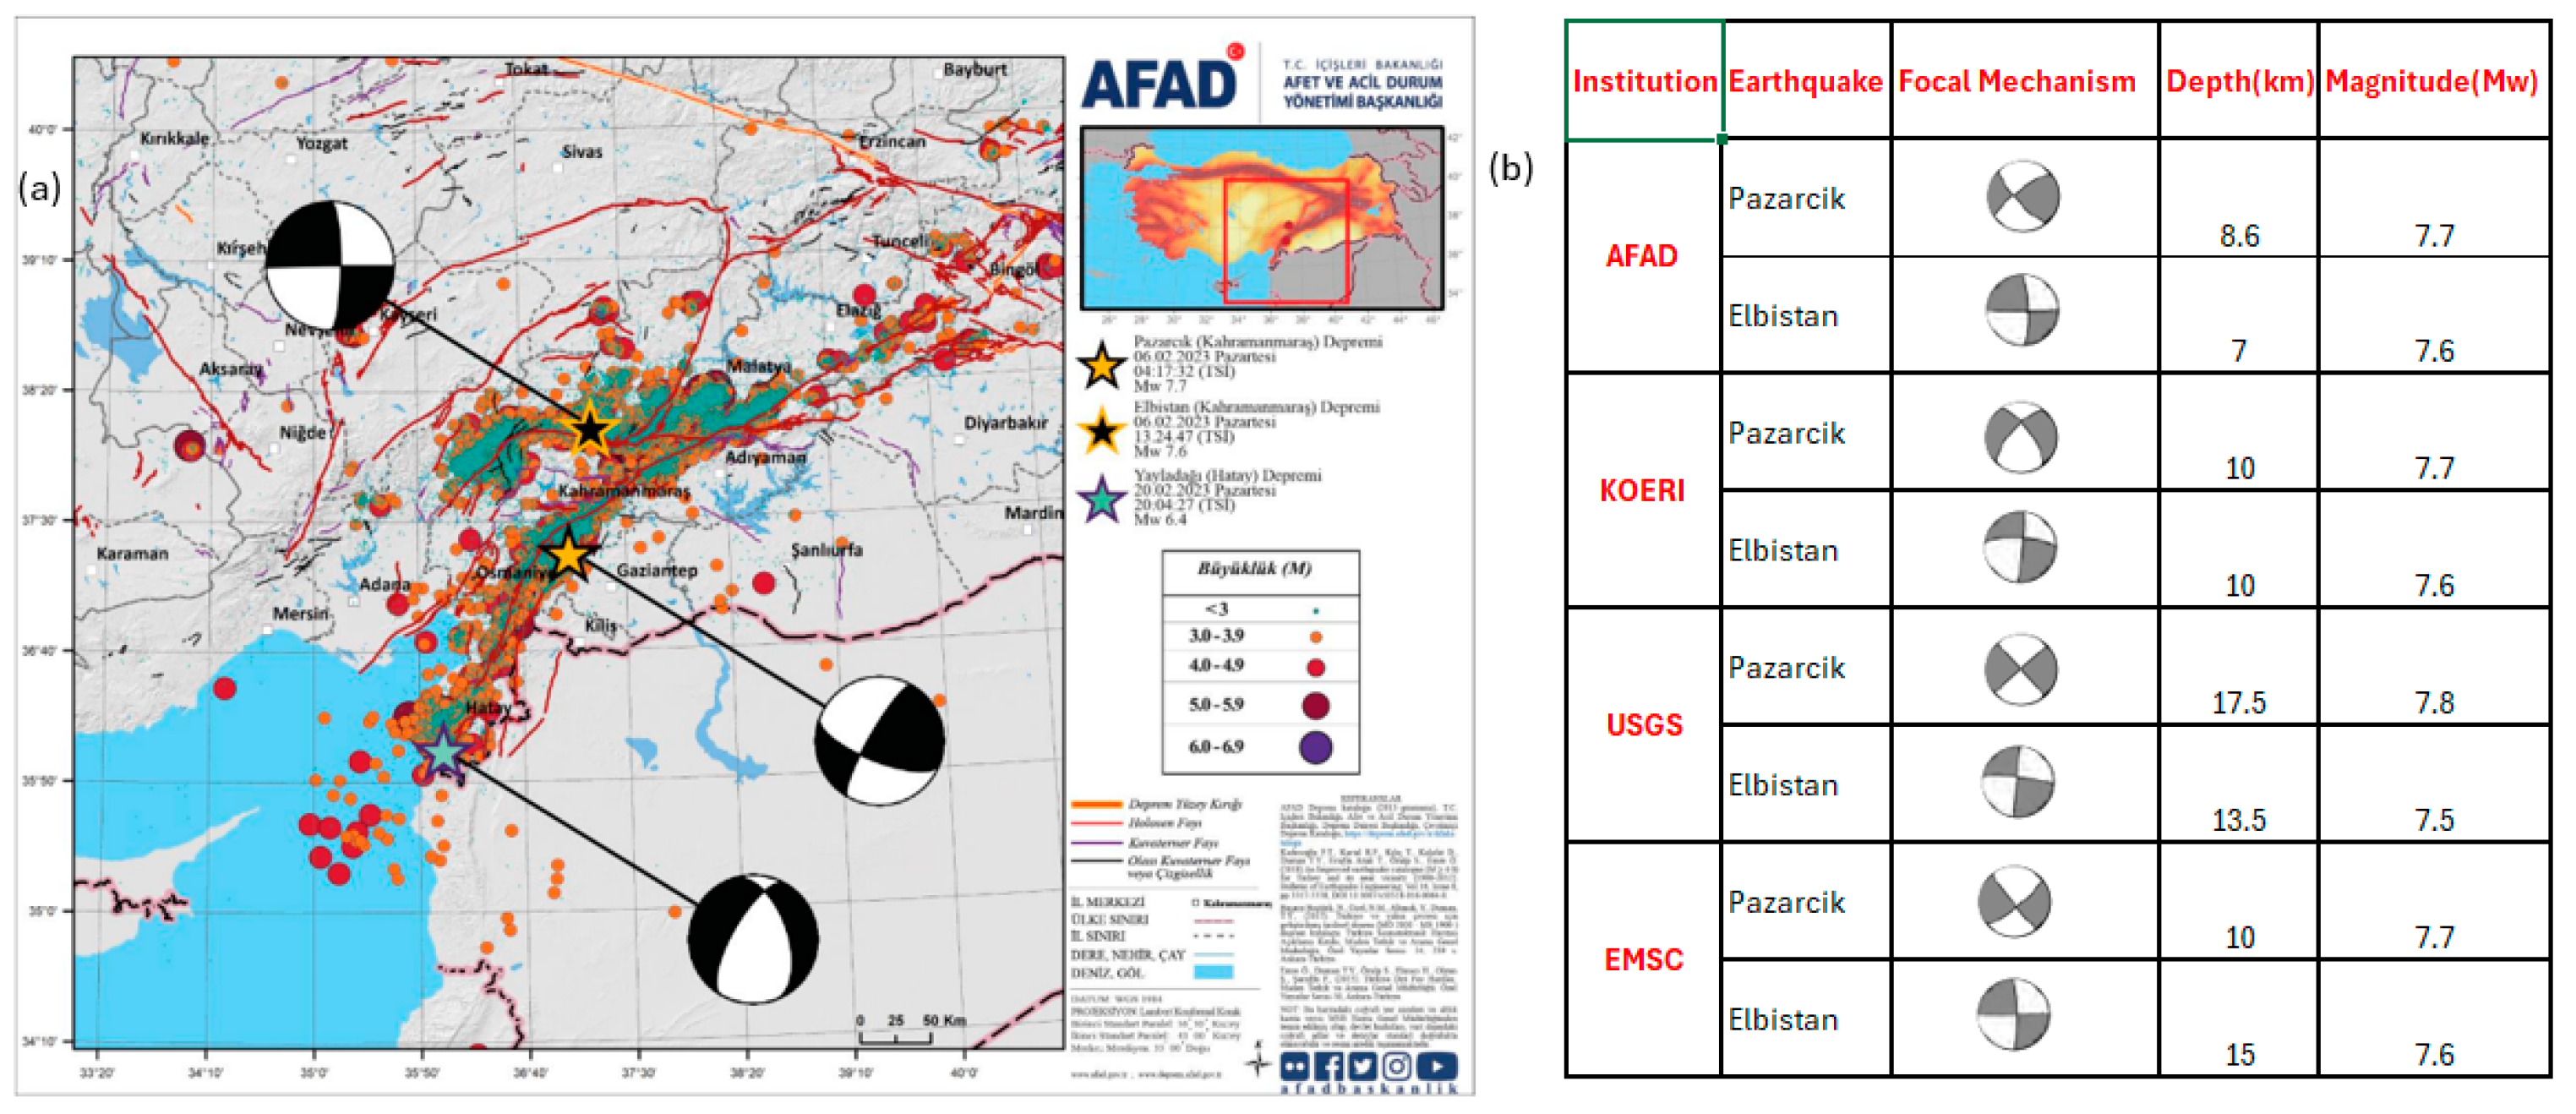
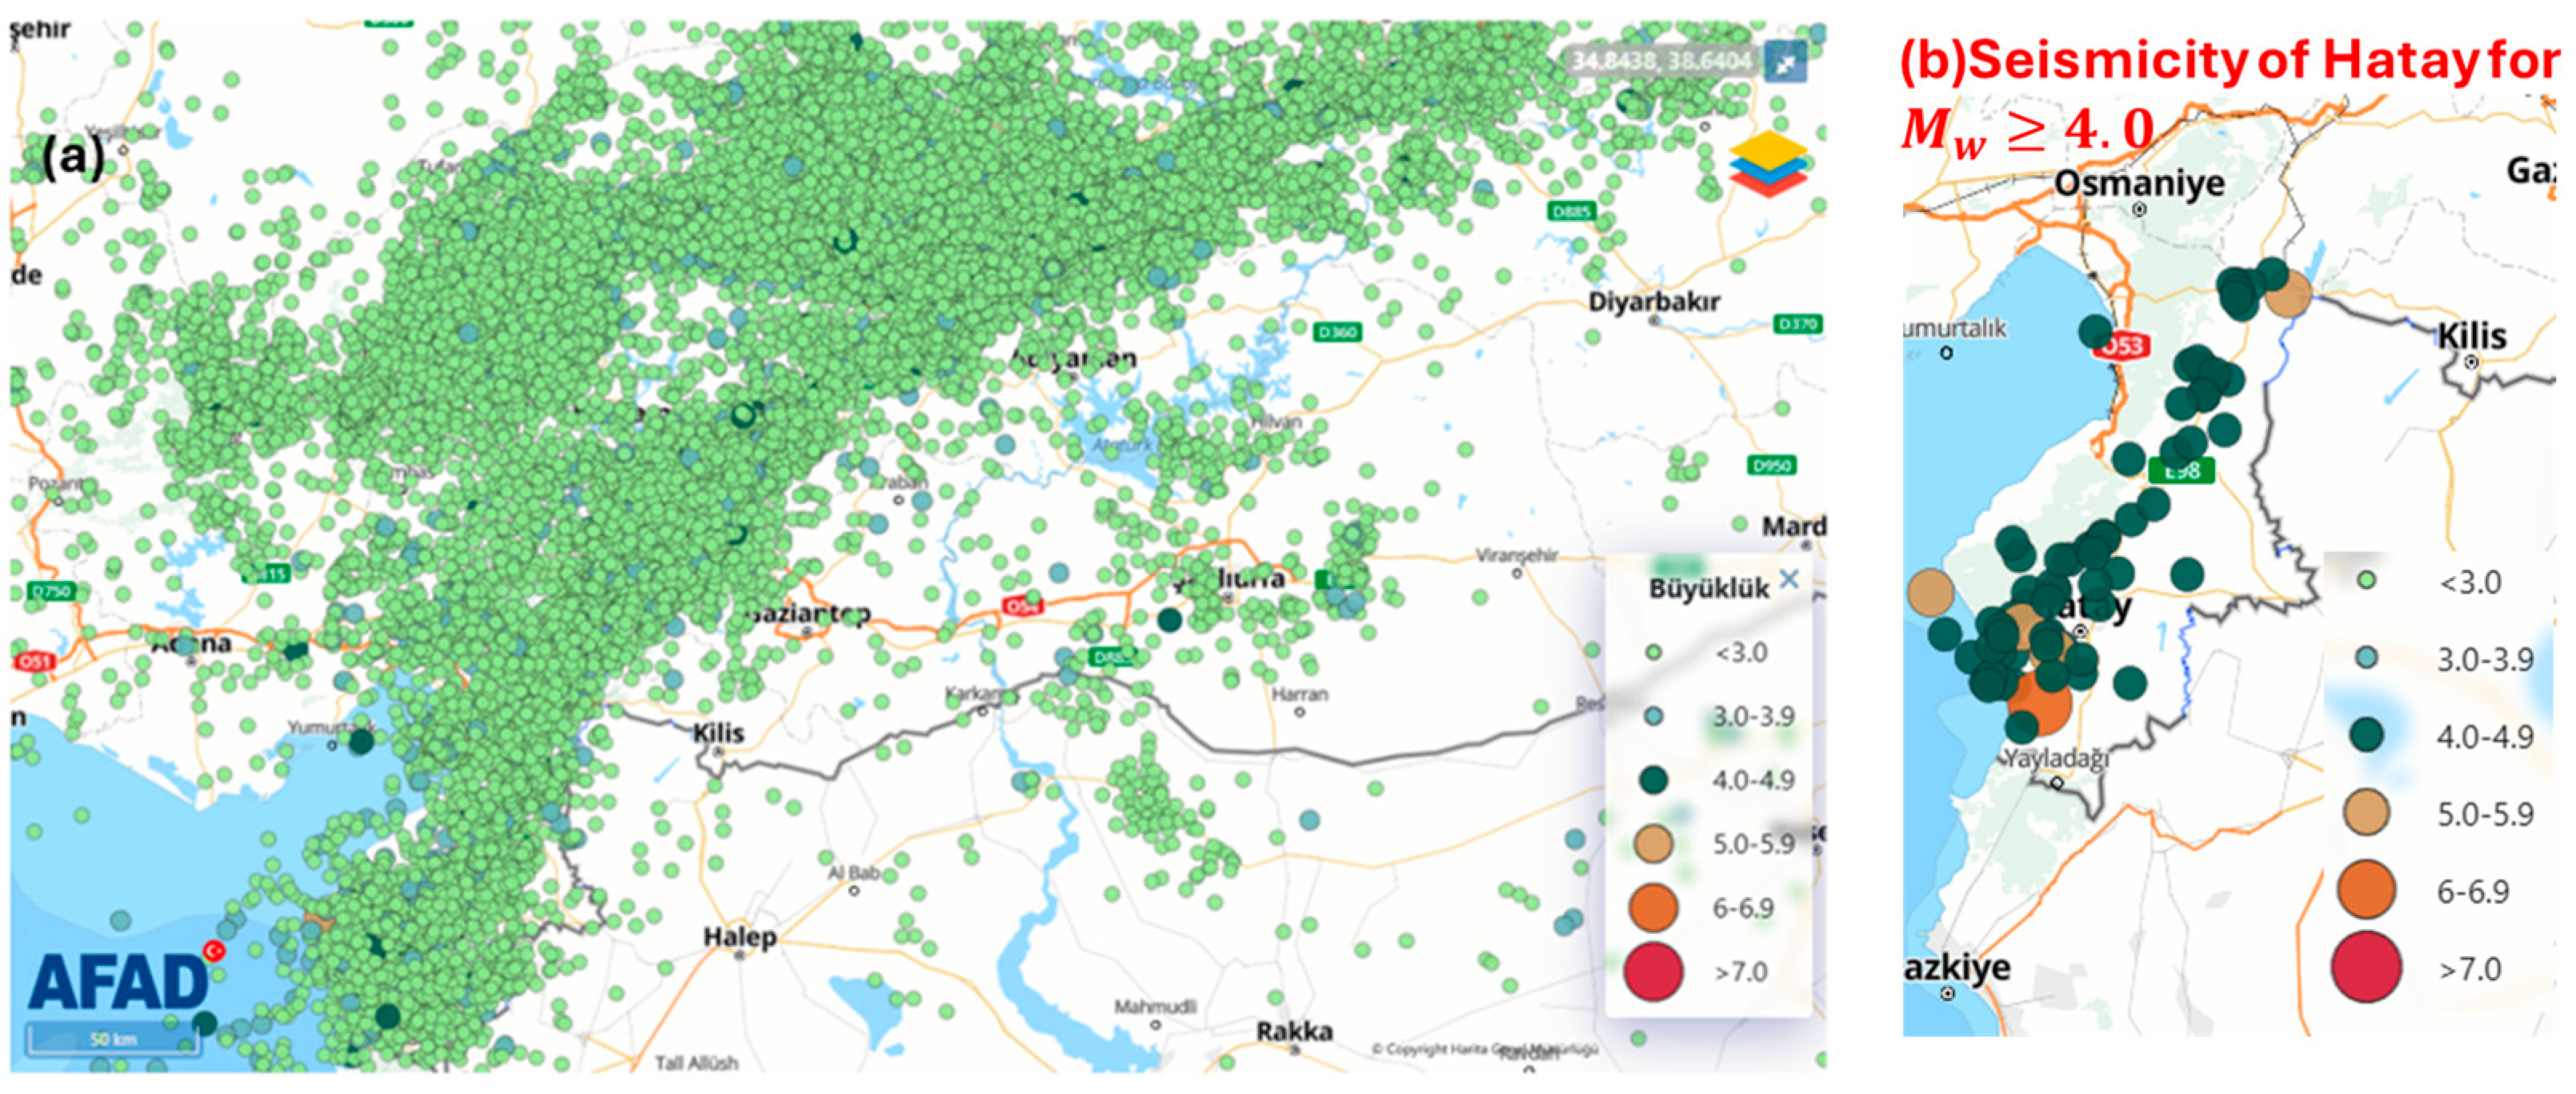
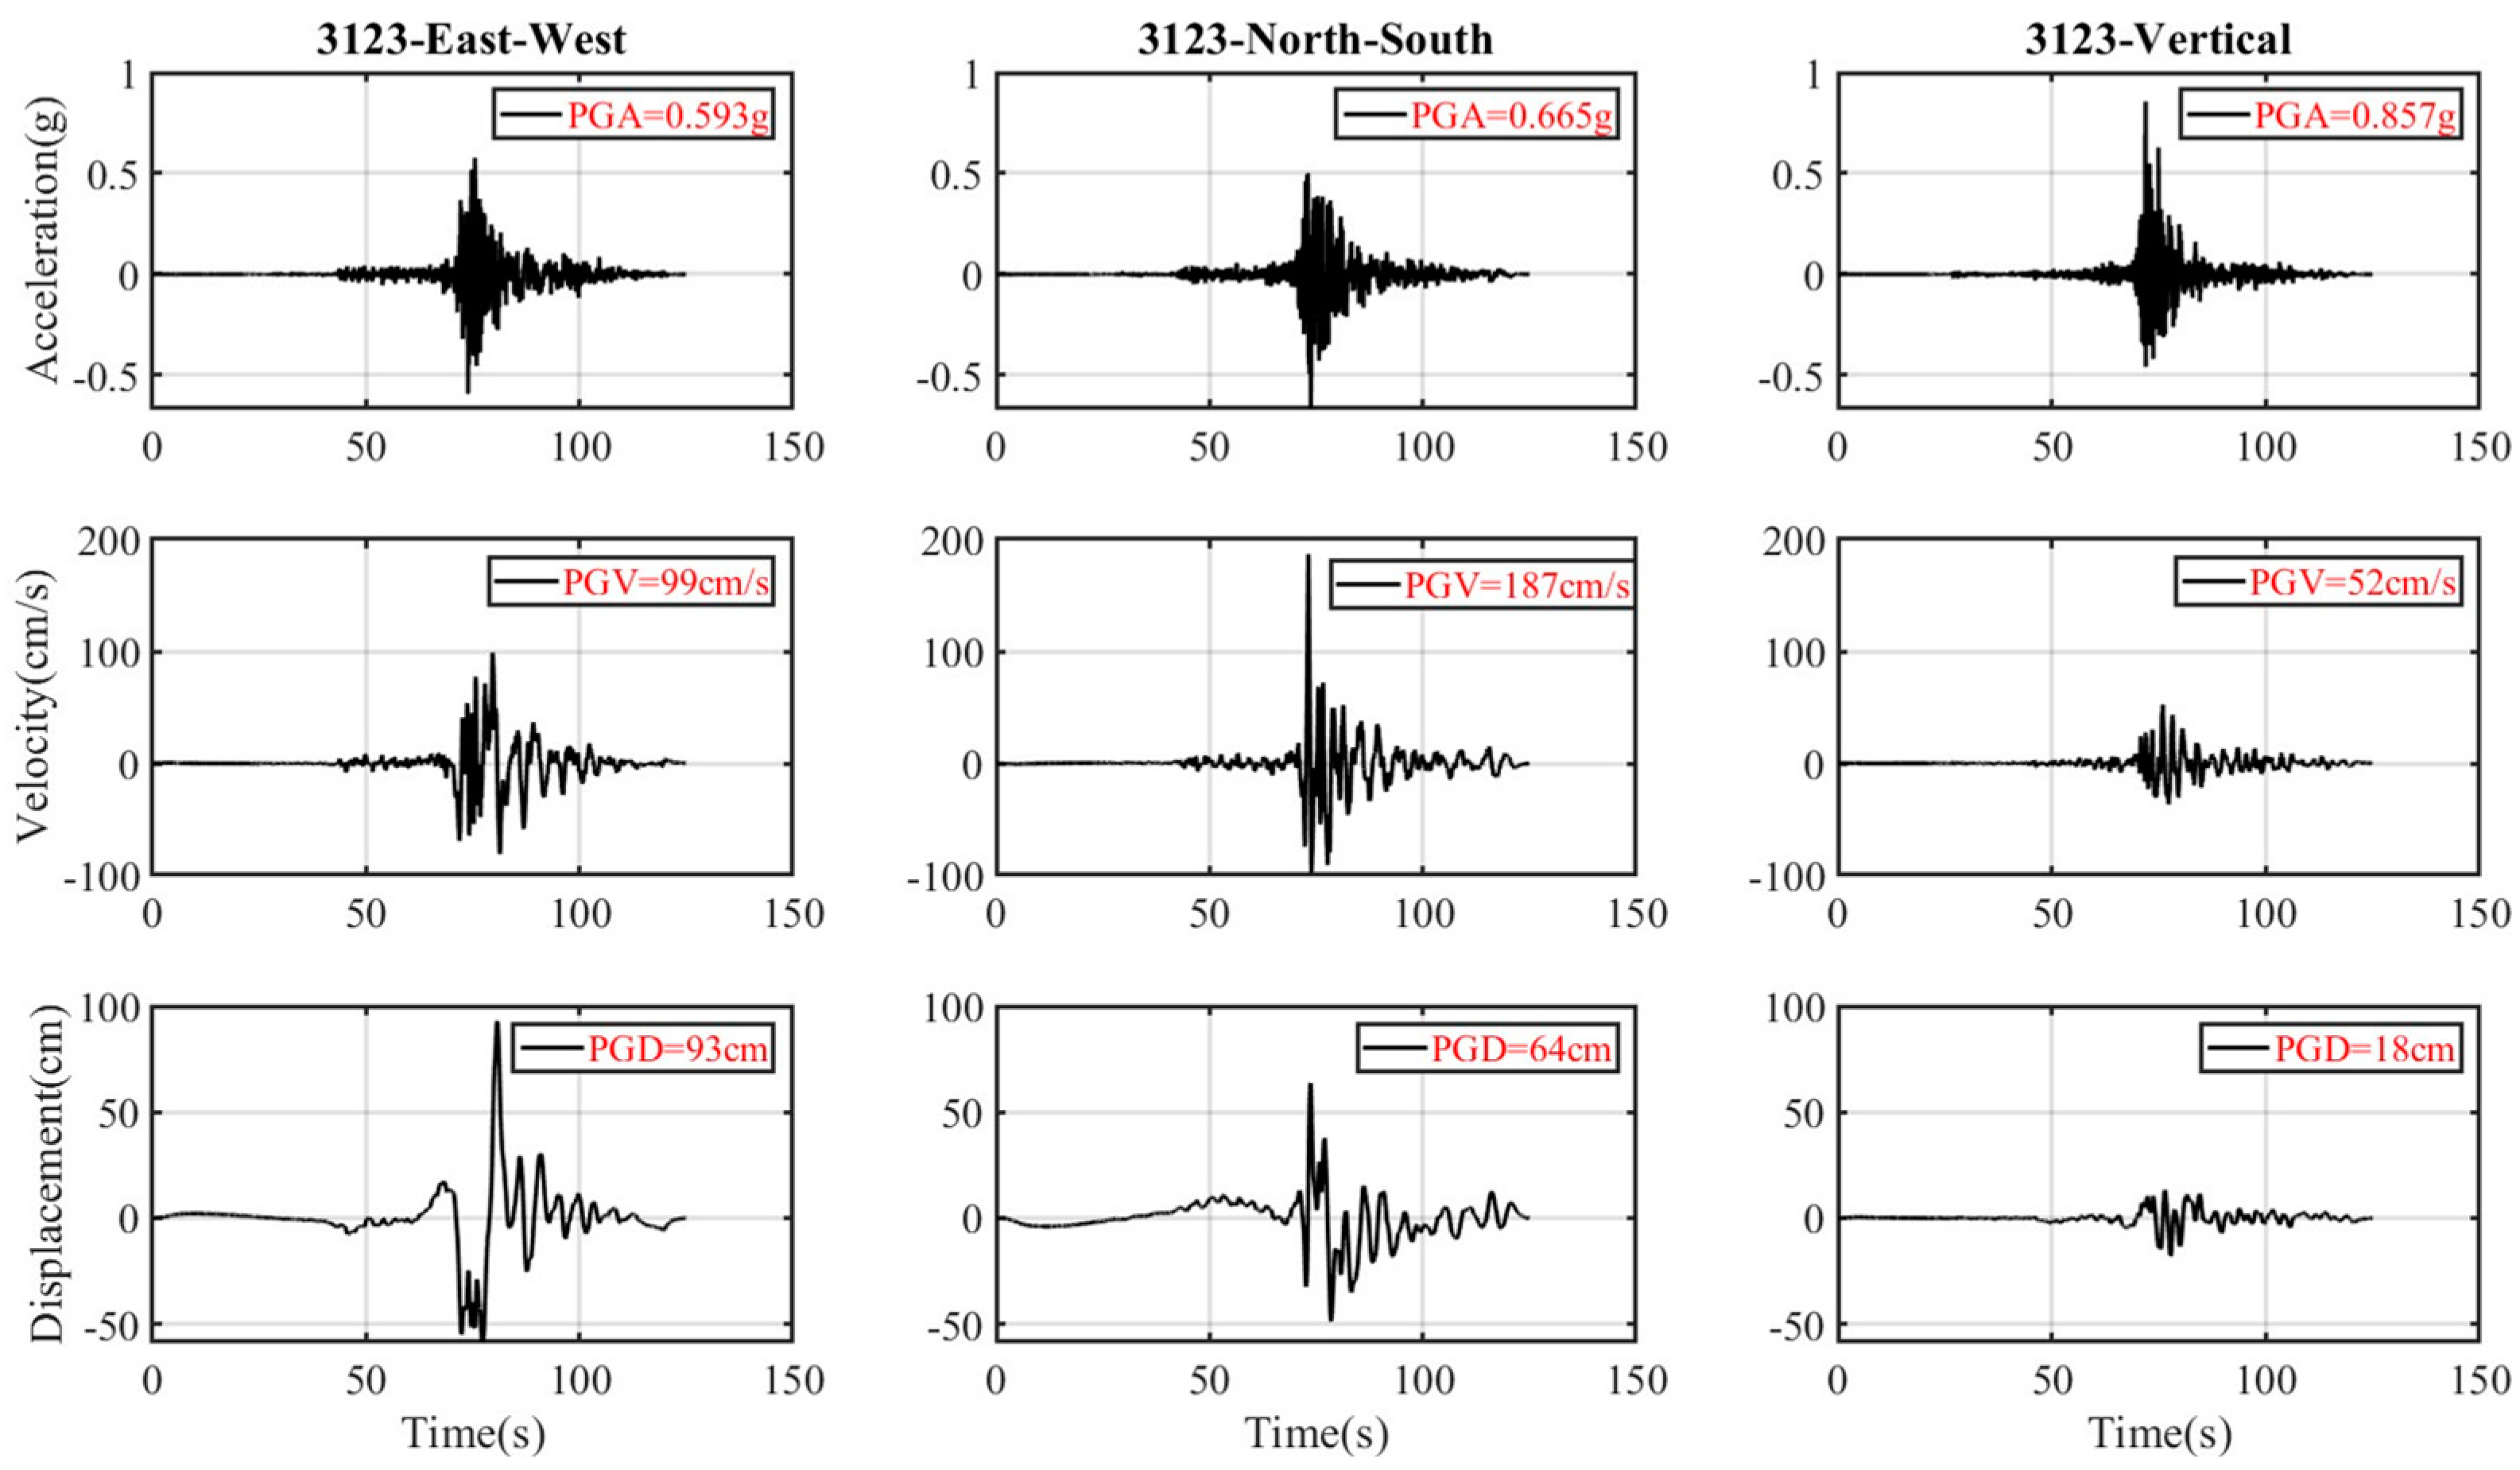
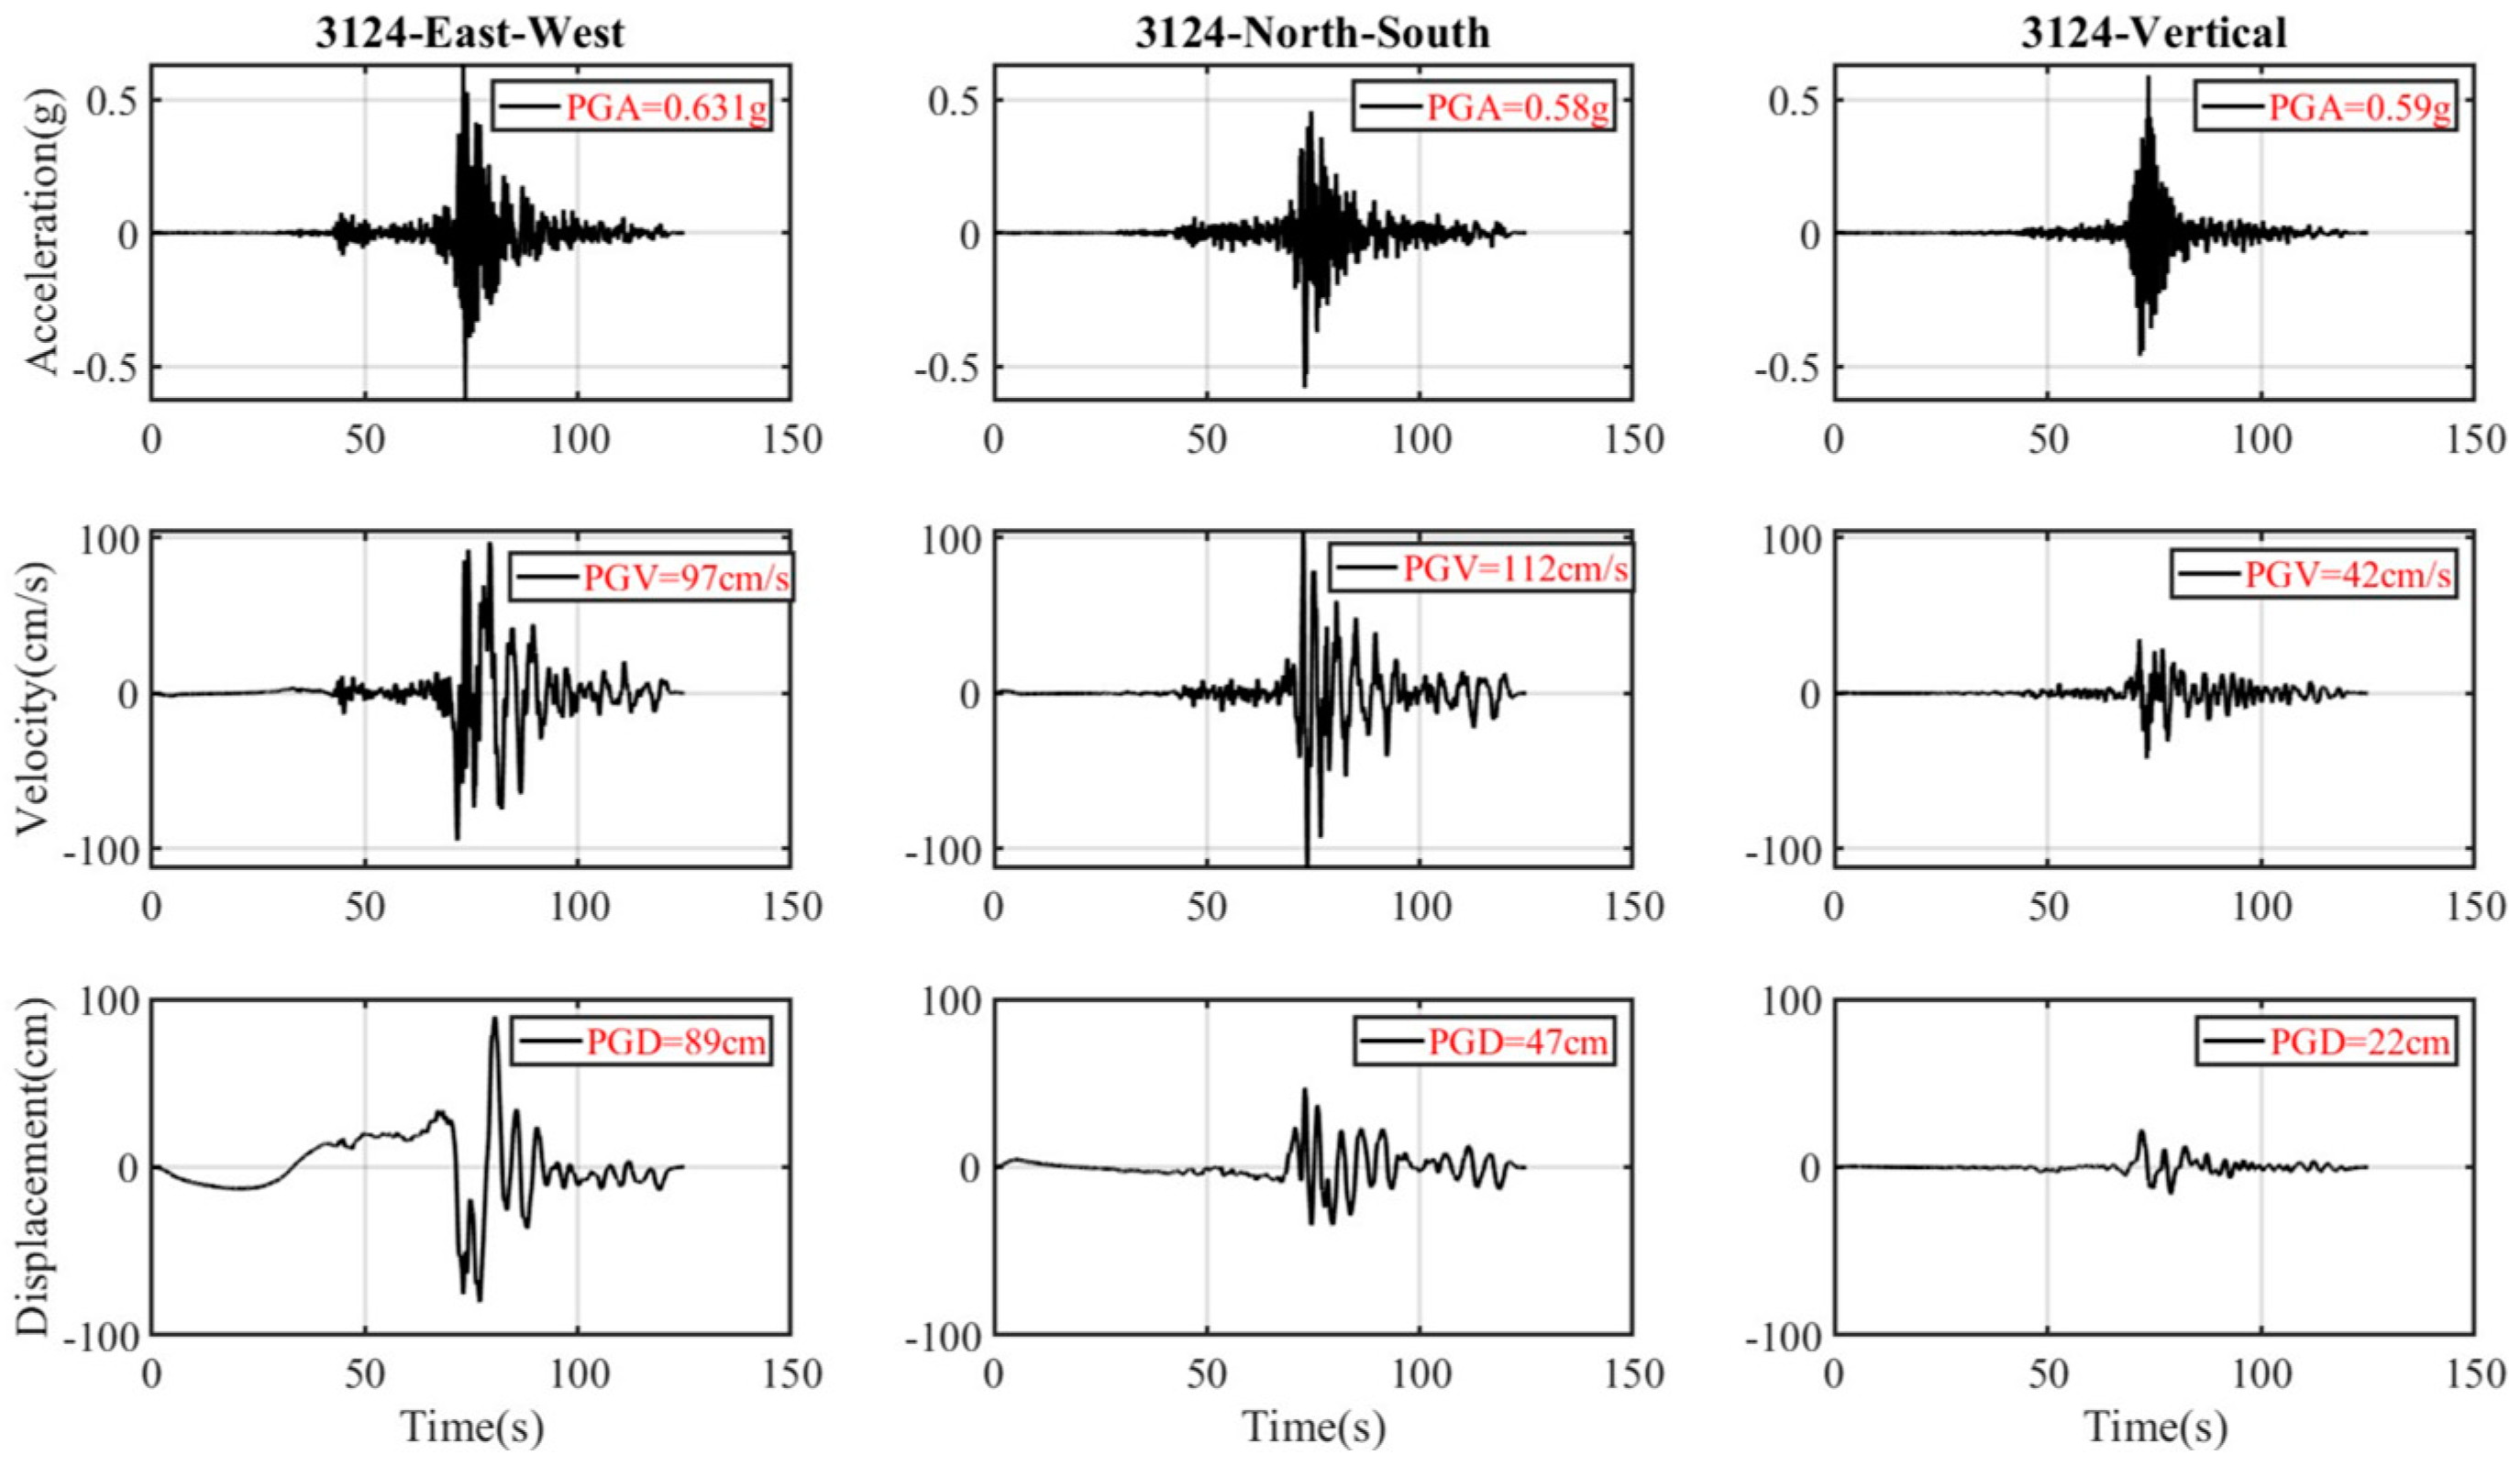
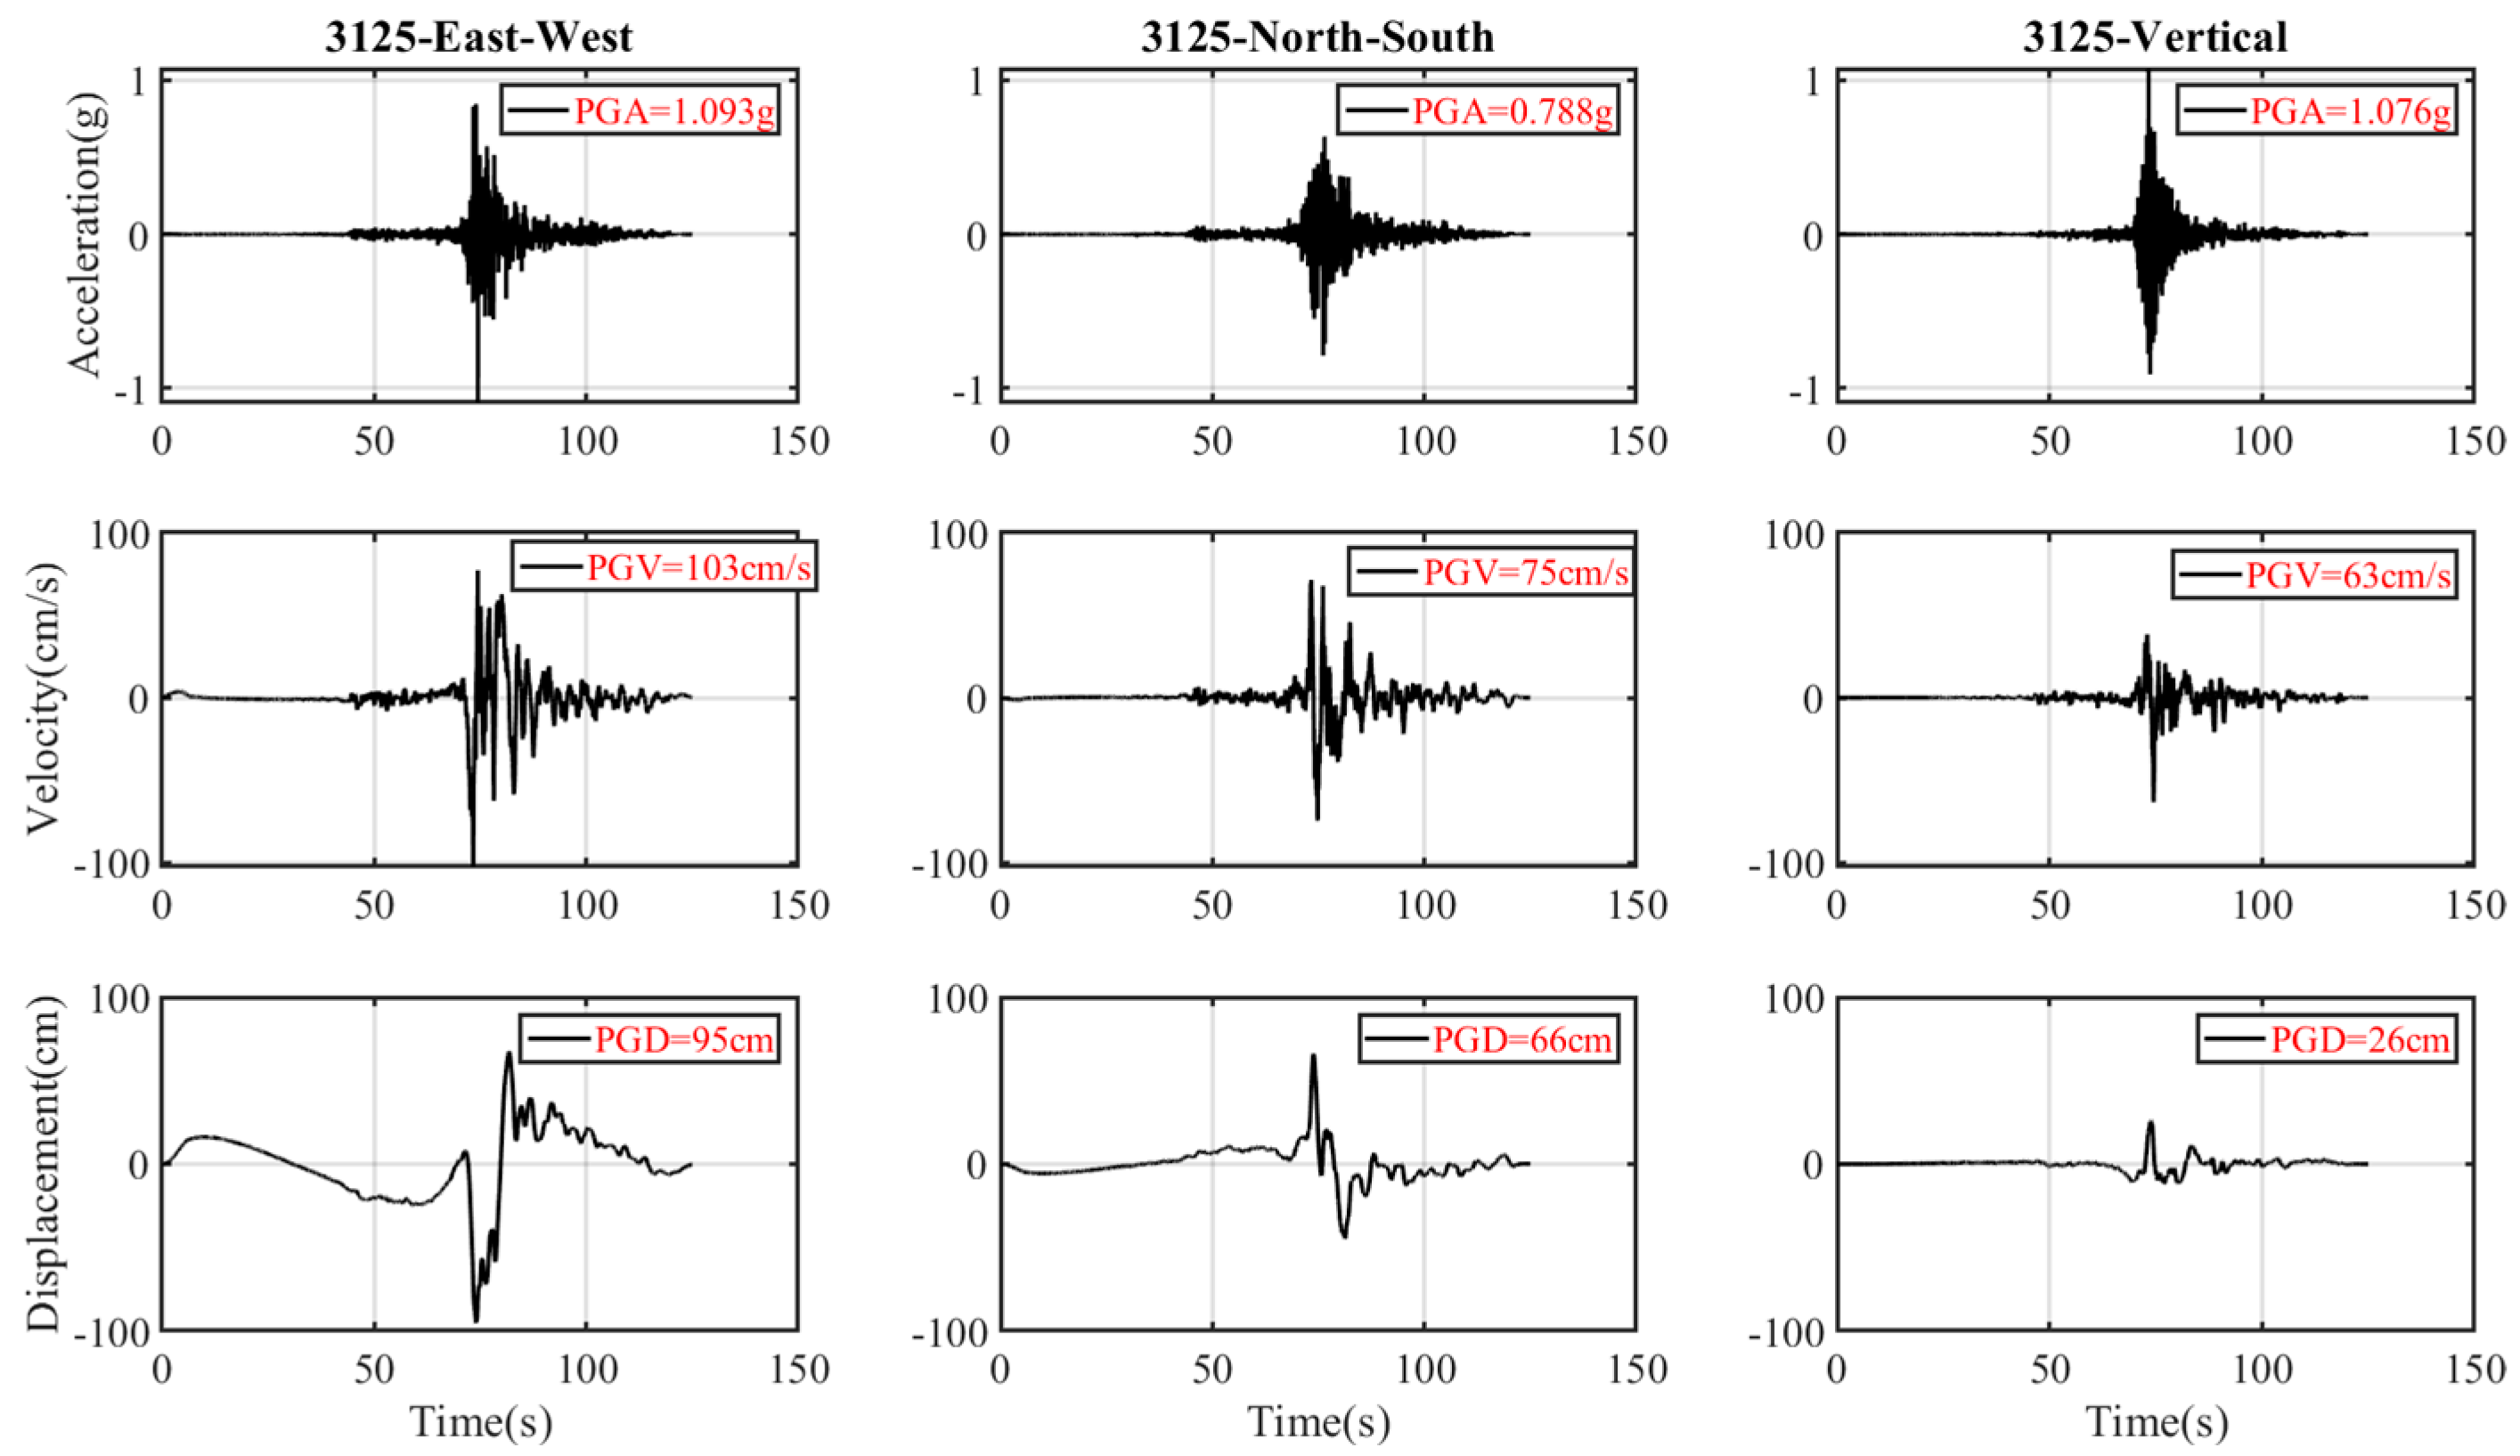
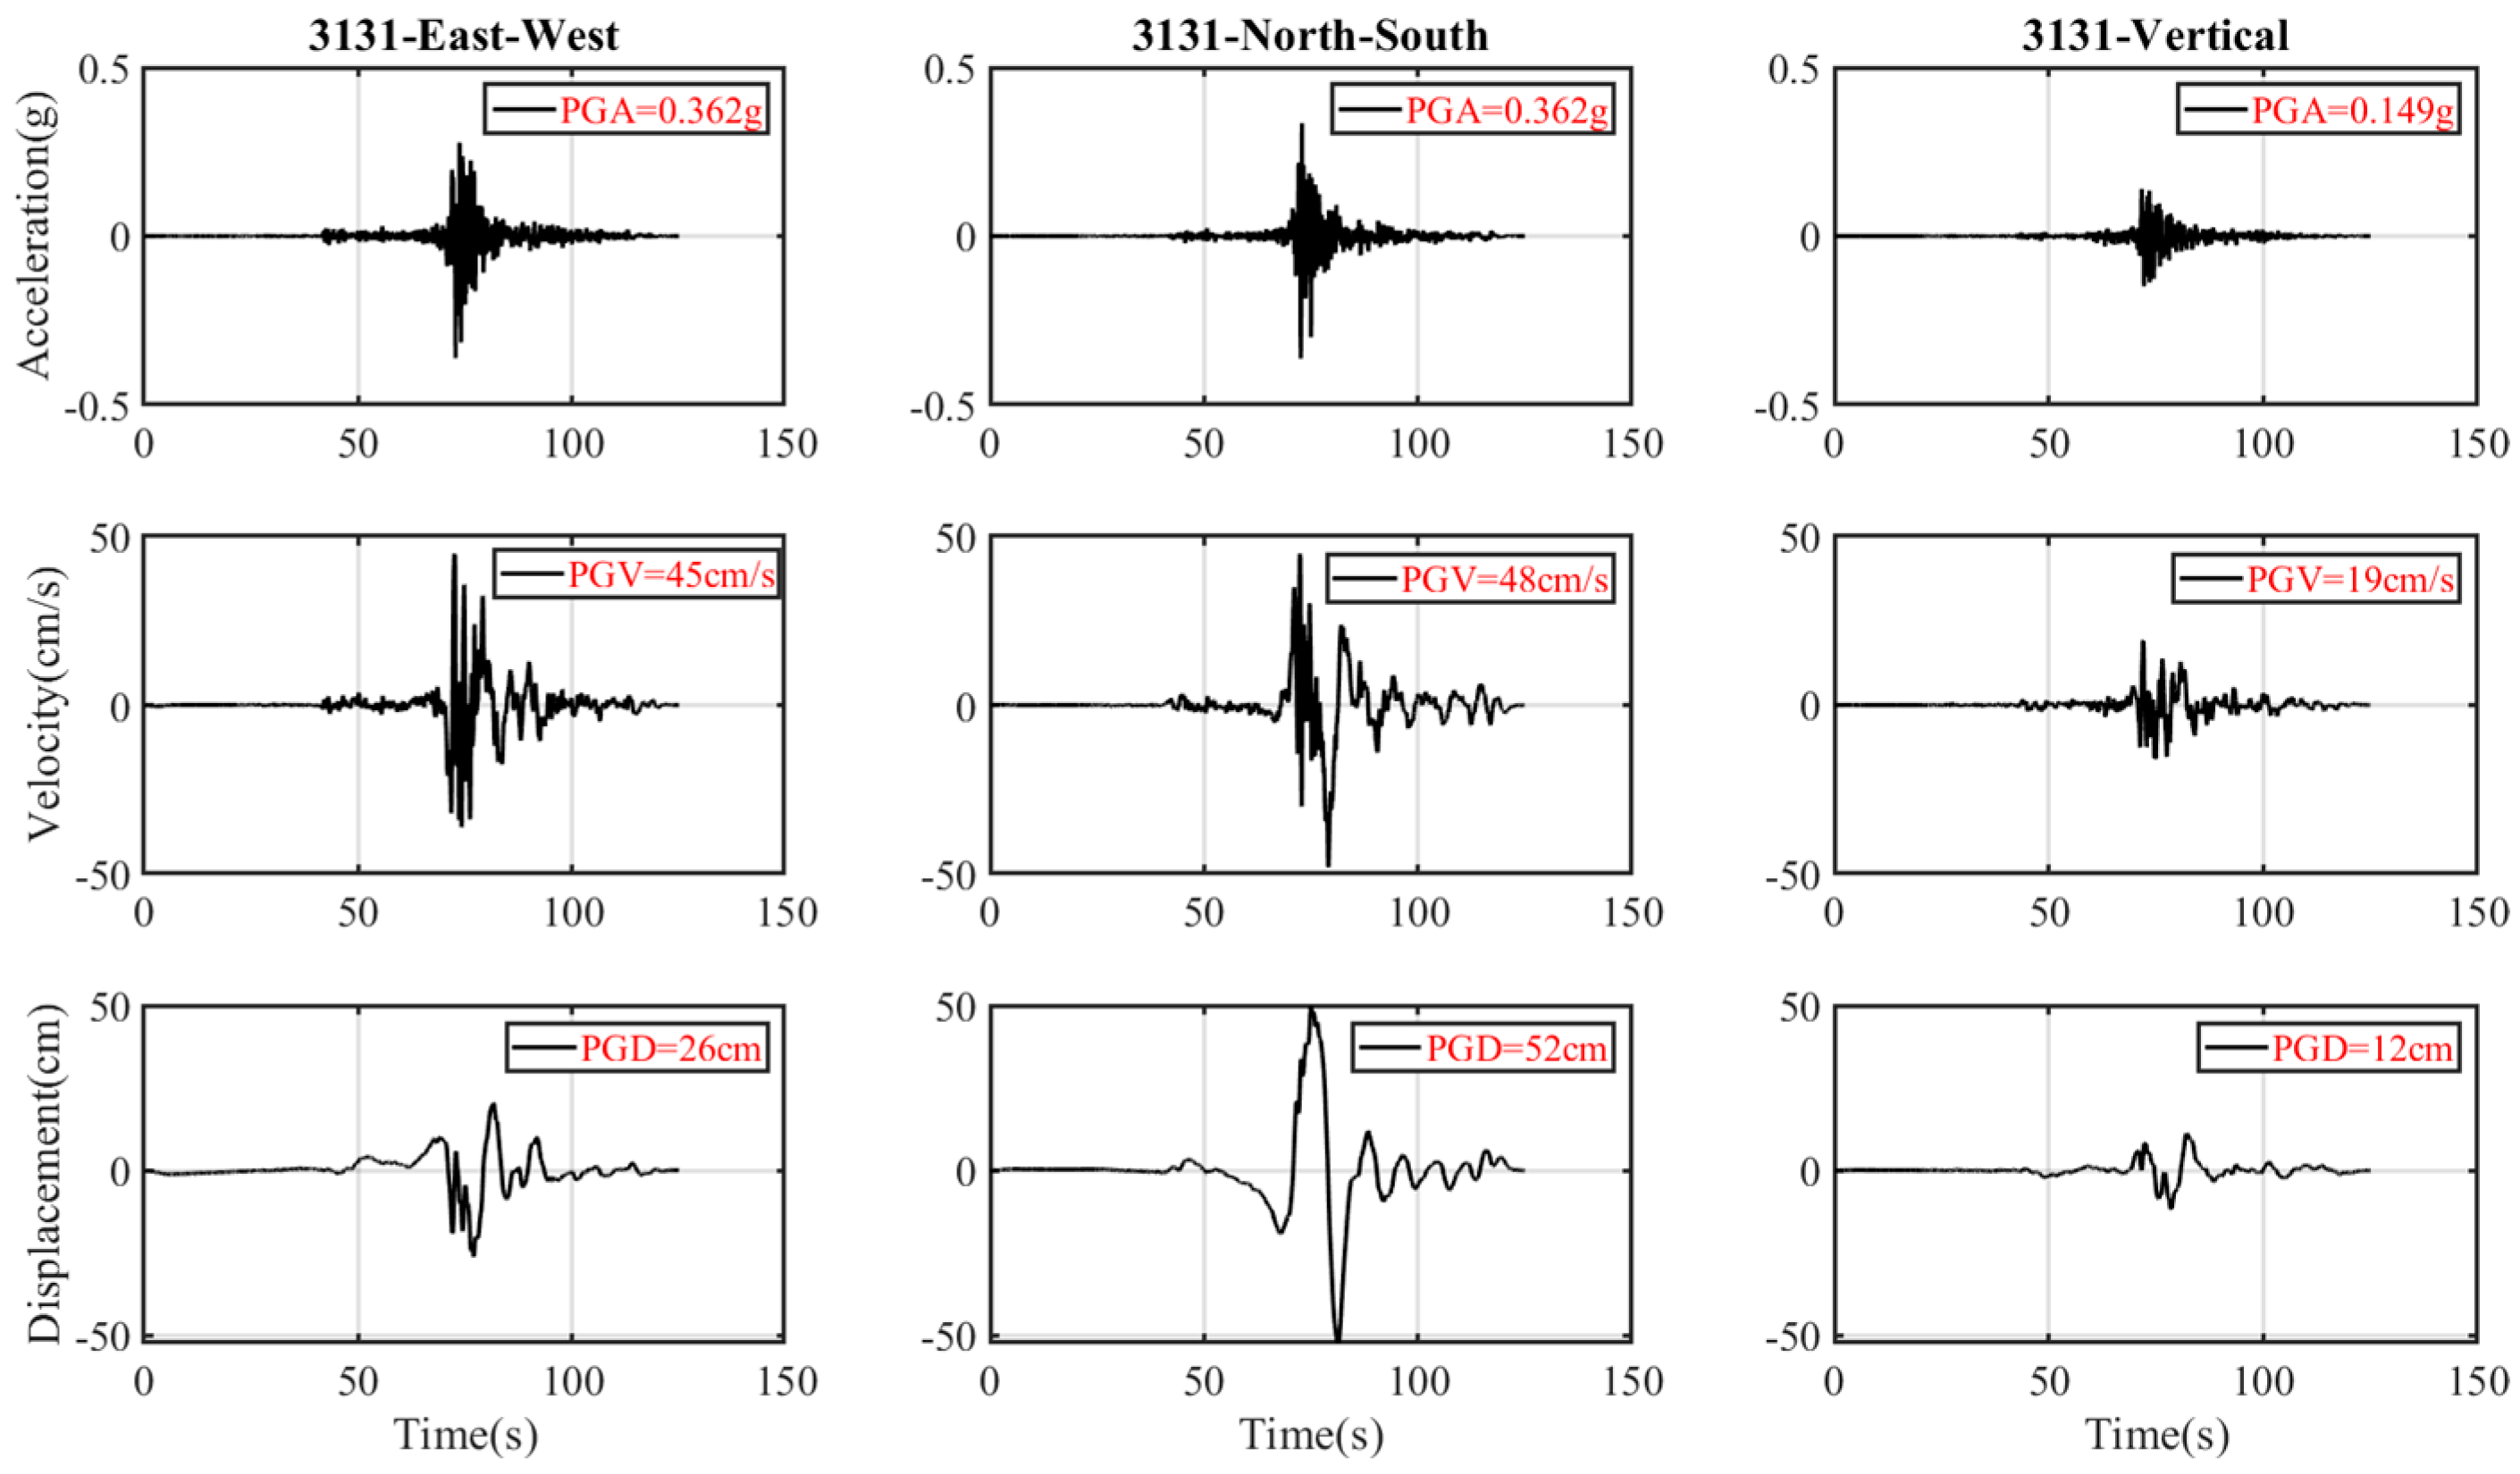
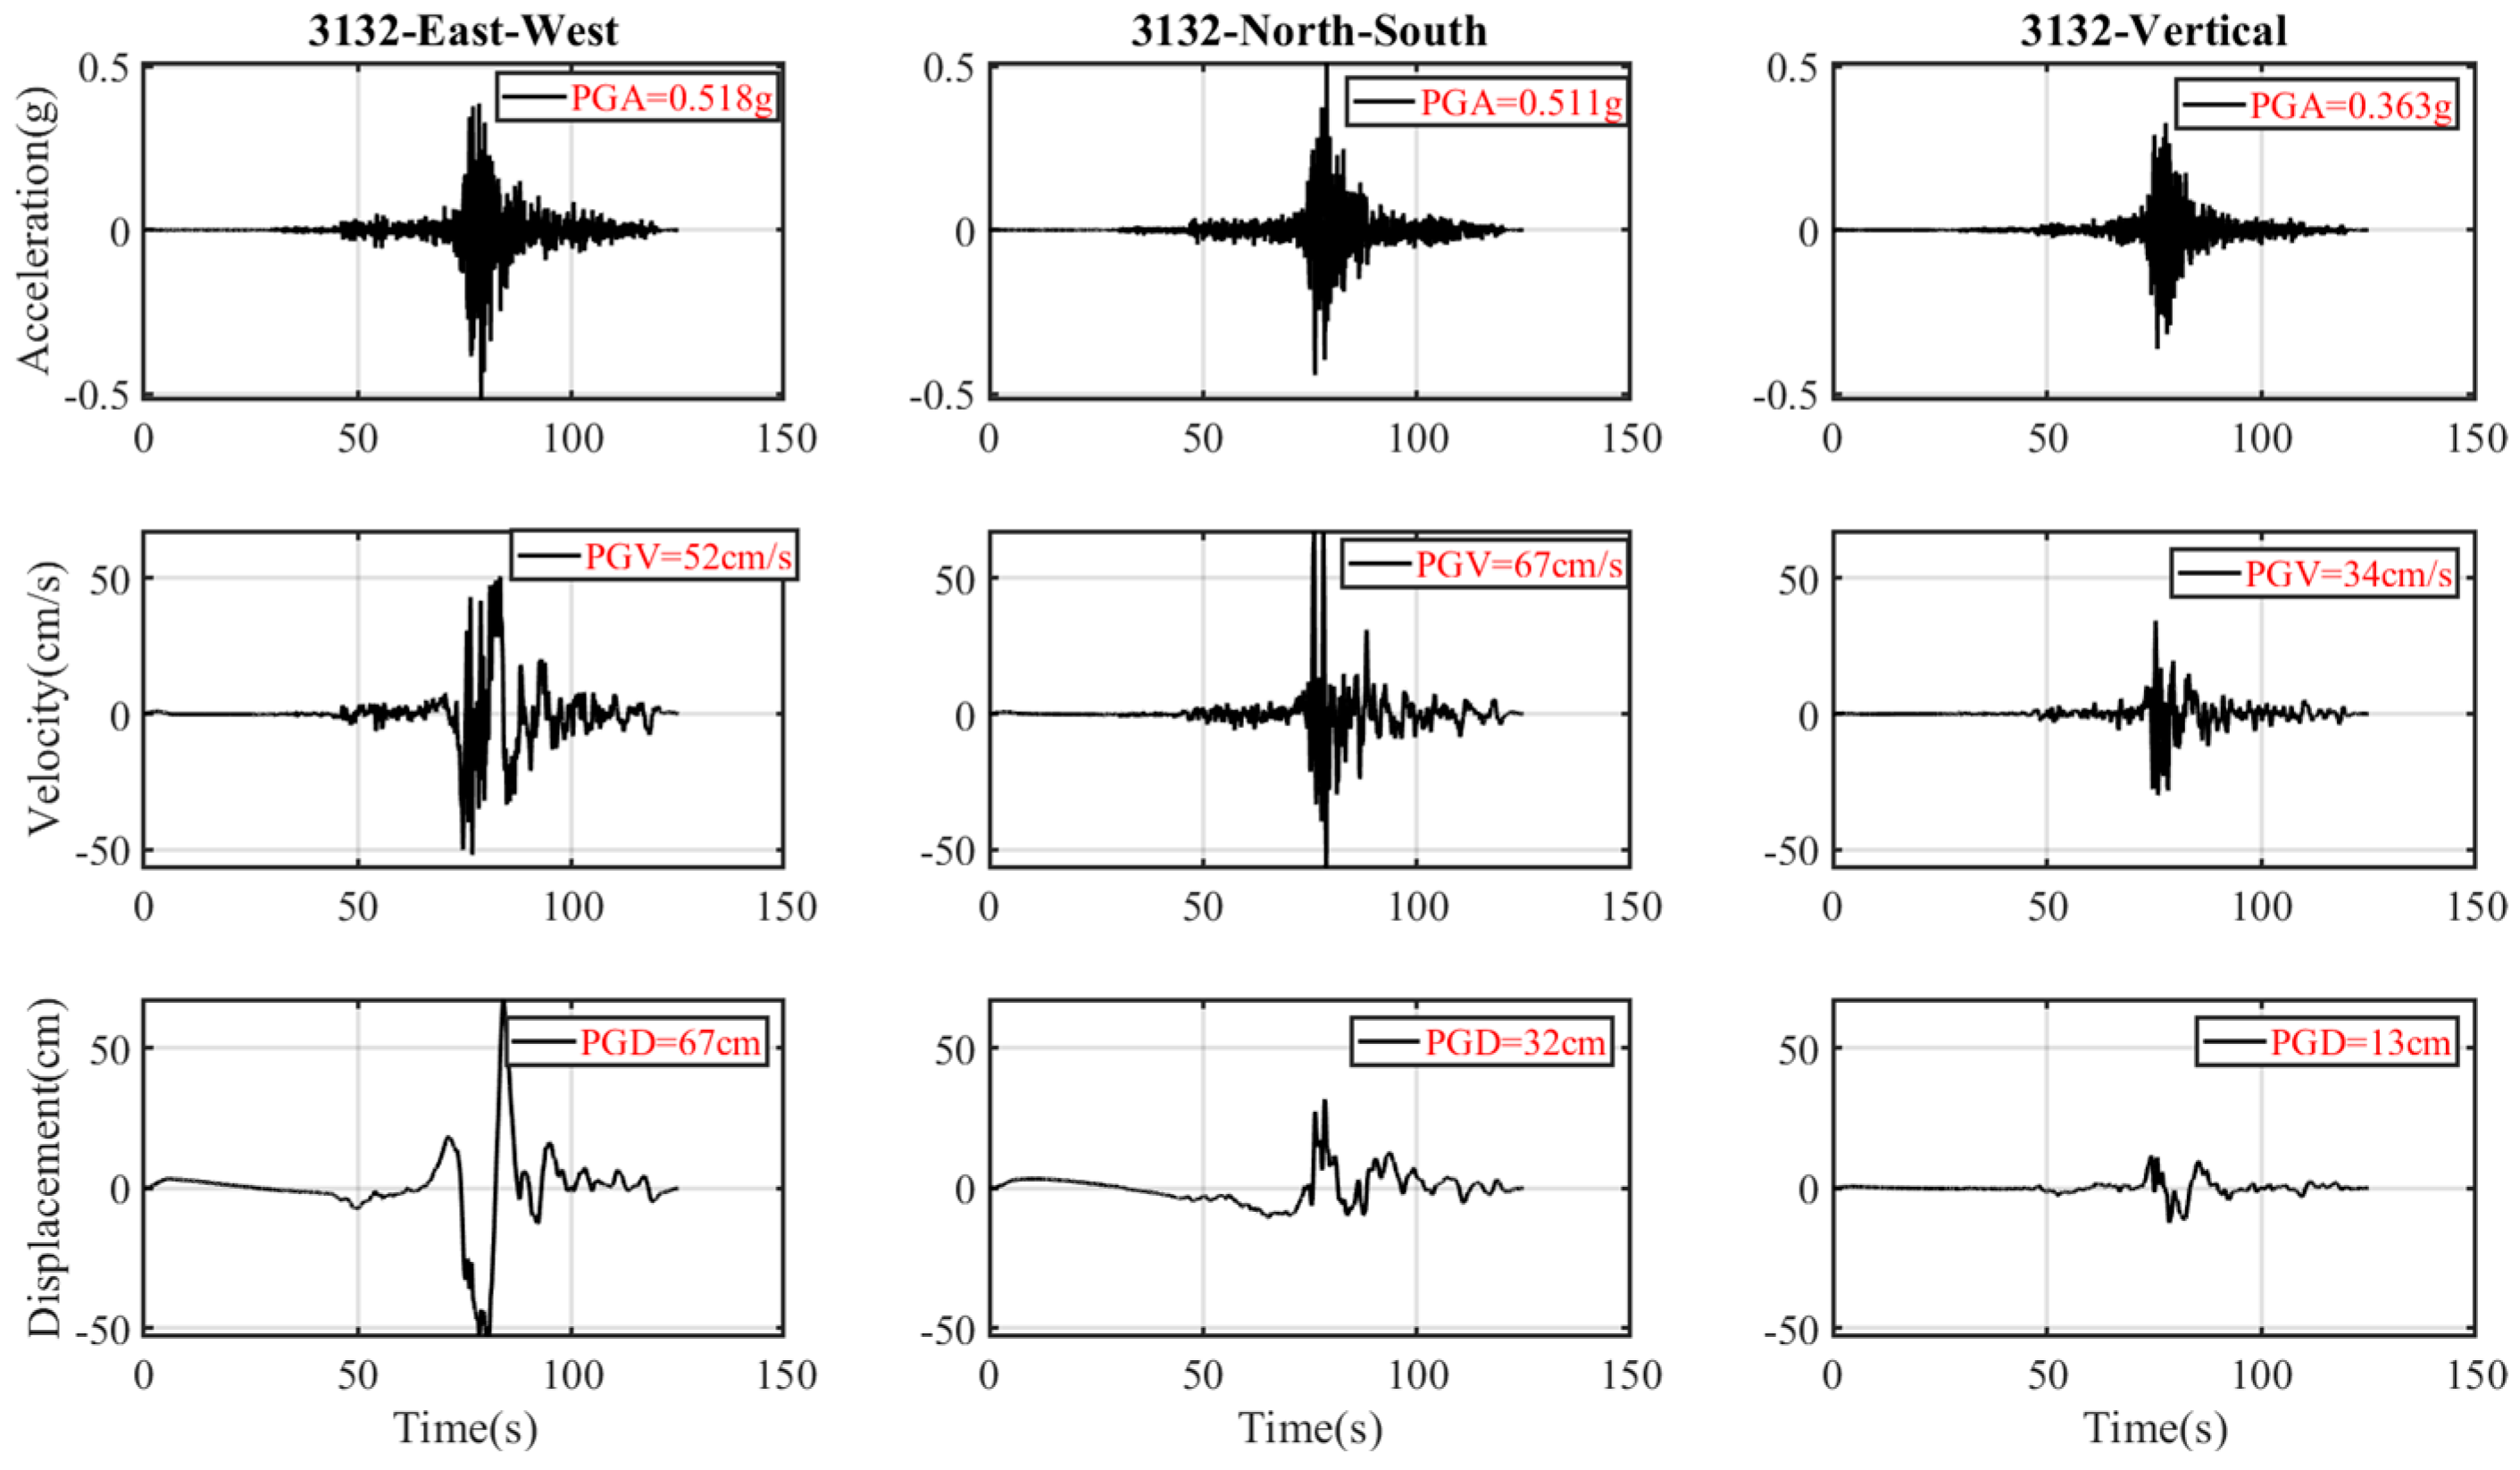
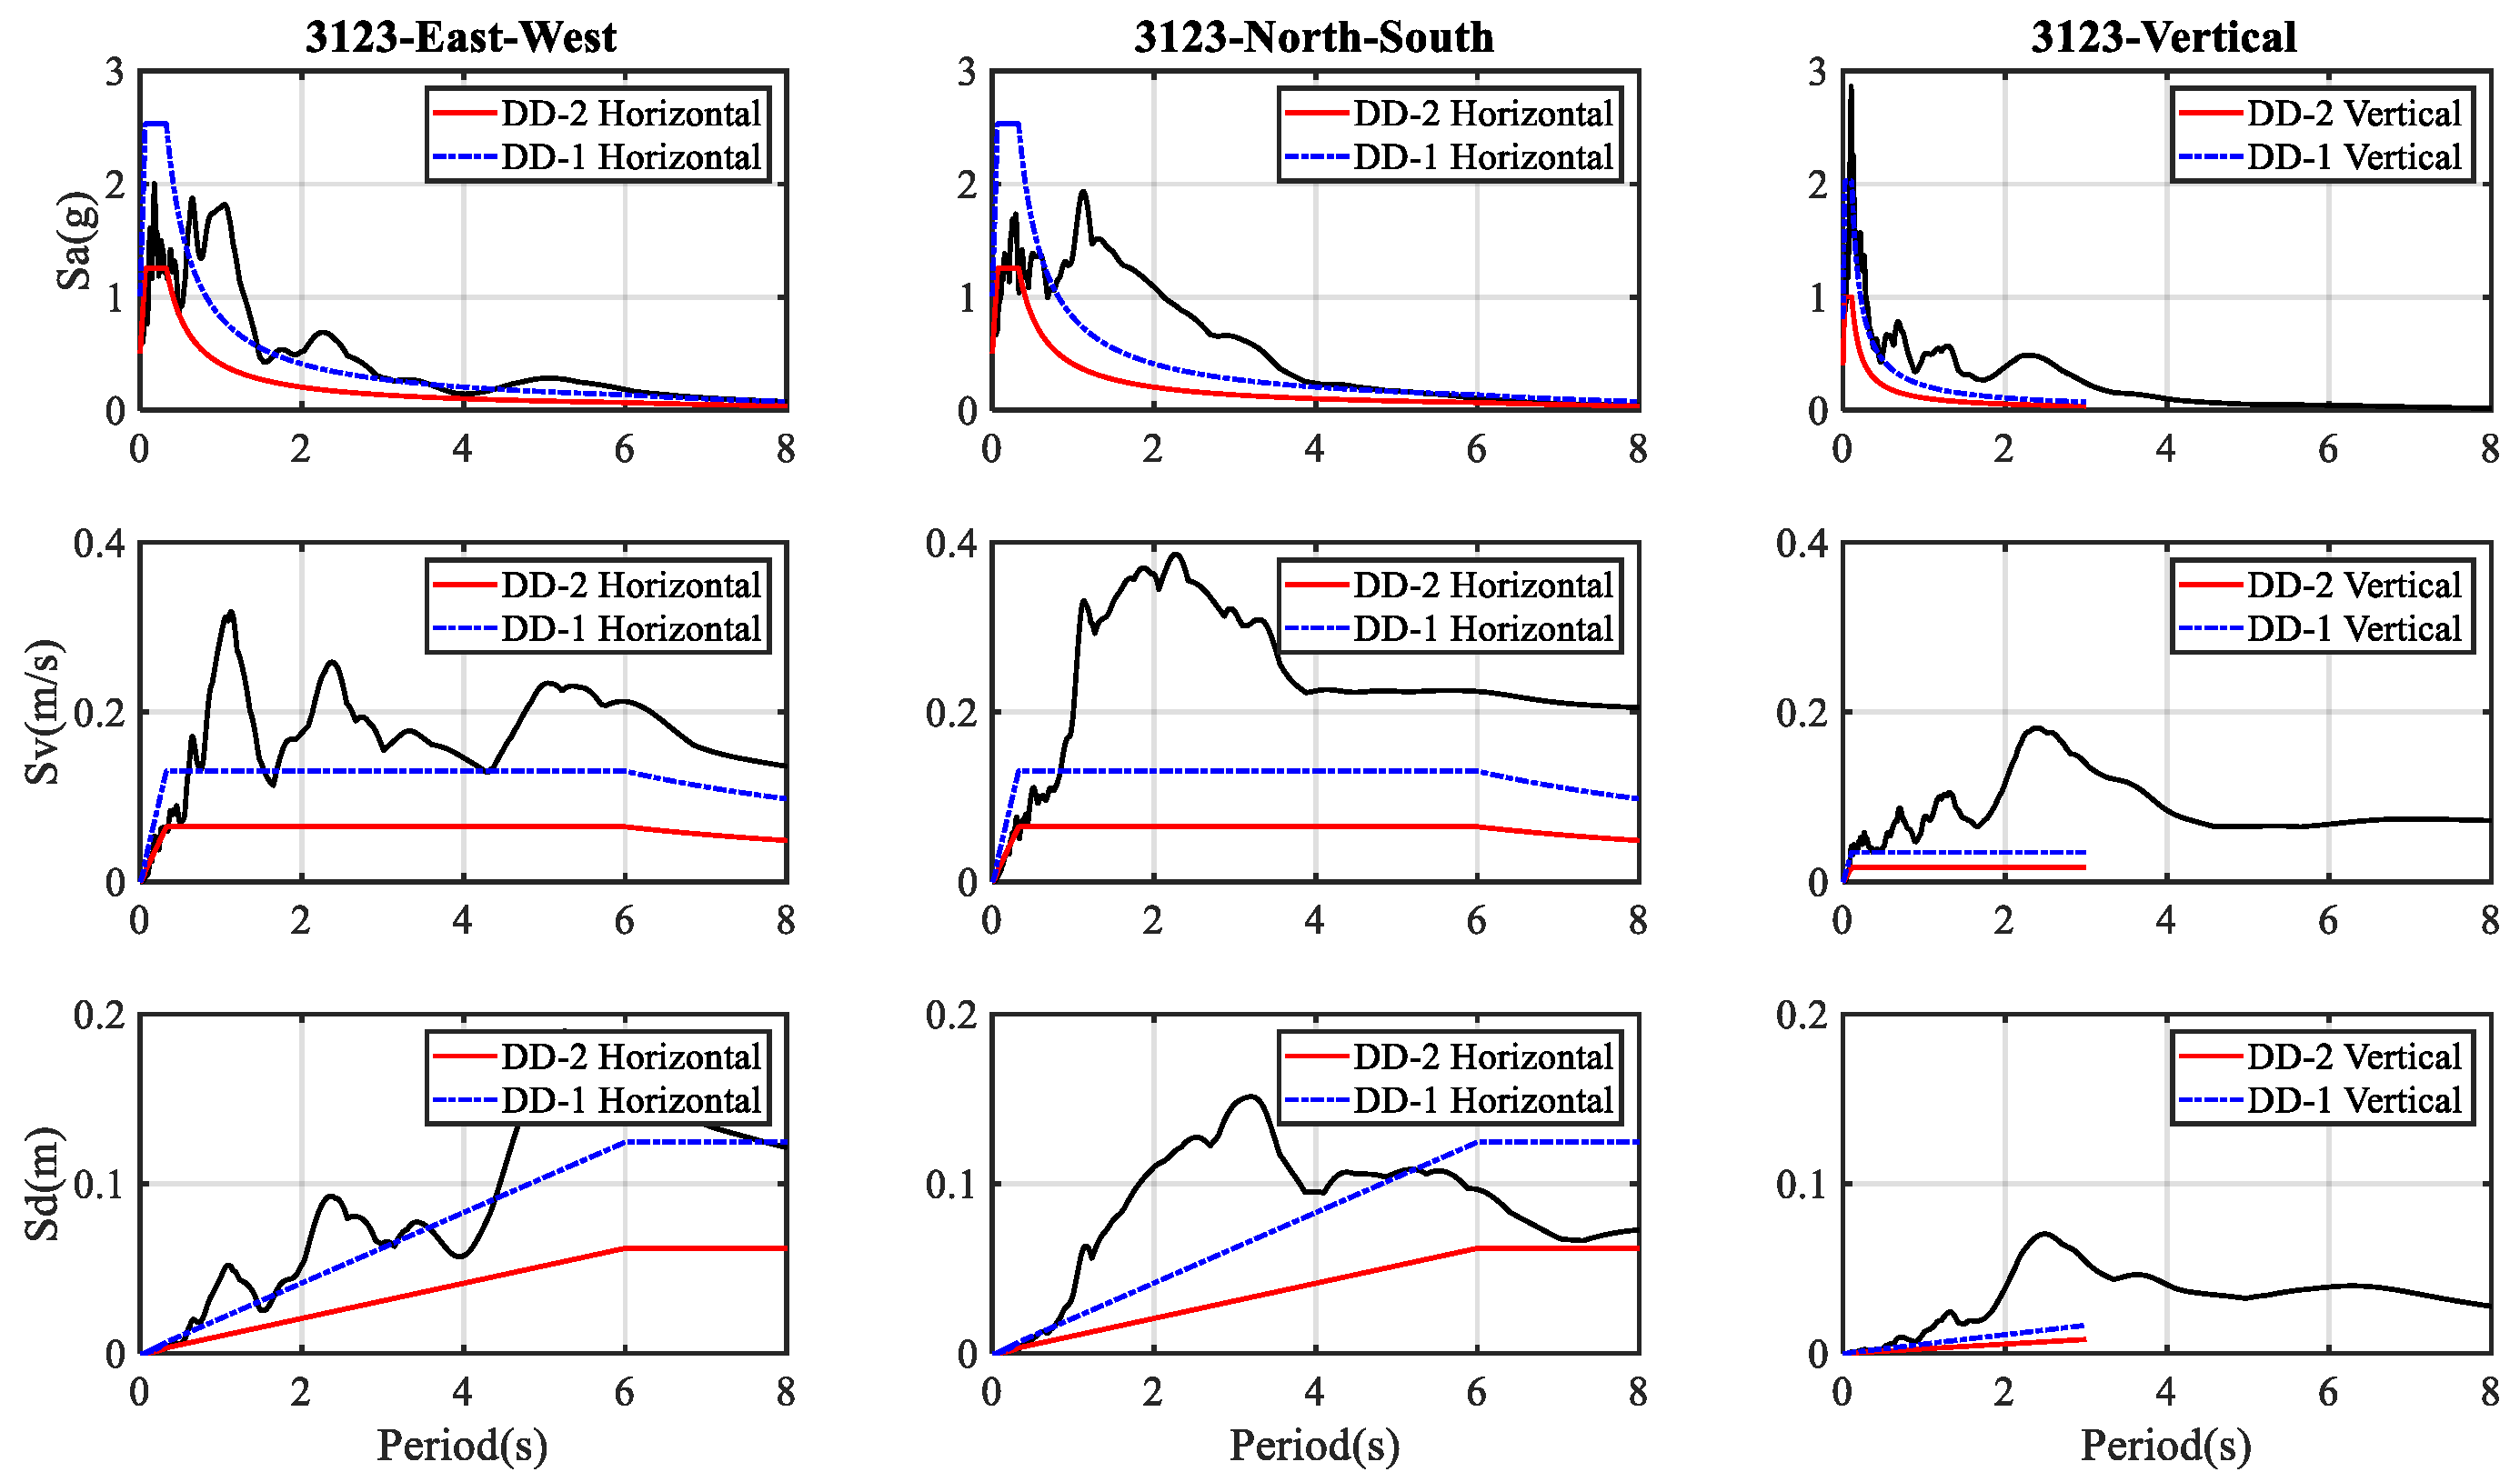
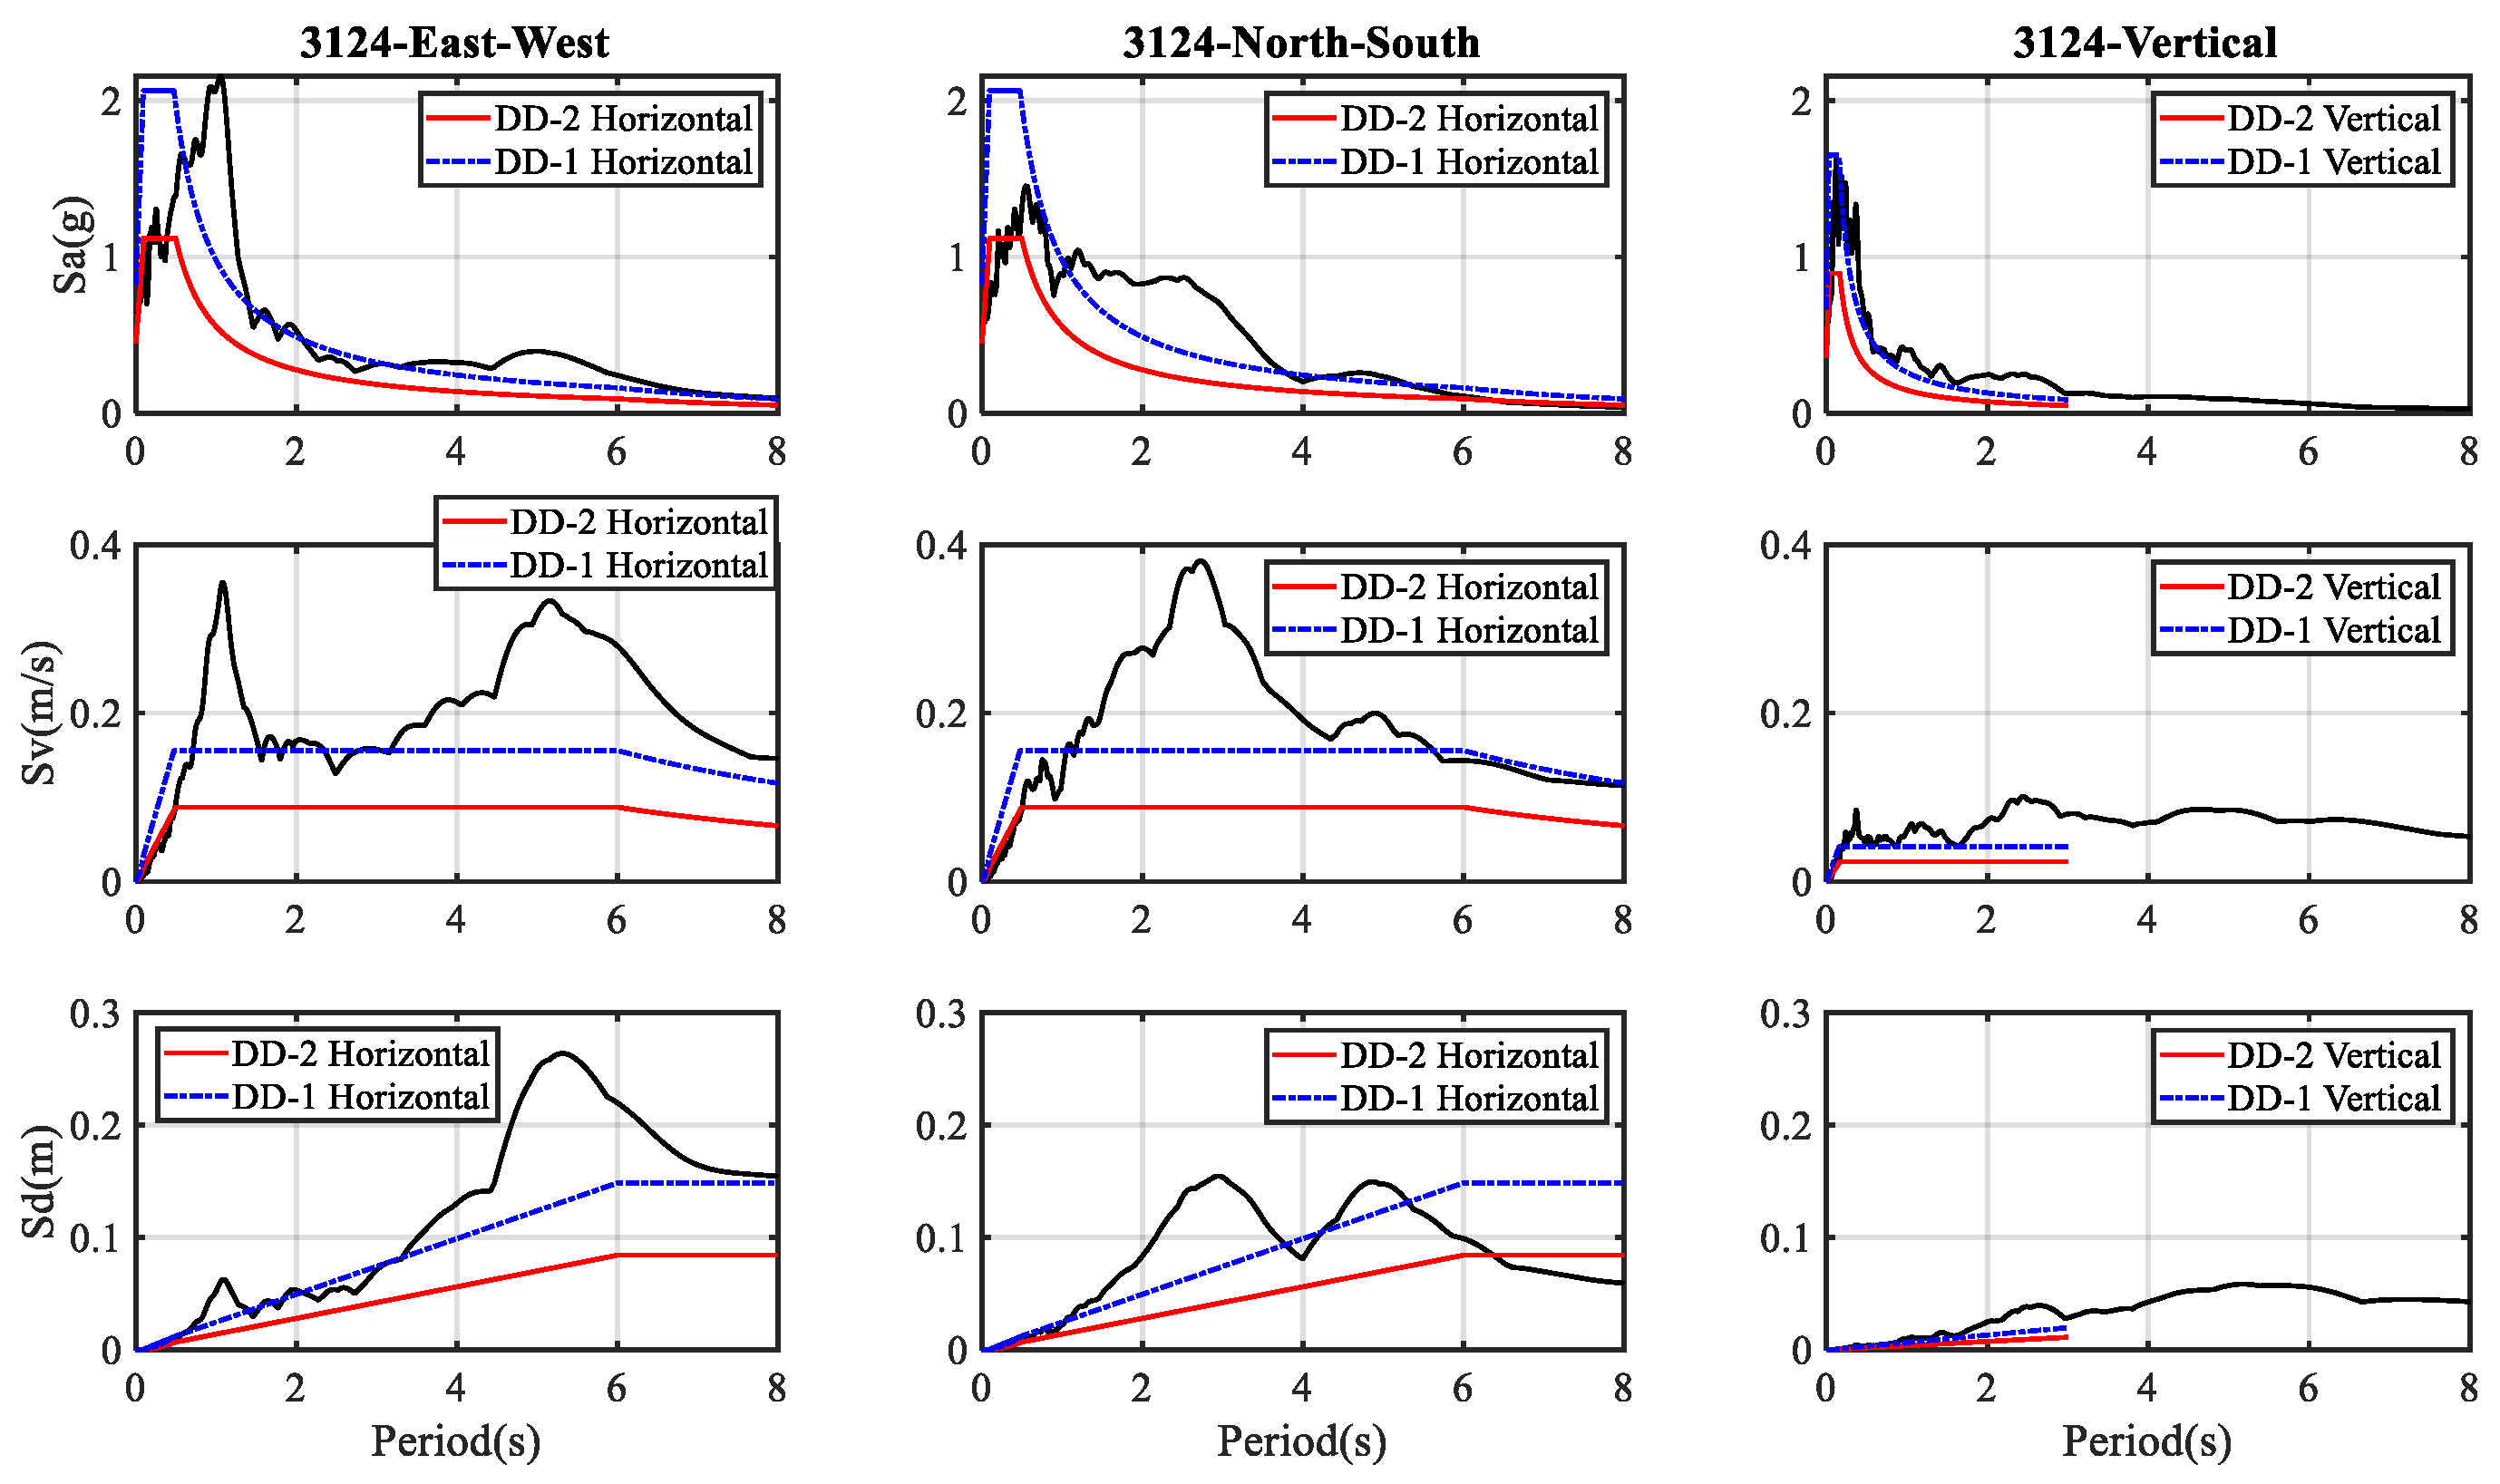
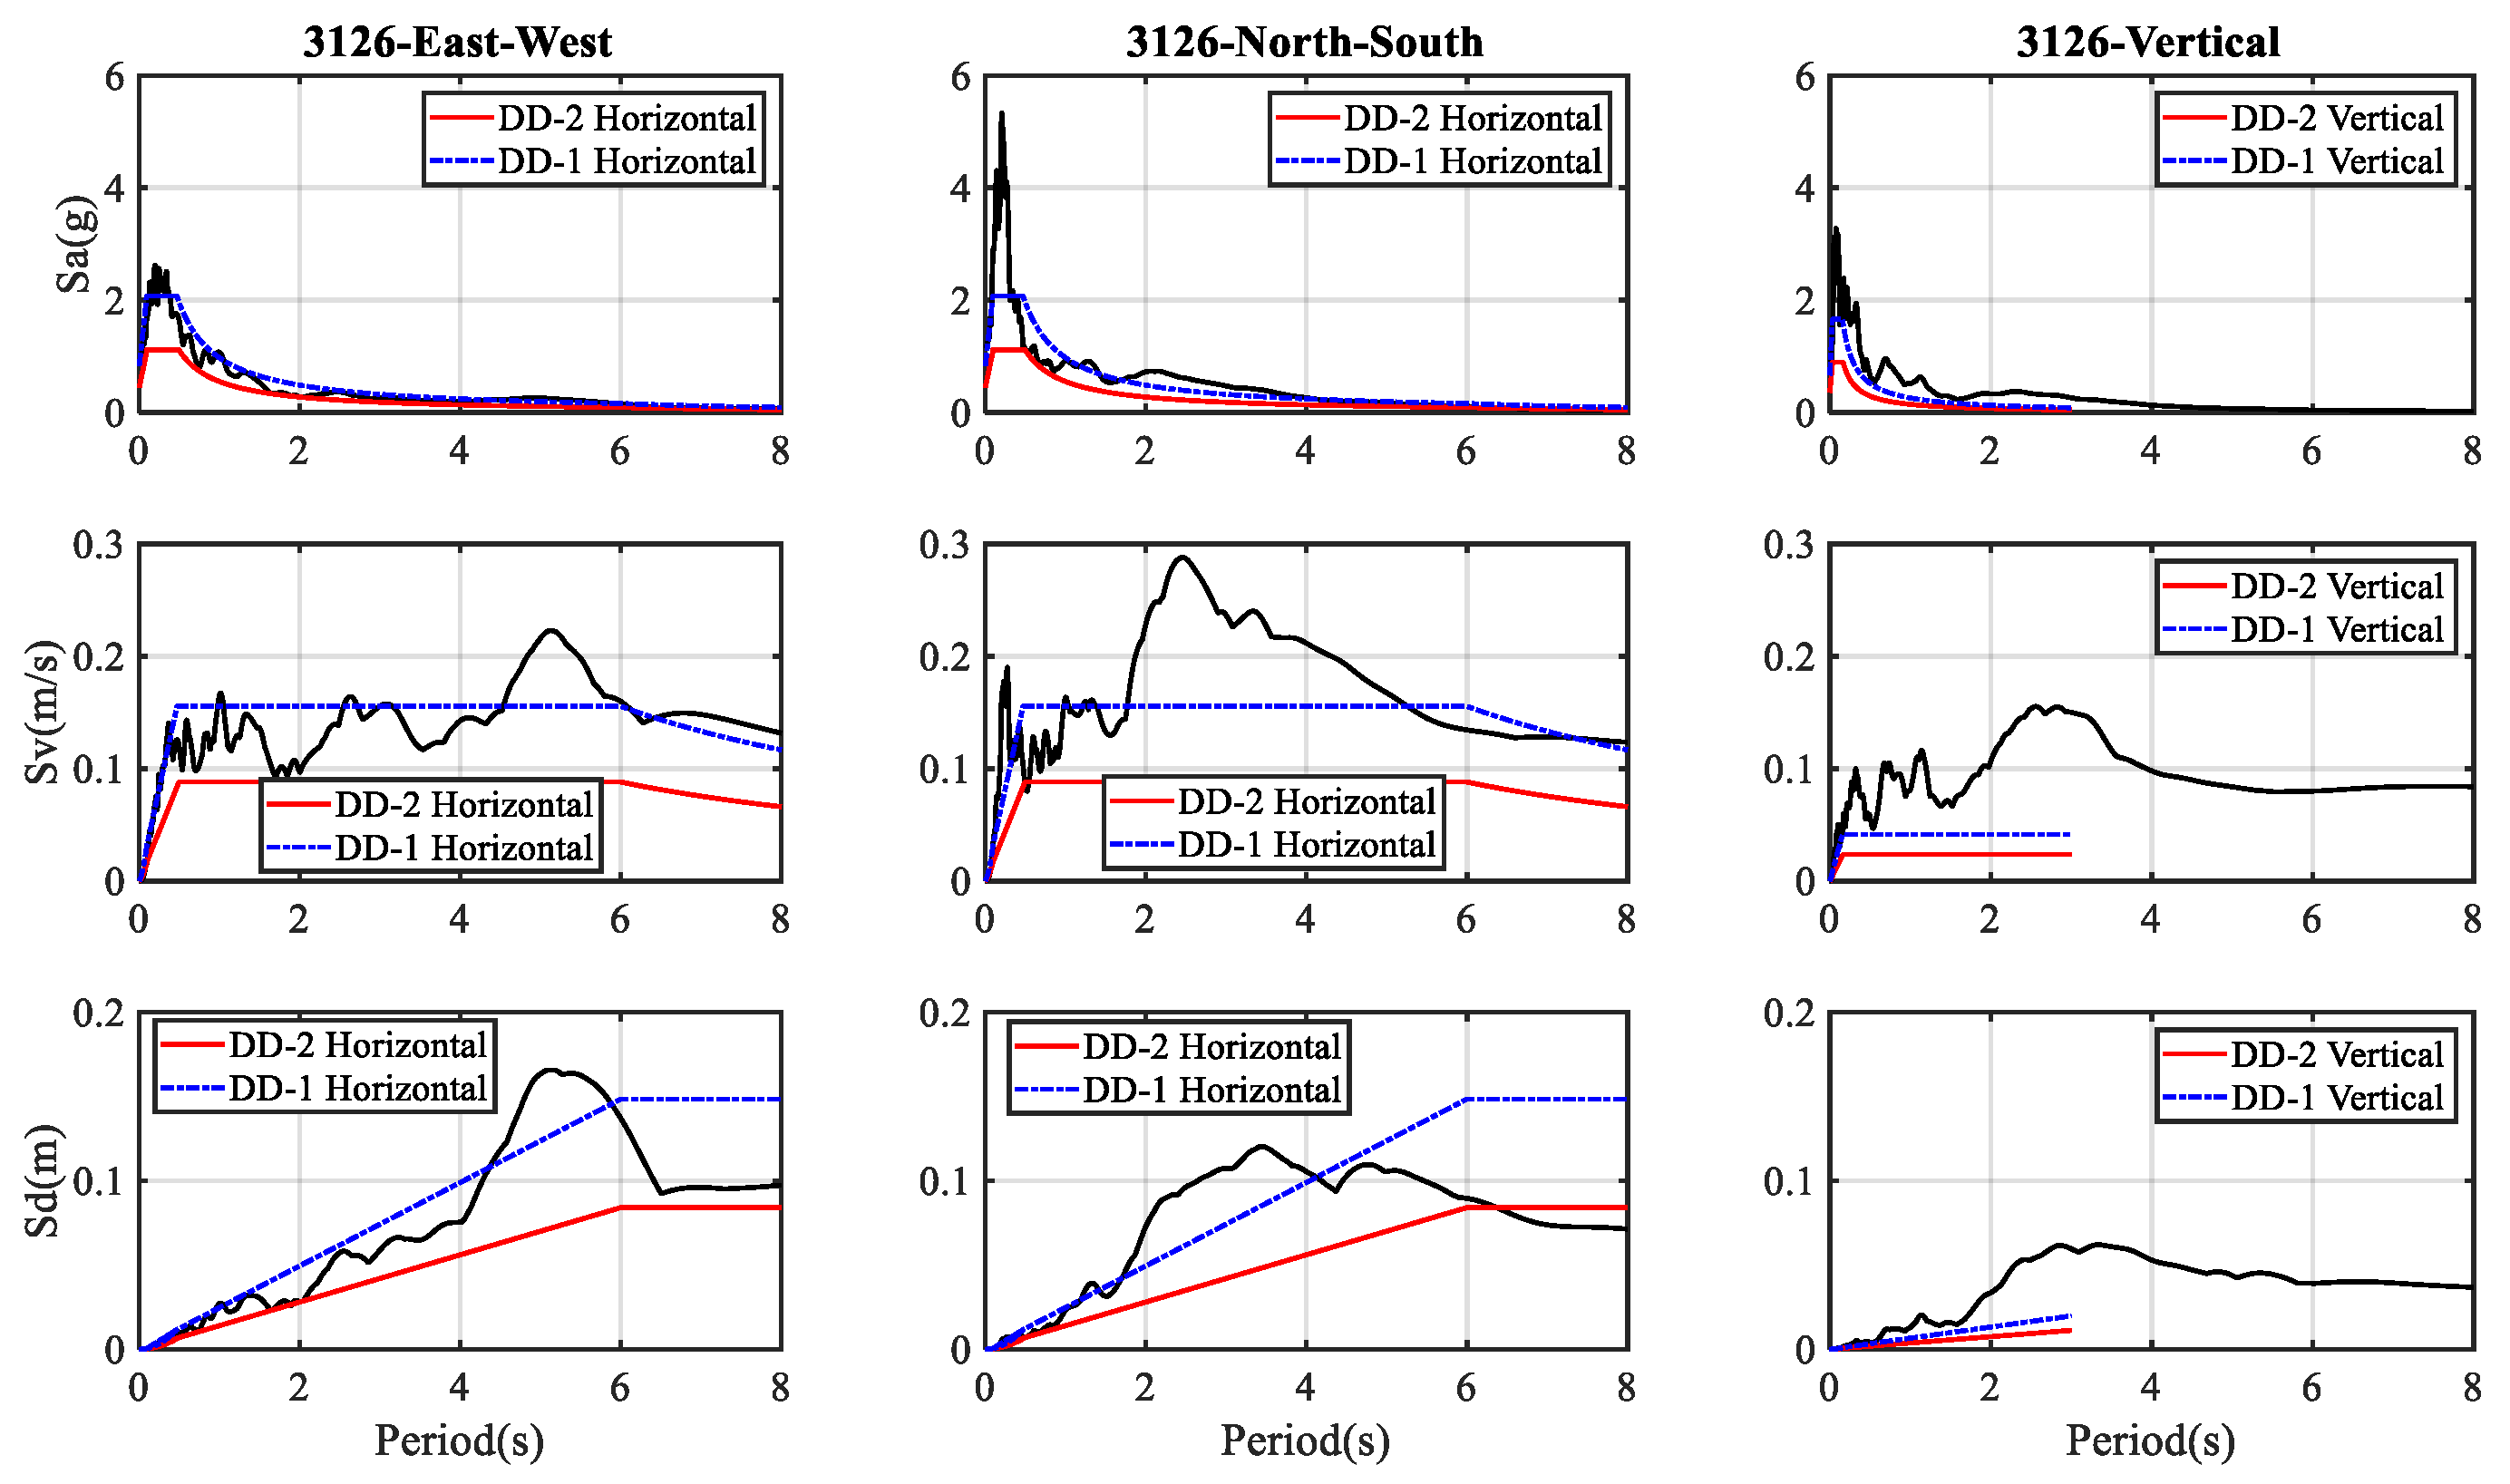
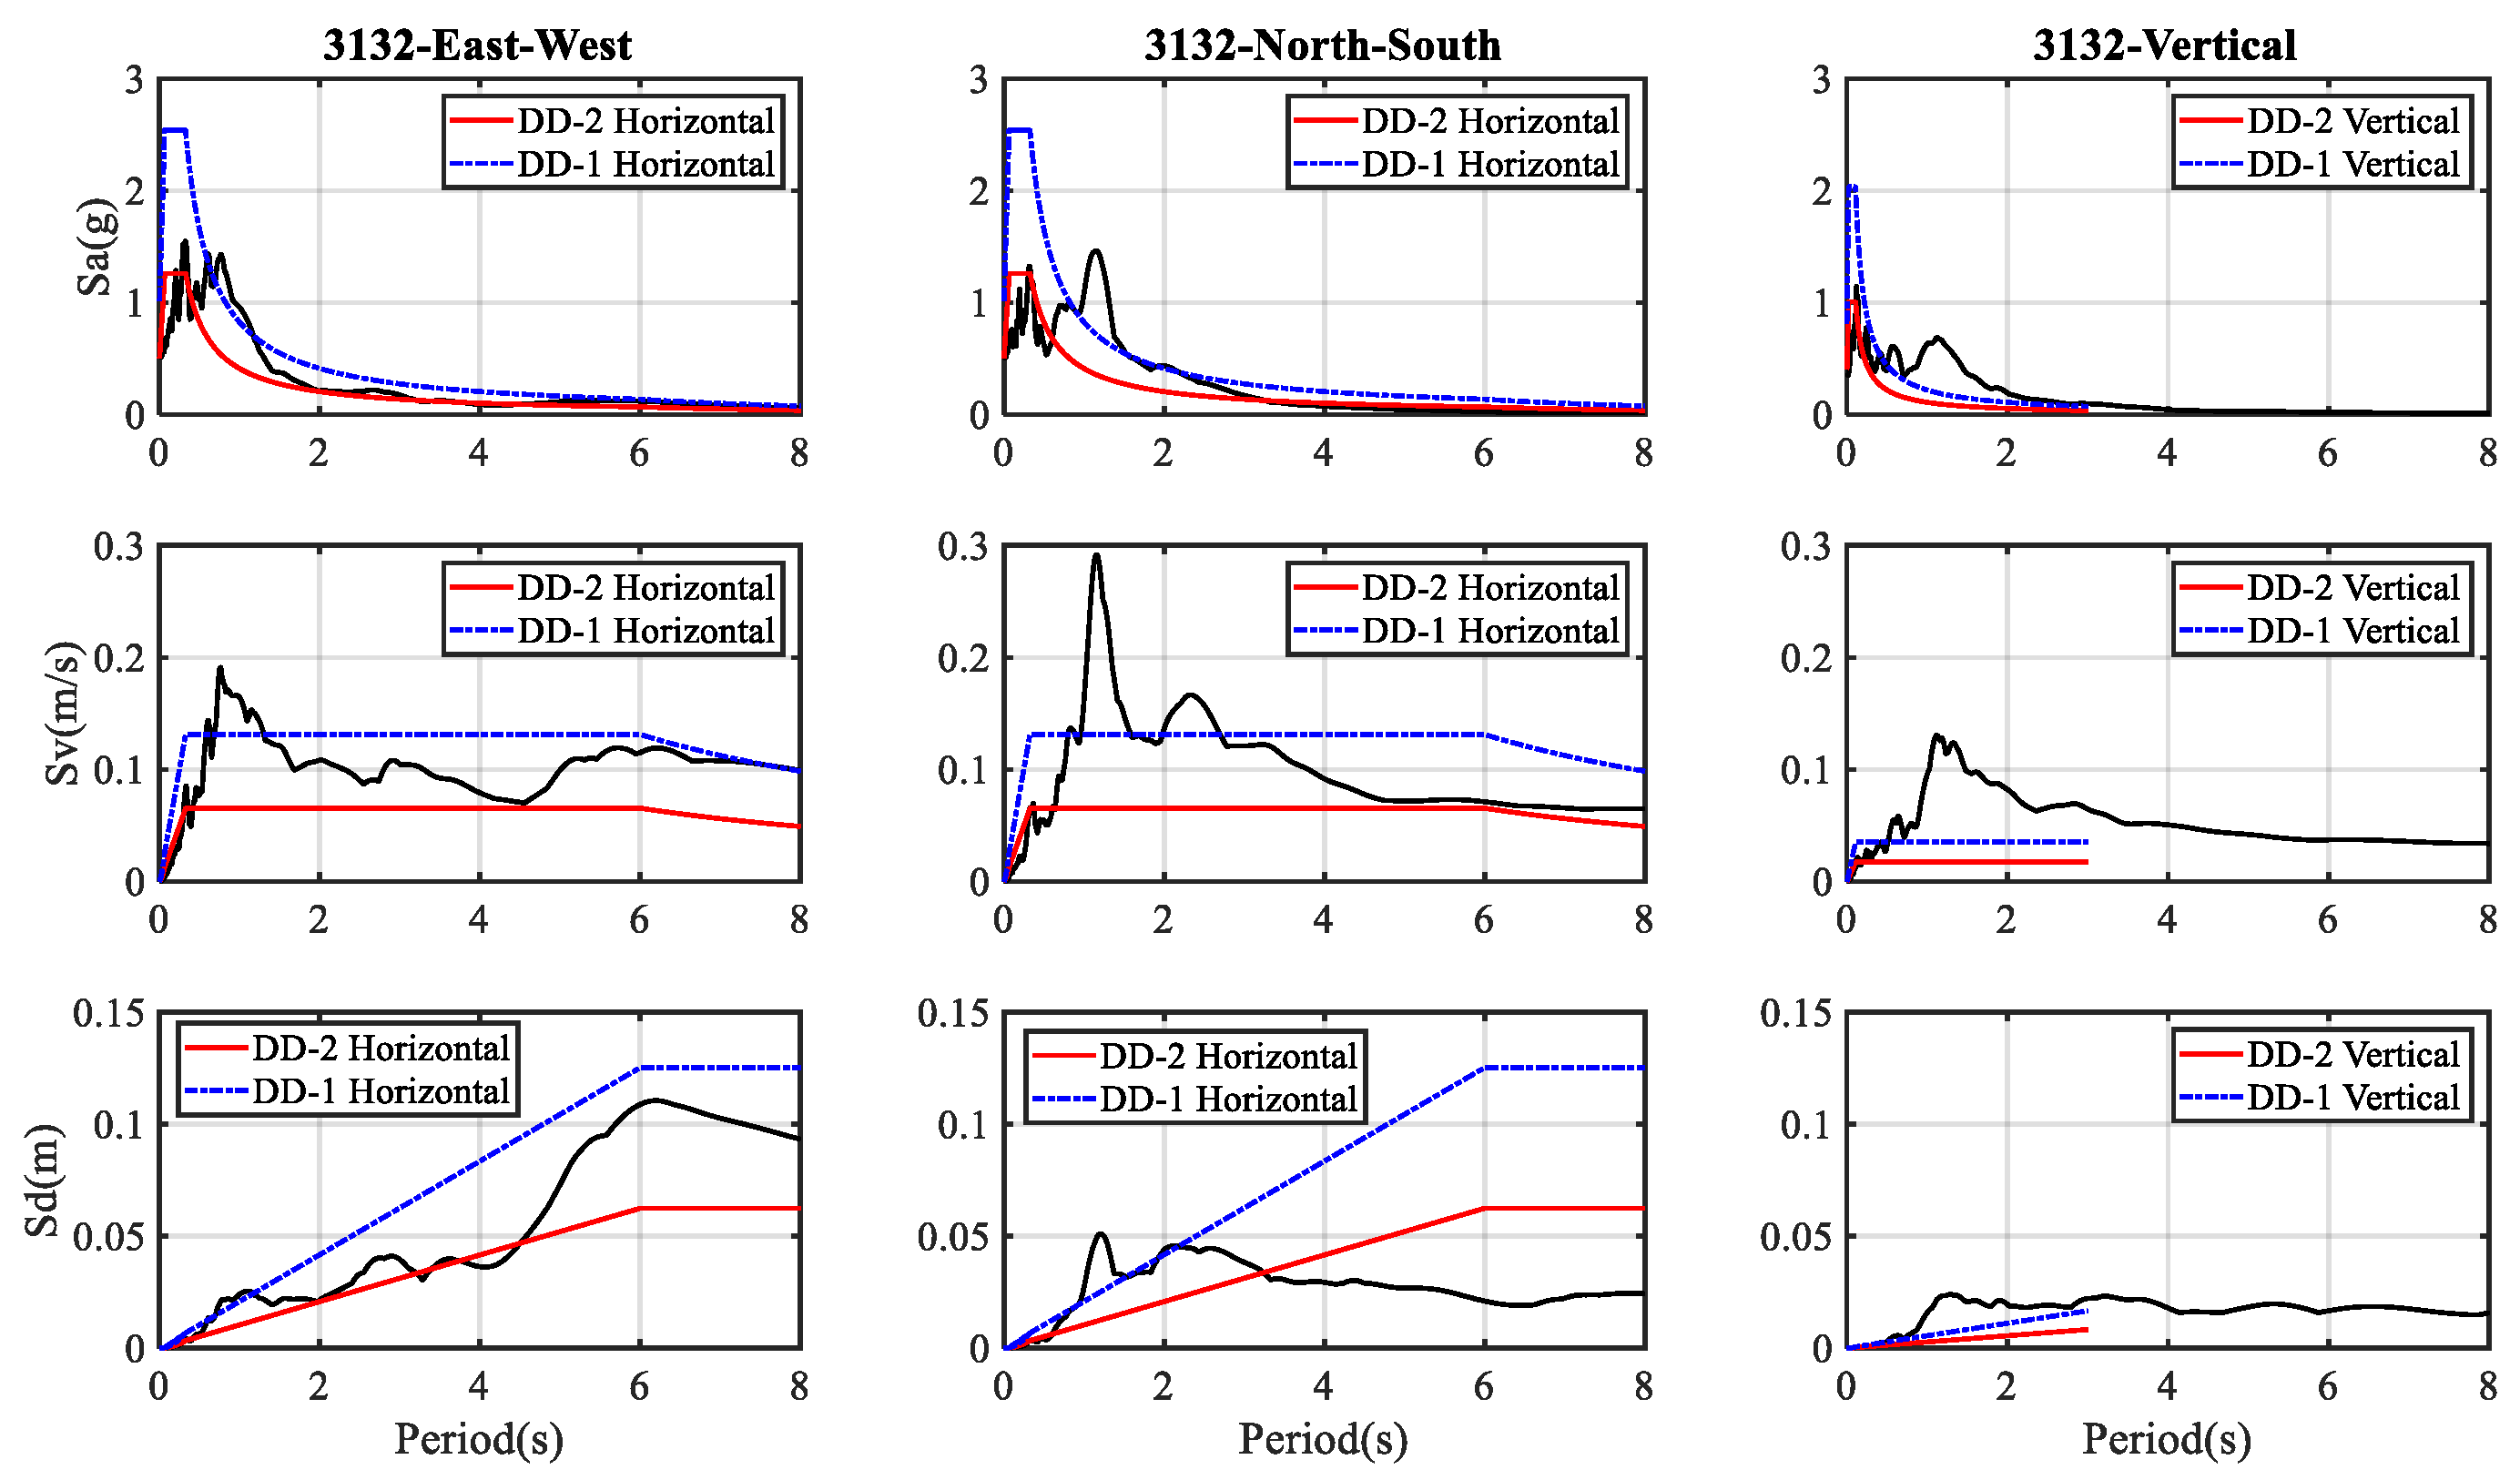
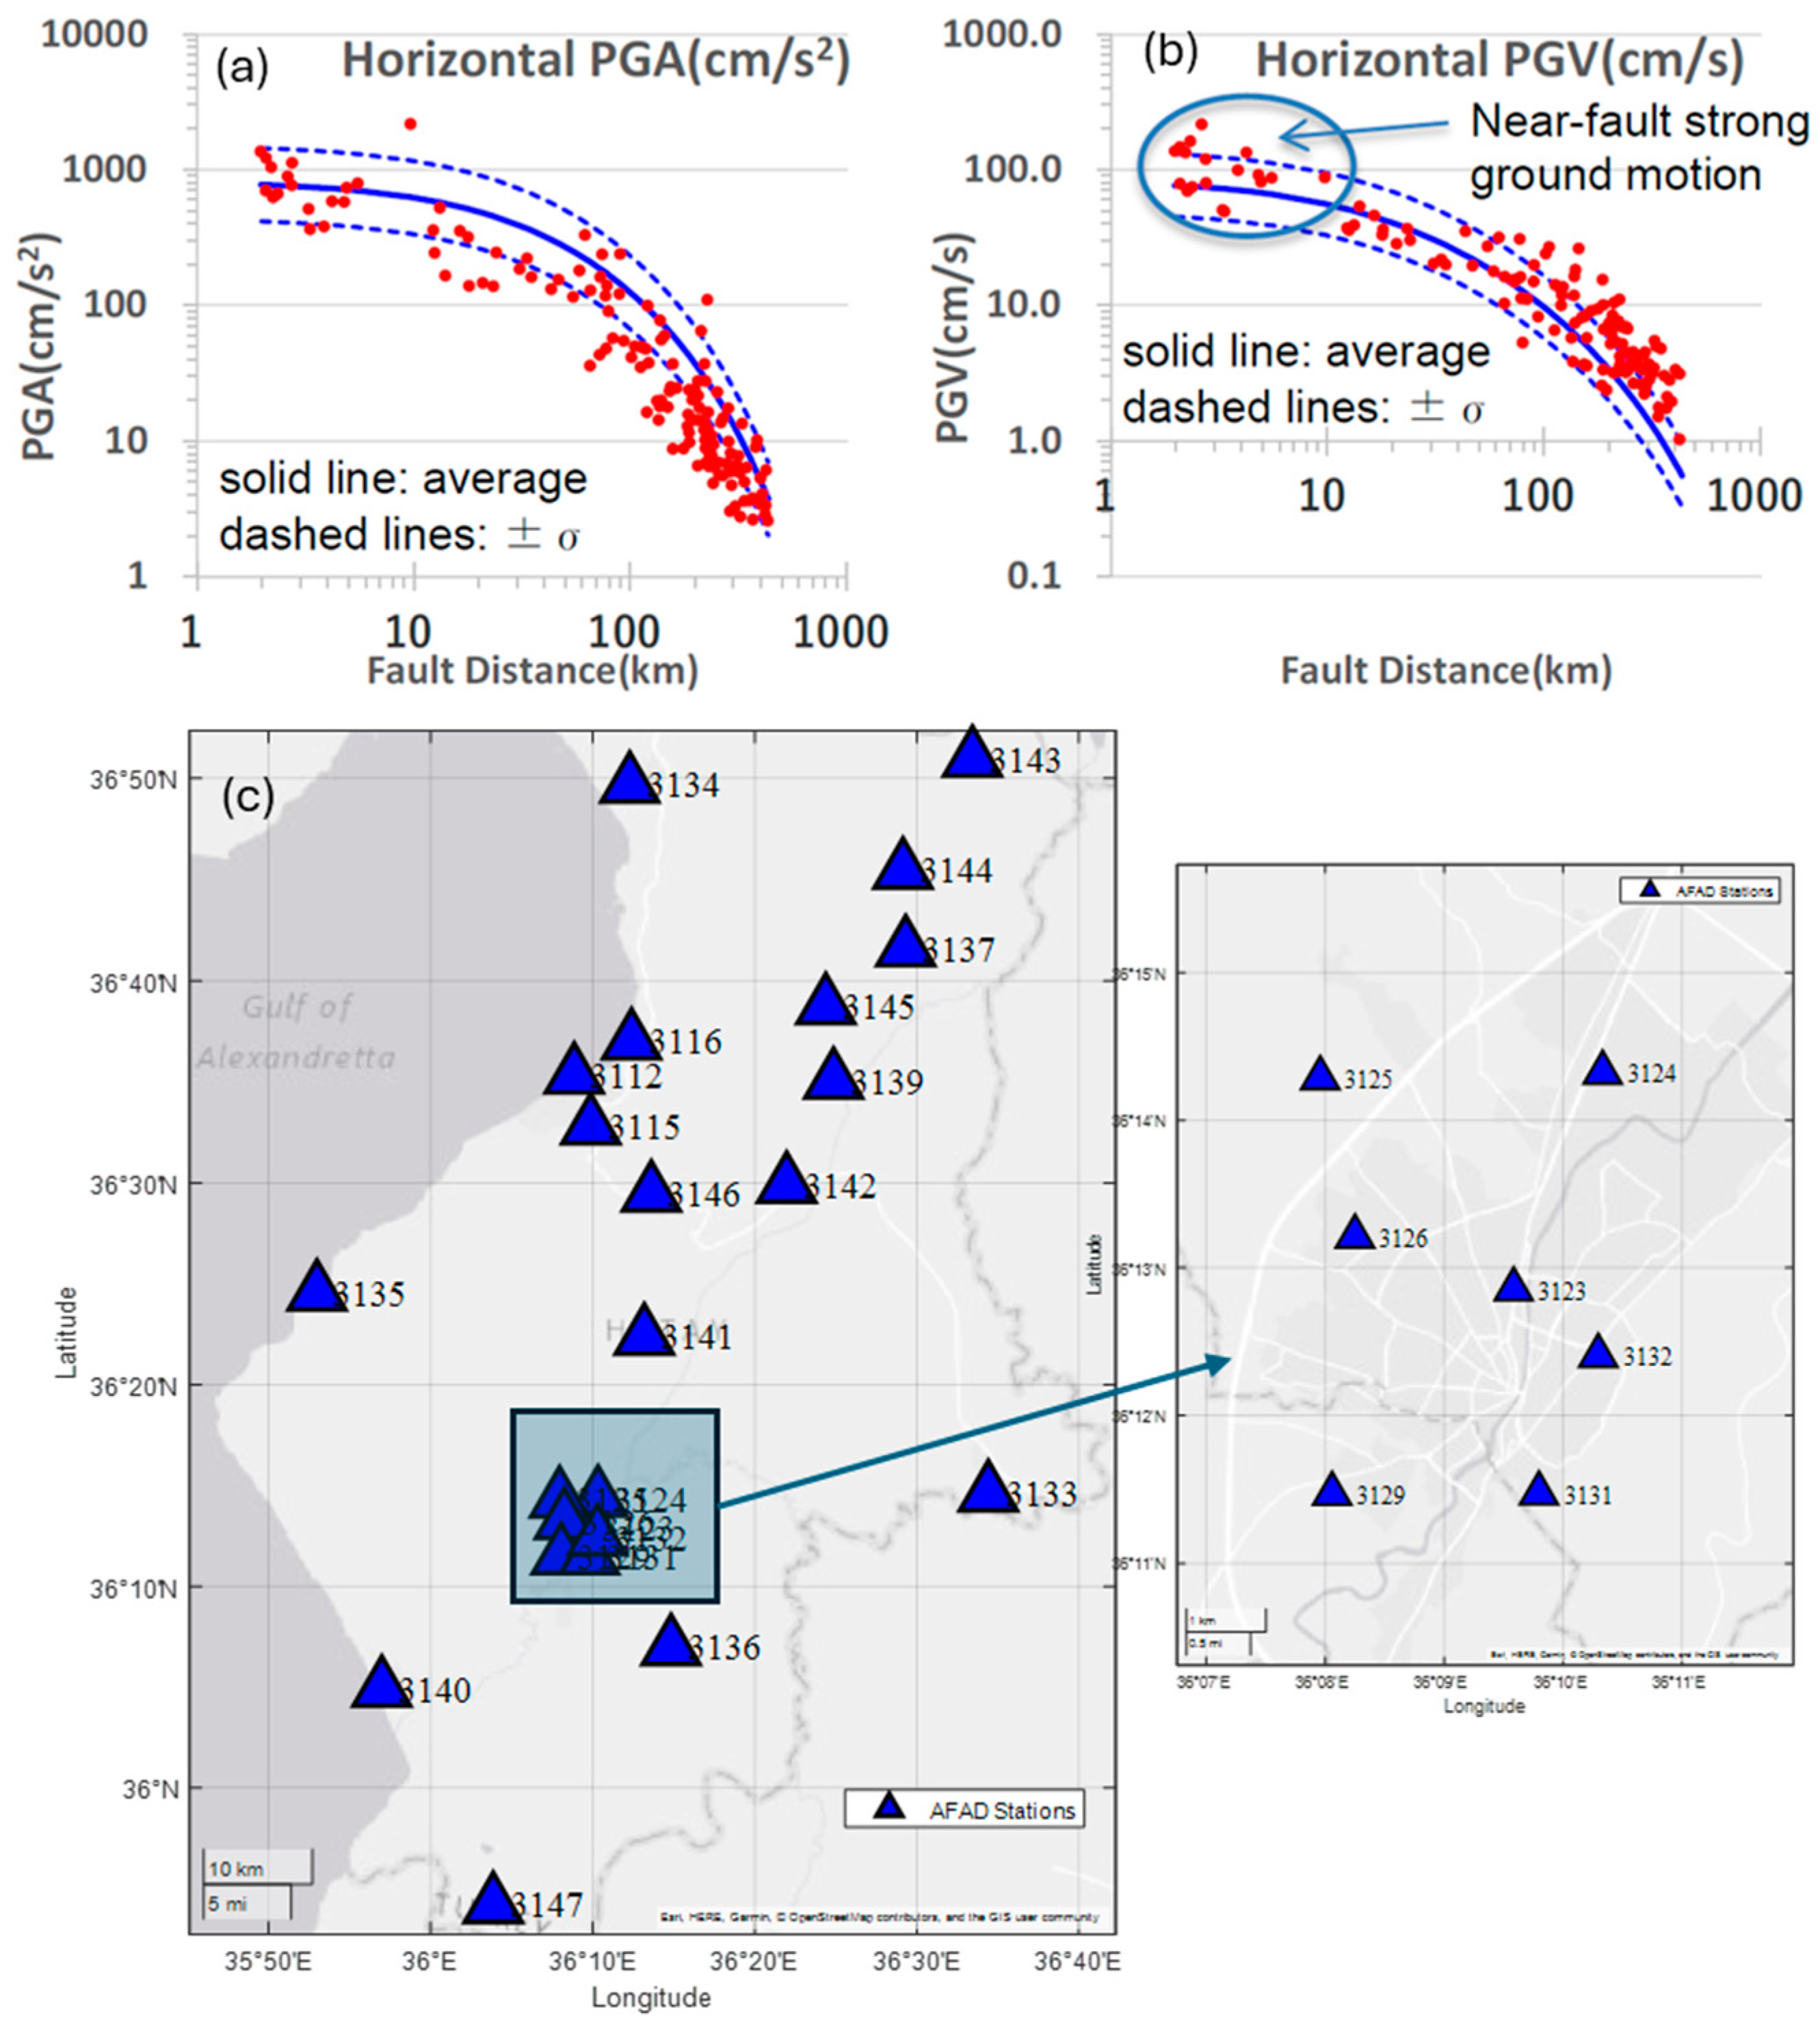
3. Ground Motion Characteristics of 6 February 2023 Earthquakes in Hatay Province

The 2023 earthquake doublet and a series of aftershocks were recorded in the earthquake-affected region by many stations. The number of recording stations of data providers for the three main shocks is shown in Table 1. Near-fault and far-field waveforms of AFAD were accessible to the international community immediately after the earthquake. AFAD generally provides strong motion data as raw and processed forms for users. Since processing raw data requires expertise in signal processing, only the automatically processed data by AFAD is employed in this study, to benefit practicing engineers. Therefore, some of the recordings might request further processing.
The 2023 Pazarcik and Elbistan earthquakes made significant contributions to the literature by reflecting particular conditions under the near-fault earthquake records and consequent earthquakes. Many near-fault earthquakes were recorded by the AFAD National Seismic Monitoring Network in Hatay because of well-known information gathered from seismic hazard studies and active fault mapping of the General Directorate of Mineral Research and Exploration of Turkey (commonly known as MTA in Turkish).
The list of strong ground motion stations with their geographic locations, site conditions, distance-to-epicenter, distance-to-hypocenter, distance-to-rupture, and distance-to-fault rupture projections are given in Table 2.
Even though the epicenter of the Pazarcik M w = 7.7 earthquake is very far away from the stations in Hatay, the near-fault orientation of the stations reflected the impulsive velocity content and high horizontal and vertical spectral values. Among strong ground motion stations in Hatay, R r u p and R J B values less than 10 km indicate these features strongly (Table 2). The locations of stations in Hatay and a close view of the heavily damaged city center in Antakya are given in Figure 5a,b. Seven strong ground motion stations in Antakya city center recorded high amplitude and destructive strong ground motion waveforms close to collapsed buildings during the first mainshock. Due to page limitation, only these seven ground motions will be shown while sharing the calculated Peak Ground Acceleration (PGA), Peak Ground (PGV), and Peak Ground Displacement values of the seven ground motion recordings for three components (e.g., East–West, North–South, Vertical) in Figure 6, Figure 7, Figure 8, Figure 9, Figure 10, Figure 11 and Figure 12.
In Hatay, a comparison of recorded PGV values indicates that estimated horizontal PGV values from seismic hazard maps of Türkiye for the DD-1 and DD-2 earthquake levels were almost exceeded in every station except in TK-3112 and TK-3147 stations for both horizontal components. Moreover, within the horizontal components of two stations, East–West TK-3116 and TK-3146 had high PGV values, slightly less than the estimated values for the DD-1 earthquake level. Four different earthquake levels are introduced in TSDC-2018 based on the Seismic Hazard Map of Türkiye-2018. Generally, two earthquake levels corresponding to 2475 and 475 years account for the Maximum Credible Earthquake (DD-1) and the Design-Based Earthquake (DD-2) with 2% and 10% probability of exceedance in 50 years, respectively. Horizontal and vertical design spectra of each station were established using the recently updated Seismic Hazard Map of Türkiye and the TSDC-2018 [21] to compare the response spectra of horizontal and vertical waveforms of the selected stations. Apart from Hatay Province, for the Kahramanmaraş 4614 earthquake station, the horizontal and vertical components’ PGA values exceeded 2 g and 1.6 g, where the spectral acceleration values for stiff structures in the constant acceleration period range exceeded 6 g based on the provided processed data. Similarly, in Antakya city center, based on the variation of elastic spectral acceleration (Sae) and spectral velocity (Sv) in Figure 13, Figure 14, Figure 15, Figure 16 and Figure 17, all records had higher values than the DD-1 design spectrum, whereas the TK-3131 and TK-3132 stations in Figure 18 and Figure 19 had values between the DD-1 and DD-2 spectrum.
It is worth noting that the PGV value is not a design parameter considered per TSDC-2018. However, it is well-known that PGV has consistent correlations with damage [23]. Following the Pazarcik and Elbistan earthquakes, USGS provided PGV ShakeMaps (Figure 20).
Duration, amplitude, and frequency content of the recorded ground motions are essential to assess the influence of ground motion characteristics on the built environment. A total of 17 strong ground motion parameters were calculated for the suite of ground motions in Hatay Province. For brevity, only nine of them are shared in this study to illustrate the destructiveness of the ground motion recordings (Table 3).
PGA and PGV values are compared briefly with selectively well-known design spectra that use these intensity measures. The PGA value in the Eurocode design spectrum is determined by the seismicity of the country supported by Annexes. The overall PGA values used in European countries are lower than the recorded PGA values in Hatay. Among selectively well-known design codes, Building Standard Law in Japan considers PGA on a macro scale for the entire country, like in TSDC-2007, whereas in the state of practice as a good damage indicator, the Level-2 and Level-3 earthquake corresponds to 50 cm/s and 75 cm/s. PGV values have exceeded Level-2 ground motions in Japan, and the maximum PGV in the TK-3123 station reached up to 187 cm/s in Hatay. Regarding spectral accelerations, the strong velocity content can be easily traced for the mid-rise buildings, and it increases demand parameters.

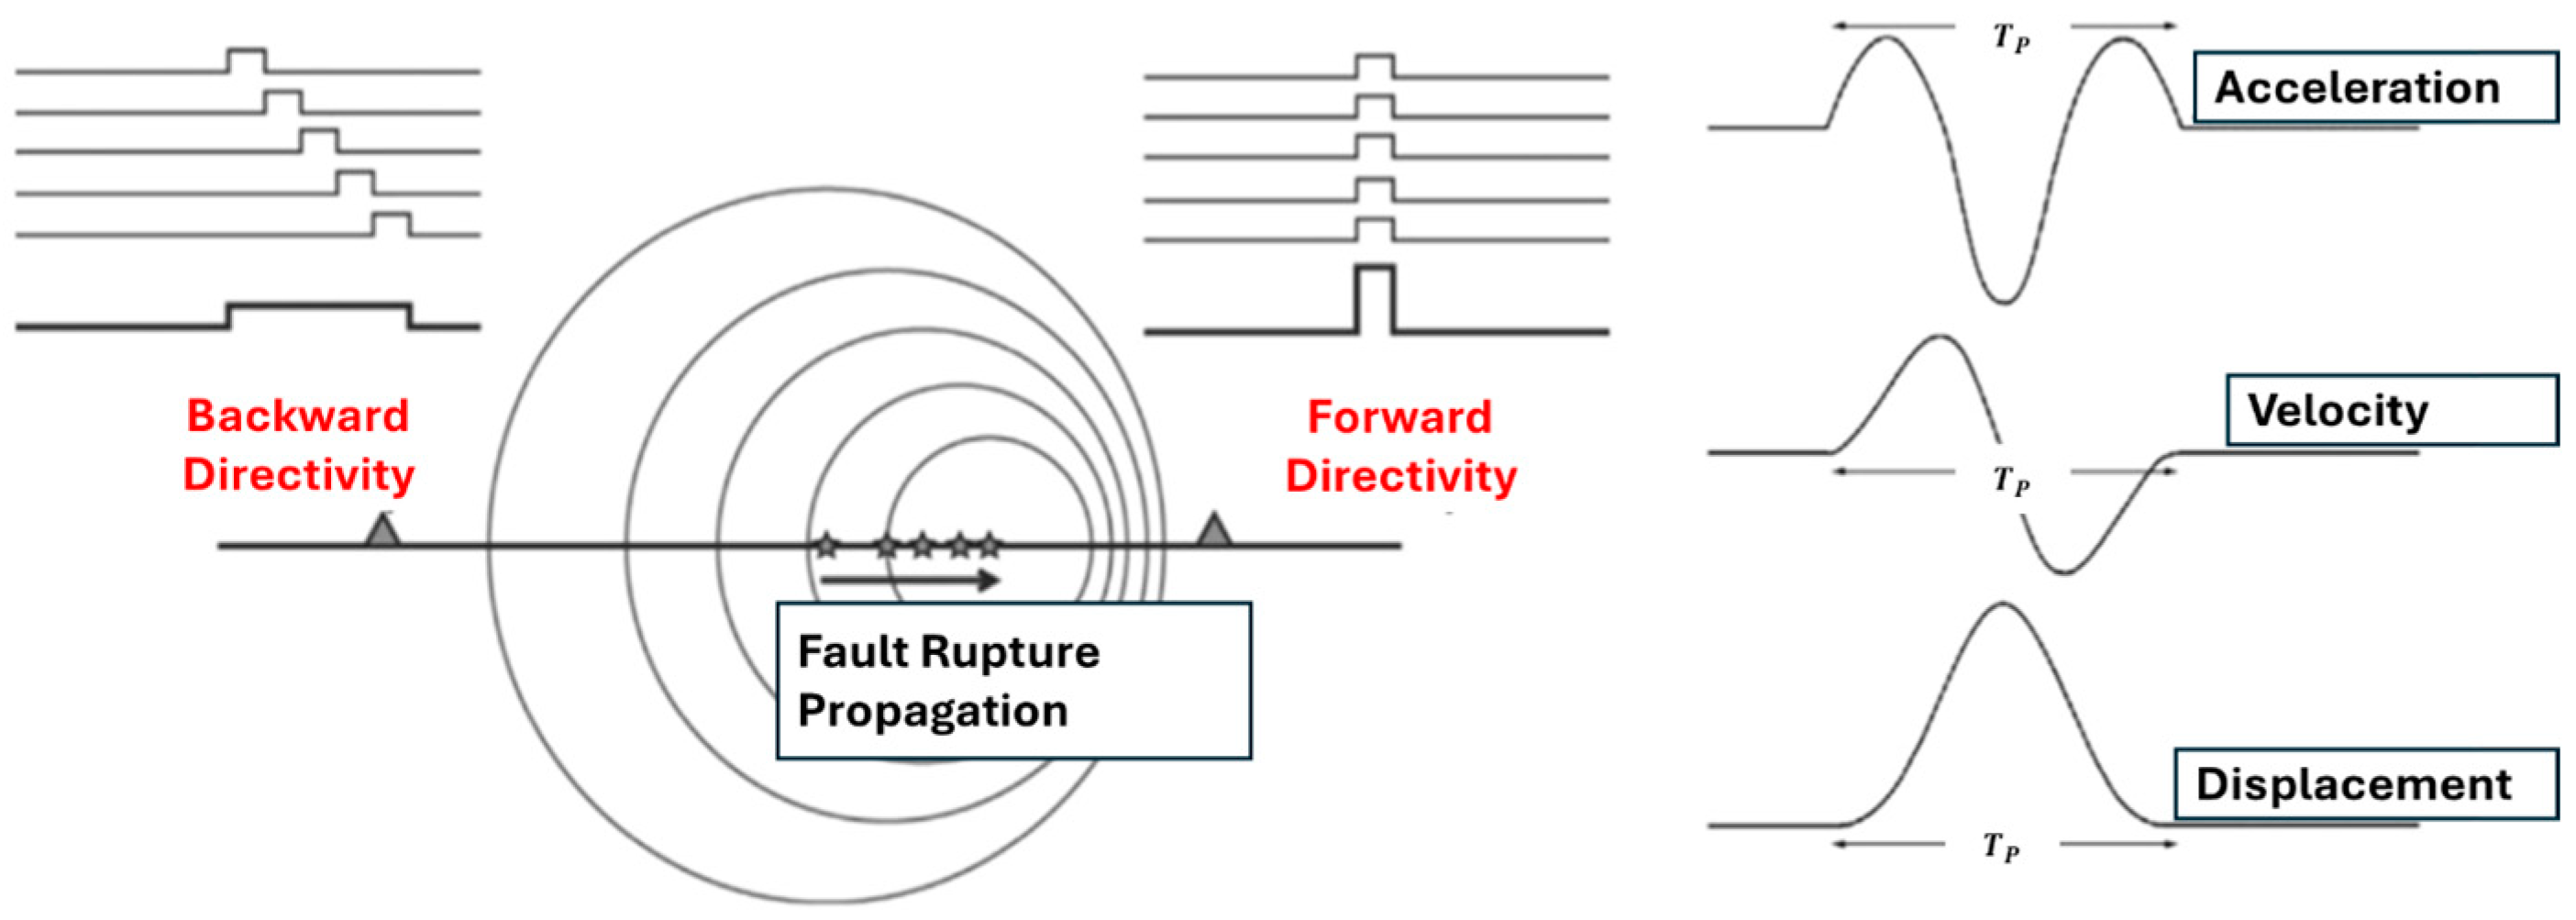
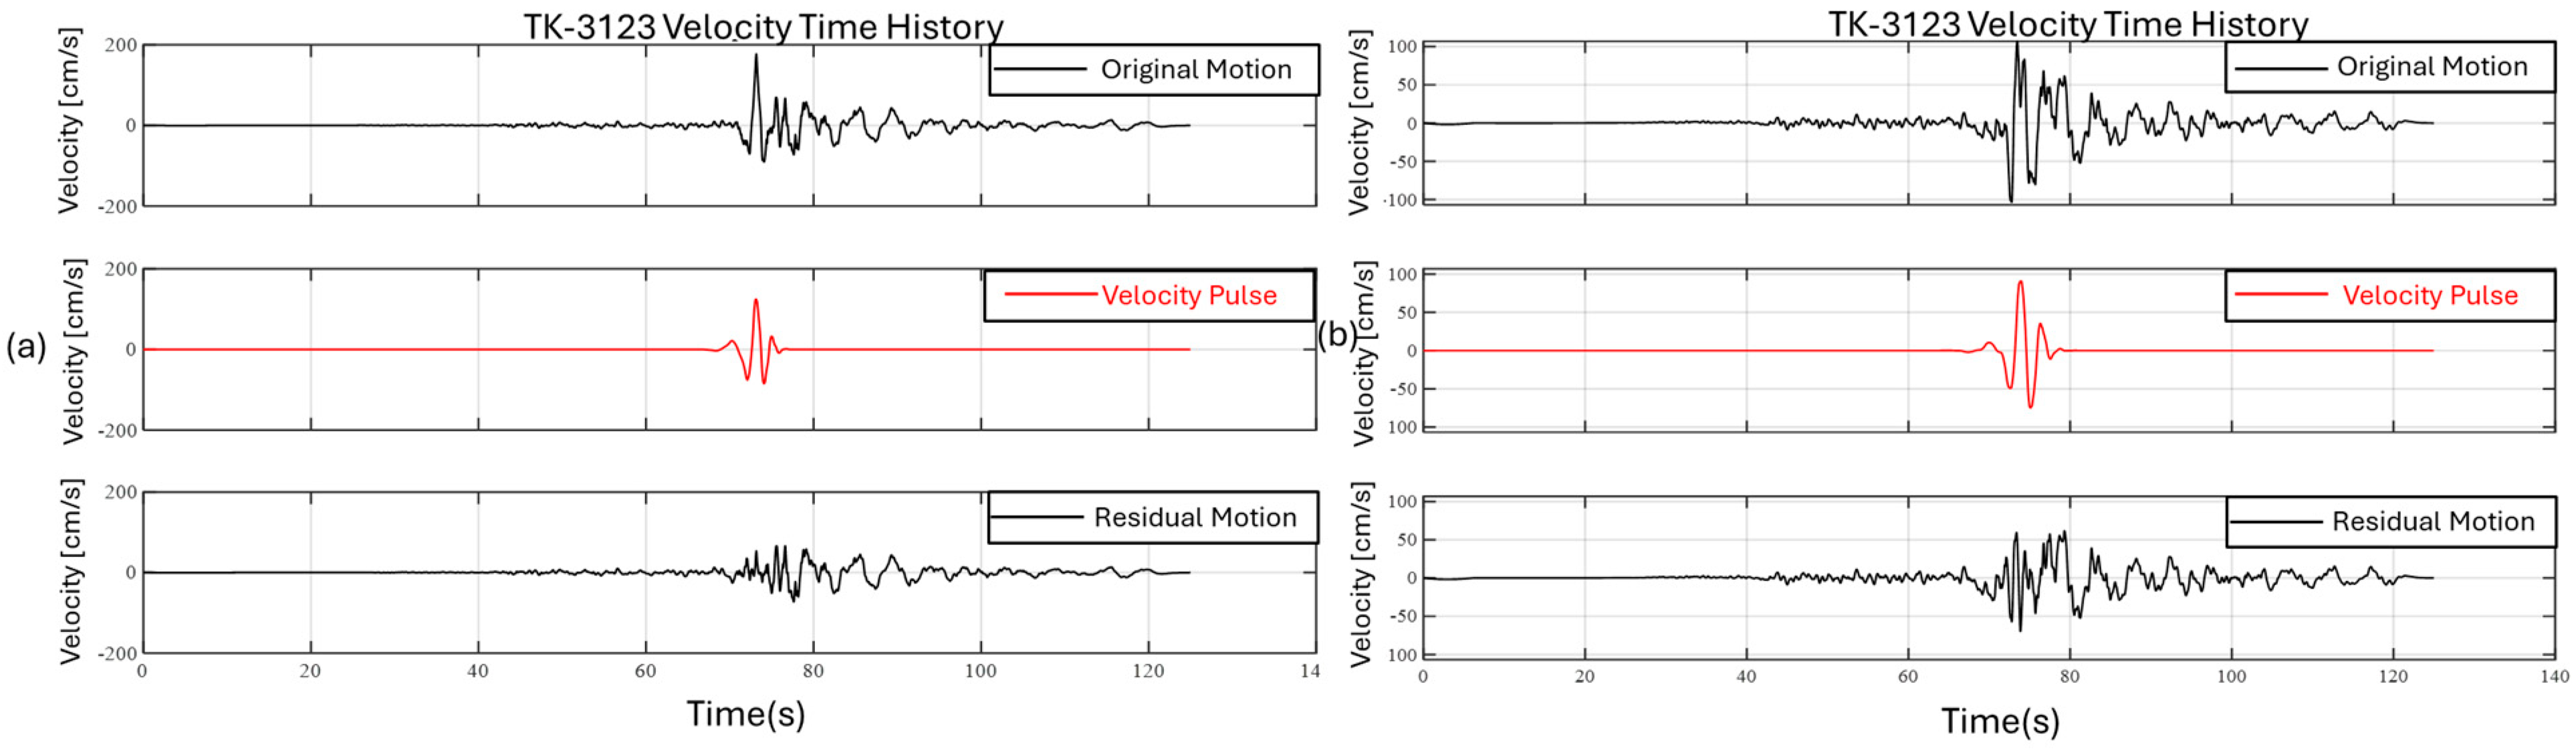
Investigation of Near-Fault Characteristics of Ground Motions in Hatay Province

Earthquake records obtained from stations ranging between 0 and 15 km from the fault rupture zone have high-energy containing large pulses, and strong vertical earthquake ground motion components increase the structural damage in a short duration [25,26,27,28,29,30,31,32,33]. During the 6 February 2023 earthquake sequence, recorded ground motions close to fault rupture had directivity effects. Ground motions subjected to directivity effects in earthquake records and the concept of impulsive content effects for the backward and forward directivity are shown in Figure 21. Backward directivity has a lower amplitude content with a longer duration, whereas forward directivity motion has the inherent features of a short duration and large amplitude content. Thus, the quantitative classification of strong ground motions used in this study is similar to the compilation of the database in the US to understand the existence of velocity pulses [34,35]. In other words, a modified version of Baker’s classification method proposed by Sashi and Baker is used in this study [35]. This classification method is used in the PEER NGA-West-2 database [36].
The parameter indicating whether the velocity pulse is present in the record is efficiently detected using the maximum ground velocity of the original record and the maximum ground velocity of the residual record after extracting the velocity pulse and incorporating the energy ratios of the two records. Since this study is focused on the damage potential of extreme events in Hatay, first the near-fault earthquake records were assessed rapidly by checking the PGV and distance relationship. Apart from NGA-West2 Ground Motion Models, the attenuation relationship of Si and Midorikawa [37] 1999 is utilized by Hisada et al. [38]. In Figure 22, variation of PGA and PGV values with distance showed that PGV values were underestimated in near-fault regions. In the data set of Figure 22, three ground motions, namely TK-3125, TK-3126, and TK-3129, were excluded for early observation to check the estimation accuracy of the ground motion prediction equation.
The aforementioned procedure has been applied to 24 stations in Hatay. Among all stations, 18 stations are identified with the velocity pulse content. In Antakya city center, TK-3132 is the only station without velocity pulse content. The minimum and maximum velocity pulse periods (Tps) of the processed ground motions are 1.76 s and 14.448 s, respectively. In Antakya city center, the pulse period varies from 1.764 to 12.264 s. Extracted velocity pluses for the TK-3123 and TK-3124 stations are given in Figure 23. The influence of extreme ground motion characteristics on the overall response of structural systems is discussed in Section 6 based on the implications of the nonlinear response history analysis.

4. Field Observations in Hatay

Although this study mainly focuses on the effects of extreme events on the structural systems through simplified nonlinear analysis of fixed-base and SI buildings in Hatay, the author believes more accurate remarks can only be verified with the help of field observations based on region-specific visual inspections and damage statistics. The earthquake doublet on 6 February 2023 has been a critical test for seismic isolation technology. The author visited the disaster region several times to understand the damage patterns in residential buildings and seismically isolated healthcare facilities [39]. To summarize field observations in Hatay and its surroundings, visual inspections of residential buildings, healthcare facilities, industrial facilities, and cultural heritages are briefly given in this section [39,40]. During the visual inspections, surveys with the residents, administrators, and hospital staff were conducted to understand the situation following both earthquakes and identify the impact of successive earthquakes and aftershocks.

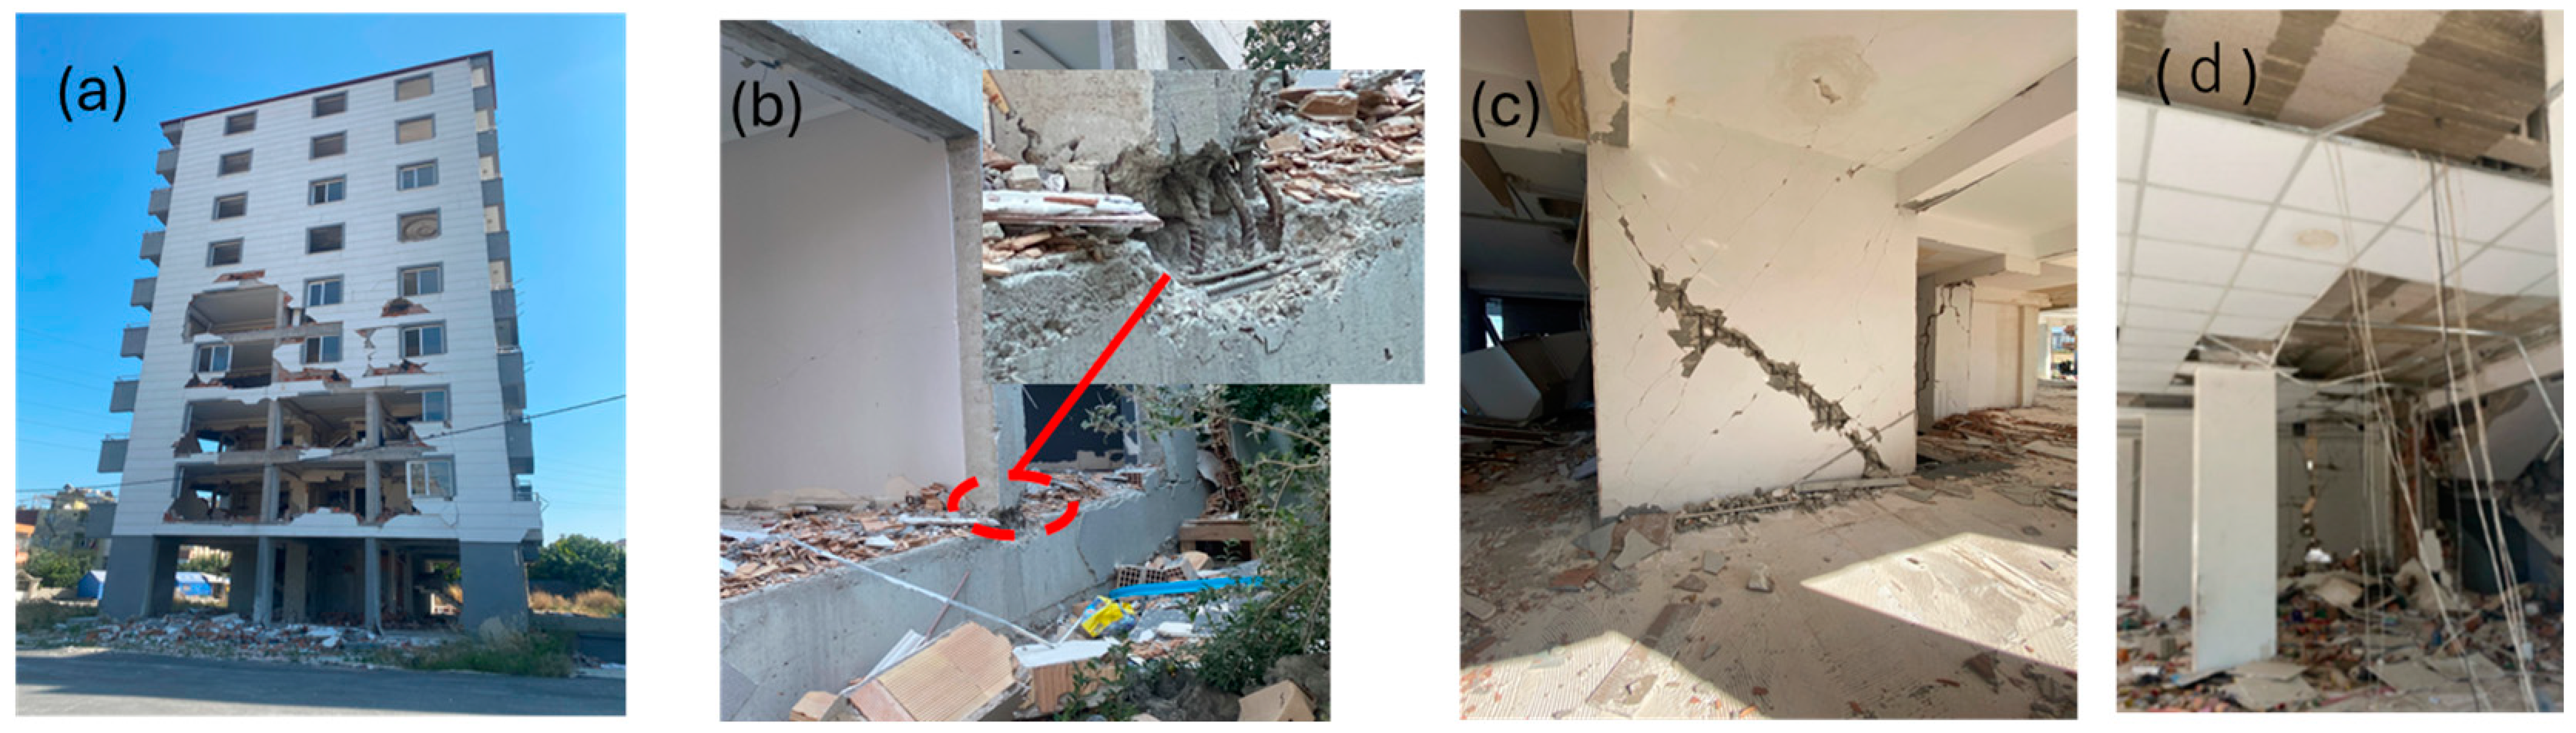
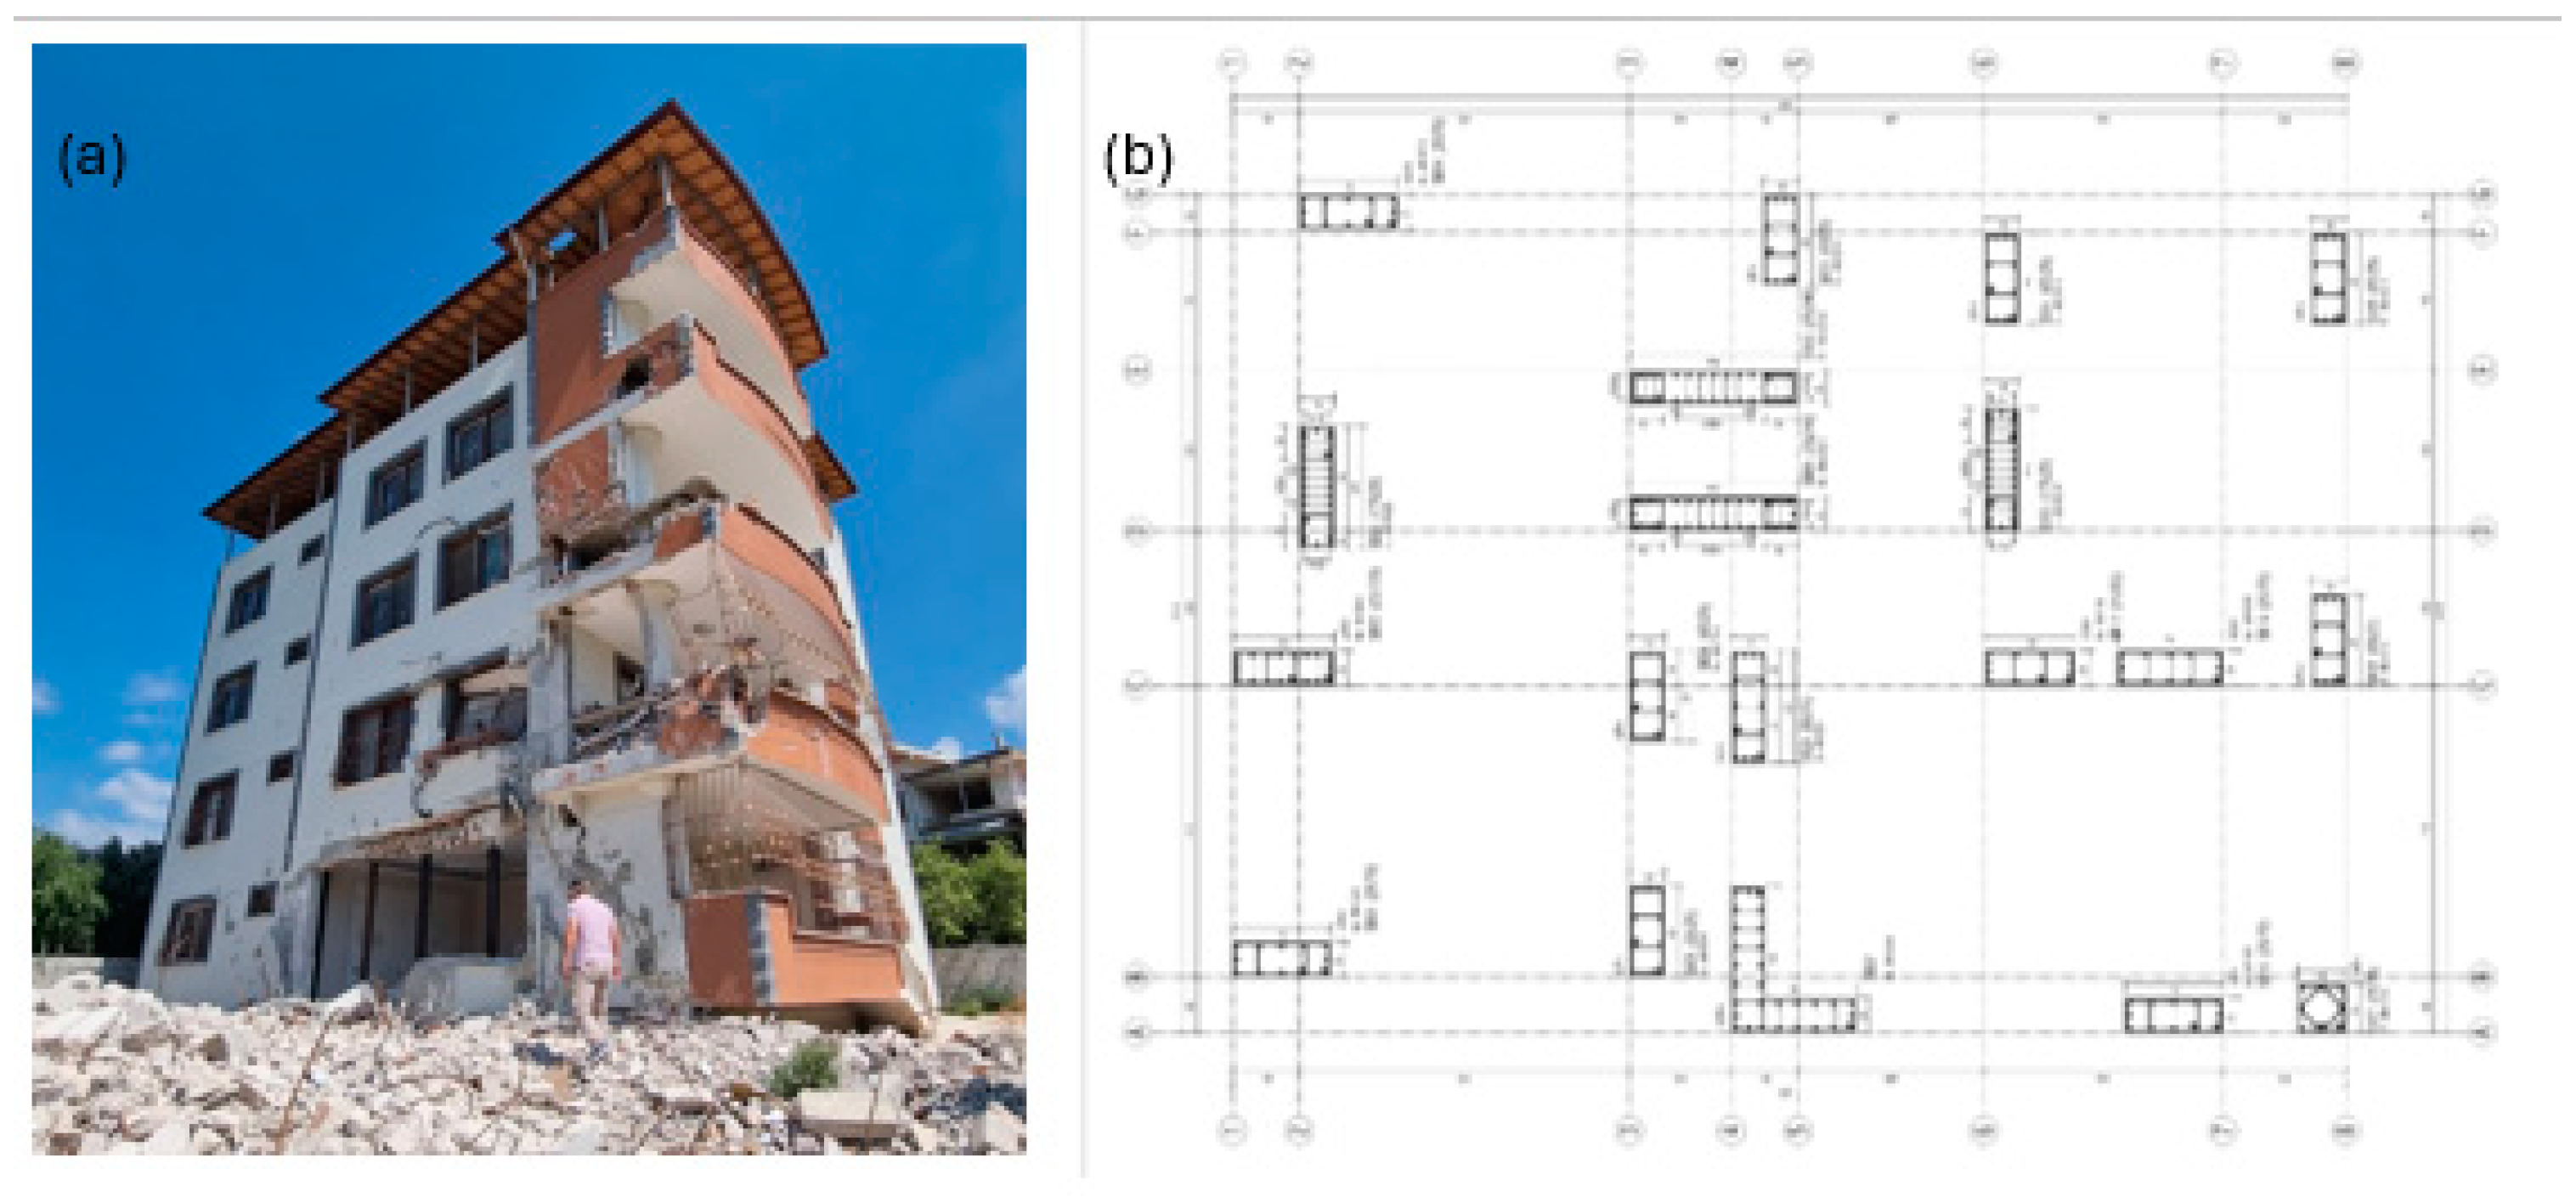
4.1. Site Surveys and Damage Observations in Hatay Province

4.1.1. Residential Buildings

Common structural deficiencies in buildings can be attributed to non-closely spaced transverse reinforcement, discontinuity of steel reinforcements, having shorter lap splices than the required amount in design provisions, low-quality-labor work, and poor construction materials, like in past earthquake field visits during the 2011 Van Earthquake. Out-of-plane failure of unreinforced infill masonry walls increased the financial losses (Figure 24a). Many residential buildings experienced total collapses and partial collapses in Hatay. Due to irregularities in the structural system, soft-story collapse damage in mid-rise buildings is commonly observed (Figure 25). Moreover, the pounding and collapse of buildings on the neighboring buildings increased the damaged state of the buildings (Figure 26).

4.1.2. Fixed-Base Healthcare Facilities

Healthcare facilities within the borders of Hatay province were adversely affected by the February 6 earthquakes in terms of functionality rather than structural damage, except for Akademi Hospital (Figure 27a,b) and Iskenderun State Hospital. Mustafa Kemal and Erzin Hospital experienced the loss of functionality and gave service to residents through established field hospitals after the two main shocks (Figure 27c,d).

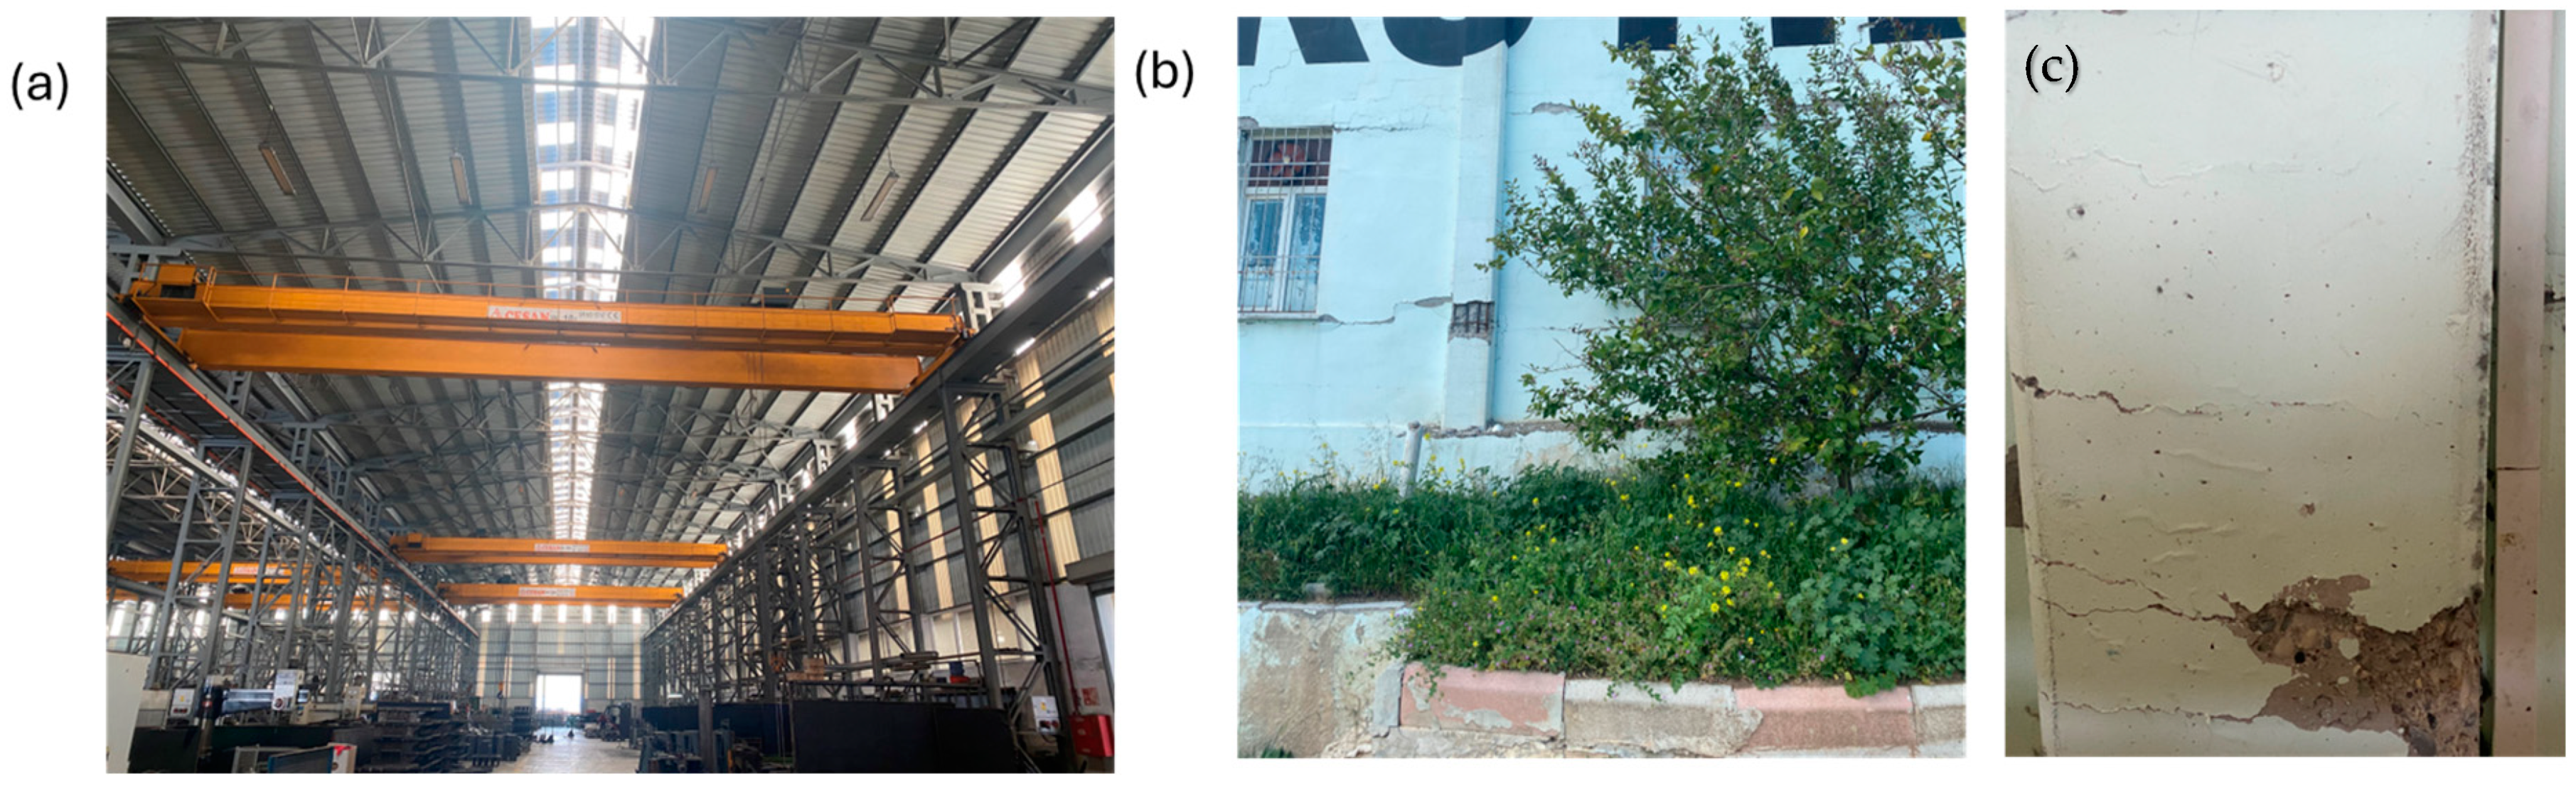
4.1.3. Seismic Performance of Industrial Facilities

Precast concrete industrial buildings built before the 1997 design code were found to be vulnerable because of connection failures between columns and beams. In the Hatay industrial zone, two of the visited facilities are shown in Figure 28.

4.1.4. Cultural Heritages

Kurtulus district was the main attraction center where socio-cultural and commercial activities were carried out. There were restored cultural heritages such as the Habibi Neccar Mosque, Turkish Catholic Church, Affan Coffee House, Antakya Jewish Synagogue, and low-rise masonry structures (Figure 29). Nowadays, ongoing renovation and reconstruction activities are concentrated on revitalizing the symbol of the social life of Hatay.

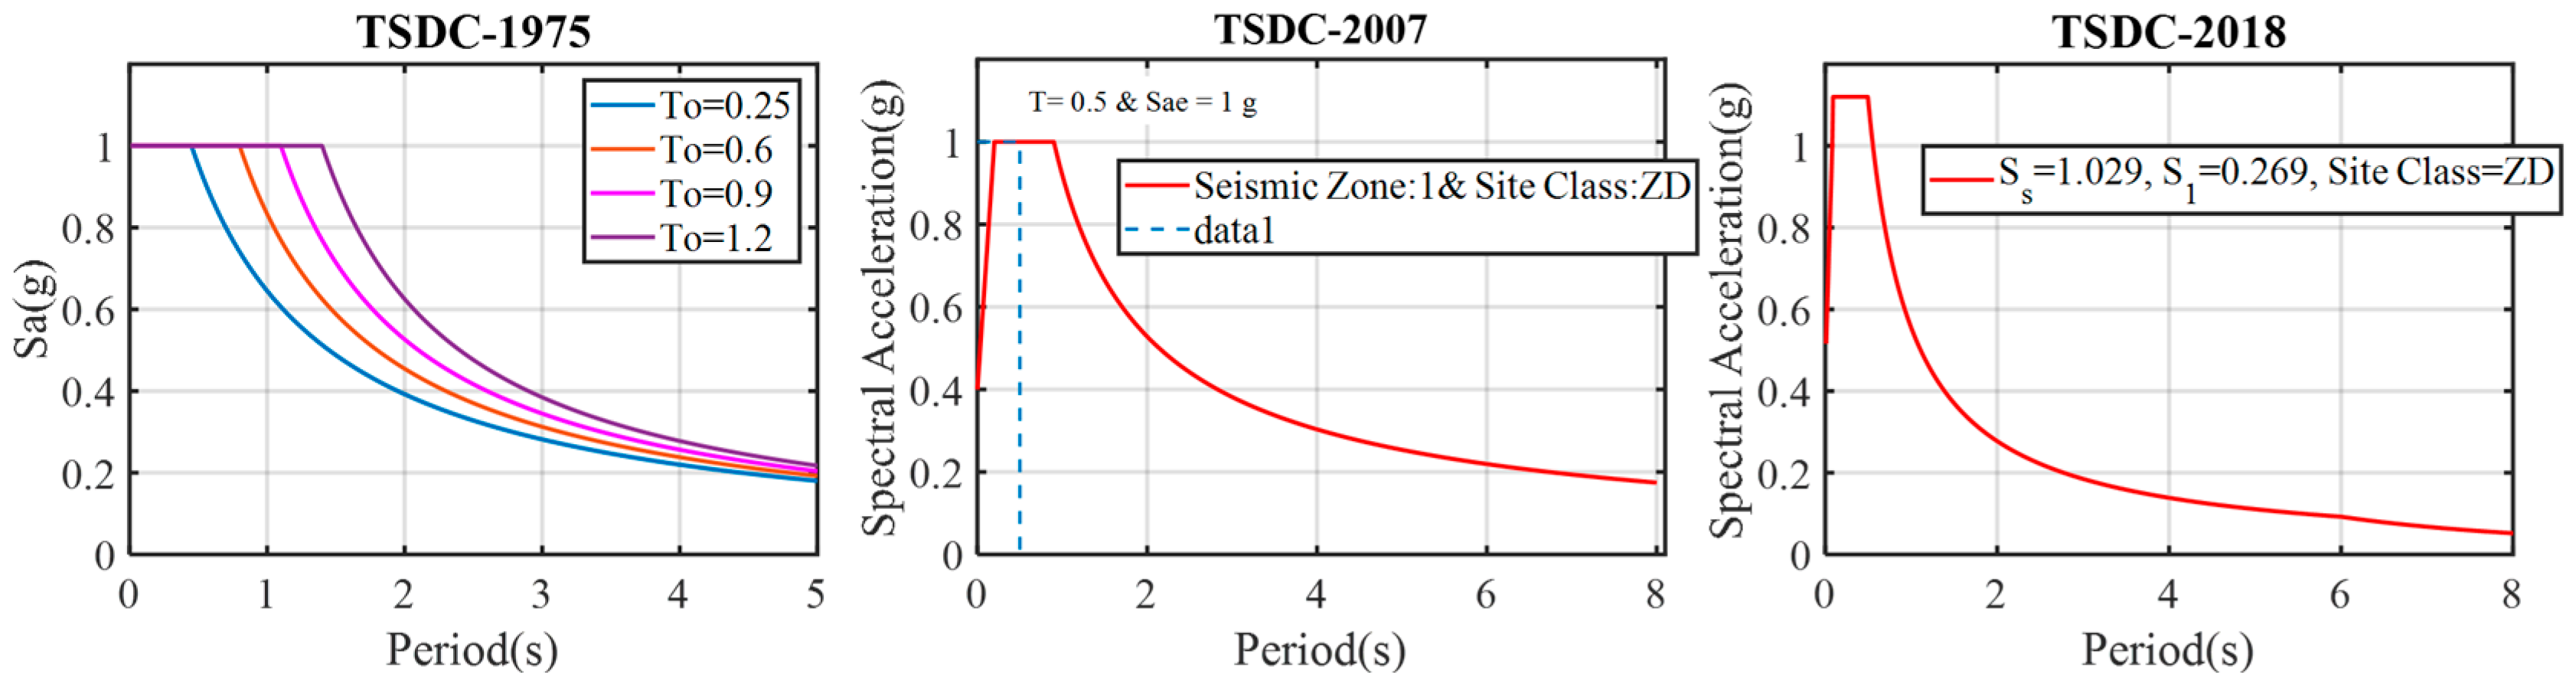
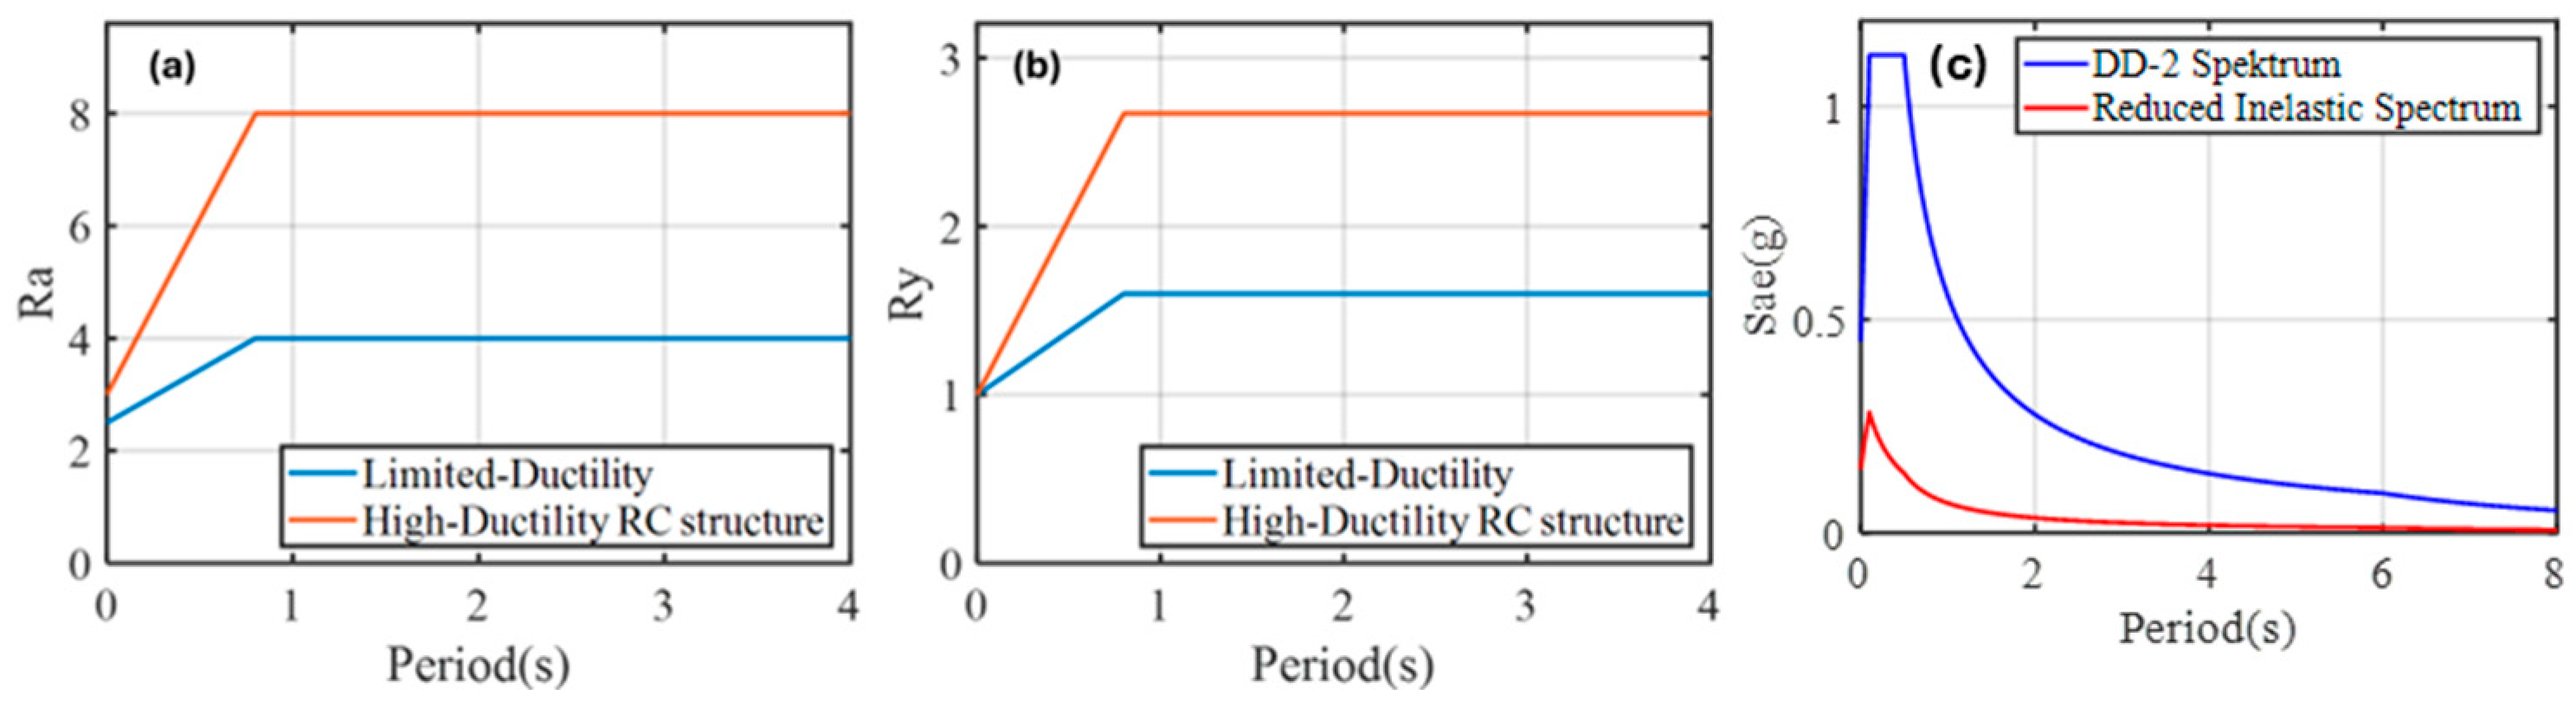
5. Overview of Seismic Design Provisions in Türkiye

Significant efforts were set forth towards establishing seismic design provisions to protect the assets and lives of the occupants in Türkiye since the catastrophic 1939 Erzincan earthquake. The name of the seismic design code varies in Türkiye, and for brevity and ease of understanding, they will be generally named the Turkish Seismic Design Code with their publication years. Three seismic design codes, Turkish Seismic Design Code (TSDC)-2018 [21], TSDC-1998/2007 [42], and TSDC-1975, predominantly played a critical role in designing RC residential buildings in the building inventory in Hatay province (Figure 9). Moreover, it is possible to find constructed fixed-base RC and masonry structures before 1975 designed following either 1965 or 1968 seismic design codes. The design spectrum and ductility-based design principles were first introduced in TSDC-1975 without having concerns about capacity-protected design principles. Then, the design spectrum in TSDC-1998/2007 was modified based on four seismic zones, with their effective PGA values considering the influence of the site classes. For the latest version, seismic hazard maps were updated. Input parameters to construct the design spectrum are provided through web-based applications. Moreover, the constant displacement period range is considered in the TSDC-2018 design spectra unlike in TSDC-1975 and TSDC-1998/2007. A comparison of the design spectra is given in Figure 27.
Reinforced concrete (RC) Moment-Resisting Frame (MRF) structures will be referred to as MRFs in this study. The R factor represents the structural system behavior factor. D and I account for the overstrength factor and the building importance factor; T B is the corner period of the TSDC-2018 [21] horizontal elastic design spectrum (Figure 30 right). R and D values of the high-ductility RC-MRF structures are prescribed as 8 and 3, respectively, whereas for the limited-ductility structure, those parameters are reduced to 4 and 2.5, respectively. Moreover, the minimum ductility required per TSDC-2018 [21] is explicitly given for the first time in a design code. Equation (2) calculates the minimum ductility demand using R, I, and D parameters. Similarly, the Ry factor can be calculated using Equation (3).
R a T = R I               f o r   T > T B
R a T = D + R I D T T B               f o r   T   T B
μ d = R I D
R y T = μ d                                 f o r   T > T B
R y T = 1 + μ d 1 T T B               f o r   T   T B
The inelastic design spectrum can be calculated from the TSDC-2018 elastic spectrum by incorporating Equation (4). Variations of the R a , R y , and the comparison of the elastic and inelastic design spectrum ( S a R T ) are shown in Figure 31.
S a R T = S a e ( T ) R a ( T )
Furthermore, the ADRS spectrum combines the spectral acceleration and displacement response of the SDOF system in a single graph, where the slope represents the square of the structural system’s circular frequency (w2). The seismic response of an inelastic single-degree-of-freedom system with a natural fundamental vibration period of Tn to that of an equivalent linear elastic system can be compared through the Acceleration Displacement Response Spectrum (ADRS), considering the main principles of the strength-based design concept. The Turkish Seismic Design Code introduces the strength-based design (SBD) and deformation-based design (DBD) procedures. Minimum required ductility and design strength are calculated with the help of Ry, Ra, and D factors. Experiencing the collapse of code-compliant multi-story structures designed with the most recent seismic design code (TSDC-2018) [21] brought some questions about the effectiveness of the code procedures, primarily relying only on the structural perspective and disregarding extreme earthquake characteristics. In Hatay, there were buildings designed following TSDC-1975 with different material safety factors. Before TSDC-1998, the R factor concept is not used in Türkiye. Such an essential concept should not be skipped for a comprehensive evaluation of building stock in Hatay. An example of the aforementioned condition is explicitly shown and summarized in Figure 32 for the TK-3124 record. The capacity curve of the buildings designed with TSDC-1975 is adjusted considering the DD-2 spectrum of TSDC-2018. The representative system behavior factor is assumed to be equal to four buildings constructed per TSDC-1975 in Hatay [41].

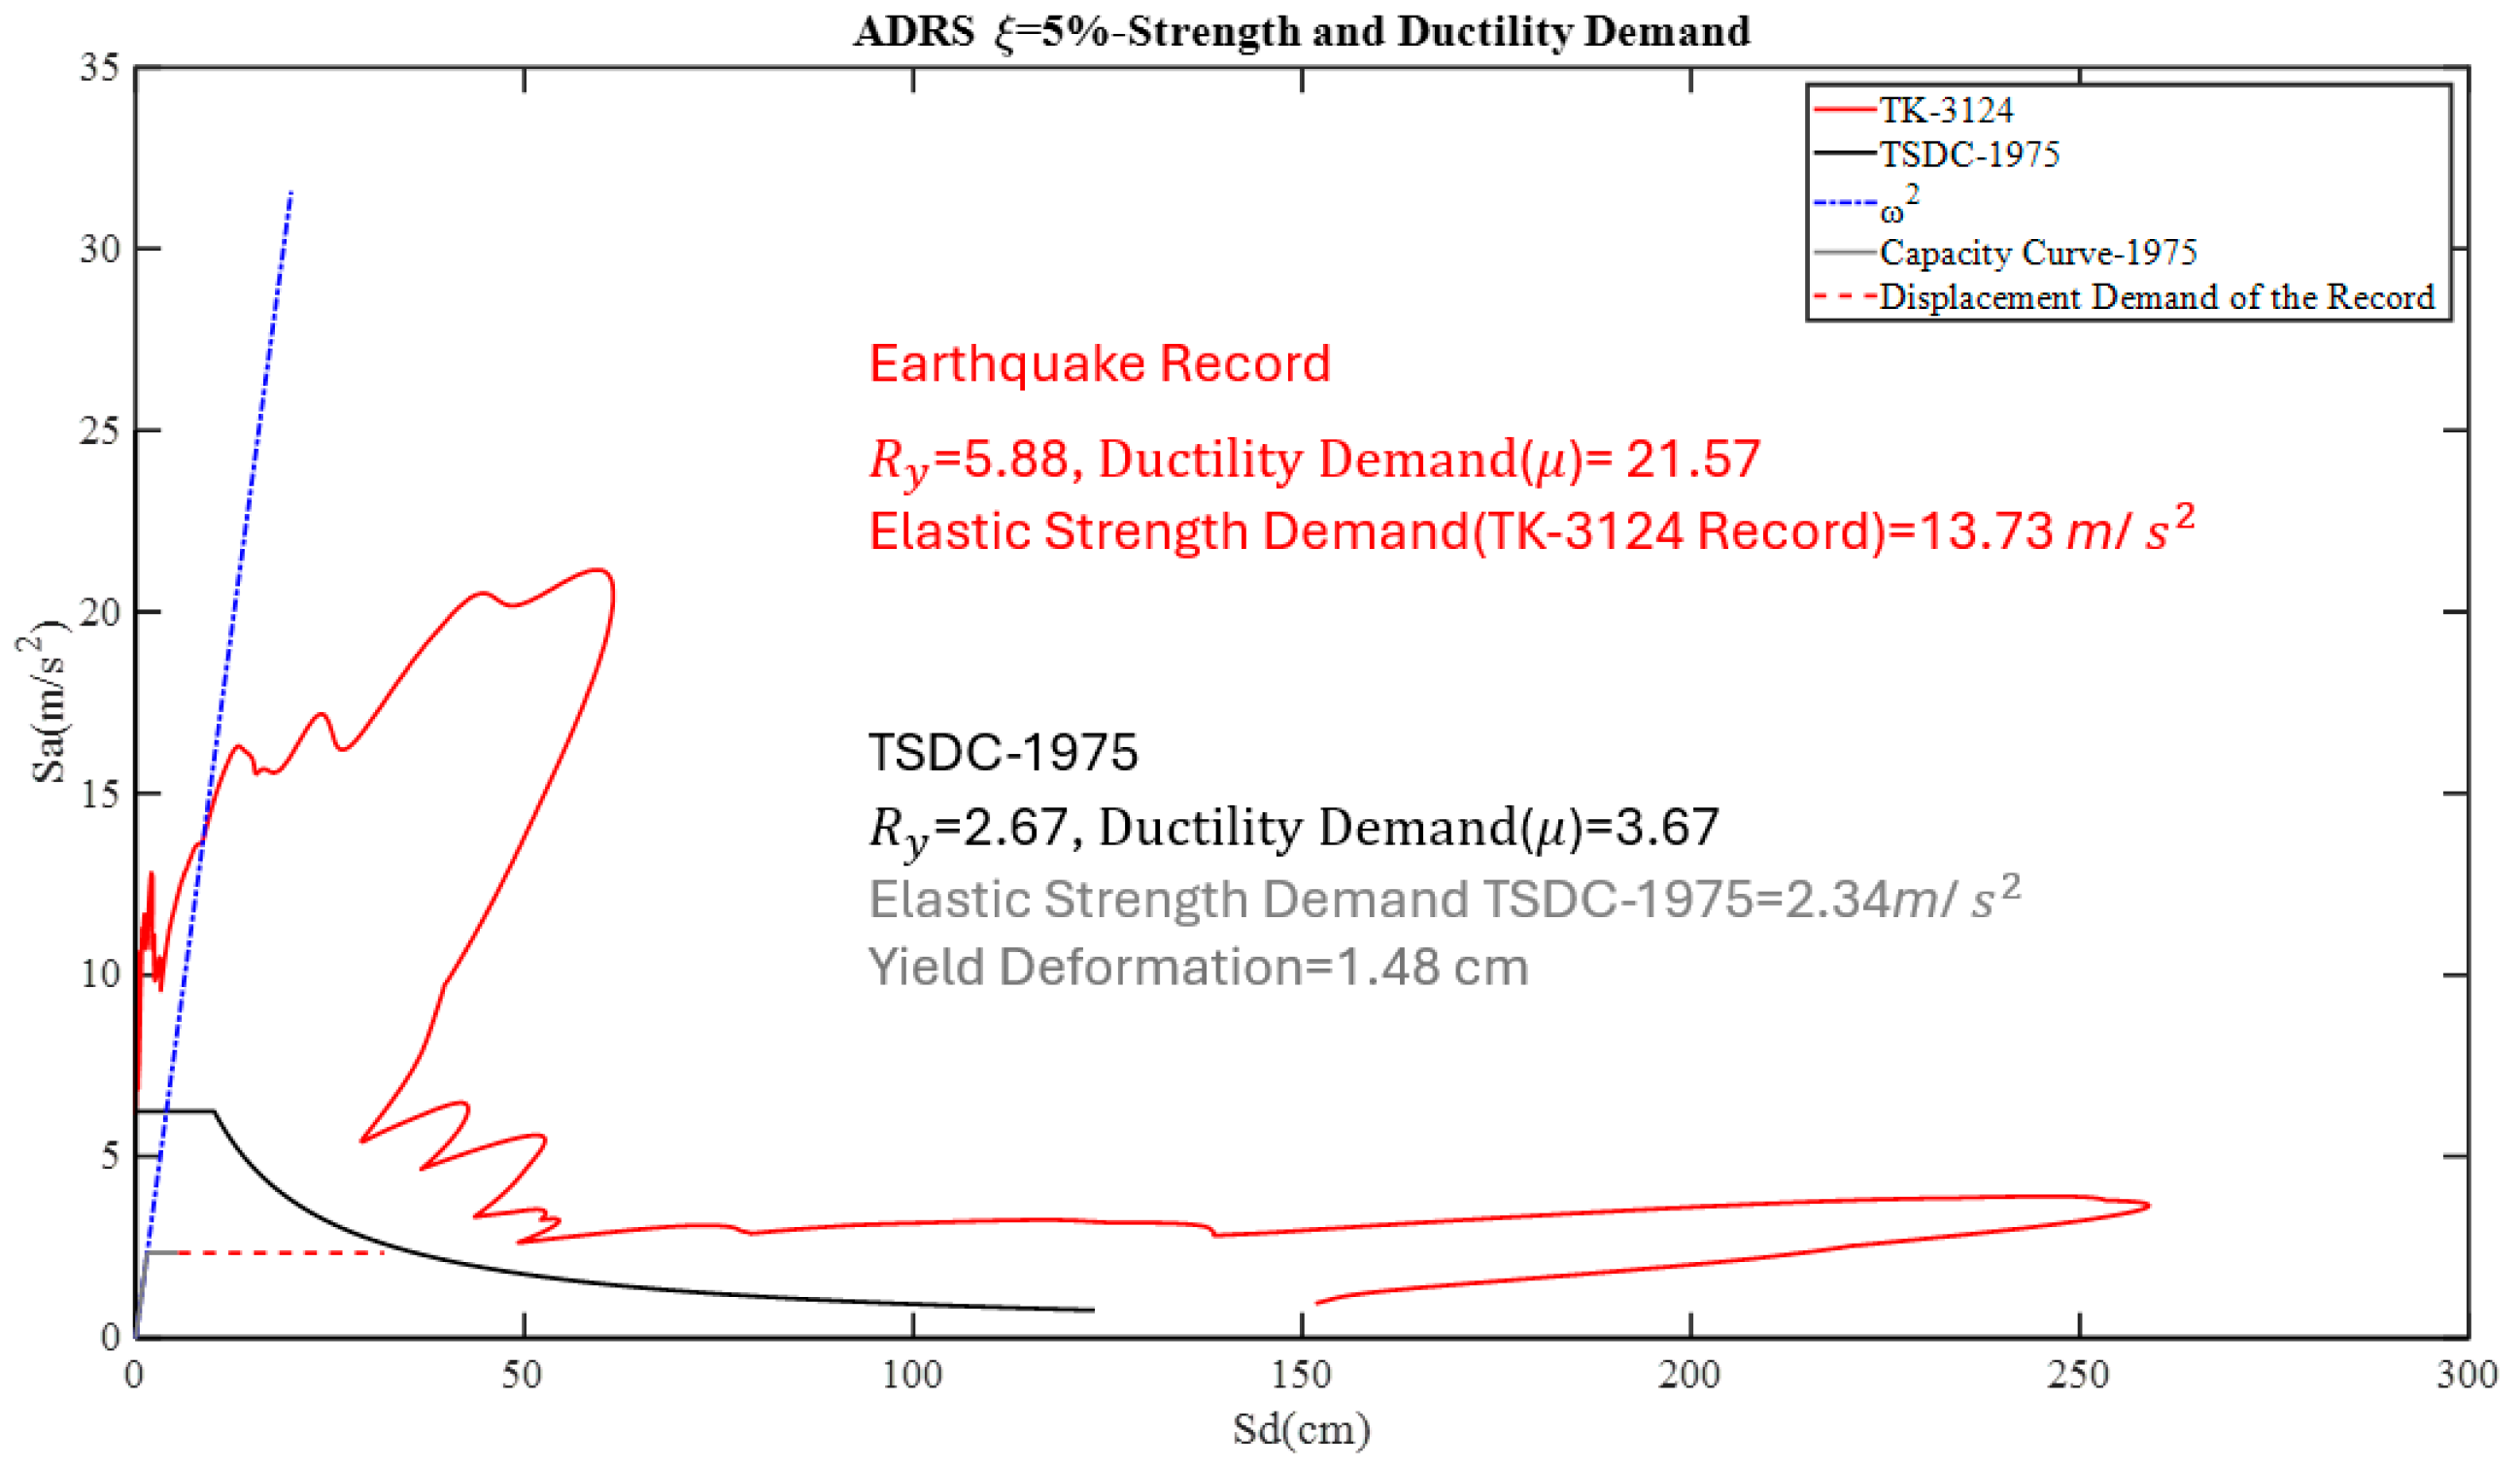
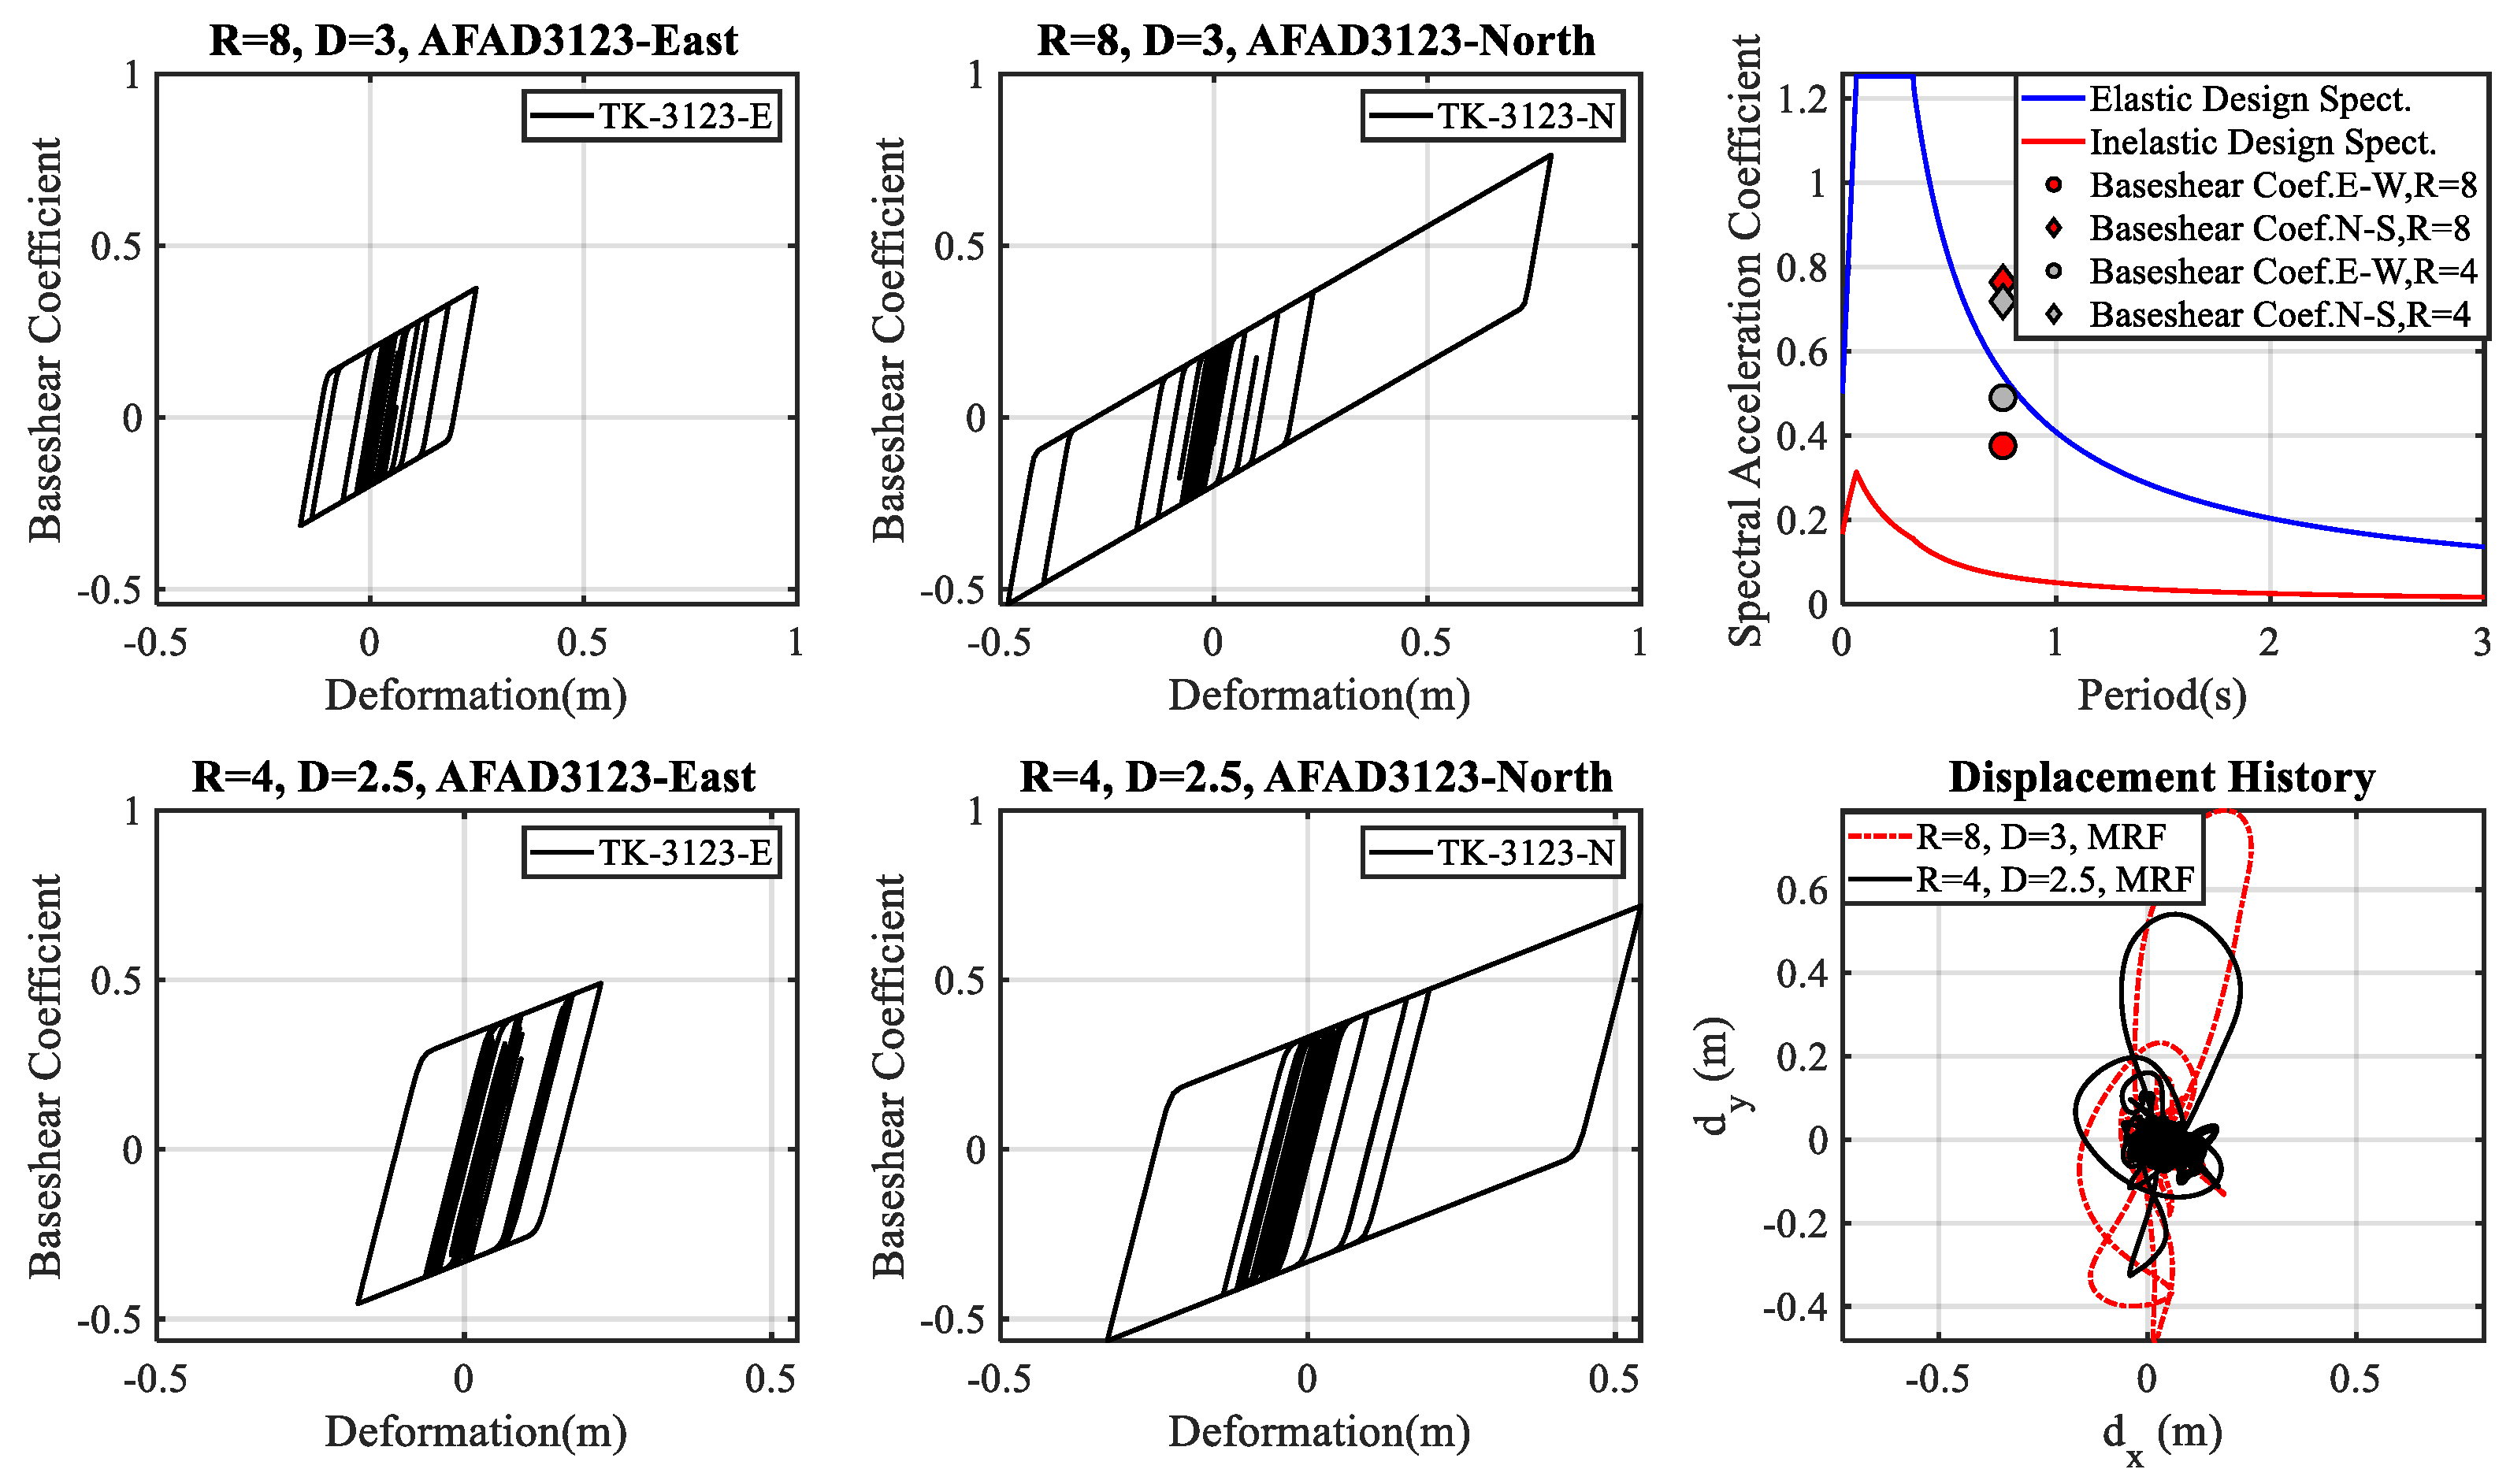
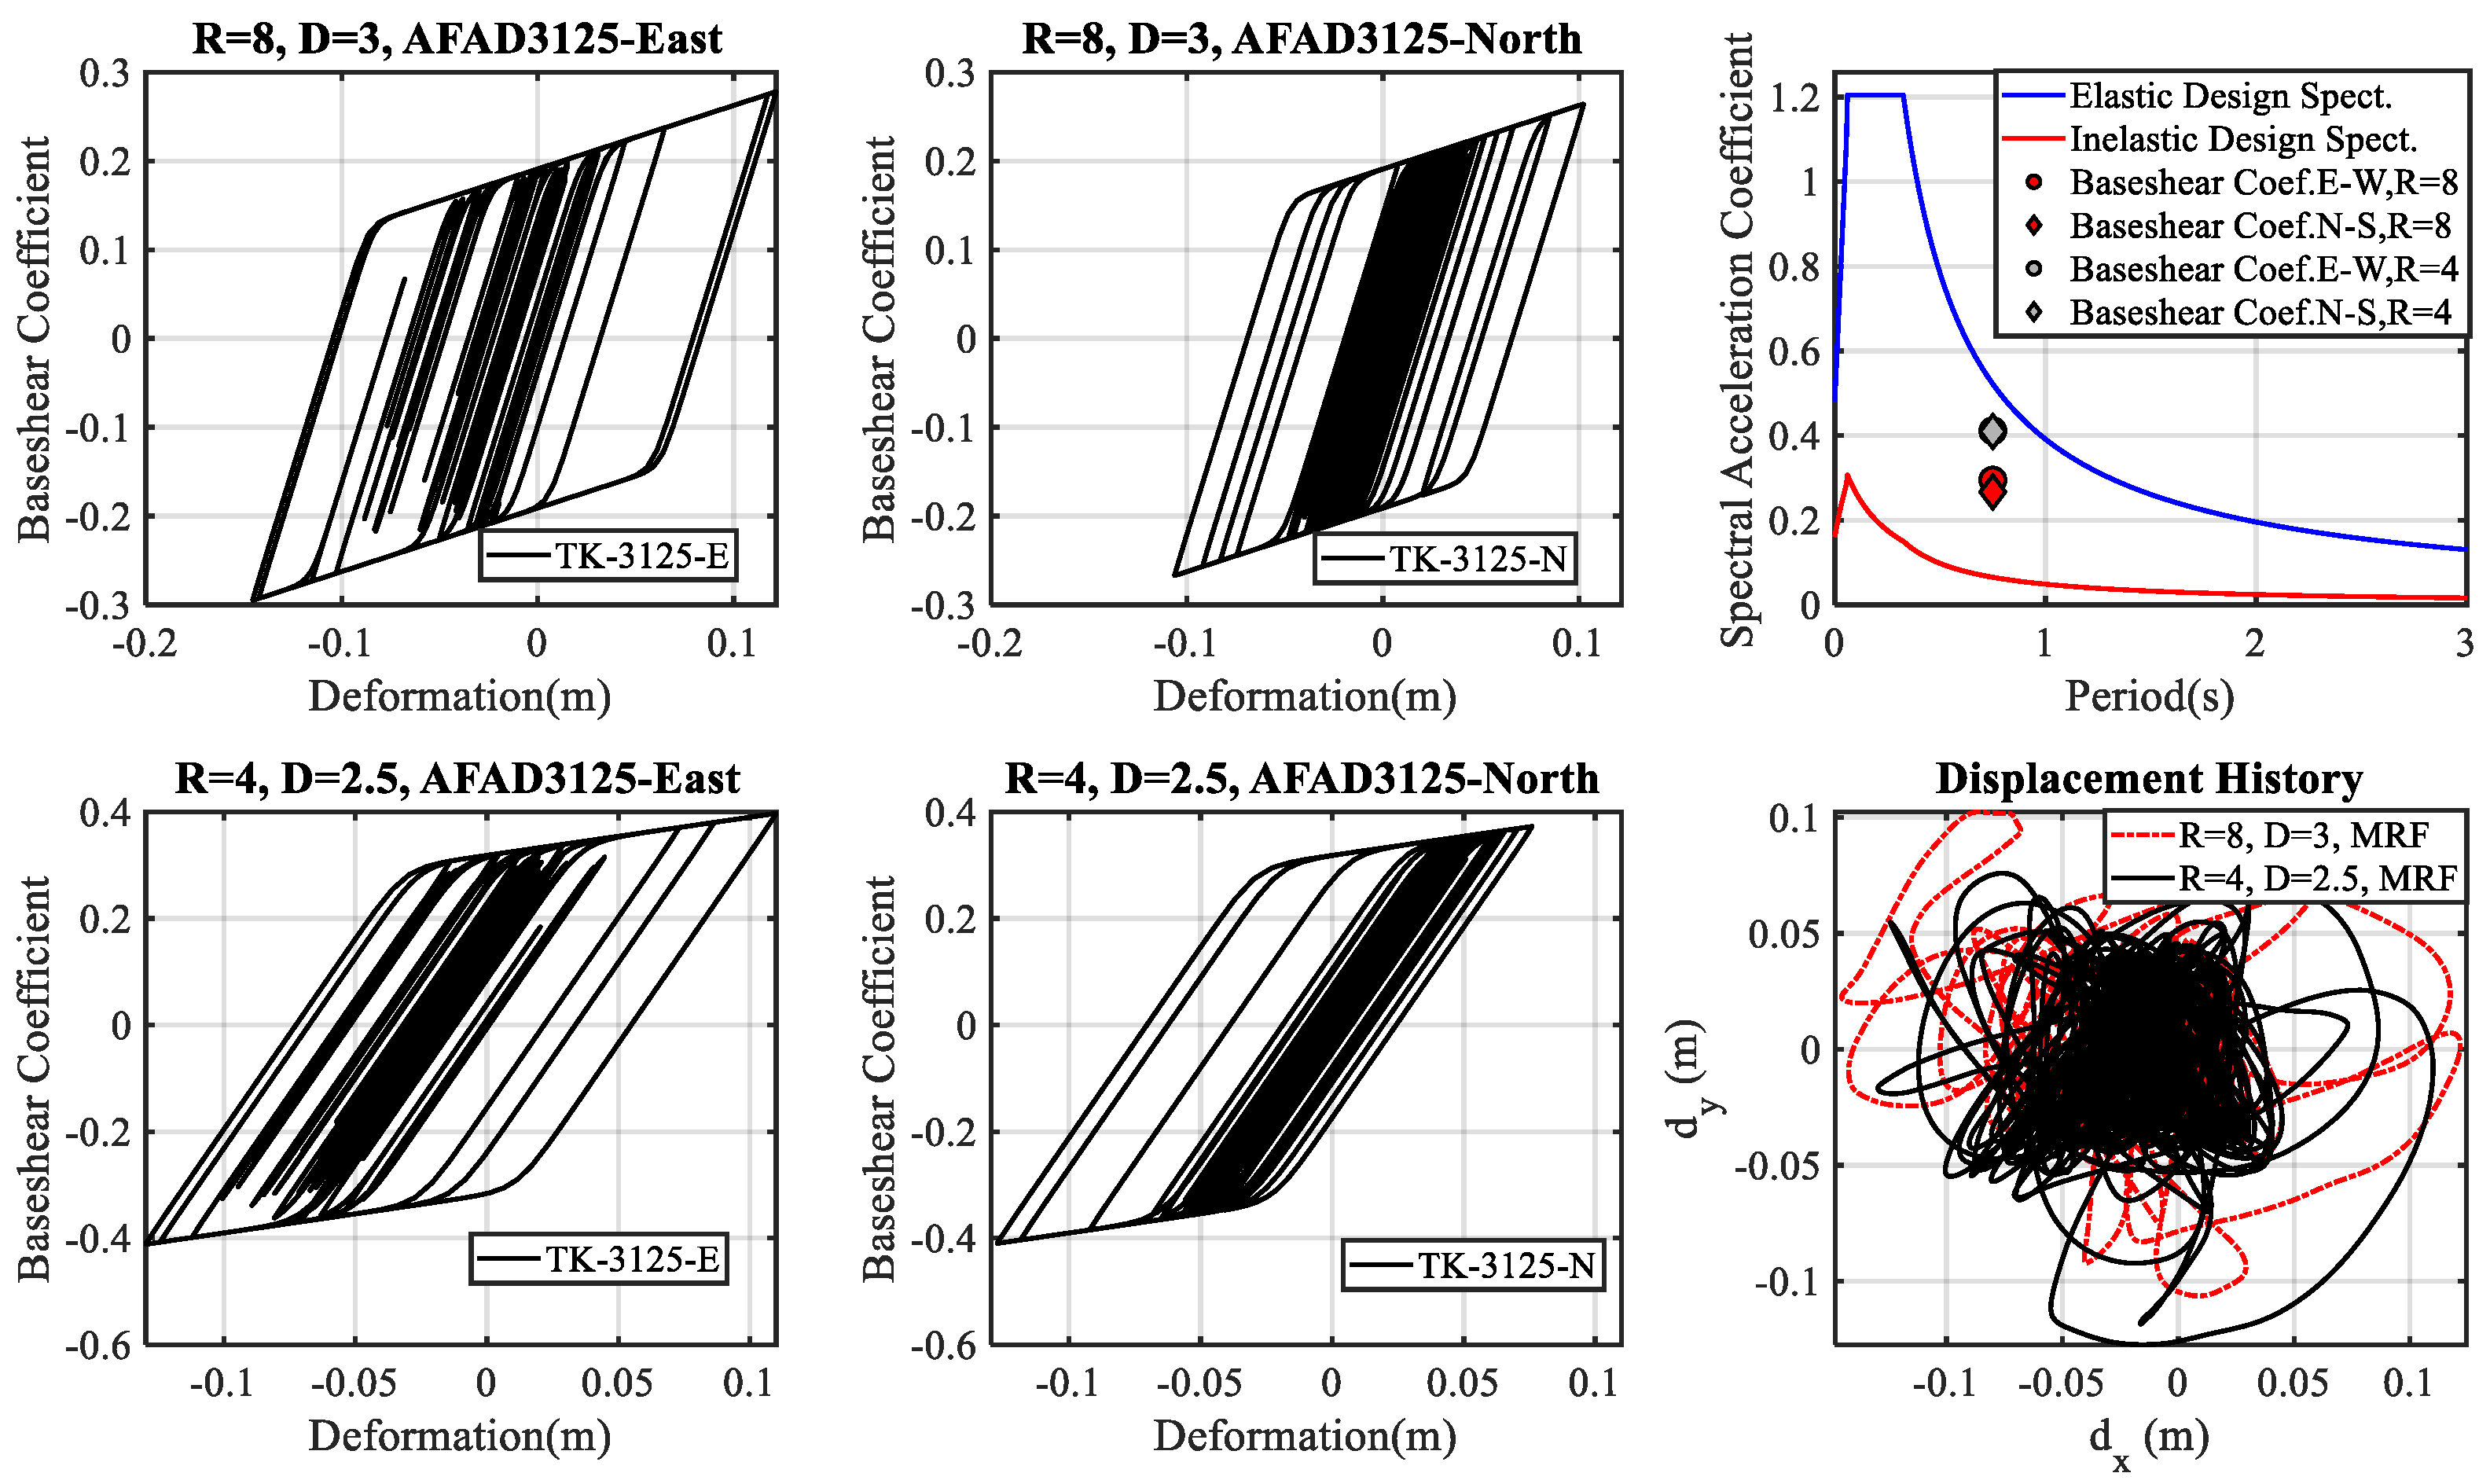
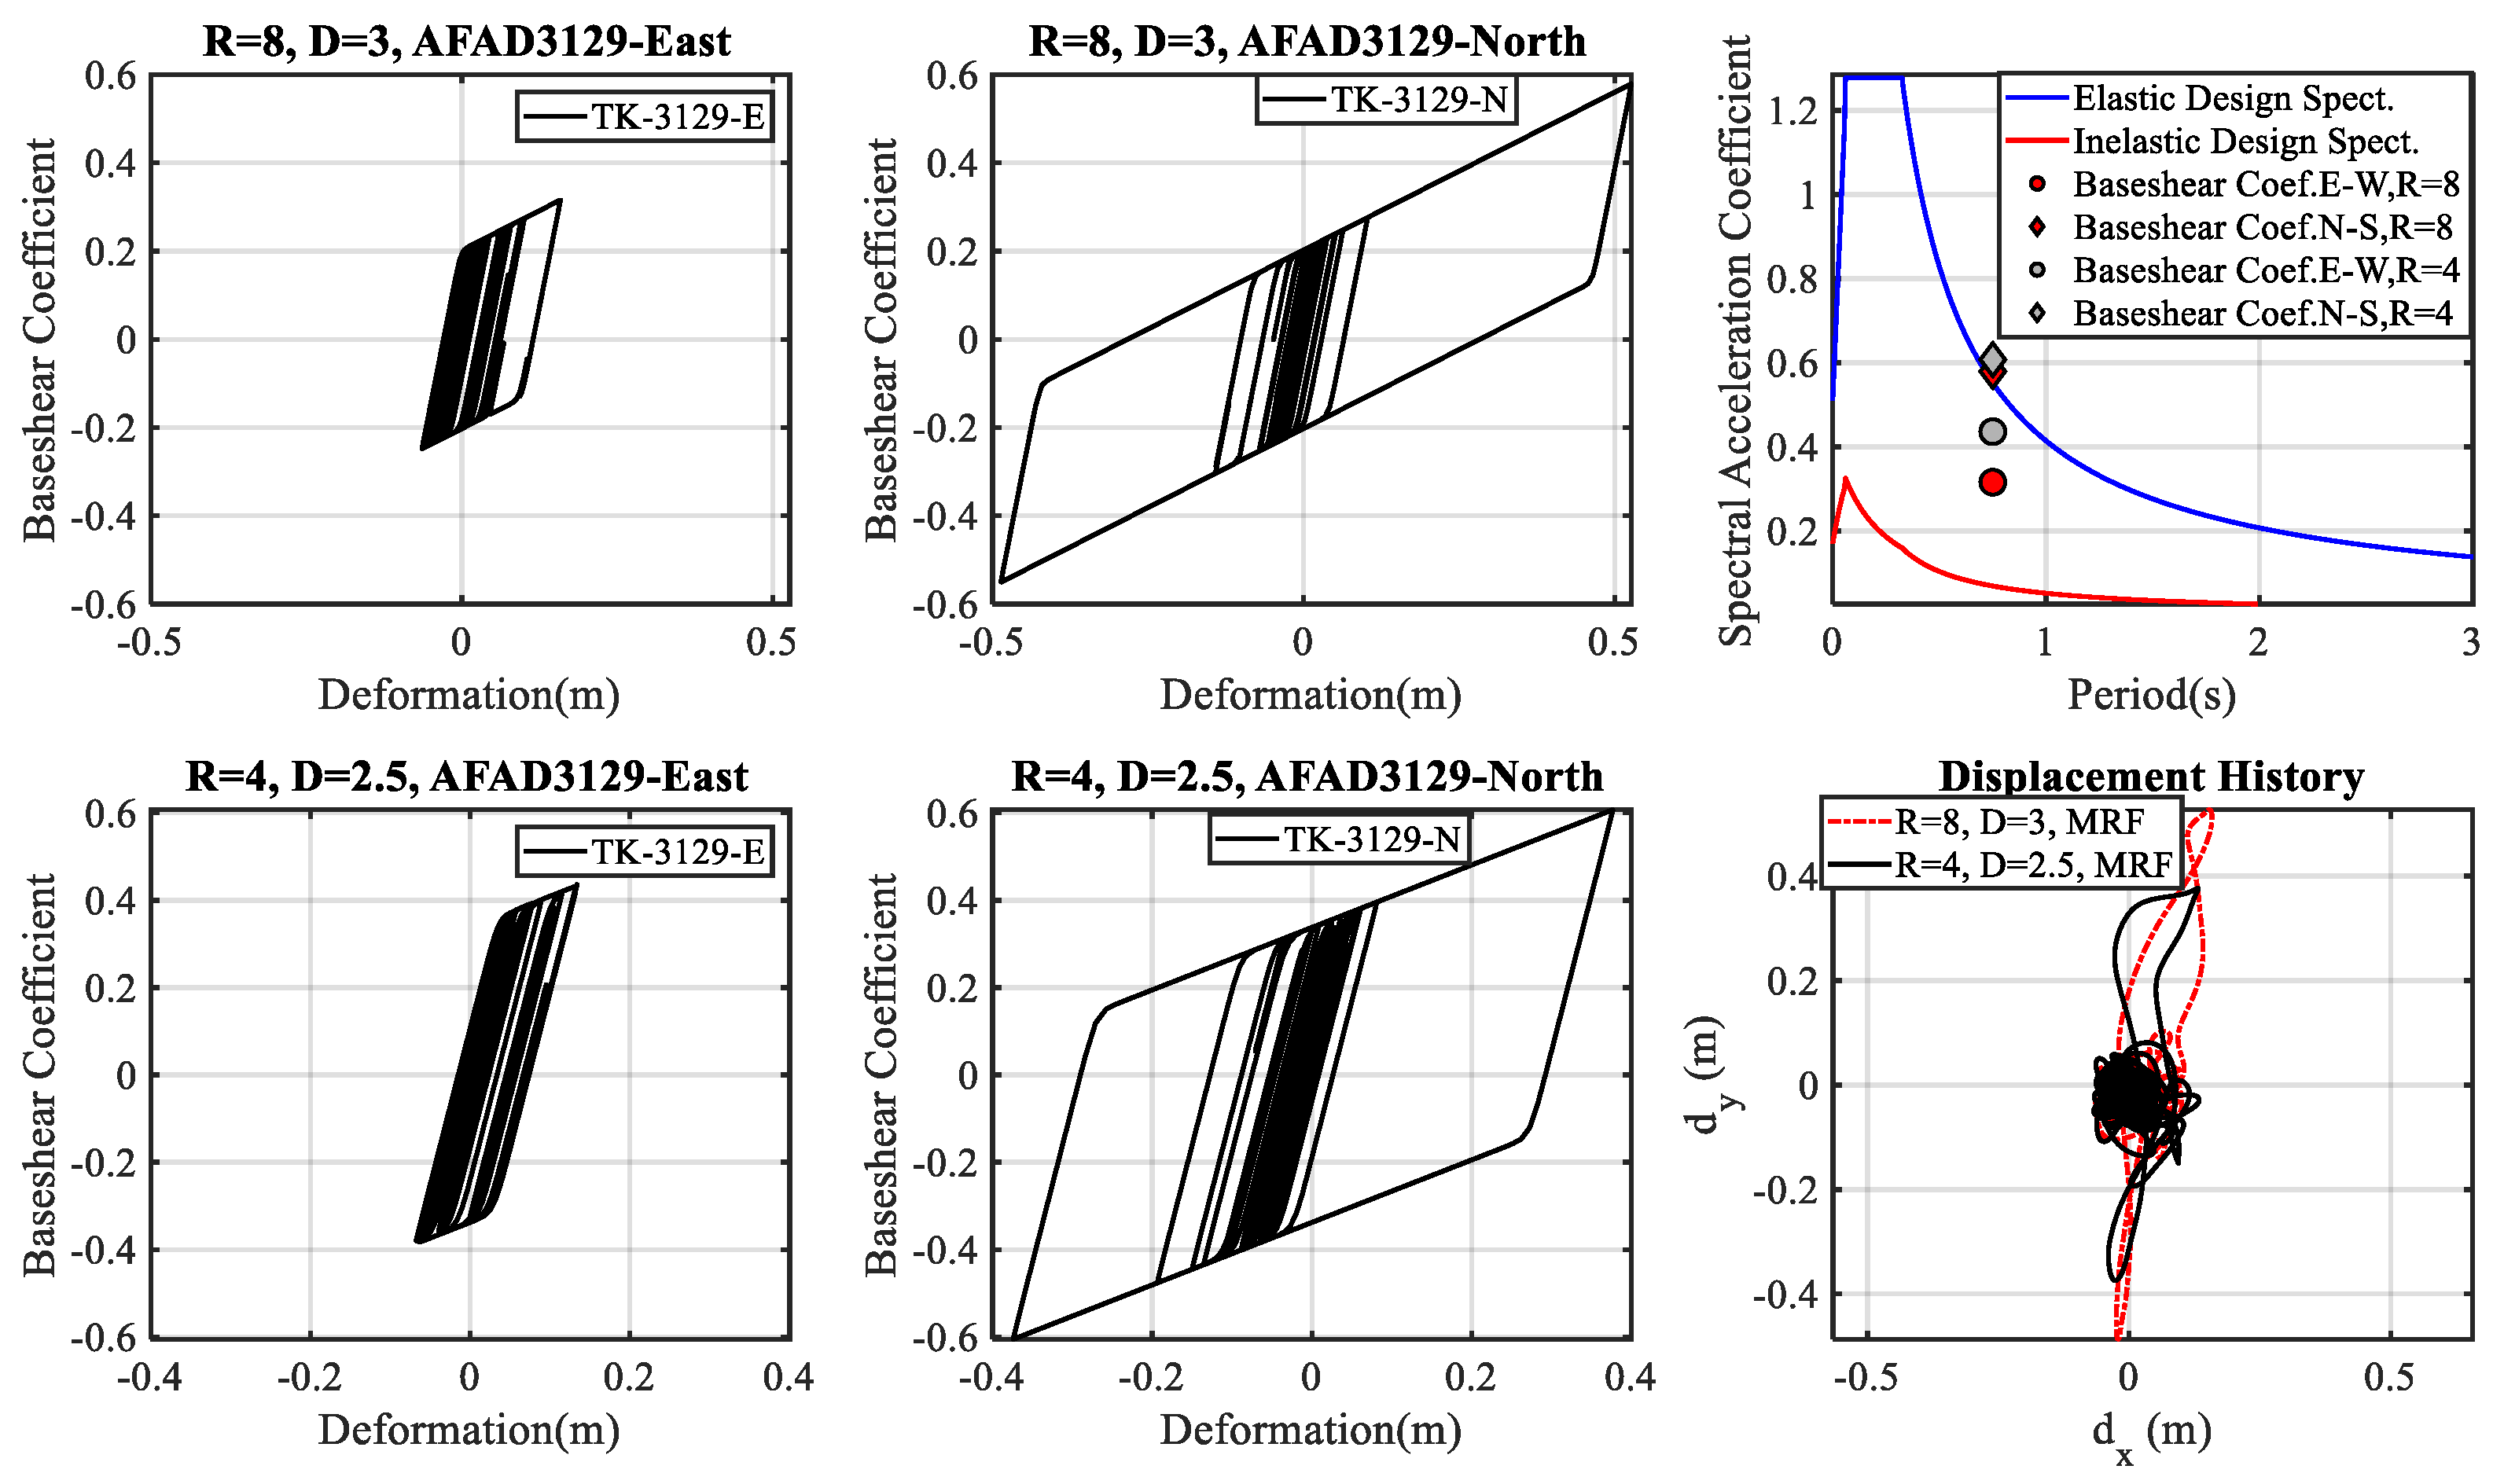
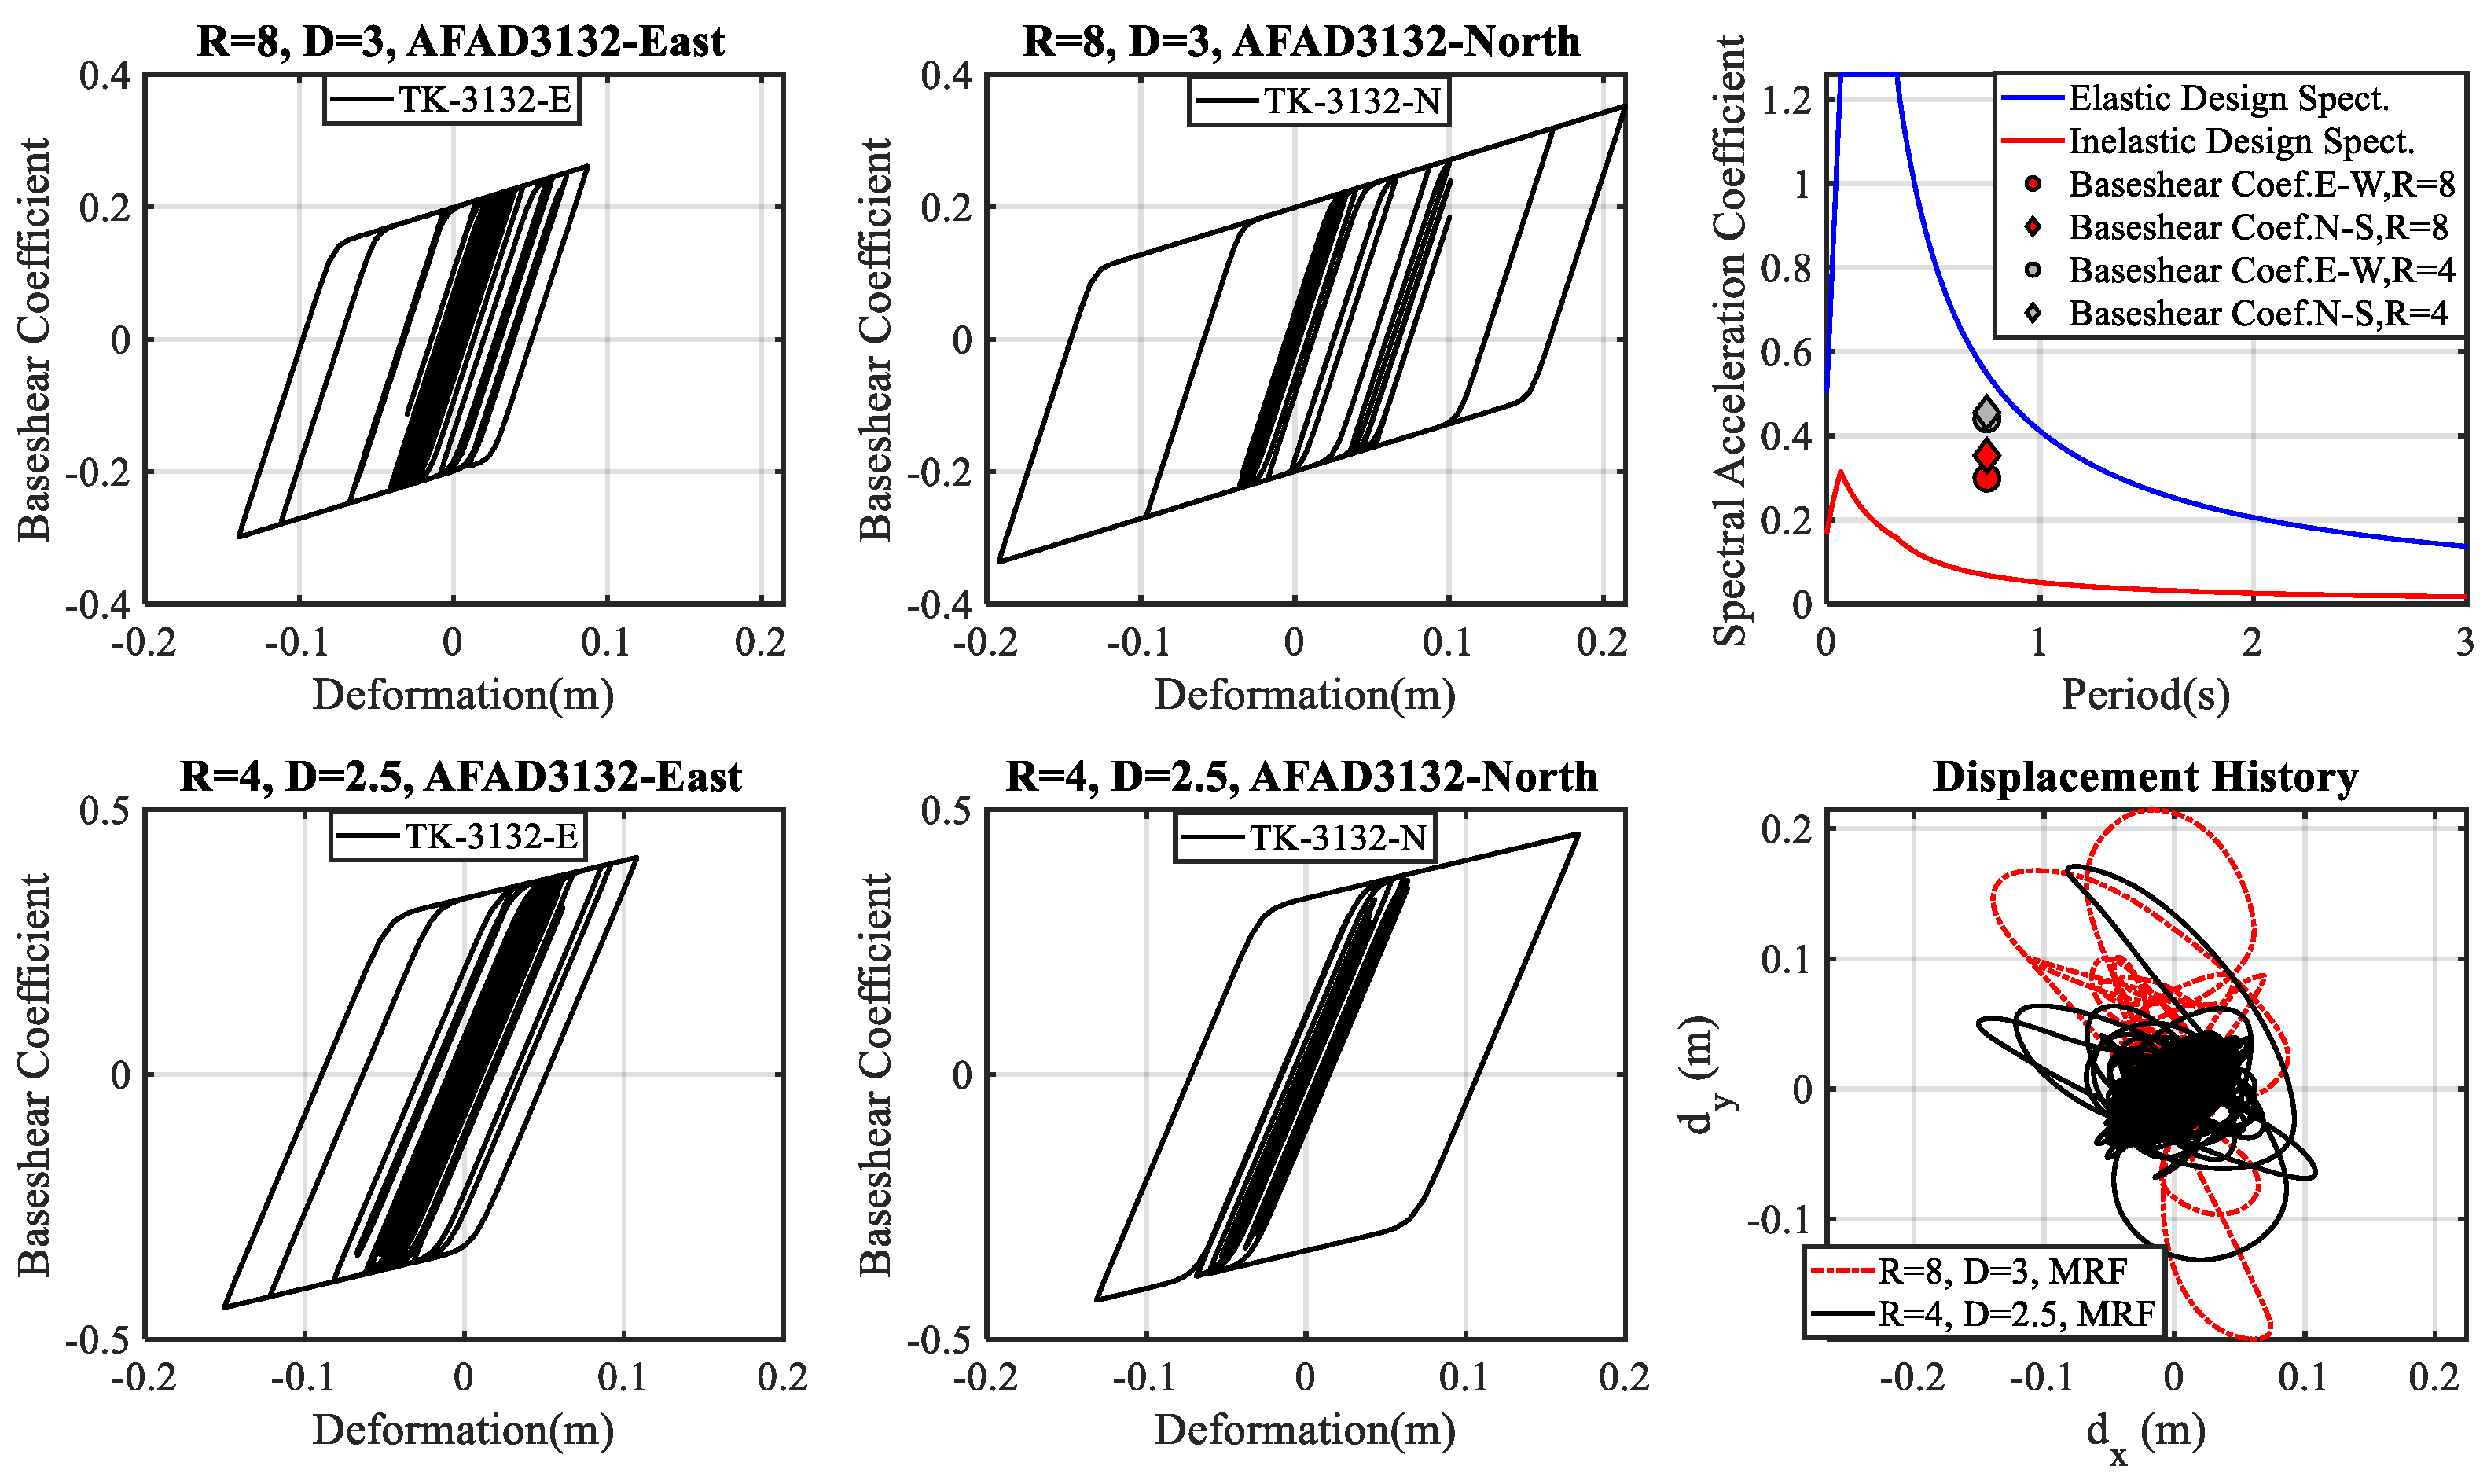
6. Response History Analysis of RC-MRF and SI Buildings

The Performance-Based Earthquake Engineering (PBEE) framework aims to achieve a reliable and quantifiable structure evaluation for a given seismic hazard. There are several concerns in PBEE. The most critical objective is improving the accuracy of nonlinear analysis associated with uncertainties to reduce the collapse risk feasibly. The Bouc–Wen model is capable of modeling various hysteretic responses, and it has been used in many commercial and object-oriented structural analysis programs due to its versatility and conciseness. The level of conservatism of TSDC-2018 is assessed through the critical minimum requirements in TSDC-2018, explained in Section 5. Inelastic response features of the RC-MRF and the benefit of SI technology were controlled considering the ultimate strength and ductility demand by incorporating the suite of ground motions recorded in the Hatay region.
The peak deformations of the elastic and the inelastic structural systems are expressed by d e l and d m a x , respectively. The yield displacement of the inelastic system is denoted by d y . The maximum elastic force and the yield strength of the inelastic SDOF system are represented by F e l and F y . In the strength-based design framework, the ductility capacity ( μ k ) versus strength demand is estimated explicitly through the base shear coefficient for an inelastic single-degree-of-freedom system. Based on this approach, the structural system should meet the minimum yield strength requirement and the ductility capacity calculated by the given equations in Section 5. Details of the Bouc–Wen model [43,44,45] analysis for the fixed-base MRF and SI structure are described in Section 6.2.

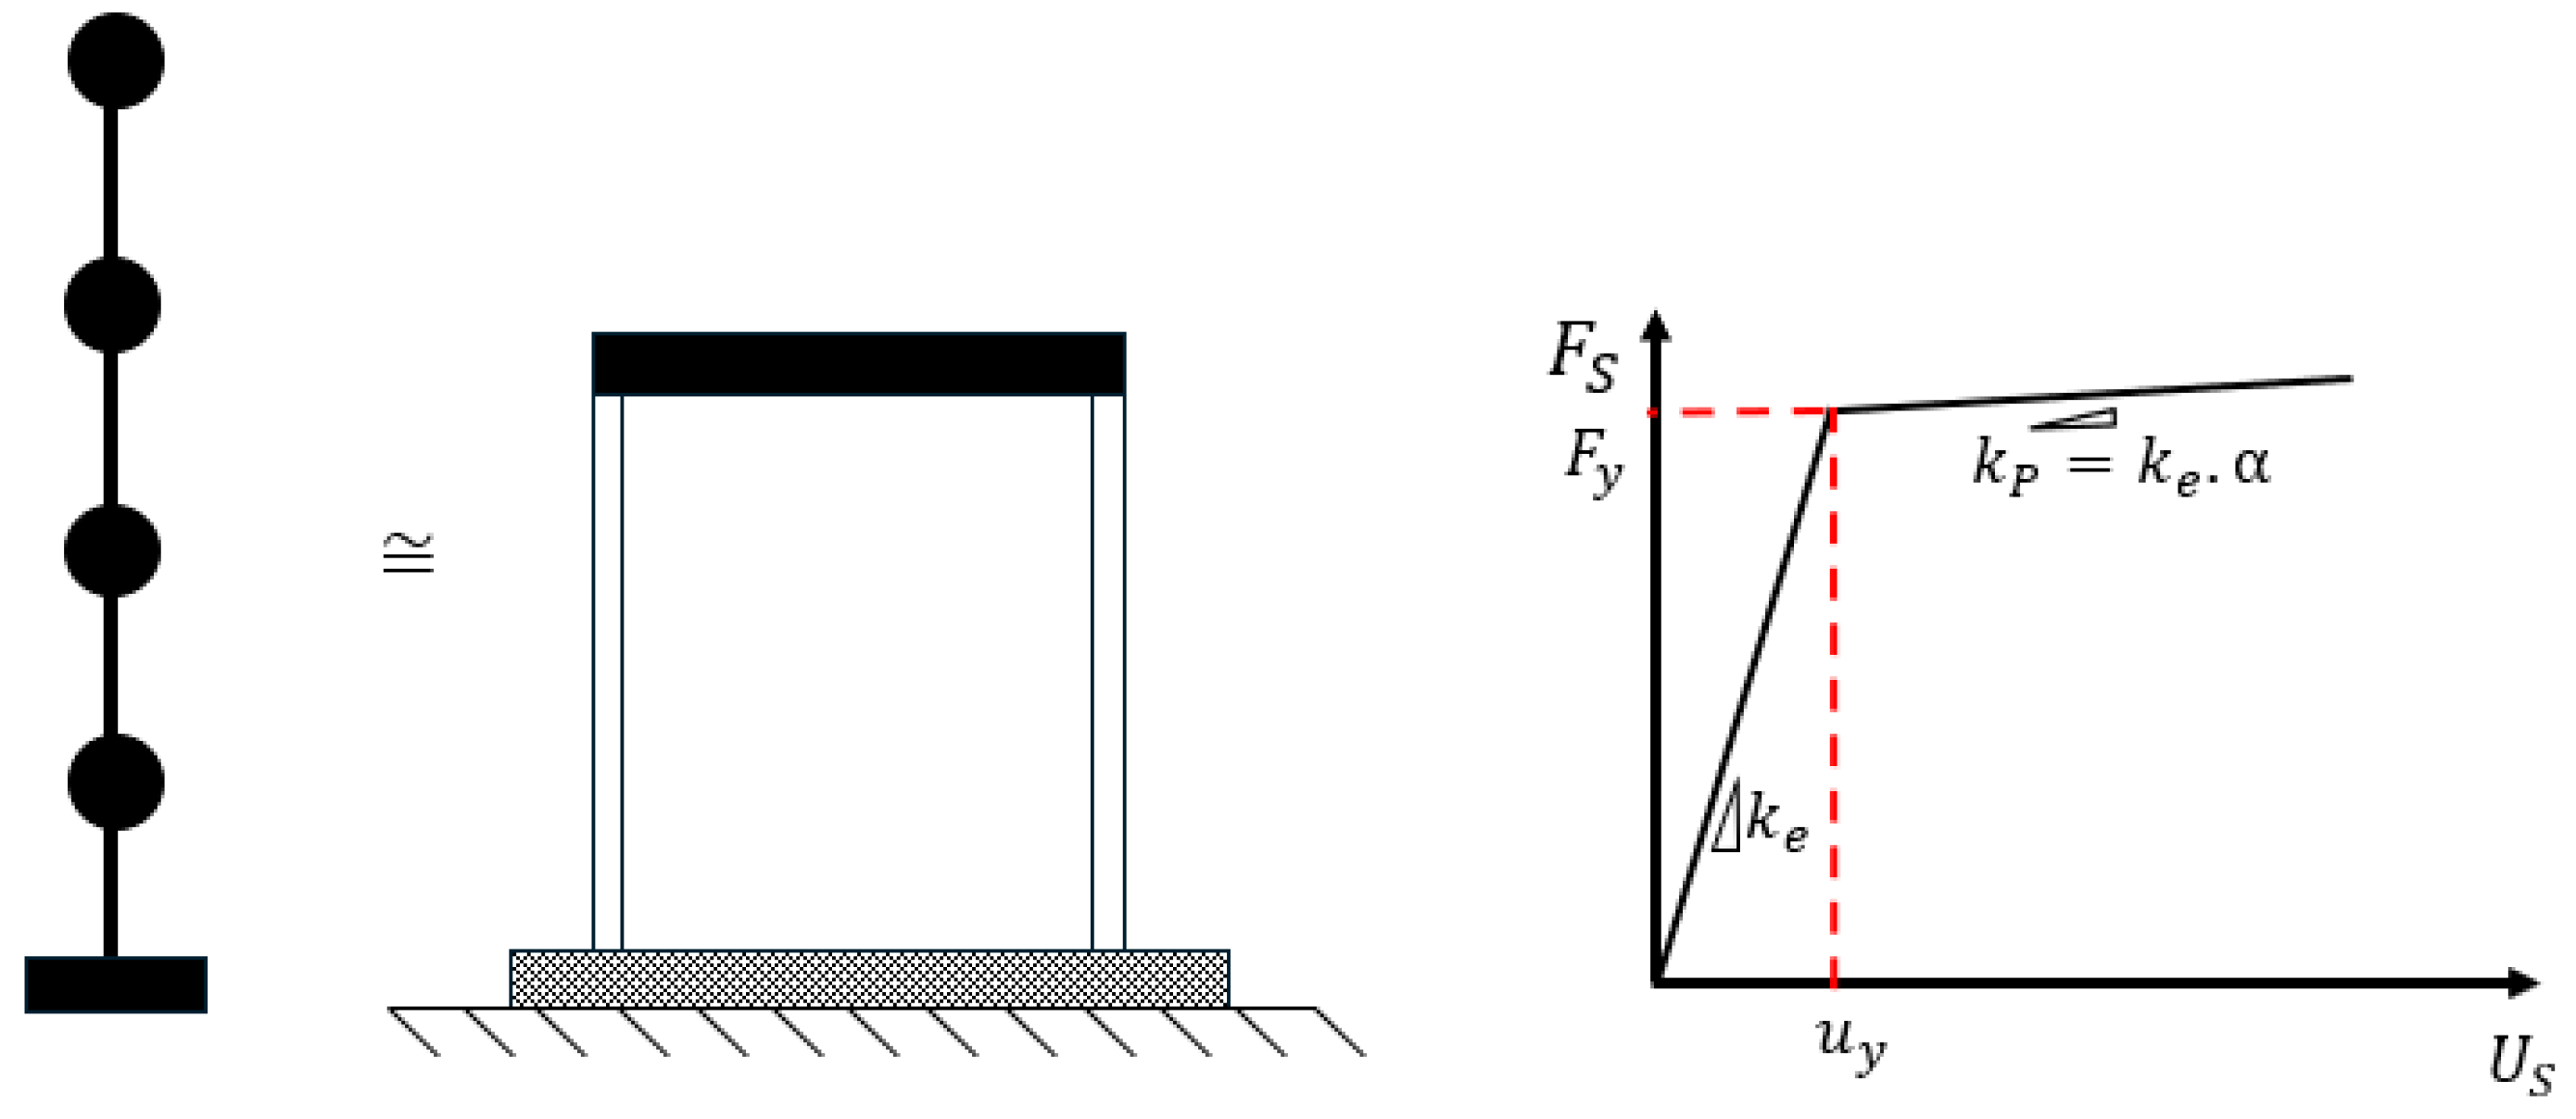
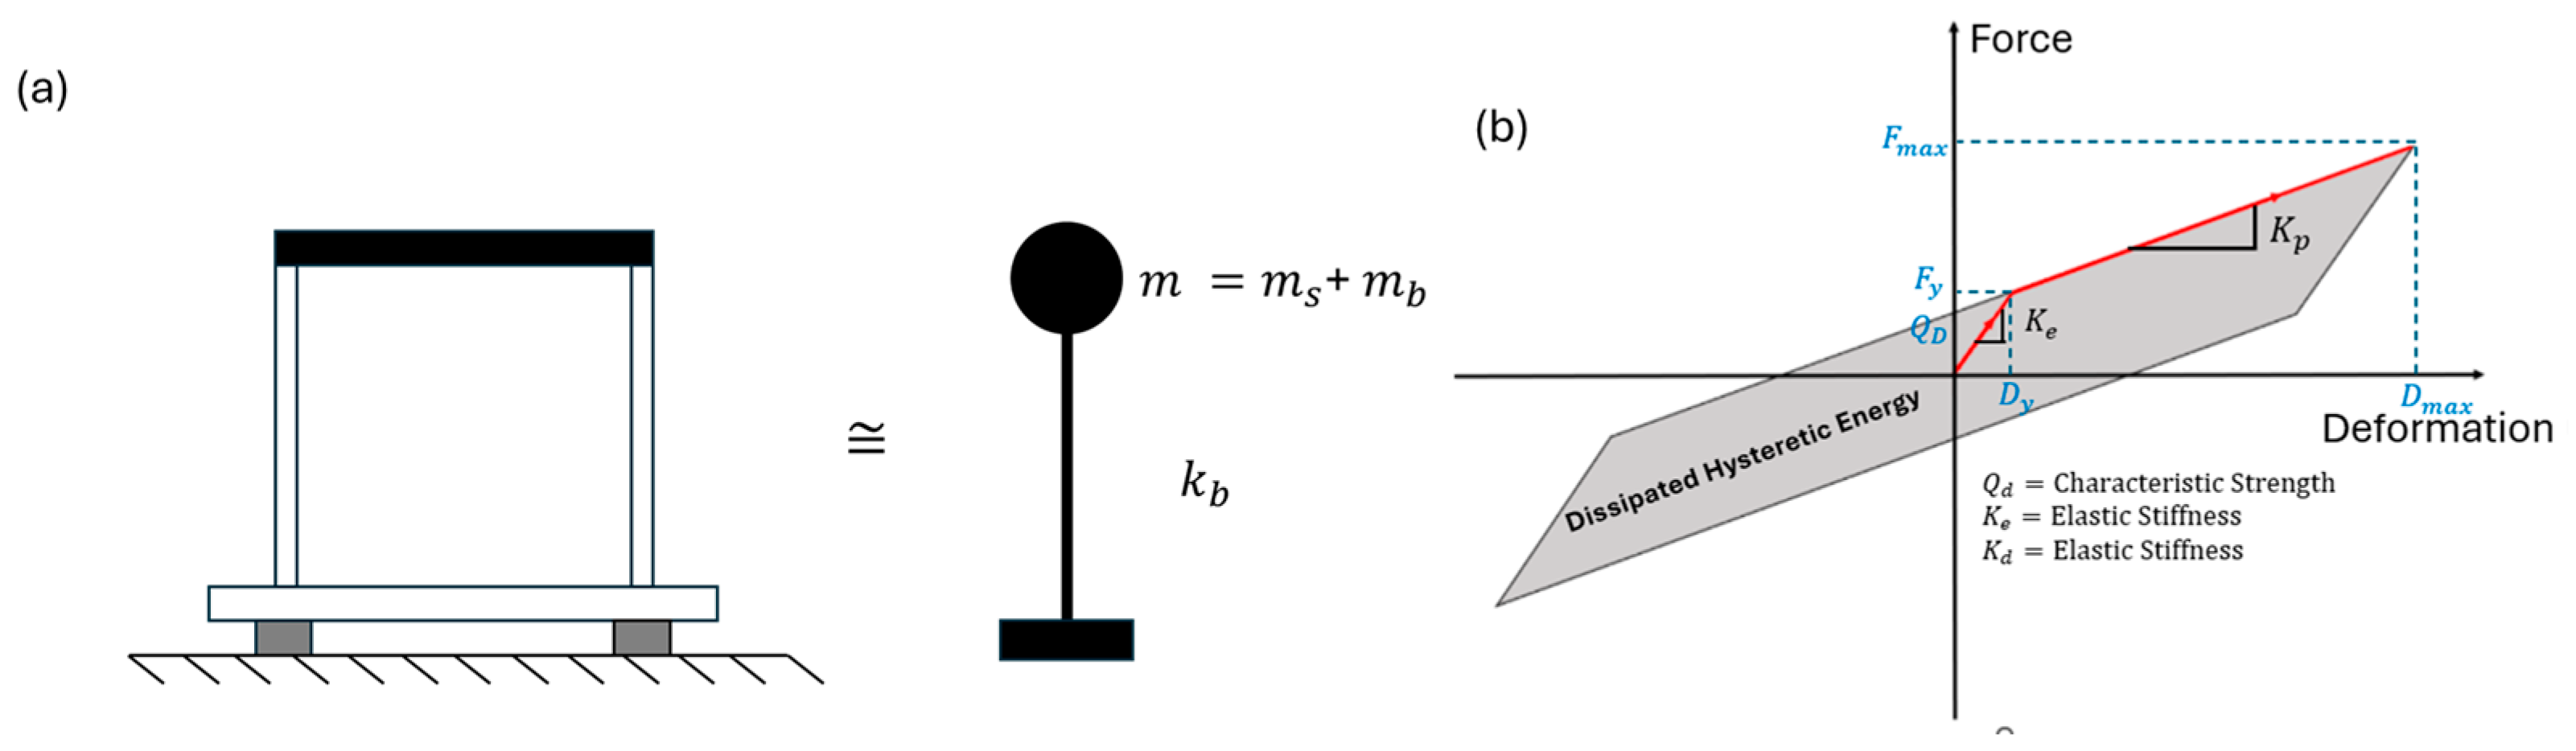
6.1. Bouc–Wen Hysteretic Model for Fixed-Base RC-MRF Structure

The overall response of an inelastic fixed-base SDOF RC-MRF structure can be determined with the proper arrangement of design parameters governed by differential equations. To model the bilinear hysteretic model, key design parameters considered for nonlinear response history analysis are yield Strength (Fy), yield displacement, d y , elastic stiffness, k e , and post-elastic stiffness, k p (Figure 33). An inelastic SDOF RC-MRF system is assumed to fulfill the capacity design principles in TSDC-2018. In Equation (5), m is the structural mass, c represents the viscous damping constant, and F R denotes the restoring force as one of the components of the equation of motion. The α coefficient is the ratio of k p to k e , and it is assumed to be equal to 0.1 for the fixed-base building in this study. These three parameters are computed for the limited-ductility and high-ductility RC-MRF buildings at each location. Two forms of equations of motion (EOMs) are given in Equations (5) and (6). EOM in Equation (6) represents the massless form of Equation (5) that depends on the system parameters (e.g., equivalent damping ratio, ξ , and circular frequency ( ω )). The u ¨ t , u ¨ g t , u ˙ t , and u represent the variation of relative acceleration, ground acceleration, relative velocity, and displacement with respect to time in Equation (6). The ordinary differential equations (ODE) are solved by MATLAB (R2023a version) routines using a bilinear Bouc–Wen hysteretic model and ODE solvers. The dimensionless parameters β, γ, and n are used in the Bouc–Wen model to control the shape of the hysteretic loops [43,44,45]. The Z parameter is the hysteretic parameter and satisfies Equation (7) given below.
m u ¨ t + c u ˙ t + F R t = m u ¨ g t
u ¨ t + 2 ξ ω u ˙ t + α ω 2 u t + ( 1 α ) ω 2 d y Z ( t ) = u ¨ g t ,
          Z ˙ t = 1 d y u ˙ t γ u ˙ t Z t Z t n 1 β u ˙ t Z t n 1 ,    
Within the scope of this study, the necessary arrangement to obtain the bilinear hysteretic model is reflected in considering three parameters of the structural system. The influence of ground motion characteristics on the response characteristics based on the Bouc–Wen hysteretic model [43,44,45] in Antakya city center is shown in Figure 34, Figure 35, Figure 36, Figure 37, Figure 38, Figure 39 and Figure 40. For the entire Hatay province, maximum displacement demand for the limited-ductility and high-ductility RC-MRF structures is illustrated in Figure 41. Time history analysis results indicate that ultimate strength levels are reached for multiples of the calculated values in accordance with TSDC-2018. Particularly in TK-3123 station, elastic strength values are exceeded for the RC-MRF systems. The maximum deformation demands for TK-3123, TK-3124, and TK-3129 are located in one of the components due to directionality effects.
The nonlinear response history of the inelastic mid-rise RC-MRF buildings having limited-ductility and high-ductility characteristics is well correlated with the AFAD stations aligned close to the fault rupture where the deformation demands are compatible with the rupture propagation, active fault mapping, and surface traces. The largest deformation demands were calculated for TK-3123 and TK-3124 in Antakya city center, and the maximum deformation is found for TK-3139 for RC-MRF systems (Figure 41).

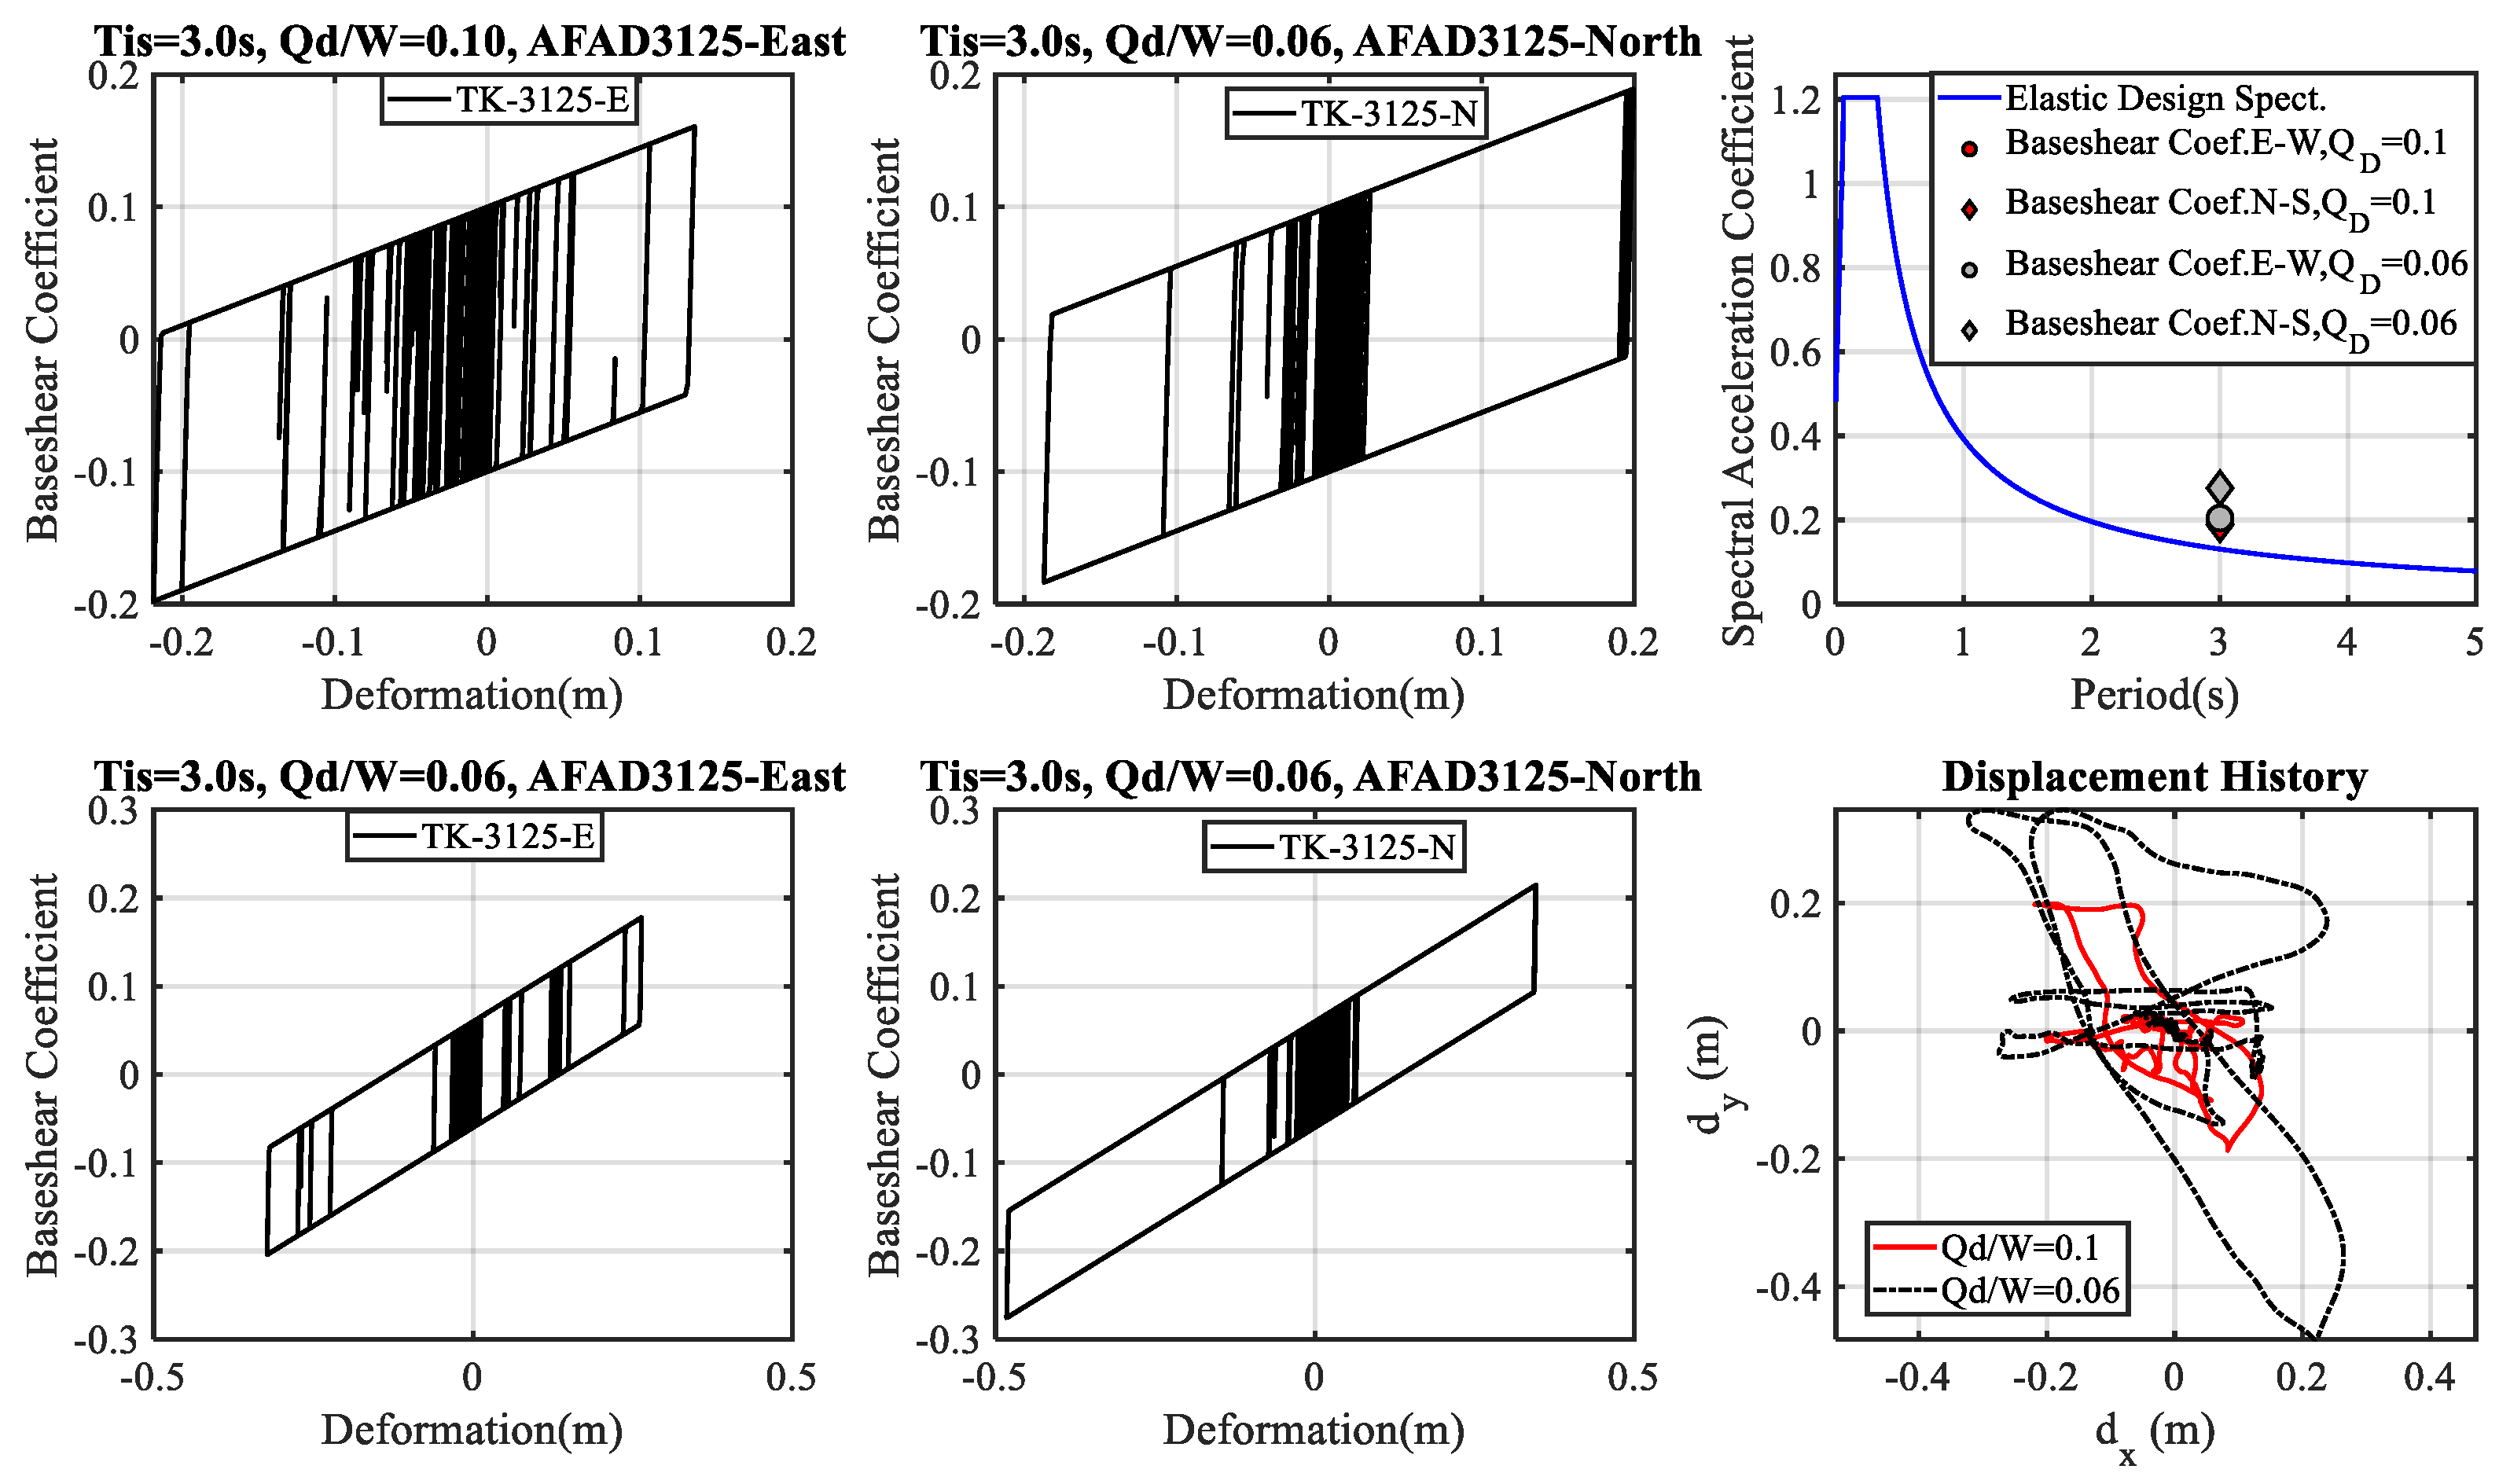
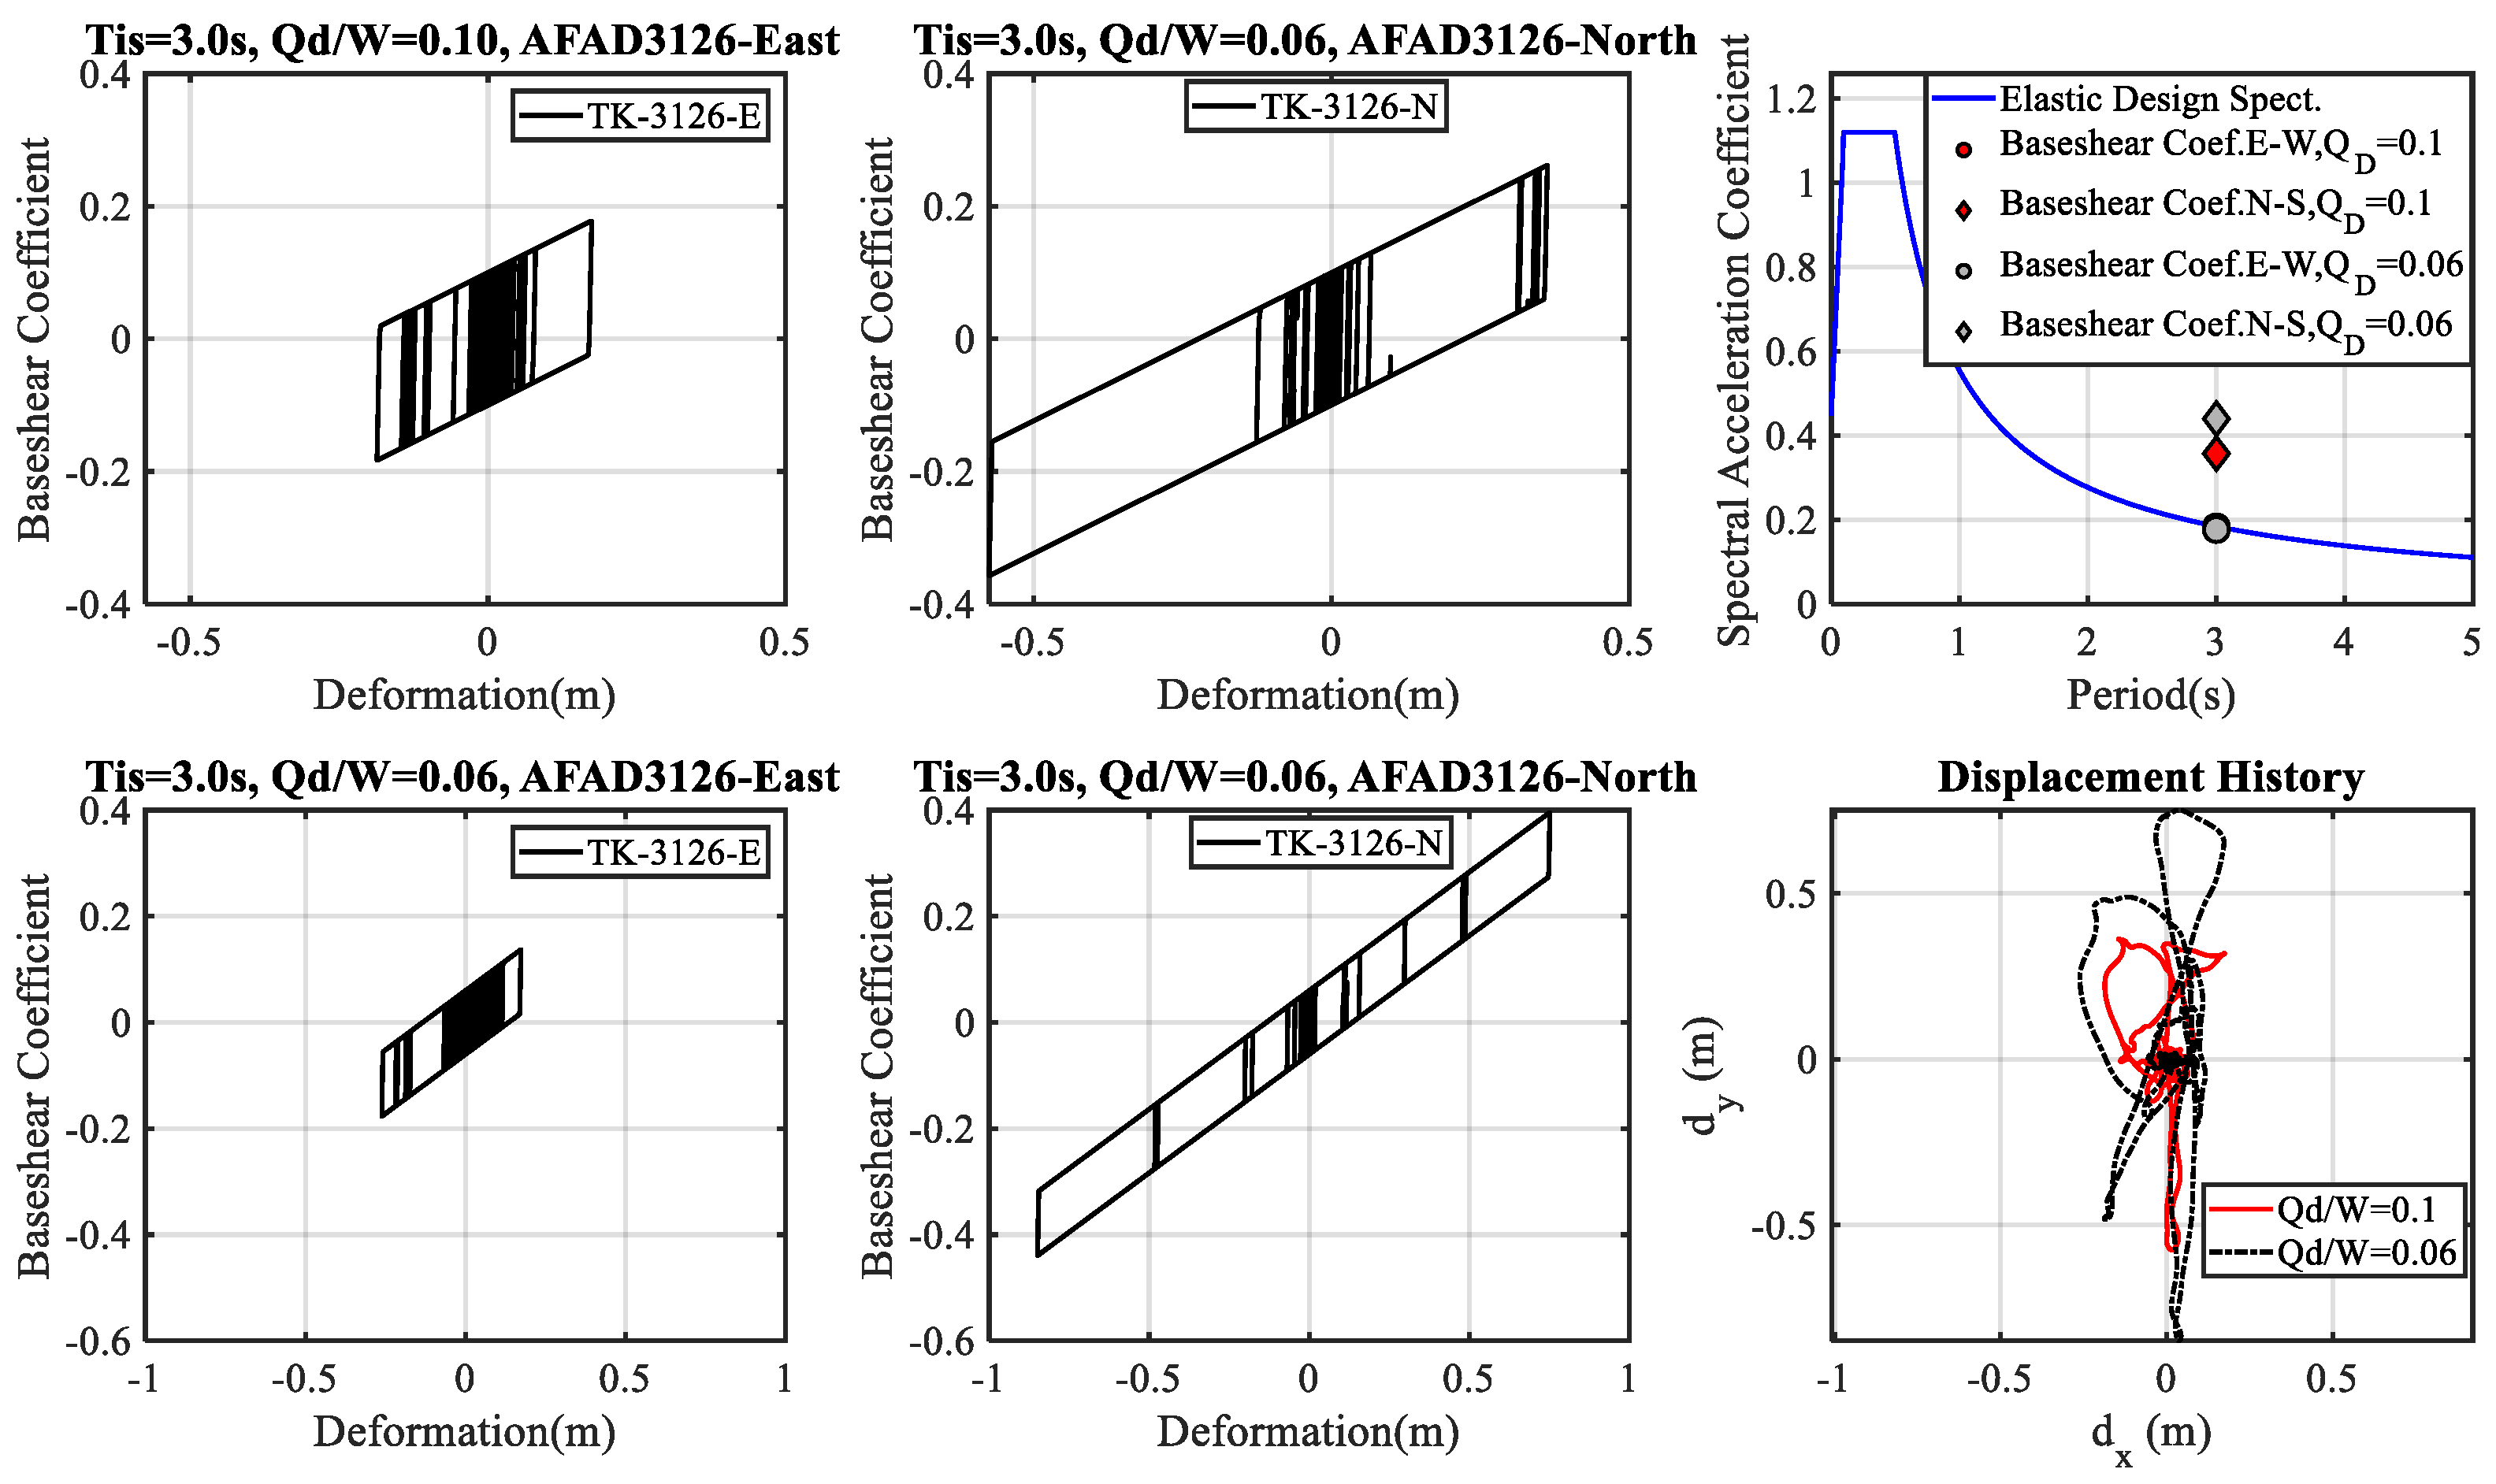
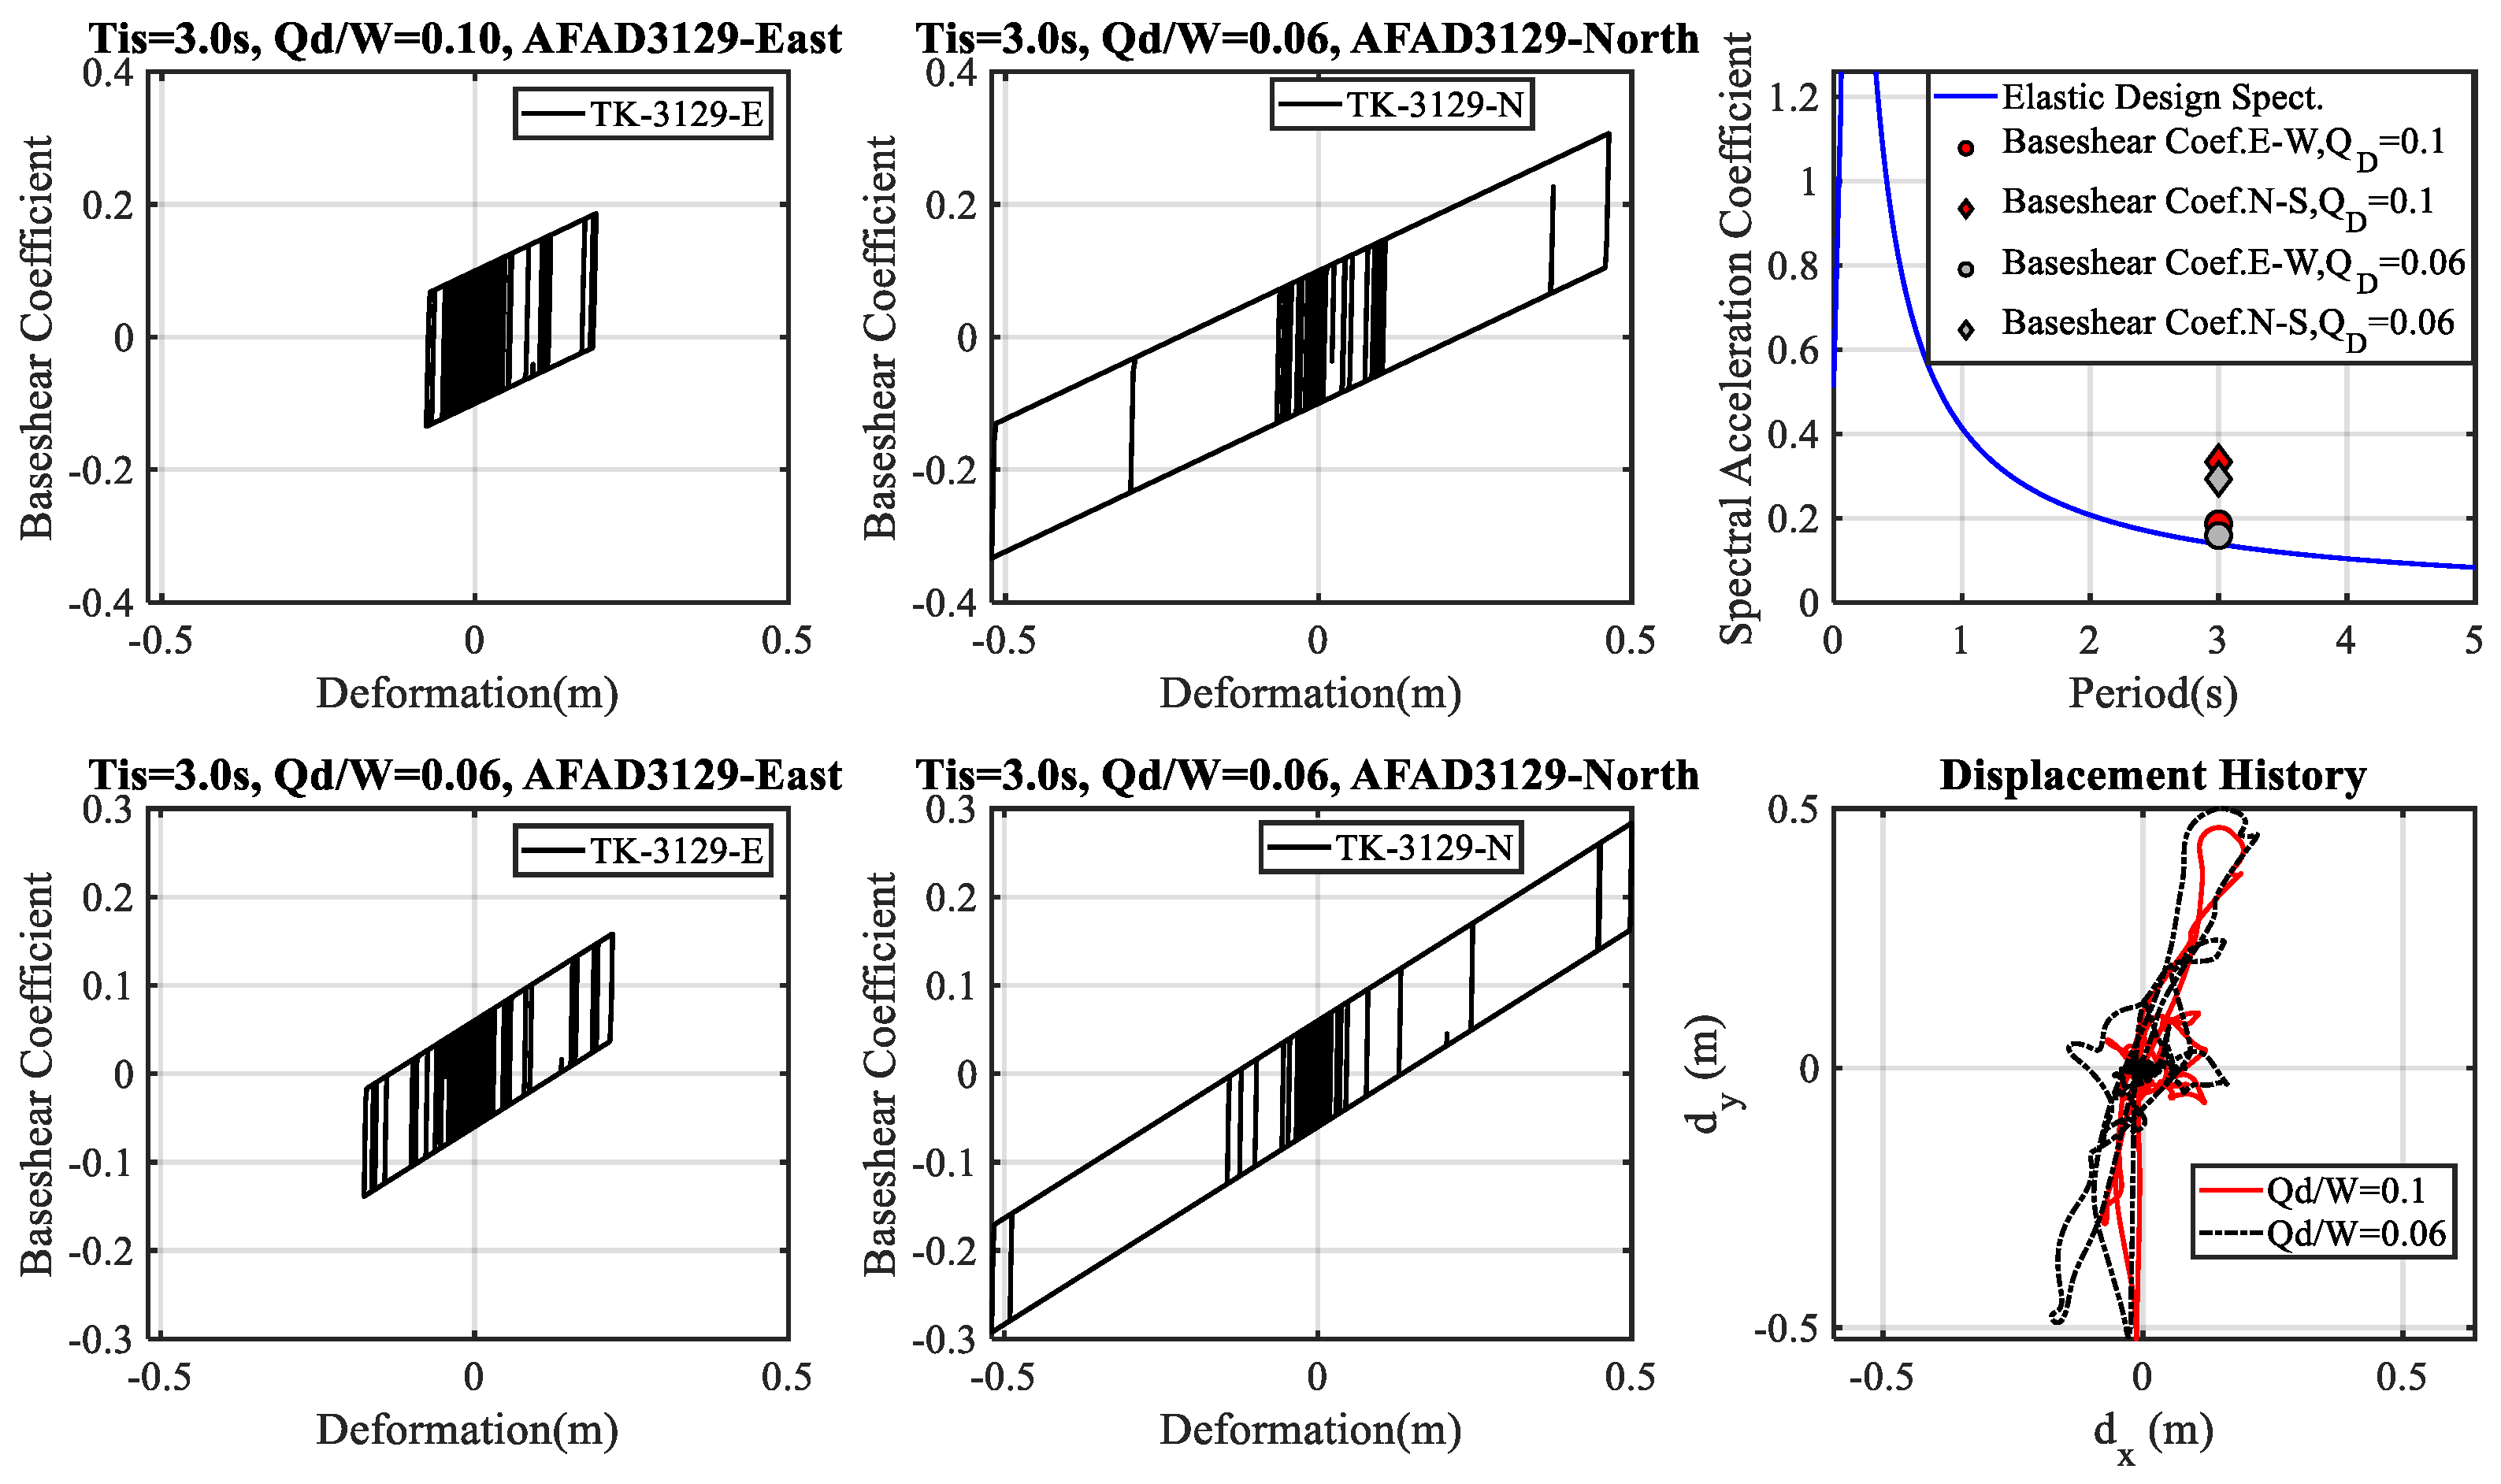
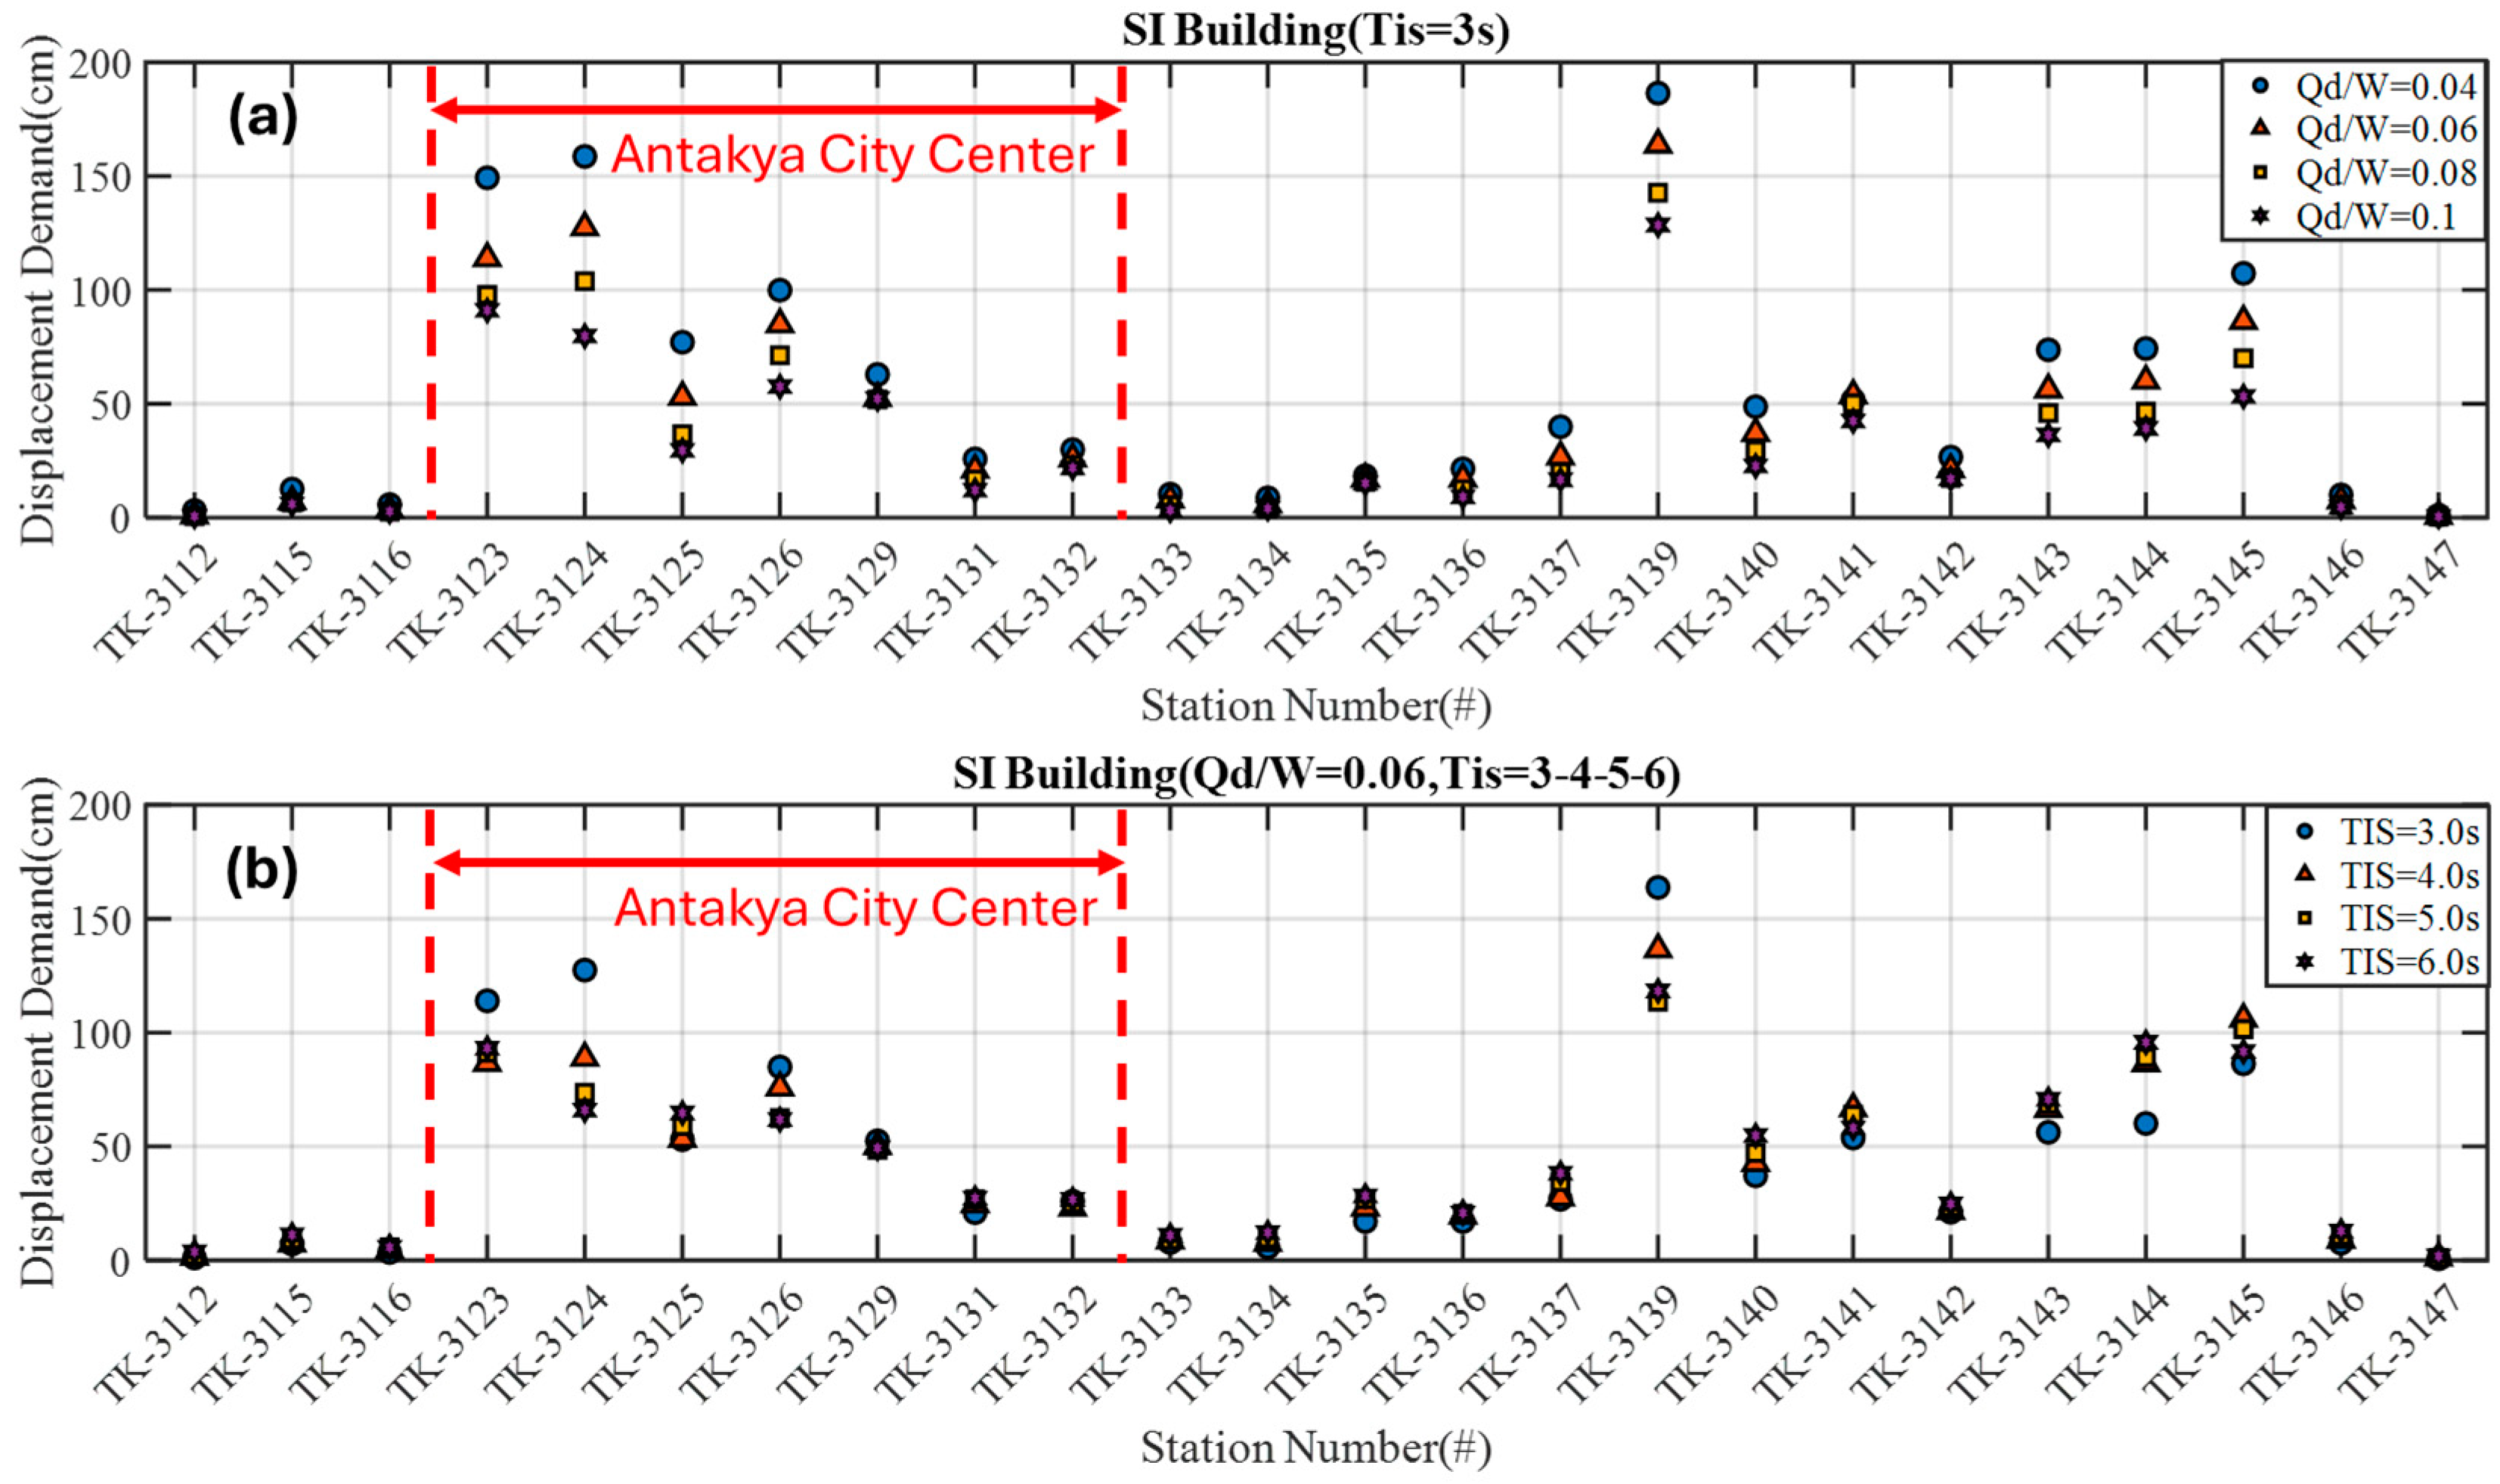
6.2. Bouc–Wen Hysteretic Model for Seismically Isolated Structures

Seismic isolation technology is a justified earthquake protection system. It is generally used in critical facilities to minimize structural damage and maintain functionality without having structural and nonstructural damage [46,47,48,49,50,51,52,53]. Elastomeric and curved friction slider isolation units are the two main categories commonly used in practice. Elastomeric isolation units are classified based on their damping and mechanical response characteristics, whereas friction sliders are classified according to used dry lubricators and geometric configurations and number of concave surfaces. None of the seismically isolated hospital buildings during the February 6 earthquakes experienced structural damage. The impact of ground motion characteristics on the vulnerability of seismically isolated buildings with sufficient seismic gaps has yielded contradictory results in the literature.
There were twelve seismically isolated hospital buildings in the disaster region. Ten healthcare facilities have curved surface friction sliders with two concave surfaces, whereas Adana City Hospital is equipped with friction sliders with four concave surfaces. Some of the healthcare facilities were operating before the February 6, 2023, earthquake, and the three of them were under construction during the February 6, 2023, earthquakes [39,40]. In this study, recorded near-fault ground motions taken from Hatay Province are classified to evaluate the impact of the pulse-type content on the displacement demand of the isolation system. Field evidence from aftermath studies indicated that the seismically isolated hospital buildings outperformed the fixed-base structures regarding structural robustness and being intact. However, several seismically isolated hospital buildings could not maintain their functionality during the critical 72 h of the earthquakes due to nonstructural damage based on faulty on-site applications such as closing the seismic gaps and restraining the movement of the isolation system. Among all cases, two of the seismically isolated hospital buildings exhibited relative underperformance based on their performance objective, where nonstructural damage due to pounding in the Doganşehir and Malatya Maternity and Children hospital could not give service in a full capacity. Hatay Dörtyol Hospital is the only seismically isolated hospital in Hatay province that kept functional, with a 250 bed capacity immediately after the first and second earthquakes. It served the entire region, and the bed capacity was increased to 400 due to increasing patients (Figure 42). The author visited the Hatay Dörtyol Hospital several times with international survey teams and performed checks on isolation units. The seismic isolation system consists of five types of double curved surface friction sliders, with axial load capacity varying from 4000 kN to 41,100 kN. The sliding seismic isolation system has a 400 mm displacement capacity. Following the 2023 doublet earthquakes, endoscopic camera measurements were utilized to determine the displacement traces. Based on investigations on isolation units, 4 cm displacement measurements were detected by site investigation teams. Although seismically isolated healthcare facilities were tested in Southeastern Türkiye, there was no seismically isolated residential buildings in the disaster region. In this study, the benefit of using SI technology for residential buildings in Hatay province will be assessed through nonlinear response history analysis. Thus, a vast number of analyses will be carried out for each isolation system incorporating the Bouc–Wen cyclic oscillation model.
Due to its simplicity, the superstructure of the SI building is idealized as a rigid mass (Figure 43). Likewise, in an inelastic SDOF MRF structure, the suite of EOM is transformed into a special form that contains the design parameters of SI buildings. The dynamic equilibrium equation of the inelastic SDOF system is solved by arranging Equation (8) to Equations (9) and (10). T i s denotes the period of the isolation system, m represents the mass of the superstructure, m b represents the isolation system mass with the interface, and k b represents the isolation system stiffness. For the practice-oriented applications, the characteristic strength, Q d , yield displacement, u y , and k b , which are among the design parameters of the isolation systems, were used with the help of subroutines developed in the MATLAB program.
The given form of equations can be used for the curved surface friction sliders and elastomeric bearings with the proper assignment of yield displacement and post-elastic stiffness values. It is worth noting that it is always possible to modify the practical suite of equations used herein into more complex forms based on the target of the study. In this study, our main concern is to evaluate the influence of extreme event input motions on the seismic performance of SI structures where the maximum displacement and maximum base shear force coefficient values are obtained. In Equations (8)–(10), u(t), u ¨ t ,   a n d   u ¨ g t denote the time-varying relative displacement, relative acceleration, and ground acceleration. The ratio of the characteristic strength to the total weight multiplied by the gravitational acceleration, g, which is one of the basic features of the seismic isolation system used in the arrangement made in Equation (9) together with the natural vibration period of the seismic isolation system is used. The z(t) parameter shown in Equations (9) and (10) is a dimensionless hysteretic parameter and takes values between −1 and 1 such that |z(t)| ≤ 1 [47,48].
      u ¨ t + F R t m = u ¨ g t
F ( t ) m = 2 π T ı s 2 u ( t ) + Q d W g z t  
  u y z ˙ + γ u ˙ ( t ) z z n 1 + β u ˙ t z n u t = 0
The Bouc–Wen hysteretic model can represent a variety of hysteretic shapes, including bilinear to flag-shaped inelastic hysteretic responses for earthquake protection systems. Due to its versatility and justified capability in experimental studies, it has been used effectively as a built-in function for many commercial software to model the nonlinear link elements. Apart from fixed-base elements, it can exhibit the response characteristics of energy dissipation and isolation devices. Moreover, MATLAB routines provide a computationally effective tool to understand the overall response of SI buildings in a shorter computational time without having any convergence problems by stiff ODE solvers. The provided tool is versatile, simple, and practical. It only depends on the solution of differential equations of the seismically isolated building with rigid mass that are put in an appropriate form considering the code-based design parameters of TSDC-2018. The validity and effectiveness of the Bouc–Wen model are verified by case studies. Time history analysis resulted in a 4.2 cm displacement, corresponding to almost the exact value of displacement trace measurement of the endoscopic camera during the reconnaissance trip (Figure 44).
Nonlinear response history analyses of SI buildings were conducted using 16 isolation systems. The analysis results offer force–deformation hysteresis, maximum displacement demand, and ultimate strength levels, utilizing a suite of processed ground motions from the AFAD Hatay stations. Due to page limitations, only the time history analysis results of the Antakya city center are illustrated in Figure 45, Figure 46, Figure 47, Figure 48, Figure 49, Figure 50 and Figure 51. It is well known that near-fault effects increase the displacement demands of the isolators. Nonlinear response history analysis results were well-correlated with the elaborated near-fault ground motions. In the Antakya city center, directivity effects resulted in velocity pulse content having a pulse period (Tp) close to the isolation system design period, where the maximum displacement demand was calculated for TK-3124. TK-3123 records gave the second peak deformations in the Antakya city center. Moreover, displacement trajectories were aligned more clearly compared to fixed-base structures. Also, the ultimate base shear coefficient for all stations in the city center exceeded the elastic design spectrum coefficients.
The influence of input ground motions containing near-fault ground motions for earthquake records of the 24 locations are shown for the seismic isolation system having a 3 s period, with varying characteristic strength ratios and varying isolation period values for an isolated structure having a characteristic strength ratio for 3, 4, 5, and 6 s in Figure 52.

7. Discussion

The SDOF model accounts for the overall response of the inelastic seismic behavior of an SDOF system, which limits this study to the first mode-dominated regular and symmetrical RC-MRF structures, ranging from low- to mid-rise structures and seismically isolated structures. Since the study investigates the influence of extreme earthquakes on the seismic response of the RC-MRF and seismic isolation systems, the provided tools with their current form cannot represent the deterioration and change of response characteristics under heating for seismic isolation systems. In contrast, SI models can consider upper and lower bound analysis for the time history analysis to capture the mechanical response changes. It is worth noting that the nonlinearity of the superstructure is disregarded for the isolation system, and the influence of the superstructure ductility was not investigated and beyond the capability of the proposed design and analysis tool.
TSDC-2018 does not require performing nonlinear analysis for the RC-MRF and isolated superstructures in near-fault regions. Hatay’s case has shown that disregarding the near-fault effects can jeopardize the structural safety of fixed-base buildings. Considering new limitations is necessary for RC-MRF buildings in seismically prone regions to reduce the annual collapse risk due to near-fault effects. Since being close to the fault rupture inherently plays a critical role through excessive deformation demands, spectral amplification of the constant velocity portion of the design spectrum for cases close to the fault rupture should be re-evaluated.
Building drift ratios in Hatay province exceeded the four percent drift ratio for the mid-rise buildings that yielded heavy damage or total collapse, which was compatible with the nonlinear response history values and found to correlate well with the PGV and fundamental vibration period for the considered building types in this study. In parallel, interstory drift ratios of the ground floors reached up to 6%, as shown in Section 4 (Figure 25a) based on site observations. Nonlinear response history analysis resulted in similar large drift values, which were reasonable for ground motion records close to fault ruptures and dominated by directivity effects for mid-rise buildings. Thus, controlling the drift of RC-MRFs in the lack of sufficient shearwalls is challenging for engineers and relies on careful reinforcement detailing in near-fault regions. The second option is to have a proper configuration of shearwalls in the plan that can provide extra strength and limit the undesired large drift ratios for conventional construction technologies compatible with the construction practice. Moreover, seismically isolated buildings were yielded to large displacement demands due to the peculiar characteristics of the 6 February 2023 earthquake doublet. The significance of conducting site-specific studies and selecting appropriate ground motions are two critical issues in the SI structures located in near-fault regions. Even though supershear waves, multiple wave packets described by Melgar [18], high amplitude velocity pulse contents, and soil–structure interactions are relatively new terms for the structural engineering profession, they should be investigated thoroughly for the 6 February 2023 earthquakes to understand their attributes in structural collapse. In addition, the trade-off between displacement demands and floor accelerations can be utilized in the design of SI structures based on Q d /W for residential buildings. Under the susceptibility of extreme events, supplemental damping should be sought for feasible isolation systems for residential buildings, which do not exist in the current version of TSDC-2018. Interested readers can refer to the various studies focused on energy dissipators to understand the basic concepts [54,55,56]. Further comprehensive studies considering cost-effectiveness as a combination of supplemental damping with different isolation systems (e.g., different types, such as properly combining elastomeric and sliding systems) should be investigated and included in the upcoming version of TSDC-2018.

8. Conclusions

The 6 February 2023 earthquake sequence was one of its kind compared to the earthquakes that occurred in the last 1000 years in Türkiye and Europe. This study investigated the characteristics of strong motion records by incorporating an inelastic SDOF system relying on the versatile Bouc–Wen hysteretic model. A suite of developed MATLAB routines eases the applicability of the nonlinear response history analysis and minimizes the computational cost. Inelastic SDOF systems could represent the features of the regular low-rise and mid-rise RC-MRF structures and SI buildings with a rigid superstructure. Since the developed models are instrumental, they can be easily adapted as a rapid assessment tool governed by differential equations. Approximately 2500 nonlinear response history analyses were performed. The accuracy of the Bouc–Wen model was matched almost perfectly with the field data and measurements taken from seismic isolation units. Time history analysis results were shown for 24 pairs of horizontal ground motions, with special attention given to Antakya city center to understand the influence of the extreme ground motion characteristics on the structural collapses.
Analysis results of MRF and SI systems verified the large drift ratios in Antakya city center, varying from 4% to 6% displacement demands. Particularly, the destructiveness of the TK-3123, TK-3124, and 3126 records stand out for the fixed-base and possibly constructed seismically isolated structures in Antakya. Apart from Antakya city center, TK-3139, TK-3143, and TK-3145 records having R r u p and R J B less than 5 km yield to large displacement drift too. Effects of near-fault ground motions have been explicitly shown in the content of this study. Buildings constructed in the 1970s without ductility requirements and capacity-protected design procedures withstood the 2023 earthquake doublet, whereas mid-rise buildings in their surroundings designed in accordance with the TSDC-2018 controlled mechanism by-law collapsed. Thus, the 2023 earthquake doublet has provided interesting cases where multiple factors played a significant role in the collapse of the buildings. Further analysis considering a holistic approach is recommended to detail the main attributes of structural collapses, where the combined effects of site conditions, structural characteristics, and near-fault ground motions are concisely determined.

Funding

This research received no external funding.

Data Availability Statement

The ground motion records of this study are accessible from the website of the Disaster and Emergency Management Presidency of Turkey, AFAD (https://tadas.afad.gov.tr/).

Acknowledgments

I want to express my gratitude to the Hatay Chambers of Civil Engineers, President of Hatay Imo, İnal Büyükaşık, senior design engineer and owner of the design company Ali Hoca, and civil and survey engineer İsmail Çalı for data sharing and insightful discussions about the damage patterns in Hatay Province. Also, I want to give my special thanks to Uğurcan Özçamur, General Manager, and Sadun Tanışer, Project Chief of TİS, for their fruitful discussions about the design perspective of their seismically isolated healthcare facility projects.

Conflicts of Interest

The author declares no conflicts of interest.

Abbreviations

The following abbreviations are used in this manuscript:
AFADTurkish Disaster and Emergency Management Authority
KOERIKandilli Observatory and Earthquake Research Institute
SI BuildingsSeismically Isolated Buildings
RCReinforced Concrete
MRFMoment-Resisting Frame
EAFEast Anatolian Fault
NAFNorth Anatolian Fault
TSDCTurkish Seismic Design Code
SDOFSingle Degree of Freedom System
MDOFMulti Degree of Freedom System
PGAPeak Ground Acceleration
PGVPeak Ground Velocity
PGDPeak Ground Displacement
ADRSAcceleration Displacement Response Spectrum
EOMEquation of Motion

References

  1. Duman, T.Y.; Emre, Ö. The East Anatolian Fault: Geometry, segmentation and jog characteristics. Geol. Soc. 2013, 372, 495–529. [Google Scholar] [CrossRef]
  2. Emre, Ö.; Duman, T.Y.; Özalp, S.; Şaroğlu, F.; Olgun, Ş.; Elmacı, H.; Çan, T. Active fault database of Turkey. Bull. Earthq. Eng. 2018, 16, 3229–3275. [Google Scholar] [CrossRef]
  3. Güvercin, S.E.; Karabulut, H.; Konca, A.Ö.; Doğan, U.; Ergintav, S. Active seismotectonics of the East Anatolian Fault. Geophys. J. Int. 2022, 230, 50–69. [Google Scholar] [CrossRef]
  4. Şengör, A.M.C.; Görür, N.; Şaroğlu, F. Strike-slip faulting and related basin formation in zone of tectonic escape: Turkey as a case study. In Strike-Slip Deformation, Basin Deformation and Sedi-Mentation; Special Publication; Biddle, K.T., Christie-Blick, N., Eds.; Society of Economic Paleontologists and Mineralogists: Denver, CO, USA, 1985; Volume 37, pp. 227–264. [Google Scholar]
  5. Soysal, H.; Spaniel, S.; Kolçak, D.; Altınok, Y. Türkiye ve Çevresinin Tarihsel Deprem Kataloğu; Proje No. TBAG 341, İstanbul, 86; TUBITAK: Ankara, Turkey, 1981. (In Turkish) [Google Scholar]
  6. Ambraseys, N.N. Temporary seismic quiescence: SE Turkey. Geophys. J. Int. 1989, 96, 311–331. [Google Scholar] [CrossRef]
  7. Ambraseys, N.N.; Melville, C.P. Historical evidence of faulting in eastern Anatolia and northern Syria. Ann. Geophys. 1995, 38, 337–343. [Google Scholar] [CrossRef]
  8. Ambraseys, N.N. The 12th century seismic paroxysm in the Middle East: A historical perspective. Ann. Geophys. 2004, 47, 733–758. [Google Scholar]
  9. Ambraseys, N.N. Earthquakes in the Eastern Mediterranean and the Middle East: A Multidisciplinary Study of 2000 Years of Seismicity; Cambridge University Press: Cambridge, UK, 2009; p. 968. ISBN 9780521872928. [Google Scholar]
  10. Arpat, E.; Şaroğlu, F. Doğu Anadolu Fayı Ile Ilgili Bazı Gözlemler ve Düşünceler; Maden Tetkik ve Arama Enstitüsü: Ankara, Turkey, 1972; pp. 44–50. [Google Scholar]
  11. Arpat, E.; Şaroğlu, F. Türkiye’deki bazı önemli genç tektonik olaylar. TJK Bül. 1975, 18, 91–101. [Google Scholar]
  12. Barka, A.; Reilinger, R. Active tectonics of the Eastern Mediterranean region: Deduced from GPS, neotectonic and seismicity data. Ann. Geophys. 1997, 40, 587–610. [Google Scholar] [CrossRef]
  13. Altindal, A.; Askan, A. Traditional seismic hazard analyses underestimate hazard levels when compared to observations from the 2023 Kahramanmaraş earthquakes. Commun. Earth Env. 2024, 5, 14. [Google Scholar] [CrossRef]
  14. Di Sarno, L.; Yenidogan, C.; Erdik, M. Field evidence and numerical investigation of the Mw = 7.1 October 23 Van, Tabanli and the Mw > 5.7 November Earthquakes of 2011. Bull. Earthq. Eng. 2013, 11, 313–346. [Google Scholar] [CrossRef]
  15. AFAD. Preliminary Assessment Report on the 06 February Pazarcık and Elbistan Earthquakes. 2023. Available online: http://www.afad.gov.tr/ (accessed on 5 May 2023).
  16. Presidency of The Republic of Turkey Presidency of Strategy and Budget. Türkiye Earthquakes Recovery and Reconstruction Assessment (TERRA). Available online: https://www.sbb.gov.tr/wp-content/uploads/2023/03/Turkiye-Recovery-and-Reconstruction-Assessment.pdf (accessed on 1 January 2025).
  17. Reitman, N.G.; Reitman, N.G.; Briggs, R.W.; Barnhart, W.D.; Hatem, A.E.; Jobe, J.A.T.; DuRoss, C.B.; Gold, R.D.; Mejstrik, J.D.; Collett, C.; et al. Rapid Surface Rupture Mapping from Satellite Data: The 2023 Kahramanmaraş, Turkey (Türkiye), Earthquake Sequence. Seism. Rec. 2023, 3, 289–298. [Google Scholar] [CrossRef]
  18. Melgar, D.; Taymaz, T.; Ganas, A.; Crowell, B.; Öcalan, T.; Kahraman, M.; Tsironi, V.; Yolsal-Çevikbil, S.; Valkaniotis, S.; Irmak, T.S.; et al. Sub- and Super-Shear Ruptures During the 2023 Mw 7.8 and Mw 7.6 Earthquake Doublet in SE Türkiye. Seismica 2023, 2, 1–10. [Google Scholar] [CrossRef]
  19. Barbot, S.; Luo, H.; Wang, T.; Hamiel, Y.; Piatibratova, O.; Javed, M.T.; Braitenberg, C.; Gurbuz, G. Slip distribution of the February 6, 2023 Mw 7.8 and Mw 7.6, Kahramanmaraş, Turkey earthquake sequence in the East Anatolian fault zone. Seismica 2023, 2. [Google Scholar] [CrossRef]
  20. Mai, P.M.; Aspiotis, T.; Aquib, T.A.; Cano, E.V.; Castro-Cruz, D.; Espindola-Carmona, A.; Li, B.; Li, X.; Liu, J.; Matrau, R.; et al. The destructive earthquake doublet of 6 February 2023 in south-central Türkiye and northwestern Syria: Initial observations and analyses. Seism. Rec. 2023, 3, 105–115. [Google Scholar] [CrossRef]
  21. Turkish Seismic Design Code for Buildings-2018 (TSDC-2018); Turkish Disaster and Emergency Management Authority: Ankara, Turkey, 2018.
  22. AFAD. Turkish Accelerometric Database and Analysis System. 2023. Available online: https://tadas.afad.gov.tr/ (accessed on 10 February 2025).
  23. Akkar, S.; Özen, Ö. Effect of Peak Ground Velocity on Deformation Demands for SDOF Systems. Earthq. Eng. Struct. Dyn. 2005, 34, 1551–1571. [Google Scholar] [CrossRef]
  24. U.S. Geological Survey. Finite Faults. 2023. Available online: https://earthquake.usgs.gov/earthquakes/eventpage/us6000jllz/finite-fault (accessed on 10 May 2023).
  25. Somerville, P.G. Magnitude scaling of the near fault rupture directivity pulse. Phys. Earth Planet. Inter. 2003, 137, 12. [Google Scholar] [CrossRef]
  26. Somerville, P.G.; Smith, N.F.; Graves, R.W.; Abrahamson, N.A. Modification of empirical strong ground motion attenuation relations to include the amplitude and duration effects of rupture directivity. Seism. Res. Lett. 1997, 68, 199–222. [Google Scholar] [CrossRef]
  27. Spudich, P.; Chiou, B.S.; Graves, R.W.; Collins, K.R.; Somerville, P.G. A Formulation of Directivity for Earthquake Sources Using Isochrone Theory; U.S. Geological Survey Open-File Report 2004-1268; US Geological Survey: Reston, VA, USA, 2004; 54p. [Google Scholar]
  28. Bray, J.D.; Rodriguez-Marek, A. Characterization of Forward-directivity Ground Motions in the Near-fault Region. Soil Dyn. Earthq. Eng. 2004, 24, 815–828. [Google Scholar] [CrossRef]
  29. Burks, L.S.; Baker, J.W. A predictive model for fling-step in near-fault ground motions based on recordings and simulations. Soil Dyn. Earthq. Eng. 2016, 80, 119–126. [Google Scholar] [CrossRef]
  30. Makris, N.; Black, C. Evaluation of peak ground velocity as a good intensity measure for near-source ground motions. Eng. Mech. (ASCE) 2004, 130, 1032–1044. [Google Scholar] [CrossRef]
  31. Bertero, V.V.; Mahin, S.A.; Herrera, R.A. Aseismic design implications of near-fault San Fernando earthquake records. Earthq. Eng. Struct. Dyn. 1978, 6, 31–42. [Google Scholar] [CrossRef]
  32. Mavreoudis, G.P.; Dong, G.; Papageorgiou, A.S. Near-fault ground motions, and the response of elastic and inelastic single-degree-of-freedom (SDOF) systems. Earthq. Eng. Struct. Dyn. 2004, 33, 1023–1049. [Google Scholar] [CrossRef]
  33. Hall, J.F.; Heaton, T.H.; Halling, M.W.; Wald, D.J. Near-source Ground Motions and Its Effects on Flexible Buildings. Earthq. Spectra 1995, 11, 569–605. [Google Scholar] [CrossRef]
  34. Baker, J.W. Quantitative Classification of Near-Fault Ground Motions Using Wavelet Analysis. Bull. Seismol. Soc. Am. 2007, 97, 1486–1501. [Google Scholar] [CrossRef]
  35. Shahi, S.K.; Baker, J.W. An efficient algorithm to identify strong velocity pulses in multi-component ground motions. Bull. Seismol. Soc. Am. 2014, 104, 2456–2466. [Google Scholar] [CrossRef]
  36. Ancheta, T.D.; Darragh, R.B.; Stewart, J.P.; Seyhan, E.; Silva, W.J.; Chiou, B.S.J.; Wooddell, K.E.; Graves, R.W.; Kottke, A.R.; Boore, D.M.; et al. PEER NGA-West2 Database; Report No. PEER 2013/03; University of California: Berkeley, CA, USA, 2013. [Google Scholar]
  37. Si, H.; Midorikawa, S. Distance Attenuation Equations for Maximum Acceleration and Maximum Velocity Considering Fault Type and Ground Conditions. J. Struct. Syst. Archit. Inst. Jpn. 1999, 64, 63–70. [Google Scholar]
  38. Hisada, Y.; Tanaka, S.; Kurata, M.; Yenidoğan, H.C.; Fukui, H.; Kobayashi, H.; Nagae, T. Near-Fault Strong Motion, Surface Rupture and Building Damage by the 2023 Kahramanmaraş Earthquake. In Proceedings of the 18th World Conference on Earthquake Engineering, Milan, Italy, 30 June–5 July 2024; Volume 1, pp. 1–10. [Google Scholar]
  39. Yenidoğan, C. 6 Şubat 2023 Depremleri ve Saha Gözlemlerine Dayalı Bina Hasarları Hakkında Ön Değerlendirme. Turk. J. Civ. Eng. 2024, 35, 75–113. [Google Scholar] [CrossRef]
  40. Yenidoğan, C. Seismic Performance of Base-Isolated and Conventional Hospital Buildings in the February 6, 2023, Earthquakes. In Proceedings of the 18th World Conference on Seismic Isolation (18WCSI), Antalya, Turkey, 6–10 November 2023; Volume 1, pp. 766–777. [Google Scholar]
  41. Turkish Seismic Design Code (TSDC-1975); Specifications for Buildings to Be Built in Seismic Areas. Ministry of Public Works and Settlement: Ankara, Turkey, 1975.
  42. Turkish Seismic Design Code (TSC-1997/2007); Specifications for Buildings to Be Built in Seismic Areas. Ministry of Public Works and Settlement: Ankara, Turkey, 1997/2007.
  43. Bouc, R. Forced vibration of mechanical systems with hysteresis. In Proceedings of the 4th Conference on Non-linear Oscillations, Prague, Czech Republic, 5–9 September 1967. [Google Scholar]
  44. Wen, Y.K. Method of random vibration of hysteretic systems. J. Eng. Mech. (ASCE) 1976, 102, 249–263. [Google Scholar] [CrossRef]
  45. Park, Y.J.; Wen, Y.K.; Ang, A.H.S. Random vibration of hysteretic systems under bidirectional ground motions. Earthq. Eng. Struct. Dyn. 1986, 14, 543–557. [Google Scholar] [CrossRef]
  46. Jangid, R.; Kelly, J. Base isolation for near-fault motions. Earthq. Eng. Struct. Dyn. 2001, 30, 691–707. [Google Scholar] [CrossRef]
  47. Yenidogan, C. Earthquake-Resilient Design of Seismically Isolated Buildings: A Review of Technology. Vibration 2021, 4, 602–647. [Google Scholar] [CrossRef]
  48. Yenidoğan, C. Deprem Yalıtımlı ve Ankastre Temelli Betonarme Yapıların Performansının TBDY-2018 Kapsamında Kıyaslamalı Olarak Değerlendirmesi. Dicle Üniversitesi Mühendislik Fakültesi Mühendislik Derg. 2024, 15, 767–781. [Google Scholar] [CrossRef]
  49. Yenidogan, C.; Erdik, M. Effects of near-field earthquakes on seismically isolated bridges. In Proceedings of the 13th World Conference on Seismic Isolation, Energy Dissipation and Active Vibration Control of Structures-Commemorating JSSI 20th Anniversary, Sendai, Japan, 24–27 September 2013. [Google Scholar]
  50. Uckan, E.; Yenidogan, C.; Tüzün, C.; Erdik, M. Seismic Isolation Applications and Current Research Practice in Turkey. In Proceedings of the Structural Engineers World Congress, Bangalore, India, 2 November 2007. [Google Scholar]
  51. Yenidogan, C.; Erdik, M. A Comparative Evaluation of design provisions for seismically isolated buildings. Soil Dyn. Earthq. Eng. 2016, 90, 265–286. [Google Scholar] [CrossRef]
  52. Yenidogan, C. Karma Deprem Yalıtım Sistemlerinin Deneysel Performans Değerlendirmesi. Dokuz Eylül Üniversitesi Mühendislik Fakültesi Fen Mühendislik Derg. 2021, 23, 767–779. [Google Scholar] [CrossRef]
  53. Yenidogan, C.; Erdik, M. The State of art in seismic isolation and energy dissipation devices. J. Jpn. Soc. Seism. Isol. (Menshin) 2014, 83, 49–59. [Google Scholar]
  54. Chopra, A.K. Dynamics of Structures: Theory and Applications to Earthquake Engineering; Pearson: Prentice Hall, NJ, USA, 2001. [Google Scholar]
  55. Foti, D. Response of frames seismically protected with passive systems in near-field areas. Int. J. Struct. Eng. 2014, 5, 326–345. [Google Scholar] [CrossRef]
  56. Foti, D.; Ruggiero, F.; Sabbà, M.F.; Lerna, M. A Dissipating Frames for Seismic Retrofitting and Building Energy-Efficiency. Infrastructures 2020, 5, 74. [Google Scholar] [CrossRef]
Figure 1. (a) Turkish Seismic Hazard Map-2018 in use [21]. (b) Disaster regions and location of Hatay in Türkiye and (c) heavily damaged city center in Antakya.
Buildings 15 00990 g001
Figure 2. (a) Interaction of surrounding tectonic plates and location of NAF and EAF transform faults; (b) large earthquakes that occurred in the EAF zone in history [1,2,3,4,5,6,7,8,9,10,11,12,13].
Buildings 15 00990 g002
Figure 3. (a) Location of main shocks and aftershocks and (b) reported focal mechanisms, depths, and magnitudes of two earthquakes by different institutions [22].
Buildings 15 00990 g003
Figure 4. (a) Seismicity of the earthquake-affected region and more than 60,000 events recorded at the end of 2024; (b) 42 seismic events recorded in the borders of Hatay province, with maximum M w = 6.4 and M w = 5.8 until the 1 February 2025 [22].
Buildings 15 00990 g004
Figure 5. (a) Surface trace and AFAD stations in Hatay Province; (b) stations located in heavily damaged city center of Hatay.
Buildings 15 00990 g005
Figure 6. Acceleration, velocity, and displacement time history for TK-3123.
Buildings 15 00990 g006
Figure 7. Acceleration, velocity, and displacement time history for TK-3124.
Buildings 15 00990 g007
Figure 8. Acceleration, velocity, and displacement time history for TK-3125.
Buildings 15 00990 g008
Figure 9. Acceleration, velocity, and displacement time history for TK-3126.
Buildings 15 00990 g009
Figure 10. Acceleration, velocity, and displacement time history for TK-3129.
Buildings 15 00990 g010
Figure 11. Acceleration, velocity, and displacement time history for TK-3131.
Buildings 15 00990 g011
Figure 12. Acceleration, velocity, and displacement time history for TK-3132.
Buildings 15 00990 g012
Figure 13. Comparison of DD-1 and DD-2 design spectra with the response spectra of TK-3123.
Buildings 15 00990 g013
Figure 14. Comparison of DD-1 and DD-2 design spectra with the response spectra of TK-3124.
Buildings 15 00990 g014
Figure 15. Comparison of DD-1 and DD-2 design spectra with the response spectra of TK-3125.
Buildings 15 00990 g015
Figure 16. Comparison of DD-1 and DD-2 design spectra with the response spectra of TK-3126.
Buildings 15 00990 g016
Figure 17. Comparison of DD- 1 and DD-2 design spectra with the response spectra of TK-3129.
Buildings 15 00990 g017
Figure 18. Comparison of DD-1 and DD-2 design spectra with the response spectra of TK-3131.
Buildings 15 00990 g018
Figure 19. Comparison of DD-1 and DD-2 design spectra with the response spectra of TK-3132.
Buildings 15 00990 g019
Figure 20. Variation of PGV in ShakeMaps of the 2023 February Pazarcik and Elbistan earthquakes and location of AFAD stations used (USGS) [17,24].
Buildings 15 00990 g020
Figure 21. Schematic representation of the forward and backward directivity effects.
Buildings 15 00990 g021
Figure 22. (a) Variation of PGA and (b) PGV with distance (After Hisada et al. 2024 [38]); (c) location of ground motions that are susceptible to near-fault ground motion and city center.
Buildings 15 00990 g022
Figure 23. Velocity time history and velocity pulse content in (a) TK-3123 and (b) TK-3124 stations.
Buildings 15 00990 g023
Figure 24. (a) Out-of-plane failure of unreinforced masonry infill walls. (b) Column damage buckling of longitudinal reinforcement. (c) Shearwall damage. (d) Slab damage.
Buildings 15 00990 g024
Figure 25. (a) Soft-story damage in Hassa. (b) Collapsed building in Kirikhan [39]. (c) Soft-story collapse in Iskenderun in nearby structures.
Buildings 15 00990 g025
Figure 26. (a) Slightly damaged building, which had partially excessive damage in a few members due to pounding of nearby structure; (b) plan layout of column application drawings [39].
Buildings 15 00990 g026
Figure 27. (a) Heavily damaged Academic Hospital in Hatay. (b) Total collapse of Iskenderun Hospital. (c) Mustafa Kemal Research and Training Hospital [41]. (d) Erzin Hospital [39].
Buildings 15 00990 g027
Figure 28. (a) Slight damage in an industrial building (cosmetic level); (b) moderately damaged precast industrial building; (c) concentrated damage in a column from the moderately damaged building.
Buildings 15 00990 g028
Figure 29. (left) Kurtulus District after the earthquake doublet; (right) damaged masonry building [39].
Buildings 15 00990 g029
Figure 30. Design spectrum for residential buildings per (left) TSDC-1975, (middle) TSDC 1998/2007, and (right) TSDC-2018.
Buildings 15 00990 g030
Figure 31. Variation of (a) Ra and (b) Ry for yield strength (c) Sae(T) and SaR(t).
Buildings 15 00990 g031
Figure 32. Design spectrum for buildings constructed following TSDC-1975 and calculation of ductility demand using equations in TSDC-2018 after adjustment (TK-3124).
Buildings 15 00990 g032
Figure 33. Equivalent inelastic SDOF system and its bilinear idealized hysteretic model.
Buildings 15 00990 g033
Figure 34. Force–Deformation, ultimate base shear coefficient and displacement history under TK-3123.
Buildings 15 00990 g034
Figure 35. Force–Deformation, ultimate base shear coefficient and displacement history under TK-3124.
Buildings 15 00990 g035
Figure 36. Force–Deformation, ultimate base shear coefficient and displacement history under TK-3125.
Buildings 15 00990 g036
Figure 37. Force–Deformation, ultimate base shear coefficient and displacement history under TK-3126.
Buildings 15 00990 g037
Figure 38. Force–Deformation, ultimate base shear coefficient and displacement history under TK-3129.
Buildings 15 00990 g038
Figure 39. Force–deformation, ultimate base shear coefficient and displacement history under TK-3131.
Buildings 15 00990 g039
Figure 40. Force–deformation, ultimate base shear coefficient and displacement history under TK-3132.
Buildings 15 00990 g040
Figure 41. Displacement demand of inelastic MRF SDOF bilinear system designed with k p   = 0.1 and varying levels of ductility.
Buildings 15 00990 g041
Figure 42. Hatay Dörtyol Seismically Isolated Hospital Building schematic configuration with bilinear hysteretic envelope.
Buildings 15 00990 g042
Figure 43. (a) Equivalent inelastic SDOF isolated structure derived from MDOF systems. (b) Inelastic SDOF bilinear hysteretic of the isolated structure for the rigid superstructure.
Buildings 15 00990 g043
Figure 44. Validation and verification of displacement demand calculation of Bouc–Wen Model for the Hatay Dörtyol Seismically Isolated Hospital Building.
Buildings 15 00990 g044
Figure 45. Force–deformation, ultimate base shear coefficient and displacement history under TK-3123 record.
Buildings 15 00990 g045
Figure 46. Force–deformation, ultimate base shear coefficient and displacement history under TK-3124 record.
Buildings 15 00990 g046
Figure 47. Force–Deformation, ultimate base shear coefficient and displacement history under TK-3125 record.
Buildings 15 00990 g047
Figure 48. Force–deformation, ultimate base shear coefficient and displacement history under TK-3126 record.
Buildings 15 00990 g048
Figure 49. Force–deformation, ultimate base shear coefficient and displacement history under TK-3129 record.
Buildings 15 00990 g049
Figure 50. Force–deformation, ultimate base shear coefficient and displacement history under TK-3131 record.
Buildings 15 00990 g050
Figure 51. Force–deformation, ultimate base shear coefficient and displacement history under TK-3132 record.
Buildings 15 00990 g051
Figure 52. Comparison of displacement demand of (a) four different inelastic Qd/W systems for Tis = 3 s) and (b) effects of varying period for Qd/W = 0.06 SI systems.
Buildings 15 00990 g052
Table 1. The number of recording stations of three main shocks of the February 2023 earthquakes.
Data
Provider
Number of Records
from the M w = 7.7 Equation
Number of Records
from the M w = 7.6 Equation
Number of Records from the M w = 6.4 Equation
AFAD285320148
KOERI21 21 118
Table 2. Location of AFAD stations, site conditions, and various distance parameters considering the epicenter of the Pazarcik ( M w = 7.7) earthquake and fault rupture.
StationLatitudeLongitude R e p i (km) R h y p (km) R r u p (km) R J B (km) V s 30   ( m / s )
TK-311536.1636.55106.86106.8617.3717.36424.00
TK-311636.2136.6298.7498.7416.4916.48868.00
TK-312336.1636.21135.85135.855.245.20470.00
TK-312436.1736.24132.96132.965.115.08283.00
TK-312536.1336.24135.04135.048.418.39448.00
TK-312636.1436.22136.42136.427.337.30350.00
TK-312936.1336.19139.24139.246.506.48447.00
TK-313136.1636.19137.81137.814.074.03567.00
TK-313236.1736.21135.96135.963.963.91377.00
TK-313336.5736.24116.12116.1228.5828.58471.00
TK-313436.2036.8384.3984.3924.6524.64374.00
TK-313535.8836.41135.61135.6135.8735.86460.00
TK-313636.2536.12141.12141.126.076.04344.00
TK-313736.4936.6975.4675.464.274.23688.00
TK-313836.5136.8064.8864.882.021.93618.00
TK-313936.4136.5889.1289.122.262.18272.00
TK-314035.9536.08158.76158.7622.7222.71210.00
TK-314136.2236.37118.35118.356.186.15338.00
TK-314236.3736.5099.3799.371.521.40539.00
TK-314336.5636.8558.3358.334.044.00445.00
TK-314436.4936.7670.1670.161.661.55535.00
TK-314536.4136.6584.1784.171.030.84533.00
TK-314736.0635.90169.86169.8629.2429.23686.52
Table 3. Strong ground motion parameters of the processed recordings from 6 February 2023; Pazarcik M w = 7.7.
StationComp.PGAPGVPGDVmax/AmaxArias Int.Char.IntSICAVSignificant
Number(m/s2)(cm/s)(cm)(s)(m/s)(Ic)(cm)(cm/s)Dur. (s)
3112East0.7510.20140.140.10371.08249.2465.723.80
North0.9915.7017.40.160.20517.64417.4139.784.85
Vertical0.867.103.30.080.0657.21174.5938.842.25
3115East2.2348.30740.221.795986.601831.8089.0715.80
North2.8741.1030.30.143.263978.202865.6088.1418.36
Vertical2.1320.1020.80.091.281304.601423.8090.18.76
3116East1.6135.00440.220.842724.001037.7089.958.92
North1.5539.7068.90.260.783872.70978.9593.149.30
Vertical1.5119.2022.30.130.43803.20624.0594.264.91
3123East5.8298.7092.80.177.4628,349.005333.6069.1442.11
North6.52186.8063.70.299.2635,523.006272.7071.7659.98
Vertical8.4152.4017.80.064.625877.103724.2044.8321.43
3124East6.1997.0089.50.167.7140,615.005467.2075.9740.24
North5.69112.3047.10.206.1930,290.004636.5072.9744.17
Vertical5.7942.0022.30.073.084018.602745.2058.3414.62
3125East10.72102.6095.10.107.3921,003.005293.9039.6228.32
North7.7374.6066.10.106.3211,551.004708.1065.5823.43
Vertical10.5663.4025.90.066.743544.904939.8031.715.87
3126East10.0092.7088.70.0911.0822,166.007176.1069.928.07
North11.78110.20510.0920.5720,329.0011,413.0073.6339.61
Vertical9.2174.3022.70.0811.035189.307150.2043.3622.23
3129East11.9975.9076.50.0617.9715,272.0010,312.0062.8432.73
North13.52171.3051.30.1324.7118,009.0013,096.0038.1859.93
Vertical7.1742.6022.40.066.543818.504834.3059.0117.51
3131East3.5544.9026.20.131.704548.601762.2070.8623.77
North3.5548.0052.20.141.366335.301484.2058.6120.14
Vertical1.4619.2011.80.130.37919.45564.1069.318.81
3132East5.0852.0067.30.104.3411,303.003554.9072.5226.78
North5.0167.4031.70.133.666446.203128.6067.7632.02
Vertical3.5634.4012.50.101.831986.401860.2062.4417.60
3133East1.4523.4033.30.160.611966.20812.2088.759.07
North2.2229.2020.30.130.922046.101113.7089.7914.26
Vertical0.8615.1013.90.180.28720.67451.2291.153.59
3134East1.9939.5066.40.201.255012.101431.1078.1711.93
North2.4539.1041.30.161.404412.101564.3077.1814.14
Vertical1.2319.1023.20.160.52843.70747.0479.784.72
3135East13.1565.4048.40.056.776116.704958.4031.7929.19
North7.4150.2057.50.075.517514.304247.4041.5221.80
Vertical5.7537.6016.70.072.341746.002235.0045.810.70
3136East3.8354.2048.30.143.537241.903041.1079.2616.45
North5.1851.80350.103.855330.703248.9075.4622.37
Vertical2.1929.40200.131.101577.601268.3089.7910.52
3137East6.7076.9054.20.123.4910,197.003095.8064.922.98
North4.2980.901420.193.5016,353.003103.7072.7522.22
Vertical4.4840.9013.90.092.181885.002172.3073.4114.56
3139East5.04145.301190.296.9732,860.005205.5075.6347.15
North5.73155.40120.30.278.6034,587.006091.7073.0151.42
Vertical3.5353.1033.80.152.945258.902726.6077.8321.60
3140East2.1779.10840.372.0421,055.001975.5091.3720.05
North1.9463.3048.20.332.2913,703.002155.3094.4722.71
Vertical1.7529.6017.50.170.853644.201029.60100.8912.99
3141East8.36123.90107.30.1515.1520,720.009072.3070.841.37
North9.9280.6060.90.0813.2610,860.008210.6067.1432.62
Vertical6.6841.6039.40.066.112742.804590.0066.3417.15
3142East7.4076.2098.80.105.3613,799.004162.0077.8722.72
North6.5190.5079.80.145.286789.304115.1068.8623.39
Vertical4.5730.4021.80.072.011027.201992.1080.278.60
3143East3.46104.4090.60.302.4815,660.002437.6067.7424.18
North3.78124.80125.60.332.7014,662.002597.5066.7428.06
Vertical3.8127.7019.30.071.631331.901779.2067.7611.40
3144East3.46104.4090.60.303.8529,320.542437.6075.4825.27
North3.78124.80125.60.333.5720,346.682597.5071.0228.75
Vertical3.8127.7019.30.071.355053.861779.2065.9622.17
3145East6.93157.80125.40.236.5029,941.003334.6957.3444.23
North5.92116.50125.80.203.8115,638.003147.2463.2525.38
Vertical6.1065.20320.113.055161.801519.0248.826.02
3146East3.2554.6070.90.173.076374.503011.2049.9212.93
North4.6342.2051.90.094.554496.004040.5043.6713.89
Vertical2.7319.309.40.071.73618.451958.6054.778.03
3147East0.4724.9034.90.530.082251.40174.9085.614.07
North0.5613.7018.90.250.07877.55157.0384.923.47
Vertical0.287.8011.60.270.04448.63104.75104.852.82
Disclaimer/Publisher’s Note: The statements, opinions and data contained in all publications are solely those of the individual author(s) and contributor(s) and not of MDPI and/or the editor(s). MDPI and/or the editor(s) disclaim responsibility for any injury to people or property resulting from any ideas, methods, instructions or products referred to in the content.

