Abstract
Concrete-filled steel tubular (CFST) structures are well known to possess high strength and ductility. CFST members are used under complex stress states, such as beam–columns, piers, caissons, or other foundation components. Recommendations for the design and construction of concrete-filled steel tubular (CFST) structures were published in 1997 and revised in 2008 in Japan. In the recommendations, calculation methods for the axial strength and flexural strength of CFST columns were established on the basis of experimental results of more than 400 specimens; however, the test results of the columns that failed in shear referred to only 12 specimens in the recommendations. It is necessary to accumulate experimental data on the shear strengths and behaviors of CFST columns. Tests and analyses have been carried out on eight circular CFST column specimens with a shear span ratio of 0.75. The diameter-to-thickness ratio of the steel tube is approximately 34. The shearing capacities of the tests were underestimated by over 20% errors using the calculation method of the CFST Recommendations in Japan. The load versus deformation relations obtained by the tests were well traced by 3D-FEM analysis. The shearing capacities were estimated as an average of 12% errors using 3D-FEM analysis.
1. Introduction
Concrete-filled steel tubular (CFST) columns provide a number of advantages when used in seismic-resistant frames. The inner concrete increases the axial and flexural stiffness and load-carrying capacity while permitting more slender elements. Because slender beam–columns are normally predicted to fail in buckling or flexure, few studies of short columns of CFST that fail in shear have been conducted. It is necessary to provide a design formula for very short columns in structural designs based on a few specimens that fail in shear. To obtain data on the shearing failure of short CFST columns, we have experimentally investigated the load versus deformation characteristics of CFST specimens subjected to shearing force under constant axial compression. The test results were compared with those of the 3D-FEM analyses.
An extensive number of experimental studies for CFST members were conducted in the fifth phase of the U.S.–Japan Cooperative Earthquake Research Program from 1992 to 1996. The total summaries of this program were reported in papers by El-Tawil and Bracci [] and by Goel []. The analytical model for composite and hybrid structures was overviewed by Spacone and EI-Tawil []. The test results for axial compression were examined in two papers by Varma [] and the authors []. The beam-column tests were reported in Refs. [,]. The research on the connections is presented in the papers [,,,].
The authors proposed uniaxial stress–strain curve models for inner concrete and steel tubes of CFSTs in Ref. [] in this program. The authors also investigated the flexural behavior of single-curvature columns through experimental and analytical studies []. In this analytical study, the proposed uniaxial stress–strain curve models were used to predict the bending behavior accurately as a multi-fibers model. One of the authors had already studied the triaxial state of the components of composite and hybrid structures in Refs. [,] by a finite elements method (FEM).
In Japan, “Recommendations for Design and Construction of Concrete Filled Steel Tubular Structures []” was published in 1997 and revised in 2008. The Recommendation includes the results of the U.S.–Japan research and summarizes more than 400 specimens to establish the design methods for axial and flexural capacities but refers to only 12 specimens to verify the calculation method for shearing capacity. The 12 test results of shear failure of CFST short columns, of which shear span ratios were from 1.0 to 1.5, were reported by Sakino []. The sectional shapes of the twelve specimens were limited to 100 mm × 100 mm squares. The concrete strength of the tests was around 20 MPa, which was relatively lower than that of normal use of CFST. This study focuses on the shearing capacity and behavior of a circular CFST column.
The characteristic behaviors of CFST members have been investigated by many researchers. Analytical studies on CFST columns under axial compression were conducted by Choi and Xiao [] and Hu et al. []. There were some analytical studies on predicting the behavior of beam–columns by Varma et al. [] and the behavior of beam–column connections by Chiew et al. []. The CFST structure has the feature of the mutual confining effects between inner concrete and steel tube. The confining effect was essentially explained by three-dimensional models. These previous studies showed that FEM analysis is an effective way to predict complex three-dimensional stress states, for example, the study by Tort and Hajjar []. The authors also conducted a numerical investigation by 3D-FEM analysis to trace the relations between the shearing force and drift angle of the circular CFST columns.
Important research on the shearing behavior of circular CFST members was reported by Roeder et al. []. In this study, a database of test results of circular CFST that failed in shear was built, and they proposed a new calculation method for the shearing capacities of circular CFST columns. The Roeders’ study focused on beams or piles without axial force. Our study focuses on the columns with axial force.
In Section 2, an outline of the experimental work is presented. Section 3 shows the experimental results. A model for FEM analysis is shown in Section 4, and the analytical results are discussed in Section 5. In Section 6, the results of the test, analysis, and calculation are compared. Section 7 summarizes the outcomes of the study.
2. Specimen and Test Setup
A test matrix is presented in Table 1. A primary test parameter is the ratio of the axial force N to the nominal axial force capacity N0. Annealed and non-annealed steel tubes are used. The average compressive strength of concrete cylinders is 50.9 MPa. The yield stress of the non-annealed steel tube is 531 MPa, and that of the annealed one is 507 MPa. The notations in the tables are as follows: D: diameter of steel tube, t: wall thickness of steel tube, D/t: diameter to thickness ratio, a/D: shear span to depth ratio, a: shear span, cσB: strength of concrete cylinder, σy: yield stress of steel tube, N: constant axial force applied.

Table 1.
Test matrix.
The shape of the test specimen is shown in Figure 1. The mid-height region of the specimen is broken by the loading apparatus shown in Figure 2. The specimens are fabricated by welding steel tubes and plates. Four 19 mm thick plates are set laterally as loading stubs. Two central plates are carefully placed in the steel tube. The two plates are welded on one side of each plate, i.e., the upper and lower sides of the test part are not welded to avoid the influence of welding heat on the test specimen.
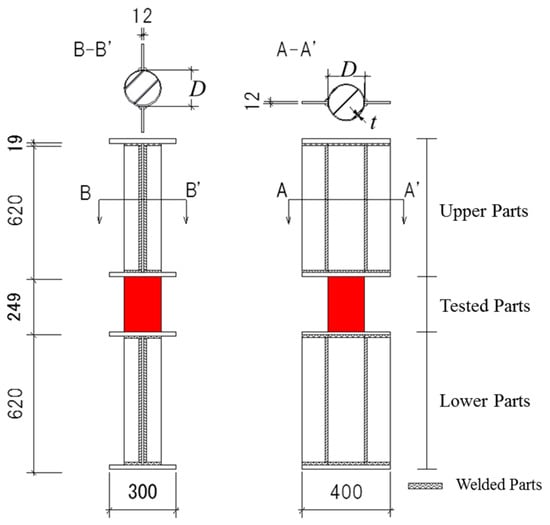
Figure 1.
Test specimen.
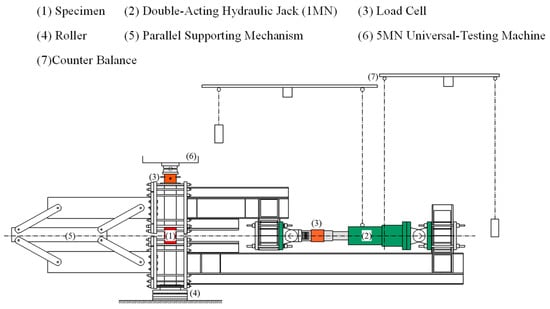
Figure 2.
Loading apparatus.
The axial force N is adopted by the universal testing machine at Kyushu University. Lateral forces Q are applied by a double-acting hydraulic jack with a capacity of 1 MN. A bending moment diagram of the whole test setup is shown in Figure 3. The mid-height region of the specimen deforms anti-symmetrically, as shown in Figure 4.
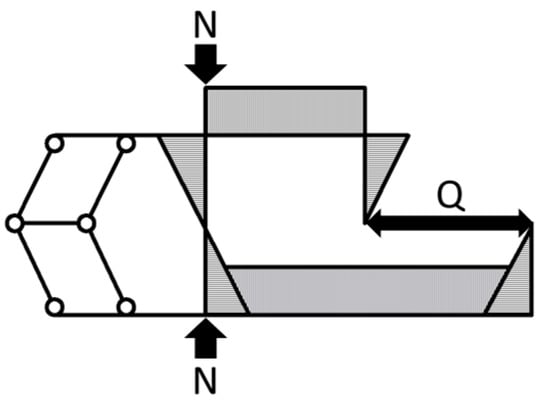
Figure 3.
Bending moment diagram.
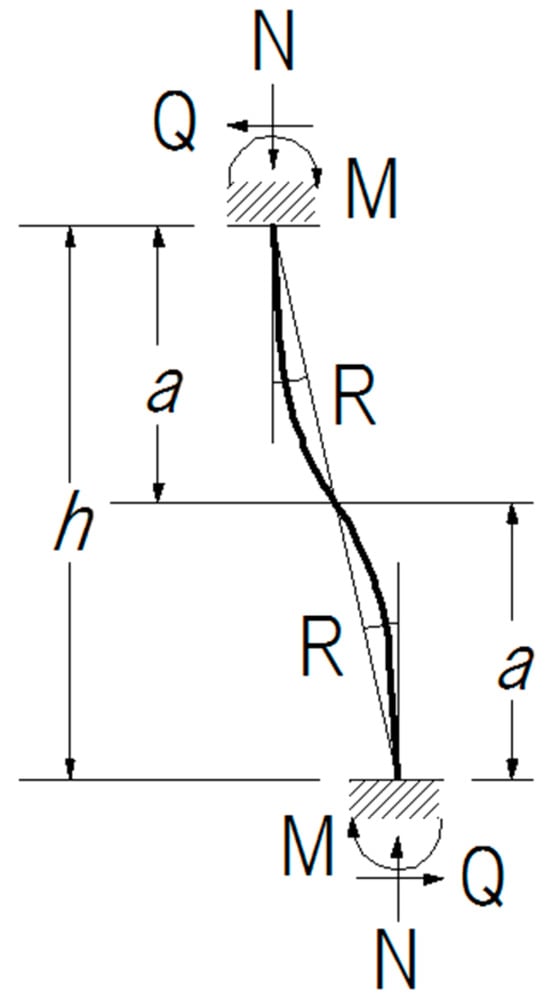
Figure 4.
Deformation of tested part.
The deformation histories of the test are shown in Figure 5, where the vertical axis shows the drift angle R of the specimen, and the horizontal axis shows the number of loading cycles. The drift angles R are obtained by dividing lateral displacements by the clear height of the specimen. The test is controlled under R according to Figure 5, where the peak drift angle increases stepwise from 1.0/100 rad. to 4.0/100 rad. Three cyclic deformations are applied at each drift angle. When the specimens do not show maximum strength within R = 4.0/100 rad., extra deformations are applied. They are up to R = 8.0/100 rad. for non-annealed specimens and R = 6.0/100 rad. for annealed specimens.
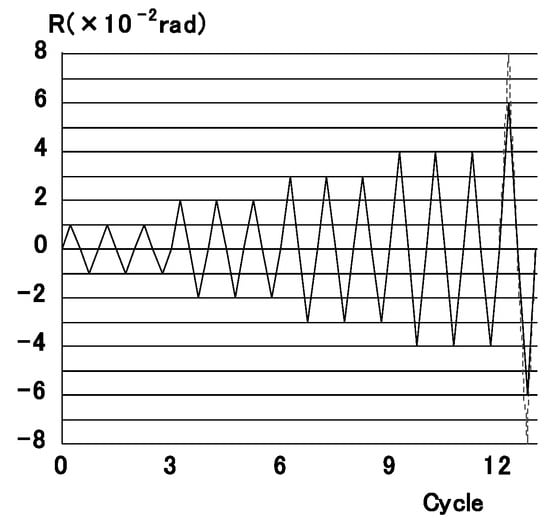
Figure 5.
Deformation histories.
Figure 6 shows locations for transducers and strain gauges. The eight linear variable differential transformers (LVDTs) are used to measure the deformations of the specimens. The four of them are set horizontally on both sides of the specimen to measure the drift angle R. Axial displacements are obtained from four LVDTs set vertically at four corners of the stub of the steel plate. A total of ten strain gauges are used for each specimen. The gauges are available for the post-elastic range and are grouped into A and B. The gauges in group A glued on the flange longitudinally are used to measure the curvatures of the top and bottom of the specimen. If the strains in group A attain the yield strain, the specimen is judged to be yielding in flexure at this point. The three-axis gauges in group B, glued on the web, are used to determine two-dimensional stress tensors. From the stress tensor, von Mises stress σe is calculated by Equation (1).
where σθ, σz are normal stresses of horizontal and vertical directions. τθz is the shearing stress. They are obtained from the strain data on the web of specimens. If the value of σe attained the yield stress, the specimen is judged to be yielding in shear.
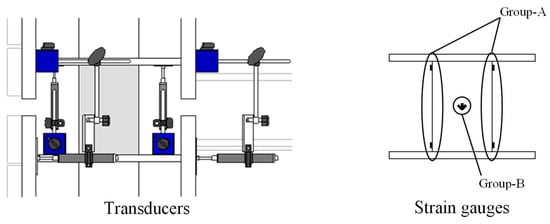
Figure 6.
Locations of transducers and strain gauges.
3. Experimental Results
The relations between shearing force Q and drift angle R are shown in Figure 7. The symbol ○ is the coordinate (Qy, Ry), which indicates the occurrence of yielding in shear. The loading tests for N75-2, N75-3, A75-1, A75-2, and A75-3 yield in shear during the loading to R = 2.0/100 rad. before the observation of flexural yielding; then, the shearing forces of the specimens increase according to the increases of the displacements. N75-1 occurs shearing and flexural yielding at the same deformation. N75-4 and A75-4 attain their maximum strengths Qmax around R = 3.0/100 rad., and then slight decreases in strengths are observed. Only N75-4 yields in flexure before the shear-yielding occurs.
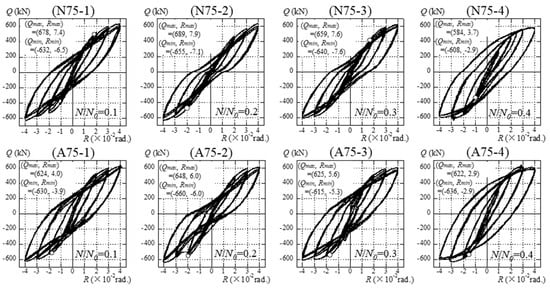
Figure 7.
Relations between shearing force Q and drift angle R.
Figure 8 shows the pictures of the inner concrete of N75-1 and A75-1 after the tests. Both have clear diagonal cracks, which show typical shearing failure.
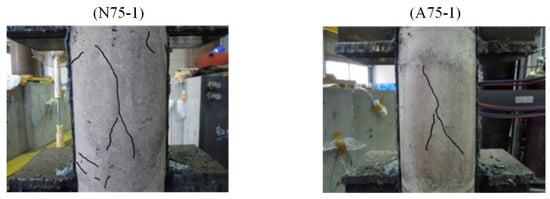
Figure 8.
Cracks on inner concrete after test.
The test specimens do not have fractures or cracks at the welded parts or on the surface of the steel tubes. This indicates that the test specimens successfully exhibited shearing or flexural capacities. It is difficult to clearly distinguish the failure modes of shear and flexure. Comparisons between the shearing capacities and flexural capacities are discussed in Section 6, entitled “Comparisons of Test, Analysis and Calculation”.
4. Finite Element Model for Analysis
An analytical investigation of the test specimens was carried out using finite element code DIANA version 9.5. The feature of the program includes the modified compressive theory for concrete []. The purpose of the analysis is mainly to estimate each of the shearing forces that the steel tube and the inner concrete sustained in the tests. The material properties of the concrete and steel are listed in Table 2 and Table 3. The property of the interface element between the steel tube and the inner concrete is shown in Table 4. The concrete is modeled by solid elements. A total strain crack model based on the modified compression field theory is used for the nonlinear constitutive law. The tensile properties of the concrete are shown in Figure 9. The tensile strength is calculated by the expression appearing in “Design Guidelines for Earthquake Resistant Reinforced Concrete Building Based on Inelastic Displacement Concept” [], published by AIJ. The Hordjik model [] is used for the tension-softening function. The tensile fracture energy Gf is calculated by the expression used among “Standard Specifications for Concrete Structures” [], published by JSCE. The compressive properties of the concrete are shown in Figure 10. The Feenstra model [] is used to determine the compressive properties. The compressive fracture energy Gc is estimated by the expression of Nakamura and Higai []. The steel tube and the web of the stub are modeled by curved shell elements with four nodes. The flange of the stub is modeled by solid elements. A bilinear model, shown in Figure 11, is used for the material properties of the steel. The yield stress is determined by the von Mises yield criterion. The Coulomb friction model is used for the interface element between steel and concrete, as shown in Figure 12. The analytical properties of the interface elements used for the CFST column by Komuro et al. [] are adopted.
Table 2.
Material properties of concrete.
Table 3.
Material properties of steel.
Table 4.
Properties of interface between steel tube and concrete.
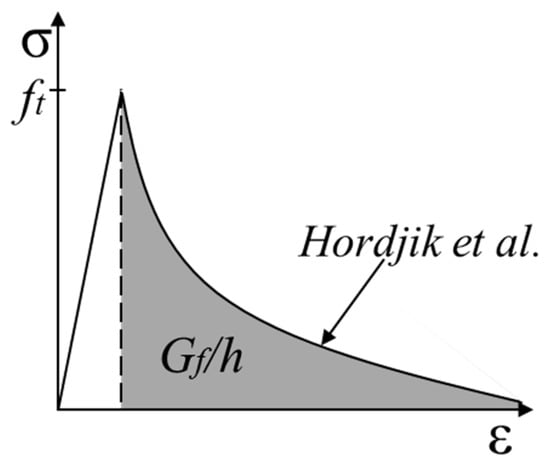
Figure 9.
Tensile properties of concrete [].
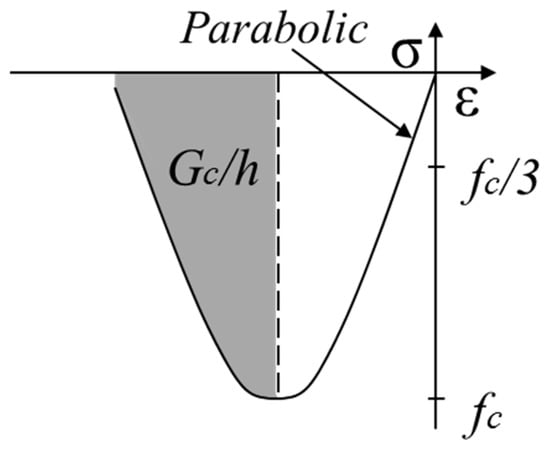
Figure 10.
Compressive properties of concrete.
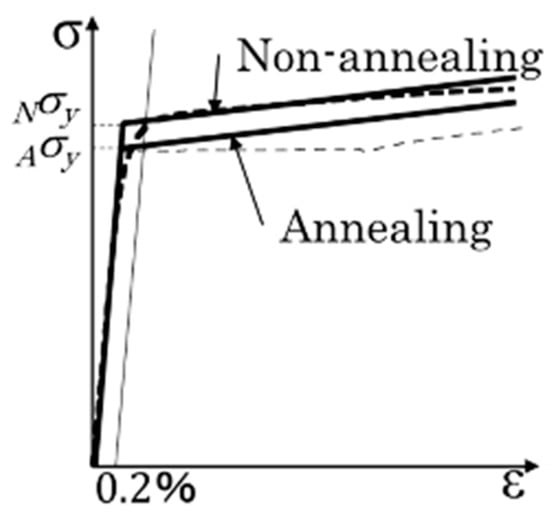
Figure 11.
Material properties of steel.
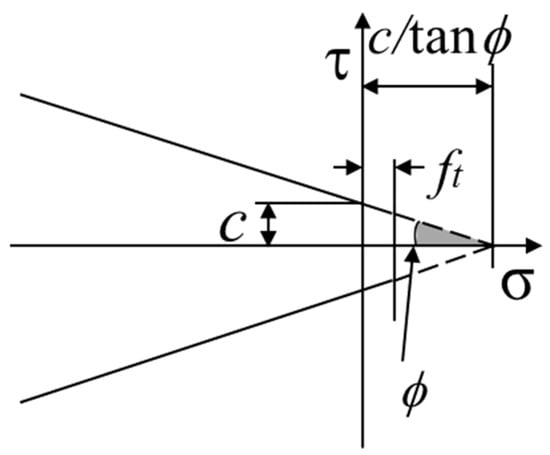
Figure 12.
Coulomb–friction model.
The components of the FEM analysis are illustrated in Figure 13. Half of the entire specimen is investigated because the specimen is symmetrical in the Z–X plane. Spring elements are installed at the center section of the specimen to measure the shearing forces of the steel tube and the inner concrete directly.
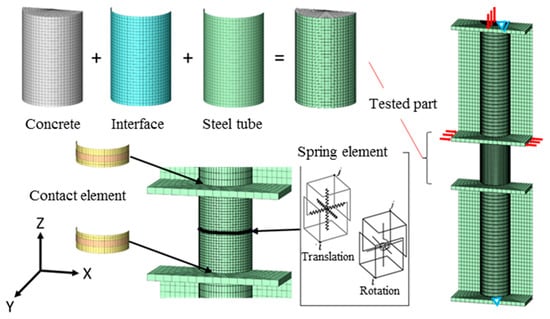
Figure 13.
Finite element model for analysis.
A 0.4 mm clearance is provided between the steel tube and the flanges of the stubs because the diameter of the steel tube is 165.2 mm and the diameter of the hole of the flanges is 166 mm. There are gaps between the steel tube and flange of the stubs; hence, they are not welded at the sides of the test part but are welded at the sides of the stub parts. The authors intend to avoid the influence of welding heat on the critical section, as shown in Figure 1.
Contact elements are used in the clearance between the steel tube and the flange. Spring elements with high stiffness are used in the welded parts.
The axial force is applied at the top of the specimen. Lateral displacements are applied in opposite directions at the upper and lower flanges. The lateral displacements are given to the drift angle of R = 4/100 rad. in the X-axis direction. The drift angle R is obtained by dividing the relative displacements between the two flanges by the clear heights of the specimens. Displacements of all nodes on the Z–X plane are zero in the Y-direction. The central node at the top of the specimen is fixed in the X-direction. The central node at the bottom of the specimen is fixed in both the X and Z directions.
5. Analytical Results and Discussions
The relations between the shearing force Q and drift angle R are shown in Figure 14. The dotted lines show the experimental results, and the solid lines show the analytical results. The symbols △ and ○ indicate the occurrences of flexural and shearing cracks in the inner concrete in the analyses. The symbols ▲ and ● indicate the flexural and shear yielding of the steel tub in the analyses. The symbol ▼ shows the analytical shear strength Qana.
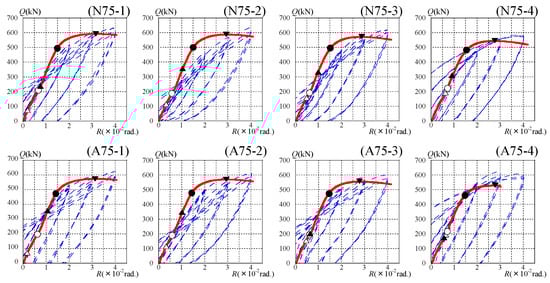
Figure 14.
Relations between shearing force Q and drift angle R in the analysis.
With respect to the crack of the inner concrete, shearing cracks are observed from around R = 0.6/100 rad. in the analyses. The shearing cracks appear after the observation of the flexural cracks. The increase in the axial force ratio delays the drift angle when the flexural crack appears. With respect to the yielding of the steel tube, the shear yielding occurs around R = 1.5/100 rad. The flexural yielding occurs prior to the shear yielding. These results contradict experimental results. It is noteworthy that the maximum strengths are exhibited after the shear yielding of the steel tube in both the test and analysis.
The initial stiffness in the test and the analysis generally agree. The maximum strengths of the analyses are smaller than those of the tests for all specimens. During the tests, the shearing force of the specimens gradually increases after R = 3/100 rad. On the other hand, in the analysis, the shearing force decreases after the peak at R = 3/100 rad. The difference is due to the strain hardening of the steel tube. Because the test is carried out under cyclic loading, the strain hardening rate of the test is greater than that of the analysis under monotonic loading.
Contour diagrams of minimum principal stress of the inner concrete of the N75-1 and N75-4 specimens are shown in Figure 15, where the shape of the compression strut is confirmed. Furthermore, the increase in axial force enhances the shearing capacity because the compression region becomes larger. Contour diagrams of the shearing stress of the steel tubes of N75-1 and N75-4 specimens are shown in Figure 16, where the increase in axial force decreases the shearing stress of the steel tube. When the specimens exhibit maximum strength, the shear yielding of steel tubes is confirmed.
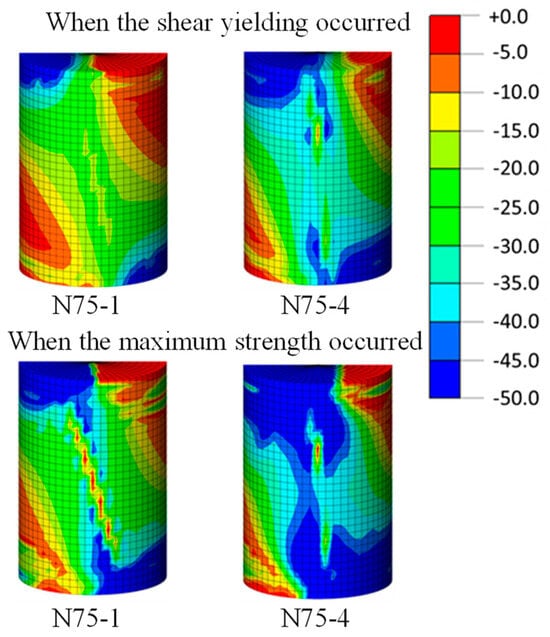
Figure 15.
Compressive stress contour of concrete.
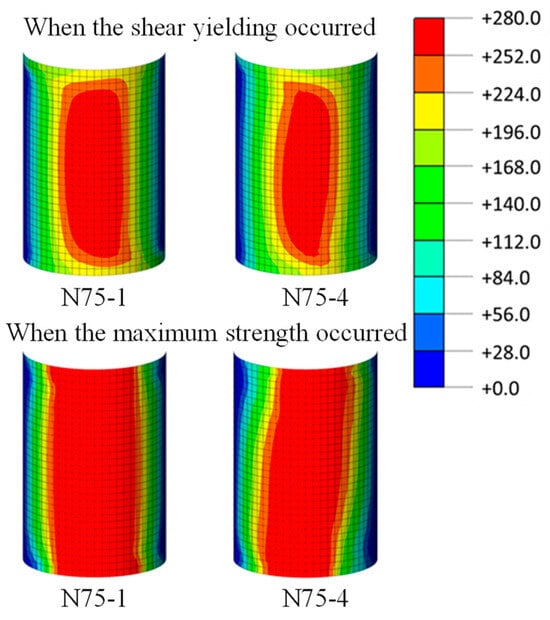
Figure 16.
Shearing stress contour of steel tube.
6. Comparisons of Test, Analysis, and Calculation
In Figure 17 and Table 5, the maximum strength of the test Q′max, the maximum strength of the analysis Qana, shearing capacity Qsu, and flexural capacity Qbu are compared. The values of Q′max are averages of the absolute values of Qmax and Qmin of the tests. The Qsu and Qbu are calculated using the methods defined in the CFST Recommendations in Japan. The Qsu is the generalized superposed strength, as shown in Equation (2).
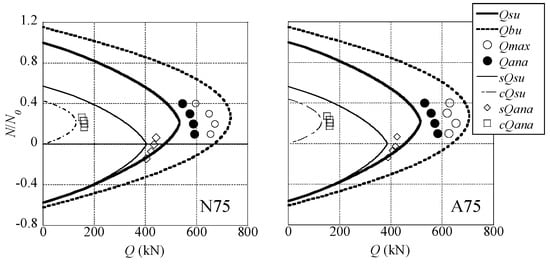
Figure 17.
Relations between axial force ratio and shearing capacity.
Table 5.
Comparisons of maximum strengths.
The shearing capacities of steel tube and inner concrete are calculated by CFST Recommendations and are shown as sQsu and cQsu. The experimental results of Q′max are greater than the analytical results of Qana and the calculated values of Qsu in all specimens. Because the average of the Q′max/Qana is 1.12, the analyses can safely evaluate the maximum strengths of the experiments in 12%. The average values of Qmax/Qsu and Qana/Qsu are 1.29 and 1.15. The standard deviations of each ratio are also shown in Table 5. This shows that the methods in the CFST Recommendations provide safe estimates of the shearing capacities. Both Q′max and Qana are lower than Qbu. This shows that the maximum strengths of the tests and analyses do not attain the full plastic states of the sections of the specimens, which are defined as the flexural capacities in the CFST Recommendations. The maximum strengths of the specimens are significantly affected by the shearing stress on the steel tube and inner concrete based on the observations of the tests and analyses. The comparisons between the test results and the design formulas suggest that all specimens fail in shear and exhibit their shearing capacities as the maximum strengths.
In Figure 17 and Table 6, the shear forces that the steel tube and inner concrete sustain at the maximum strength of the CFST are shown as sQana and cQana in the analyses and are compared with each other. sQana and cQana are estimated by integrating the bearing forces of the spring elements arranged in the middle surface of the specimen. The ratio of the shearing forces of the steel tube and inner concrete is approximately 7:3 for the specimens. sQana/sQsu is 1.10 on average, so sQsu safely evaluates the shearing strength of the steel tube. The average value of cQana/cQsu is 1.29; thus, cQsu underestimates the shearing strength of the inner concrete.
Table 6.
Comparisons between sQana, cQana, and sQsu, cQsu.
7. Conclusions
Shearing capacities and behaviors of short CFST columns have been experimentally and analytically investigated. In the experiments, eight specimens with a/D of 0.75 are subjected to cyclic shearing forces under a constant axial force. The main test parameter was the axial force ratio. Relations between the shearing force and drift angle were obtained through the tests. Then, a 3D-FEM analysis was carried out to trace the load versus deformation relations of each specimen of the tests. The maximum strengths of tests and analyses were compared to each other and to the shearing and flexural capacities calculated by the design formulas of “Recommendations for Design of and Construction of Concrete Filled Steel Tubular Structures” in Japan. The following conclusions were derived.
- In the tests, shear yielding of the steel tube was observed before each specimen exhibited the maximum strength. Diagonal cracks were observed in the inner concrete after the tests were conducted.
- The results of the 3D-FEM analyses traced the overall trend of the shearing force and drift angle relations obtained from the tests.
- The maximum strengths of the specimens obtained from the test and analysis were lower than the flexural capacities calculated by the CFST Recommendations in Japan. The load-carrying capacities of the CFST short columns were influenced by shearing forces.
- The maximum strengths of the tests were compared with the shearing capacities calculated by the CFST Recommendations in Japan. The maximum strengths of the tests were underestimated, with 29% errors. The value of the standard deviation of the ratio of the test and calculation was 0.034.
- The maximum strength of the tests was the evaluated safety, with a 12% error by the 3D-FEM analyses. The value of the standard deviation of the ratio of the test and analysis was 0.033.
Author Contributions
H.N. was responsible for study design. H.N., K.U. and Y.Y. were involved in experimental works, calculations, and data interpretation. All authors critically revised the report, commented on drafts of the manuscript, and approved the final report. All authors have read and agreed to the published version of the manuscript.
Funding
This research was founded by the Ministry of Education of Japan, Culture, Science, and Technology of Japan, under Grant-in-Aid for Young Scientists (B, No. 23760528, Representative: Hiroyuki Nakahara).
Data Availability Statement
The data that support the findings of this study are available from the corresponding author upon reasonable request.
Acknowledgments
The authors wish to express their thanks to H. Kubotera, technician of Kyushu University, and K. Kin and R. Tsumura, graduate students of Kyushu University, for their assistance in the experiment and preparation of this paper.
Conflicts of Interest
Author Yuto Yanai was employed by the company General Building Research Corporation of Japan. The remaining authors declare that the research was conducted in the absence of any commercial or financial relationships that could be construed as a potential conflict of interest.
References
- El-Tawil, S.; Bracci, J. Recent Findings from Phase V of the United States-Japan Cooperative Earthquake Research Program. ASCE J. Struct. Eng. 2004, 130, 155–156. [Google Scholar] [CrossRef]
- Goel, S.C. United States-Japan Cooperative Earthquake Engineering Research Program on Composite and Hybrid Structures. ASCE J. Struct. Eng. 2004, 130, 157–158. [Google Scholar] [CrossRef]
- Spacone, E.; EI-Tawil, S. Nonlinear Analysis of Steel-Concrete Composite Structures: State of the Art. ASCE J. Struct. Eng. 2004, 130, 159–168. [Google Scholar] [CrossRef]
- Varma, A.H.; Ricles, J.M.; Sause, R.; Lu, L.W. Seismic Behavior and Design of High-Strength Square Concrete-Filled Steel Tube Beam Columns. ASCE J. Struct. Eng. 2004, 130, 169–179. [Google Scholar] [CrossRef]
- Sakino, K.; Nakahara, H.; Morino, S.; Nishiyama, I. Behavior of Centrally-Loaded Concrete-Filled Steel Tube Short Columns. ASCE J. Struct. Eng. 2004, 130, 180–188. [Google Scholar] [CrossRef]
- Inai, E.; Mukai, A.; Kai, M.; Tokinoya, H.; Fukumoto, T.; Koji Morita, K. Behavior of Concrete-Filled Steel Tube Beam Columns. ASCE J. Struct. Eng. 2004, 130, 189–202. [Google Scholar] [CrossRef]
- Fujimoto, T.; Mukai, A.; Nishiyama, I.; Sakino, K. Behavior of Eccentrically Loaded Concrete-Filled Steel Tubular Columns. ASCE J. Struct. Eng. 2004, 130, 203–212. [Google Scholar] [CrossRef]
- Azizinamini, A.; Schneider, S.P. Moment Connections to Circular Concrete-Filled Steel Tube Columns. ASCE J. Struct. Eng. 2004, 130, 213–222. [Google Scholar] [CrossRef]
- Ricles, J.M.; Peng, S.W.; Lu, L.W. Seismic Behavior of Composite Concrete Filled Steel Tube Column-Wide Flange Beam Moment Connections. ASCE J. Struct. Eng. 2004, 130, 223–232. [Google Scholar] [CrossRef]
- MacRae, G.; Roeder, C.W.; Gunderson, C.; Kimura, Y. Brace-Beam-Column Connections for Concentrically Braced Frames with Concrete Filled Tube Columns. ASCE J. Struct. Eng. 2004, 130, 233–243. [Google Scholar] [CrossRef]
- Nishiyama, I.; Fujimoto, T.; Fukumoto, T.; Yoshioka, K. Inelastic Force-Deformation Response of Joint Shear Panels in Beam-Column Moment Connections to Concrete-Filled Tubes. ASCE J. Struct. Eng. 2004, 130, 244–252. [Google Scholar] [CrossRef]
- Nakahara, H.; Sakino, K. Hysteretic Behavior of Concrete Filled Steel Tubular Columns under Uniform Bending. ACI Int. Symp. Confin. Concr. 2006, 238, 289–304. [Google Scholar]
- Koester, B.D.; Uchida, K.; Noguchi, H.; Yura, J.A.; Jirsa, J.O. Panel-Zone Behavior of Moment Connections Between Steel Beams and Concrete-Filled Steel Tube Columns, Proceedings of the Structural Engineers World Congress, San Francisco, CA, USA, 18–23 July 1998; Elsevier Science: Amsterdam, The Netherlands, 1998. [Google Scholar]
- Noguchi, H.; Uchida, K. Finite Element Method Analysis of Hybrid Structural Frames with Reinforced Concrete Columns and Steel Beams. ASCE J. Struct. Eng. 2004, 130, 328–335. [Google Scholar] [CrossRef]
- Architectural Institute of Japan (AIJ). Recommendations for Design and Construction of Concrete Filled Steel Tubular Structures; Architectural Institute of Tokyo: Tokyo, Japan, 2008. [Google Scholar]
- Sakino, K.; Ishibashi, H. Experimental Studies on Concrete Filled Square Steel Tubular Short Columns Subjected to Cyclic Shearing Force and Constant Axial Force. AIJ J. Struct. Constr. Eng. 1985, 353, 81–91. [Google Scholar] [CrossRef][Green Version]
- Choi, K.K.; Xiao, Y. Analytical Studies of Concrete-Filled Circular Steel Tubes under Axial Compression. ASCE J. Struct. Eng. 2010, 136, 565–573. [Google Scholar] [CrossRef]
- Hu, H.T.; Huang, C.S.; Wu, M.H.; Wu, Y.M. Nonlinear Analysis of Axially Loaded Concrete-Filled Tube Columns with Confinement Effect. ASCE J. Struct. Eng. 2003, 129, 1322–1329. [Google Scholar] [CrossRef]
- Varma, A.H.; Sause, R.; Ricles, J.M.; Li, Q. Development and Validation of Fiber Model for High-Strength Square Concrete-Filled Steel Tube Beam-Columns. ACI Struct. J. 2005, 102, 73–85. [Google Scholar]
- Chiew, S.P.; Lie, S.T.; Dai, C.W. Moment Resistance of Steel I-Beam to CFST Column Connections. ASCE J. Struct. Eng. 2001, 127, 1164–1172. [Google Scholar] [CrossRef]
- Tort, C.; Hajjar, J.F. Mixed Finite-Element Modelling of Rectangular Concrete-Filled Steel Tube Members and Frames under Static and Dynamic Loads. ASCE J. Struct. Eng. 2010, 136, 654–664. [Google Scholar] [CrossRef]
- Roeder, C.; Lehman, D.; Heid, A.; Maki, T. Shear Design Expressions for Concrete Filled Steel Tube and Reinforced Concrete Filled Tube Components. WSDOT Research Report. Seattle, Washington. 2016. Available online: https://www.wsdot.wa.gov/research/reports/fullreports/776.2.pdf (accessed on 12 June 2016).
- Vecchio, F.J.; Collins, M.P. The Modified compression-Field Theory for Reinforced Concrete Elements Subjected to Shear. ACI J. 1986, 83, 219–231. [Google Scholar]
- Architectural Institute of Japan (AIJ). Design Guidelines for Earthquake Resistant Reinforced Concrete Building Based on Inelastic Displacement Concept; Architectural Institute of Japan: Tokyo, Japan, 2010. [Google Scholar]
- Hordjik, D.A. Local Approach to Fatigue of Concrete. Ph.D. Thesis, Delft University of Technology, Delft, The Netherlands, 1991. [Google Scholar]
- Japan Society of Civil Engineers (JSCE). Standard Specifications for Concrete Structures; Japan Society of Civil Engineers: Tokyo, Japan, 2012. [Google Scholar]
- Feenstra, P.H. Computational Aspects of Biaxial Stress in Plain and Reinforced Concrete. Ph.D. Thesis, Delft University of Technology, Delft, The Netherlands, 1993. [Google Scholar]
- Nakamura, H.; Higai, T. Compressive Fracture Energy and Fracture Zone Length of Concrete. In JCI-C51E Seminar on Post-Peak Behavior of RC Structures Subjected to Seismic Loads; Japan Concrete Institute: Tokyo, Japan, 2001; pp. 259–272. [Google Scholar]
- Komuro, M.; Kishi, N.; Zhang, G. Analytical Study on Load-Carrying of Partially Concrete-Filled Steel-Pipe Pier Models. JSCE J. Appl. Mech. 2003, 6, 475–486. [Google Scholar] [CrossRef]
Disclaimer/Publisher’s Note: The statements, opinions and data contained in all publications are solely those of the individual author(s) and contributor(s) and not of MDPI and/or the editor(s). MDPI and/or the editor(s) disclaim responsibility for any injury to people or property resulting from any ideas, methods, instructions or products referred to in the content. |
© 2024 by the authors. Licensee MDPI, Basel, Switzerland. This article is an open access article distributed under the terms and conditions of the Creative Commons Attribution (CC BY) license (https://creativecommons.org/licenses/by/4.0/).