Abstract
This study introduces a continuous pedestrian-bridge design utilizing a circular tube girder and brackets for extended spans. The flexural performance evaluation in the negative moment region focuses on the support section of the continuous pedestrian bridge. In this regard, a full-scale test unit of the negative moment region was fabricated for a loading test. The test unit consists of a circular steel-tube girder, loading plates, vertical steel plates, and support. Subsequently, a finite element analysis (FEA) was employed to compare with the loading test results. The experimental and FEA results showed that the stresses in the members of the proposed pedestrian bridge are within the allowable stresses under service load. However, local buckling was observed in the circular steel-tube girder adjacent to the vertical steel plate under ultimate loading. To prevent the local buckling in the girder and improve the flexural performance of the negative moment region, a parametric study was performed by increasing the filling ratio of concrete inside the girder. The load–deflection relationship of the parametric study indicates that filling the negative moment region of a circular steel tube with concrete has a structural effect. Consequently, based on these results, an optimal filling ratio for the proposed bridge is suggested.
1. Introduction
Conventional pedestrian bridges have a number of straight girders installed on the piers. Pedestrian bridges comprising straight girders have been extensively studied. Ali et al. [1] analyzed the dynamic performance of a pedestrian bridge composed of I-shaped steel girders and a bilayer composite deck made of cement and laminated glass. Mendes et al. [2] analyzed the effect of the height and thickness of a girder on the serviceability limit stated by FEA for a pedestrian bridge composed of I-shaped girders. Deng et al. [3] experimentally investigated the flexural performance of the girder-to-girder joint in an I-type straight girder bridge, considering both the conventional I-shaped joint and the T-shaped joint.
However, conventional pedestrian bridges using straight girders experience difficulties with girder-to-girder and girder-to-pier connections. Straight girders are difficult to connect between girders when curved sections are constructed. This challenge adds unnecessary processes, such as modifying the girder length during construction at the site. Furthermore, the simply supported pedestrian bridges have a maximum span of 5000 mm to 7000 mm because of the positive moment in the center of the bridge. In addition, due to the increased number of substructures, the construction cost increases, and the urban aesthetic is harmed.
To address these limitations, Cho et al. [4] proposed a pedestrian bridge consisting of a circular steel-tube girder and analyzed the fatigue behavior through experiments and FEA. This study proposes a continuous pedestrian bridge based on a circular steel-tube girder and steel brackets for a long span. The proposed pedestrian bridge can simplify construction by using a circular steel tube as a main single girder and installing steel brackets at regular intervals. The single circular steel-tube girder can improve the constructability of curved sections, and it facilitates the connection of the girders and piers of the pedestrian bridge. Furthermore, the brackets constructed on top of the circular steel-tube girder can be rapidly constructed at the site by bolting.
The construction steps of the proposed pedestrian bridge are explained in Figure 1. The proposed pedestrian bridge, for which shoes, support, and vertical steel plates are installed on the pier, is shown in Figure 1a. The proposed bridge comprises a circular steel-tube girder and steel brackets, as illustrated in Figure 1b. In addition, as shown in Figure 1c, the pedestrian bridge utilizes a circular steel tube as a main girder and supports the slab with steel brackets installed transversely.

Figure 1.
Construction step of the proposed pedestrian bridge: (a) install the bridge pier with shoes, a support, and vertical steel plates; (b) place a circular steel-tube girder and brackets; and (c) stage of completion.
The proposed pedestrian bridge has a continuous type and allows for a span of more than 15,000 mm because a negative moment occurs in the support. As the span of the pedestrian bridge increases, the number of substructures can be reduced to improve the sense of openness underneath. However, according to many studies, continuous bridges must be structurally evaluated because they are subject to tensile stress in the negative moment regions [5]. Therefore, the flexural performance of the negative moment region in the proposed pedestrian bridge must be further investigated.
Several analytical and experimental studies have been conducted to examine the negative moment region performance of continuous bridges. Liu et al. [5] experimentally studied the flexural behaviors in the negative moment region using concrete-filled rectangular tubular composite truss beams. In the experiment, the load-deflection response, crack development, ultimate bearing capacity, and strain distribution in the truss beams were measured. For the purpose of the practical design, the formulae were derived to predict concrete crack width under the serviceability limit state. Joo et al. [6] analyzed the structural behavior of the negative moment region of a continuous bridge with high-strength steel through FEA and experiments. The results showed that applying high-strength steel increased the yield strength of the steel and decreased the bending ductility due to the decrease in plastic deformation ability. Xu et al. [7] proposed using double composite girders to reduce the effect of local buckling in the negative moment region. The girder proposed in this study and the conventional continuous composite girder were fabricated to verify the performance of the double composite girder through experiments. The result of comparing the crack behavior, strain, and other properties obtained in the experiments indicated that the negative moment region performance of the double composite girder was increased. Fan et al. [8] conducted an experimental study on the mechanical performance of the negative moment region in continuous steel–concrete composite girders, considering parameters in the shape of the web and the type of concrete. In the experimental results, the main failure phenomenon observed was local buckling. The fatigues for the steel element of integral bridges were studied [9].
The flexural performance of the proposed pedestrian bridge in negative moment regions is experimentally and numerically investigated in this study. The deflection of the girder was analyzed by applying a load to both ends of the circular steel tube of the proposed pedestrian bridge. Moreover, the stress distribution of the circular steel-tube girder and the vertical steel plate on the support was examined by increasing the load in the test unit. The stresses of the proposed pedestrian bridge were researched based on the allowable stresses of SM490 steel presented by AASHTO [10] and the Korea Road Transportation Association [11]. This study aims to investigate the long-span and continuous bridge type of the proposed pedestrian bridge using a circular steel-tube girder.
In addition, the effect of the filling ratio of concrete inside the girder was numerically investigated to improve the flexural performance of the negative moment region. Various studies have been conducted to improve the structural performance of bridges by filling steel tubes with concrete. The structural characteristics of a concrete-filled tube (CFT) were investigated by the experiment and numerical analysis [12,13]. Lu et al. [14] performed FEA to investigate the flexural performance of circular concrete-filled thin-walled steel tubular (CFST) beams. The study investigated the stress and strain distributions in the composite section and analyzed the composite action between the steel pipe and the concrete. The results indicated that the method of filling the CFST beams with concrete increased the structural performance of the structure. Tang et al. [15] conducted an experimental and analytical analysis of the flexural performance of CFT structures considering the diameter of the steel tube and the ratio of in-filled steel-slag micropowder ultra-high-performance concrete (UHPC). In this study, the load–deflection relationship according to the filling ratio of concrete was analyzed through the FEA model in a parametric study. Finally, the optimum filling ratio of concrete in the negative moment region is derived.
2. Experimental Program
2.1. Experiment Overview
The structural analysis was performed in this study to analyze the global behavior of a three-span pedestrian bridge with a total length of 50,000 mm (15,000 mm + 20,000 mm + 15,000 mm) to design a test unit. The design load was set to HS-15, considering the maintenance vehicles on the bridge [16]. As a result of the analysis, the negative moment of the continuous bridge occurred up to 3500 mm on either side of the support. The negative moment diagram of a continuous pedestrian bridge is a polynomial curve, and it is difficult to accurately implement the negative moment region in the test unit. Therefore, it was assumed to be a test unit with a linear bending moment diagram that occurs in a simple bridge type. The maximum moment at this time was converted to a load using the following Equation (1):
where is the applied maximum load, is the maximum moment obtained from the structural analysis, and L is the length of the test unit. The aim of this experiment is to examine the behavior in the negative moment region. Therefore, a loading test was performed in which the girder was loaded at both ends. Therefore, the service load was determined by dividing the maximum load equivalent to Equation (1) by 1/2. The service load needs to be evenly distributed to both ends to induce the maximum negative moment.
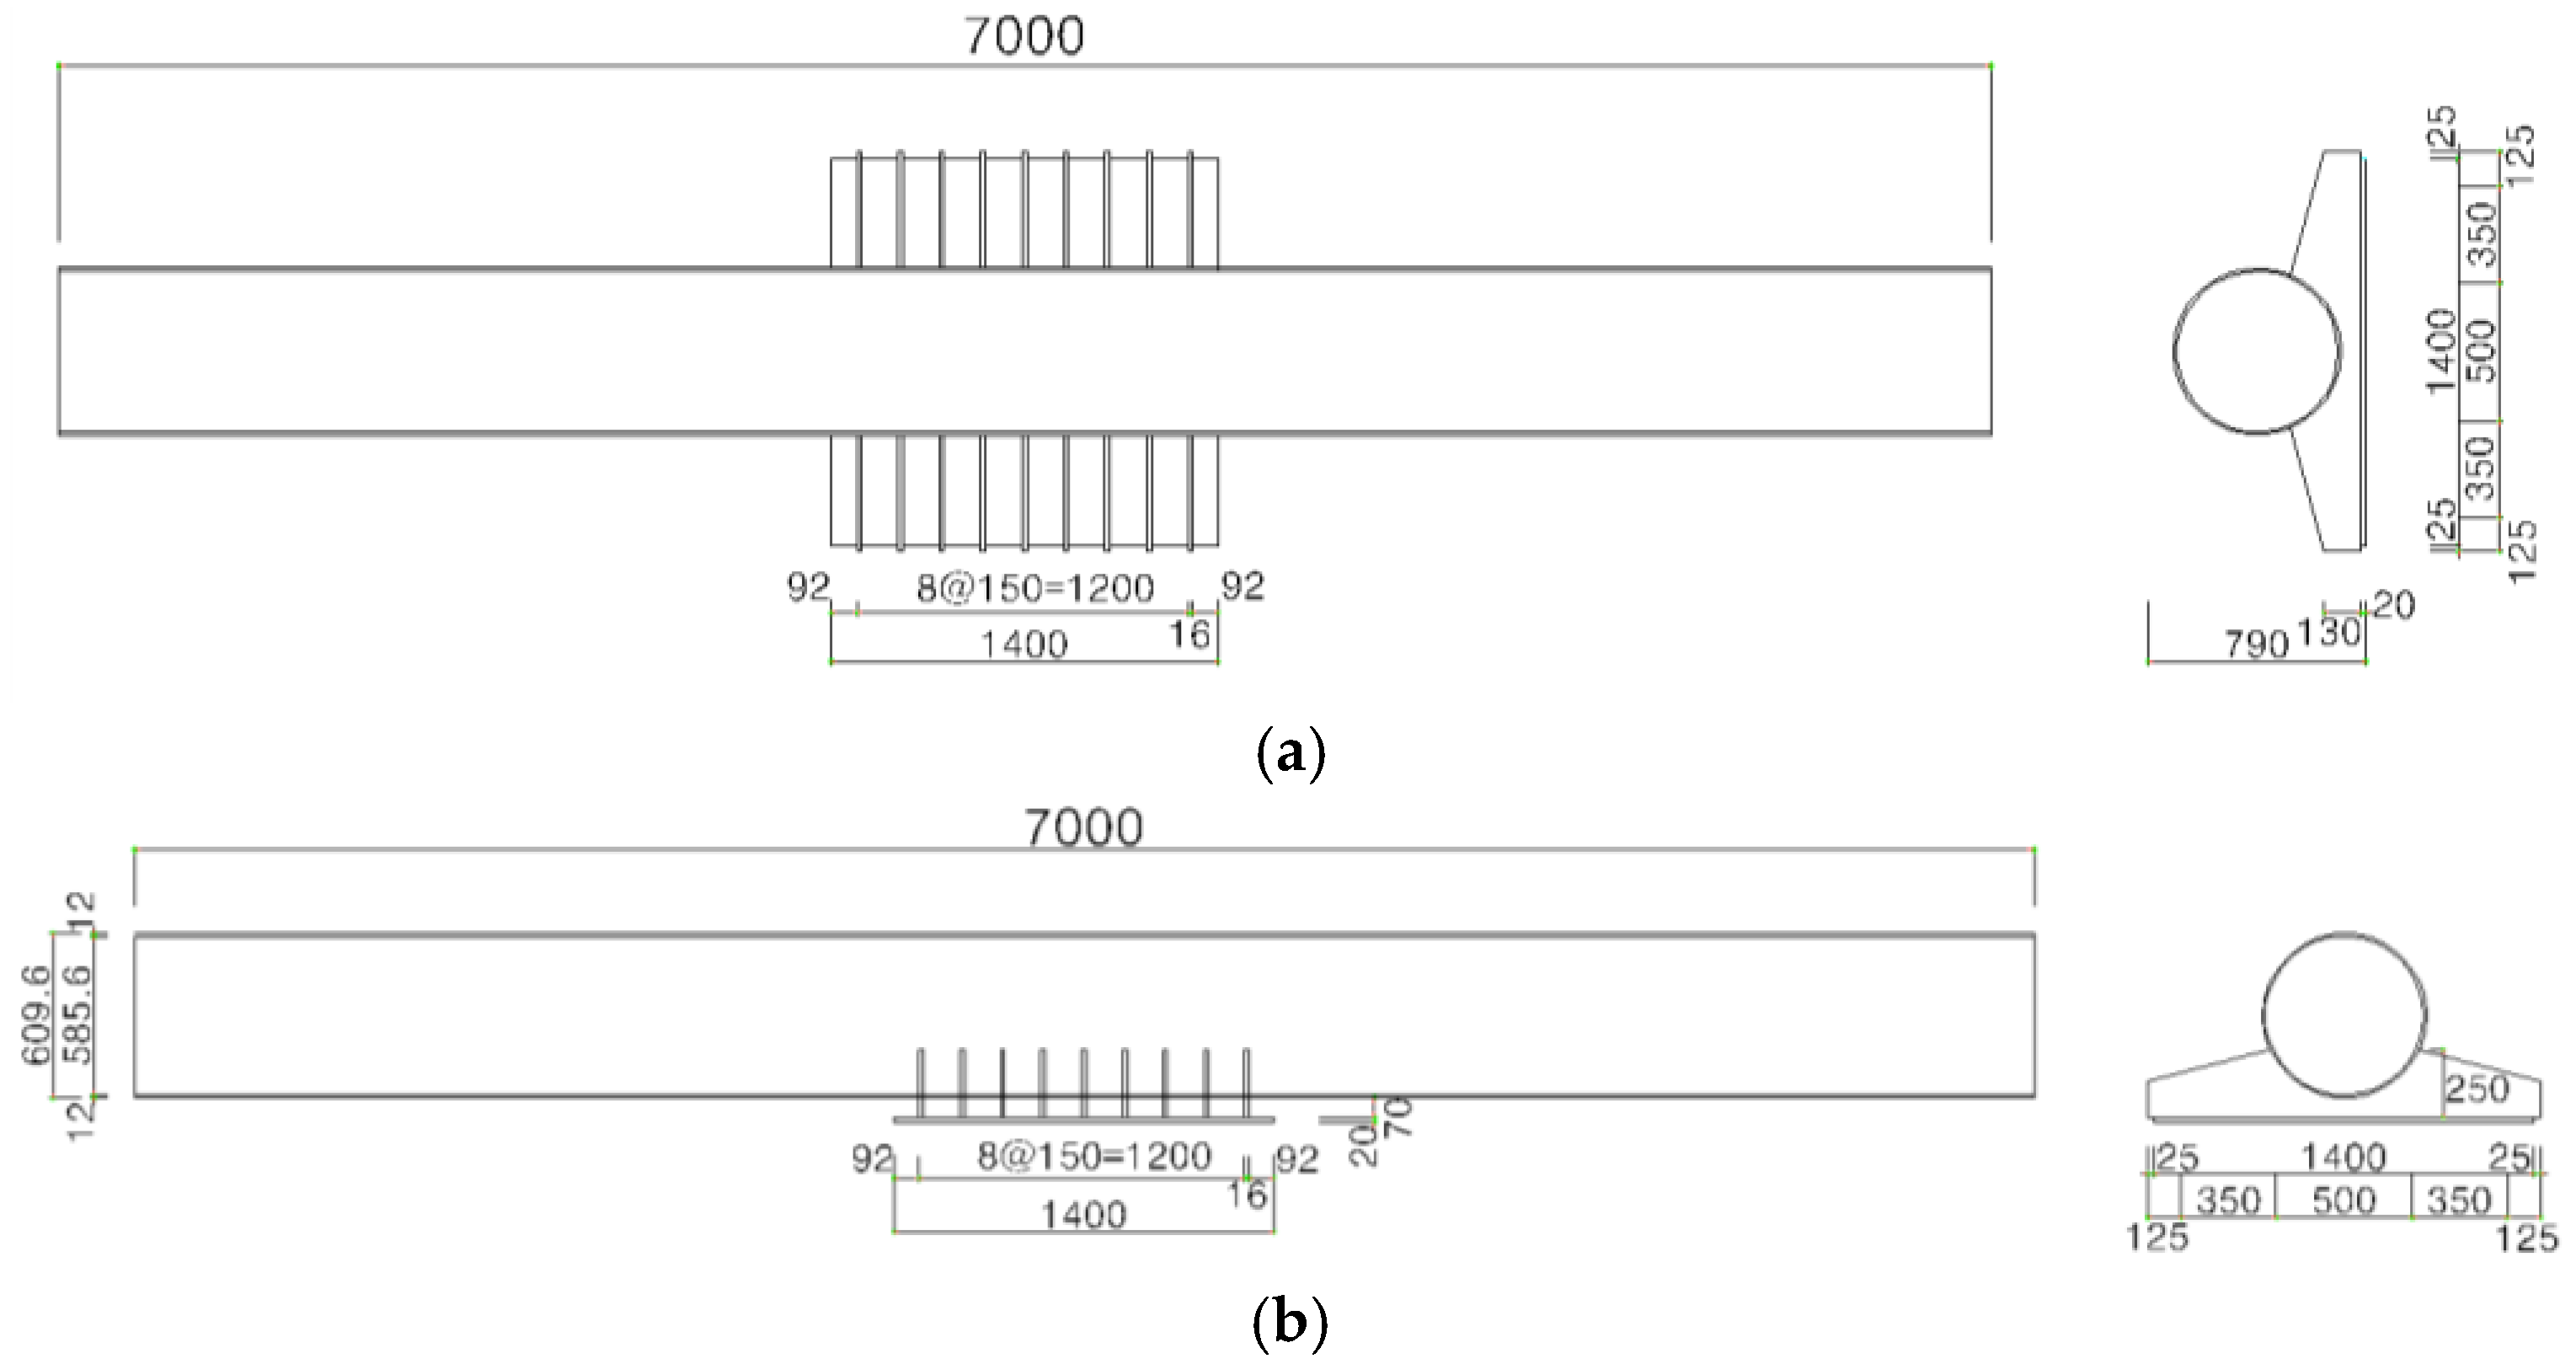
The calculated service load was 175 kN. The test unit comprises a circular steel-tube girder, vertical steel plates, and support, excluding brackets and piers, as illustrated in Figure 2. The strain generated at the main members and the deflection of the circular steel-tube girder were measured.
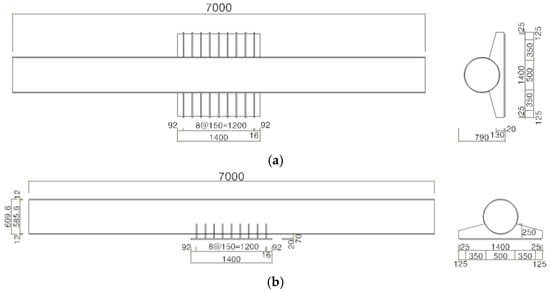
Figure 2.
Test unit (unit: mm): (a) Top View and (b) Front View.
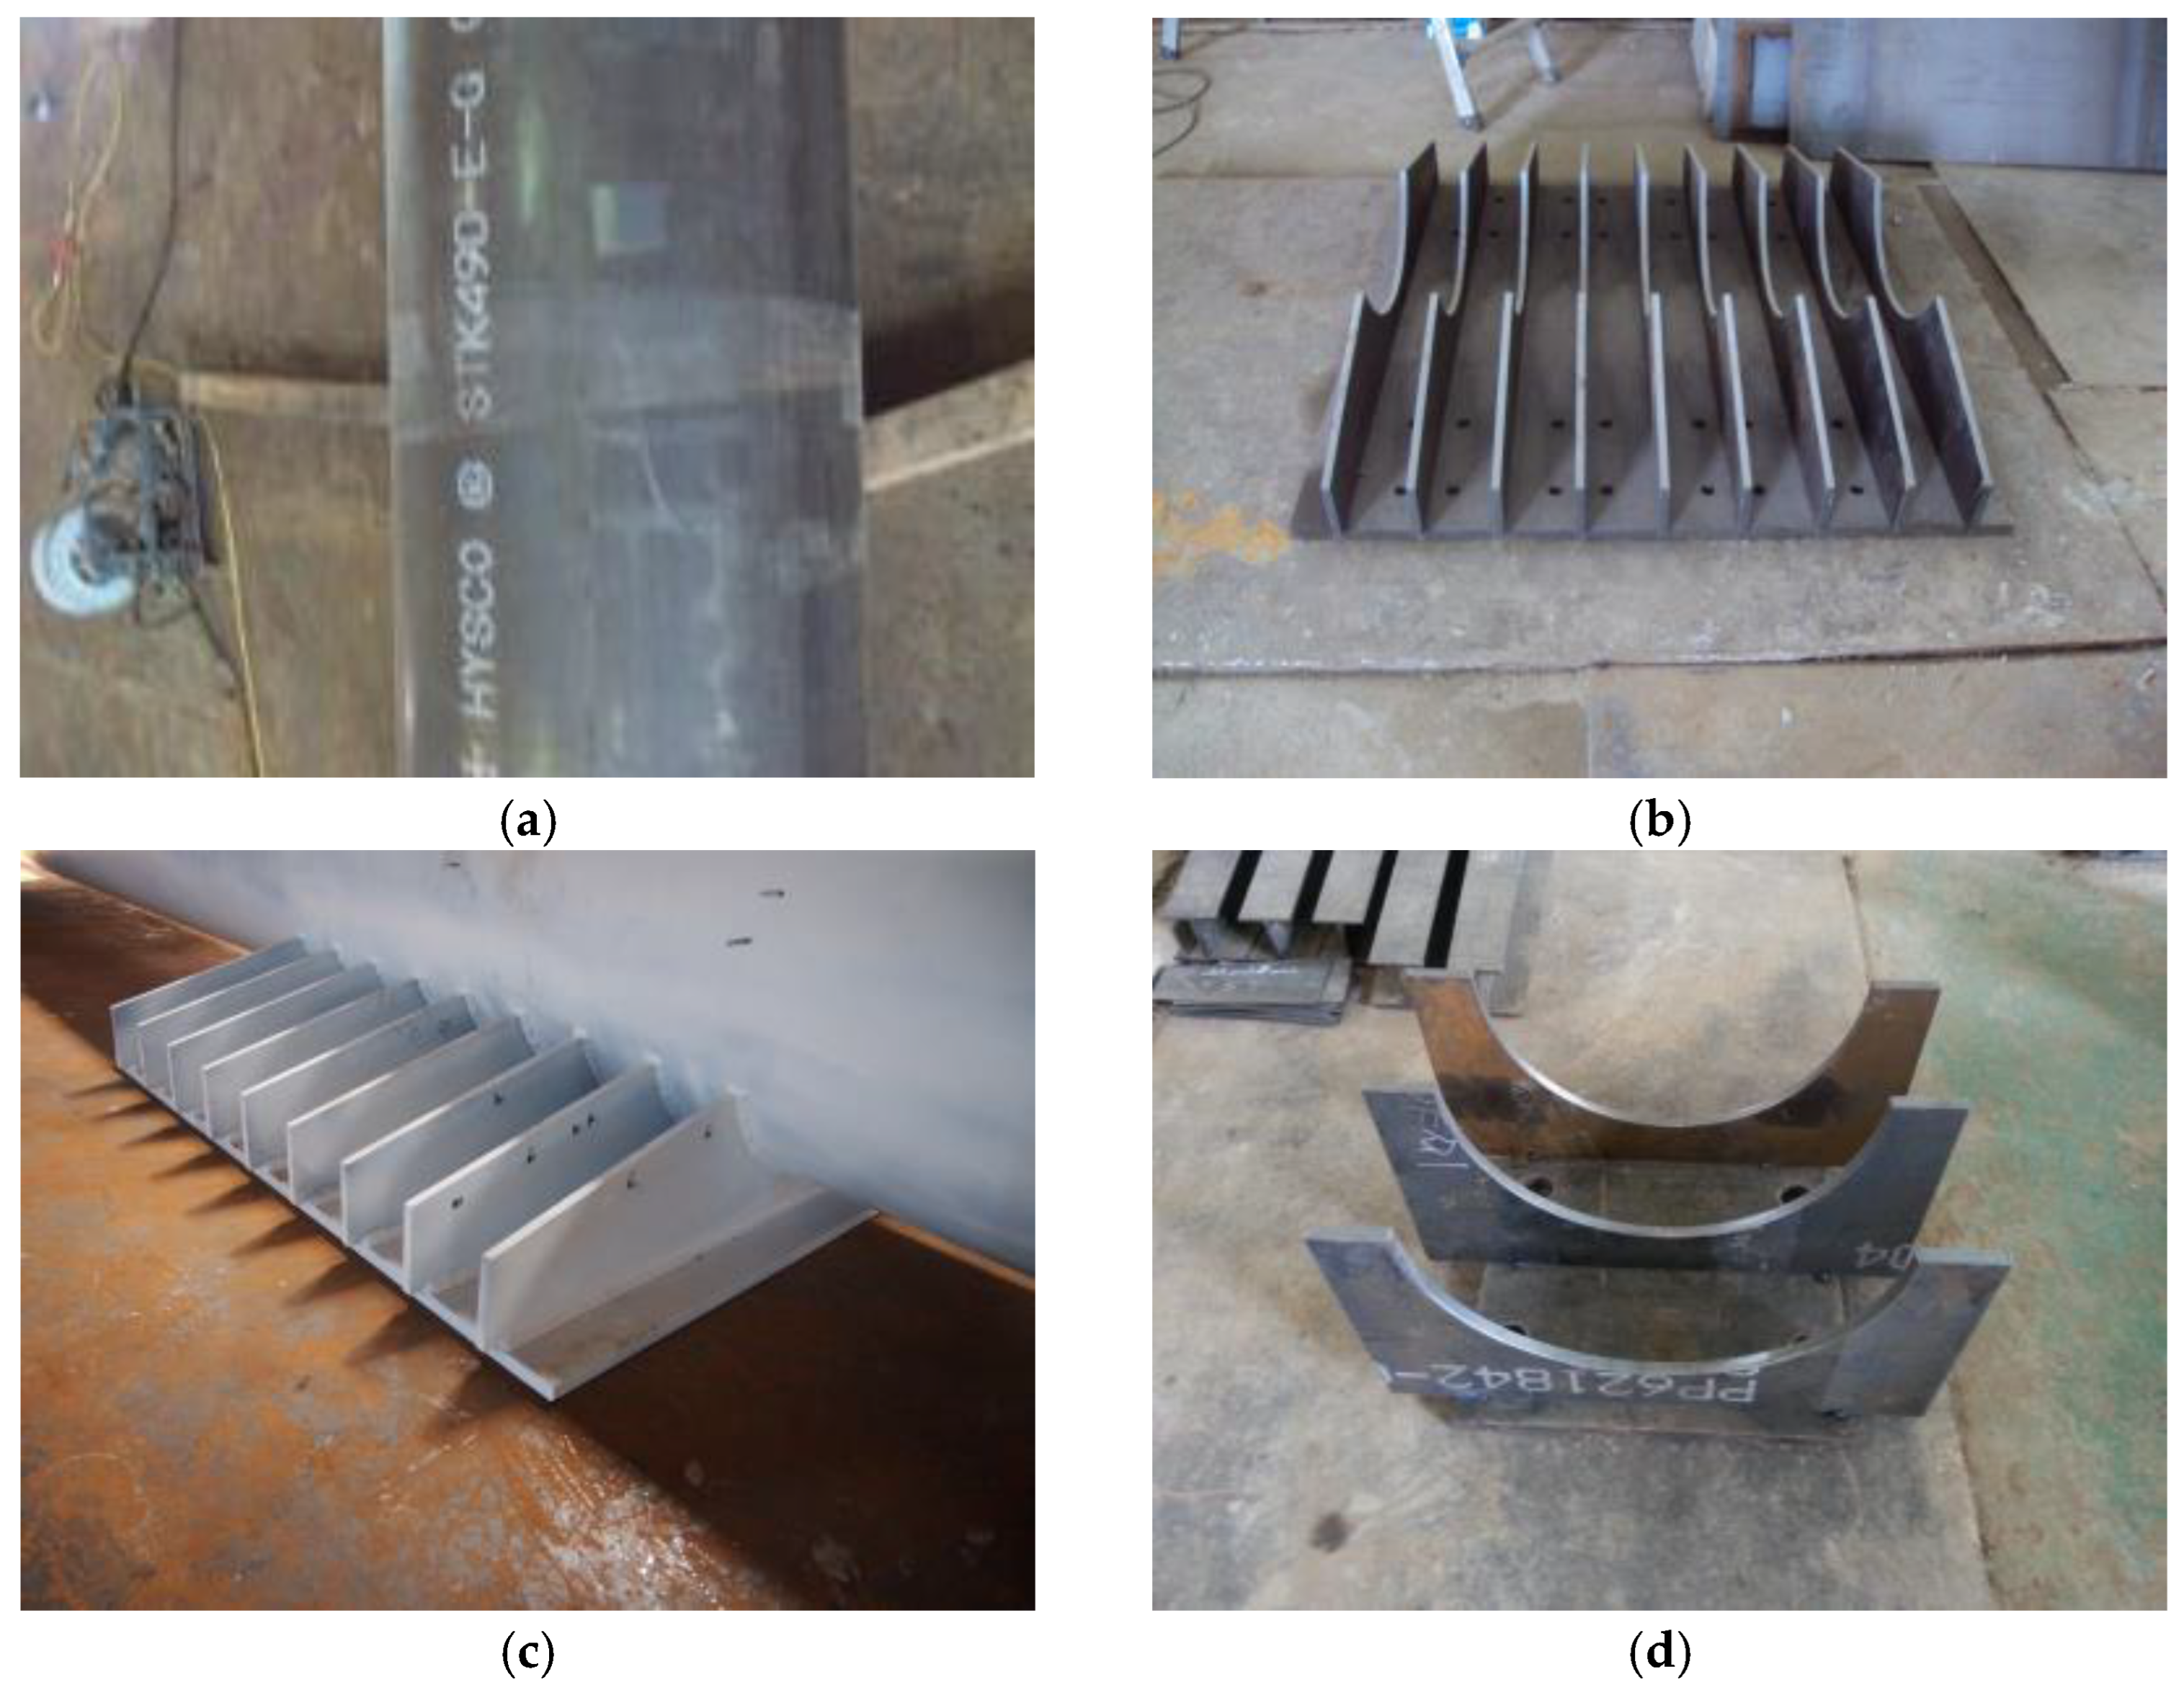
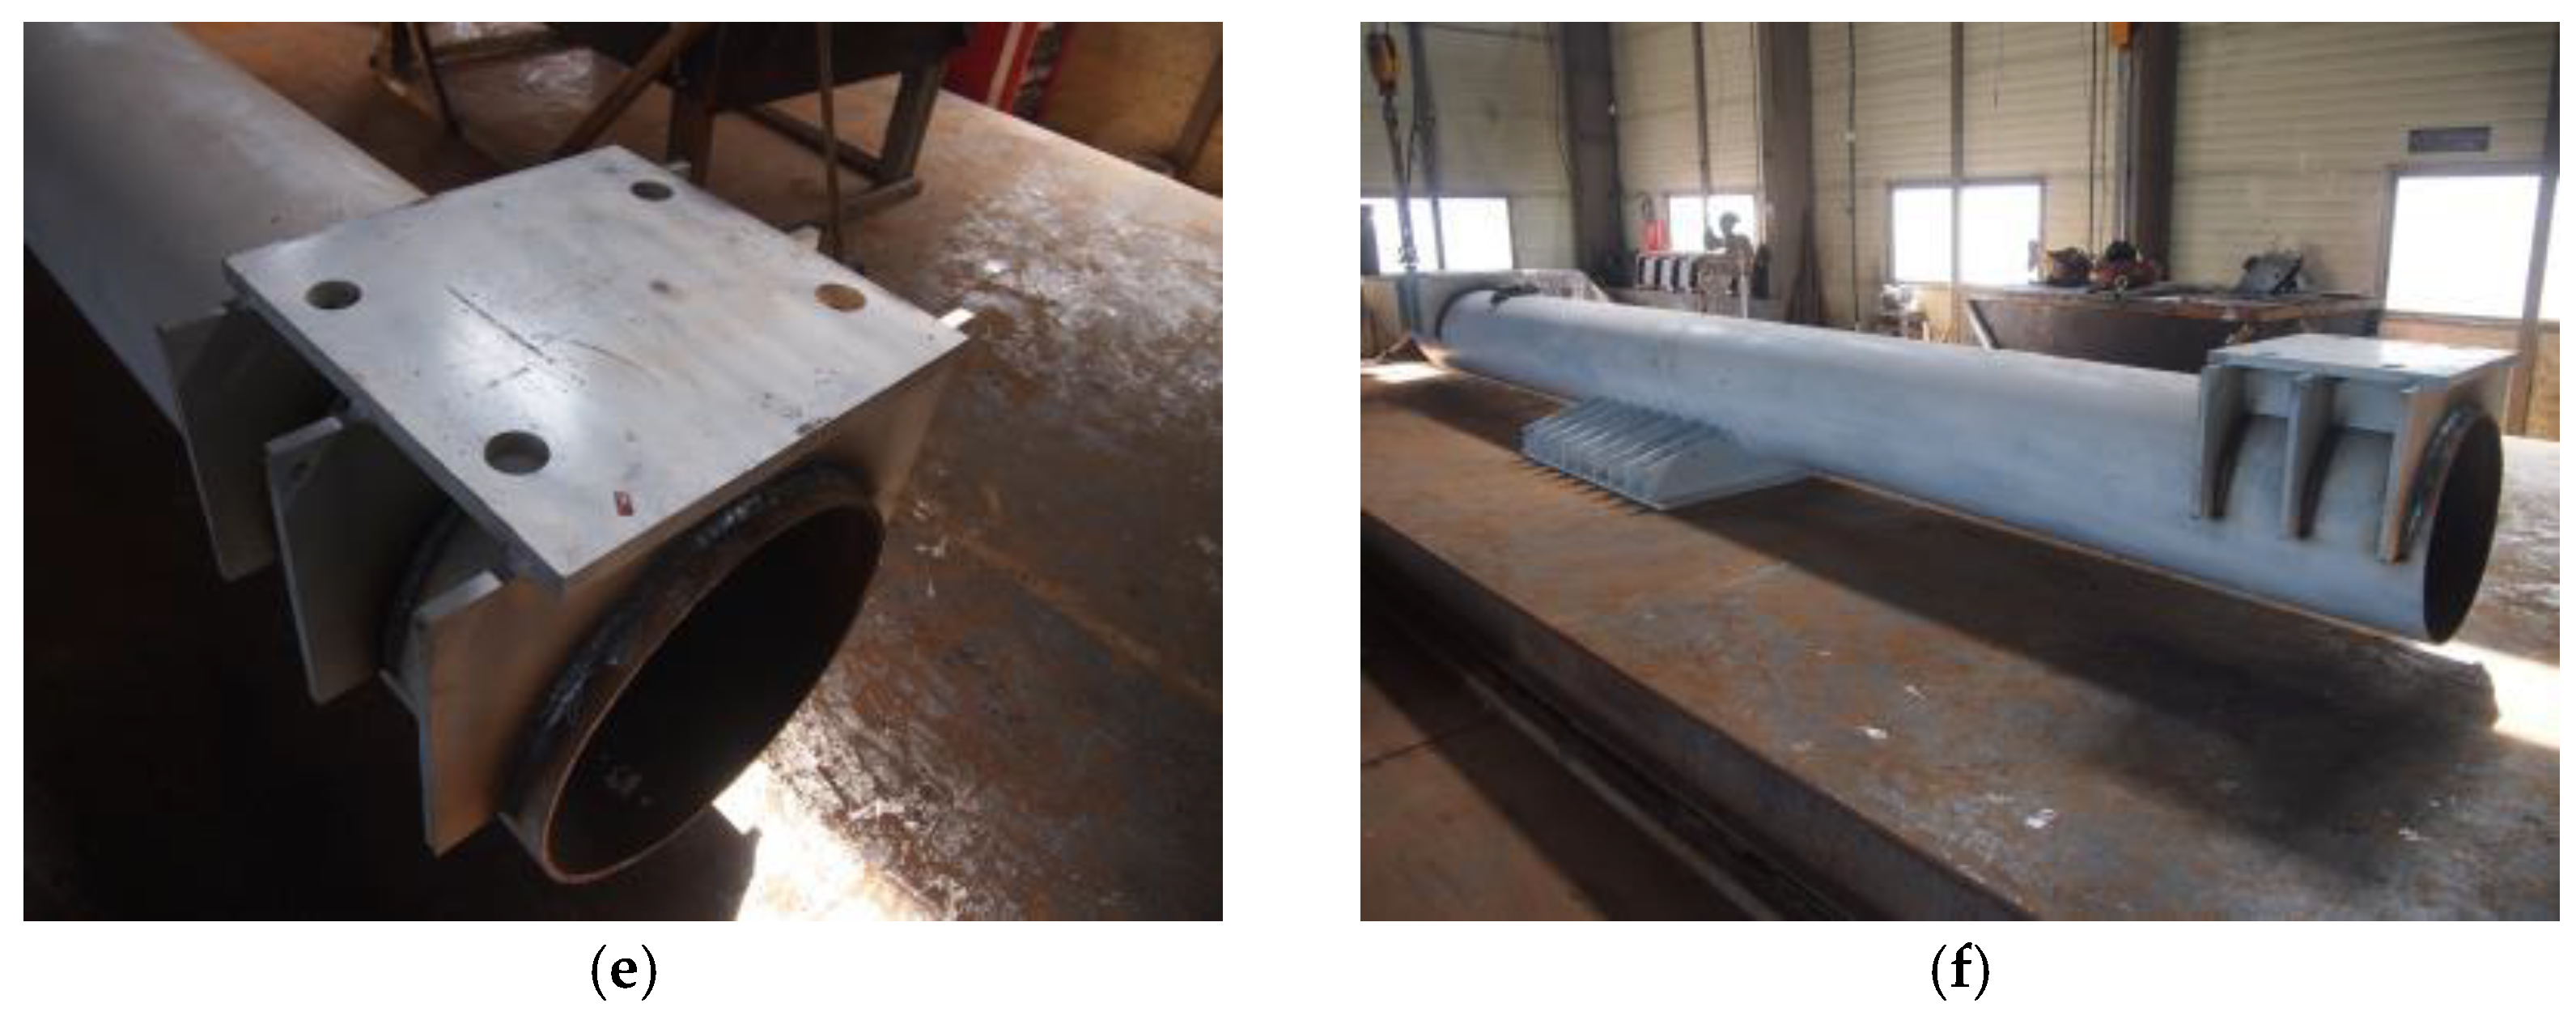
The circular steel tube used in this experiment had a length of 7000 mm and a diameter of 609.6 mm, as shown in Figure 3a. The yield strength of the circular steel tube is 315 MPa and the tensile strength is 490 MPa [17,18,19]. To support the circular steel-tube girder, a 1400 mm × 1400 mm support was fabricated, and 9 vertical steel plates with a width of 1400 mm and a maximum height of 250 mm were fabricated and welded at 150 mm intervals, as shown in Figure 3b. Figure 3c shows the vertical steel plates welded to the center of the fabricated circular steel-tube girder. Figure 3d shows the loading plate where the equivalent loads are applied. The loading plate was designed to accommodate the circular shape of the girder. Figure 3e shows the welding of the girder and the loading plate. Inspection of the welds was performed to verify the integrated behavior of each test specimen. Finally, the test unit was completed, as illustrated in Figure 3f.
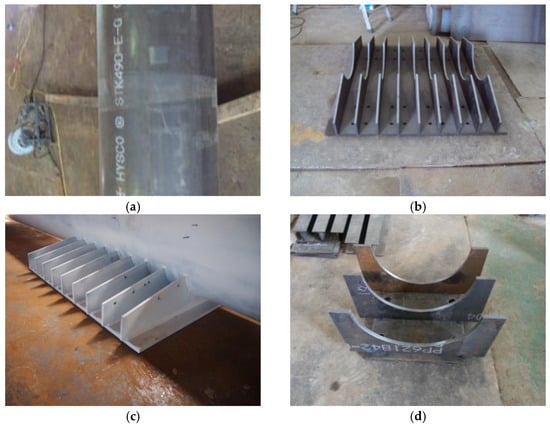
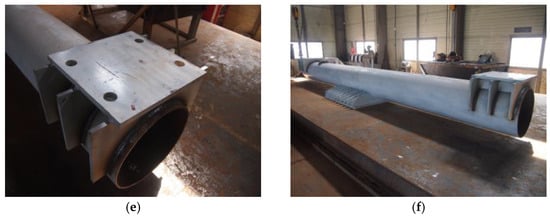
Figure 3.
Fabrication of the test unit: (a) circular steel-tube girder; (b) vertical steel plates and support (c) welding of girder and vertical steel plates; (d) production of loading plate; (e) welding of the girder and loading plate; and (f) completion of the test unit.
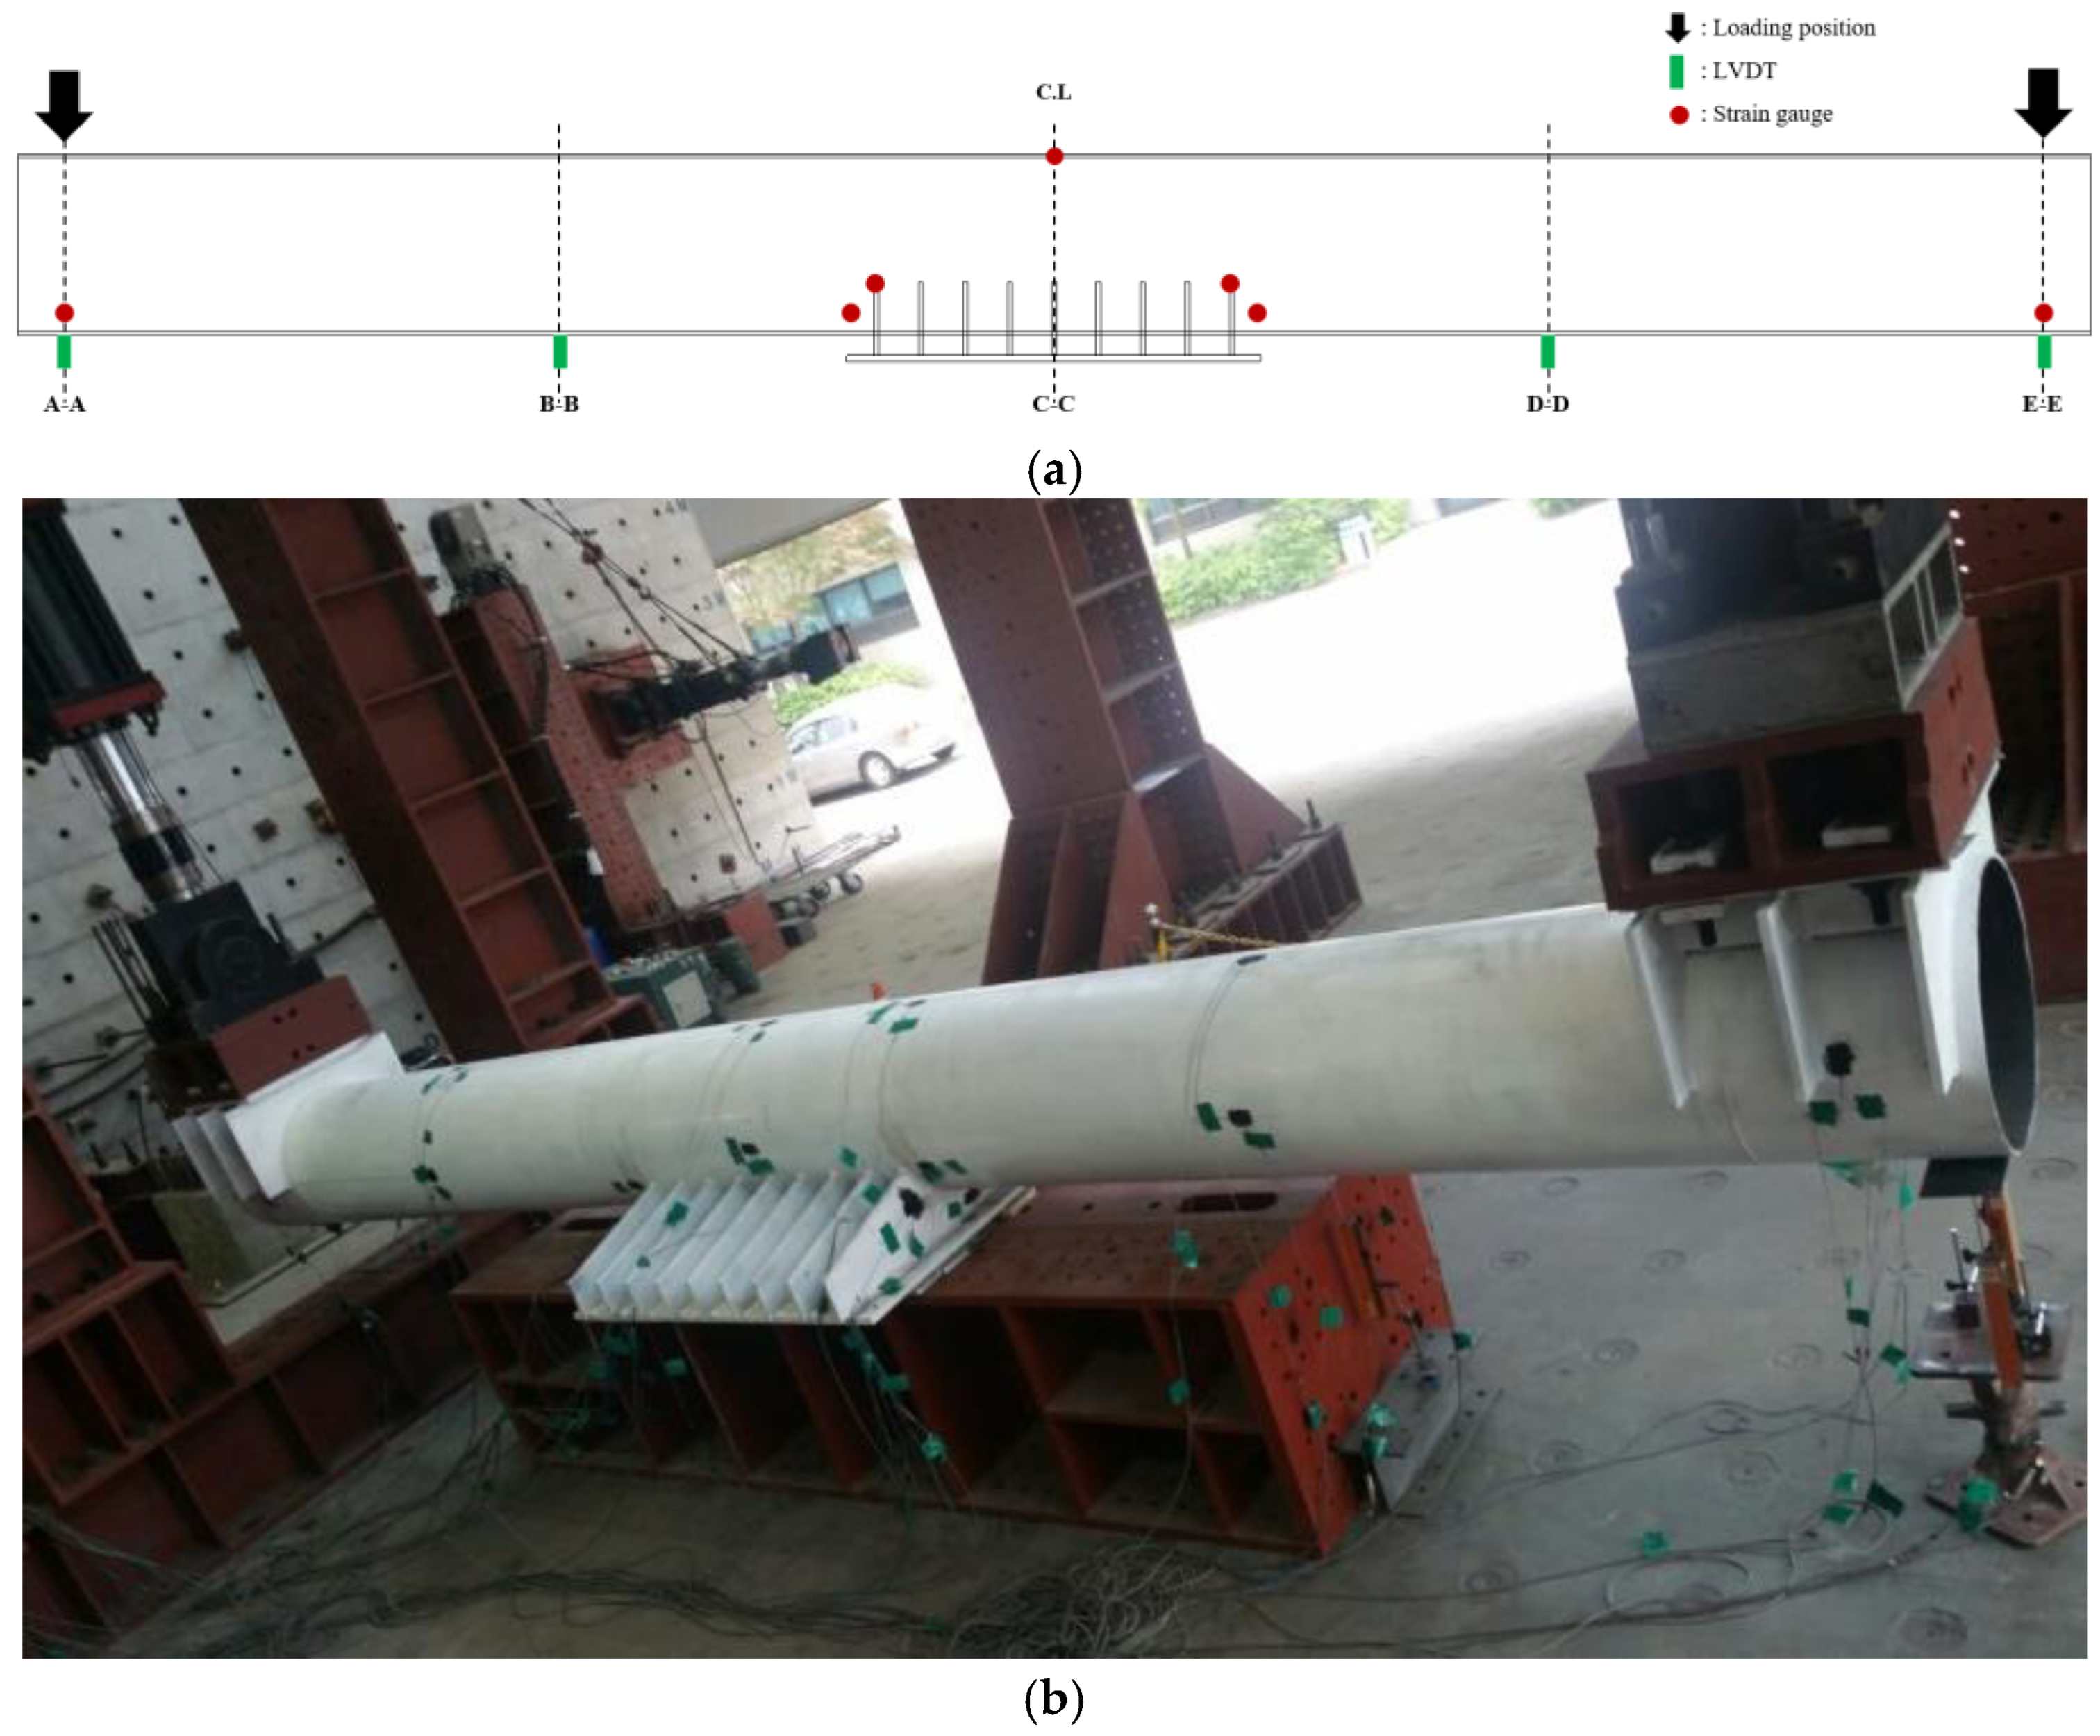
The test unit was experimented with using two actuators with a capacity of 2000 kN, as shown in Figure 4a. The installation spacing was maintained at 6500 mm, considering the width of the actuators, and the test unit was installed on a block to examine the deflection under increasing load. To measure the vertical deflection of the test unit, 100 mm linear variable displacement transducers (LVDTs) were installed at both ends of the girder and 1/4 points of the span. Strains at the main members were measured using strain gauges. The strain gauges are attached in the longitudinal and circumferential directions of the circular steel-tube girder and the vertical and horizontal directions of the vertical steel plate. Figure 4b illustrates the test site.
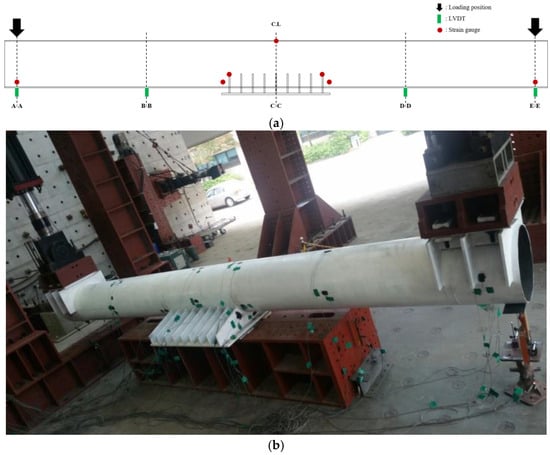
Figure 4.
Negative moment test: (a) test set up and (b) Test site.
In the loading test, the displacement rate was controlled at 0.02 mm/s, up to a vertical displacement of 20 mm. After the vertical displacement exceeded 20 mm, the displacement rate was controlled at 0.1 mm/s.
2.2. Experimental Results
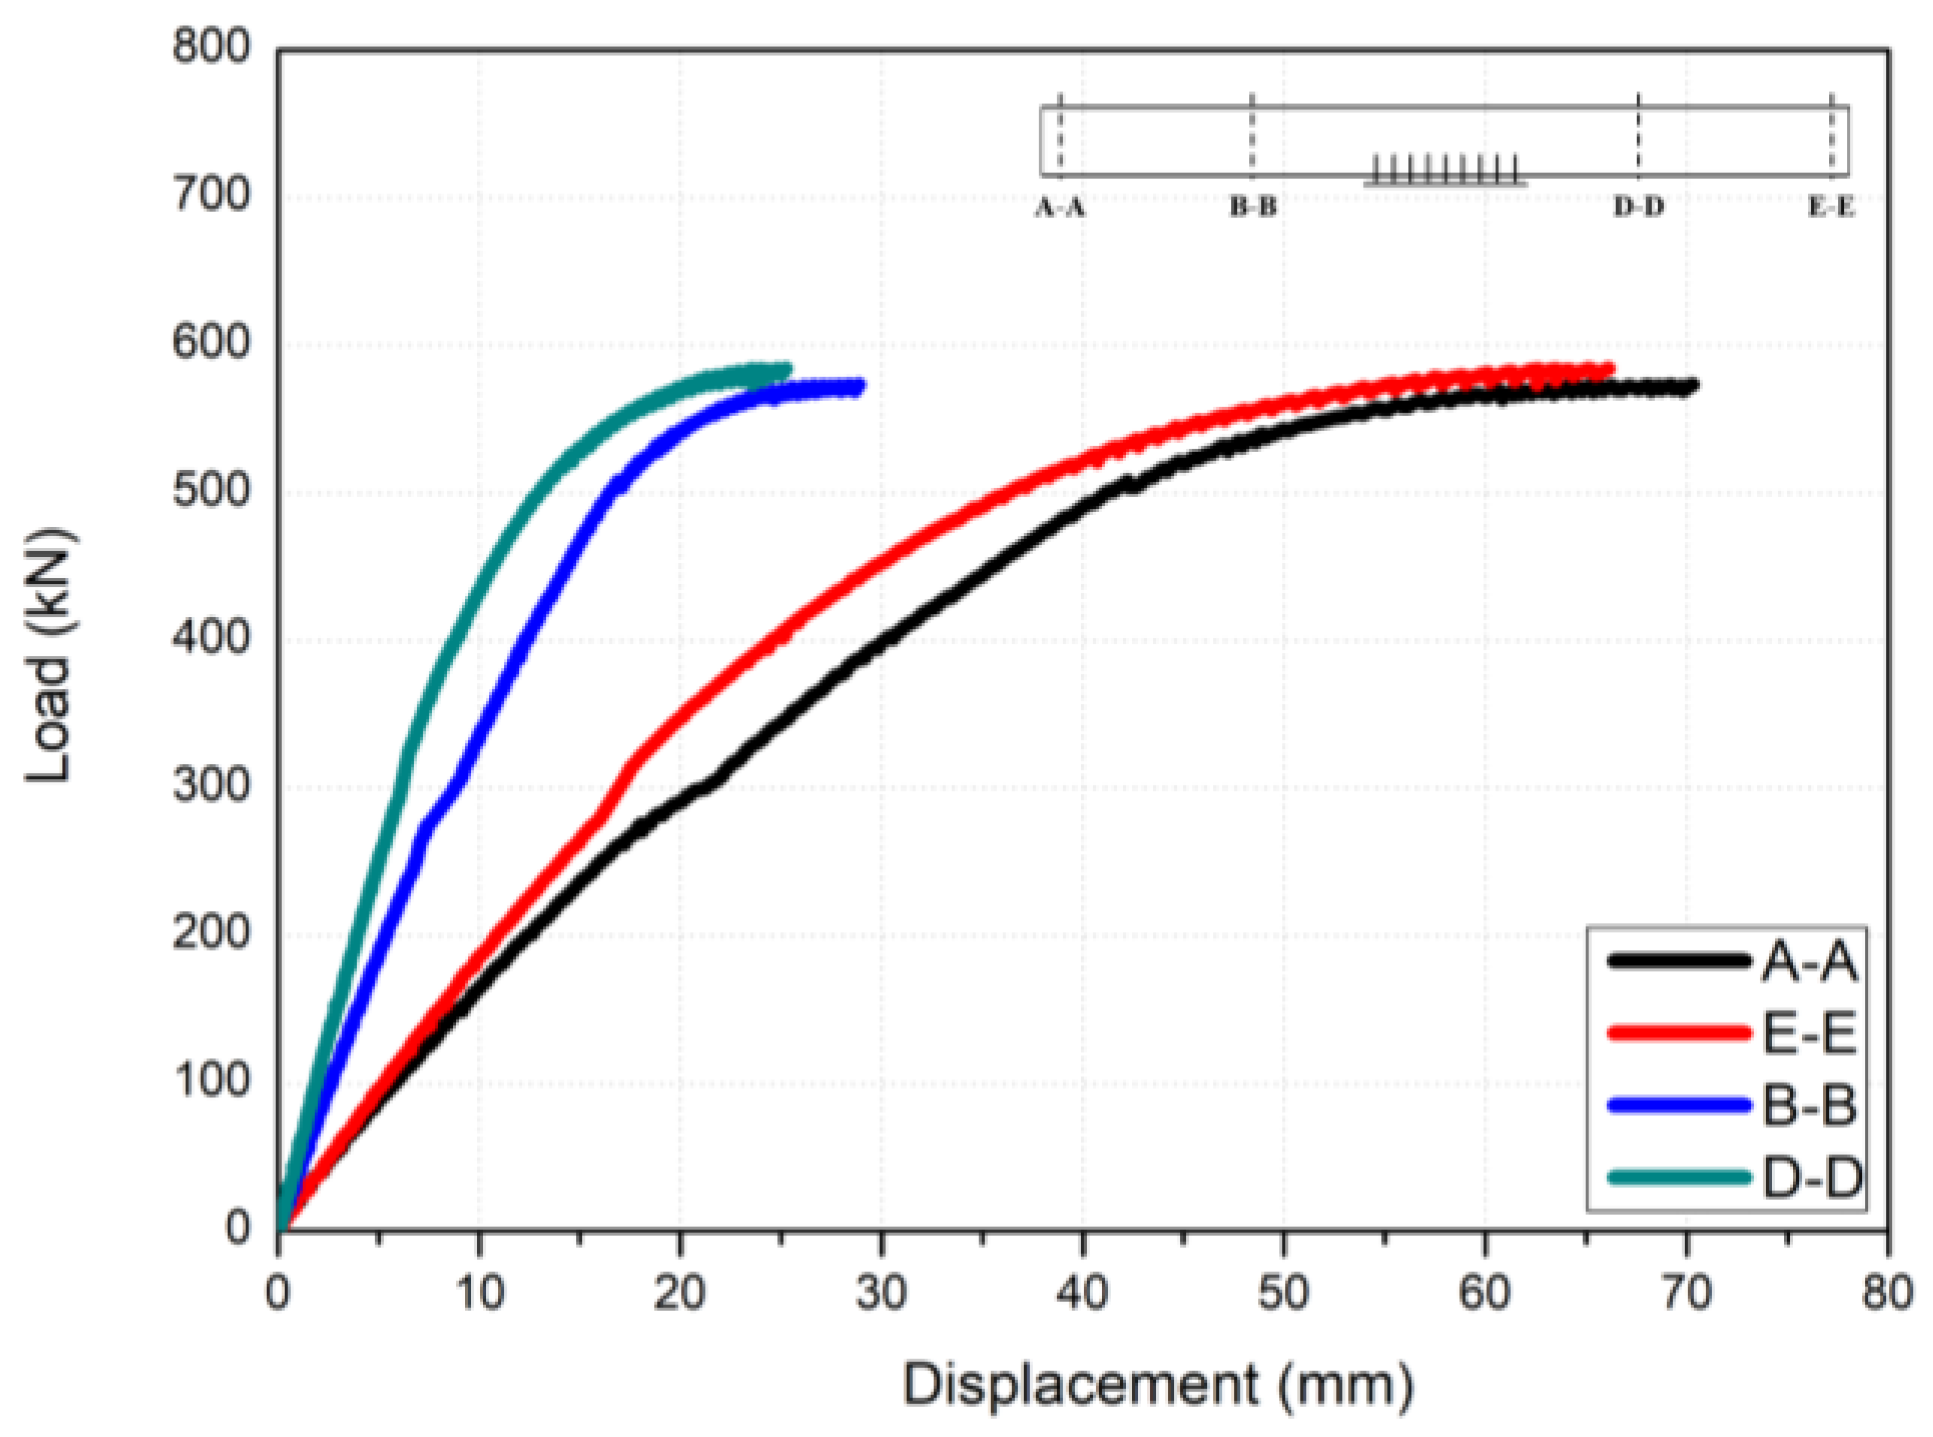
Figure 5 shows the deflection according to the negative moment test results by location under increasing load. These results present the deflections at both ends (A–A, E–E) and the L/4 points (B–B, D–D) of the test unit, as illustrated in Figure 4a. At the service load of 175 kN, the circular steel-tube girder and vertical steel plates behaved within the elastic range. At 365 kN, 210% of the service load, a nonlinear behavior with tensile yielding occurred at the top of the center section of the circular steel-tube girder. Then, a nonlinear behavior occurred at 500 kN due to the local buckling of the circular steel-tube girder.
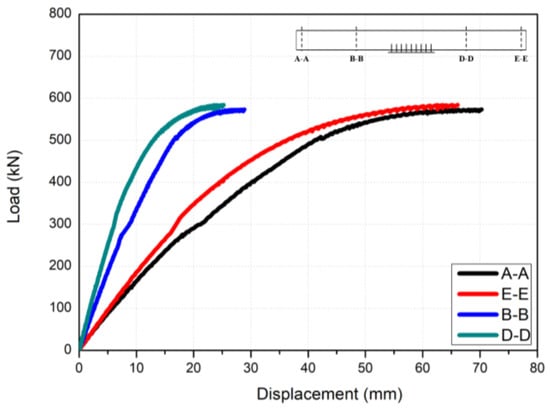
Figure 5.
Load–deflection relationship according to the test results.
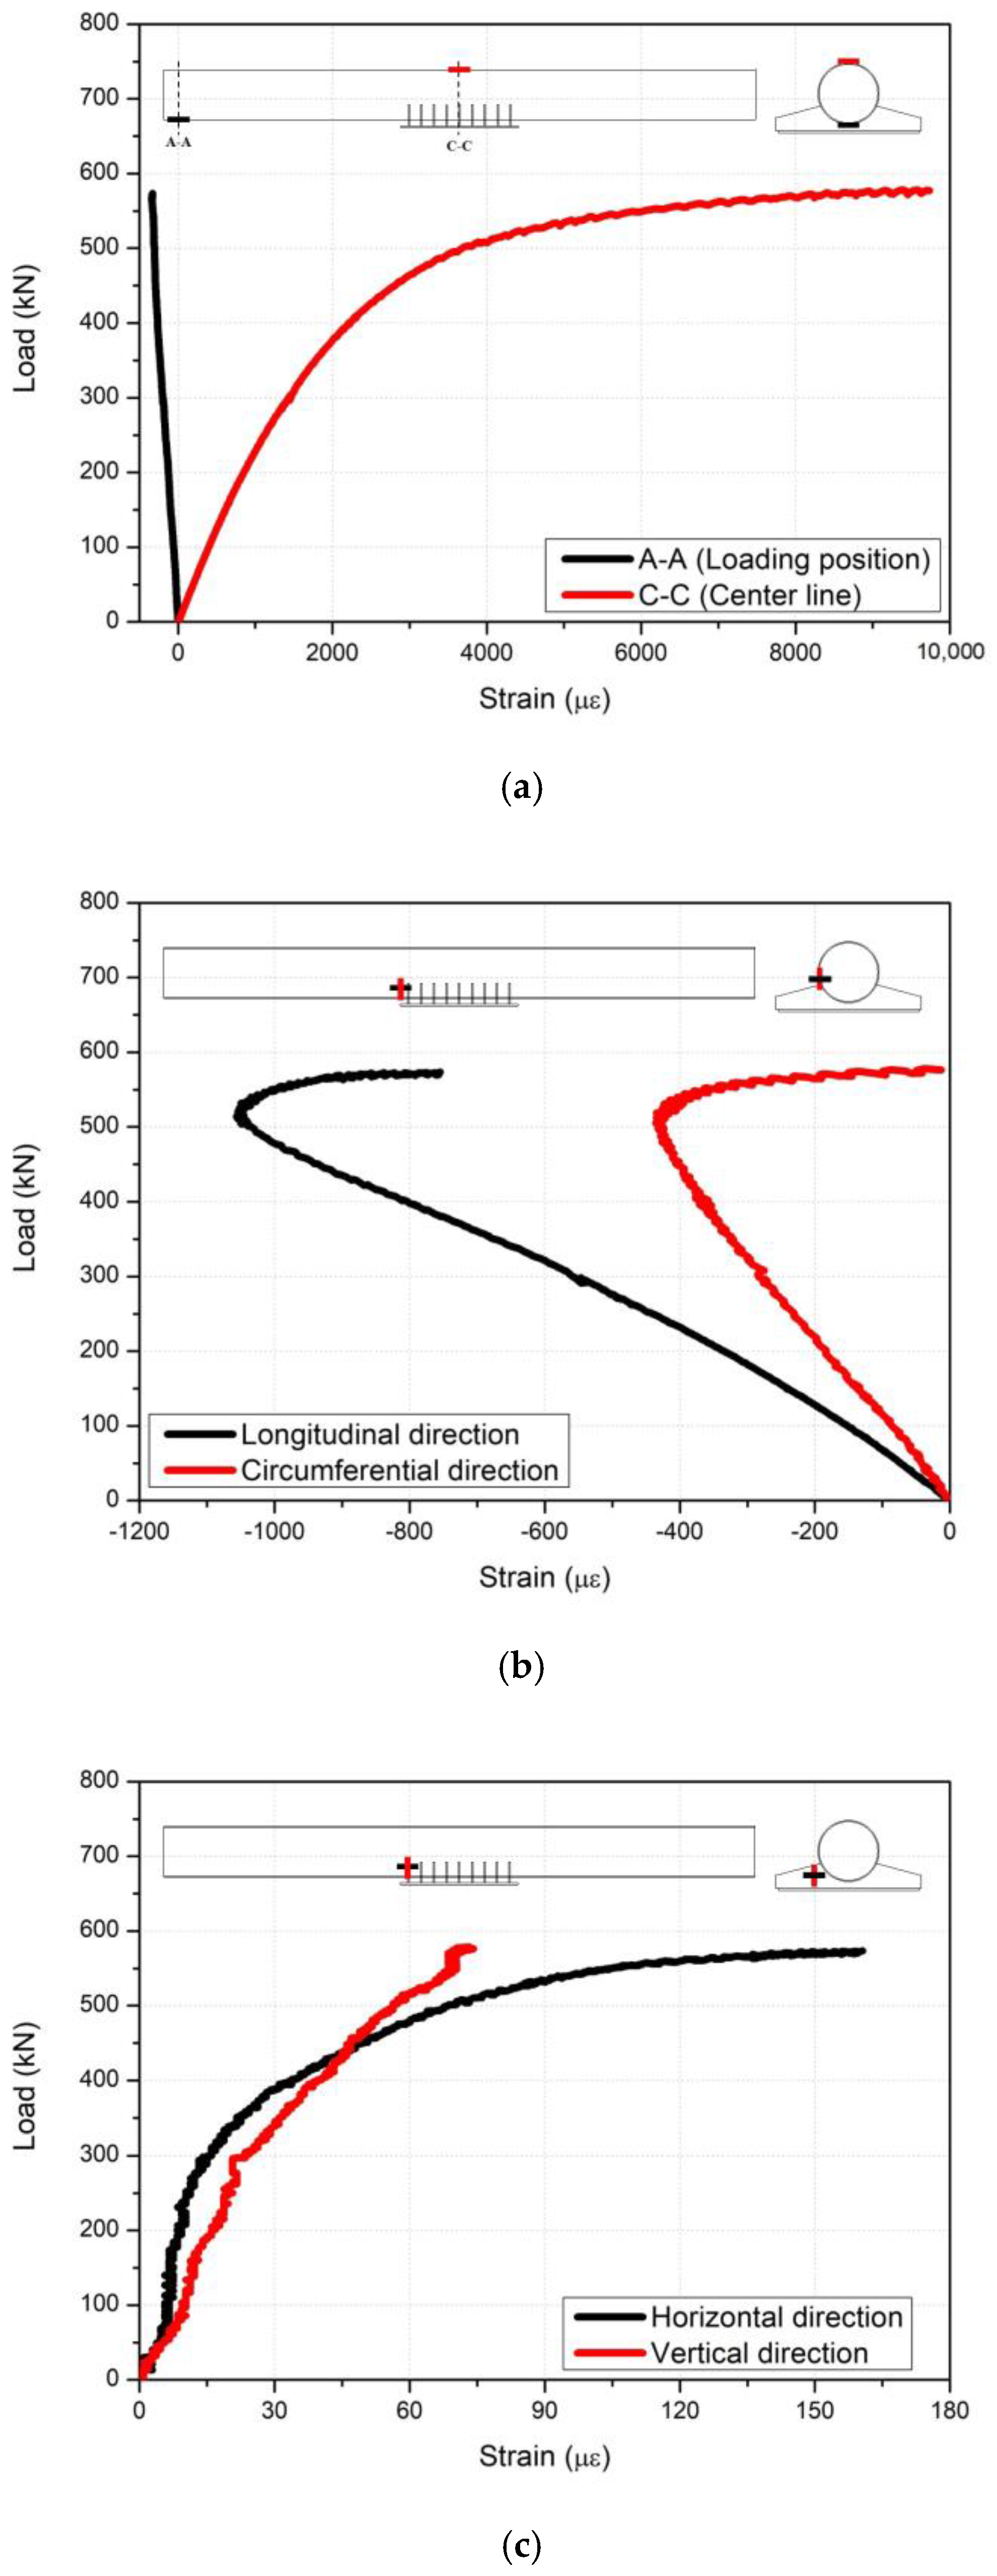
Figure 6a shows a comparison of the strain results between both ends of the circular steel-tube girder, which is the positive moment region, and the center of the circular steel-tube girder, which is the negative moment region. The strains at both ends of the circular steel-tube girder were measured at the bottom because there was a loading plate at the top of the girder. At the service load of 175 kN, the main members behaved within the elastic range. At a load of 365 kN, initial deformation due to tensile yielding occurred at the top of the center section of the circular steel-tube girder in the negative moment region. At a load of 550 kN, the yield gradually increased in the longitudinal direction of the circular steel-tube girder.
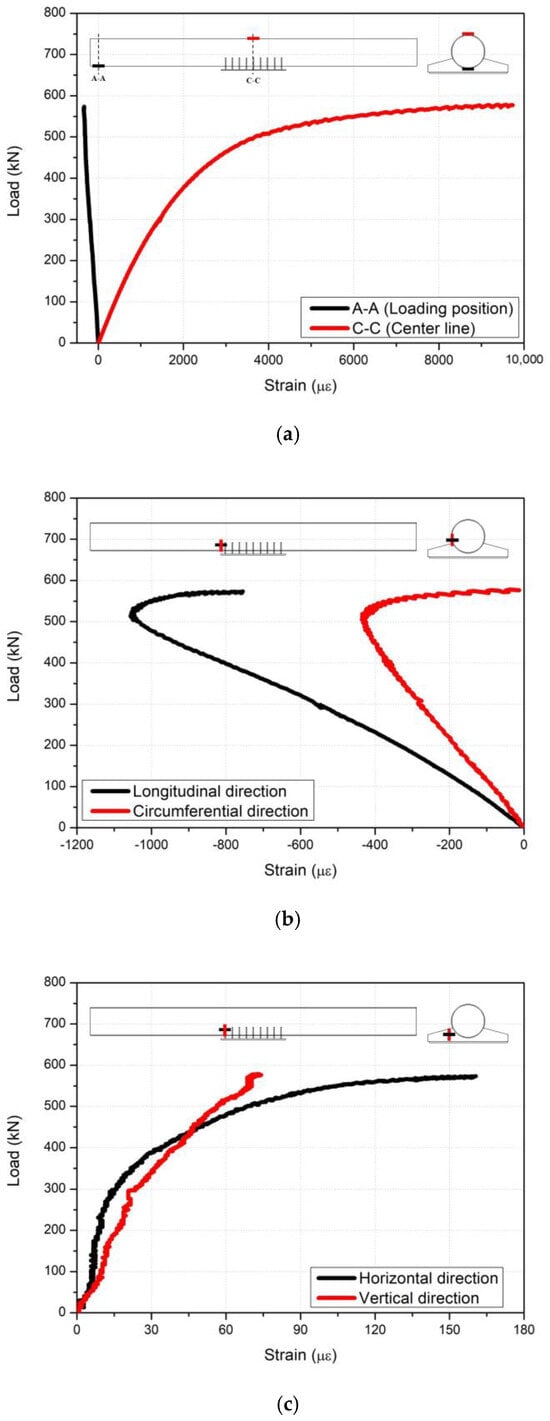
Figure 6.
Load–strain relationship according to the test results: (a) circular steel-tube girder; (b) circular steel-tube girder adjacent to the vertical steel plates; and (c) vertical steel plate.
Figure 6b shows the strain result of the circular steel-tube girder adjacent to the vertical steel plate. At the maximum load of 550 kN, local buckling occurred at the bottom of the circular steel-tube girder adjacent to the vertical steel plate, as illustrated in Figure 9a. The circumferential and longitudinal strains were reversed in the strain direction because local buckling occurred. The longitudinal strain was 1080 με, and the circumferential strain was 410 με at the maximum load. Furthermore, the circumferential deformation of the girder due to the load was less than the longitudinal deformation.
Figure 6c shows the load–strain relationship for a vertical steel plate. The experimental results indicate that only the outer vertical steel plate is deformed. The tensile strain increased as the load increased, and this trend was due to the effect of local buckling in the circular steel-tube girder.
3. Finite Element Analysis and Results
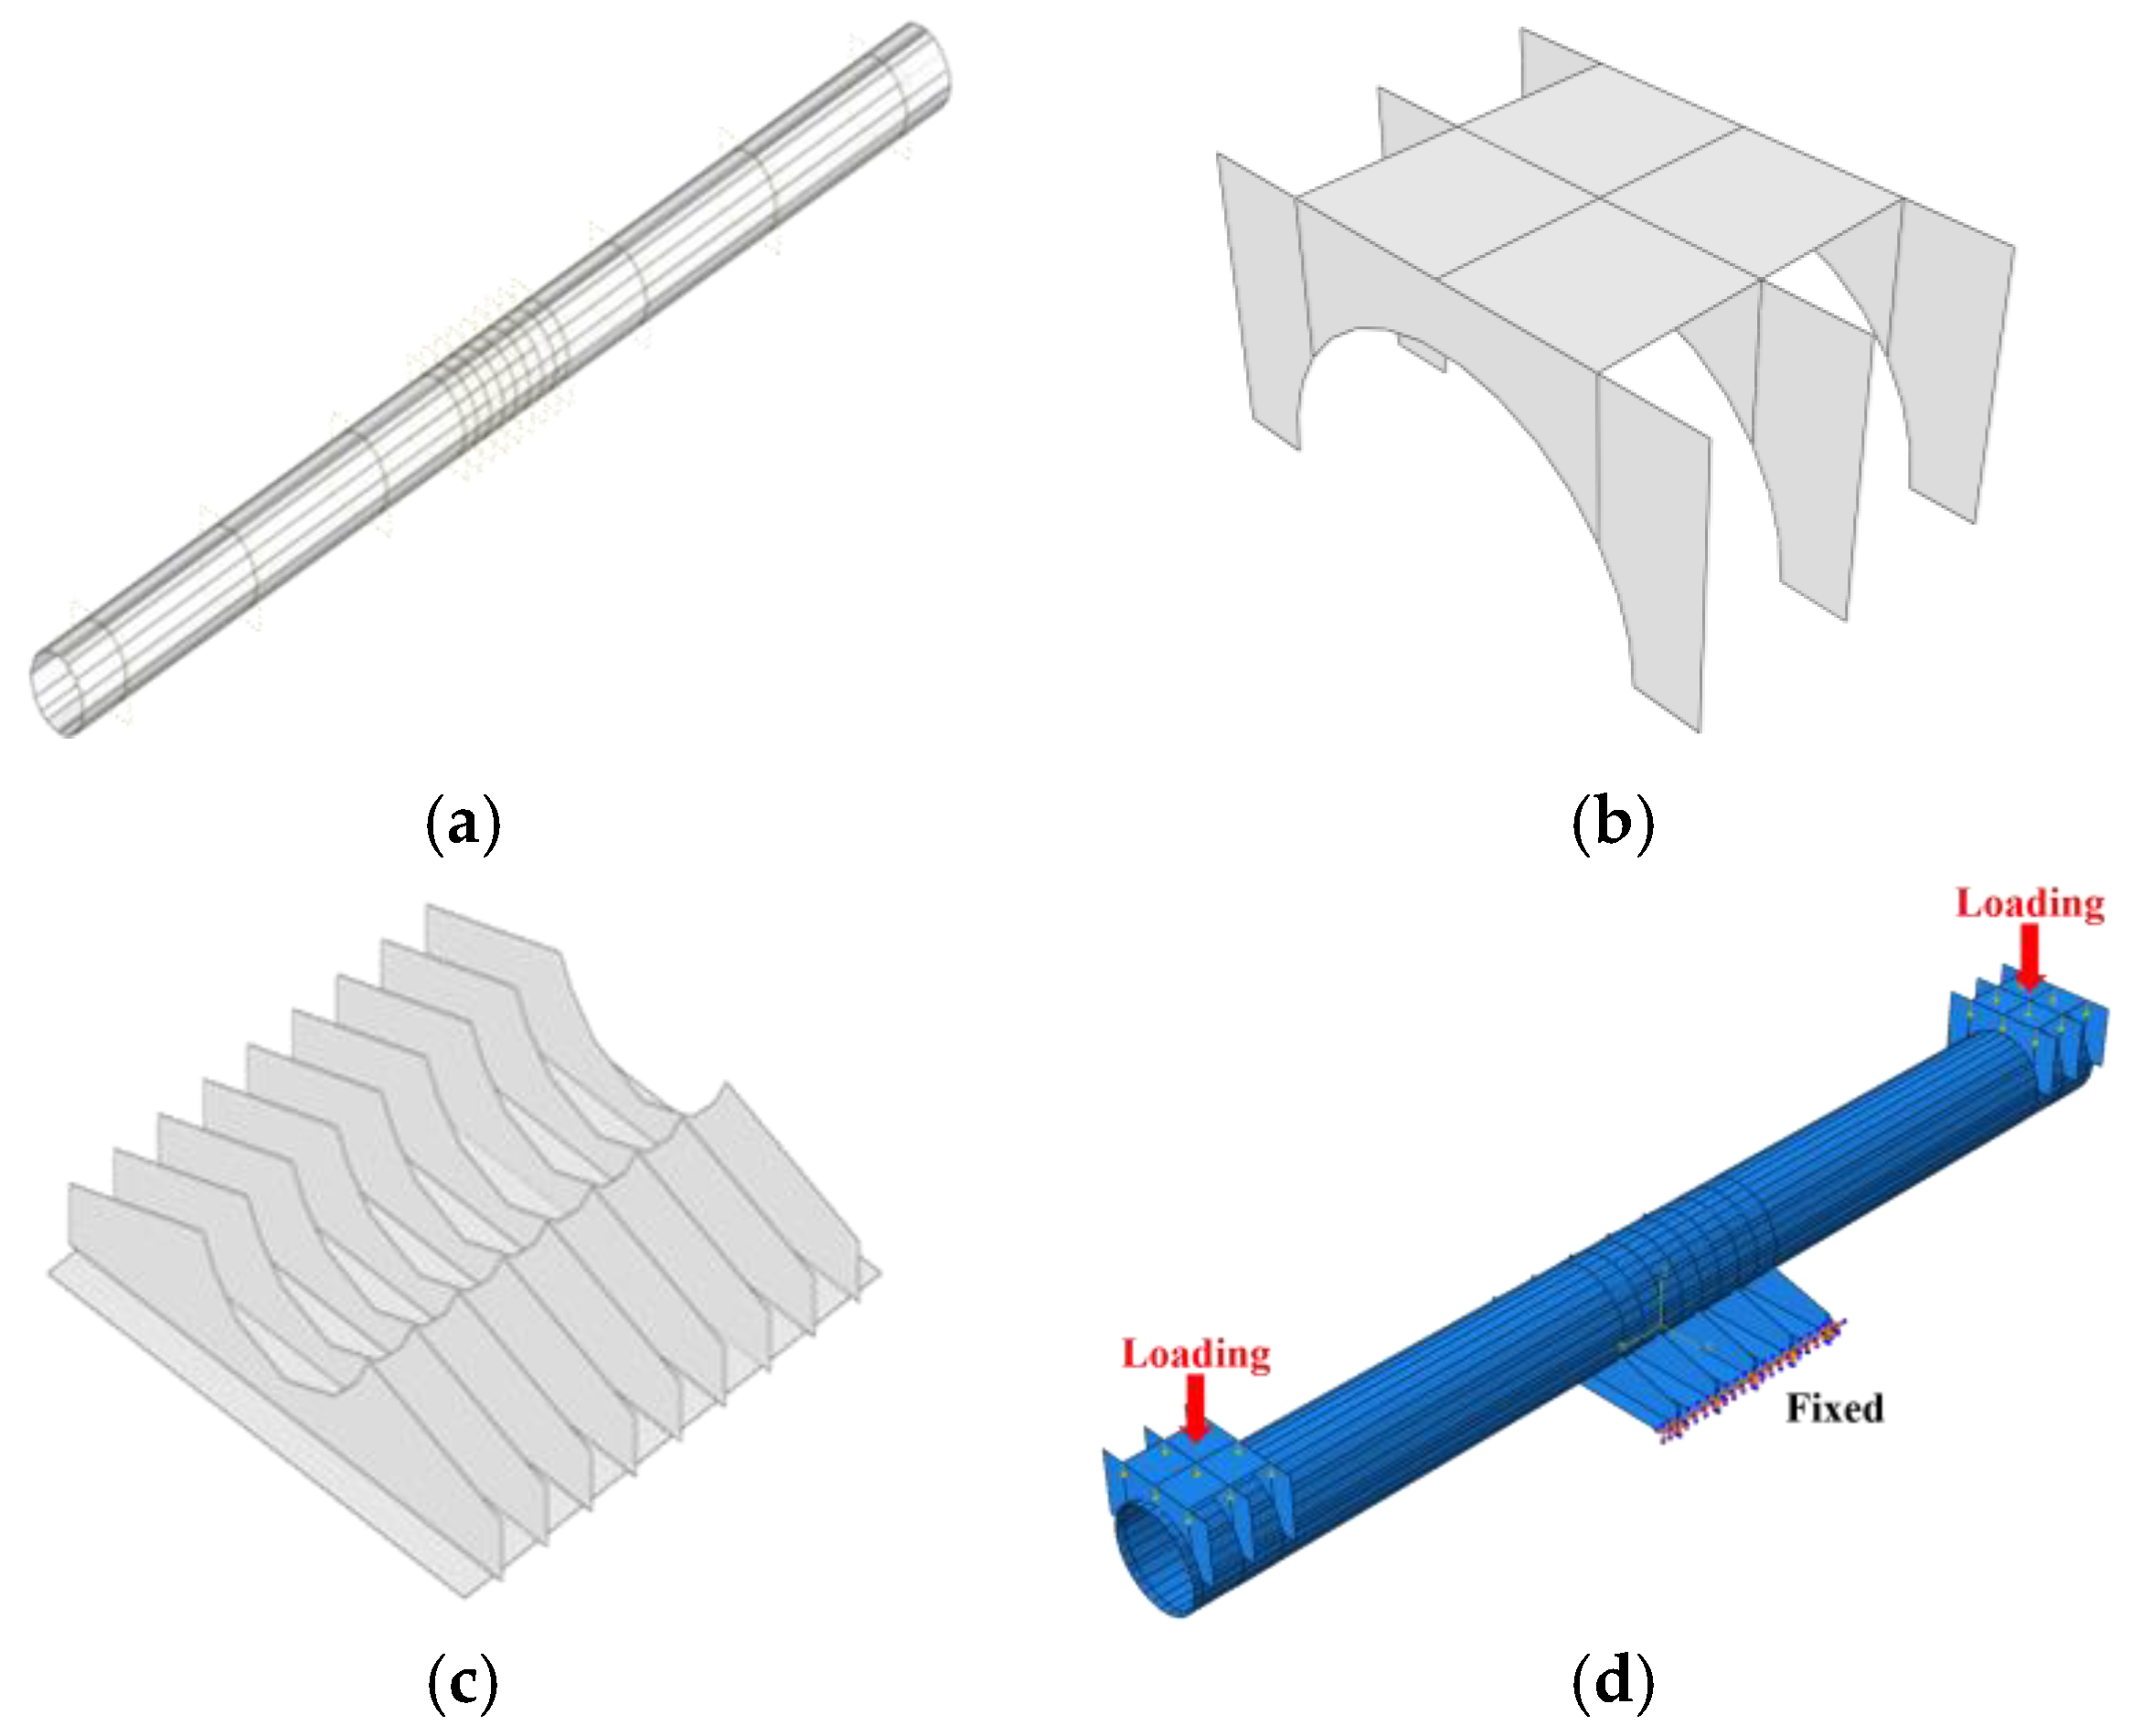
In this study, the negative moment region of the proposed circular steel-tube girder was constructed by three-dimensional FEA modeling. Subsequently, the stress results of each member under load were compared with the allowable stress criteria suggested in [10,11]. The analysis model comprised a circular steel-tube girder with a length of 7000 mm, vertical steel plates, support, and loading plates, as illustrated in Figure 7. The FEA program ABAQUS (version 6.21) [20] was used for the analysis. All members were constructed using three-dimensional shell elements (S4R). In addition, the width–height ratio of the elements was maintained as close as possible to 1:1 to minimize errors due to the geometry of the elements, and the mesh size was set to 70 mm. A structured hex was applied to the mesh geometry to prevent distortion. Moreover, an elastic modulus and Poisson’s ratio of 200,000 MPa and 0.3 were applied, respectively. The boundary condition is fixed to the support, and the load condition increases the load at both ends of the girder, as shown in Figure 7d.
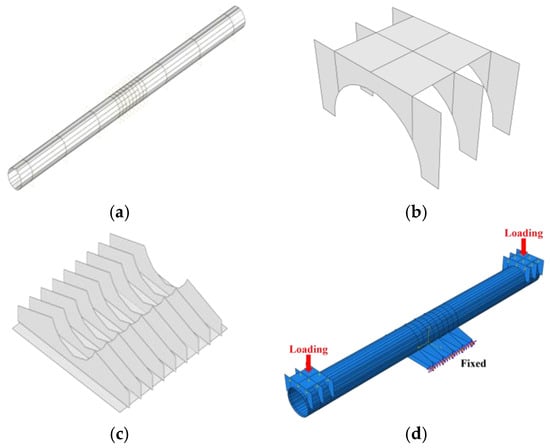
Figure 7.
FEA model: (a) circular steel-tube girder; (b) loading plate; (c) vertical steel plates and support; and (d) boundary and loading conditions.
A service load of 175 kN, a yield load of 365 kN, and a maximum load of 550 kN were used to examine the structural analysis results. The service load was determined in Section 2, and the yield load was obtained from the experimental results. The yield load corresponds to the load measured when the circular steel-tube girder is deformed by tensile yielding. The maximum applied load is the load applied to the maximum in the experiment.
The stress–strain relationship of the material in FEA can be divided into elastic and plastic regions. As the load increases, the material in the analysis model transitions from the elastic region to the plastic region. Therefore, a nonlinear analysis considering the steel plasticity model was performed to analyze the behavior of the plastic region of the test unit in this study [21]. The plastic properties of steel are as follows. The yield strength is 315 MPa and the tensile strength is 490 MPa. The load was applied on the loading plates attached to both ends of the girder under the same conditions as the experiment, and the boundary condition was fixed. Furthermore, a nonlinear analysis was conducted using the load-controlled Newton–Raphson method, which reaches the limit state of the member as the load increases. In addition, incremental static analysis was used to predict stress, displacement, and deformation in the static state of the structure.
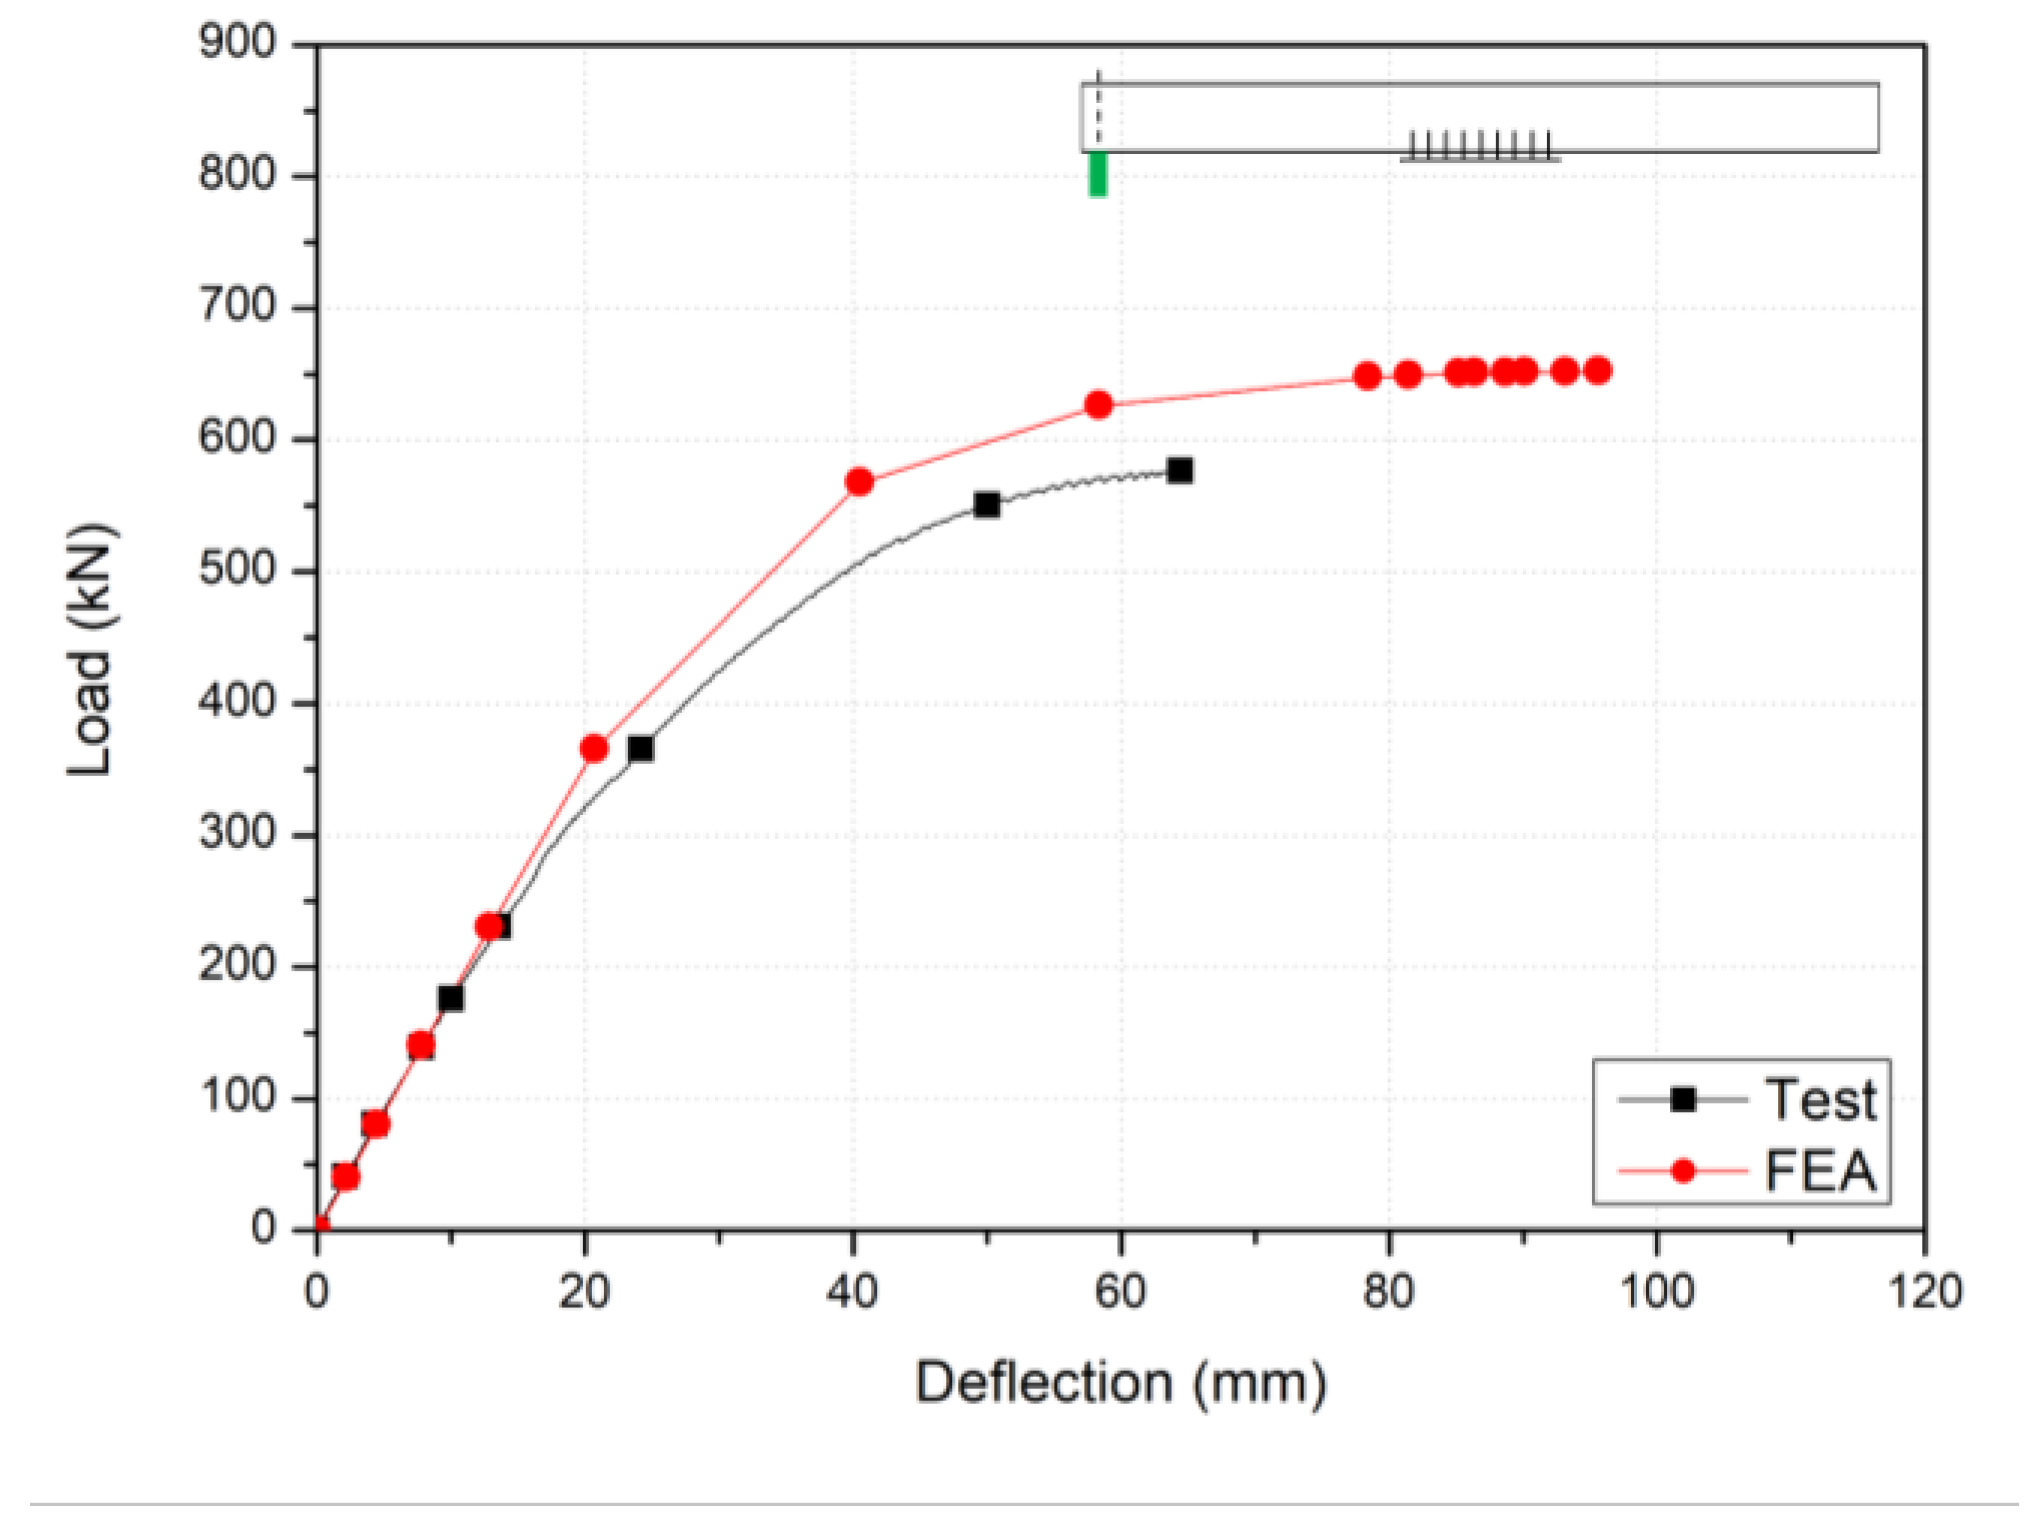
Figure 8 shows the load–deflection relationship of the structure obtained from the experiment and analysis. The load–deflection results from the negative moment region experiment described earlier were compared with the FEA results.
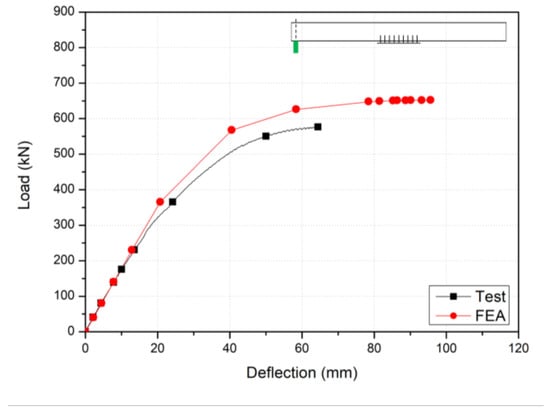
Figure 8.
Load–deflection relationship.
In the linear section, the deflection with increasing load was similar, and, then, local buckling occurred in the circular steel-tube girder adjacent to the vertical steel plate at a load of 365 kN. In addition, at the maximum load of 550 kN, the circular steel-tube girder adjacent to the vertical steel plate showed deformation due to local buckling. The red circles in Figure 9a and Figure 9b show the local buckling of the test and FEA. The local buckling in FEA occurred at the same location in the test unit, as mentioned in Section 2.2. [22].

Figure 9.
Local buckling: (a) test and (b) FEA.
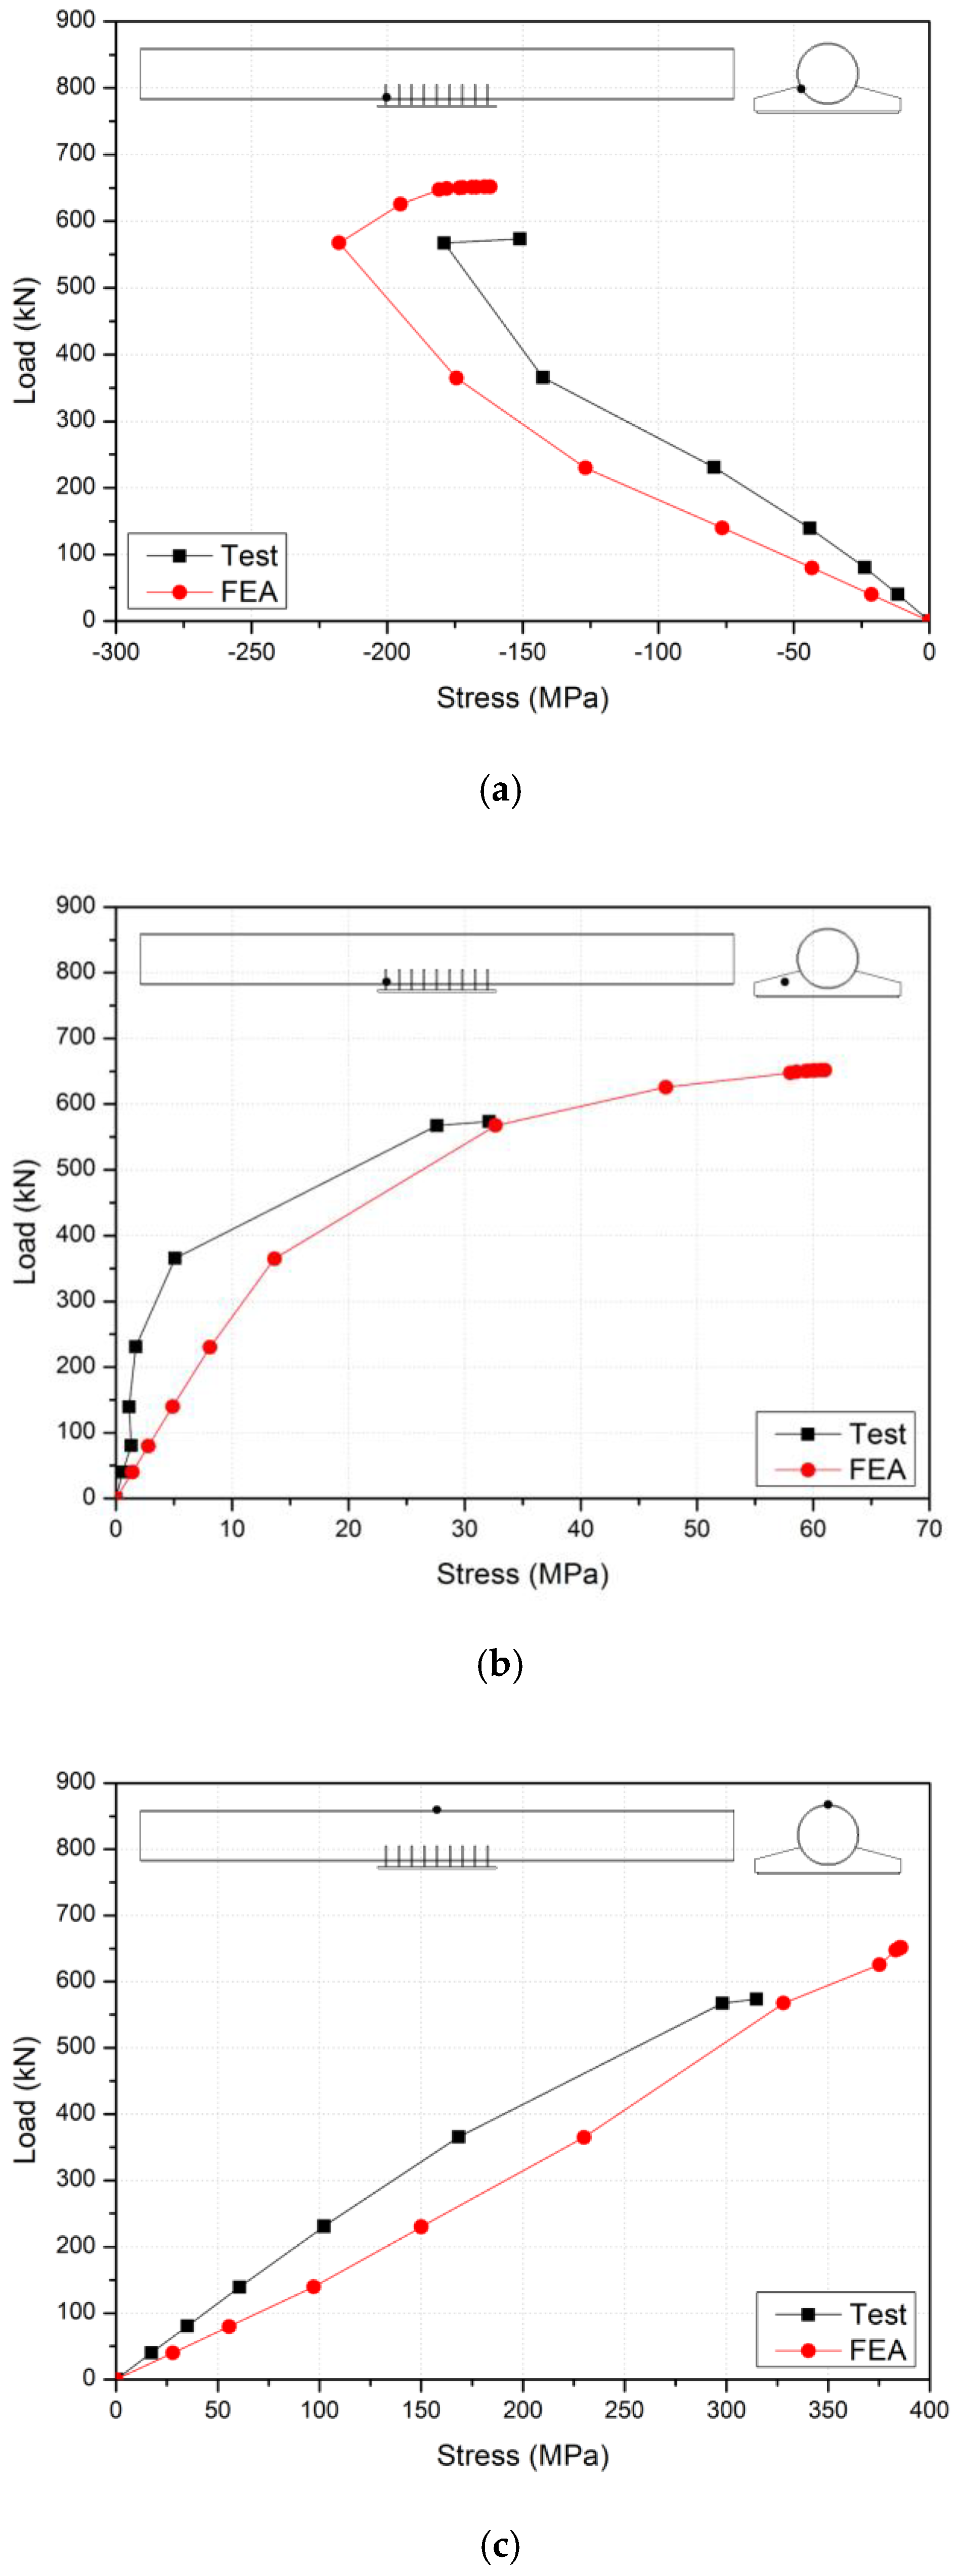
Figure 10 shows the load–stress relationship. In particular, Figure 10a presents the stress result of the circular steel-tube girder adjacent to the vertical steel plates. As the maximum load of 550 kN was reached, the position of the neutral axis of the circular steel-tube girder changed, and the compressive deformation changed to tensile deformation. Figure 10b shows the stresses in the vertical steel plates. Tensile yielding of the vertical steel plate occurred under a load of 365 kN. The FEA exhibited the same effect of local buckling as in the experimental results. Figure 10c illustrates the load–stress relationship at the top of a circular steel-tube girder in the negative moment region. The tensile yield of the circular steel-tube girder was ascertained at 365 kN. At the maximum load, both the experimental and FEA results showed that the greatest stress occurred at the top of the circular steel-tube girder.
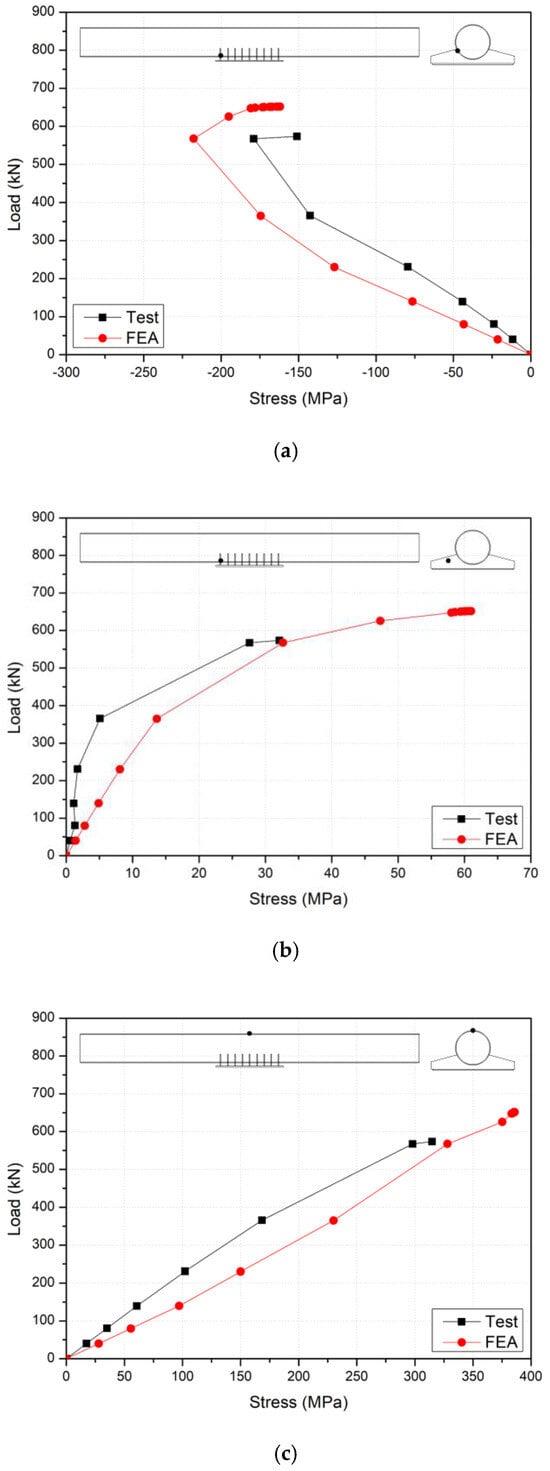
Figure 10.
Load–stress relationship: (a) circular steel-tube girder adjacent to the vertical steel plates; (b) vertical steel plate; and (c) top of the circular steel-tube girder in the negative moment region.
Table 1 lists the stress results of the experiment and analysis by member with the allowable stresses given by AASHTO [10] and the Korea Road Transportation Association [11]. The stress results of the experiment and FEA under a service load of 175 kN were within the allowable stress range of 190 MPa. The results indicate that the design is safe at the service load. However, as the applied load increased from 300 kN, the stresses generated by the top of the circular steel-tube girder in the negative moment region exceeded the allowable stress of 190 MPa.

Table 1.
Results of stress according to members.
4. Parametric Study
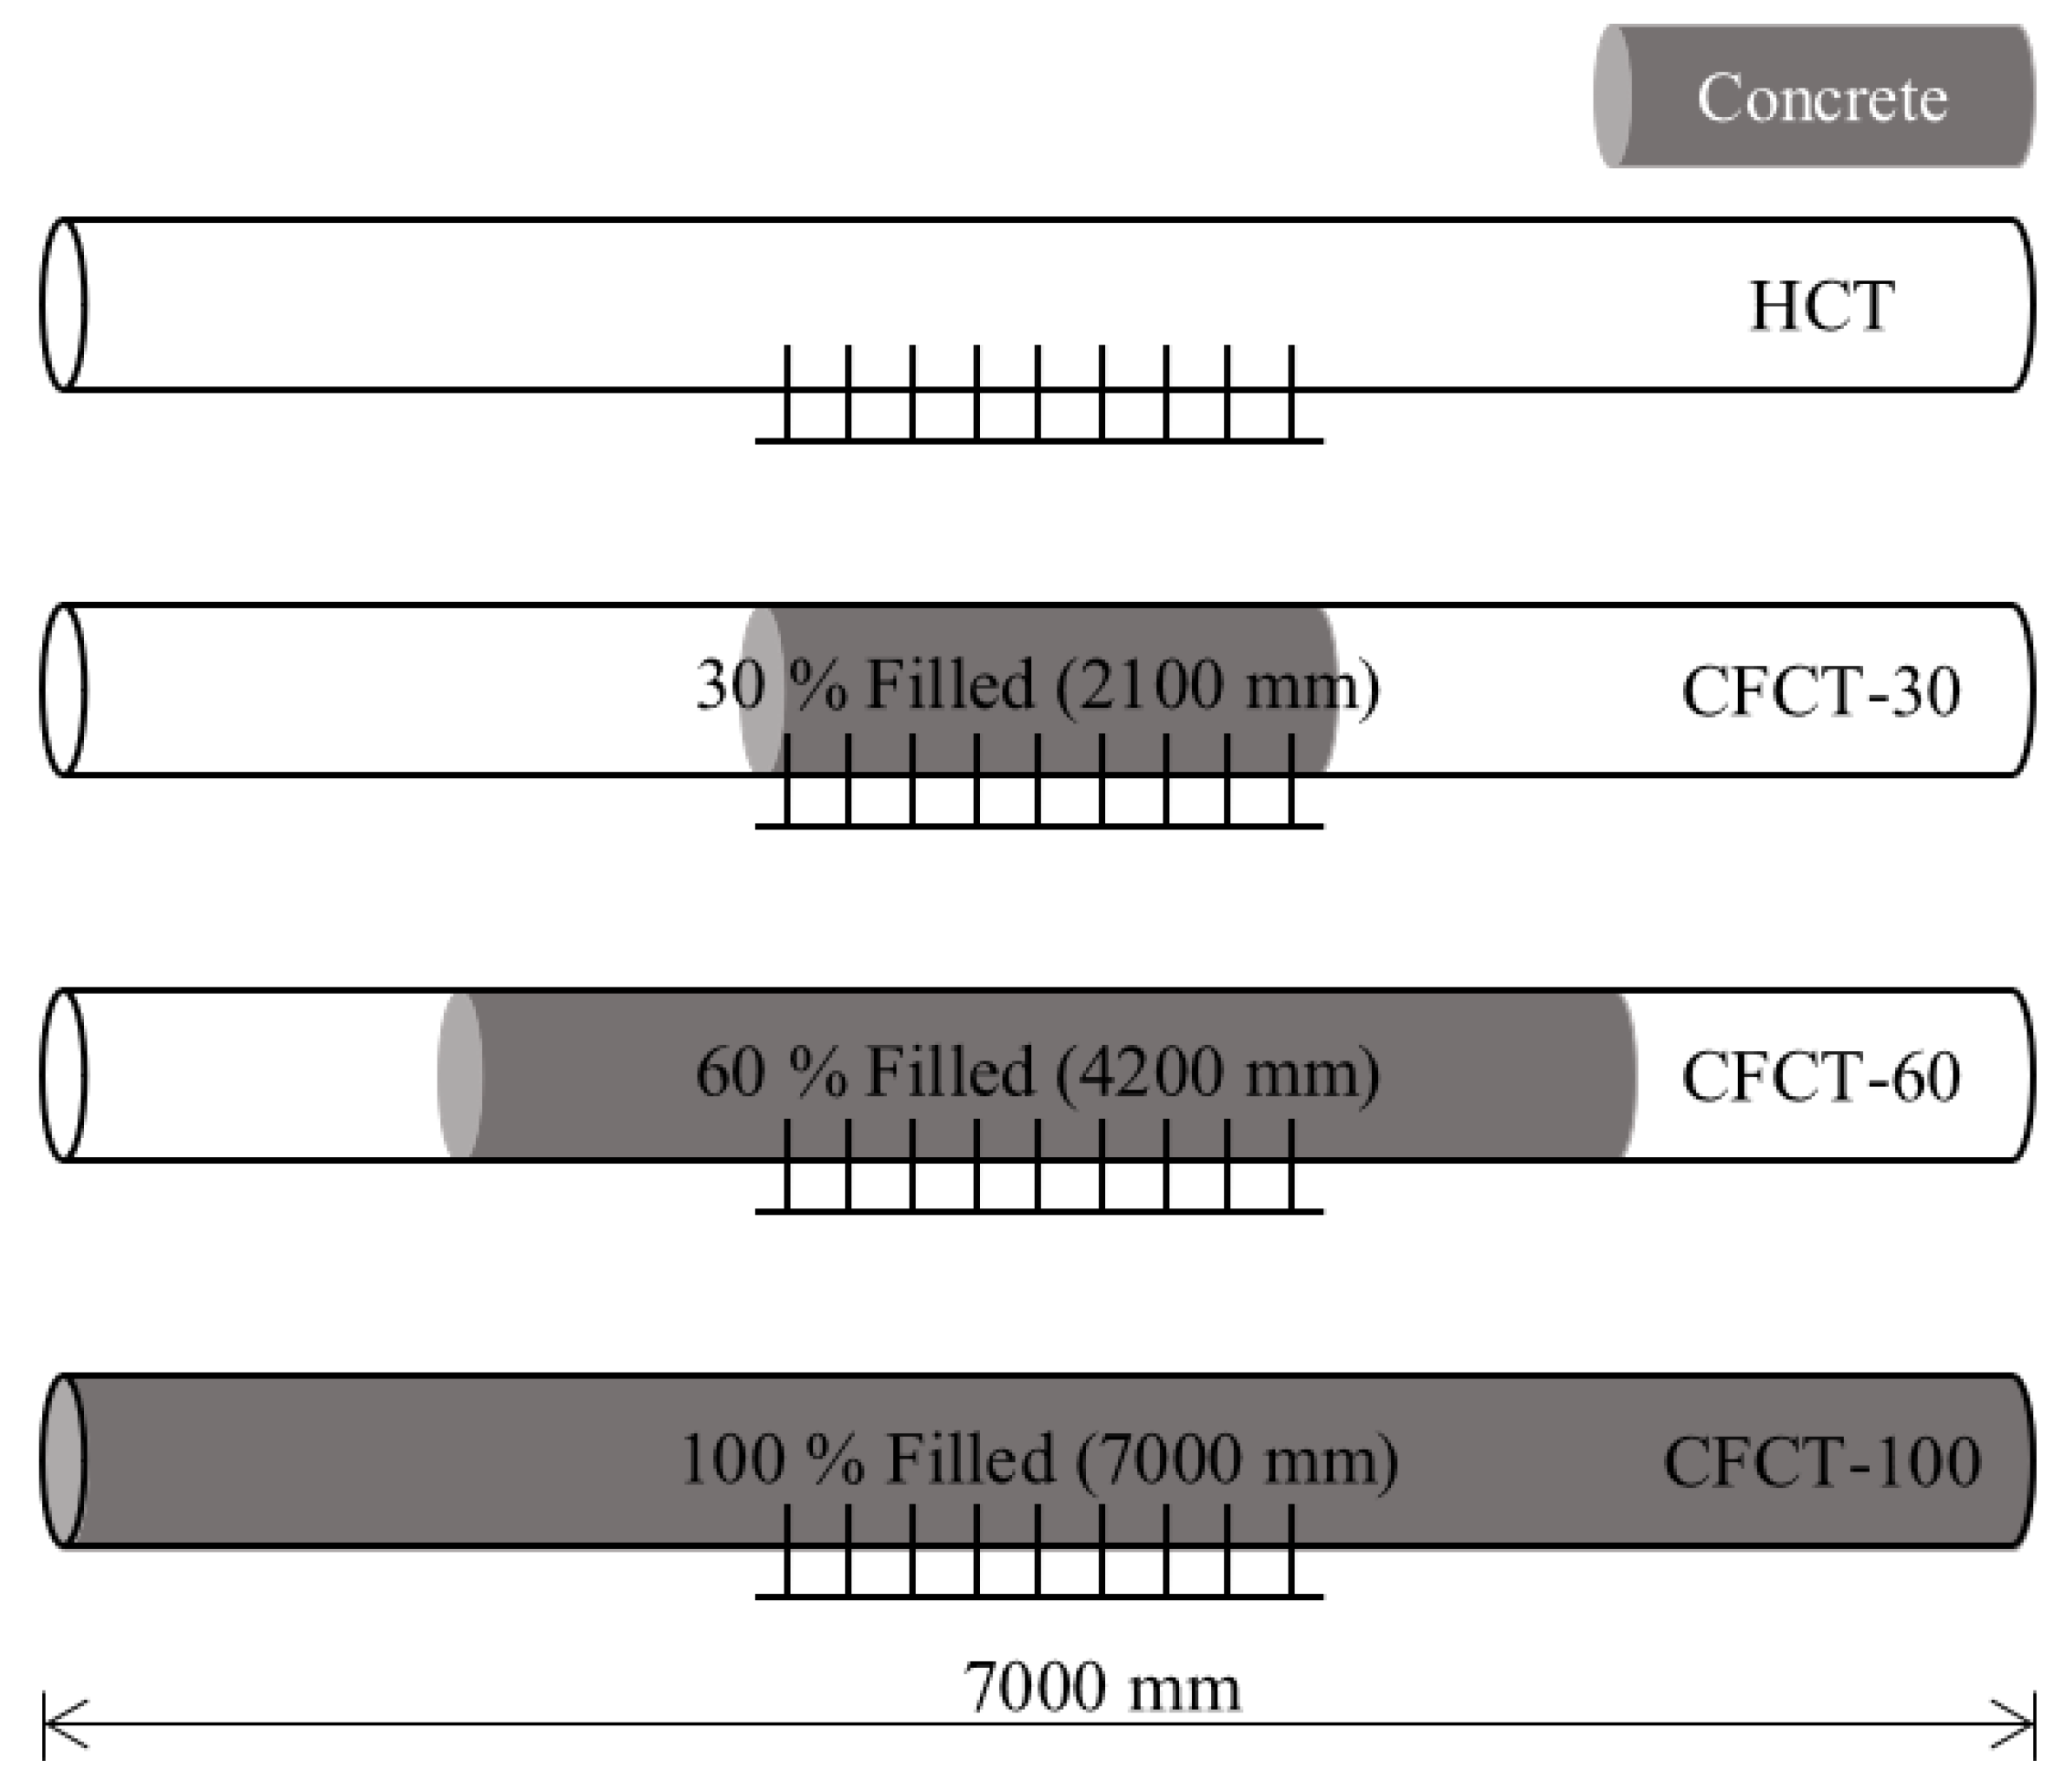
This study aimed to examine the effect of improving the negative moment region performance by filling concrete inside the circular steel-tube girder. The concrete filling lengths of 2100 mm, 4200 mm, and 7000 mm, representing 30%, 60%, and 100% of the test unit length, respectively, were considered, as illustrated in Figure 11. The model without concrete filling was named HCT (hollow circular tube), the model with the concrete filling was named CFCT (concrete-filled circular tube), and the filling ratio of concrete was named using the corresponding percentage.
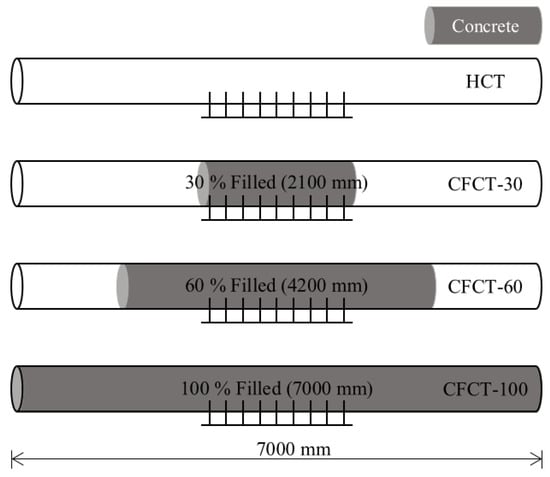
Figure 11.
Parametric study model.
The filled concrete was modeled with C3D10, a three-dimensional solid element, using an elastic modulus of 30,000 MPa and a Poisson’s ratio of 0.2 [23,24,25,26]. The concrete was modeled using a nonlinear model considering a concrete damaged plasticity model provided by ABAQUS [20,27,28,29]. In the concrete damage plasticity model, the dilation angle was 31, flow potential eccentricity was 0.1, fb0/fc0 was 1.16, Kc was 0.67, and the viscosity parameter was 0. The fb0–fc0 is the ratio of initial equibiaxial compressive yield stress to initial uniaxial compressive yield stress, and Kc is the second stress invariant [20,24]. The tensile behavior of the concrete considered tension stiffening [24].
The plasticity model of steel was used to develop the nonlinear behavior of ductile materials [30]. The interface of the concrete and the circular steel-tube girder was implemented using multipoint constraint (MPC) to share degrees of freedom with the node, allowing the concrete and girder to conduct as a composite behavior. MPC is a connection method used in the case of node sharing in finite element analysis. The beam among the types of MPC were applied in this study.
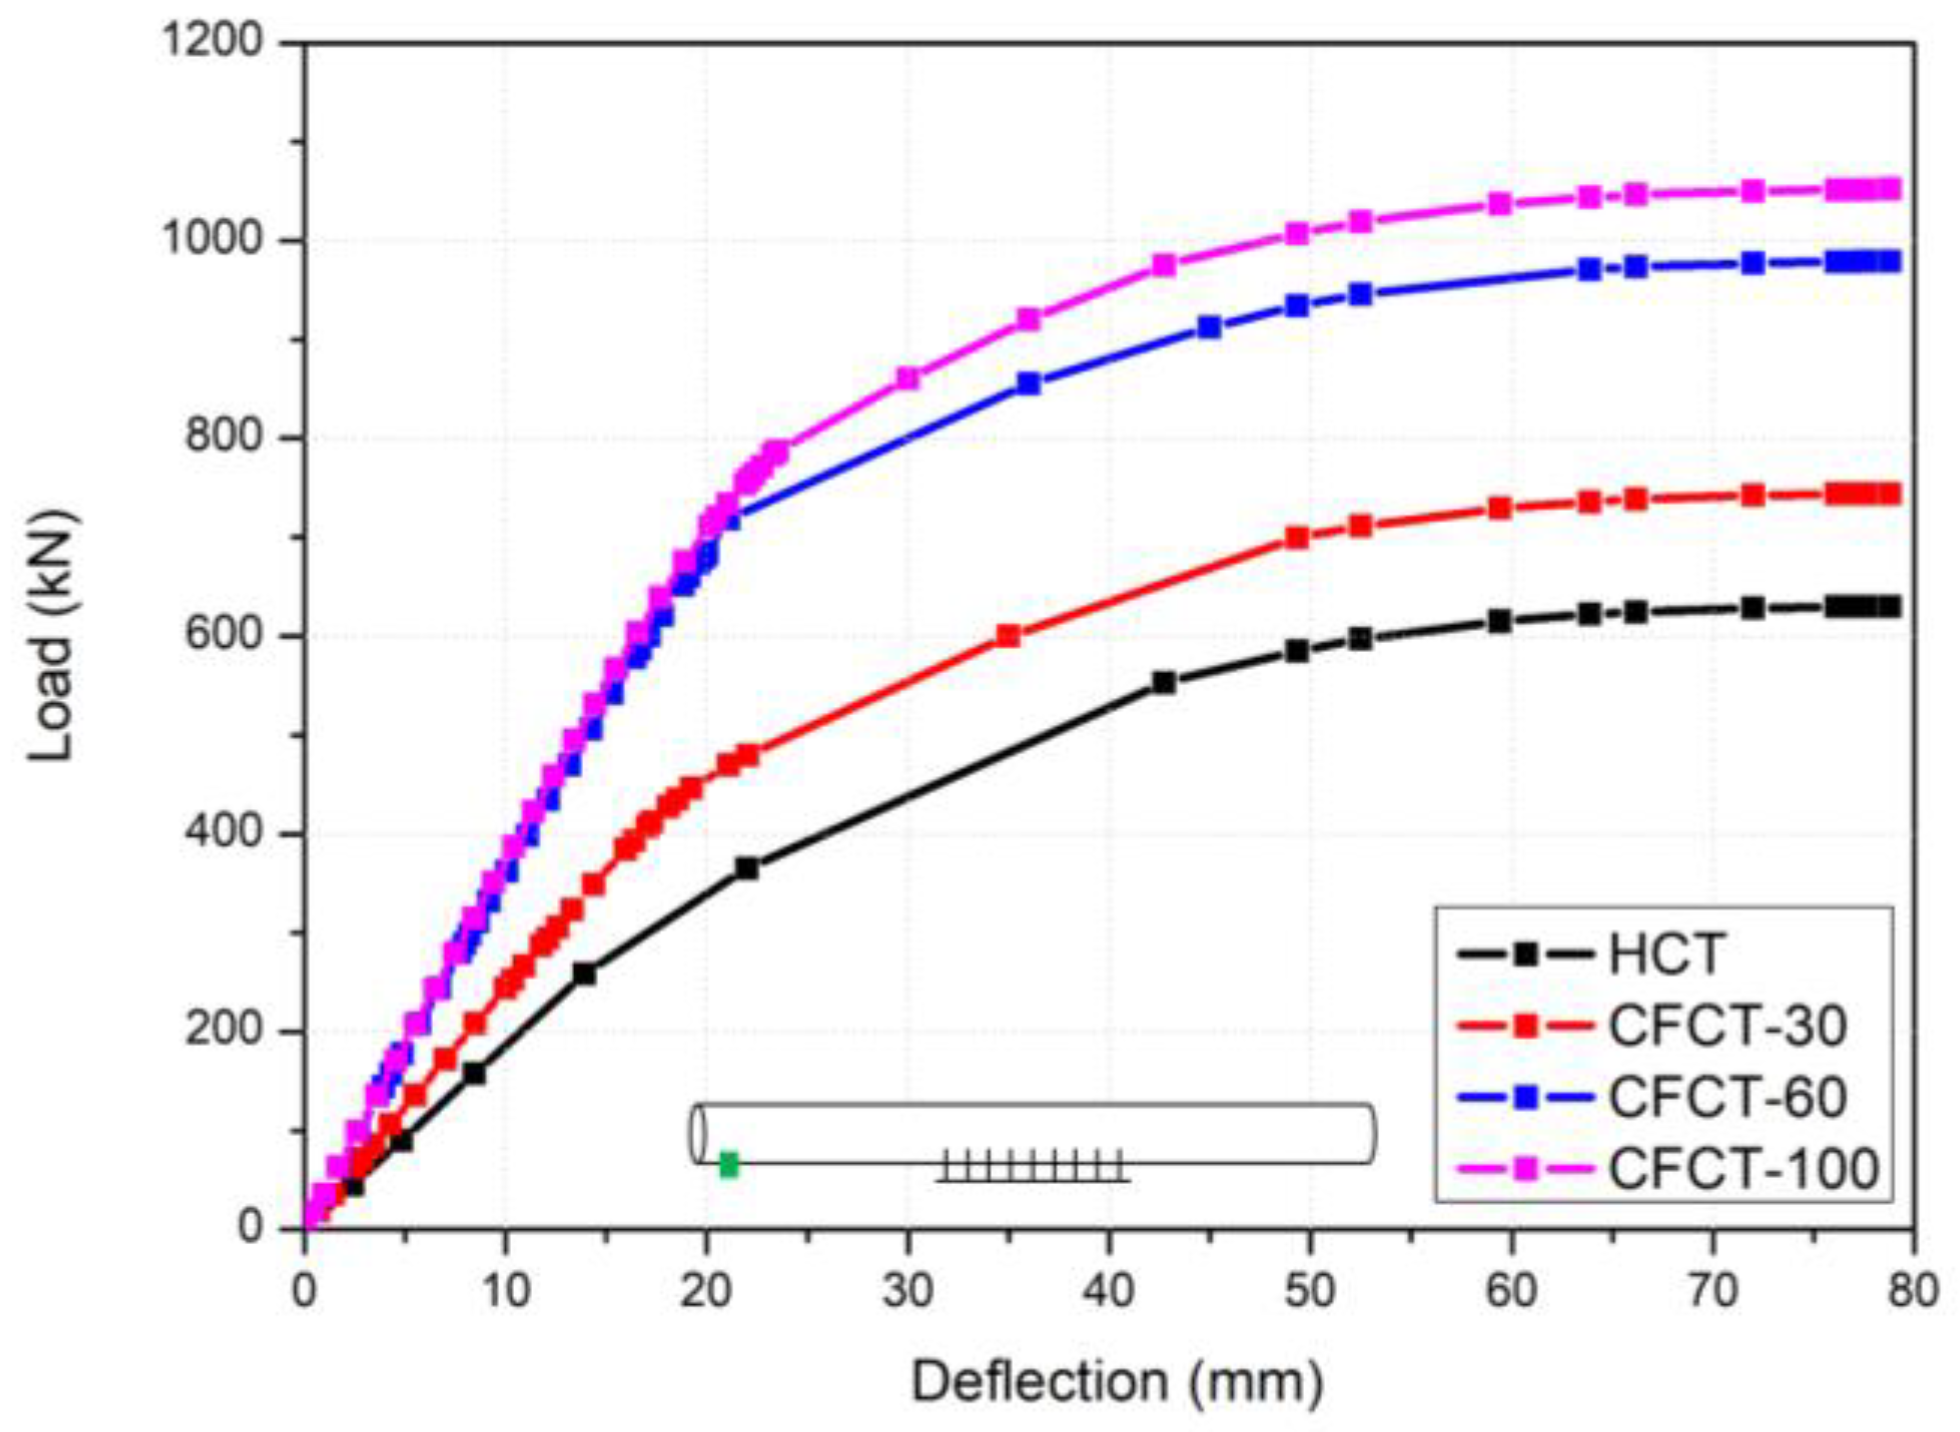
The results of the parametric study are as follows. Figure 12 shows the load–deflection relationship according to the filling ratio of concrete. In HCT, the tensile yield of the circular steel-tube girder occurred at a load of 365 kN. However, all the CFCT models had tensile yields of the circular steel-tube girder above 365 kN. The maximum vertical deflection of the circular steel-tube girder under the maximum load of 550 kN was compared by parameter. The maximum vertical deflection was 42.7 mm for HCT, 29.6 mm for CFCT-30, 15.3 mm for CFCT-60, and 14.4 mm for CFCT-100. The maximum vertical deflection was reduced by 30.7% for CFCT-30, 64.2% for CFCT-60, and 66.3% for CFCT-100 compared to HCT. The impact of reducing vertical deflection due to concrete infill can be clearly observed in this study. In CFCT, the stiffness and maximum load were improved compared to HCT because the circular steel-tube girder and concrete behave as composite cross-sectional elements. However, for CFCT-60 and CFCT-100, the difference in deflection reduction is small. This suggests that filling more than 60% of concrete has no effect on the deflection of a circular steel-tube girder.
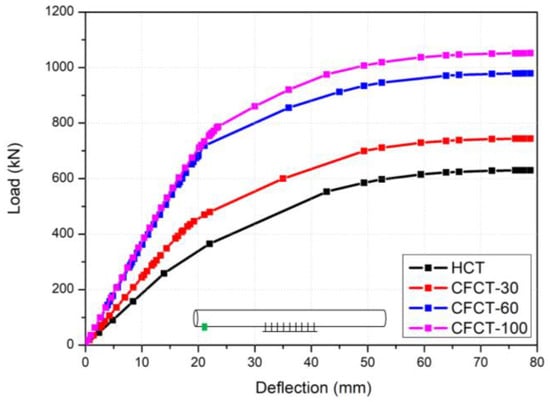
Figure 12.
Load–deflection relationship according to the filling ratio of concrete.
Table 2 presents a comparison of the effect of the load increase with the filling ratio of concrete based on the yield load and maximum load of HCT. The yield load increased by 122% for CFCT-30, 201% for CFCT-60, and 221% for CFCT-100 compared to HCT. The maximum load increased by 118% for CFCT-30, 155% for CFCT-60, and 167% for CFCT-100 compared to HCT. These results indicate that filling the circular steel-tube girder with more than 60% concrete has little effect on the structure.

Table 2.
Comparison of yield load and maximum load for specimens.
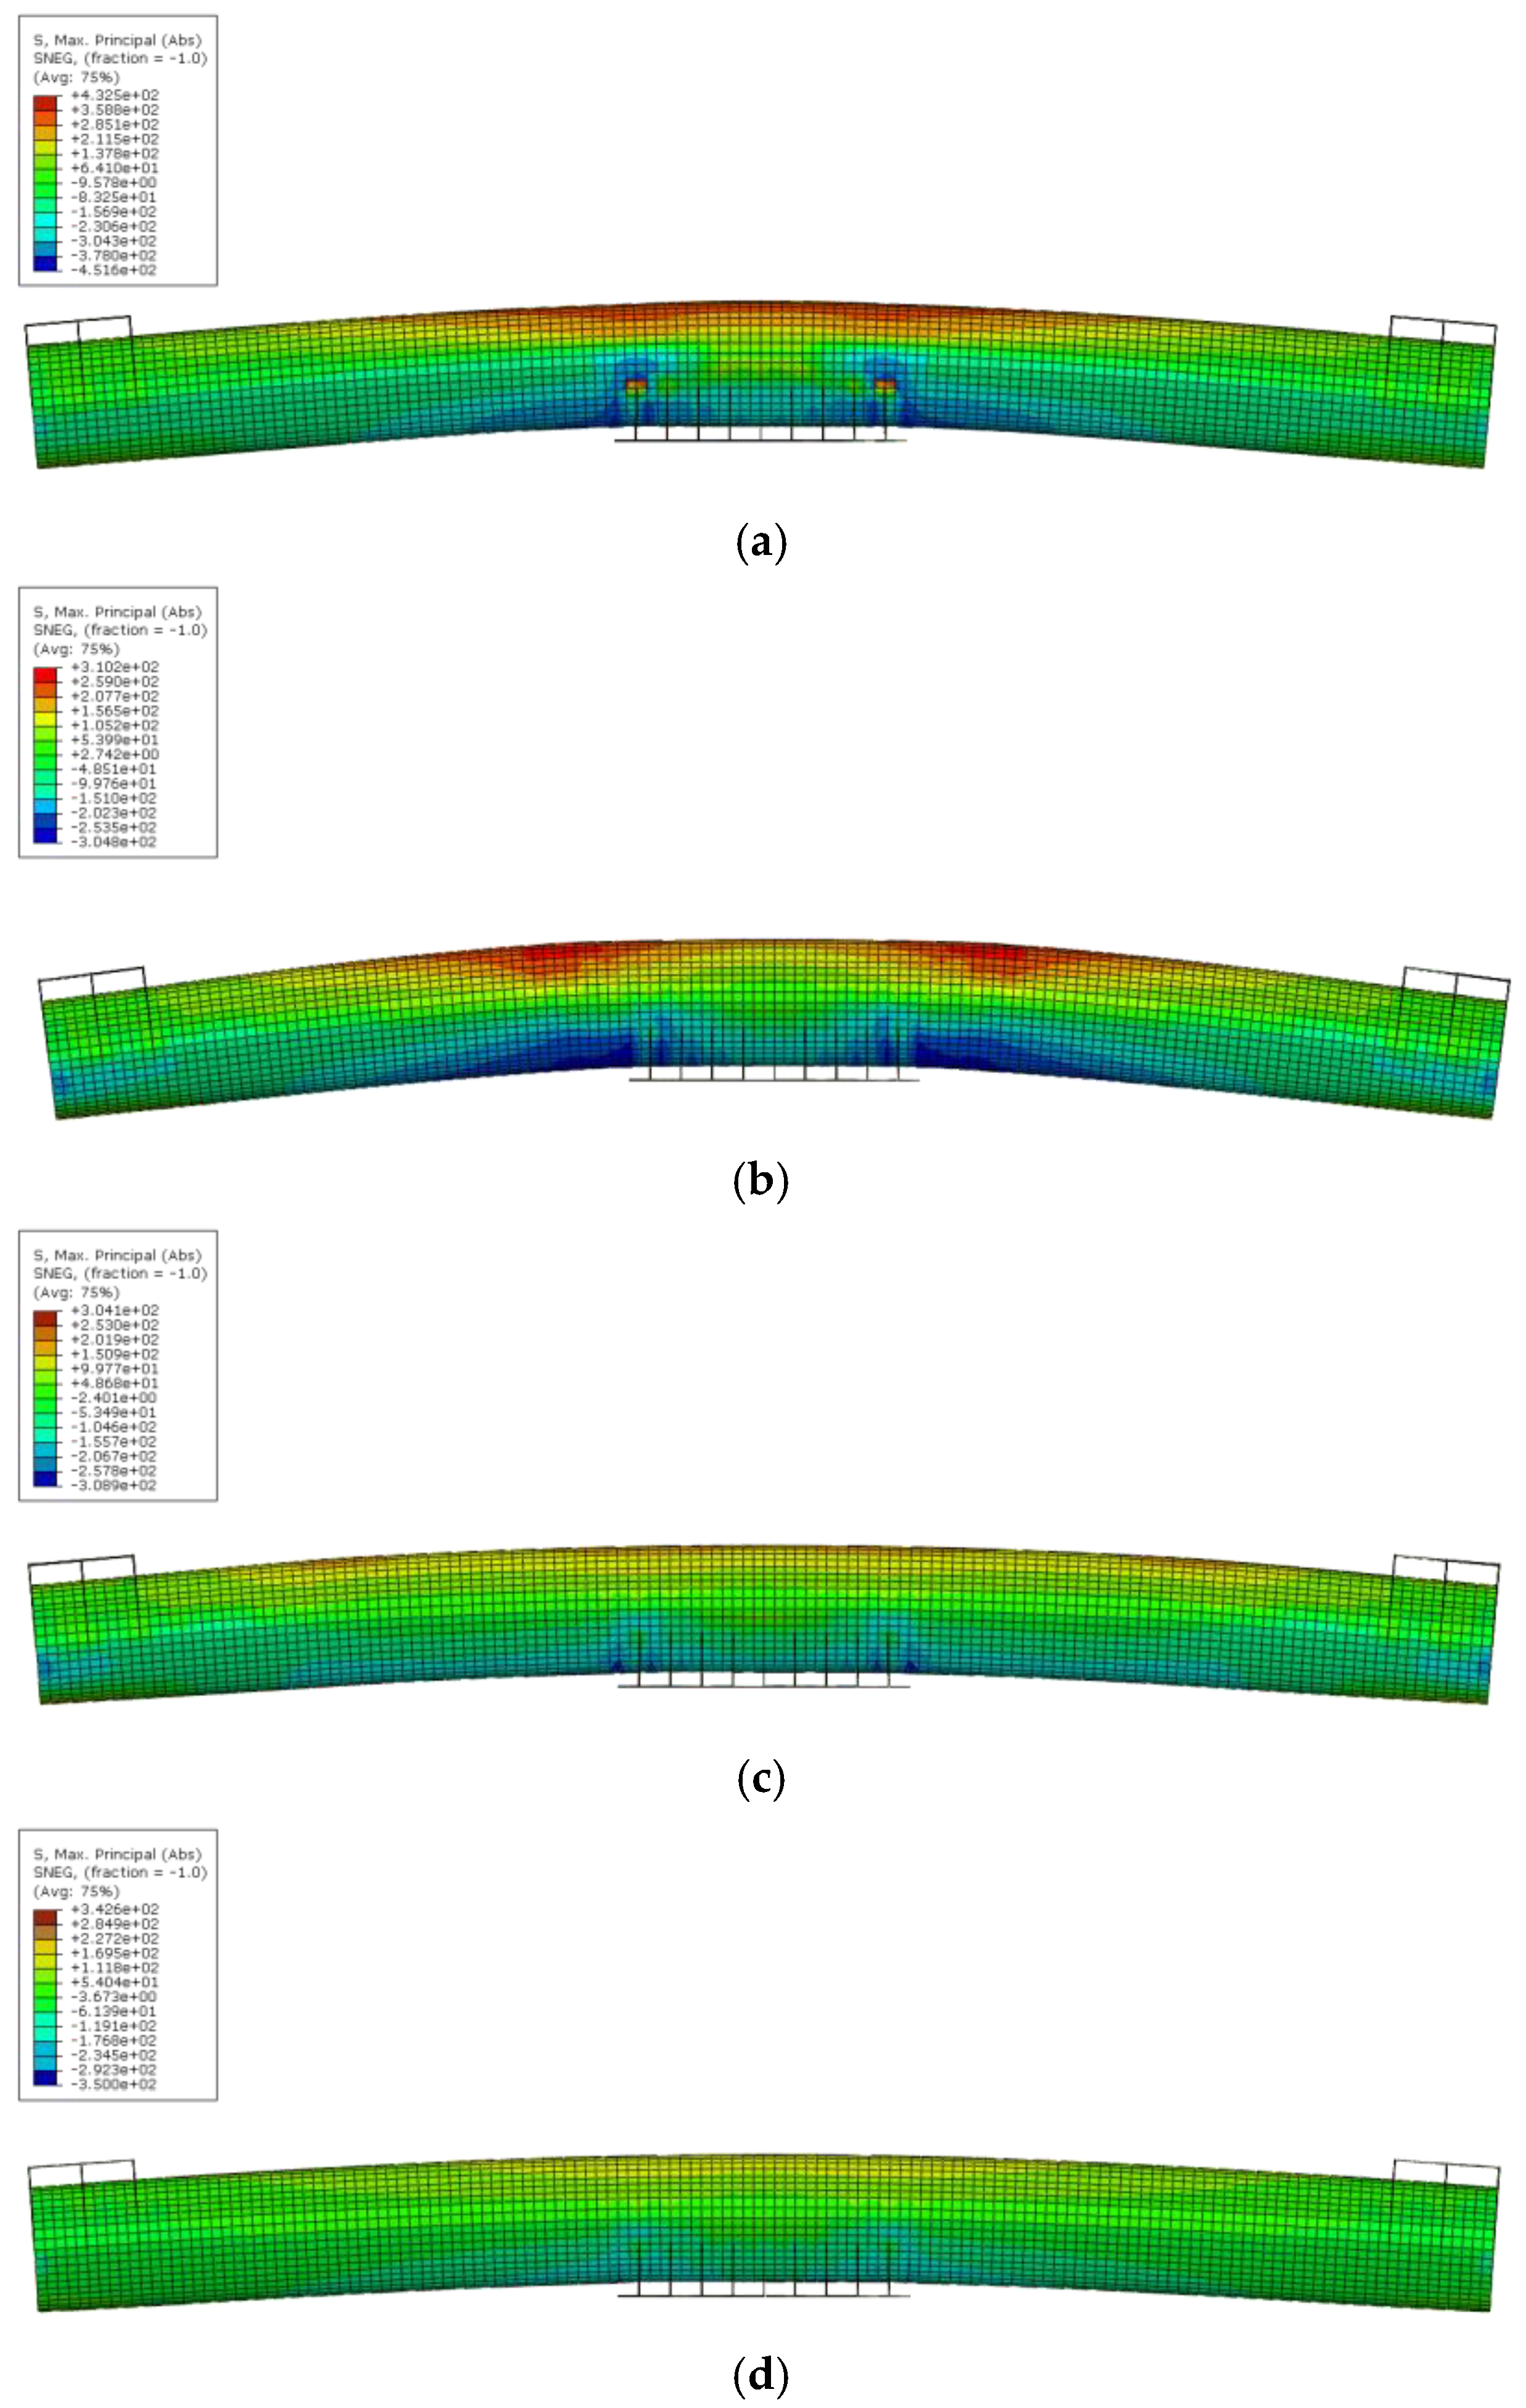
Figure 13 shows the stress distribution of the circular steel-tube girder according to the filling ratio of concrete at a maximum load of 550 kN.
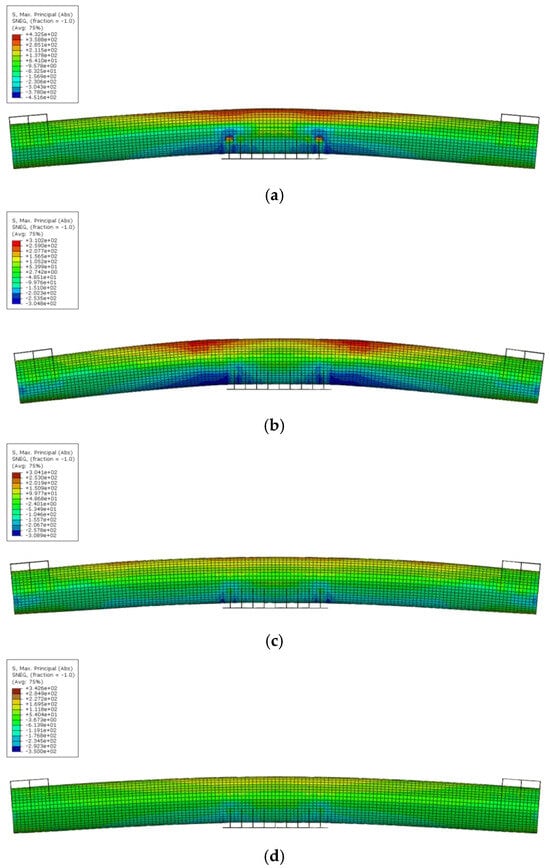
Figure 13.
Stress distribution in maximum load: (a) HCT; (b) CFCT-30; (c) CFCT-60; and (d) CFCT-100.
5. Conclusions
This study aimed to develop a pedestrian bridge with a circular steel-tube girder and assessed the flexural performance of the negative moment region through FEA and experiment. The key findings and conclusions are summarized as follows.
- Under the service load of 175 kN, all members of the proposed pedestrian bridge exhibited stress within the allowable range of 190 MPa. Consequently, the flexural performance of the negative moment region of the pedestrian bridge is analyzed to be safe;
- At the load of 365 kN, equivalent to 210% of the service load, nonlinear behavior containing tensile yielding occurred at the top of the center section of the circular steel-tube girder. Subsequently, additional nonlinear behavior occurred due to local buckling of the circular steel-tube girder at the load of 500 kN;
- The finite element analysis (FEA) results, compared with experimental findings, demonstrated consistent behavior. The local buckling identified in the experiment occurred at the same load level and position as the FEA. Thus, the FEA model proposed in this study can sufficiently predict the structural deformation and failure mode of the proposed pedestrian bridge;
- The FEA results, considering different filling ratios of concrete, indicated a 66.3% reduction in vertical deflection at both ends of the CFCT-100, a 211% increase in yield load, and a 167% increase in maximum load compared to HCT. These results suggest that filling the negative moment region of the circular steel tube with concrete significantly affects vertical deflection and yield load;
- When the circular steel-tube girder was filled with concrete for more than 60% of the length of the girder, the yield load increased by 201% compared to HCT, and the maximum load improved by 155%. Therefore, in terms of economic aspects and constructability, the results suggest that the structural performance can be improved sufficiently if the optimal filling ratio of concrete is more than 60% of the length of the negative moment region of a circular steel-tube girder.
Author Contributions
Conceptualization, C.P.; Data curation, S.C.; Formal analysis, H.Y.; Validation, H.Y.; Writing—original draft, W.C.; Writing—review and editing, H.Y. and W.C. All authors have read and agreed to the published version of the manuscript.
Funding
This research was supported by the Transport of the Korean Government and the Basic Science Research Program through the National Research Foundation of Korea (NRF), funded by the Ministry of Education (2021R1A2C101151713).
Data Availability Statement
Data are contained within the article.
Conflicts of Interest
The authors declare no conflicts of interest. The funders had no role in the design of the study; in the collection, analyses, or interpretation of data; in the writing of the manuscript; or in the decision to publish the results.
References
- Ali, S.; Thambiratnam, D.; Liu, X.; Fawzia, S. Performance evaluation of innovative composite pedestrian bridge. Structures 2020, 26, 845–858. [Google Scholar] [CrossRef]
- Mendes, P.J.; Barros, J.A.; Sena-Cruz, J.M.; Taheri, M. Development of a pedestrian bridge with GFRP profiles and fiber reinforced self-compacting concrete deck. Compos. Struct. 2011, 93, 2969–2982. [Google Scholar] [CrossRef]
- Deng, S.; Shao, X.; Yan, B.; Wang, Y.; Li, H. On flexural performance of girder-to-girder wet joint for lightweight steel-UHPC composite bridge. Appl. Sci. 2020, 10, 1335. [Google Scholar] [CrossRef]
- Cho, S.; Kong, C.; Kim, Y.; Chung, W.; Lee, H. Fatigue and fracture performance of a pedestrian bridge with a circular steel tube girder. KSCE J. Civil. Eng. 2021, 25, 3019–3030. [Google Scholar] [CrossRef]
- Liu, B.; Liu, Y.; Jiang, L.; Wang, K. Flexural behavior of concrete-filled rectangular steel tubular composite truss beams in the negative moment region. Eng. Struct. 2020, 216, 110738. [Google Scholar] [CrossRef]
- Joo, H.; Moon, J.; Choi, B.; Lee, H. Evaluation of flexural ductility of negative moment region of I-girder with high strength steel. KSCE J. Civil. Eng. 2010, 30, 513–523. [Google Scholar] [CrossRef][Green Version]
- Xu, C.; Su, Q.; Wu, C.; Sugiura, K. Experimental study on double composite action in the negative flexural region of two-span continuous composite box girder. J. Construct. Steel Res. 2011, 67, 1636–1648. [Google Scholar] [CrossRef]
- Fan, Z.; Wu, F.; He, L.; He, R.; Zeng, K.; Liu, Z. Experimental Investigation on the Mechanical Performance of Steel-ECC Composite Girders with Corrugated Webs under Negative Moment. Materials 2022, 15, 6539. [Google Scholar] [CrossRef] [PubMed]
- Karalar, M.; Dicleli, M. Low-cycle fatigue in steel H-piles of integral bridges; a comparative study of experimental testing and finite element simulation. Steel Compos. Struct. Int. J. 2020, 34, 35–51. [Google Scholar] [CrossRef]
- AASHTO. LRFD Bridge Design Specifications; American Association of State Highway and Transportation Officials: Washington, DC, USA, 2020. [Google Scholar]
- Korea Road Transportation Association. Korean Highway Bridge Design Code; Korea Road Transportation Association: Seoul, Republic of Korea, 2010. [Google Scholar]
- Ali, S.B.; Kamaris, G.S.; Gkantou, M. Flexural behaviour of concrete-filled double skin aluminium alloy tubes. Eng. Struct. 2022, 272, 114972. [Google Scholar] [CrossRef]
- He, A.; Liang, Y.; Zhao, O. Flexural buckling behaviour and resistances of circular high strength concrete-filled stainless steel tube columns. Eng. Struct. 2020, 219, 110893. [Google Scholar] [CrossRef]
- Lu, H.; Han, L.H.; Zhao, X.L. Analytical behavior of circular concrete-filled thin-walled steel tubes subjected to bending. Thin-Walled Struct. 2009, 47, 346–358. [Google Scholar] [CrossRef]
- Tang, X.; Feng, C.; Chang, J.; Ma, J.; Hu, X. Research on the Flexural Performance of Steel Pipe Steel Slag Powder Ultra-High-Performance Concrete Components. Materials 2023, 16, 5960. [Google Scholar] [CrossRef] [PubMed]
- Federal Highway Administration (FHWA). Recording and Coding Guide for the Structure Inventory and Appraisal of the Nation’s Bridges; Report No. FHWA-PD-96-001; U.S. Department of Transportation: Washington, DC, USA, 2010.
- JIS G 3444; Carbon Steel Tubes for General Structure. Japanese Standards Association: Tokyo, Japan, 2015.
- ASTM A572/A572M-07; Standard Specification for High-Strength Low-Alloy Columbium-Vanadium Structural Steel. ASTM International: West Conshohocken, PA, USA, 2007.
- ISO 630; Structural Steels—Plates, Wide flats, Bars, Sections and Profiles. International Organization for Standardization: Geneva, Switzerland, 2003.
- ABAQUS. ABAQUS/Standard User’s Manual; Version 6.21; ABAQUS, Inc.: Pawtucket, RI, USA, 2022. [Google Scholar]
- De Angelis, F.; Taylor, R.L. A nonlinear finite element plasticity formulation without matrix inversions. Finite Elem Anal Des. 2016, 112, 11–25. [Google Scholar] [CrossRef]
- De Angelis, F.; De Angelis, M. On solutions to a FitzHugh–Rinzel type model. Ric. di Mat. 2021, 70, 51–65. [Google Scholar] [CrossRef]
- Ellobody, E.; Young, B. Structural performance of cold-formed high strength stainless steel columns. J. Construct. Steel Res. 2005, 61, 1631–1649. [Google Scholar] [CrossRef]
- Hafezolghorani, M.; Hejazi, F.; Vaghei, R.; Jaafar, M.S.B.; Karimzade, K. Simplified damage plasticity model for concrete. Struct. Eng. Inter. 2017, 27, 68–78. [Google Scholar] [CrossRef]
- Chang, X.; Wei, Y.Y.; Yun, Y.C. Analysis of steel-reinforced concrete-filled-steel tubular (SRCFST) columns under cyclic loading. Constr. Build. Mater. 2012, 28, 88–95. [Google Scholar] [CrossRef]
- Dai, X.; Lam, D. Numerical modelling of the axial compressive behaviour of short concrete-filled elliptical steel columns. J. Construct. Steel Res. 2010, 66, 931–942. [Google Scholar] [CrossRef]
- Chi, Y.; Yu, M.; Huang, L.; Xu, L. Finite element modeling of steel-polypropylene hybrid fiber reinforced concrete using modified concrete damaged plasticity. Eng. Struct. 2017, 148, 23–35. [Google Scholar] [CrossRef]
- Lee, H.; Jung, W.T.; Chung, W. Post-tension near-surface-mounted strengthening systems of full-scale PSC girders. Constr. Build. Mater. 2017, 151, 71–82. [Google Scholar] [CrossRef]
- Tian, Z.; Cai, Y.; Shi, H.; Wang, G.; Zhang, Z.; Dai, Y.; Xu, B. Simulation of Test Arch Based on Concrete Damage Plasticity Model and Damage Evolution Analysis. Appl. Sci. 2023, 13, 11239. [Google Scholar] [CrossRef]
- Lee, H.; Jung, W.T.; Chung, W. Post-tension near-surface mounted strengthening system for reinforced concrete beams with changes in concrete condition. Compos. B Eng. 2019, 161, 514–529. [Google Scholar] [CrossRef]
Disclaimer/Publisher’s Note: The statements, opinions and data contained in all publications are solely those of the individual author(s) and contributor(s) and not of MDPI and/or the editor(s). MDPI and/or the editor(s) disclaim responsibility for any injury to people or property resulting from any ideas, methods, instructions or products referred to in the content. |
© 2024 by the authors. Licensee MDPI, Basel, Switzerland. This article is an open access article distributed under the terms and conditions of the Creative Commons Attribution (CC BY) license (https://creativecommons.org/licenses/by/4.0/).


