Abstract
Ground-motion intensity measures (IMs), which quantify and describe the characteristics of earthquake ground motion, are of utmost importance in the assessment of seismic risk and the design of resilient structures with large spans. The appropriate selection of a ground-motion IM is crucial in establishing a reliable and robust correlation between seismic hazards and structural demands. The current study presents a novel ground-motion IM that incorporates the influence of multiple vibration modes and period elongation resulting from isolation based on the velocity spectrum. A comprehensive study has been conducted to examine the efficiency of 37 different ground-motion IMs on a roof-isolated large-span structure with engineering demand parameters (EDPs), using far-field ground-motion data. The initial examination of the proposed intensity measure involves a planar lumped-mass model. Subsequently, a numerical model of a large-span roof-isolated structure, specifically the Beijing Workers’ Stadium, is constructed and examined. The results suggest that the proposed intensity measure (IM) demonstrates satisfactory adequacy and achieves optimal efficiency when considering three different engineering demand parameters among 37 other ground-motion intensity measures.
1. Introduction
In recent years, there has been a growing preference for large-span structures in the construction of iconic building roofs. These structures are known for their capacity to distribute forces well, exhibit exceptional overall integrity, and stability. Notwithstanding the exceptional structural performance, it is worth noting that large-span spatial roofs may experience significant structural damage when subjected to certain seismic events, wind loads, and fluctuations in temperature [1]. To avoid the damage, a careful assessment of the structural load [2,3,4], and a precise numerical analysis of the structural mechanical performance [5,6,7] of large-span spatial structures have been conducted, and new technologies, including seismic isolation for domes and lattices, have been developed to meet diverse and demanding design needs [8,9,10]. The distinctive structural configurations of large-span spatial structures are marked by the abundance of natural frequencies and three-dimensional vibration modal shapes under seismic loading. The seismic response of these structures is influenced by multiple modes, with high-order modes typically playing a dominant role [11,12,13]. For the seismic design of spatial structures using a mode superposition dynamic analysis, an essential criterion is needed to discern the dominant modes.
Roof-isolation systems, implemented by inserting isolation bearings between the roof and supporting columns of a building, can alleviate the thermal load and filter inertial forces transmitted to the roof. As a result, these systems serve as an elegant and efficient solution for enhancing the seismic resilience of large-span structures. Large-span roof isolation provides several advantages, such as the release of thermal stresses, the isolation of earthquake effects, and the enhancement of the structural seismic behavior via the mass-damping effects [14,15,16,17,18,19]. To enhance the credibility of seismic performance evaluations for large-span structures with roof isolation, it is inevitable to have a comprehensive understanding of the advancement of a more sufficient, efficient, and reliable ground-motion intensity measure to cover those structures.
Quantifying the attributes of ground motion and describing the possible structural harm that may occur in the event of an earthquake, ground-motion IMs are indispensable in the fields of earthquake engineering and seismic-risk assessment [20]. The careful selection of ground intensity contributes to a more precise assessment of seismic performance and the successful mitigation of the variability in predicting structural reactions. Earthquakes are often assessed based on parameters such as frequency, amplitude, and duration. The investigation of intensity measures in seismic analysis commonly focuses on the peak ground acceleration (PGA) and fundamental period spectral acceleration () due to the extensive availability of hazard curves for these parameters. Regrettably, a plethora of studies have demonstrated that, in certain instances, may not possess sufficient predictive capability. Given its failure to incorporate the elongated period, as the structure extends beyond the point of elasticity, and its neglect of the impact of the higher modes, is inadequate. In order to address the constraint above, researchers have devised a range of IMs that are derived from the acceleration spectrum.
Generally, the modification of the spectral-acceleration-based intensity measures is in the power-law form and in the power-law form and linear superposition form. Cordova et al. [21] present an IM in exponential form to reflect the acceleration spectral shape. Based on the acceleration spectrum, Lin et al. [22] design two exponential form IMs, denoted as and , which account for the first two modes of participation and period elongation, respectively. Similarly, Lu et al. [23] propose an improved IM, and Zhou and Su [24] develop and for super-high buildings. In addition to exponential form intensity measures, Shome [25] introduces two linear IMs, denoted as and , which consider the initial two periods and three modes, respectively. Zhang et al. [26] propose a linear IM, , based on the acceleration spectrum.
The peak ground velocity (PGV) measure, which is less sensitive to the higher-frequency components, is another useful ground-motion intensity measure. Extensive research has demonstrated that isolated structures which are susceptible to loading within the intermediate-frequency range may benefit from considering velocity-related IMs, as they can offer a more precise assessment of the likelihood of damage [27,28,29]. Housner’s definition of seismic intensity (SI) involves calculating the area under the pseudo-velocity spectrum curve within the frequency range of 0.1 s to 2.5 s [30]. Von Thun et al. [31] modify the seismic intensity (SI) measure by incorporating a velocity spectrum, resulting in the development of a novel intensity measure known as the Velocity Spectrum Intensity (VSI) measure. The VSI measure has demonstrated considerable potential as an intensity measure due to its strong association with the structural damage observed in tall buildings. Based on the normalized velocity response spectrum, the Applied Technology Council defines the effective peak velocity as the mean spectral velocity within the period range of 0.1 to 0.5 s divided by 2.5. [32] These intensity measures mentioned above employ the integer operations of the velocity spectrum and cover a frequent period range of low-rise structures. However, due to the significant influence of multiple vibration modes on the dynamic response of structures, several velocity spectrum-based IMs have been devised to account for the impact of multiple vibration modes. Zhang et al. [33] propose a modification to the existing approach by substituting spectral acceleration with spectral velocity, resulting in the development of a novel intensity measure based on the velocity spectrum. Xiao et al. [34] employ the normalized modal mass participation coefficient as a weighing exponent and present a new intensity measure derived from the velocity spectrum.
Despite the fact that extensive research has been carried out on the efficiency of intensity measures across various structural types, only a limited number of studies have specifically examined isolated structures. According to Ryan [35], the PGV measure is a generally reliable IM when it comes to forecasting the behavior of base-isolated structures. Narasimhan et al. [36] examine the efficiency of velocity-based IMs in predicting the nonlinear behavior of structures with base-isolation elements and find that the PGV measure can reduce the variability of maximum base displacement. Additionally, the research conducted by Avsar [37] suggests that velocity-related intensity measures (IMs) exhibit a more robust association with the isolation system’s response. The peak ground velocity (PGV) measure is the preeminent indicator among velocity-associated intensity measures examined in the existing body of literature. The suitability of ground-motion intensity measurements for tall structures made of seismically isolated reinforced concrete is investigated by Yang et al. [38]. The researchers conclude that the modified VSI measure demonstrates a high degree of efficiency in accurately forecasting structural displacement, exhibiting a satisfactory level of sufficiency.
As discussed, current studies concerning the ground-motion intensity measures for seismic-isolation structures have mainly focused on examining the effectiveness of intensity measures in base-isolated buildings. The relationship between roof-isolated structures and the IM is not straightforward. Consequently, this paper presents a correlation study between the EDPs of roof-isolated large-span structures and 37 ground-motion IMs, including a new IM that is based on the velocity spectrum.
2. Introduction of Ground-Motion IMs
The characteristics of ground motion that are important in earthquake engineering applications are amplitude, frequency content, and duration. It is vital to acknowledge that the complexity and ambiguity surrounding earthquake ground motions make it exceedingly difficult to identify an intensity measure that can effectively capture all the significant properties of these ground motions.
2.1. A Novel Ground-Motion IM for Roof-Isolation Structures
Recent research has demonstrated that the utilization of spectral velocity-related intensity measures has proven to be effective in the seismic evaluation of base-isolated structures. However, there is a limited body of research on the relationship between ground-motion intensity measures and roof-isolated structures. The roof-isolation system involves the placement of isolator bearings between the roof of a building and the supporting columns, as well as the incorporation of viscous dampers that are connected to both the roof and a structural element situated beneath it. Roof-isolation structures, being a specific category of inter-story-isolated systems, demonstrate additional sets of modes in their dynamic response, characterized by significant mass participation as compared to base-isolation structures. Furthermore, the implementation of isolation bearings has the effect of increasing the duration of structural vibration periods, which leads to a reduction in the seismic base shear force. In certain circumstances, the isolated roof can also function as a vibration absorber and mimic the behavior of a nonconventional Tuned Mass Damper (TMD) on the lower levels of the structure. To achieve the desired Tuned Mass Damper (TMD) effect, it is necessary to employ roof-isolation bearings in the design and maintain an appropriate mass ratio between the lower structure and the isolated structure. The significance of the mass ratio in the response of the inter-story-isolated structures has been demonstrated, as it determines the dominant element of behavior and facilitates the identification of the governing relationship between isolation and tuned mass damping.
Hence, it is imperative to incorporate the aforementioned qualities when synthesizing a ground-motion intensity measure for roof-isolation structures. Intensity measures often incorporate the influence of multiple vibration modes and elongated periods by utilizing linear combinations or exponential expressions of spectral amplitudes. The ground-motion IMs with linear combinations or exponential expressions are presented in Table 1.

Table 1.
Summary of the spectrum-based IMs.
The IMs presented in Table 1 incorporate either the inclusion of multiple vibration modes or the elongated period, but not both simultaneously. Additionally, it is important to consider the reasonable inclusion of the influence of the roof mass ratio. The design and expression of the new IM is based on the earlier work indicated in Table 1, which is expressed as follows:
where is the ith modal spectral velocity, refers to the ith modal spectral velocity of the isolated structure, n is the number of modes that included, denotes the roof mass ratio and is used to adjust the effect of roof isolation. It is evident that accounts for both the spectral characteristics of seismic velocity and the influences of the higher modal vibration of the structure and roof-isolation effects. Meanwhile, it inherits the advantages of existing IMs by incorporating both exponential and linear combination approaches.
2.2. The Other Ground-Motion Intensity Measures
In conclusion, it is evident that no individual IMs have the capability to offer the most accurate prediction in terms of the structure’s response. However, certain measures may exhibit greater efficacy as predictors of response, depending on the features of the structure. To conduct a thorough comparative analysis, some ground-motion IMs have been chosen for inclusion in this study. Table 2 provides concise definitions and introductory explanations for the ground-motion intensity in question. Based on the definitions provided in Table 2, the peak ground acceleration (PGA), peak ground velocity (PGV), and peak ground displacement (PGD) measures exhibit a direct correlation with the magnitude of ground motions. The utilization of these IMs has been extensively implemented in several design codes owing to their practicality as well as ease of use. Additional IMs, which are not immediately derived, typically involve a more intricate formulation, such as the Arias intensity (AI), Housner’s spectral intensity (SI), and effective peak acceleration (EPA), among others. In this study a total of 37 ground-motion IMs are examined. These IMs discussed in earthquake engineering are widely utilized, with comprehensive documentation provided in the literature [40,41].
Table 2.
Information of the introduced ground-motion IMs.
3. Ground-Motion Database
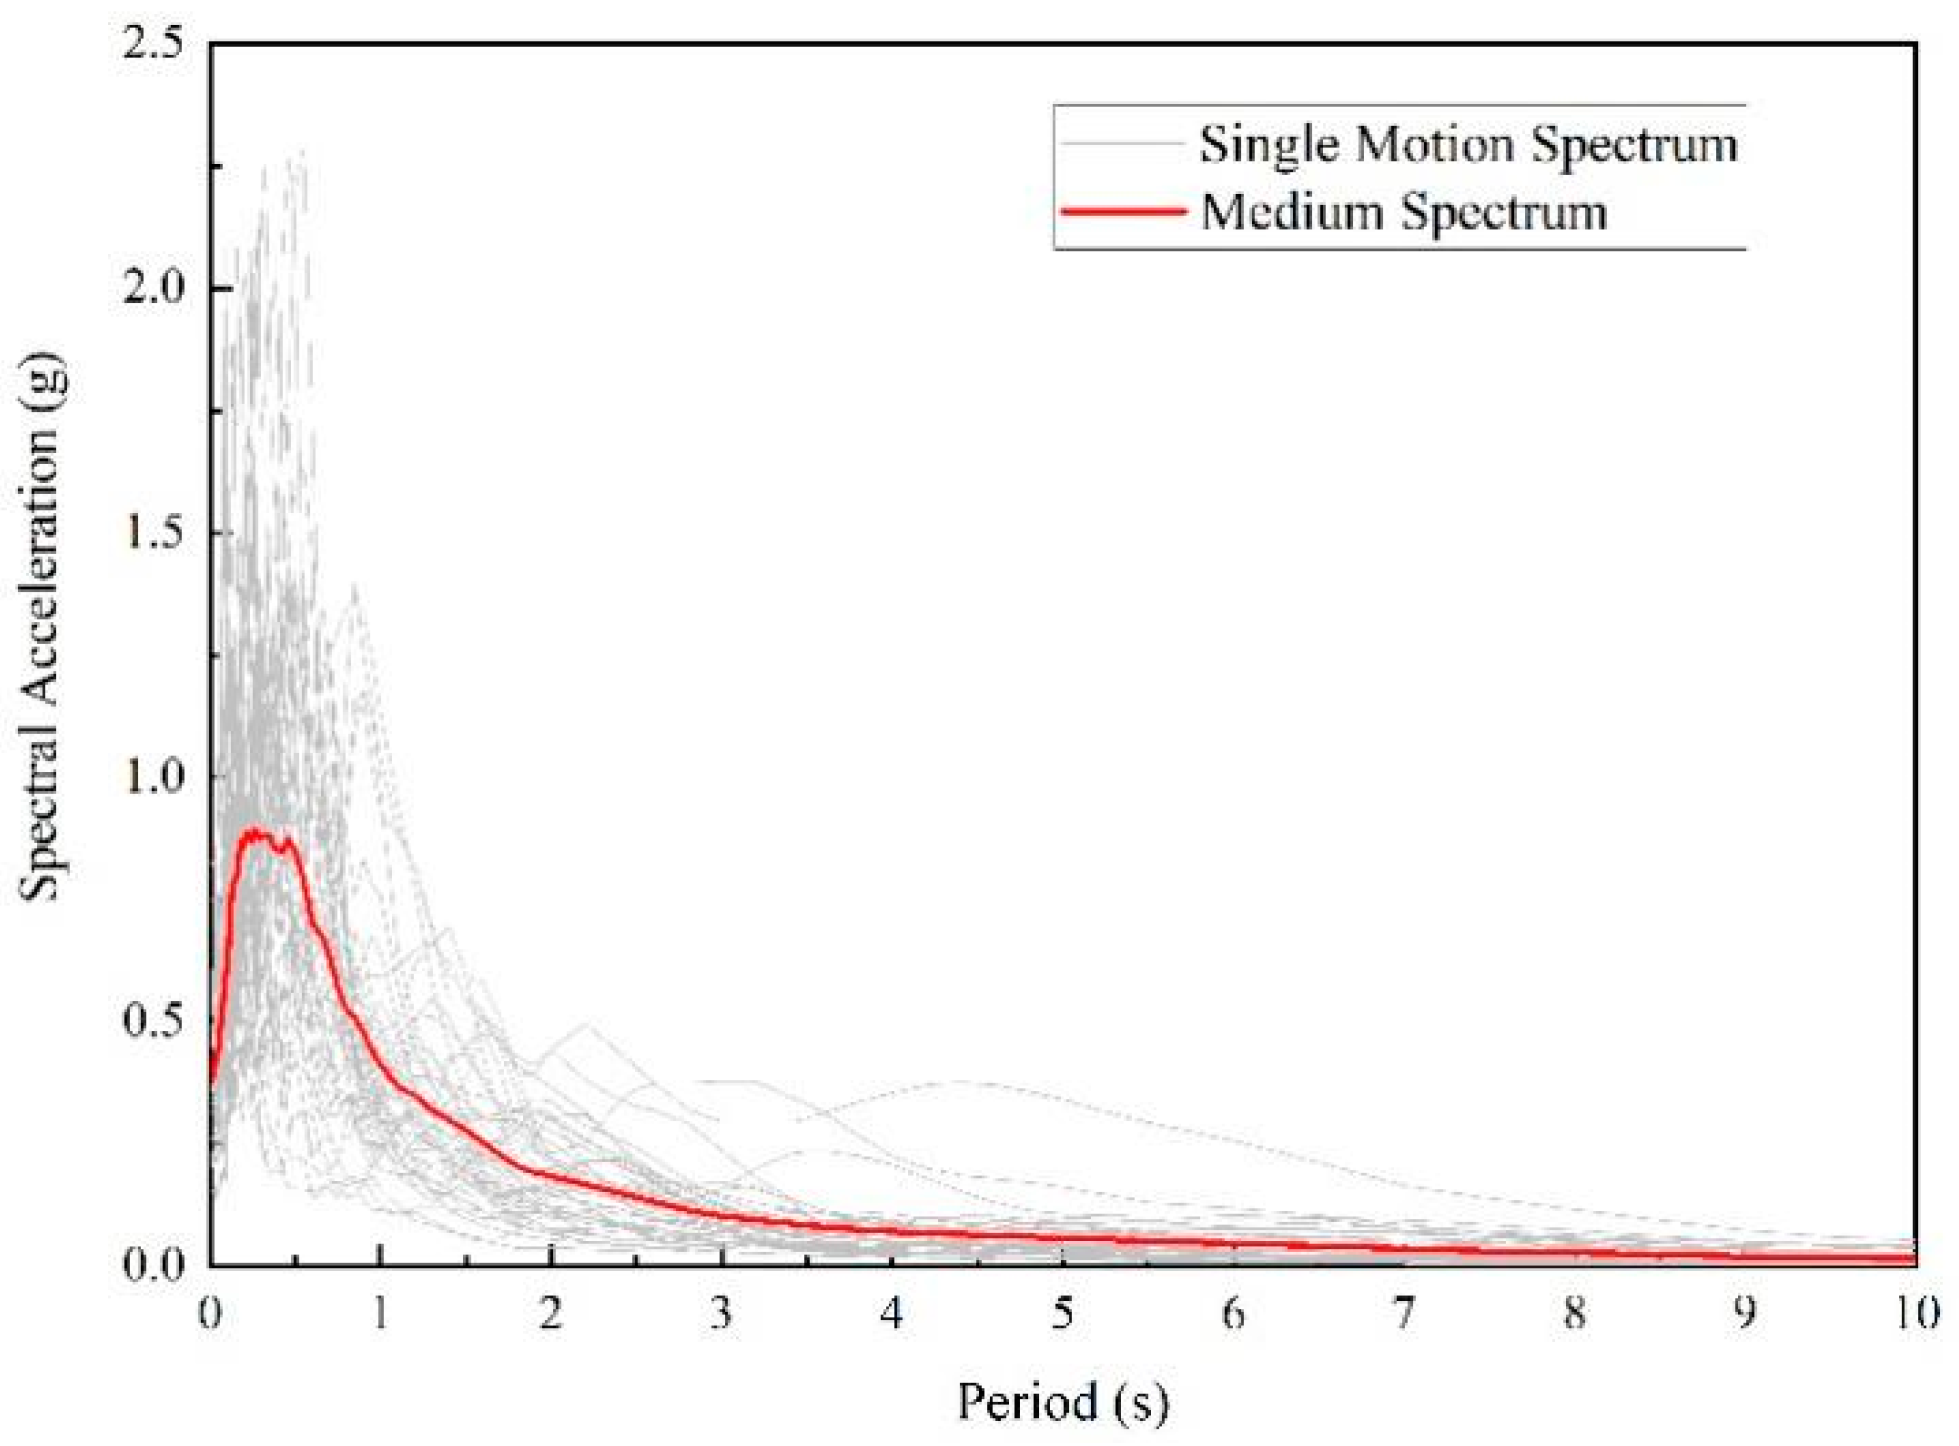
Generally, in the current investigations of ground-motion intensity measures, there are two approaches commonly employed for the selection of ground-motion records. The first is to directly select the ground-motion records recommended in the appendix of FEMA P695 [50] for analysis. The second approach relies on the seismic code to choose ground-motion records depending on the specific characteristics of the site where the structure is situated. Most of the known studies opt for the first method. Furthermore, the process of evaluating the sufficiency of the ground motion entails computing the correlation between the residual of the intensity measure (IM) and the distance from the epicenter, denoted as R. In order to ensure the generality and universality of the research results, it is necessary to ensure enough far-site ground-motion samples. Consequently, a selection of 22 far-field seismic ground motions, as recommended by the FEMA P695 guidelines, sourced from the NGA project database, is employed in the dynamic analysis of a roof-isolated structure in the following sections. Figure 1 depicts the acceleration spectrum of the aforementioned records. The seismic events encompass a range of magnitudes, specifically falling within the interval of 6.5 to 7.9. Additionally, the distance exhibits variability, ranging from 7 km to 23 km. The comprehensive data pertaining to the ground-motion recordings is shown in Table 3. The ground-motion data that have been chosen in the time history analysis have not undergone any scaling. Table 3 presents a comprehensive overview of the ground-motion recordings, providing detailed information.
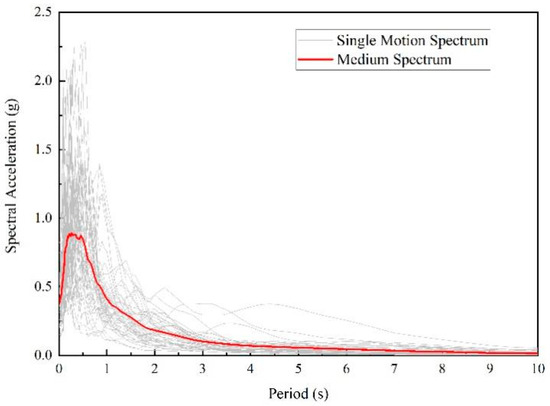
Figure 1.
Representation of the distribution of acceleration spectrum.
Table 3.
Ground-motion records.
4. Property of Ground-Motion IMs
To evaluate the predictive capability of an intensity measure, a number of properties are typically examined. In this investigation, both sufficiency and efficiency are taken into account. Engineering demand parameters (EDPs) are numerical metrics that are employed to assess the response and reaction time of a system or structure in the event of an earthquake. Physical quantities that can be explicitly measured or calculated using information on the structure’s response are the typical sources from which EDPs are derived. The parameters have been deliberately chosen to encompass essential elements of the response that are crucial for evaluating the functionality and safety of the structure.
4.1. Efficiency
An efficient IM is characterized by the ability to induce a comparatively low degree of variation in the structural response for a specific value of the IM. Shome et al. [25] demonstrate that the connection between the IM and EDP generally adheres to a standard power law. As a result, regression analyses are conducted utilizing the subsequent functional form:
where and denote the coefficients. We can rewrite Equation (2) in linear logarithm expression as follows:
Equation (3) is employed in the context of linear regression analysis to quantitatively assess the pattern exhibited by the dataset.
The Pearson correlation coefficient, which is a statistical metric employed to quantify the degree of linear association between two variables, is used to quantify the level of efficiency of an intensity measure. The correlation between two variables is stronger when the coefficient approaches 1. The Pearson correlation coefficient can be expressed as follows:
where and are the average values. n is the data number.
4.2. Sufficiency
In the performance-based seismic-evaluation system, evaluating the annual average probability of a structure exceeding a certain limit state on the specific site is a crucial aspect. Sufficiency describes the statistical independence of the seismic intensity indicators from the seismic characteristic parameters (usually magnitude M and distance R). If the seismic intensity indicator lacks sufficiency, the seismic evaluation of the structure will depend to some extent on the selection of seismic motions. The sufficiency of the IM is quantified by the following equations [51]:
When the significance level index in the residual regression on magnitude M or the logarithm of distance R exceed 0.05, the IM is proved to be sufficient.
5. Discussion
In this section, the ground-motion intensity measures of the roof-isolated structure are investigated using a multi-degree-of-freedom (MDOF) planar lumped-mass elastic model and a three-dimensional real stadium structural model. MDOF models can be used to explore multiple solutions by modifying design parameters throughout the basic design process. However, they fail to account for the torsion effect and the nonlinear behavior of a real structure. As a result, following the initial investigation with the MDOF model, a three-dimensional real stadium structural model is developed.
5.1. Planar Lumped-Mass Elastic Multi-Degree-of-Freedom Models
The literature [52] reports the existence of a prototype three-story steel skyscraper of this particular kind. Figure 2 presents a visual depiction of the MDOF lumped-mass model. The graphic presented illustrates the simplification of each layer as a lumped mass, with the roof being isolated by the implementation of isolators. The floor-to-floor height is 3.96 m. The effective stiffness is 3000 N/mm in the horizontal direction. The vertical connection of each floor is modeled by the elastic beam element. The column bases are modeled as fixed at the ground level to the ground. The Bouc–Wen model, which is extensively employed in the simulation of isolators, is used to illustrate the behavior of isolation. The initial proposal of this model by Bouc in 1967, followed by subsequent modifications by Wen, provides a description of the characteristics of the isolation system [53,54]. The elastic time history analysis is performed with SAP2000. Table 4 presents the mass data and dynamic parameters of the model. It is important to acknowledge that the vibration period of the roof-isolated model is denoted as CTi, in order to distinguish it from the vibration period of the non-isolated model, Ti. The lumped-mass model and Bouc–Wen model are depicted in Figure 2. The dynamic properties of the lumped-mass model is shown in Table 5.
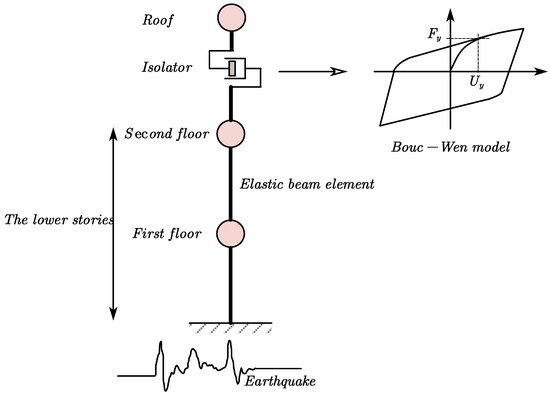
Figure 2.
Depiction of the lumped-mass model.
Table 4.
Mass properties of the lumped-mass model.
Table 5.
Dynamic properties of the lumped-mass model.
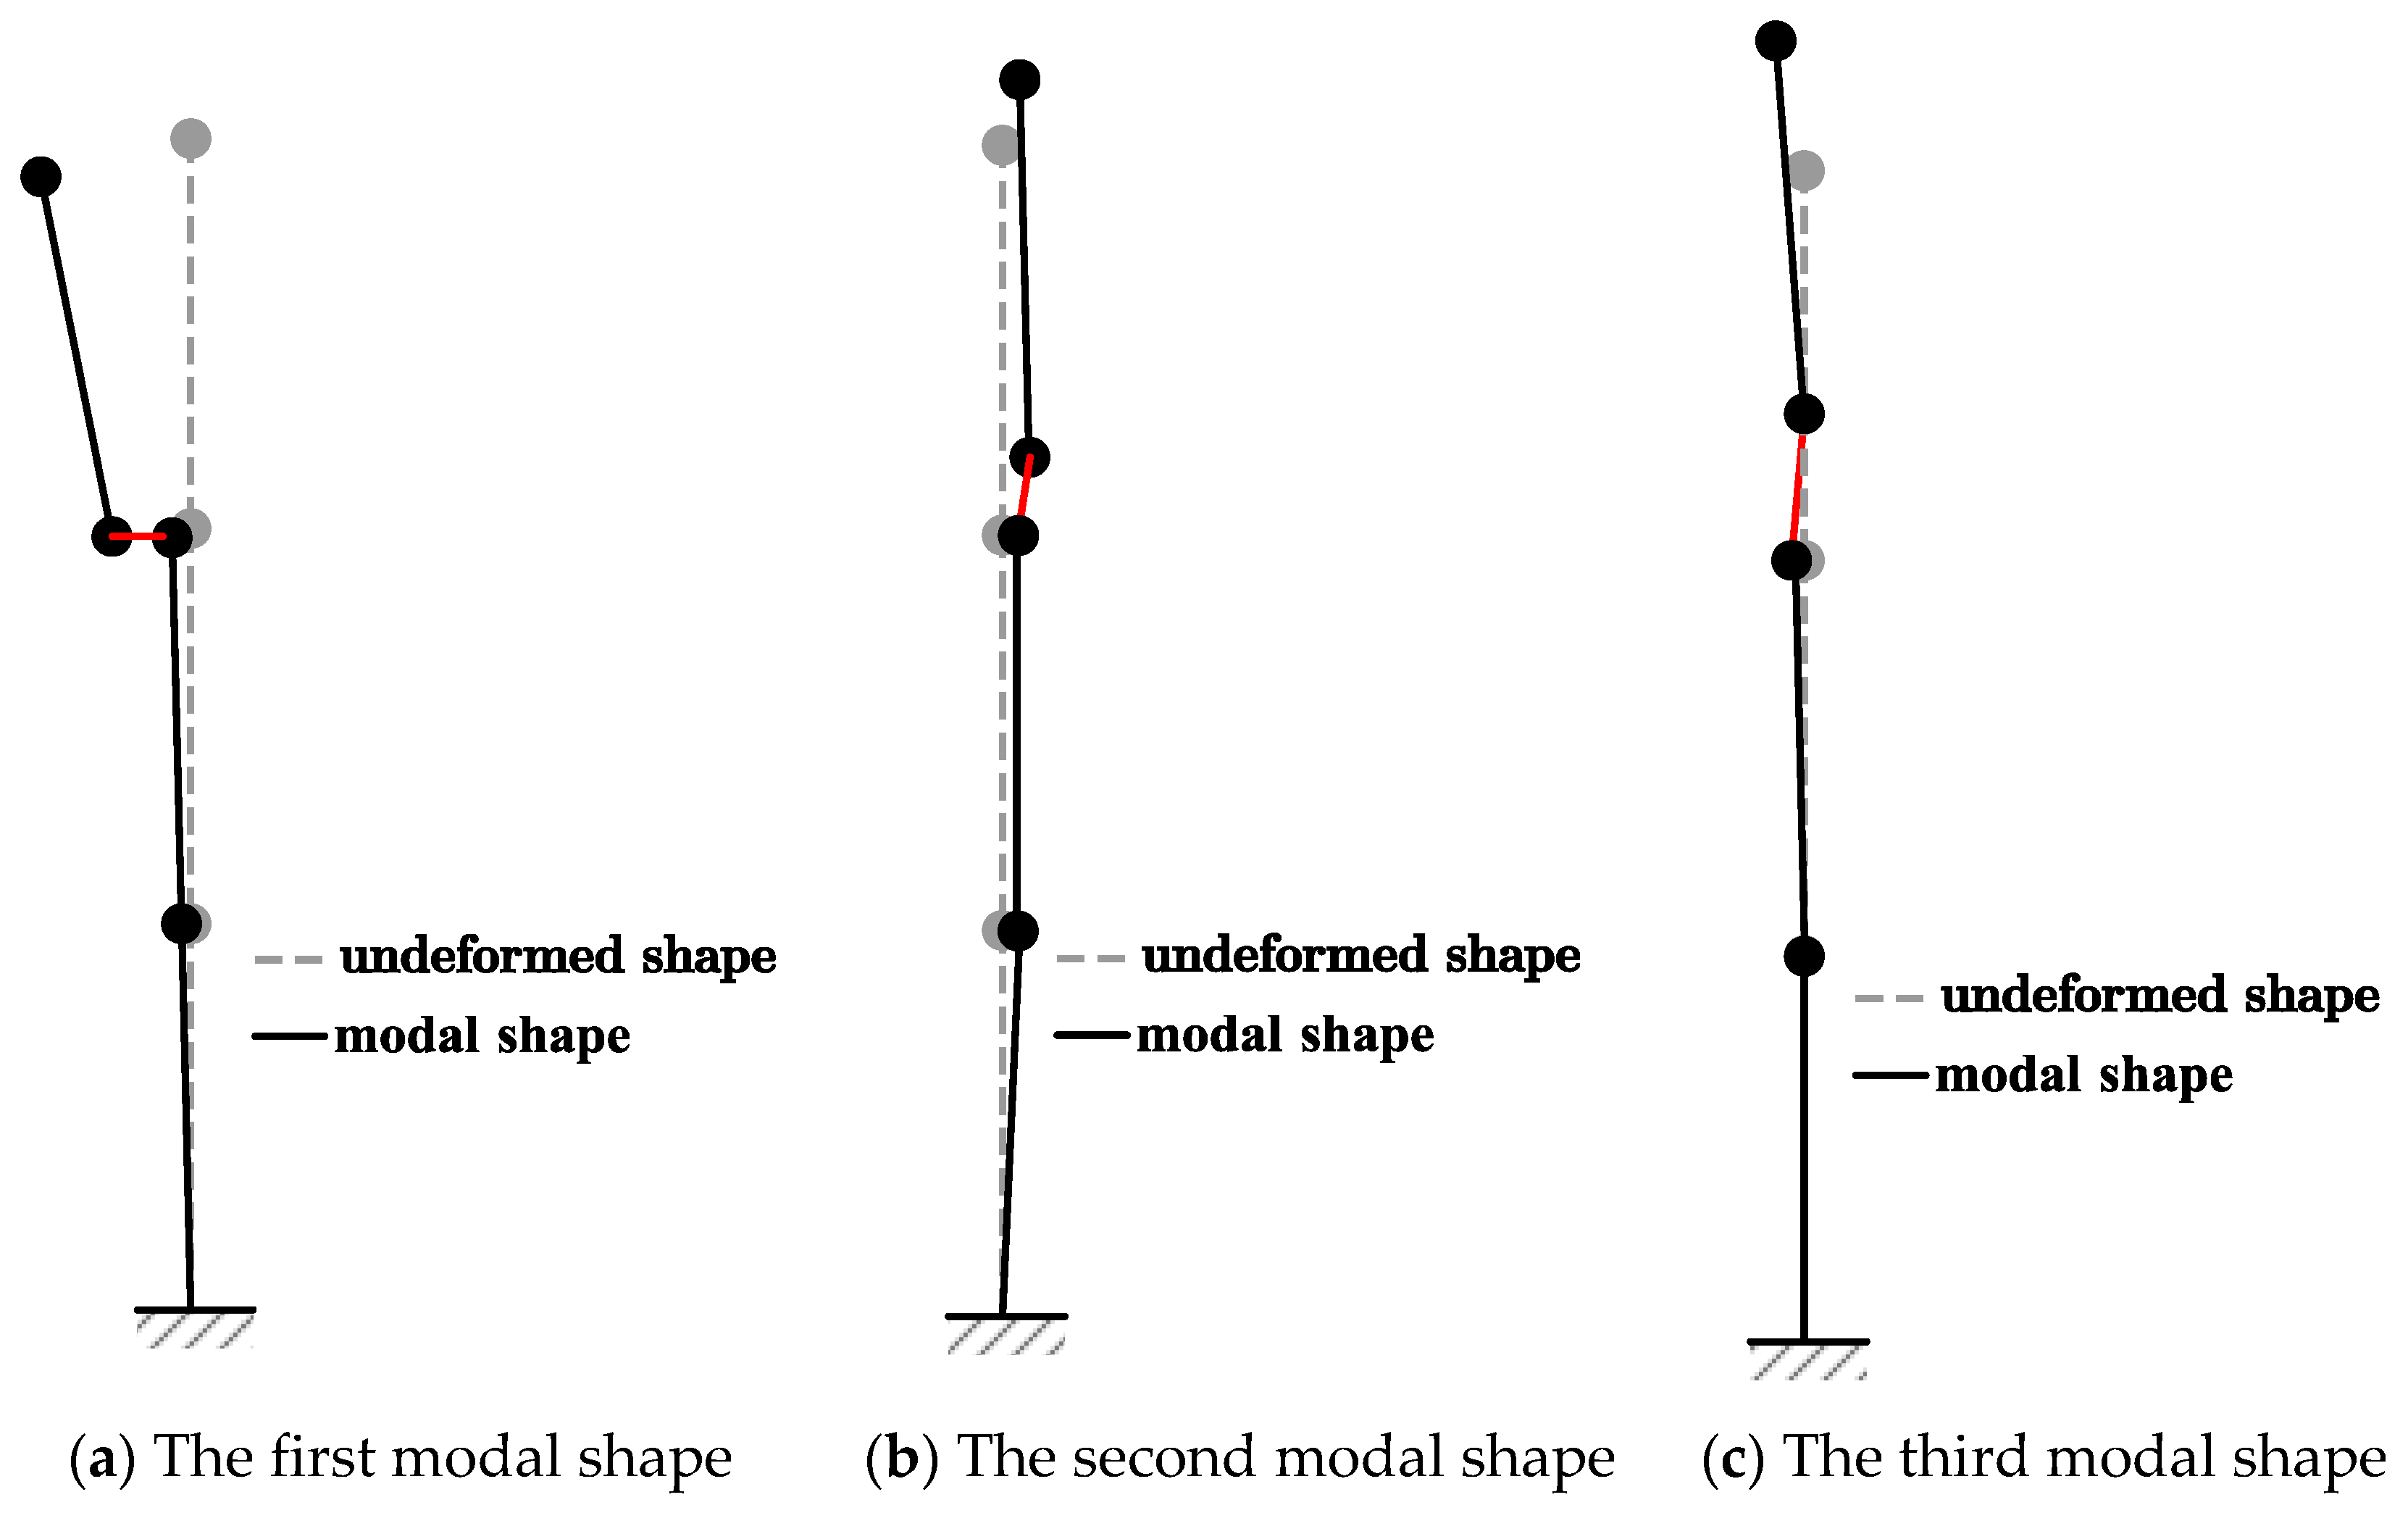
In general, the presence of an isolated roof contributes to two structural phenomena: the isolation effect and the mass-damping effect. It has been demonstrated that the mass ratio is a significant factor influencing the interaction between the two effects. An increase in the mass ratio between the isolated layers typically leads to a transition from mass damping to isolation. In the case of roof-isolated constructions, particularly those with enormous spans, it is observed that the mass of the roof is rather insignificant when compared to the mass of the lower floors. The dominance of the mass-damping effect is observed in the structural response. In certain instances, the mass of the roof may be insufficient to effectively decrease the displacement or base shear stress experienced by the lower levels. However, it is important to acknowledge that the primary focus of this study is on examining the connection between structural response and ground-motion IMs. This study does not place significant emphasis on comparing and analyzing the effects of isolation and mass damping. The first three modal shapes of the lumped-mass model are illustrated in Figure 3. The first three modal periods are 1.594, 1.320, and 1.120, respectively.
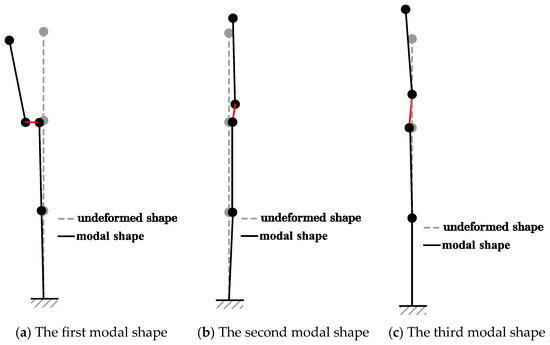
Figure 3.
The first three modal shapes of the lumped-mass model.
5.1.1. Dynamic Response of the Lumped-Mass Model
The structural response is influenced by various factors, including the structural design, materials used in construction, and the dynamic properties of the ground motion. A total of 44 ground-motion records are put into the elastic time history analysis. Key aspects of the dynamic response of a structure include the maximum inter-story drift ratio (MIDR) and the maximum floor acceleration (MFA). The MIDR is essential for assessing the seismic performance of a structure. It helps to determine if the structure can withstand the lateral forces generated by seismic events without experiencing excessive damage or collapse. Different building codes and design standards specify maximum allowable drift ratios based on factors such as the building’s occupancy, structural system, and location in a seismic zone. The MFA is strongly related to the seismic-resilience assessment and is crucial to ensure public safety and minimize the non-structural members of the structure.
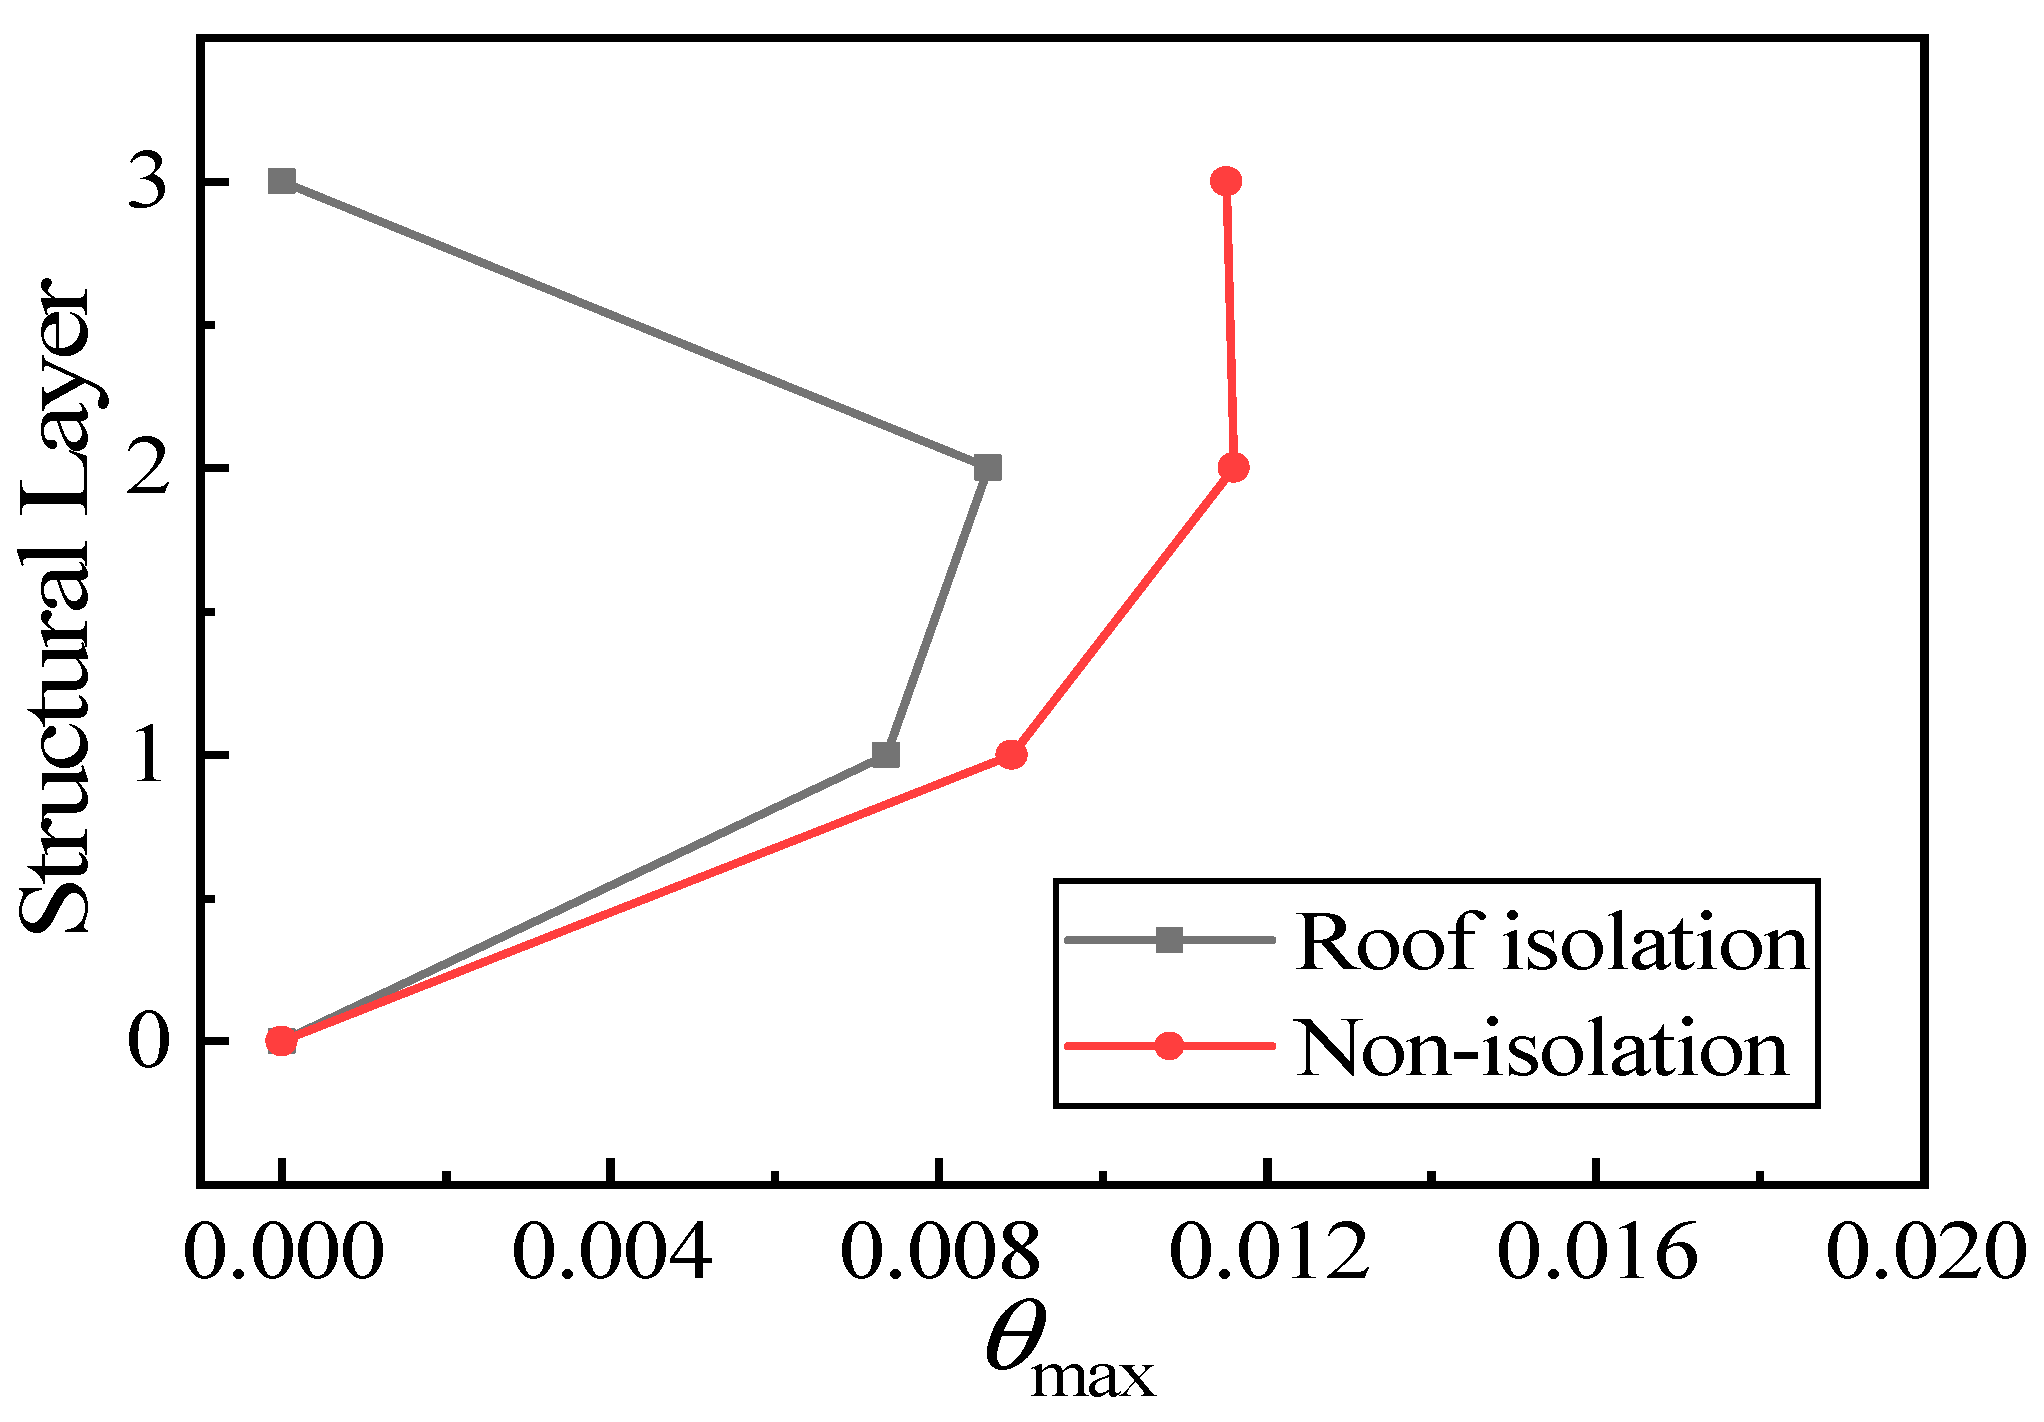
The average inter-story drift ratio of both the roof-isolated and non-isolated structure under the far-field record is illustrated in Figure 4. The standard derivation of the maximum inter-story drift ratio is 0.0038 for the roof-isolated model and 0.0047 for the non-isolated model. The displacement curve of the non-isolated model exhibits a bending deformation pattern. After the roof isolation, there is no significant change in the base shear and the of the first floor. As the number of floors increases, the inter-story drift ratio gradually decreases. Due to the use of roof isolation, the motion pattern of the roof changes to translation under the action of an earthquake, and the becomes almost zero.

Figure 4.
Average maximum inter-story drift of the structure under the 44 far-field ground-motion records.
5.1.2. Regression Study
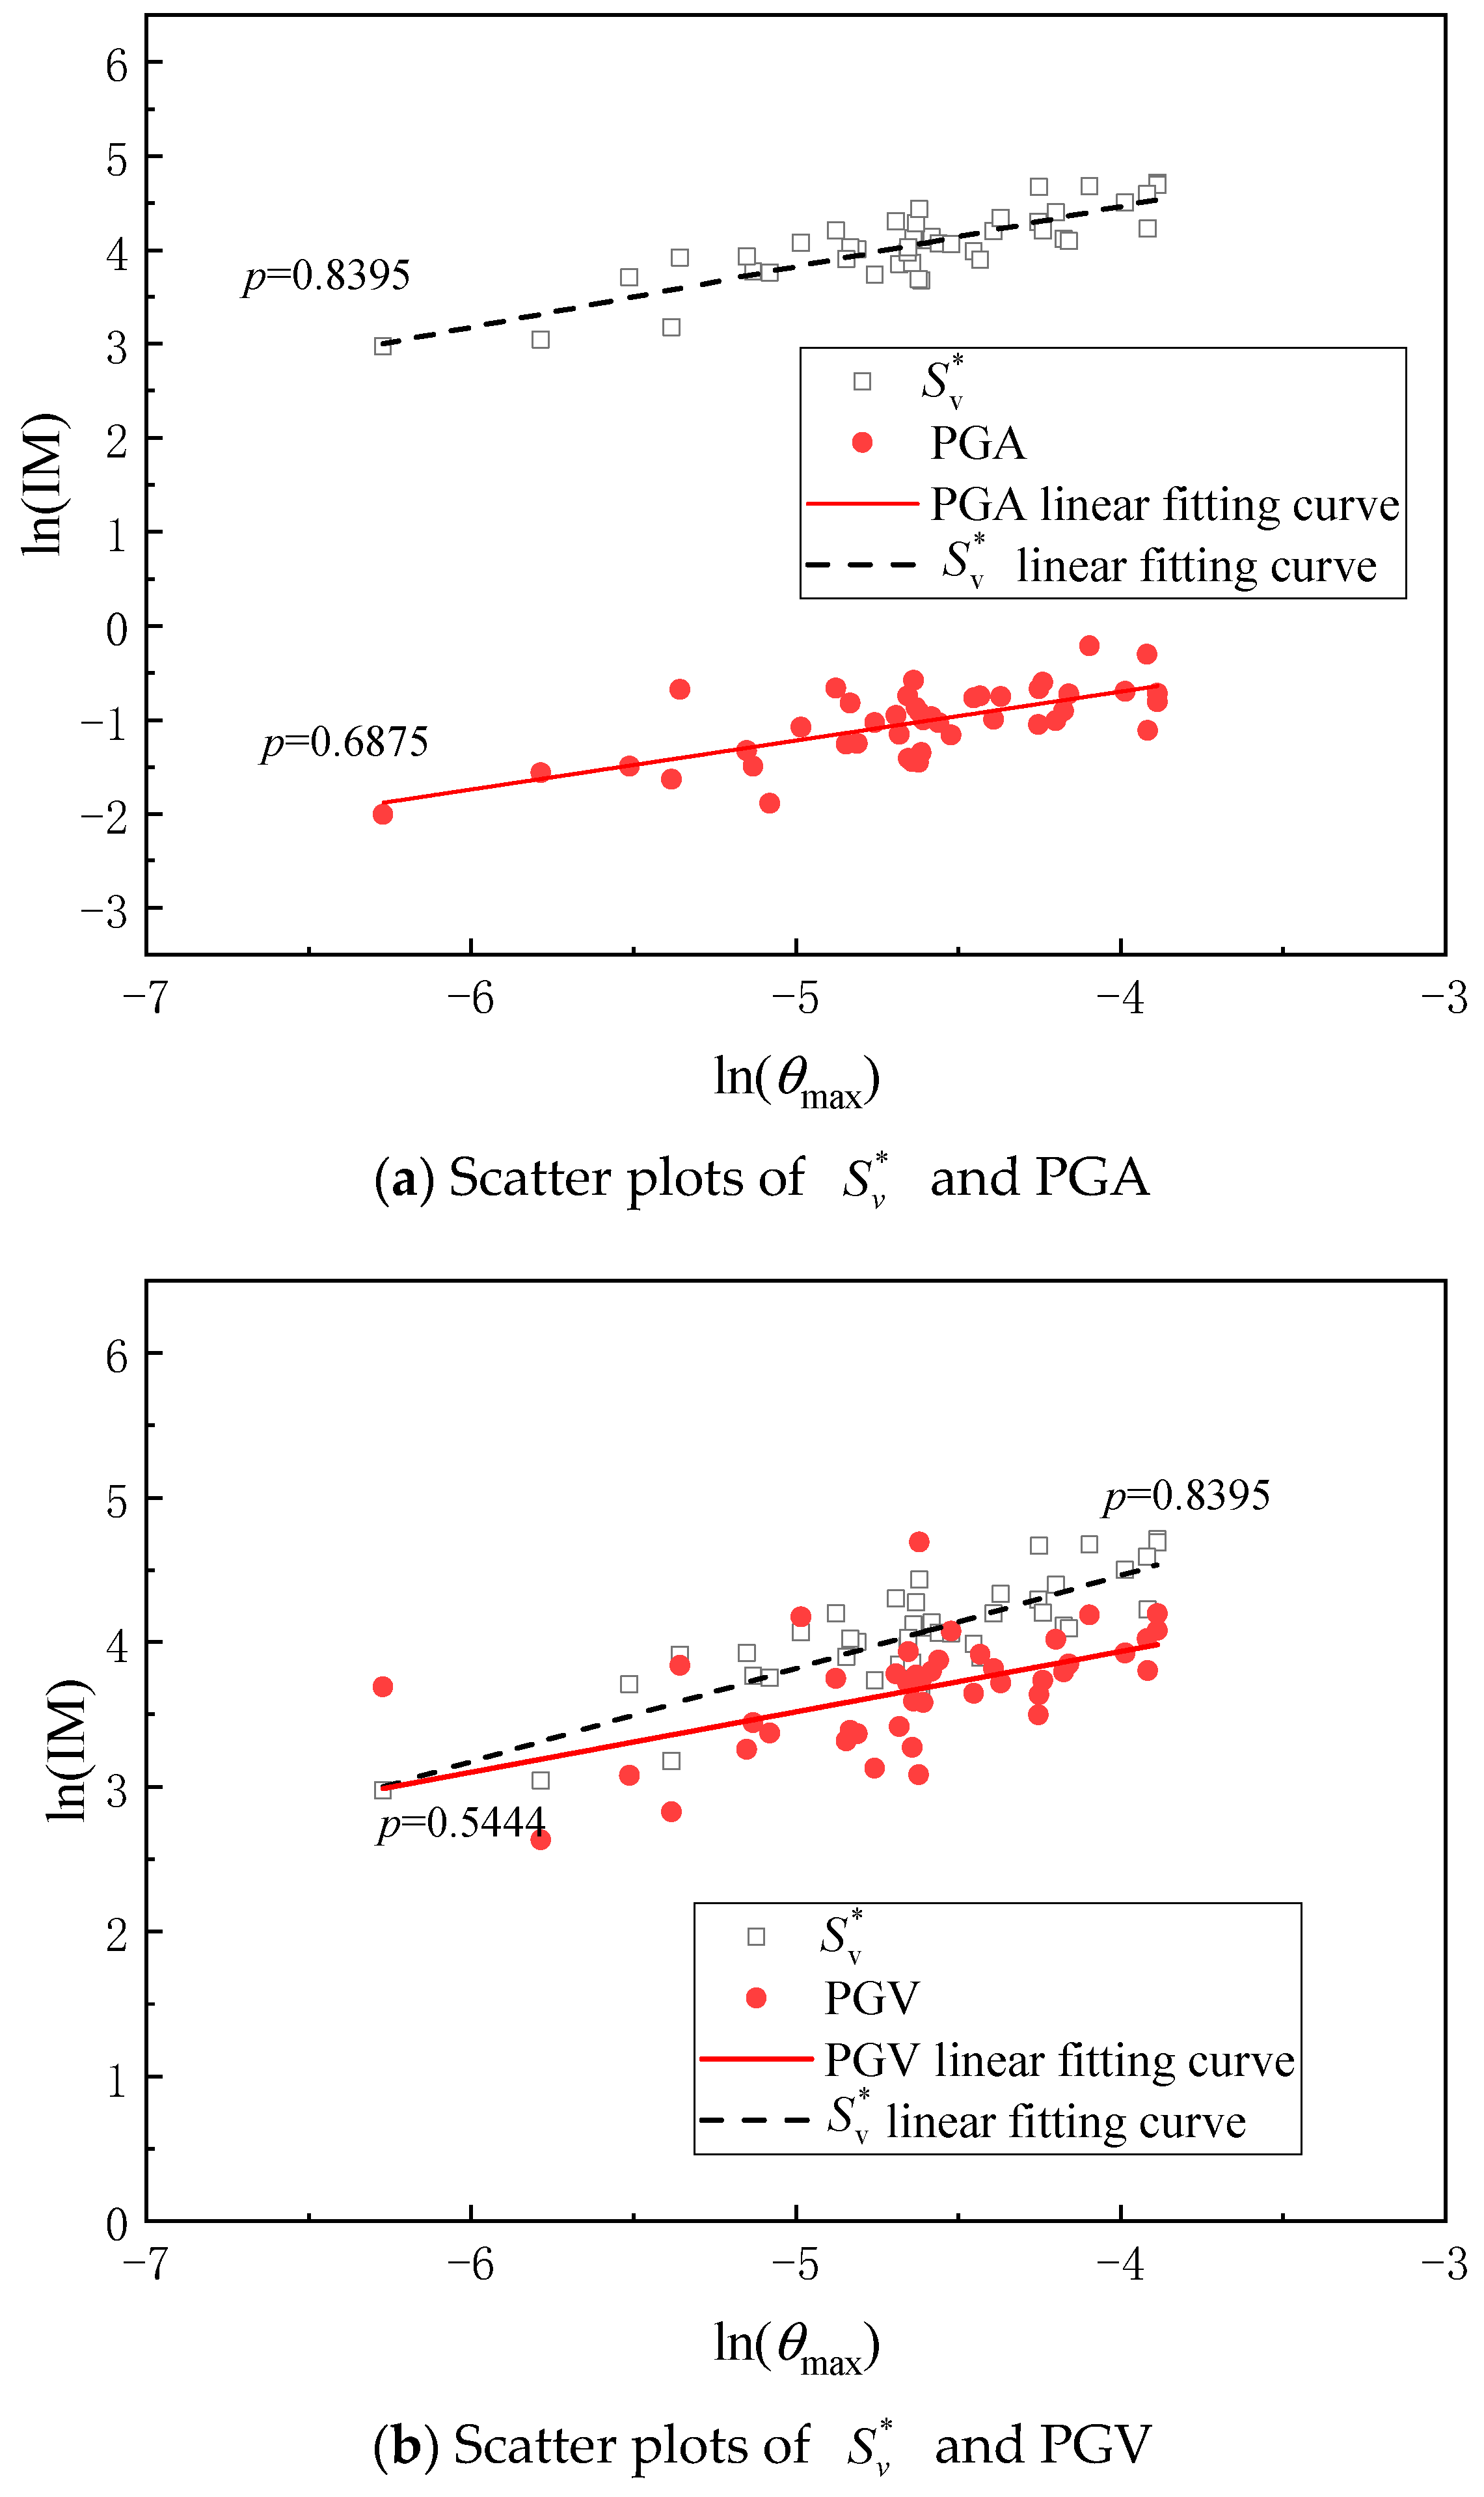
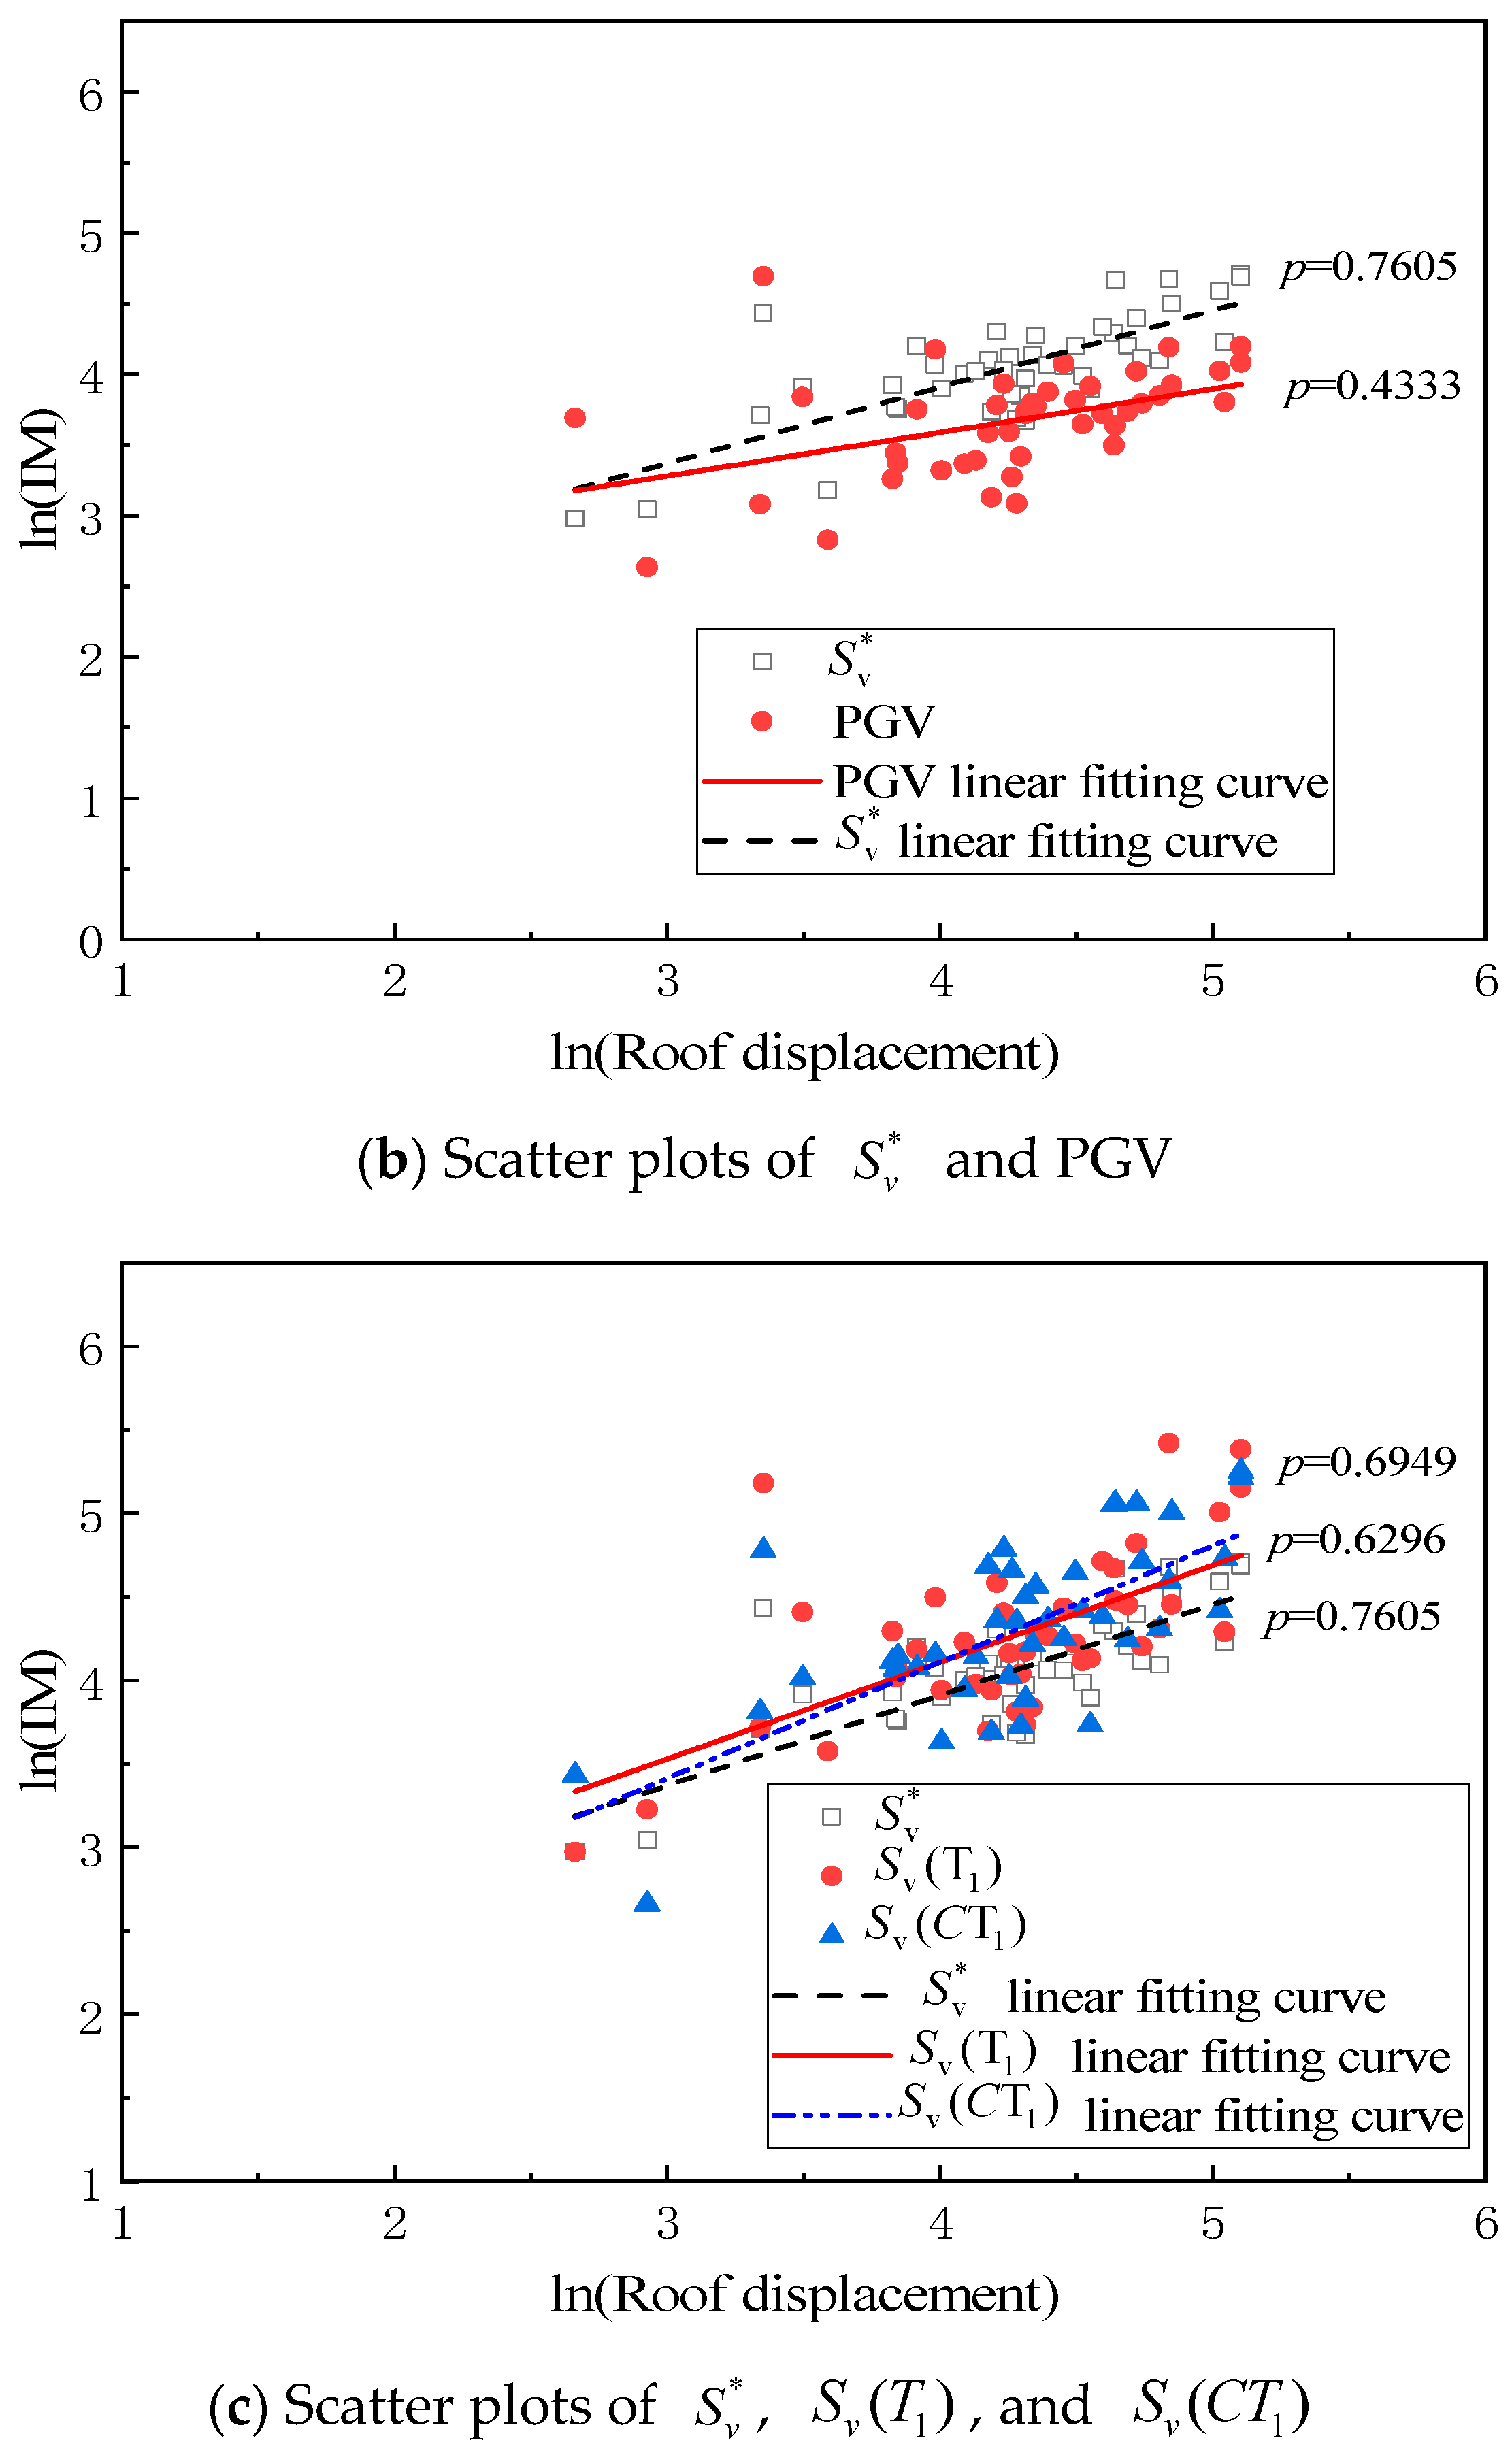
The efficiency is evaluated using Equation (4) and the closer the Pearson coefficient is to 1, the higher the efficiency of the intensity measure. Taking the roof mass ratio into consideration, as is illustrated in Equation (1), the proposed intensity measure is rewritten as . Figure 5 illustrates the scatter plots and correlation coefficients of . The correlation coefficients of and are 0.6875 and 0.8395, respectively. The improvement in the correlation coefficient indicates a higher efficiency of the velocity-related intensity measure. In addition, the comparison between the most common used velocity-related intensity measure (the PGV measure) and the proposed parameter indicates that it is necessary to contain the velocity spectrum and the higher modes. The correlation coefficients increase significantly from 0.5444 to 0.8395.
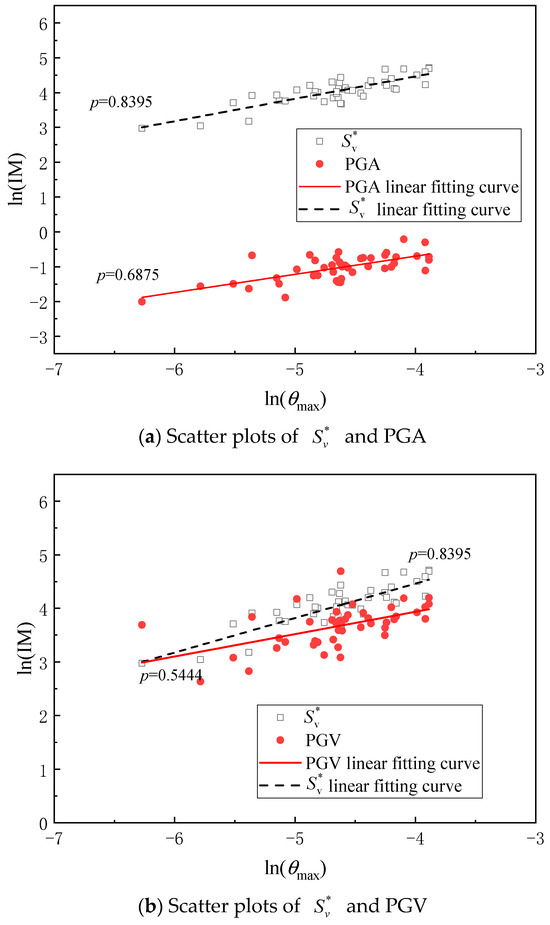
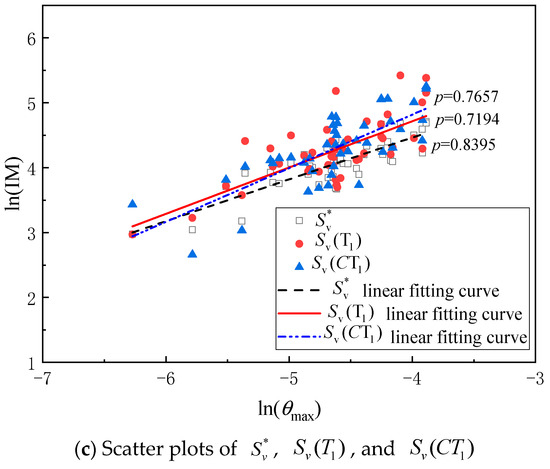
Figure 5.
Scatter plots and correlation coefficients.
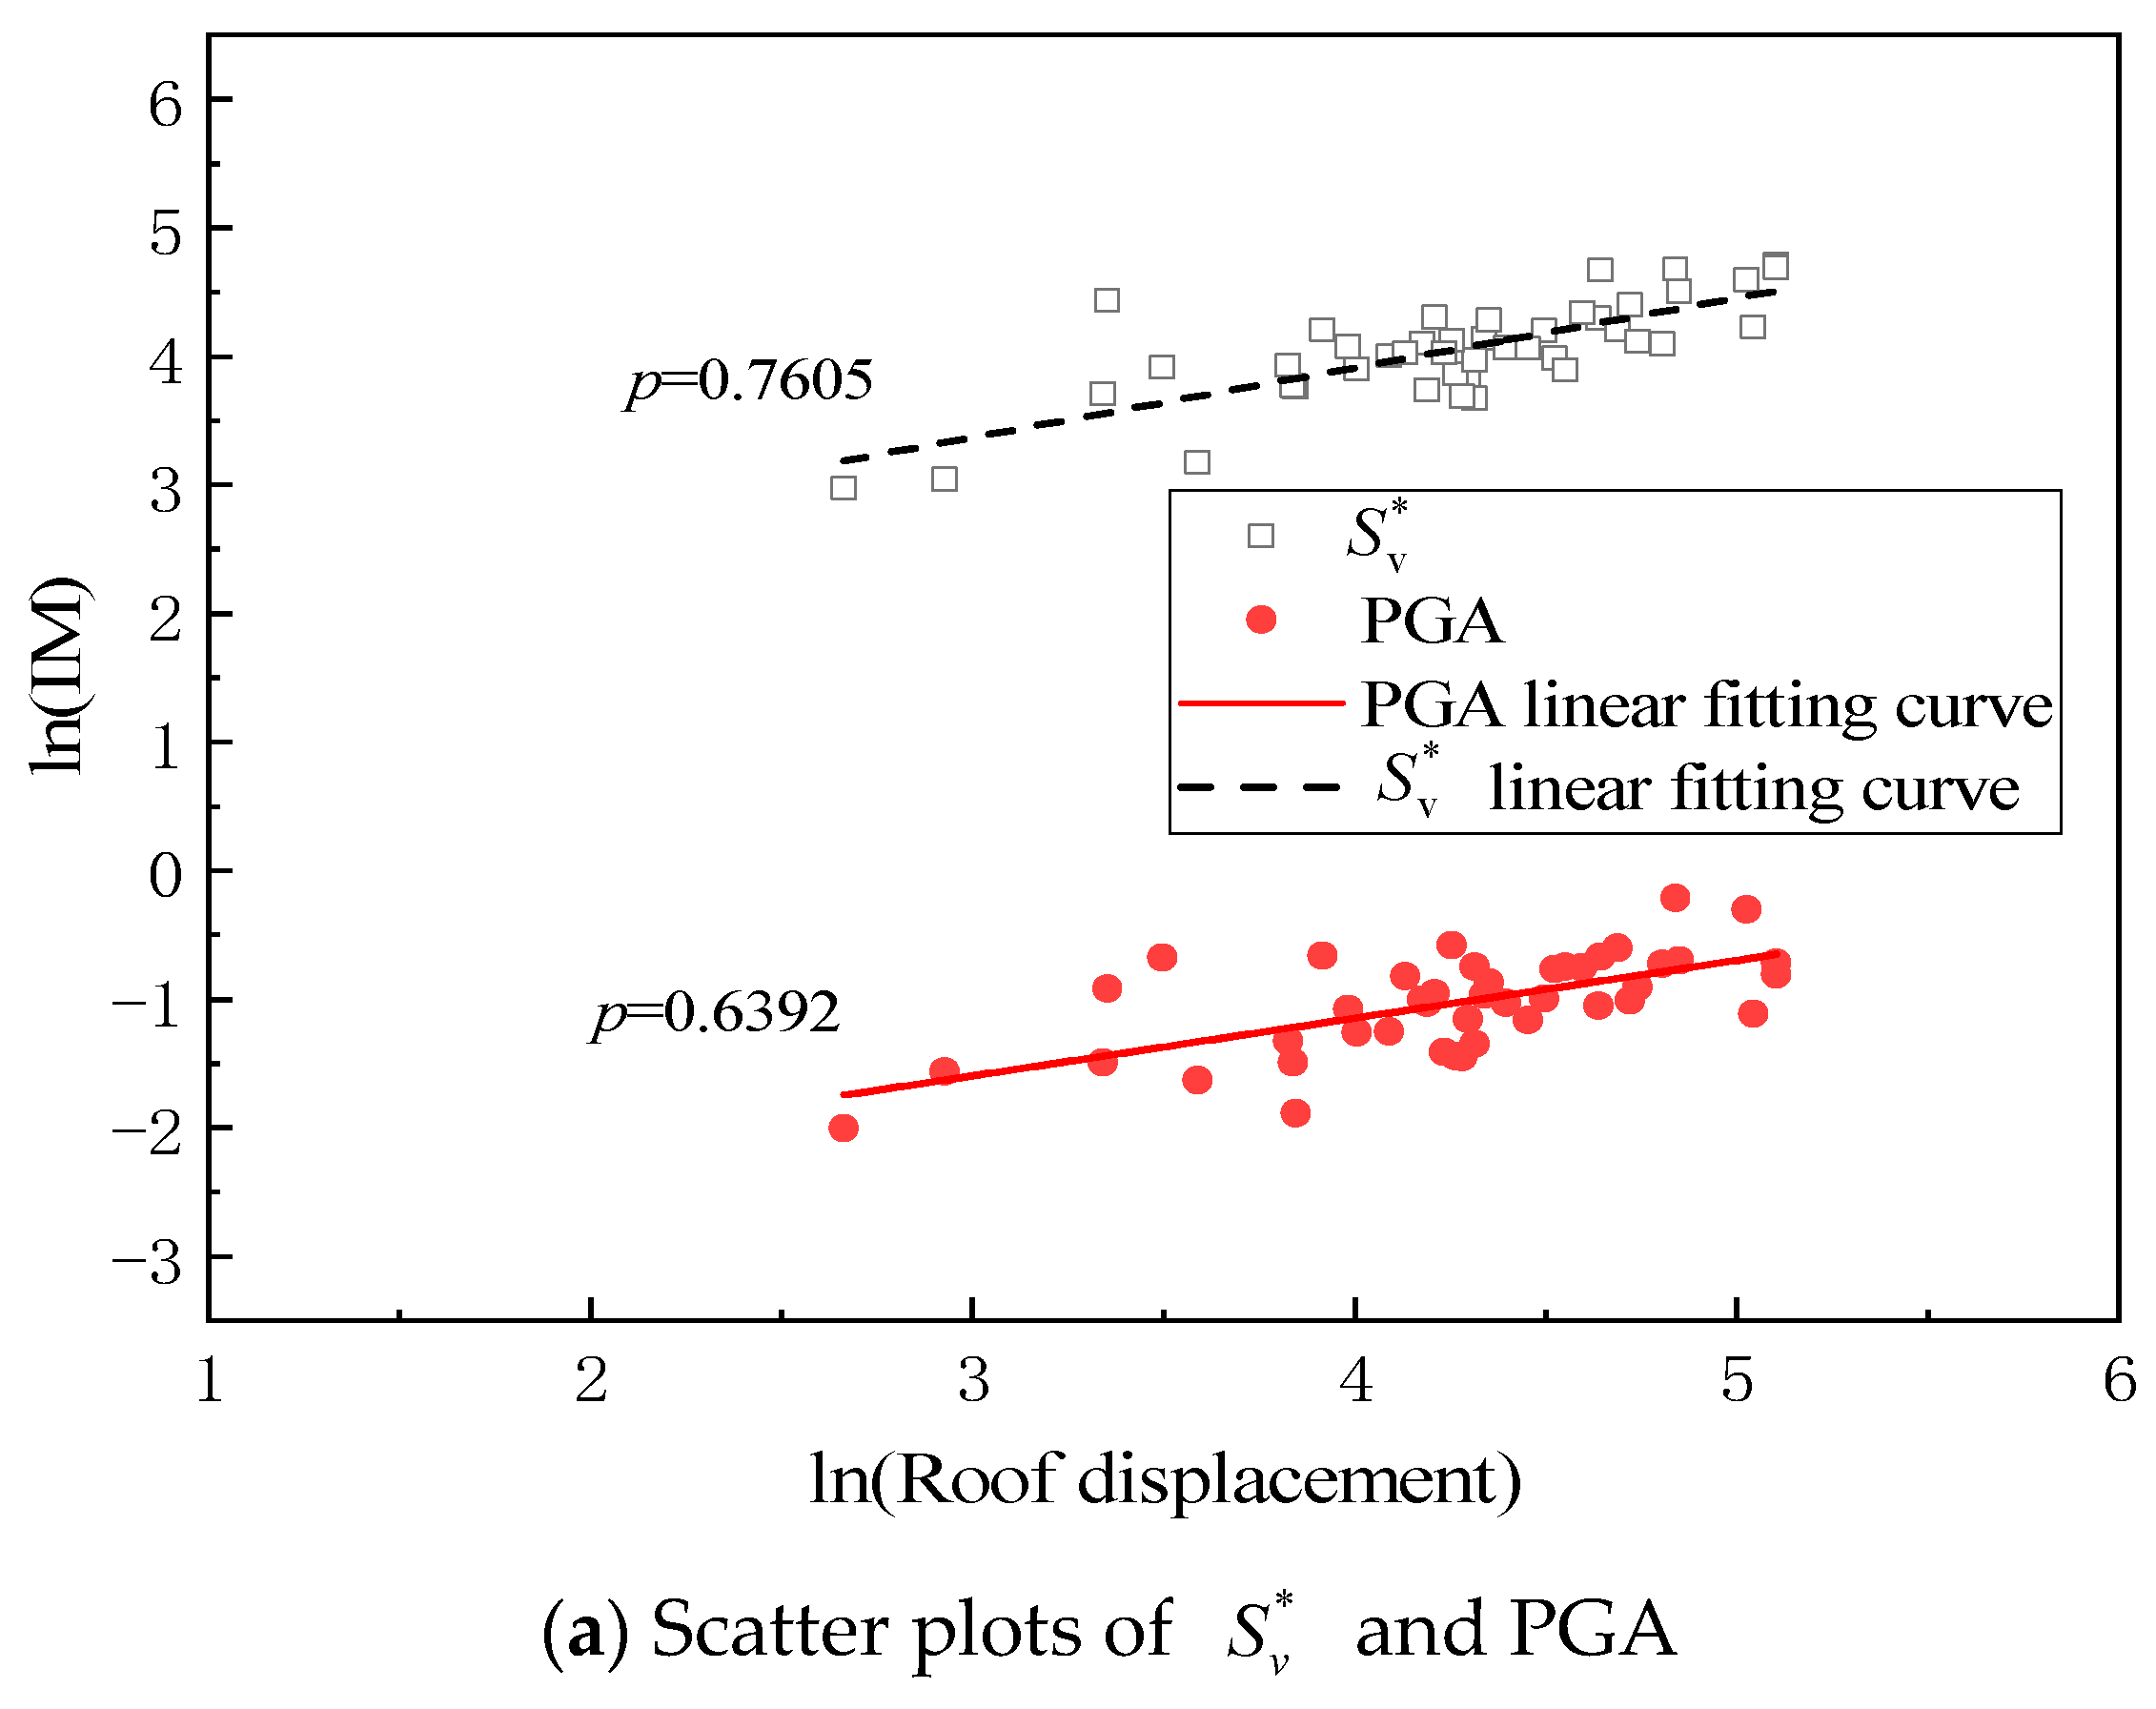
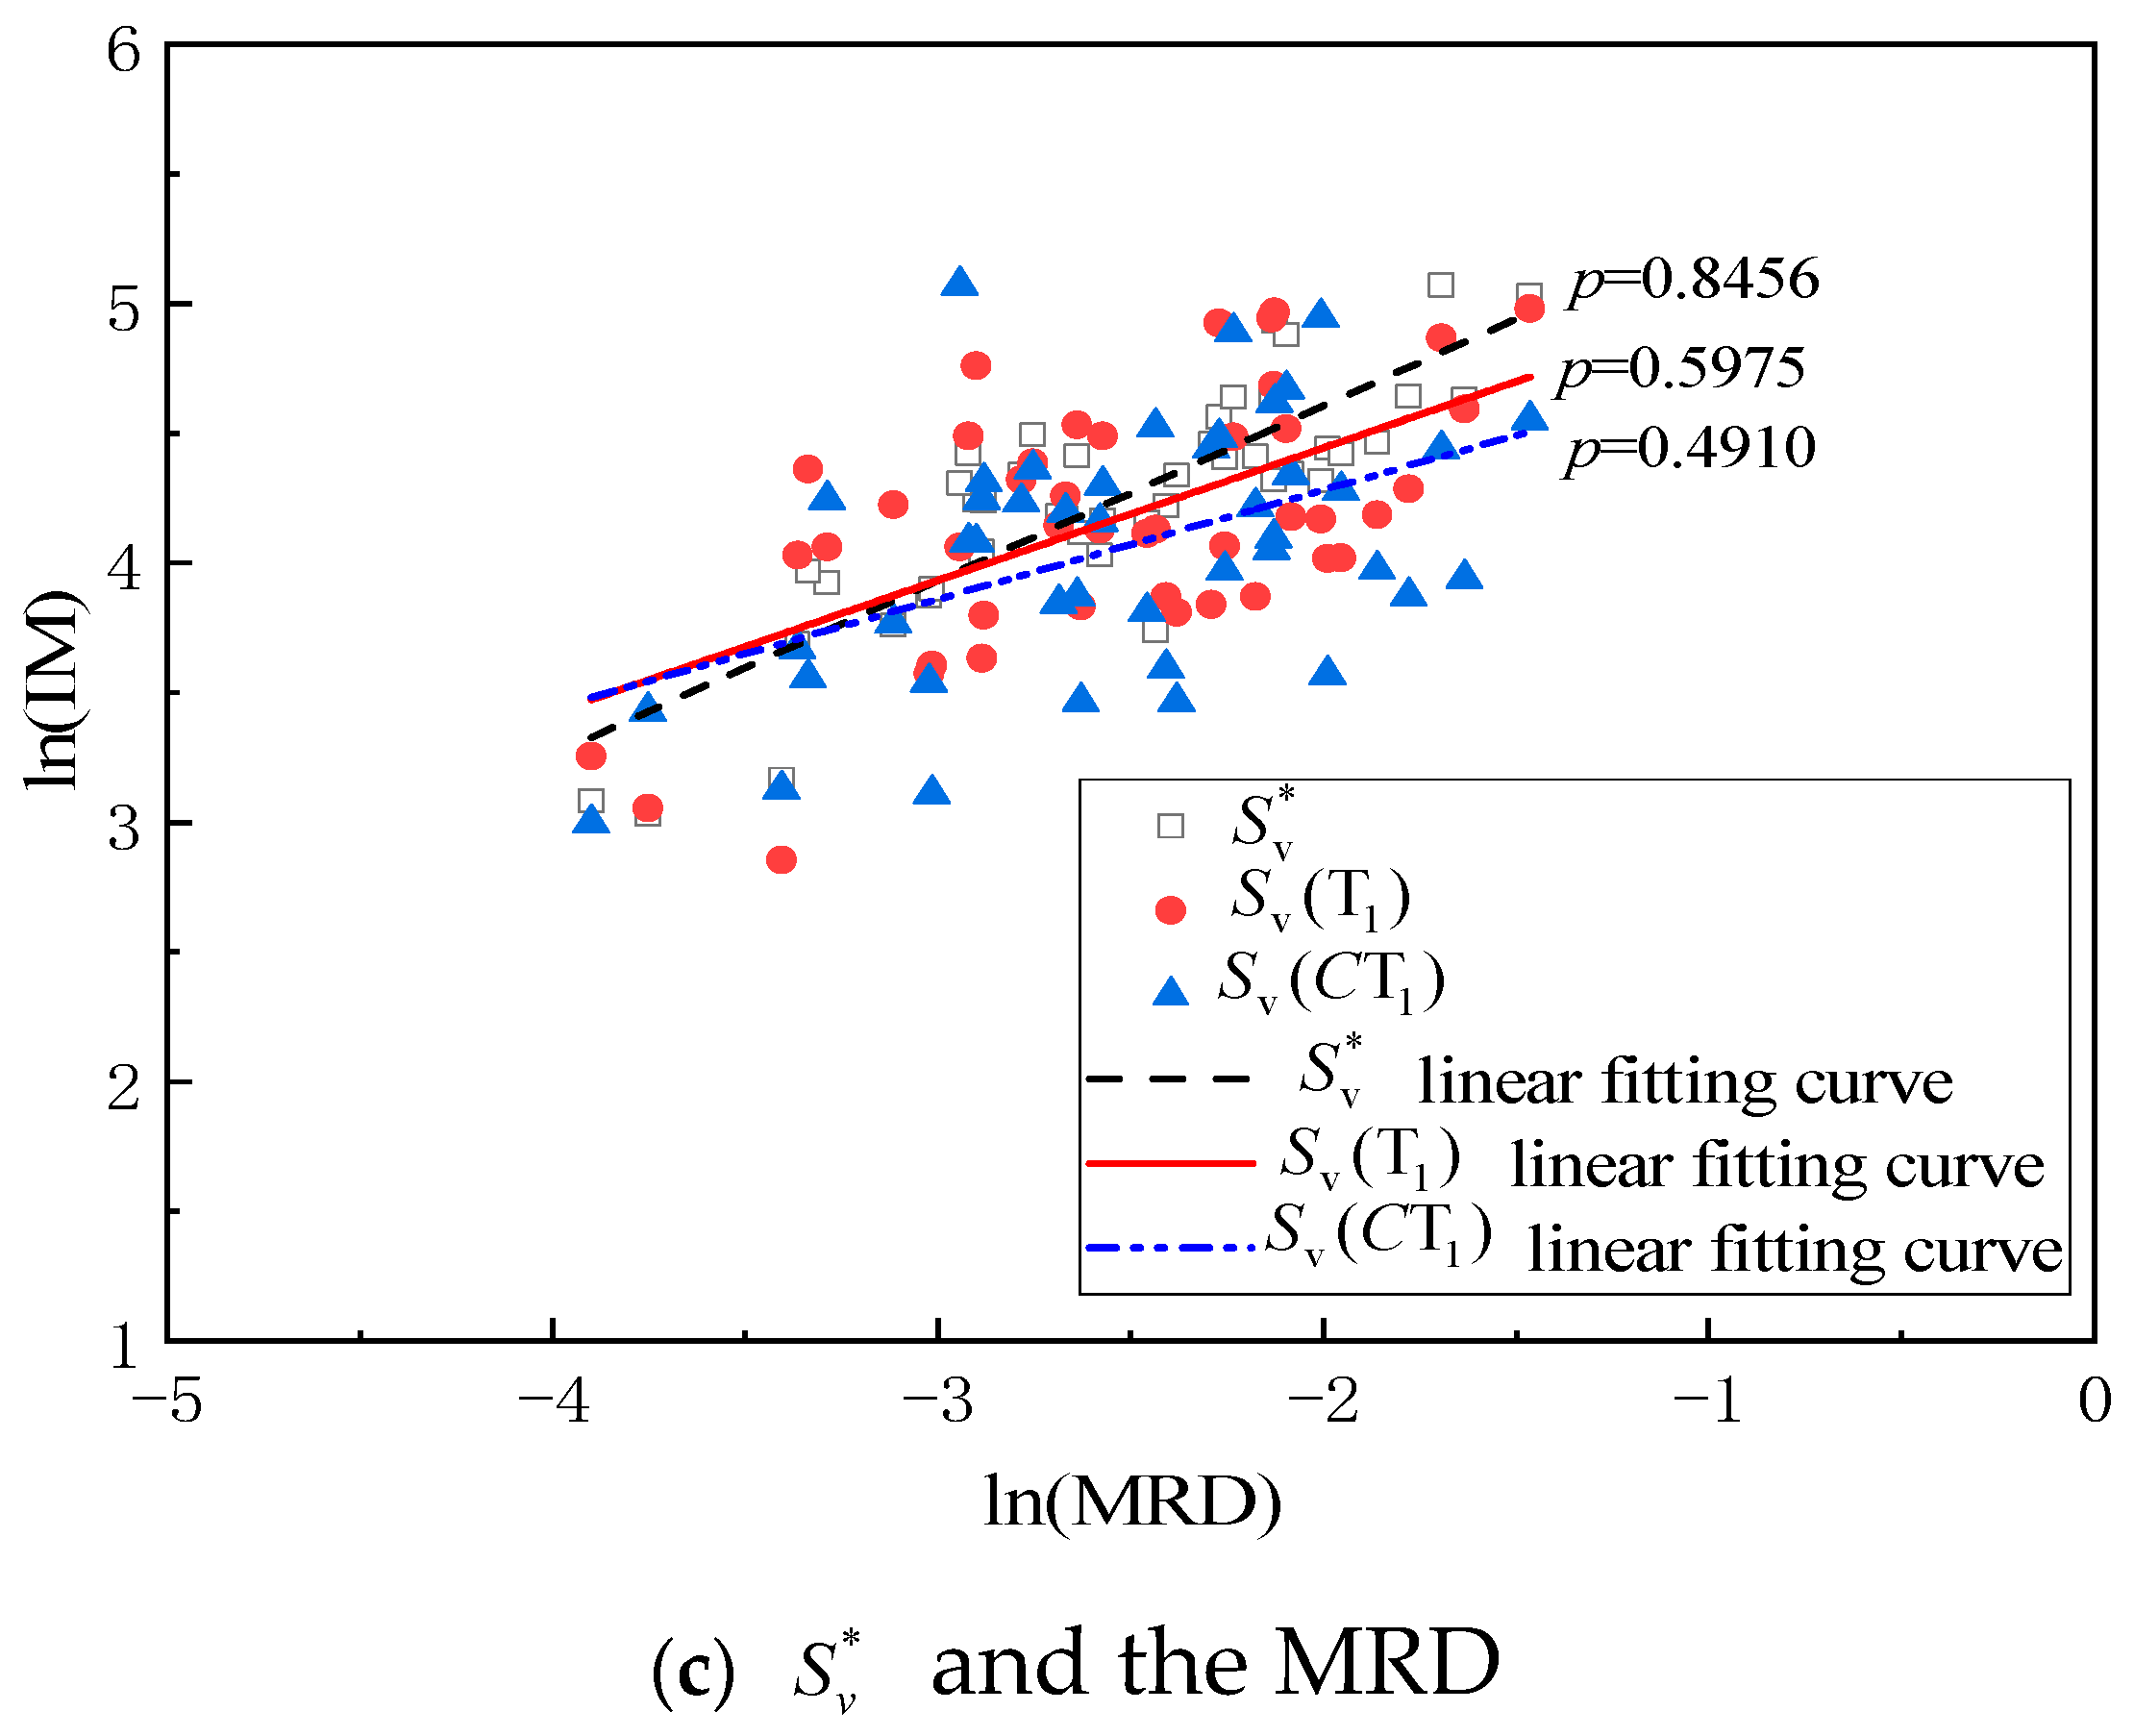
As is introduced in the second section, the is derived from the spectral velocity and is modified with the higher modes and roof mass ratio. Taking the first mode into consideration, the is rewritten as . When the isolated mass ratio γ is 1, i.e., the base isolation, the proposed becomes the first spectral velocity of the base-isolated model. On the other hand, the mass ratio γ = 0 represents the non-isolated model. To illustrate the influence of the isolated mass ratio, the comparison between , , and is presented in Figure 5c. The reaches a higher efficiency level as the correlation coefficients increase from 0.7657 () to 0.8395 (). Previously studies concerning the ground-motion intensity for base-isolated structures indicated that the first modal spectral velocity, i.e., in this study, is a promising IM and obtains relative high efficiency. However, for the roof-isolated structures, the import of the isolated mass ratio as a weighing coefficient improves the performance of the first modal spectral velocity. Moreover, the is regarded as a special form of the proposed when the isolated mass ratio γ = 1, which refers to the base isolation.
In addition to the MIDR, the MRD is another widely used EDP. Figure 5 presents the scatter plots of the IMs and the MRD. Despite the different correlation coefficient values, the Pearson coefficient of is much closer to 1 compared with the PGA and PGV measures, which is similar to the cases of the MIDR. Compared with , the Pearson coefficient of is improved from 0.6949 to 0.7605. The increment in the Pearson coefficient denotes the necessity to account for the isolated mass ratio, as can be seen from Figure 6c.
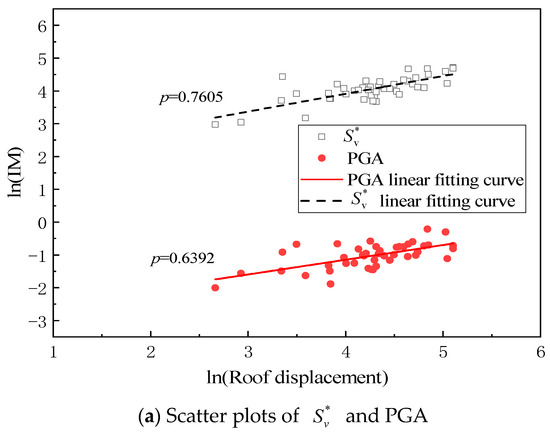

Figure 6.
Scatter plots and correlation coefficients.
5.1.3. Vibration Modes Involved in the Proposed IM
The IM presented in this study is modified by adding the different periods of each mode. Therefore, it is essential to initially determine the ideal number of modes that accurately represent the influence of higher modal vibrations on seismic reactions. It should be emphasized that the inclusion of higher-order modes in the IM may not always be desirable in practical applications of IMs. Consequently, in order to obtain a heightened efficacy of the proposed measure of intensity, it is important to investigate the ideal quantities of modes inside the IM.
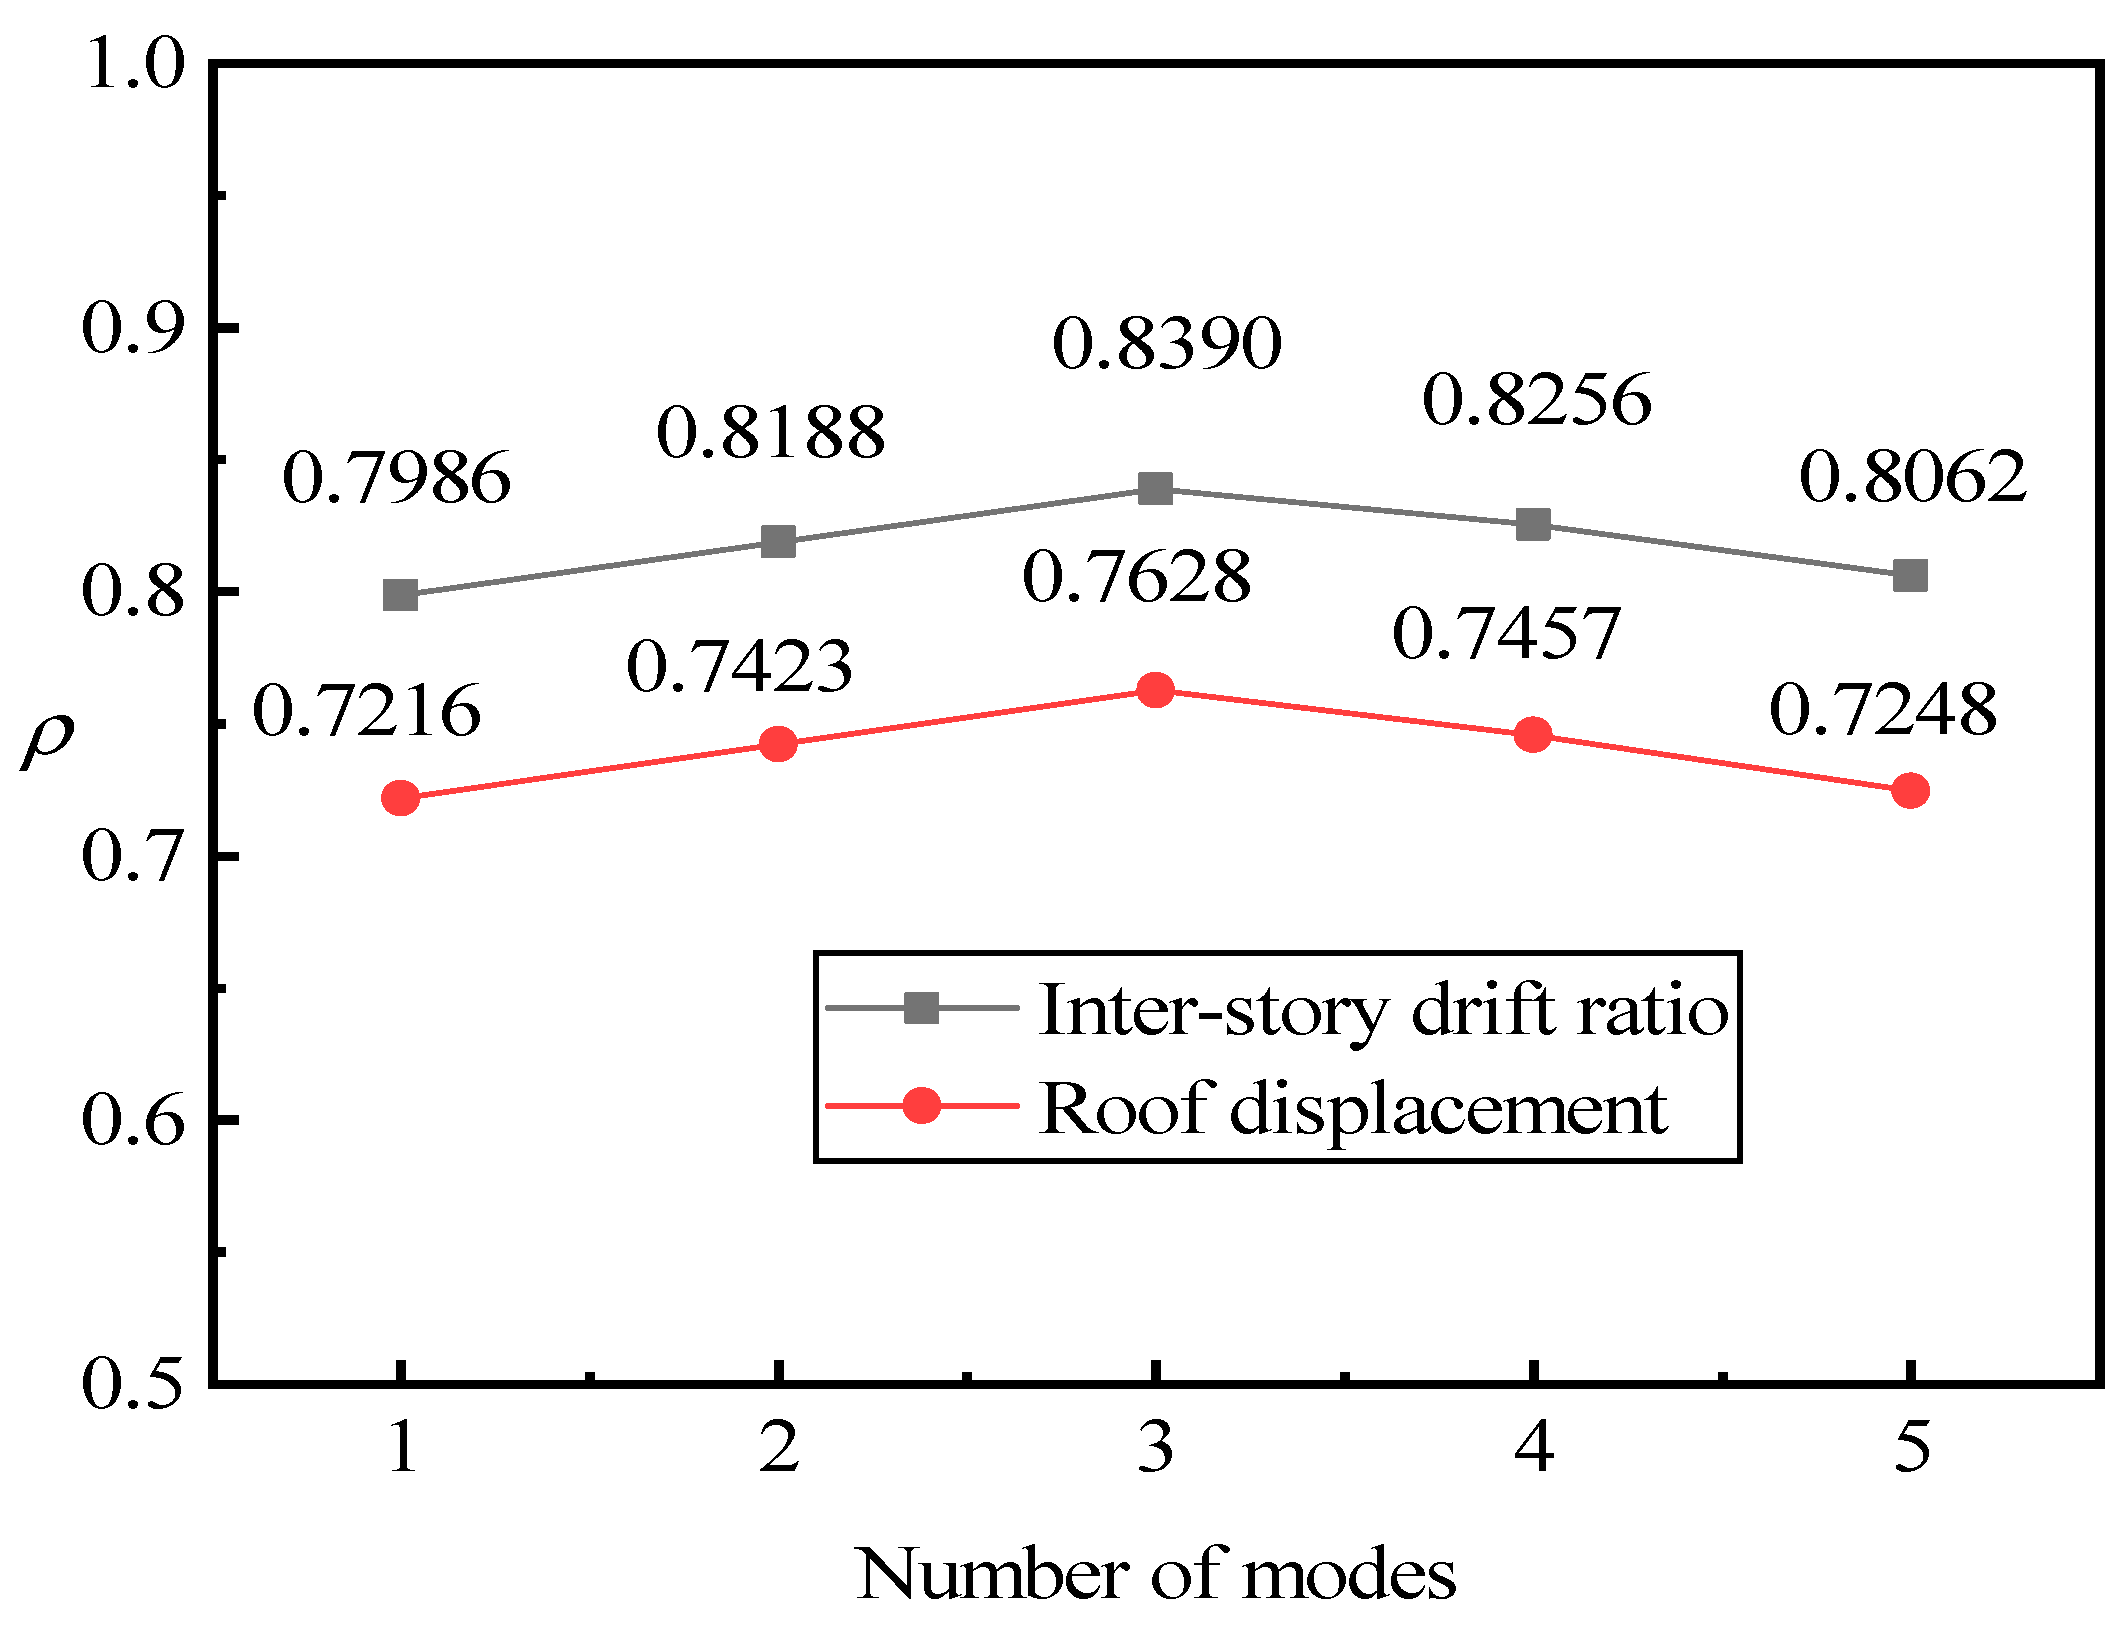
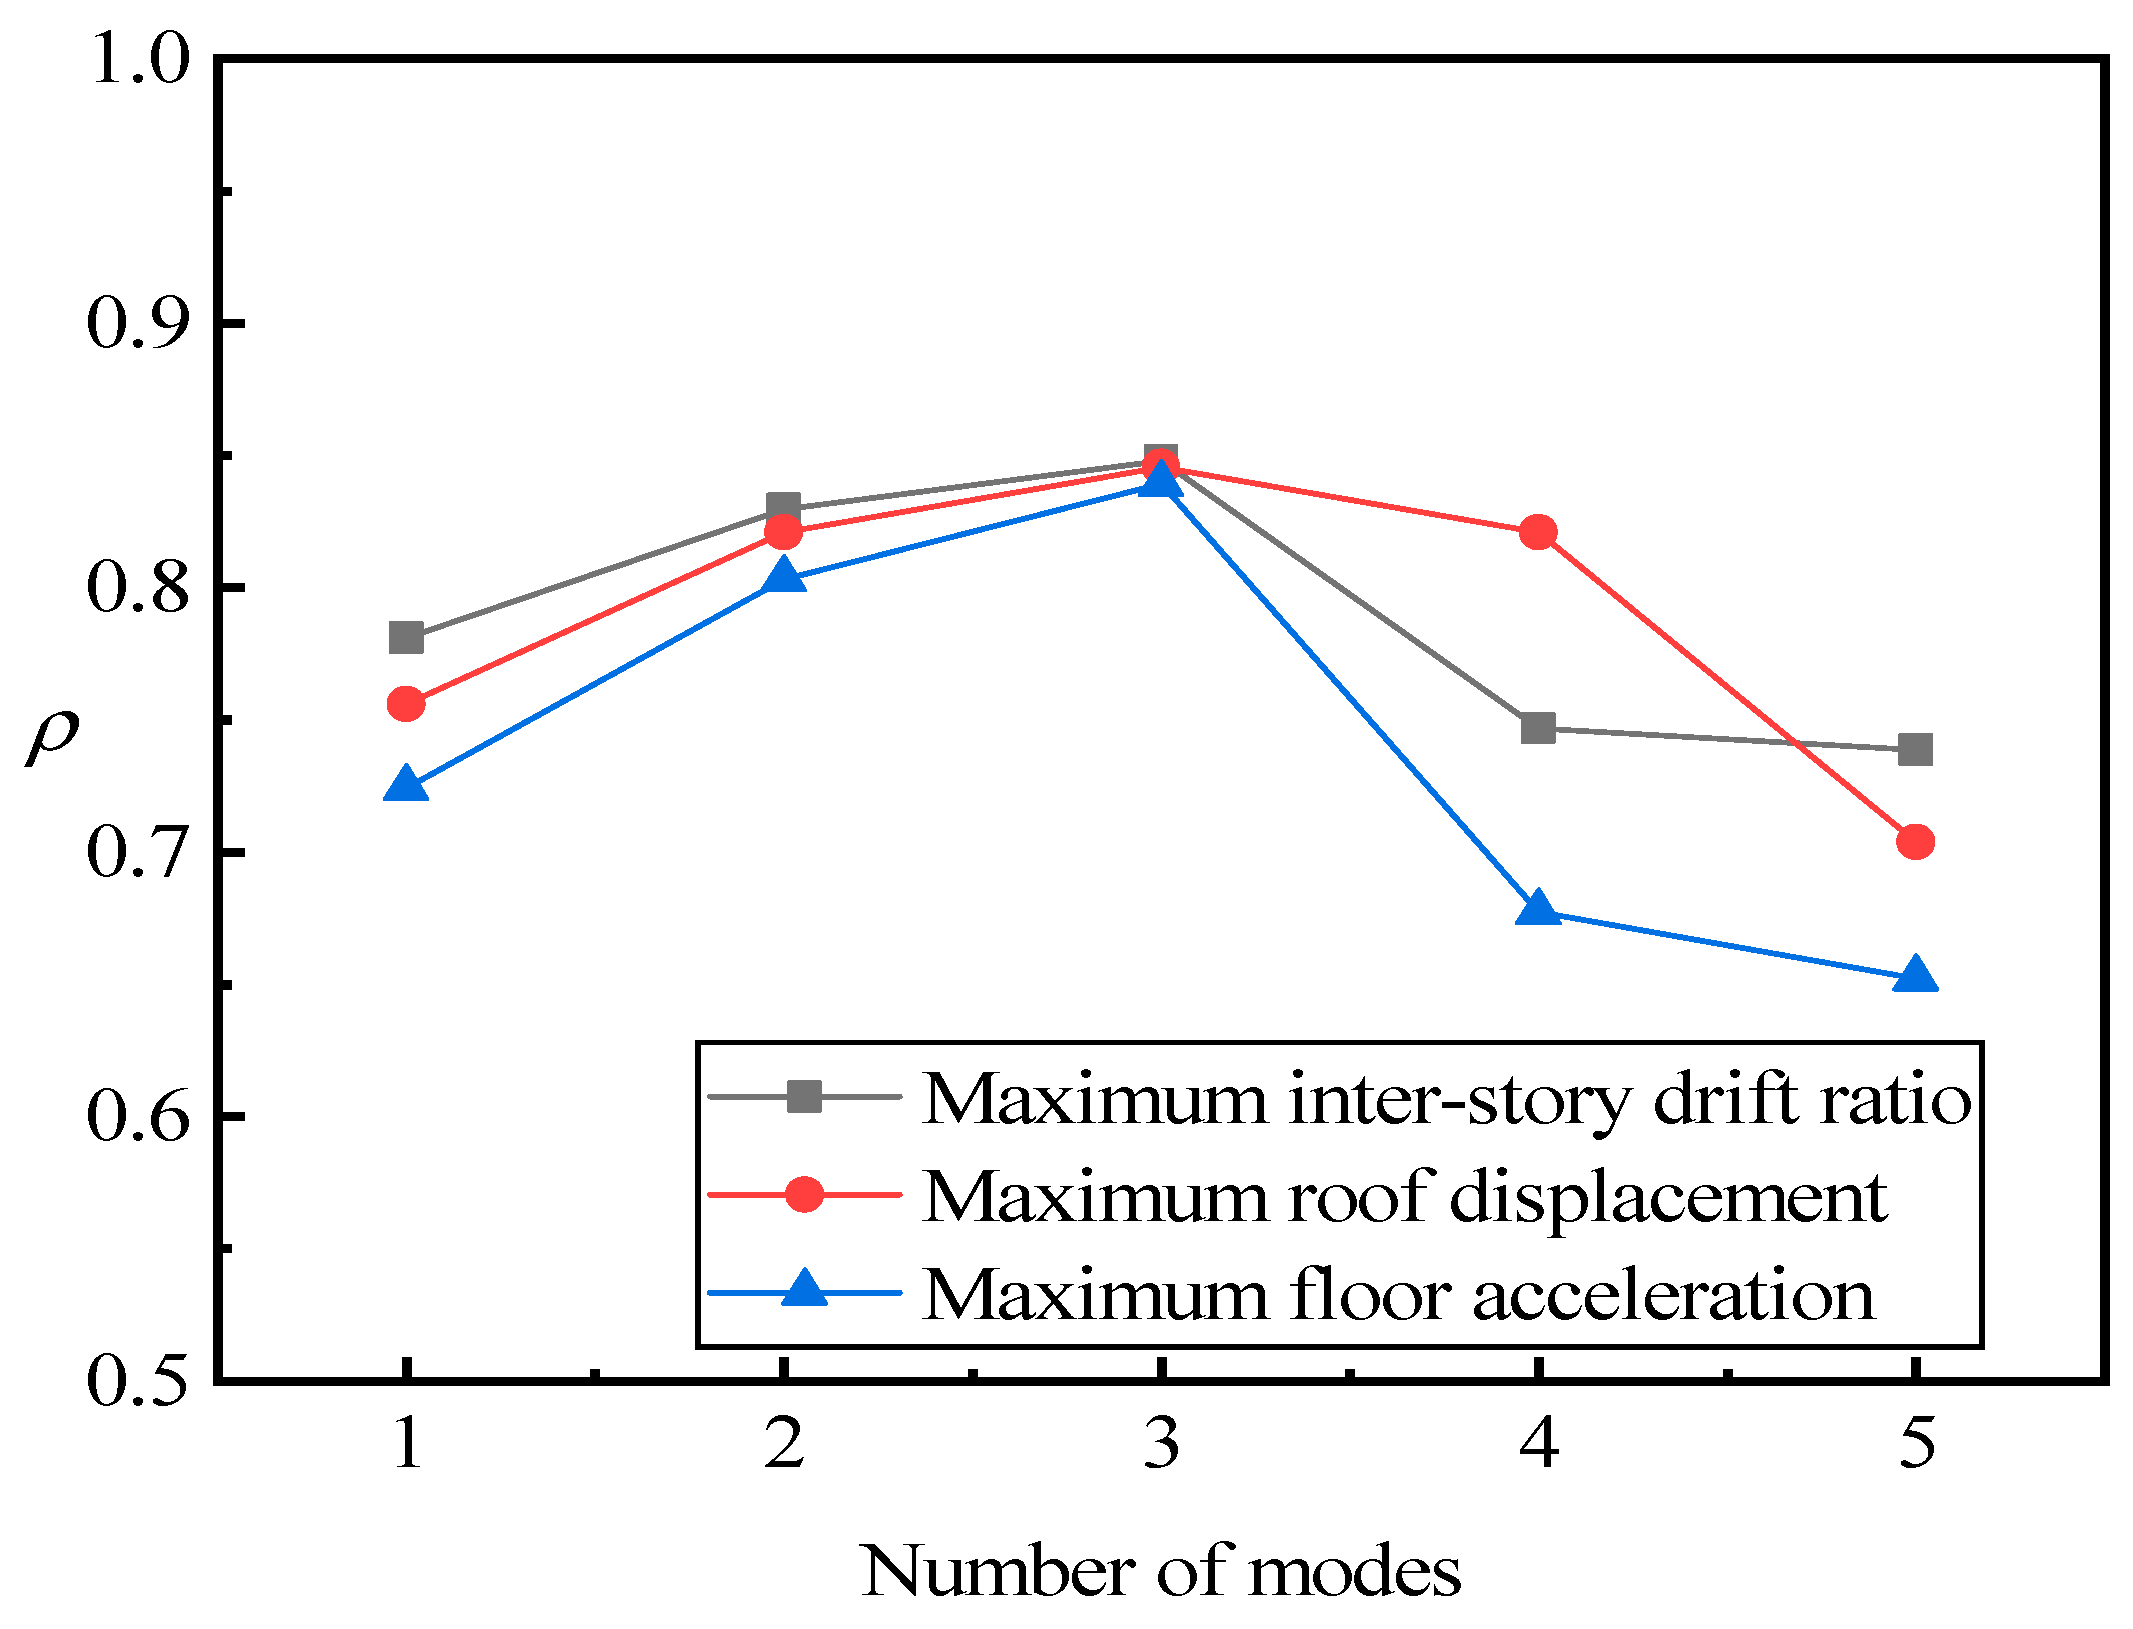
Figure 7 presents the correlation coefficient ρ of the first five modes involved in with the MIDR and MRD. The correlation coefficients are relatively higher in the MIDR case compared with the MRD. Obviously, the correlation coefficient ρ firstly increases and then decreases with the increasing of modes both for the MIDR and the MRD. In both cases, taking the first three modes will guarantee the best efficiency of .

Figure 7.
The number of modes involved in the IM.
As a result, it is not always advantageous to incorporate the maximum number of modes into the combination of ground-motion intensity measurements. The spectral velocity signifies the structural response and frequency content resulting from the ground motion. Consequently, the efficiency of the IM diminishes as the frequency content it represents surpasses the frequency range that is susceptible to the structure. While the impact of higher modes is more pronounced on isolated structures, its strength diminishes as the mode ascends in comparison to the cumulative effect of the lower modes.
5.2. The Roof-Isolated Large-Span Stadium Structure Model
To overcome some shortcomings of the planar lumped-mass model, a three-dimensional roof-isolated large-span structure model of the Beijing Workers Stadium is established to examine the performance of the ground-motion intensity measures. The Beijing Workers Stadium, also known as the Workers’ Gymnasium, is a well-known multi-purpose indoor arena in Beijing, China. It holds great significance in the country as it has hosted numerous major sporting events, concerts, and cultural shows.
The stadium was originally built in 1959 and has undergone several renovations over the years to meet modern standards. However, due to the hosting of the opening and closing matches of the Asian Cup Football Tournament in 2023, it needed to be transformed into a professional football stadium. The original elliptical field was transformed into a rectangular football pitch and the seating arrangement in the stands also needed to meet the requirements of a professional football stadium. After inspections, the old venue could not meet the future usage requirements and structural safety requirements. Therefore, it was demolished and rebuilt according to the original design concept to meet the new usage requirements and ensure structural safety.
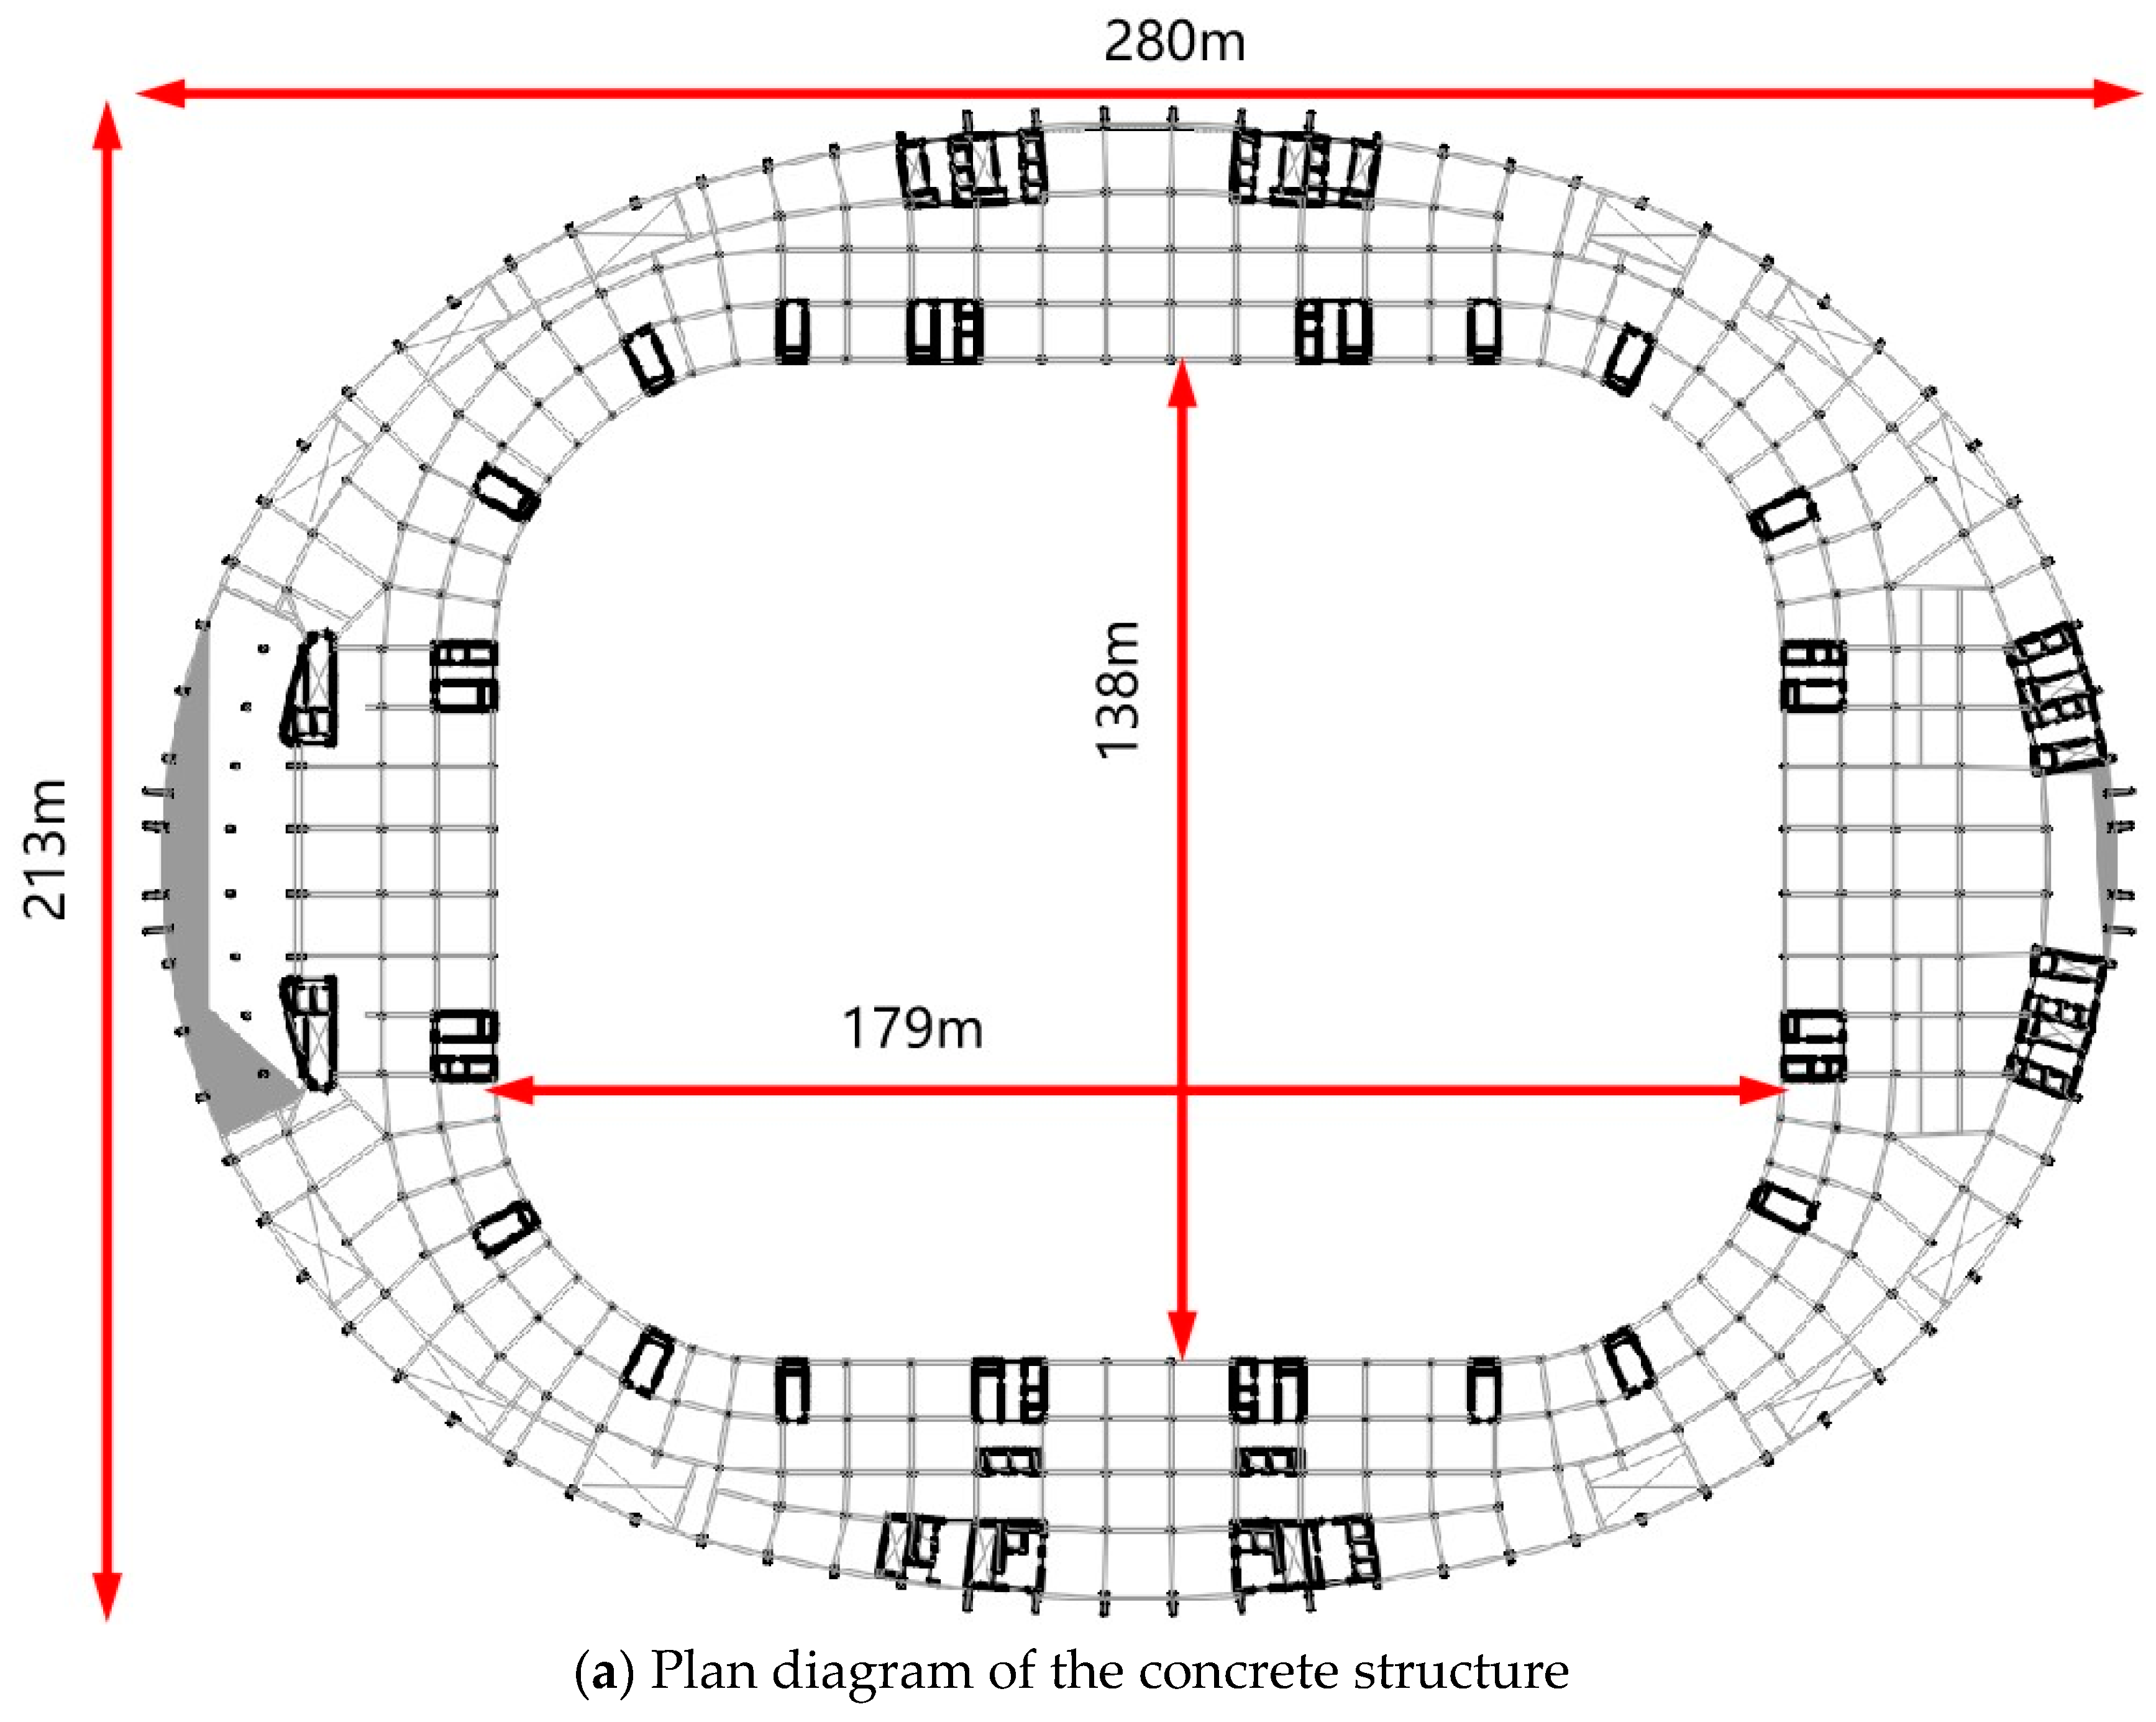
The renovation and reconstruction of the Beijing Workers’ Stadium was finished in 2022. The main structure consists of a concrete frame-shear wall structure system and a large-span roof. The Beijing Workers’ Stadium has three underground floors and six above-ground floors, with a total construction area of 385,000 square meters and a total height of 47 m. The main structure of the stadium has an east–west span of 213 m and a north–south span of 280 m. The plan diagram of the Beijing Workers’ Stadium is shown in Figure 8.
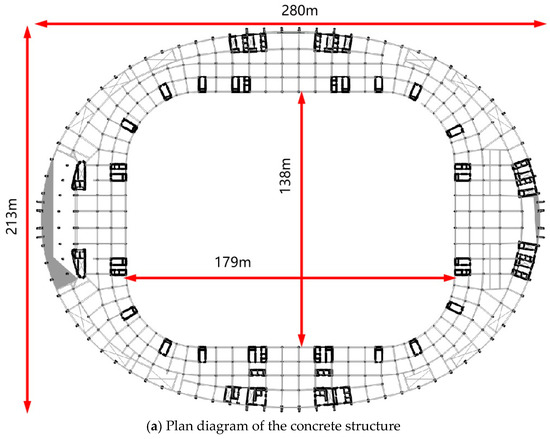

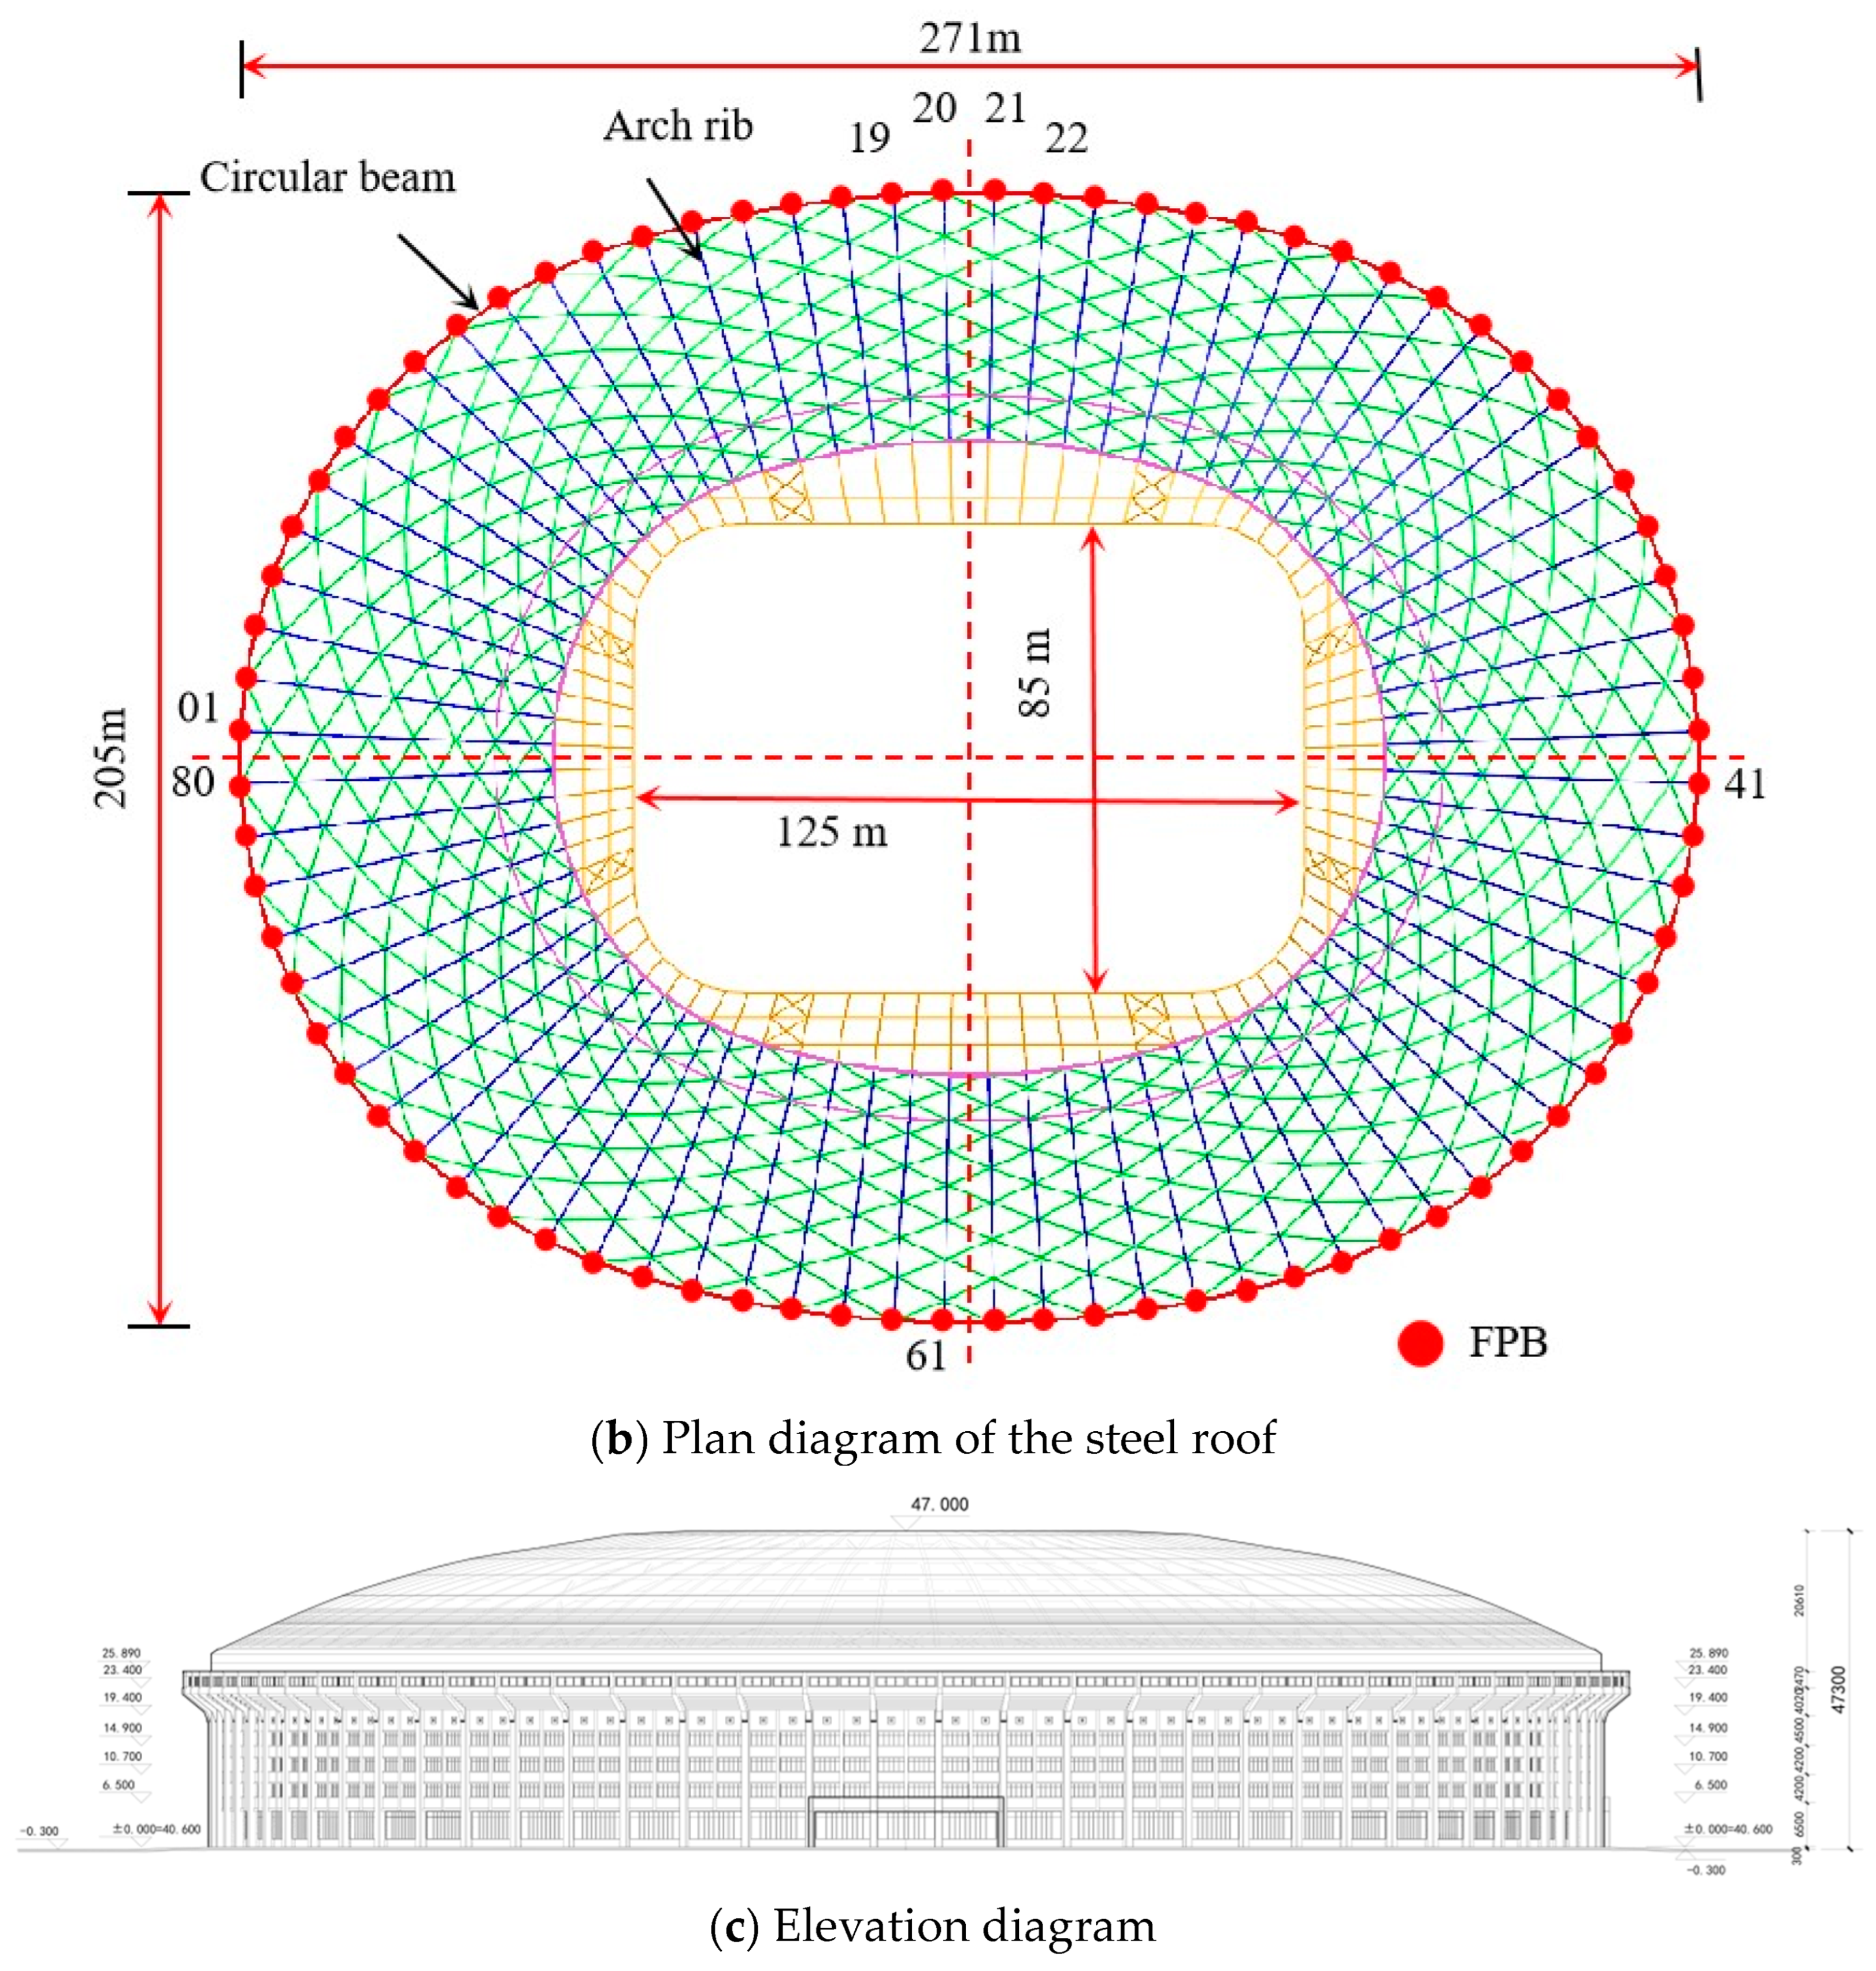
Figure 8.
The plan and elevation diagram of the Beijing Workers’ Stadium.
The roof is covered by a large-span single-layer reticulated shell structure with a “radiating arch rib and cross bracing” system. The primary load-bearing components include the inner and outer rings of beams and arch ribs, with the cross bracing providing lateral restraint for the arch ribs. The outer dimensions of the single-layer shell is 271 m × 205 m, with an inner opening size of 125 m × 85 m. The spacing between the inner and outer rings of beams range from 44 m to 58 m, with a cantilever beam of 5 m to 15 m length on the innermost side. The height difference between the inner and outer rings of beams is 17.922 m.
The roof is isolated with the frictional pendulum isolation bearings (FPB). A total number of 80 FPBs are used to achieve lower vertical stiffness and ensure horizontal shear transfer. The friction pendulum has a double-sliding surface structure. Compared with a regular single-sliding surface friction pendulum support with the same parameters, it has lower horizontal stiffness, allowing for larger sliding distance within a limited space. The planar size of the FPB is 1.02 m × 1.02 m. The upper and lower sliding surfaces are spherical surfaces with a curvature radius of 2.32 m, and the slider height is 330 mm. The swinging period is 4.13 s. The static friction coefficient of the FPB used in this study is 0.035, and the dynamic friction coefficient is 0.015–0.025. The bearing is composed of a thick laminated rubber bearing for vertical vibration isolation and a friction pendulum for horizontal earthquake isolation. The vertical equivalent stiffness is significantly lower than that of the typical frictional pendulum isolation bearing after using a modified vertical stiffness test approach.
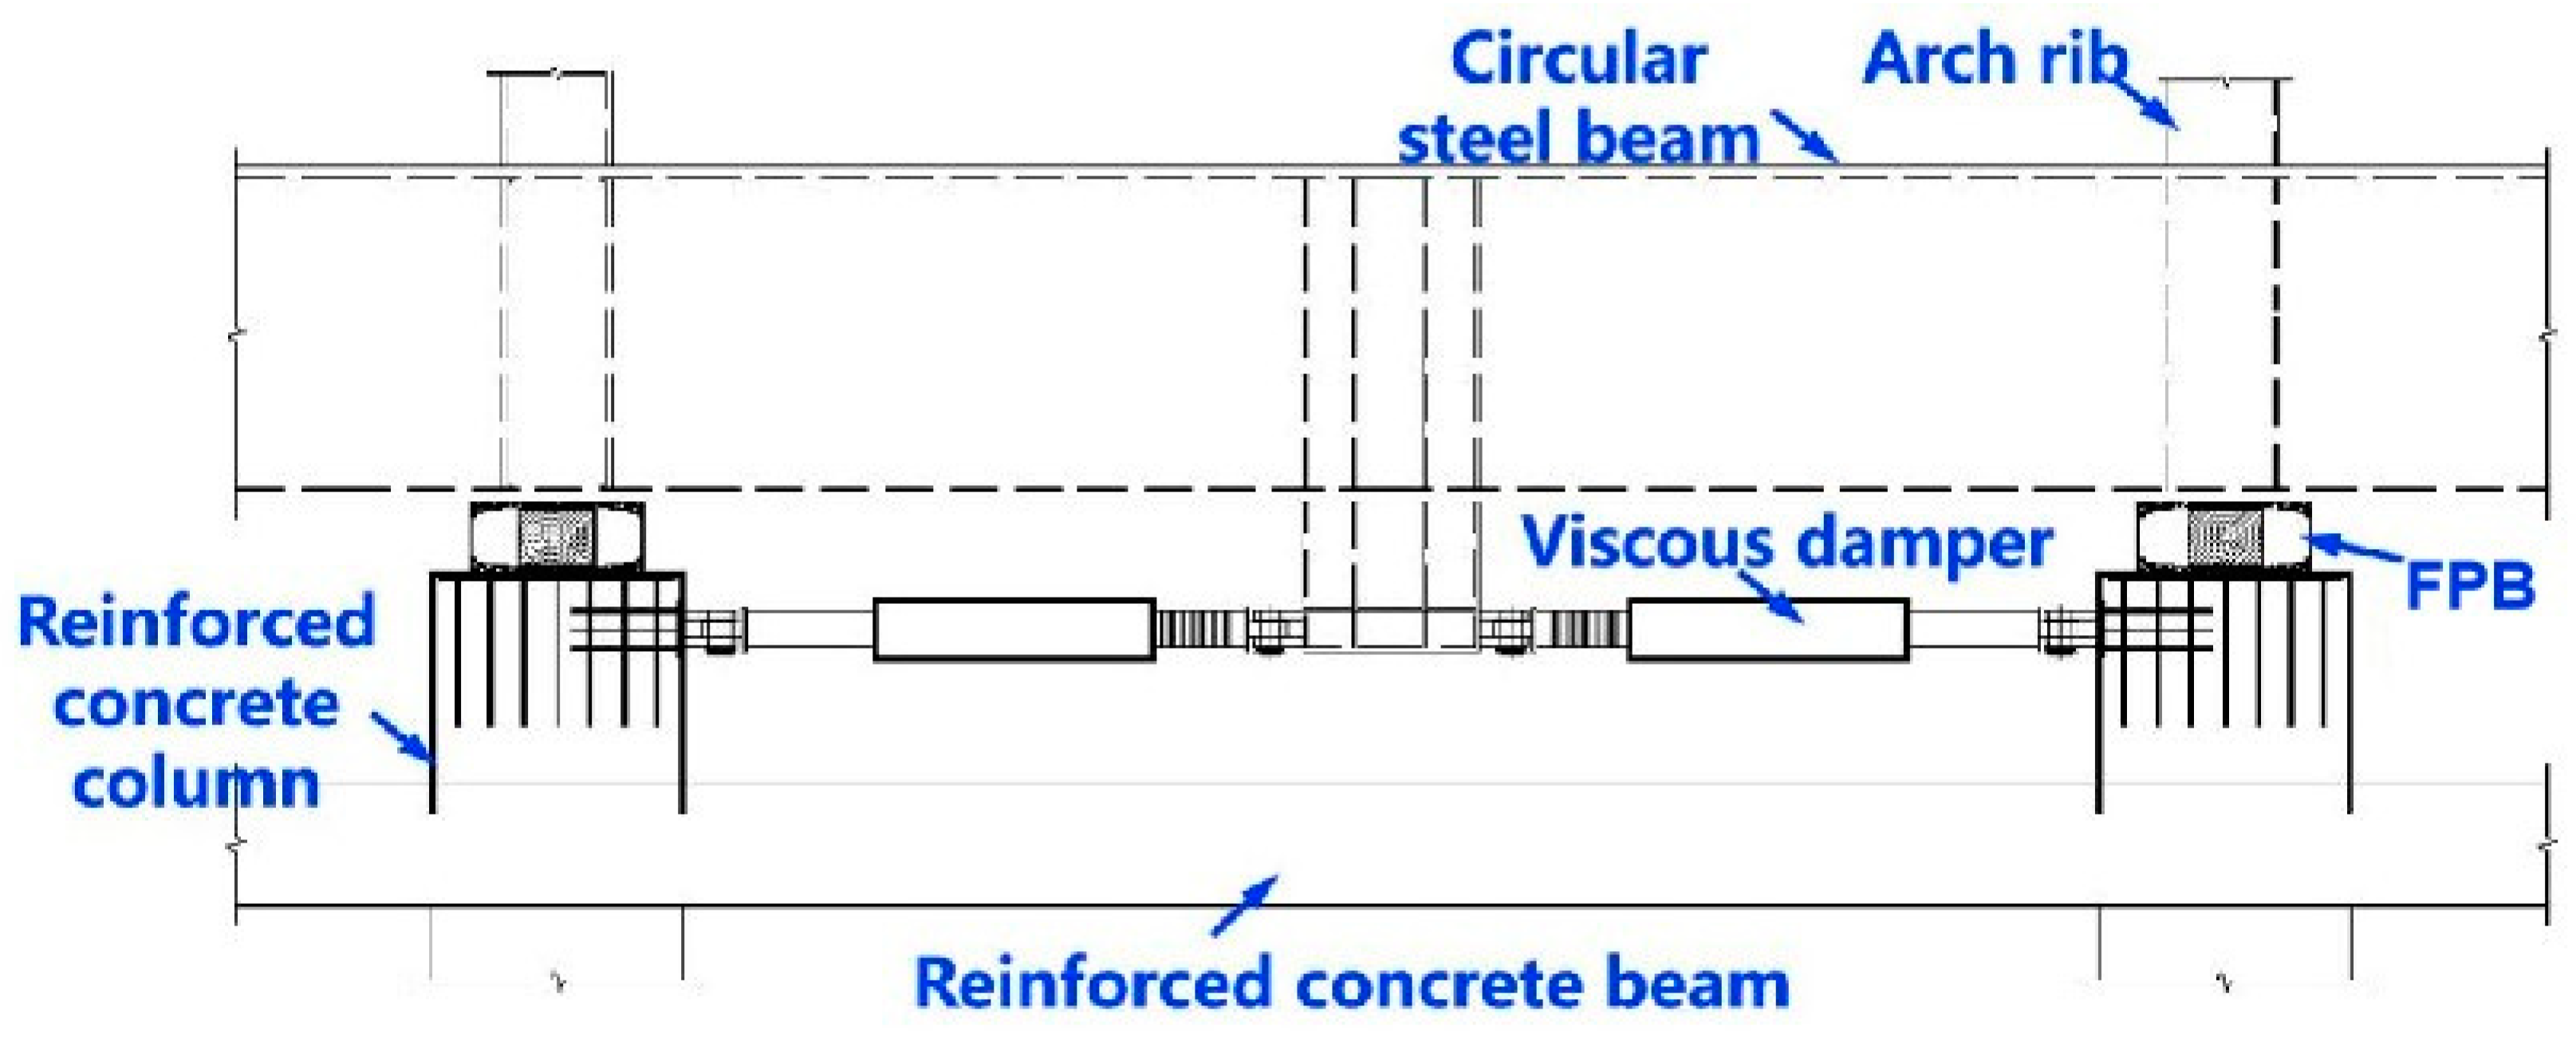
The friction pendulum bearings are installed at the bottom of each arch rib, with a static friction coefficient of 0.035 and a dynamic friction coefficient of 0.015–0.025. In order to reduce the horizontal displacement of the large-span roof under the action of a major earthquake, viscous dampers, which are passive energy dissipation devices [55], are installed between the pier columns and the outer circular beams. The damping coefficient is 130 kN/(mm·s−1), and the damping index is 0.3. The schematic diagram of the connection of the seismic-isolation device for the large-span roof-isolated structure is presented in Figure 9.

Figure 9.
The schematic diagram of the connection of the seismic-isolation device.
The establishment of nonlinear numerical models for the Beijing Workers’ Stadium has been carried out in the SAUSAGE program, which is one of the high-performance programs in China that specialize in structural nonlinear analysis. In the analysis, the geometric nonlinearity, material nonlinearity, and construction process are fully considered. The equilibrium equation of the structure is established on the geometric state after deformation. The P-Δ effect, nonlinear buckling effect, and large deformation effect are comprehensively considered. The nonlinear stress–strain constitutive relationship of materials is employed to simulate the elastic–plastic characteristics of steel bars, steel, and concrete, which can effectively simulate the elastic–plastic behavior of structural components throughout the analysis. The beam and column elements are simulated using a nonlinear fiber beam element, while the shear wall is modeled using a multi-layer shell element. The concrete damaged plasticity (CDP) model is utilized for the purpose of simulating the progressive deterioration of concrete material. The initial elastic modulus is 3.25 × 10⁴ MPa, and the design tensile and compressive strength are 1.71 and 19.1 MPa. The strain–stress model of reinforcement has been chosen to be the bilinear model, which takes into account the Bauschinger effect. The initial elastic modulus of steel is 2.0 × 10⁵ Mpa, and the yield strength is 360 MPa. The numerical model is fixed at the base. The Rayleigh damping model is used in the nonlinear time history analysis. The damping ratio for concrete material is 5%, and for steel material it is 2%. The main dead load and live load for each layer are 6 kN/m2 and 4 kN/m2, respectively. Table 6 and Table 7 provide the mass data and dynamic characteristics of the Beijing Workers’ Stadium, respectively. Large-span spatial structures have closely spaced frequencies and complex vibration modes. However, when the roof is isolated, the first three modal shapes of the model become X-direction translation, Y-direction translation, and torsion. To obtain relatively high efficiency, the first three modal periods are used in the proposed IM.
Table 6.
Mass properties of the Beijing Workers’ Stadium.
Table 7.
Vibration period of the Beijing Workers’ Stadium.
The spectral velocity is not only the structural response (maximum velocity of the elastic single-degree-of-freedom with specific damping ratio under the ground motion) but also the measure to describe the intensity of the ground motions from the aspect of frequency content. In the CQC combination method, multiple modes that account for a 90% mass participation of spatial structures are considered. That is essential to achieve a relatively accuracy result. However, the ground-motion intensity is insufficient to cover enough ranges of frequency, to which the studied structures are sensitive. As a result, taking as many modes as possible is not always beneficial to improve the efficiency of the IM. The optimal number of modes should be investigated when the spectral-response-based IMs are employed.
5.2.1. Efficiency
The results of the Pearson coefficients between ln(IM) and ln(EDP) under the selected ground motions are illustrated in Figure 10. In this section, the EDPs examined include the MIDR, MRD, and MFA. The MIDR and MRD, which evaluate the degree of structural damage under earthquakes and local damage, story collapse, and instability, are both widely used EDPs. The MFA is proven to be closely related to the non-structural damage and reflects the level of seismic resilience.
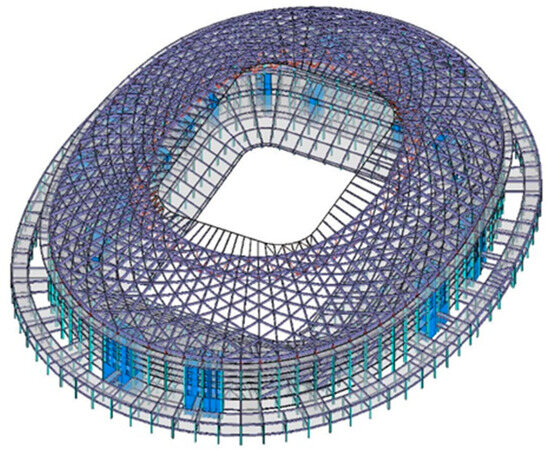
Figure 10.
Numerical model of the Beijing Workers’ Stadium.
Figure 11 illustrates that the proposed intensity measure exhibits a substantial increase in efficiency as measured by the MIDR, MRD, and MFA when compared to the first modal spectral velocity of the non-isolation and roof-isolation structures, denoted as and , respectively. Previous studies have demonstrated that serves as a significant indicator in classifying the damage incurred by base-isolated structures. Nevertheless, the notable distinctions in the dynamic response of structures with roof isolation versus those with base isolation underscore the necessity to implement adjustments in accordance with factor .
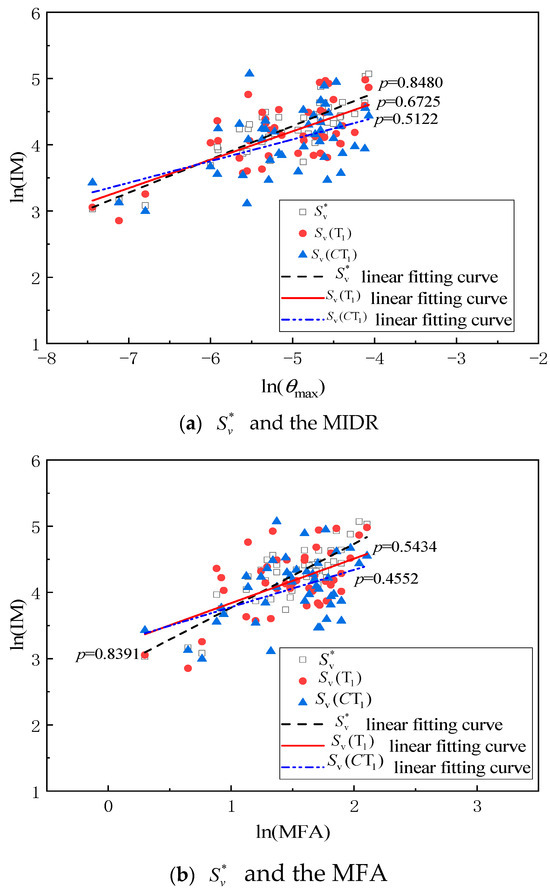
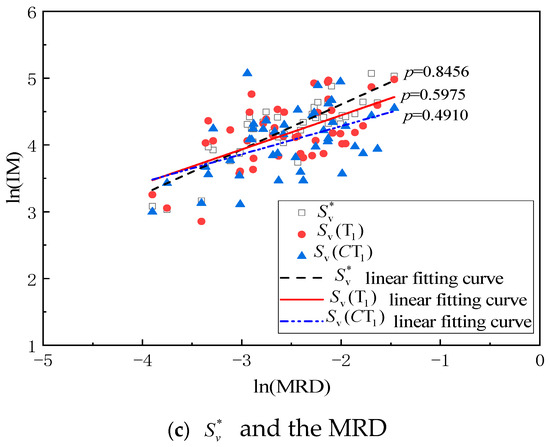
Figure 11.
Scatter plots and correlation coefficients.
The substantial improvement in the efficiency of the modified parameter (Figure 11) suggests that the isolated mass ratio and higher modes must be simultaneously accounted for in the first modal spectral velocity. Figure 12 depicts the ideal quantity of modes involved in . In order to optimize the benefits of the and attain the utmost efficiency, it is imperative to examine the initial three modes throughout all the EDPs (MIDR, MFA, and MRD). The efficiency of exhibits an early growth followed by a subsequent decline in response to an increase in the number of modes. This conclusion aligns with the findings of the elastic lumped-mass model that was examined in the preceding section.

Figure 12.
The number of modes combined in the IM.
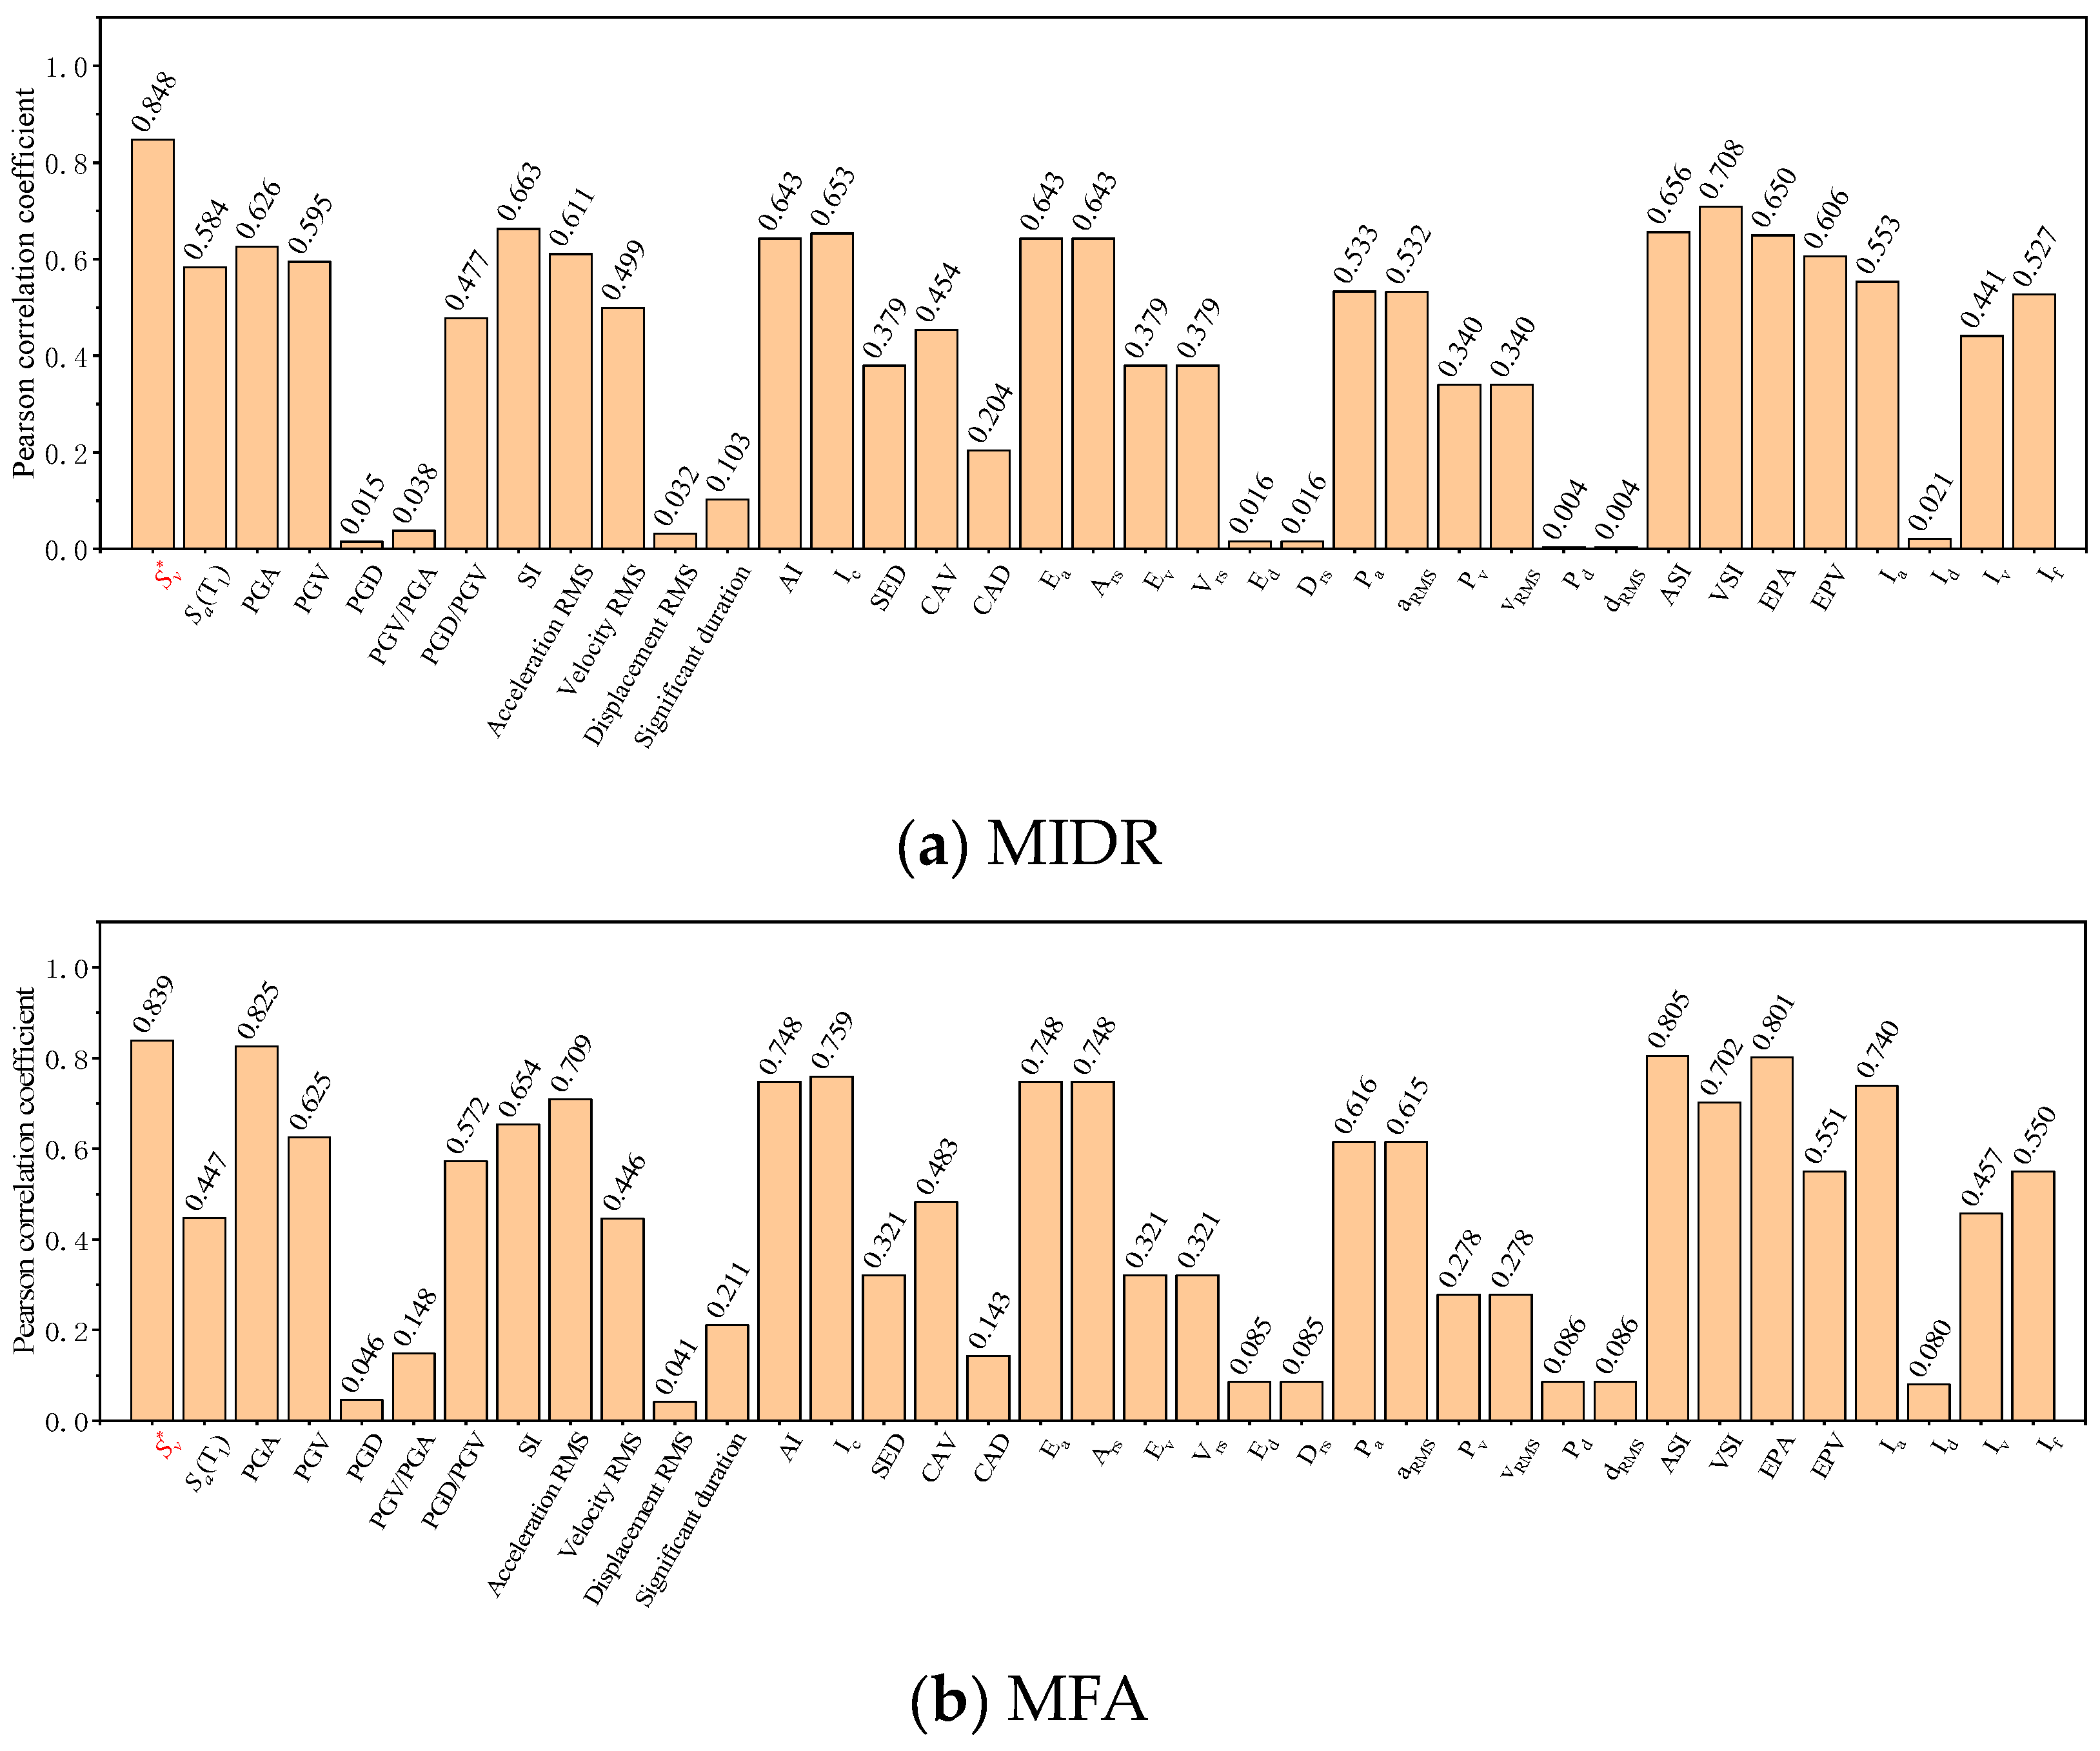
Figure 13 displays the Pearson coefficients between the EDPs and the selected ground-motion IMs. It is noteworthy to mention that the proposed exhibits superior efficiency in relation to the MFA, MIDR, and MRD compared to conventional ground-motion parameters.
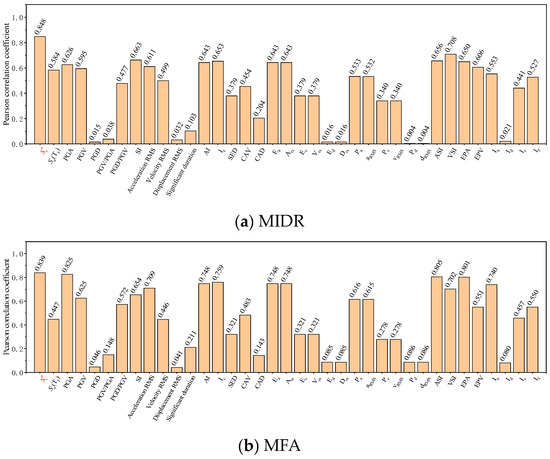
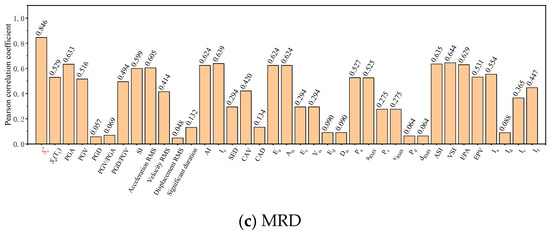
Figure 13.
Pearson correlation coefficients between IMs and the EDPs.
In Figure 13a, the first four efficient IMs are , VSI, SI, and ASI. In the MRD case, Figure 13c illustrates that the VSI measure exhibits the second highest level of efficiency compared to other IMs, with Ic and ASI ranking behind. For the MFA, when comparing Figure 13a,c, the primary distinction observed in Figure 13b pertains to the enhanced efficiency in the growth of IMs associated with acceleration-based IMs (such as ASI, Ea, Pa, and PGA). For example, the Pearson coefficients of the PGA in Figure 13a–c are 0.626, 0.633, and 0.825. Significant progress has been made, as the MFA can be seen as a direct amplification of the ground-motion acceleration, specifically known as the peak ground acceleration (54). Consequently, the MFA exhibits sensitivity towards the ground-motion IMs associated with acceleration, leading to an increase in the overall efficiency.
For widely used single parameter intensity measures, namely, the PGA, PGV, PGD, and measures, the most efficient IM is the PGA measure, which is also the key parameter used in the structural design of the Beijing Workers’ Stadium. With regard to the ground-motion IMs connected to velocity, the VSI measure distinguishes itself through the sophisticated definition, which incorporates a broad spectrum of frequency content and velocity.
Although the MRD and MIDR belong to the displacement demands, the displacement-related IMs, including the PGD, Drs, CAD, Displacement RMS, dRMS, Pd, Id, and Ed IMs, tend to demonstrate limited efficiency. In this regard, displacement-related IMs are inadequate for simulating the potential damage to roof-isolated structures caused by far-field ground motions. Furthermore, the correlation between the EDPs and the significant duration is weak in every case, as evidenced by the Pearson coefficients below 0.3. While both the PGV/PGA and PGD/PGV IMs attempt to capture a portion of the frequency content of earthquakes, their efficiency differs significantly. For the Riddle parameters (Ia, Id, Iv, If), the relative ranking is constant; Ia has the highest Pearson coefficient. From these figures, it should be noted that the acceleration-energy-based ground-motion IMs, such as acceleration RMS, Ea, Ars, Pa, and aRMS IMs, exhibit relatively high correlation with the structural response.
To investigate the suitability of different IMs for seismic-isolation structures, an inter-story-isolated high-rise structure with a similar fundamental period to the Beijing Workers’ stadium structure is selected for comparison [29]. The Pearson correlation coefficients between IMs and the MIDR of two structures with roof isolation and inter-story isolation are presented in Table 8. Despite the different structural types, the results of the Pearson correlation coefficients have similarities. Among the single parameter intensity measures PGA, PGV, and PGD, the most efficient IM is the PGA IM. Furthermore, some velocity-based IMs, including VSI, SI, PGV IMs, have relatively high efficiency. The IM with the greatest change in the Pearson correlation coefficient is the PGD IM, where the difference is close to 27 times.
Table 8.
Pearson correlation coefficients between IMs and MIDR on two structures with roof isolation and inter-story isolation, respectively.
5.2.2. Sufficiency
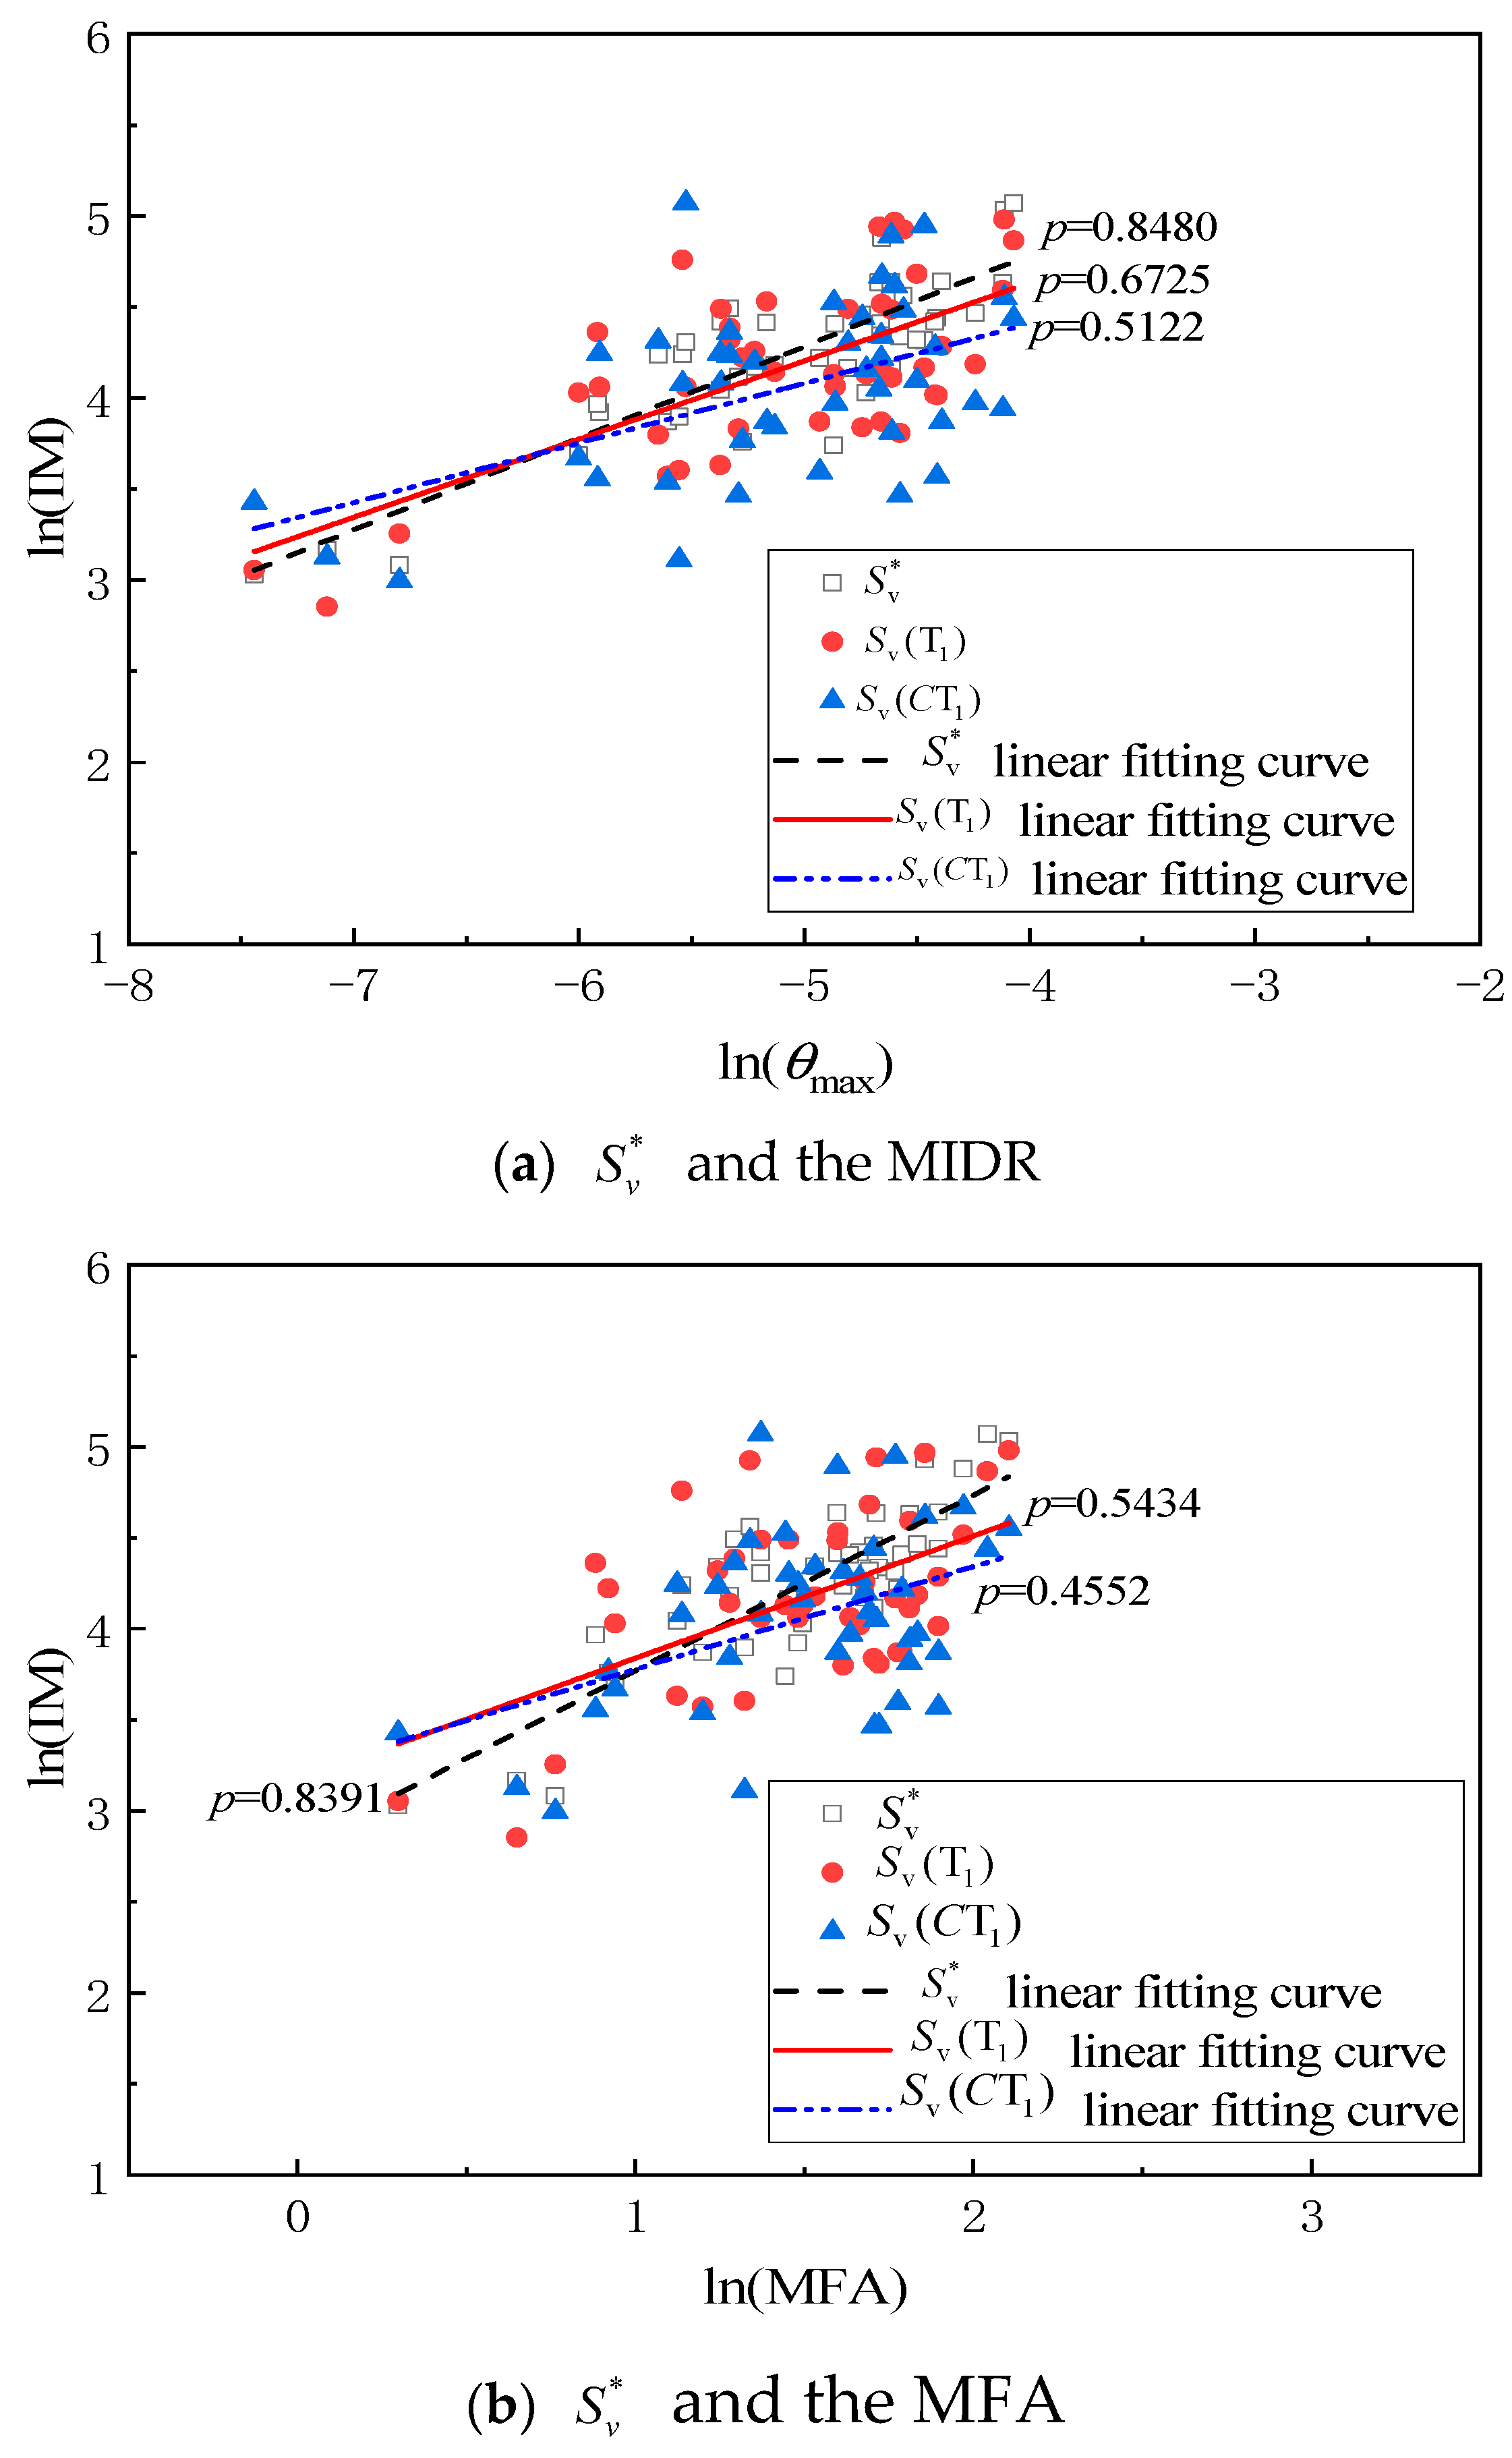
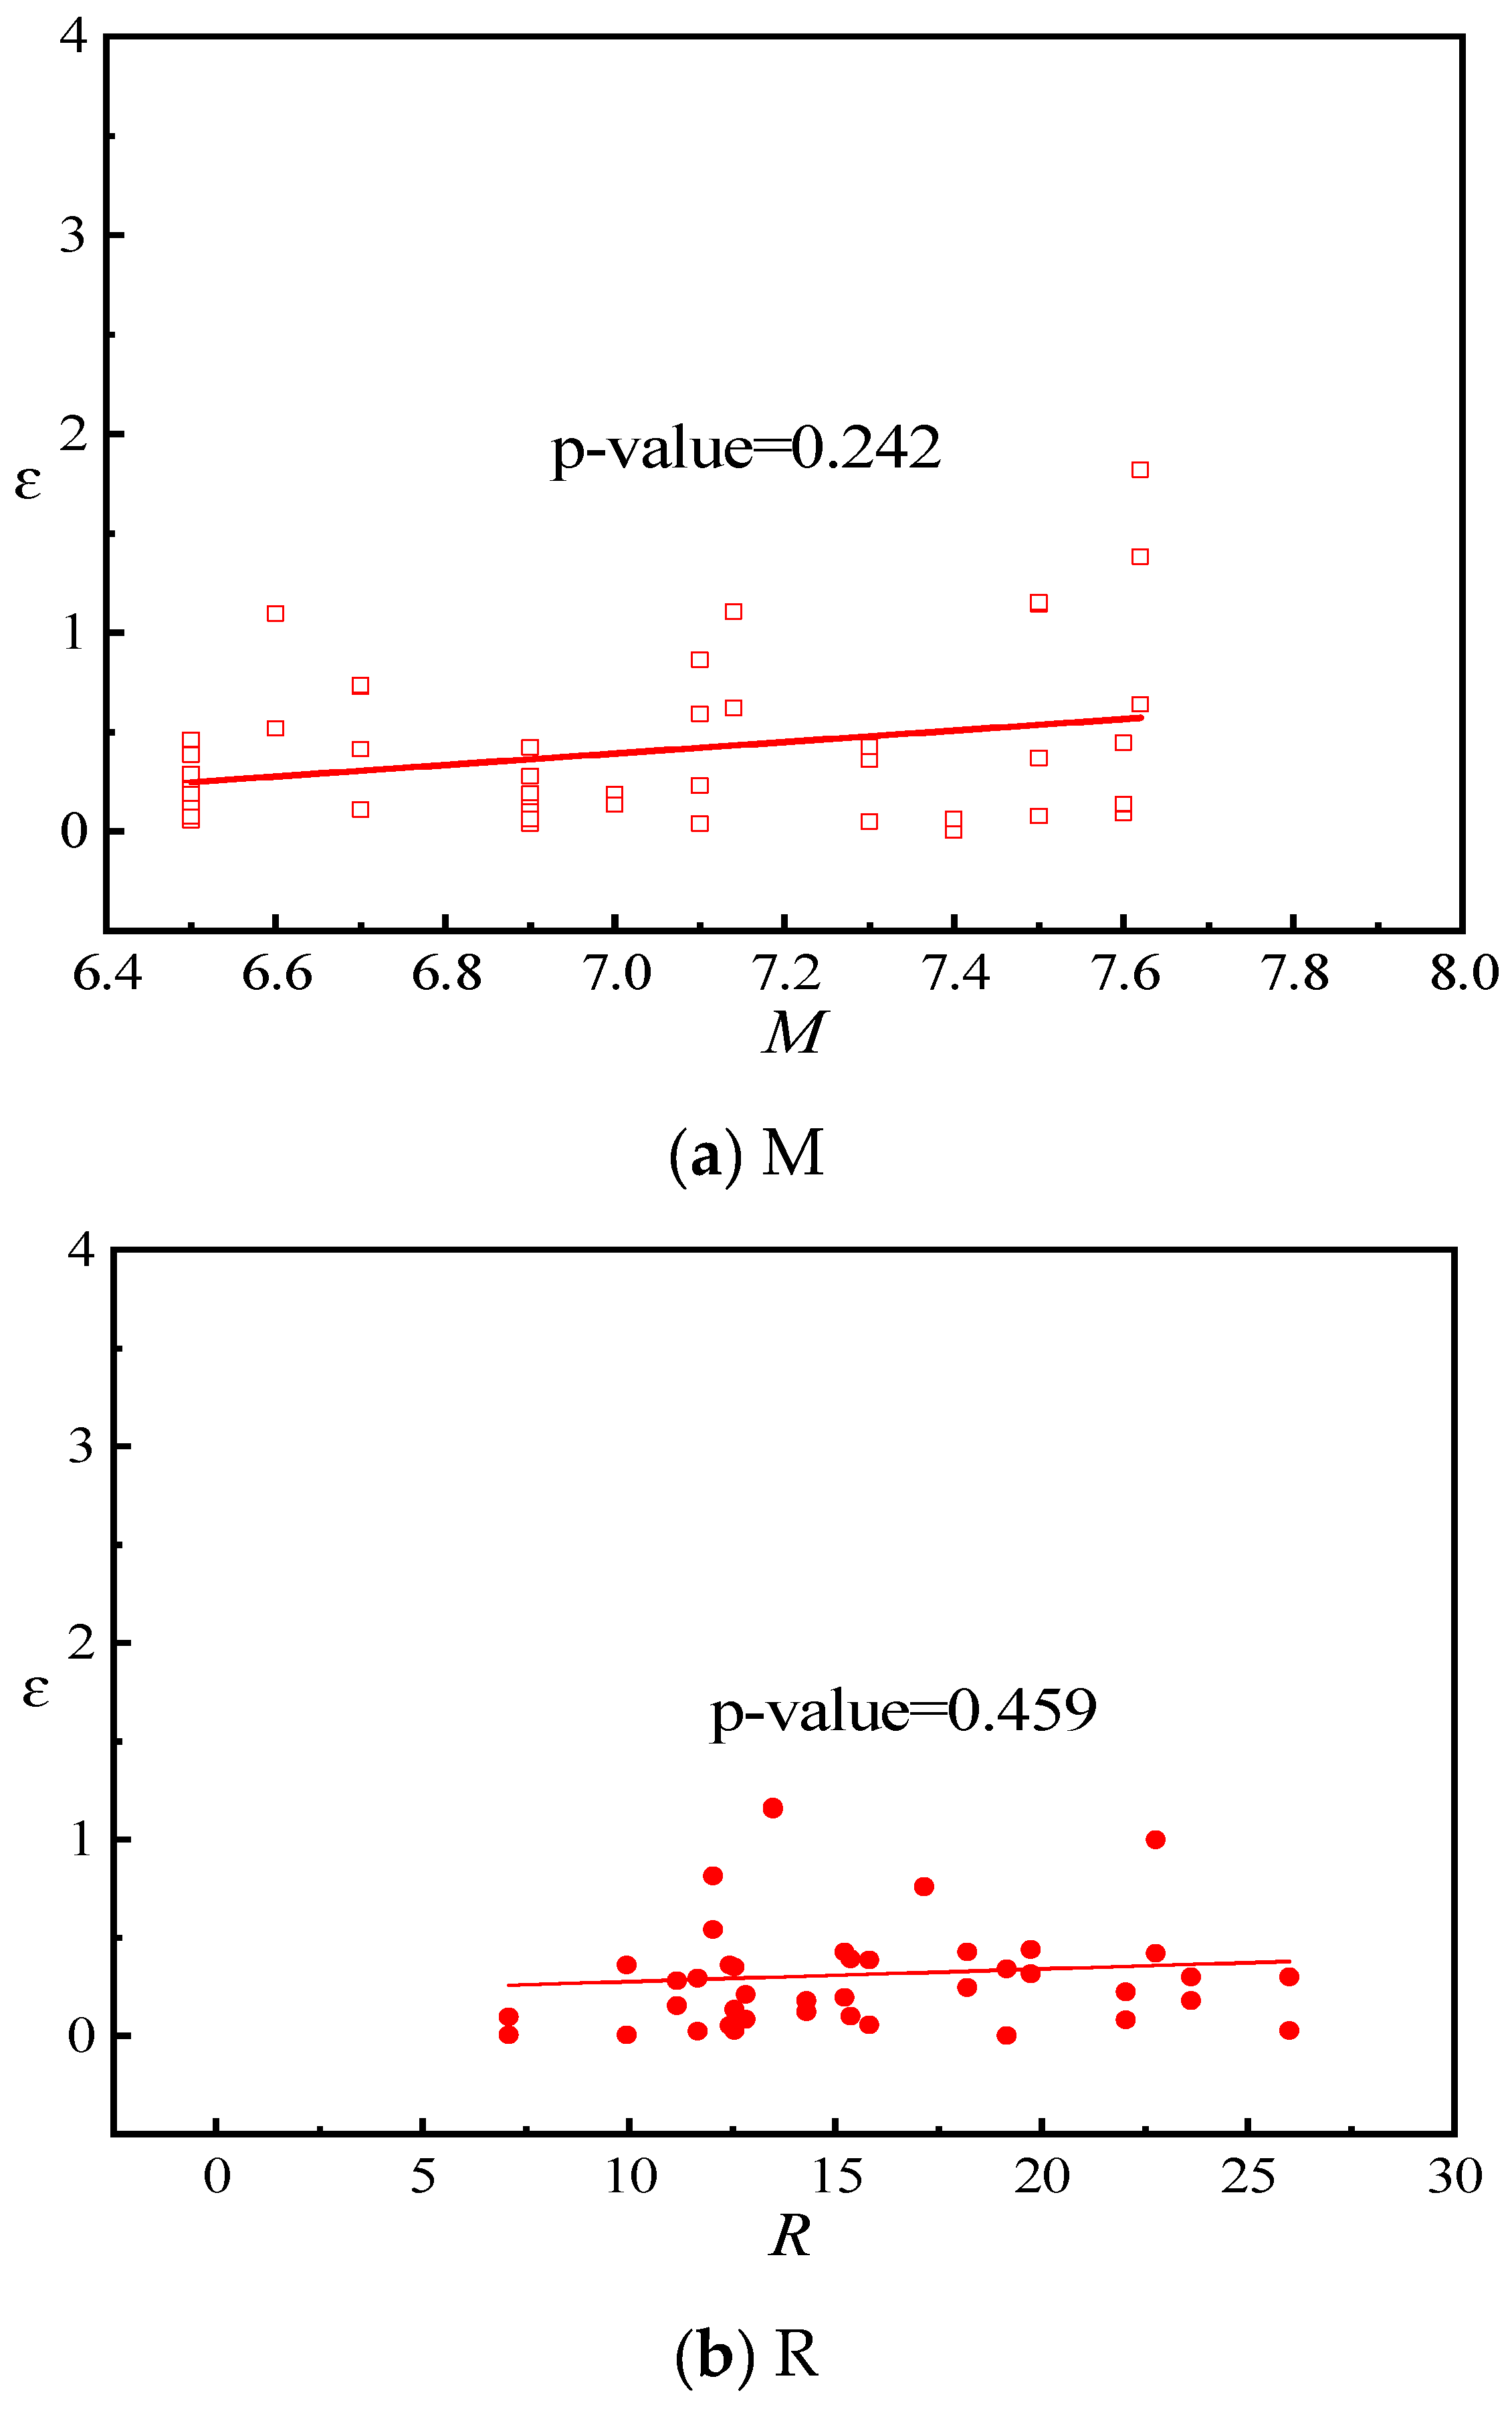
The sufficiency of the intensity measure (IM) can be assessed by regressing the residual term ln(ε|IM) against the seismic magnitude M or the logarithm of the distance R, as indicated by Equations (5) and (6). This allows for the evaluation of the importance of the link between the residual and magnitude M or the logarithm of the distance R. The present study used the F-test method at a significance level of 5% to examine the linear relationship. When the p-value in the regression analysis is less than 0.05, it suggests that the sufficiency of the related independent variable does not match the sufficiency requirements. The findings of the analysis performed for the sufficient evaluation of the suggested intensity measure are presented in Figure 14. The p-value is more than 0.05 in both instances. Consequently, the sufficiency of the is guaranteed.
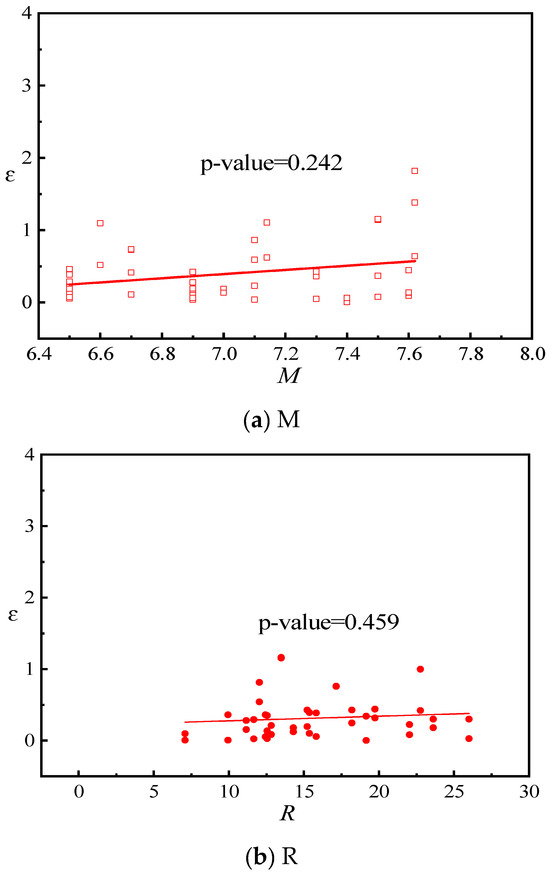
Figure 14.
Sufficiency evaluation of the : (a) magnitude M, (b) distance R.
It is necessary to acknowledge the limitations of this work. Notwithstanding the high efficiency and adequate sufficiency of this proposed ground-motion IM, other properties of a well-established IM, including scaling robustness and the correlation between IMs and structural damage, are not discussed. Furthermore, in the process of the time history analysis, the situation of a three-directional seismic wave input and the travelling wave effect are not considered. These limitations will necessitate additional investigations. Finally, while the suggested intensity measure has been studied in the context of large-span roof-isolated structures, there is no restriction on its application to other types of structures.
6. Conclusions
The comparative evaluation of the findings has yielded the subsequent conclusions:
- Roof isolation significantly increases the inherent period of the structure. By considering higher-order vibration modes and the isolated mass ratio in the spectral velocity, the Pearson coefficient can be improved by 34.2% for the MIDR, 51.5% for the MFA, and 41.5% for the MRD. The significant increment in the Pearson coefficient indicates the improvement in the efficiency of the proposed IM.
- The efficiency of the proposed IM firstly increases and then decreases with the increasing of modes. Taking the first three modes into consideration will lead to a 5% increase in efficiency in terms of the MIDR and MRD. For roof-isolated structures, it is recommended to employ the first three modes in the proposed IM.
- The proposed , which has adequate sufficiency, demonstrates the best efficiency in terms of the MFA, MIDR, and MRD among other ground-motion IMs. Moreover, the VSI is a superior definition for the synthesis of ground-motion IMs. The acceleration-energy-based ground-motion IMs, such as the PGA, Ars, Ea, Pa, acceleration RMS, and aRMS, exhibit a relatively high correlation with the structural response.
- Among the commonly used ground-motion intensity measures (PGA, , PGV) in the structure design, the PGA IM has the highest efficiency. For the proposed intensity measure, its incorporation into the probabilistic seismic hazard analysis (PSHA) framework in the design process of roof-isolated large-span structures entails further study.
Author Contributions
Methodology, W.Z. and Y.Q.; Software, Y.Q.; Validation, Y.Q.; Formal analysis, W.L.; Investigation, Y.Q.; Data curation, Y.Z.; Writing—original draft, Y.Q.; Writing—review & editing, W.Z. All authors have read and agreed to the published version of the manuscript.
Funding
This research was funded by [Beijing Municipal Science and Technology Project] grant number [Z221100005222009] and [Beijing Natural Science Foundation] grant number [L221022]. The APC was funded by [Beijing Municipal Science and Technology Project].
Data Availability Statement
The data presented in this study are available on request from the corresponding author. The data are not publicly available due to privacy.
Conflicts of Interest
Authors Wei Zhen, Yikun Qiu, Yanhua Zhang and Wei Li were employed by the company Beijing Institute of Architectural Design Co., Ltd. The remaining authors declare that the research was conducted in the absence of any commercial or financial relationships that could be construed as a potential conflict of interest.
References
- Wang, J.-T.; Liu, Y.-F.; Zhou, M.; Nie, J.-G.; Chen, X. Deformation prediction of large-span spatial structure considering adverse weather conditions. Structures 2023, 50, 508–523. [Google Scholar] [CrossRef]
- Su, Y.; Di, J.; Li, J.; Xia, F. Wind Pressure Field Reconstruction and Prediction of Large-Span Roof Structure with Folded-Plate Type Based on Proper Orthogonal. Appl. Sci. 2022, 12, 8430. [Google Scholar] [CrossRef]
- Tominaga, Y.; Stathopoulos, T. CFD simulations can be adequate for the evaluation of snow effects on structures. Build. Simul. 2020, 13, 729–737. [Google Scholar] [CrossRef]
- Liu, C.; Xiao, J.; Ma, K.; Xu, H.; Shen, R. Experimental and numerical investigation on the temperature field and effects of a large-span gymnasium under solar radiation. Appl. Therm. Eng. 2023, 255, 120169. [Google Scholar] [CrossRef]
- Tomasello, G.; Adriaenssens, S.; Gabriele, S. Dynamic behavior of form-found shell structures according to Modal and Dynamic Funicularity. Eng. Struct. 2019, 198, 109521. [Google Scholar] [CrossRef]
- Terazawa, Y.; Takeuchi, T.; Niimi, A.; Takeuchi, T. Generalized response spectrum analysis based computational morphogenesis for metal gridshells with buckling-restrained braces subjected to seismic loading. Comput. Struct. 2023, 275, 106914. [Google Scholar] [CrossRef]
- Bysiec, D.; Maleska, T. Influence of the mesh structure of geodesic domes on their seismic response in applied directions. Arch. Civ. Eng. 2023, LXIX, 65–78. [Google Scholar]
- Zhang, H.; Liang, X.; Gao, Z.; Zhu, X. Seismic performance analysis of a large-scale single-layer lattice dome with a hybrid three-directional seismic isolation system. Eng. Struct. 2020, 214, 110627. [Google Scholar] [CrossRef]
- Zhang, H.; Liu, X.; Li, H.; An, N. A comparative study on the effectiveness of bidirectional and tridirectional isolation systems used in large-scale single-layer lattice domes during earthquakes. Soil Dyn. Earthq. Eng. 2020, 141, 106488. [Google Scholar] [CrossRef]
- Zhang, C.; Nie, G.; Dai, J.; Liu, K.; Zhi, X.; Ma, H. Seismic Isolation Research on a Double-Layer lattice Structure Using Shaking Table Tests. Int. J. Steel Struct. 2019, 19, 1237–1248. [Google Scholar] [CrossRef]
- Feng, R.-Q.; Zhu, B.; Wang, X. A mode contribution ratio method for seismic analysis of large-span spatial structures. Int. J. Steel Struct. 2015, 15, 835–852. [Google Scholar] [CrossRef]
- Zhang, J.; Li, H.N.; Li, C. Seismic response of large-span spatial structures under multi-support and multidimensional excitations including rotational components. Earthq. Eng. Eng. Vib. 2021, 20, 141–159. [Google Scholar] [CrossRef]
- Wang, W.; Nie, G.B.; Bai, W.; Xu, W.D.; Du, K. Study on the strong earthquake failure mechanism of space grid structure considering rotational ground motion. Structures 2023, 57, 105140. [Google Scholar] [CrossRef]
- Faiella, D.; Mele, E. Vibration characteristics and higher mode coupling in intermediate isolation systems (IIS): A parametric analysis. Bull. Earthq. Eng. 2019, 17, 4347–4387. [Google Scholar] [CrossRef]
- Faiella, D.; Mele, E. Insights into inter-story isolation design through the analysis of two case studies. Eng. Struct. 2020, 215, 110660. [Google Scholar] [CrossRef]
- Forcellini, D.; Kalfas, K.N. Inter-story seismic isolation for high-rise buildings. Eng. Struct. 2023, 275, 115175. [Google Scholar] [CrossRef]
- Rajana, K.; Giaralis, A. A novel nonlinear isolated rooftop tuned mass damper-inerter (IR-TMDI) system for seismic response mitigation of buildings. Acta Mech. 2023, 234, 3751–3777. [Google Scholar] [CrossRef]
- Marulanda, J.; Thomson, P.; Tocoche, J. Seismic retrofitting of academic buildings using roof isolation as a tuned mass damper. Ing. Compet. 2023, 25, 1. [Google Scholar]
- Burton, H.V.; Baker, J.W. Evaluating the effectiveness of ground motion intensity measures through the lens of causal inference. Earthq. Eng. Struct. Dyn. 2023, 52, 4842–4864. [Google Scholar] [CrossRef]
- Shome, N.; Cornell, C.A.; Bazzurro, P.; Carballo, J.E. Earthquakes, Records, and Nonlinear Responses. Earthq. Spectra 1998, 14, 469–500. [Google Scholar] [CrossRef]
- Cordova, P.P.; Deierlein, G.G.; Mehanny, S.S.F.; Cornell, C.A. (Eds.) Development of a two-parameter seismic intensity measure and probabilistic assessment procedure. In The Second US-Japan Workshop on Performance-Based Earthquake Engineering Methodology for Reinforced Concrete Building Structures; Pacific Earthquake Engineering Research Center: Sapporo, Japan, 2001. [Google Scholar]
- Lin, L.; Naumoski, N.; Saatcioglu, M.; Foo, S. Improved intensity measures for probabilistic seismic demand analysis. Part 1: Development of improved intensity measures. Can. J. Civ. Eng. 2010, 38, 79–88. [Google Scholar] [CrossRef]
- Lu, X.; Ye, L.P.; Lu, X.Z.; Li, M.K.; Ma, X.W. An improved ground motion intensity measure for super high-rise buildings. Sci. China-Technol. Sci. 2013, 56, 1525–1533. [Google Scholar] [CrossRef]
- Su, N.F.; Lu, X.L.; Zhou, Y.; Yang, T.Y. Estimating the peak structural response of high-rise structures using spectral value-based intensity measures. Struct. Des. Tall Spec. 2017, 26, e1356. [Google Scholar] [CrossRef]
- Shome, N. Probabilistic Seismic Demand Analysis of Nonlinear Structures; Stanford University: Stanford, CA, USA, 1999. [Google Scholar]
- Zhang, Y.T.; He, Z.; Lu, W.G.; Yang, Y.F. A Spectral-Acceleration-Based Linear Combination-Type Earthquake Intensity Measure for High-Rise Buildings. J. Earthq. Eng. 2018, 22, 1479–1508. [Google Scholar] [CrossRef]
- Mollaioli, F.; Lucchini, A.; Cheng, Y.; Monti, G. Intensity measures for the seismic response prediction of base-isolated buildings. Bull. Earthq. Eng. 2013, 11, 1841–1866. [Google Scholar] [CrossRef]
- Saha, A.; Mishra, S.K. Amplification of seismic demands in inter-storey-isolated buildings subjected to near fault pulse type ground motions. Soil Dyn. Earthq. Eng. 2021, 147, 106771. [Google Scholar] [CrossRef]
- Saha, A.; Mishra, S.K. Synthesis of a vector-valued intensity measure for improved prediction of seismic demands in Inter-Story-Isolated (ISI) buildings subjected to near fault ground motions. Eng. Struct. 2021, 248, 113241. [Google Scholar] [CrossRef]
- Housner, G.W.; Martel, R.R.; Alford, J.L. Spectrum analysis of strong-motion earthquakes. Bull. Seismol. Soc. Am. 1953, 43, 97–119. [Google Scholar] [CrossRef]
- Von Thun, J.L.; Roehm, L.H.; Scott, G.A.; Wilson, J.A. Earthquake ground motions for design and analysis of dams. In Proceedings of the Earthquake Engineering and Soil Dynamics II-Recent Advances in Ground Motion Evaluation, Park City, UT, USA, 27–30 June 1988; Geotechnical Special Publication (ASCE): New York, NY, USA, 1988; pp. 463–481. [Google Scholar]
- ATC. Tentative Provisions for the Development of Seismic Regulations for Buildingss; ATC 3–06; ATC: Redwood City, CA, USA, 1978. [Google Scholar]
- Zhang, Y.; He, Z.; Yang, Y. A spectral-velocity-based combination-type earthquake intensity measure for super high-rise buildings. Bull. Earthq. Eng. 2018, 16, 643–677. [Google Scholar] [CrossRef]
- Lai, X.; He, Z.; Chen, Y.; Zhang, Y.; Li, Z.; Guo, Z.; Ma, L. A modified spectral-velocity-based earthquake intensity measure for super high-rise buildings. Soil Dyn. Earthq. Eng. 2022, 162, 107504. [Google Scholar] [CrossRef]
- Ryan, K.L.; Mojidra, R. Analysis of effect of vertical ground shaking in bridges isolated with spherical sliding bearings. Earthq. Eng. Struct. Dyn. 2023, 52, 5010–5032. [Google Scholar] [CrossRef]
- Narasimhan, S.; Wang, M.; Pandey, M. Principal Component Analysis for Predicting the Response of Nonlinear Base-Isolated Buildings. Earthq. Spectra 2009, 25, 93–115. [Google Scholar] [CrossRef]
- Avsar, O.; Ozdemir, G. Response of Seismic-Isolated Bridges in Relation to Intensity Measures of Ordinary and Pulselike Ground Motions. J. Bridge Eng. 2013, 18, 250–260. [Google Scholar] [CrossRef]
- Yang, C.; Xie, L.; Li, A.; Jia, J.; Zeng, D. Ground motion intensity measures for seismically isolated RC tall buildings. Soil Dyn. Earthq. Eng. 2019, 125, 105727. [Google Scholar] [CrossRef]
- Vamvatsikos, D.; Cornell, C.A. Developing efficient scalar and vector intensity measures for IDA capacity estimation by incorporating elastic spectral shape information. Earthq. Eng. Struct. 2005, 34, 1573–1600. [Google Scholar] [CrossRef]
- Kramer, S.L. Geotechnical Earthquake Engineering; Prentice Hall: Englewood Cliffs, NJ, USA, 1996. [Google Scholar]
- Riddell, R. On ground motion intensity indices. Earthq. Spectra 2007, 23, 147–173. [Google Scholar] [CrossRef]
- Tso, W.K.; Zhu, T.J.; Heidebrecht, A.C. Engineering implication of ground motion A/V ratio. Soil Dyn. Earthq. Eng. 1992, 11, 133–144. [Google Scholar] [CrossRef]
- Bommer, J.J.; Elnashai, A.S.; Weir, A.G. Compatible acceleration and displacement spectra for seismic design codes. In Proceedings of the 12th World Conference on Earthquake Engineering, Auckland, New Zealand, 1 January–4 February 2000. [Google Scholar]
- Dobry, R.; Idriss, I.M.; Ng, E. Duration characteristics of horizontal components of strong-motion earthquake records. Bull. Seismol. Soc. Am. 1978, 68, 1487–1520. [Google Scholar]
- Bommer, J.J.; Martinez-Pereira, A. The Effective Duration of Earthquake Strong Motion. J. Earthq. Eng. 1999, 3, 127–172. [Google Scholar] [CrossRef]
- Arias, A. Measure of earthquake intensity. In Seismic Design for Nuclear Power Plants; Hansen, R.J., Ed.; Mass Massachusetts Inst of Tech Press: Cambridge, MA, USA, 1970; Medium: X; pp. 438–483. [Google Scholar]
- Nau, J.M.; Hall, W.J. Scaling Methods for Earthquake Response Spectra. J. Struct. Eng.-ASCE 1984, 110, 1533–1548. [Google Scholar] [CrossRef]
- Riddell, R.; Garcia, J.E. Hysteretic energy spectrum and damage control. Earthq. Eng. Struct. 2001, 30, 1791–1816. [Google Scholar] [CrossRef]
- Fajfar, P.; Vidic, T.; Fischinger, M. A measure of earthquake motion capacity to damage medium-period structures. Soil. Dyn. Earthq. Eng. 1990, 9, 236–242. [Google Scholar] [CrossRef]
- FEMA. FEMA P695: Quantification of Building Seismic Performance Factors; Applied Technology Council: Redwood City, CA, USA, 2009. [Google Scholar]
- Ebrahimian, H.; Jalayer, F. Selection of seismic intensity measures for prescribed limit states using alternative nonlinear dynamic analysis methods. Earthq. Eng. Struct. Dyn. 2021, 50, 1235–1250. [Google Scholar] [CrossRef]
- Ohtori, Y.; Christenson, R.E.; Spencer, B.F.; Dyke, S.J. Benchmark control problems for seismically excited nonlinear buildings. J. Eng. Mech. 2004, 130, 366–385. [Google Scholar] [CrossRef]
- Bouc, R. (Ed.) Forced Vibration of Mechanical Systems with Hysteresis. In Proceedings of the Fourth Conference on Nonlinear Oscillation, Prague, Czech Republic, 5–9 September 1967; pp. 315–321. [Google Scholar]
- Wen, Y.-K. Method for Random Vibration of Hysteretic Systems. J. Eng. Mech. Div. 1976, 102, 249–263. [Google Scholar] [CrossRef]
- Rayegani, A.; Nouri, G. Seismic collapse probability and life cycle cost assessment of isolated structures subjected to pounding with smart hybrid isolation system using a modified fuzzy based controller. Structures 2022, 44, 30–41. [Google Scholar] [CrossRef]


Disclaimer/Publisher’s Note: The statements, opinions and data contained in all publications are solely those of the individual author(s) and contributor(s) and not of MDPI and/or the editor(s). MDPI and/or the editor(s) disclaim responsibility for any injury to people or property resulting from any ideas, methods, instructions or products referred to in the content. |
© 2024 by the authors. Licensee MDPI, Basel, Switzerland. This article is an open access article distributed under the terms and conditions of the Creative Commons Attribution (CC BY) license (https://creativecommons.org/licenses/by/4.0/).