Article

Structural Behaviour of FRP-Reinforced Tubular T-Joint Subjected to Combined In-Plane Bending and Axial Load

1
Shandong Provincial Key Laboratory of Civil Engineering Disaster Prevention and Mitigation, Shandong University of Science and Technology, Qingdao 266590, China
2
College of Civil Engineering and Architecture, Shandong University of Science and Technology, Qingdao 266590, China
3
Beijing Institute of Architecture Design, Beijing 100055, China
*
Author to whom correspondence should be addressed.
Buildings 2024, 14(2), 412; https://doi.org/10.3390/buildings14020412
Submission received: 3 January 2024 / Revised: 31 January 2024 / Accepted: 1 February 2024 / Published: 2 February 2024
(This article belongs to the Section Building Structures)

Abstract

:
In this study, 90 finite-element models are used to explore the behaviour of fibre-reinforced polymer (FRP) reinforced joints under combined in-plane bending (IPB) and axial load (AX). The effects of joint geometry, FRP layer count, and AX levels of the chord or brace are considered. Three typical failure modes are observed: chord plastic failure, brace plastic failure, and brace buckling failure. Increasing the number of FRP layers can ensure that failure is chord-related failure in a ductility manner rather than the unexpectedly brace-related brittle failure. Depending on the stress distribution of fibres, FRP reinforcement can restrict the deformation of joints subjected to complex loading patterns. Moreover, added FRP layers efficiently reduce the effect of brace AX on the IPB resistance. Finally, a modified strength equation is established, including the influence of FRP reinforcement, chord AX, and brace AX.

1. Introduction

Because of their excellent weight-strength ratios and attractive appearance, tubular members, especially circular hollow sections (CHSs), are very common in jacket platforms, bridges, and long-span constructions. In tubular structures with a small slenderness ratio, the connecting joint is not generally considered a hinged part [1]. The current CHS-joint design standard, published by CIDECT [2], includes predicted-resistance equations for a brace subjected to combined axial load (AX) and bending; the necessary chord loads are also considered as a coefficient function in the formula. The effect of joint reinforcement, e.g., with metallic stiffeners such as external rings [3], double plates [4], or grouted clamps [5] has been widely discussed. However, these traditional reinforcement methods typically require a welding connection and induce unexpected potential welding damage. To eliminate such welding damage, the fibre-reinforced polymer (FRP) composite can serve as an effective alternative for use in joint reinforcement. Meanwhile, with the fabrication of FRP, the load-bearing capacity [6], joint flexibility [7], and its flexible materials could perfectly fit the diverse joint geometry [8]. Emerging applications of FRP composites notwithstanding, the complex loading patterns on the FRP-reinforced joints have not yet been thoroughly surveyed.
According to previous studies, the use of FRP reinforcement improves the performance of brace loading schemes. Lesani et al. [9,10] found that FRP composite improved the static strength of T/Y joints under brace compression by about 22–66%. Deng et al. [11] reported that FRP composite postponed the development of chord-face plastic and punching-shear failure in T-joints under axial compression. Nassiraei and Rezadoost [12] and Hosseini et al. [13] observed that FRP reinforcement benefited T/Y joints subjected to bending: reinforcement reduced the stress concentration factor at the weld toe by 50% for out-of-plane bending (OPB) and 40% for in-plane bending (IPB) [13]. Discrepant strengthening results for different loads may be attributable to the loading transfer path and the fibre orientation [12]. Positive effects of FRP composite have been reported in joints with a wide range of geometries [14,15,16].
The chord load is known to affect joints adversely [17,18,19]. However, the effects of FRP reinforcement on joints subjected to chord load seem not to have been investigated. There have been some studies of the chord performance of hollow steel tubes with FRP composite. Al-Saadi et al. [20] and Fernando et al. [21] have demonstrated the enhanced load-carrying capacity of FRP-confined tubes with end-bearing loads. Teng et al. [22] concluded that FRP reinforcement improves the ductility and buckling resistance of axially loaded hollow tubes. Wei et al. [23] reported that the radial expansion of a tube subjected to axial compression was restrained by the enclosed FRP, which produced a tri-axial compressive response within the tube member. As the main contribution of FRP wrapping is to generate a confined pressure, an unsatisfactory result was observed in axial-tension experiments on an FRP-reinforced circular tube [24], which not only induced the dominant fibre tearing but also the unexpectedly adhesive failure. Moreover, the chord in the joint system mainly exhibited flexural behaviour, in which deformation restriction and debonding would both be observed with FRP reinforcement [25,26].
To date, studies on the FRP-reinforced joint have merely investigated the single loading pattern, overlooking the application of FRP reinforcement to tubular members. In this study, the effect of complex load patterns on FRP-reinforced joints is explored, including the influence of brace and chord AX on IPB resistance of tubular joints. An isolated CHS T-joint representing a practical truss member is simulated using the finite element (FE) method. Ninety FE models are constructed with different geometric properties, brace and chord AX, and numbers of FRP layers. The failure mode, fibre stress status, and the ultimate strength of FRP-reinforced joint are exhaustively discussed.

2. Finite Element Simulation Steps

2.1. Modelling

FE simulation can capture the mechanical characteristics of tubular joints and FRP strengthening [11,27,28]. Here, three different CHS T-joints described in the experimental literature were numerically simulated to verify the FE calculations: T-1, a T-joint under brace axial compression [29]; T-1-C, a T-joint with FRP wrapping under brace axial compression [29]; and M-T2, a T-joint under IPB [30]. The FE simulations were conducted using ABAQUS 2021 commercial software [31].
The geometry and weld sizes of each model are shown in Figure 1, and the measured dimensions are in Table 1. Both T-1 and T-1-C had an annular groove on the chord [29]. Fillet weld models were produced for each joint, each possessing an arc shape fitting the intersecting line. Due to the lack of welding information, the possible welding damage and heat-affecting region were not considered in this simulation. The end plates were used only to support the specimen rather than the majorly investigated part of structural behavior. Each end plate was 20 mm thick. The solid elements of C3D8R [31] could provide a better calculation accuracy if the element distortion occurred, which was used for simulating the chord, brace, weld profile, and end plates with ABAQUS.
Figure 2 shows the FRP-wrapping orientation and arrangement of each pile. The wrapping lengths on the chord (lfrp0) and brace (lfrp1) were 1200 mm and 300 mm, respectively. S4R shell elements [31] were used to construct the FRP model. Because the interface slippage between the steel substrate and FRP composite did not appear, a ‘Tie’ constraint was applied for the interaction with the default discretization method, in which the FRP composite was considered the slave surface.
The mesh size and boundary conditions are indicated in Figure 3. T-1 had the same settings as T-1-C did. The models’ boundary conditions were realistic. To promote the calculation convergence, the loading was performed by a corresponding displacement method [5]. Different mesh densities were chosen for the different models to meet the computational requirements. The mesh was crowded in the core region around the intersection to provide more accurate calculated results, with a size of 1.5t0 × 1.5t0. Due to the chord-thickness difference at the transition of the corroded and intact region, an extremely crowded mesh was placed around it with expected stress concentrations.
The material properties of the chord and brace in the experiments are listed in Table 2. The material data of steel members from the Refs. [29,30] are the nominal strain (εn) and stress (σn). To show more realistic material properties, the tested material information in Table 2 should consider the changed section area with increasing load, which were both transformed into engineering strain (εt) and stress (σt) responses:
ε t = ln ( 1 + ε n )
σ t = σ n ( 1 + ε n )
The bi-linear material model with the isotropic hardening rule was applied for the chord and brace. Poisson’s ratio for the steel tube was taken as 0.3 [32]. The material properties of the weld were not provided in Refs. [29,30]; hence, they were tentatively assumed here to be the same as those of the brace material. The end plates were modelled as rigid bodies.
The FRP composite is compounded by unidirectional carbon with a model ID of T300-12K; the matrix of the FRP composite is the insulation varnishes of the epoxy resin. The material used by Shao et al. [29] was transplanted into the lamina model in ABAQUS. The fibre’s tensile strength was 2560 MPa, and its elastic modulus was 238 GPa. The matrix elastic modulus was 2400 MPa, and the Poison’s ratio was 0.35. Typical damage evolution and failure criteria for fibres [33] were used to reflect the FRP destroying manner.

2.2. Verification Study

The experimental failure modes were well captured by the simulated results; a detailed comparison for all three models is made in Figure 4. The high-stress area on T-1 (Figure 4a) coincides with the area of joint yielding and major deformation. The fibre-tearing observed in the specimen of T-1-C also appears in the corresponding region of the FRP model (in Figure 4b) accompanied by an evident stress concentration. Brace fracture was observed in M-T2, in the region that reached fracture strain in the simulation (Figure 4c).
The experimental and simulated load-displacement curves are compared in Figure 5. These curves were very close in the structural elastic state but showed slight deviation in the plastic state due to the simplified material model. The coefficients of variation (COV) of the modelled and experimental curves were 0.084, 0.147, and 0.176, for T-1, T-1-C, and M-T2, respectively. Based on the strength determinations in Refs. [29,30], the joint failure strength of the FE model (NFE) and experiment (Nex) are plotted in Figure 5. The three NFE-to-Nex ratios were 1.03, 1.01, and, 1.02. Thus, FE modelling can replicate the structural behaviour of un-reinforced and FRP-reinforced joints.

3. Parametric Investigation

3.1. Specimen Programme

A total of 90 numerical models of CHS T-joint models were created. The influencing factors investigated were the joint geometry, chord AX, brace AX, and number of FRP layers. Joint geometries met the Chinese standard for steel structures [34]. The specimens were divided into six geometrically homogeneous groups (Table 3).
Various magnitudes of axial compression and tension onto the chord and brace were considered. The chord AX proportion (n0) and brace AX proportion (n1) were defined as:
n 0 = σ / f y 0 A
n 1 = N s / F s
where σ is the imposed chord stress, fy0 is the chord material’s yield strength, A is the chord’s cross-sectional area, Ns is the imposed brace load, and Fs is the joint’s yield strength under corresponding brace AX. (Negative values mean a compressive force and positive a tensile one).

3.2. Numerical Model, Loading Protocol, and Strength Definition

The material properties and element types in the numerical models were those of verified model T-1-C. The fibres had alternating principal orientations of 90°/0°, as in Figure 2. The same strategy of FRP wrapping was followed for both chord and brace. The ‘Tie’ interaction in ABAQUS was again used between FRP and steel members.
The loading instructions and boundary conditions of the numerical models are illustrated in Figure 6. The brace or chord AX was imposed first; then, the IPB was applied. The chord AX was held fixed while the IPB moment was acting. The brace AX was discontinued in the second step to avoid the secondary moment from the inclination and axial force of the brace. However, the brace AX changed the stress status and deformation of the joint. The loading was executed by the corresponding displacement method.
The joint strength was determined from the moment–deformation curve, based on the widely accepted Lu’ strength criteria for IPB-loaded joints [35]: if a peak point existed at the moment–deformation curve, the ultimate strength was assumed to be the load at that point; otherwise, it was defined as the load value around 3% chord deformation. Hoadley [36] reported that the superimposed effect of the brace AX and IPB moment alters the position of maximum deformation on the chord surface. Thus, for different loading patterns, three sections were considered (Figure 6). To eliminate the effect of chord deflection, the extracted vertical deformation value on the chord upper surface of each section was subtracted from the corresponding displacement at the bottom.

4. Typical Failure Phenomena

4.1. Distribution of Failure Mode

Three joint-failure modes were found to occur in the steel member and FRP composite: chord plastic failure, brace plastic failure, and brace buckling failure. Their distribution among the specimens is shown in Figure 7. For groups T1 to T3, which exhibited the chord plastic-failure mode, n0, β, and FRP layer-count had less effect than the other parameters on the joint-failure mode. For groups T4 to T6, the decreased γ and brace axial tension resulted in the brace, rather than the chord, showing plastic failure, but the chord failure mode could be restored with enough FRP layers. Based on the distributed situation of failure modes, the chord AX did not change the failure mode of the FRP-reinforced T-joint. The composition action of brace AX and IPB would result in the unaccepted failure patterns on the brace. This could be due to two reasons: a small γ of joint geometry or insufficient FRP reinforcement. The major failure phenomenon and stress contour are meticulously discussed in the following section.
The contours of the Mises stress on the steel member and the Hashin damage [33] of the FRP composite in three typical specimens (T1-C0-L4, T6-B+0.4-L4, T6-B0-L0) are plotted in Figure 8. The damage conditions of fibre and matrix in FRP composite are exhibited in envelope calculation [31], where a damage degree of 1.0 means complete failure. Typical moment-deformation curves of each failure mode are also shown, with the loading state of the displayed contour denoted indicated by a bold dot.

4.2. Chord Plastic Failure (T1-C0-L4)

Most specimens, e.g., T1-C0-L4 (Figure 8a), exhibited chord plastic failure. Subjected to merely IPB moment, the brace inclined, causing different chord ovalisation on the sides of the crown regions [30]. For a weak matrix, joint deformation was clearly reflected as matrix damage: the outward bulging of the steel member induced tensile damage to the matrix, and the concave steel surface induced compressive damage.
Steel-member yielding occurred first near the crown area of the chord up-surface and then progressed rapidly around the ring-like weld. At the point of 72% ultimate moment (Mu), a plastic hinge formed surrounding the intersecting line. This increased the brace’s inclination, indicating the beginning of the structural plastic phase. The yielding area gradually occupied the intersection region of the chord wall and little of that spread to the tensile-side brace wall, causing extensive matrix tensile damage on the left-side brace and chord surfaces. Moreover, the fibre and matrix compressive damage corresponded to the right-side chord concavity.
At the point of 86% Mu, fractional fibre tearing (tensile-damage degree = 1) appeared near the tensile-side weld. This implies weakened restrictions on joint deformation, mainly in the chord domain. Finally, progressive chord deformation reached 3% d0; this was judged to constitute acceptable ductile failure.

4.3. Brace Plastic Failure (T6-B+0.4-L4)

The brace plastic failure (i.e., failure attributable to loss of carrying capacity by a tensile-side brace wall) in FRP-reinforced joints (with γ = 10.5) subjected to combined brace tension and IPB moment was examined, using T6-B+0.4-L4 as the sample (Figure 8b).
Under brace tension and IPB, the left-side tensile stress first caused yielding at a relatively small moment ratio (at the point of 57% Mu) on the left-side chord face. The smaller γ also boosted the spreading of the yielding area to the brace wall rather than the chord. Then, the brace quickly reached a larger degree of inclination and bent slightly. On the tensile-side brace wall, the larger inclination and FRP restriction generated an isolated yielding area at the transition between the FRP covering and uncovering regions. Meanwhile, the right-side brace wall began to yield; this was followed by corresponding compressive damage to the fibre and matrix.
Arriving at 77% Mu, fibre tearing occurred in the weld area and mainly grew toward the tensile-side brace wall. A considerable yielding area occupied both the right-side and left-side brace walls. Before the chord deformation reached its serviceability limit of 3% d0, excessive plastic development and the fibre tearing around the left-side brace wall made the brace members unable to withstand the tensile stress from IPB. A sharp peak was generated in the moment–deformation curve, indicating that the joint had failed. The inducer of this failure pattern was attributed to the small γ, which caused the excessive deformation of branch pipes, and to the inadequate FRP reinforcement.

4.4. Brace Buckling Failure (T6-B0-L0)

Only an un-reinforced joint (T6-B0-L0) with a small γ (10.5) failed through brace wall buckling (Figure 8c). The yielding initially appeared on both sides of the crown region at the point with 70% Mu; it grew toward the brace wall as the smaller γ (10.5). Lacking FRP assistance, the brace had a faster incline rate and the compressive stress from IPB produced obvious brace bulging near the right-side weld. As the IPB moment increased, the yielding area mainly developed on the right-side brace wall, cultivating an instability of the brace wall.
Finally, the continuous IPB and the excessive yielding area on the right-side brace wall caused brace buckling before 3% d0 chord deformation. Thus, the joint reached its ultimate strength and a peak point appeared in the moment-deformation curve. If the loading continued, a wavy face would develop on the compressive-side brace wall (Figure 8c). Compared to the modes of brace plastic and buckling failure, even though they are both unacceptable brittle failure modes for tubular joints, FRP reinforcement not only assisted the load-bearing but also reduced high-stress areas in the brace member.

5. Effects of Diverse Loading Strategies on FRP-Reinforced Joint

5.1. General

To clarify the contribution of the FRP composite with different loading patterns, the stress distributions on the fibres in joints that exhibited chord plastic failure were investigated. Because most steel-yielding and fibre-tearing took place in the chord domain, only the stress contours of the chord were plotted. Effects on fibres aligning in the longitudinal (90°) and hoop (0°) directions of the chord were estimated.

5.2. IPB Moment

The fibre stress distributions of T1-C0-L0 subjected to an IPB moment alone are shown in Figure 9. Once the IPB acted, the joint rotated around the interaction region to maintain its moment equilibrium [36]. The chord was deformed by vertical or lateral ovalisation on the sides of the crown regions, depending on the rotation direction.
FRP reinforcement produces confinement pressure, which restricts surface bulging [22]; the pressure causes (positive) tensile stress on the fibre. As Figure 9 shows, the upward protrusions of the steel surface in the left-side crown area were restricted by fibres in both the longitudinal and hoop directions. The right-side chord concavity in the crown area was not directly restricted by the FRP composite, but the resultant side-wall bulging was blocked by hoop fibres.

5.3. Chord AX and IPB Moment

Fibre stress contours for the T1-C+0.8-L4 and T1-C−0.8-L4 samples were plotted for the chord AX completion state (Figure 10). The desired amount of axial force was transferred uniformly within the chord thickness and redistributed along the longitudinal fibres through bond action. These fibres exhibited a relatively even stress distribution (Figure 10a,b). Moreover, the chord AX also induced a minor radial deformation; this was confined by the hoop fibres, which induced tensile or compressive stress states (Figure 10c,d). However, because of the brace, the stress delivery was not as uniform as in FRP-wrapped tube members [23]. An uneven stress distribution was observed in both longitudinal and hoop fibres.
Next, the IPB was applied with sustained chord AX. The ultimate moment fibre stress contours are shown in Figure 11. In T1-C+0.8-L4, sustained axial tensile stress had a beneficial straightening effect and delayed joint deformation under IPB [18]. The distributions of high tensile stress in Figure 11a,c are smaller than those with IPB alone; the chord axial compression, meeting the right-side chord concavity, triggered a secondary moment effect [3] that resulted in a deeper indention. Thus, wider scopes of higher tensile stress were detected on the side-wall hoop fibres (Figure 11d).

5.4. Brace AX and IPB Moment

The fibres’ stress contours at the completion state of the brace AX for T4-B+0.8-L4 and T4-B−0.8-L4 are plotted in Figure 12. The AX was transmitted from the brace to the chord along the longitudinal direction at the crown points [13]. As shown in Figure 12a,b, the longitudinal fibres efficiently contributed to load bearing; they exhibited more high stress around the interaction region than hoop fibres. A widespread high-stress area could be observed on the bottom of the chord in longitudinal fibres for its overall chord bending. High stress also occurred on the side wall of the hoop fibres, as indicated in Figure 12c,d.
Even though brace AX was abolished during IPB, the residual stress field changed the joint-deformation characteristic under the IPB moment. Figure 13 shows the ultimate moment fibre stress contours of T4-B+0.8-L4 and T4-B−0.8-L4. The superimposed tensile stress on the left-side crown area promoted an evident protrusion deformation and the propagation of further spreading of high tensile stress on longitudinal fibres (Figure 13a). A reversed superposition of the tensile and compressive stresses relieved the right-side concavity and dissolved the high tensile stress on the hoop fibres (Figure 13c).
The combination of brace compression and IPB caused an indention around the intersection region. As seen in Figure 13d, the high tensile stress of the hoop fibres occupied an area below the intersection region, while the left-side crown protrusion was greatly mitigated. As illustrated in Figure 13b,d, the distribution of the high tensile stress on the left-side crown area for fibres in both the longitudinal and hoop directions was hard to discover. Compared to the load pattern of chord AX and IPB, the scope of high-stress grade more appeared which means the FRP reinforcement plays a more efficient role for the T-joint subjected to the brace AX and IPB.

6. Results

6.1. Effect of n0, β, and FRP Layer-Count on Joint Strength

The ultimate moments of specimens in groups T1 to T3 with different n0, β, and FRP layer-counts are summarised in Figure 14. Increasing β and layer count upgraded the resistance to IPB moment, as seen in previous studies [1,37]. An elevated n0 reduced the threshold of the joint yielding moment and also decreased IPB resistance. A slight improvement of joint resistance to IPB (straightening effect) was noticed for axial tensions in a relatively minor range (n0 = +0.4). By contrast, chord tension with a sizeable proportion (n0 = +0.8) caused a reduction in IPB resistance.
Figure 15 illustrates the effects of parameter interactions on IPB resistance. The change ratios of Mu under different parameter arrangements are marked. The effect of varying n0 on IPB resistance for joints with different β was insignificant (Figure 15a). For instance, when β increased from 0.446 to 0.714, the whole fluctuation ratios of joint strength impacted by varying n0 just altered for about 1%. That was because β was amplified, in this study, by enlarging the brace diameter rather than replacing the chord diameter. Therefore, n0 and β had relatively independent effects on the IPB resistance.
The interaction between n0 and FRP layer-count was also limited. For the specimen without FRP reinforcement, as n0 went from −0.8 to −0.4, the strength increased 5.1%; with eight FRP layers, this became 2.8%. Moreover, having more FRP layers did not change the effect of chord tension on IPB resistance. As the layer count increased from 0 to 8, the strength fluctuation ratios (as n0 went from +0.4 to +0.8) only changed by about 0.5%.

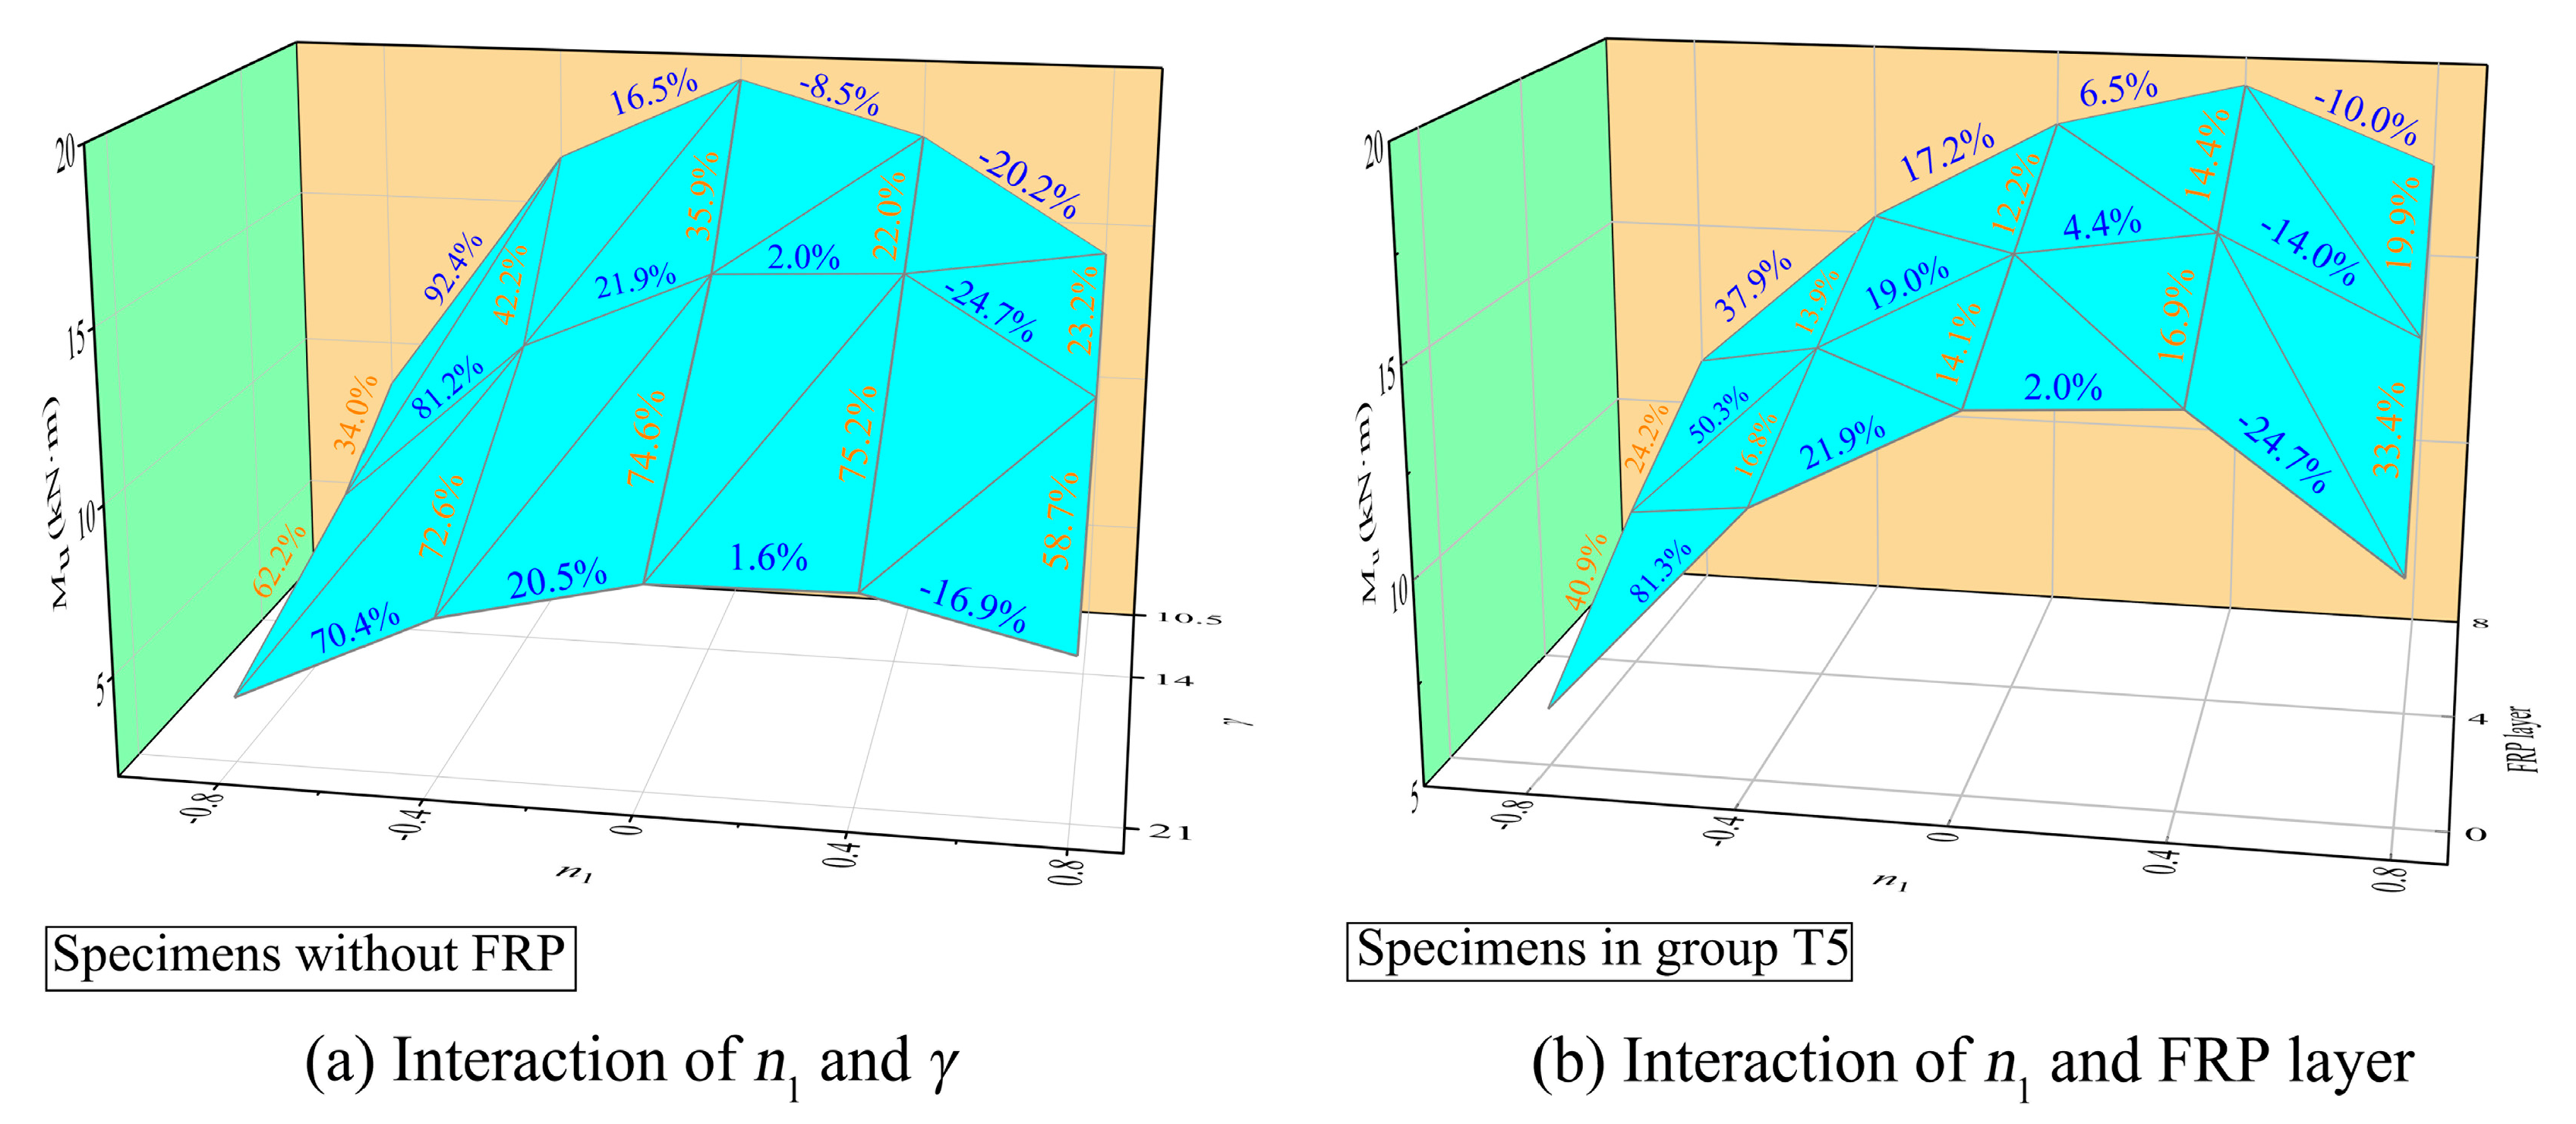
6.2. Effect of n1, γ, and FRP Layer-Count on Joint Strength

Figure 16 presents the specimens in groups T4 to T6, varying n1, γ, and FRP layer-count. Incremental brace compression boosted the overall indention of the interaction region and weakened IPB resistance. Minor brace tension (n1 = +0.4) enhanced IPB resistance. However, the improvement in joint strength from brace axial tension became negligible for joints that failed for brace-related reasons (brace plastic failure or brace buckling failure). A high brace-tension proportion (n1 = +0.8), although it postponed the formation of right-side chord concavity under IPB, had a more pronounced negative effect, reducing the joint strength. This joint strength reduction attributed to brace axial tension was however less than that related to axial compression.
The strength-change ratios of un-reinforced joints with different combinations of n1 and γ are shown in Figure 17a. A smaller γ implies stronger radial flexibility of the chord wall and enhances joint resistance. However, this also makes IPB resistance more sensitive to brace AX, especially for large n1. For example, when n1 changed from −0.8 to −0.4, the joint strength increased by 70.4% for γ = 21, but by 92.4% for γ = 10.5.
Figure 17b illustrates the effect of the interaction between n1 and layer count on the ultimate moment for group T5. The added FRP layers strengthened IPB resistance and weakened the effect of n1. For instance, the strength fluctuation as n1 went from −0.8 to −0.4 changed by 81.3% without FRP, but 50.3% and 37.9%, respectively, with four and eight FRP layers. However, the efficiency of the FRP reinforcement was gradually reduced as the layer count increased. As the number of FRP layers increased from 0 to 4, the joint strength (at n0 = +0.8) was enhanced by 33.4%, but going from 4 to 8 resulted in an improvement of just 19.9%.

7. Discussion

The current CIDECT standard [2] includes a predicted-strength equation for a CHS T-joint loaded by IPB moment:
M u = Q u Q f f y 0 t 0 2 d 0
The geometric parameters β and γ enter into Qu through the Equation (6):
Q u = 4.3 β γ 0.5
The chord axial stress is included in Qf in piecewise form:
Q f = 1 n 0 C 1
C 1 = 0.45 0.25 β ,     i f , n 0 < 0   C 1 = 0.20 ,     i f , n 0 0 ,
This expression for chord axial tension disregards its beneficial influence on IPB resistance in both reinforced and un-reinforced joints. External reinforcement not only increases joint strength but also alters the effect of chord loads [3]. For combined brace loading, CIDECT [2] only includes a lower-bound function for the joint resistance interaction with simultaneous axial and bending loading. Hence, for FRP-reinforced joints with complex loading patterns, the current strength equations are inadequate.
Here, three new functions are introduced: the FRP reinforcement (Qr), chord AX (Qc), and brace AX (Qb). These functions and the modified joint strength (Mur) are defined as follows:
Q r = 1 + k 1 L T frp k 2
Q c = 1 n 0 C c
C c = k 3 n 0 k 4 n 0 ,     i f , n 1 < 0 C c = k 5 n 0 exp n 0 k 6 ,     i f ,   0 n 1 0.8
Q b = 1 n 1 C b
C b = k 7 γ k 8 n 1 ,     i f , n 1 < 0 C b = k 9 n 1 k 10 ,     i f ,   0 n 1 0.8
M ur = Q r Q c Q b Q u f y 0 t 0 2 d 0
where L is the FRP layer count, Tfrp is FRP tensile strength, and k1 to k10 are regression coefficients. Equation (14) can be also applied to a merely IPB-loaded T-joint by setting the functions Qc or Qb equal to 1.
The predicted strength equation in CIDECT [2] was based on joints in chord plastic-failure mode, and the regression database of the modified strength formula Equation (14) should be so as well. IBM SPSS Statistics v 27 software [38] was employed for the regression analysis, and data reflecting failure for brace-related reasons was eliminated. The values of k1 to k10 were found to be 0.287, −0.247, −7.592, 7.456, 34.784, 13.931, 0.928, 0.223, 8.393, and 8.086.
FE simulated results (MFE) are compared with calculated results (Mur) of Equation (14) in Figure 18. The proposed strength calculation for groups T1 to T3 was within an error range of [−6%, +9%]. However, because of the serious effects of the brace force on the IPB resistance, a relatively unsatisfactory discreteness of the strength comparison was found for groups T4 to T6, showing an error range of [−19%, +18%]. The root-mean-square error (RMSE) and COV of the fitting precision were acceptable (Figure 18a,b). Therefore, the proposed strength equation can calculate the IPB resistance of FRP-reinforced CHS T-joints impacted by axial loading from the chord or brace.
Equation (14) was applied in the following parameter ranges: 0.446 ≤ β ≤ 0.714, 10.5 ≤ γ ≤ 21, −0.8 ≤ n0 ≤ +0.8, −0.8 ≤ n1 ≤ +0.8, 0 ≤ FRP layer-count ≤ 8.

8. Conclusions

This paper presents an FE analysis of FRP-reinforced T-joints subjected to combined load patterns that include IPB moment with chord and brace axial compression and tension. The effect of different FRP layer counts was also investigated. The FE models were verified against experiments conducted by Hu et al. [30] and Shao et al. [29]. The failure modes, FRP stress distribution with different load patterns, and joint-resistance estimates support the following conclusions:
(1)
There are three main failure modes: chord plastic failure, brace plastic failure, and brace buckling failure. A small γ promotes brace-related joint failure, and the combination of IPB and brace tension can cause plastic failure of the brace. However, a sufficient number of FRP layers can make chord plasticity the main failure mode. The increase in FRP reinforcement could compensate for the thinner brace thickness and yield results equivalent to those obtained with joints with a larger γ.
(2)
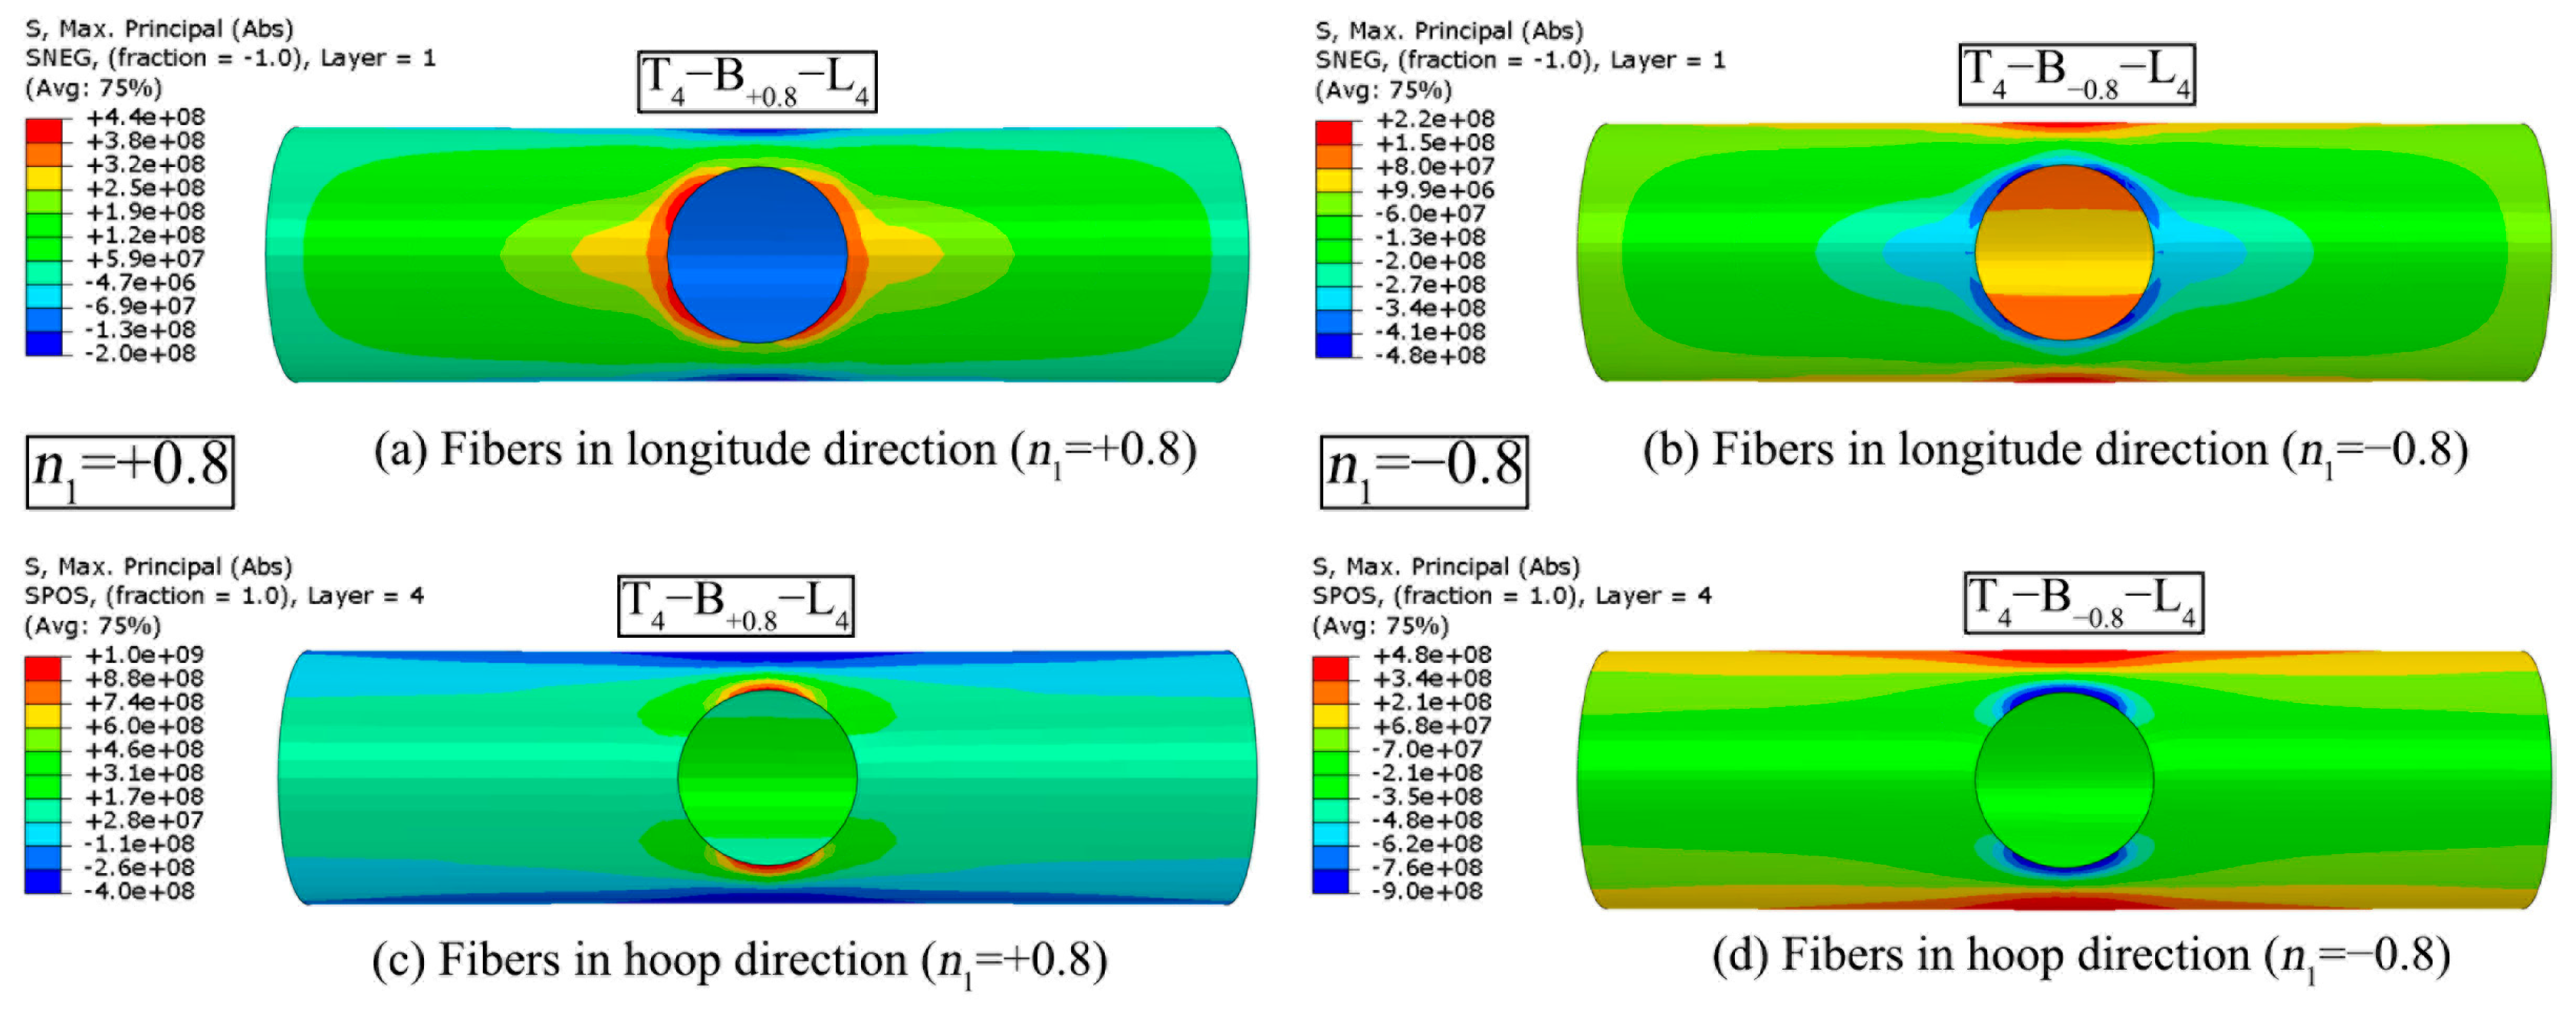
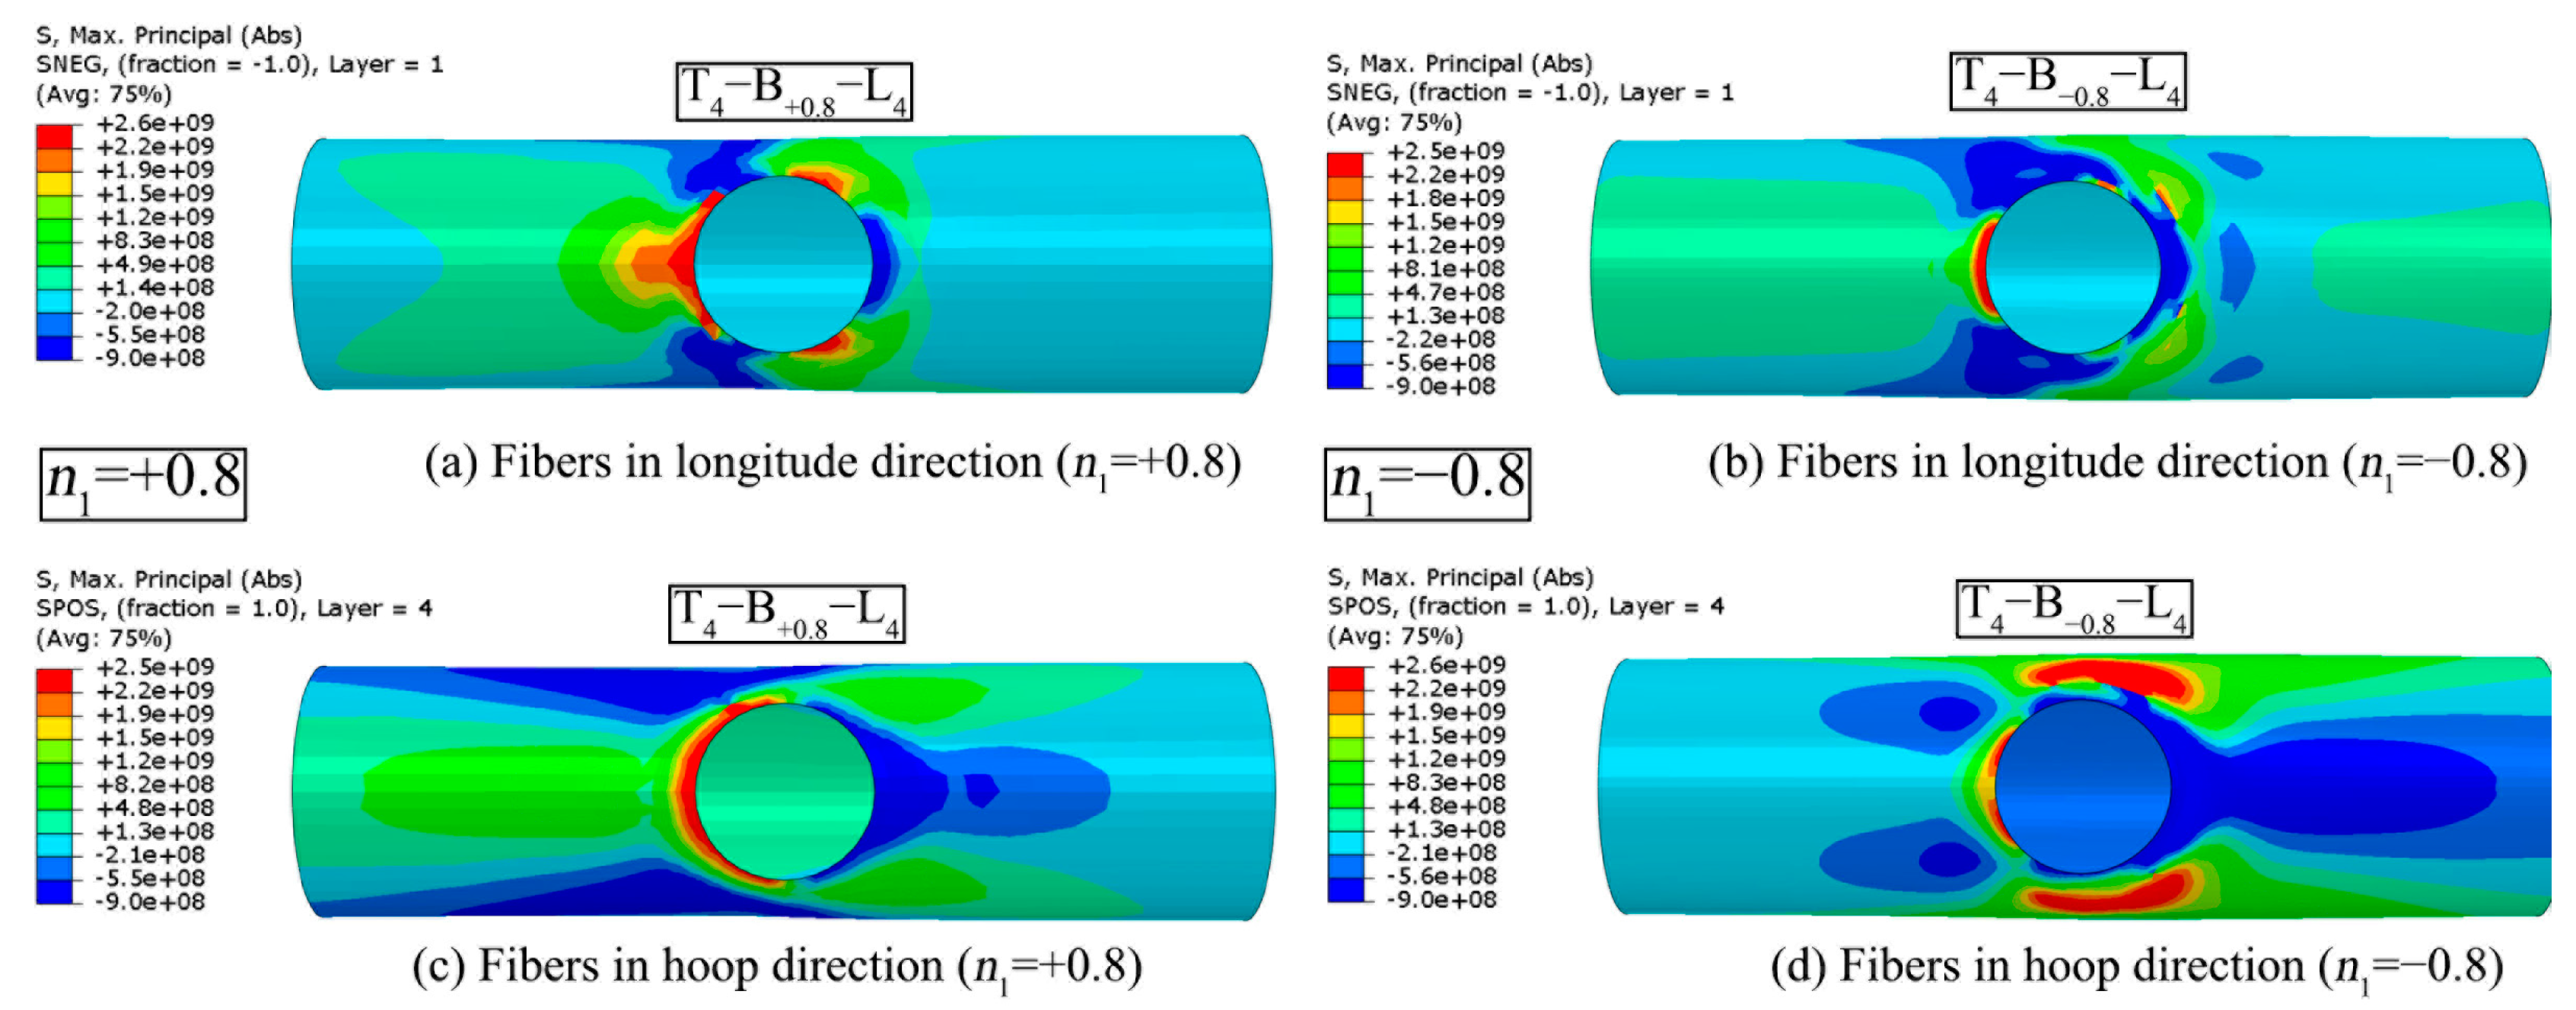
FRP reinforcement restricts the deformation of joints under complex load patterns. Under axial compression of the chord or brace, the fibres in both the longitudinal and hoop directions of the chord will take on more responsibilities for tensile stress in the crown area. Under axial tension of the chord or brace, more fibre tension appears on the chord side wall. The FRP composite serves more efficient stiffeners for the joint subjected to combined IPB moment and brace AX than the combination of IPB and chord AX.
(3)
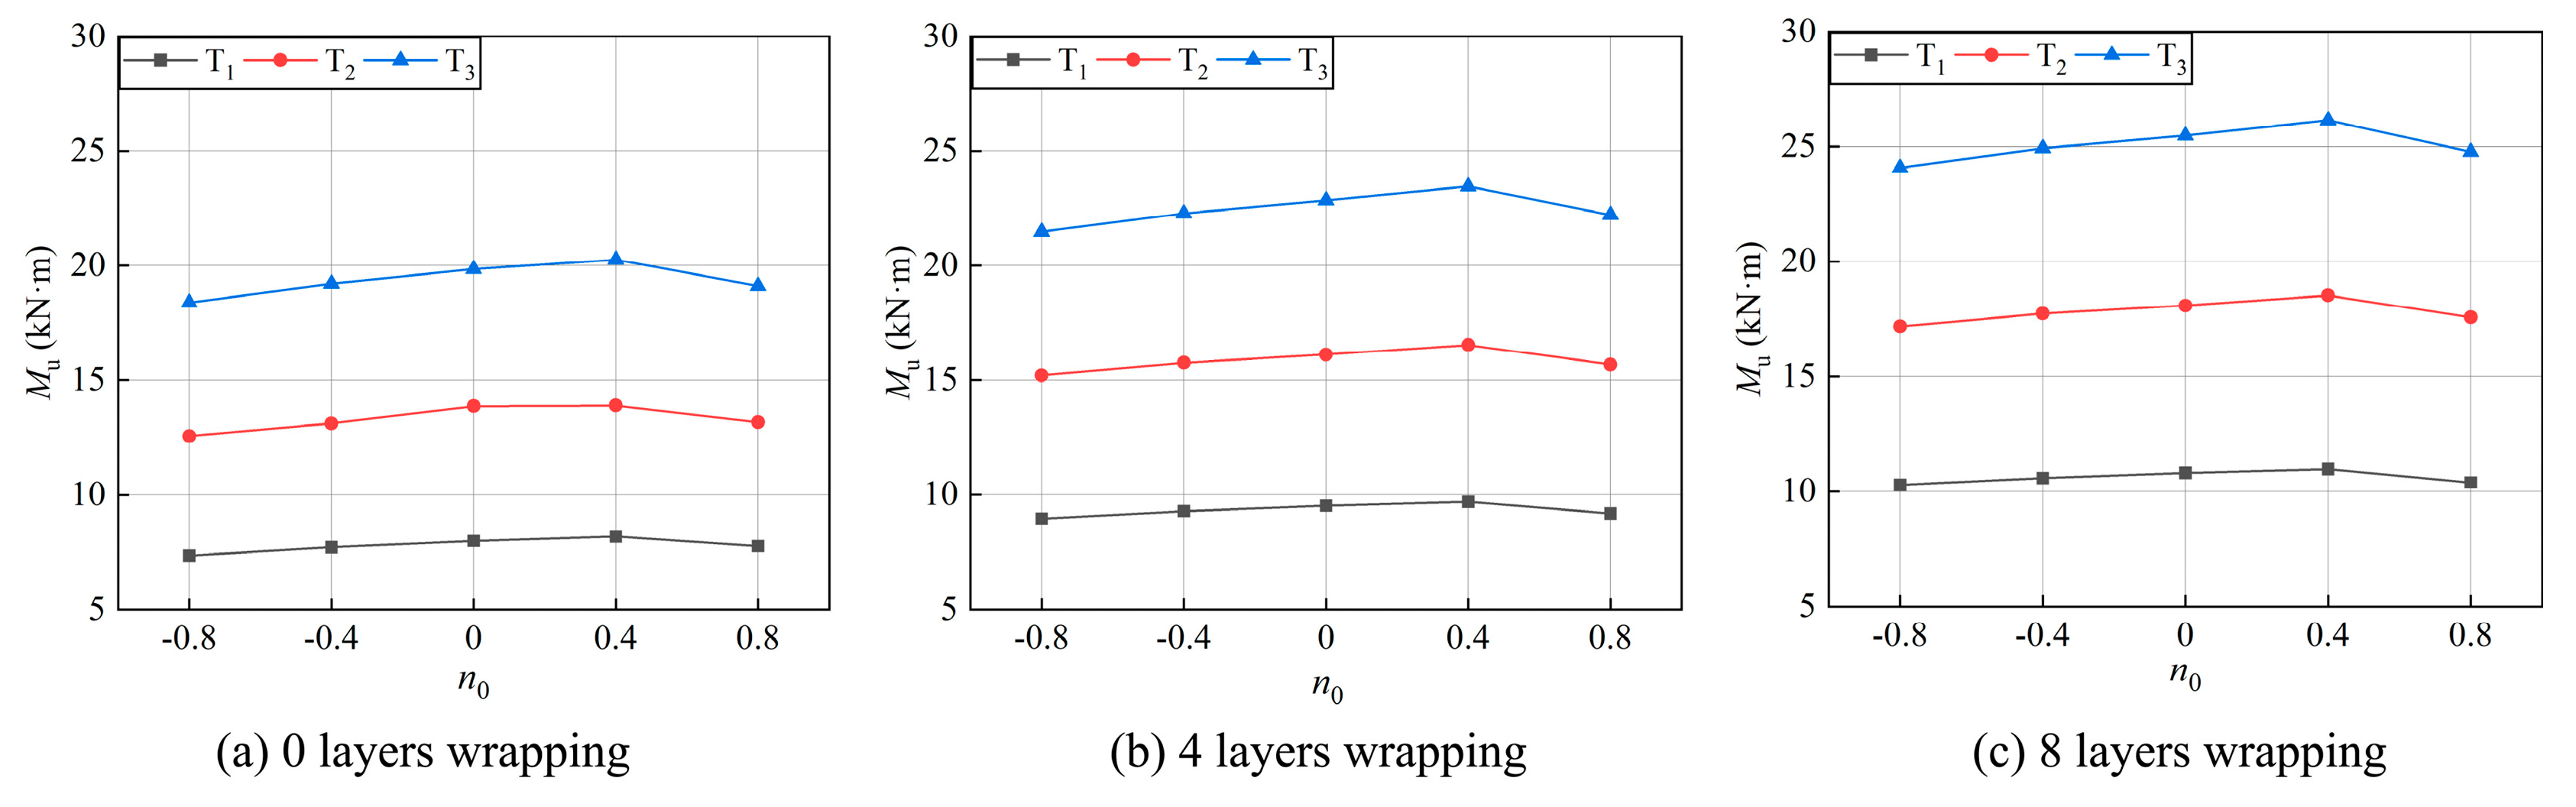
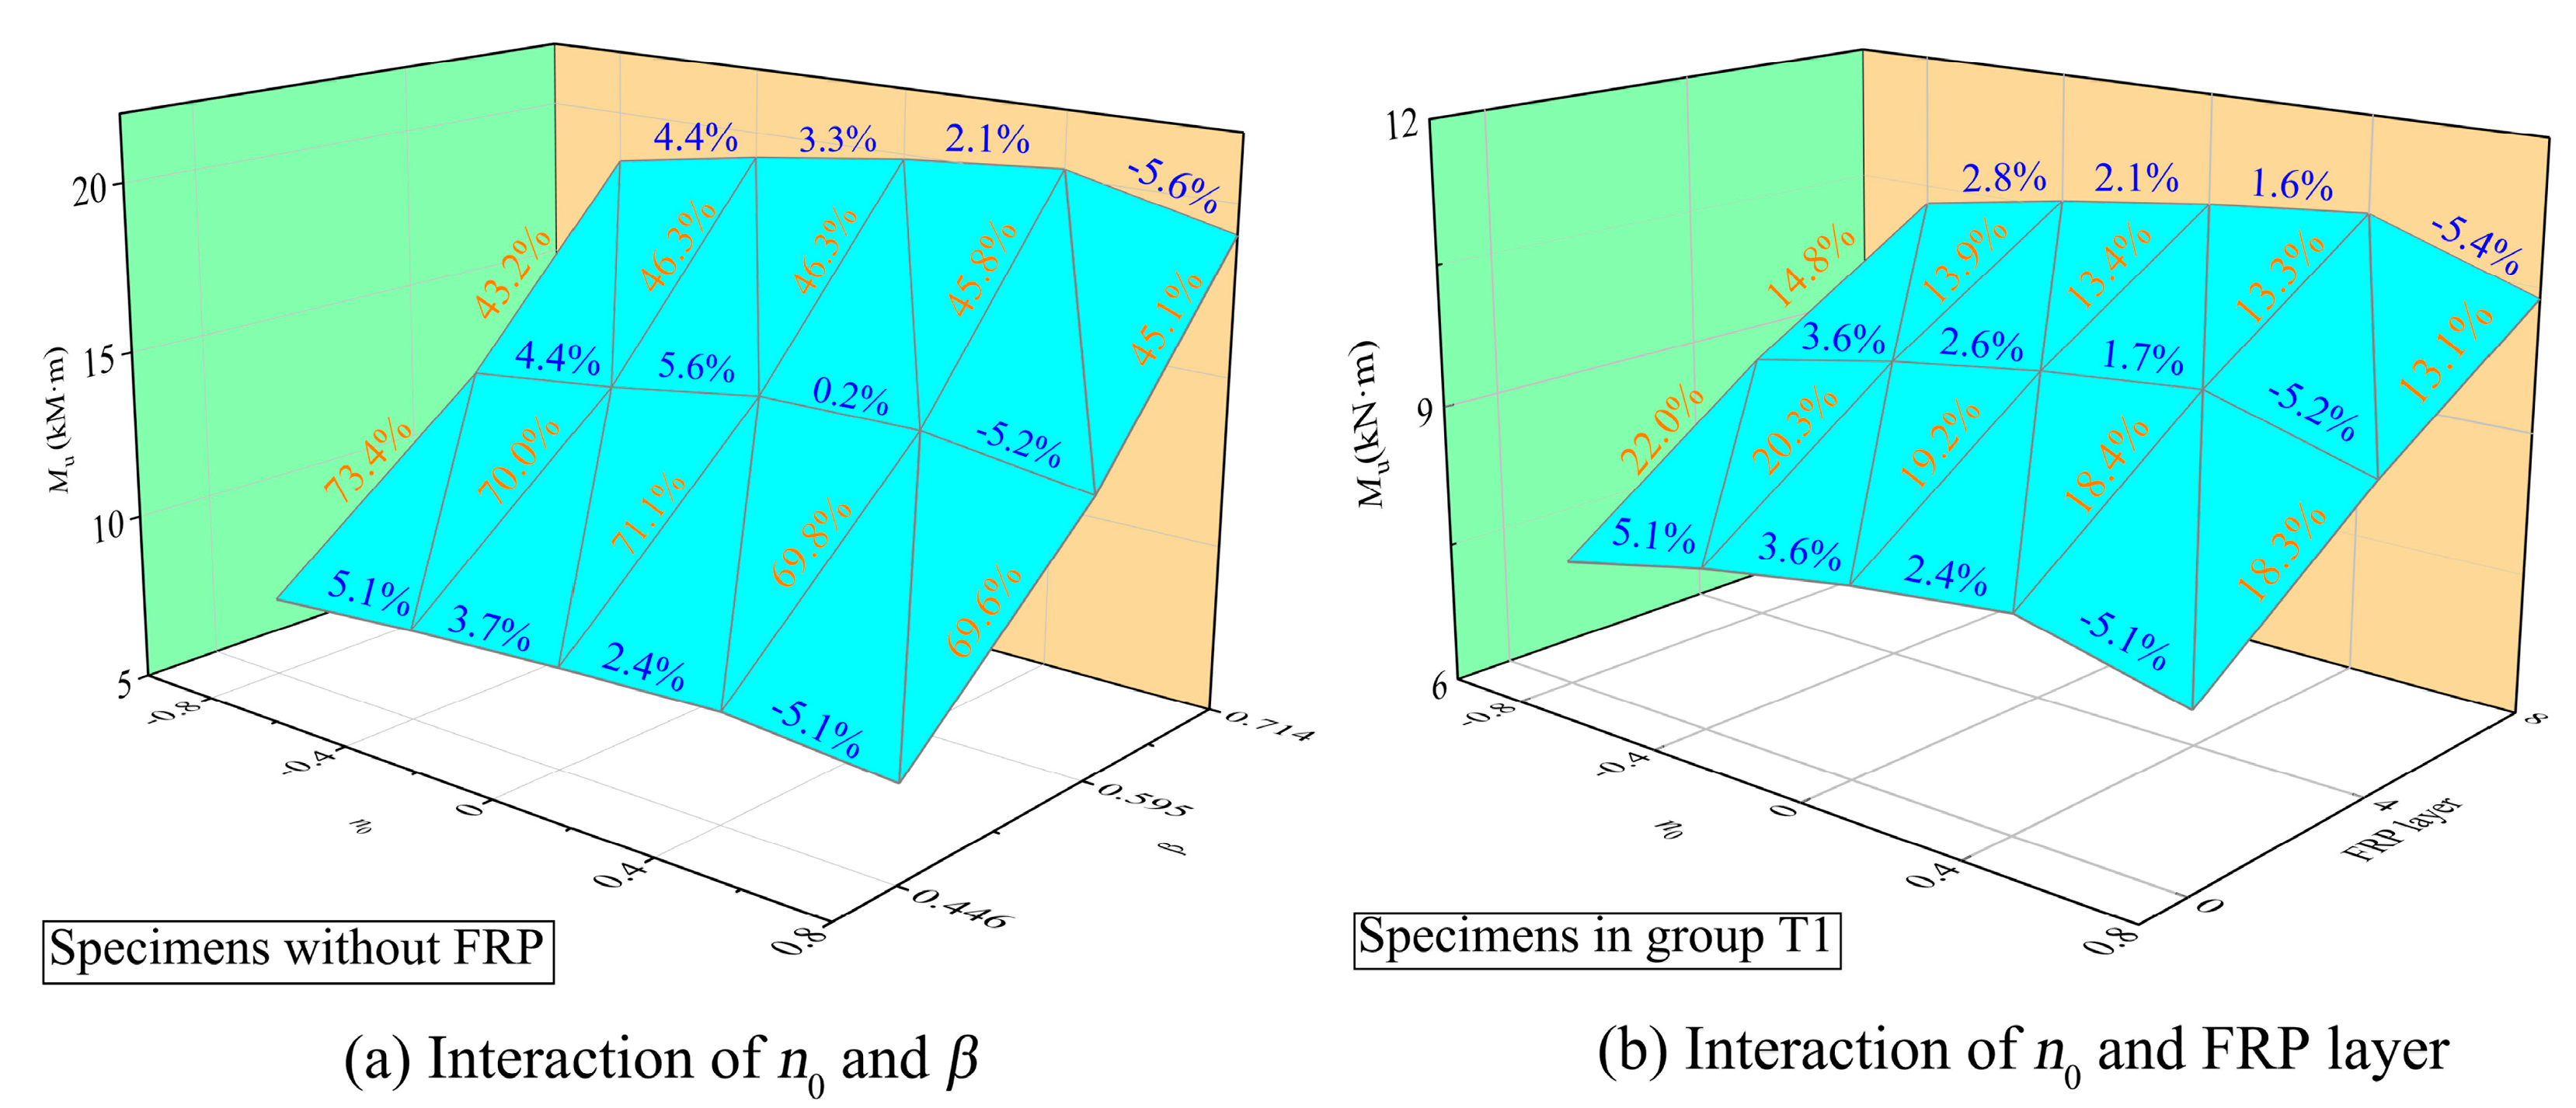
A relatively independent influence of chord AX, β, and FRP layer count is observed on the IPB resistance of the T-joint. Under the IPB moment and brace AX, the FRP composite exhibited a relatively minor reinforcement effect on the T-joint. However, the resistance is sensitive to the proportional brace AX for joints with small γ; adding FRP layers can weaken the influence of the proportional brace AX.
(4)
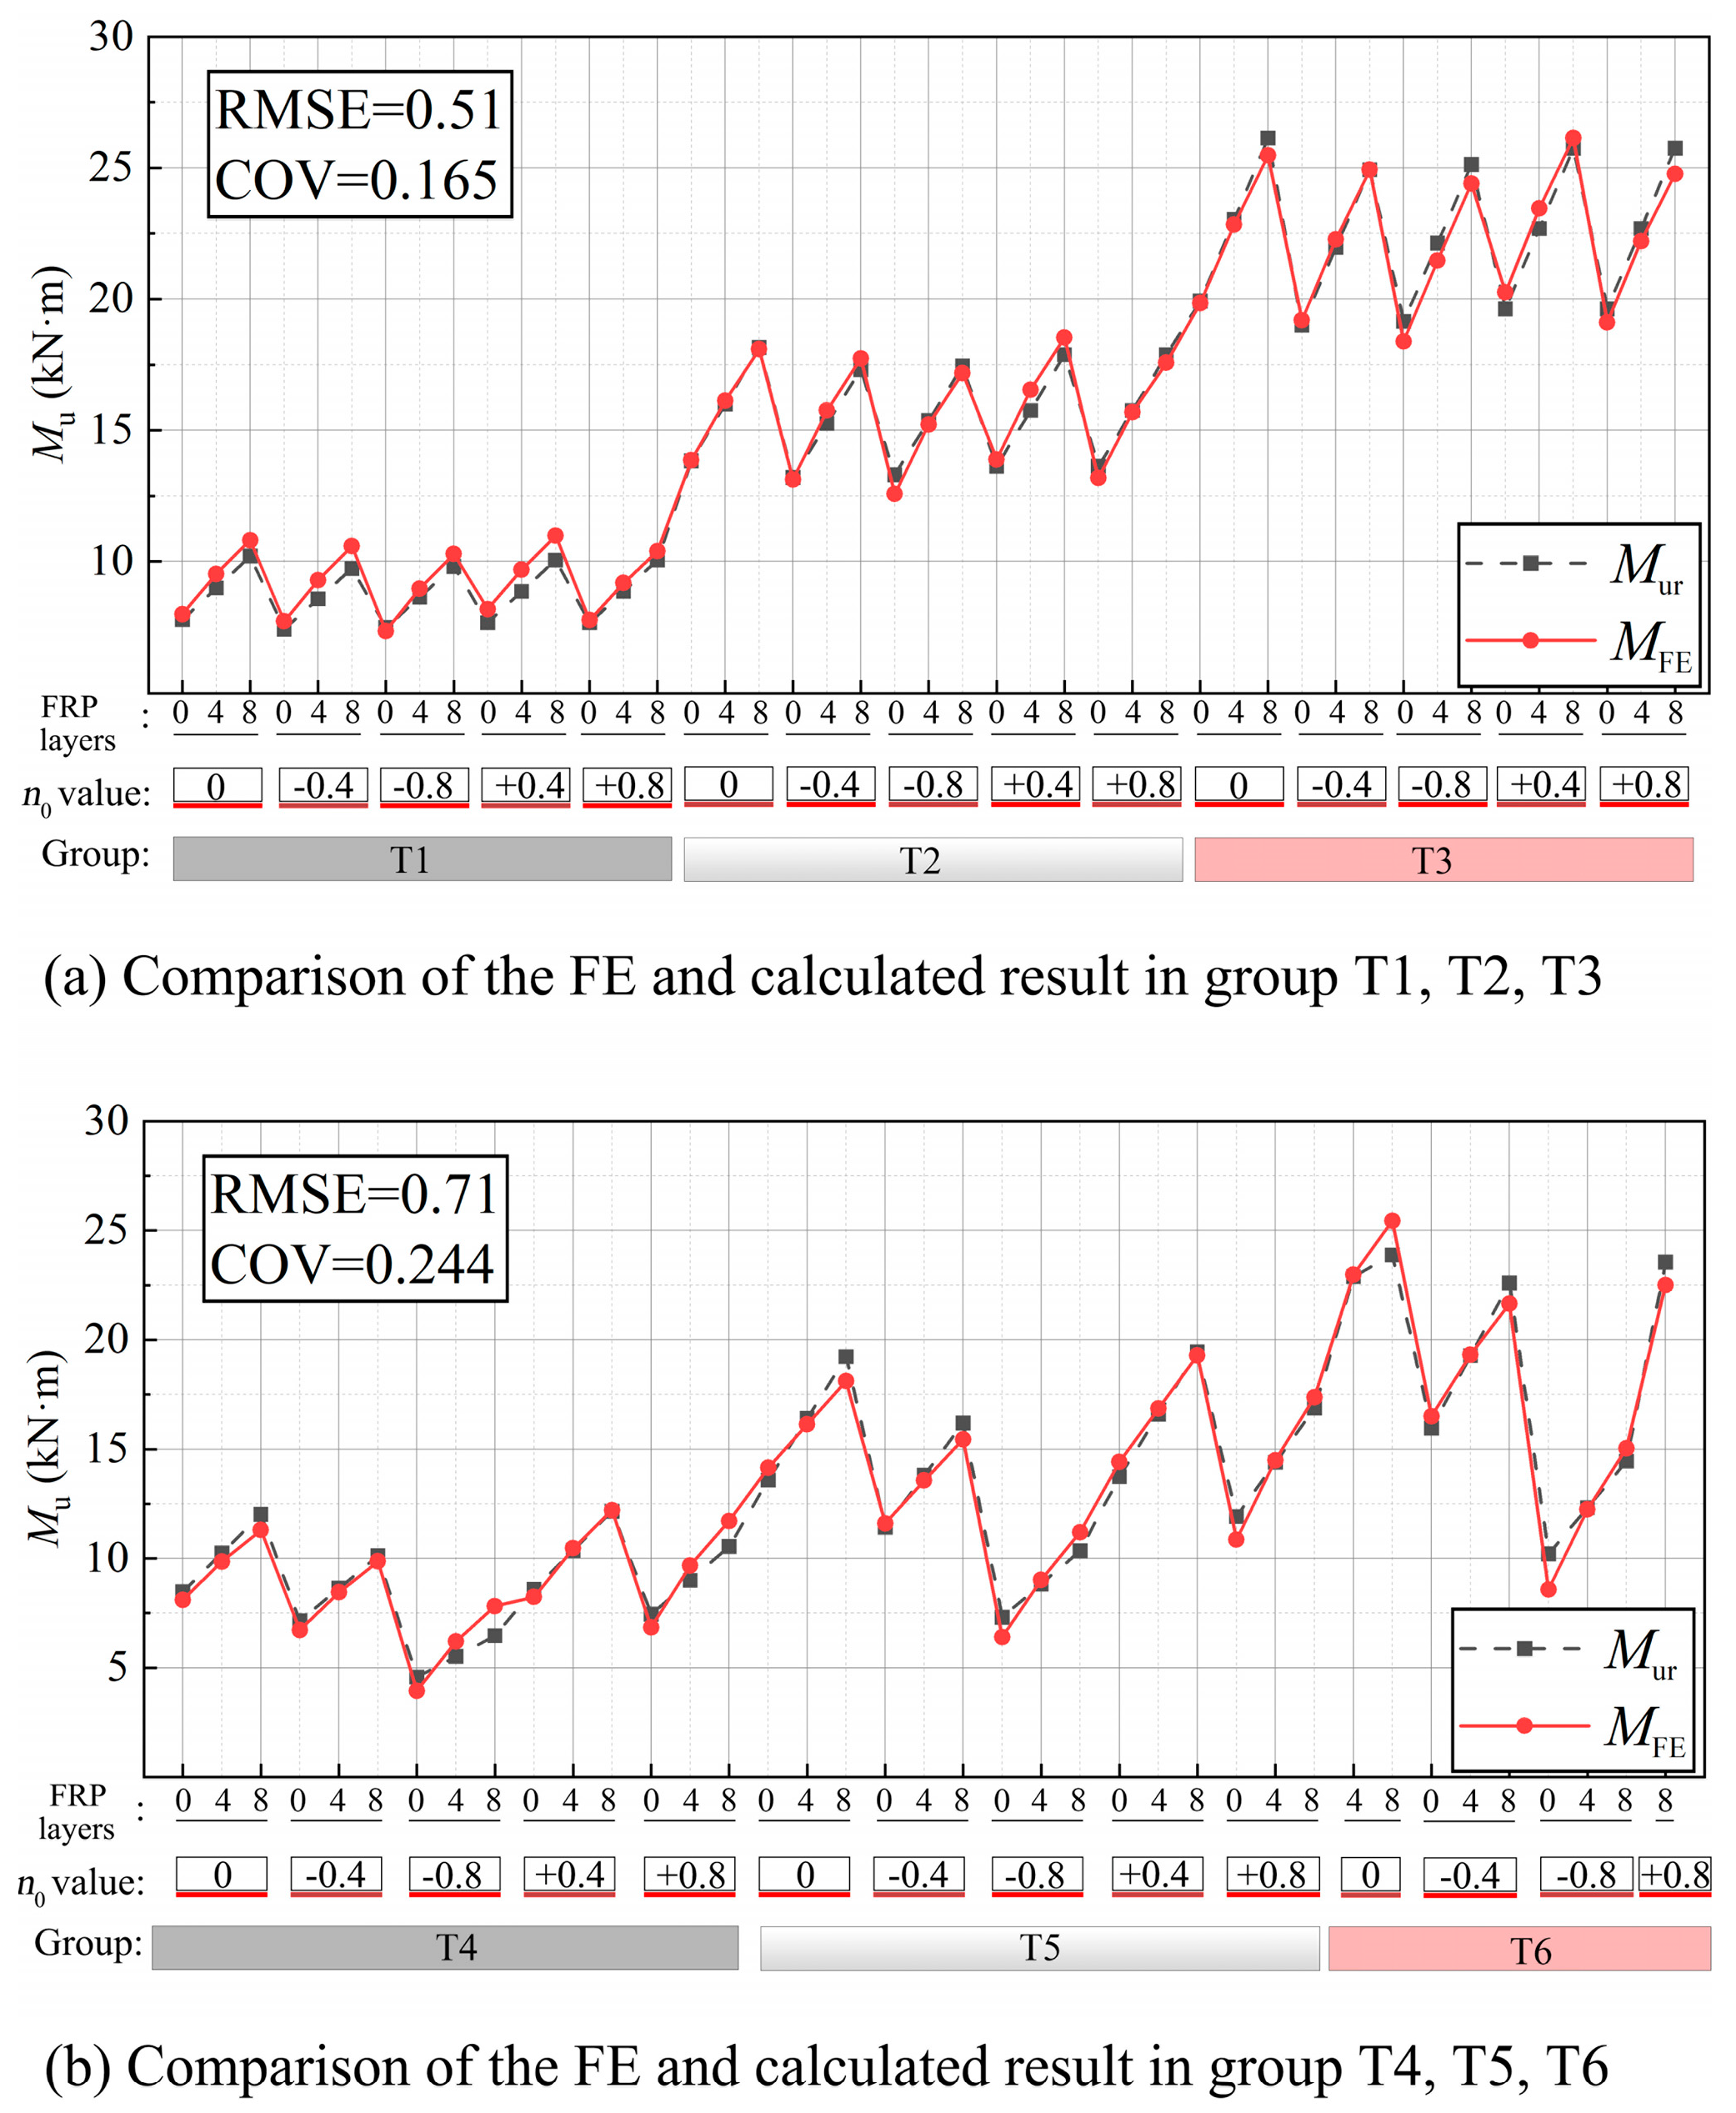
A modified strength equation for IPB resistance is proposed, incorporating the contribution of FRP reinforcement and the impact of brace AX on joint strength. The prototypical function of the chord loads in CIDECT [2] is improved with FRP reinforcement.

Author Contributions

Conceptualization, P.D. and Y.C.; methodology, Z.Z. and Y.L.; software, J.G.; validation, S.Z., Y.L. and J.G.; formal analysis, P.D.; investigation, J.G.; resources, Y.C.; data curation, Y.C.; writing—original draft preparation, J.G.; writing—review and editing, Y.L.; visualization, S.Z.; supervision, P.D.; project administration, P.D. and Z.Z. All authors have read and agreed to the published version of the manuscript.

Funding

This research received no funding.

Data Availability Statement

Data generated or analysed during this study are provided in full within the published article.

Conflicts of Interest

The authors declare no conflicts of interest.

References

  1. Gibstein, M.B. The Static Strength of T-Joints Subjected to In-Plane Bending; Det Norske Veritas Report; DNV: Bærum, Norway, 1976; pp. 76–137. [Google Scholar]
  2. Wardenier, J.; Kurobane, Y.; Packer, J.A.; Van der Vegte, G.J.; Zhao, X.L. Design Guide for Circular Hollow Section (CHS) Joints under Predominantly Static Loading; CIDECT: Geneva, Switzerland, 2008. [Google Scholar]
  3. Chen, Y.; Hu, Z.; Guo, Y.; Wang, J.; Tong, G.; Liu, Q.; Pan, Y. Effects of chord pre-load on strength of CHS X-joints stiffened with external ring stiffeners and gusset plates. Eng. Struct. 2019, 195, 125–143. [Google Scholar] [CrossRef]
  4. Soh, A.K.; Soh, C.K.; Hoon, K. Stress analysis of reinforced tubular joints subjected to different load types. Proc. Inst. Civ. Eng.-Struct. Build. 1994, 104, 257–266. [Google Scholar] [CrossRef]
  5. Deng, P.; Guo, J.; Zhu, Z.; Liu, Y.; Zhu, Q. Finite element analysis of corrosion tubular T-joint repaired with grouted clamp. Adv. Civ. Eng. 2023, 2023, 6634023. [Google Scholar] [CrossRef]
  6. Bharti, K.; Kumaraswamidhas, L.A.; Das, R.R. Detailed investigation of adhesive fillet tubular T-joint of laminated FRP composite tube under axial compressive load. Weld. World 2020, 64, 1279–1292. [Google Scholar] [CrossRef]
  7. Nassiraei, H.; Rezadoost, P. Local joint flexibility of tubular T/Y-joints retrofitted with GFRP under in-plane bending moment. Mar. Struct. 2021, 77, 102936. [Google Scholar] [CrossRef]
  8. Dipen, K.R.; Pratiksha, H.W.; Ashwini, K.; Mavinkere, R.S.; Suchart, S.; Anish, K.; Abdullah, M.A.; Naresh, K.; Velmurugan, R.; Gupta, N.K. Impact of fiber reinforced polymer composites on structural joints of tubular sections: A review. Thin Wall. Struct. 2022, 180, 109967. [Google Scholar] [CrossRef]
  9. Lesani, M.; Bahaari, M.R.; Shokrieh, M.M. Numerical investigation of FRP-strengthened tubular T-joints under axial compressive loads. Compos. Struct. 2013, 100, 71–78. [Google Scholar] [CrossRef]
  10. Lesani, M.; Bahaari, M.R.; Shokrieh, M.M. Experimental investigation of FRP-strengthened tubular T-joints under axial compressive loads. Constr. Build. Mater. 2014, 53, 243–252. [Google Scholar] [CrossRef]
  11. Deng, P.; Yang, B.; Chen, X.; Liu, Y. Experimental and numerical investigations of the compressive behavior of carbon fiber-reinforced polymer-strengthened tubular steel T-joints. Front. Struct. Civ. Eng. 2020, 14, 1215–1231. [Google Scholar] [CrossRef]
  12. Nassiraei, H.; Rezadoost, P. Probabilistic analysis of the SCFs in tubular T/Y-joints reinforced with FRP under axial, in-plane bending, and out-of-plane bending loads. Structures 2022, 35, 1078–1097. [Google Scholar] [CrossRef]
  13. Hosseini, A.S.; Bahaari, M.R.; Lesani, M. Stress concentration factors in FRP-strengthened offshore steel tubular T-joints under various brace loadings. Structures 2019, 20, 779–793. [Google Scholar] [CrossRef]
  14. Fu, Y.; Tong, L.; He, L.; Zhao, X.L. Experimental and numerical investigation on behavior of CFRP-strengthened circular hollow section gap K-joints. Thin Wall. Struct. 2016, 102, 80–97. [Google Scholar] [CrossRef]
  15. Zavvar, E.; Hosseini, A.S.; Lotfollahi-Yaghin, M.A. Stress concentration factors in steel tubular KT-connections with FRP-Wrapping under bending moments. Structures 2021, 33, 4743–4765. [Google Scholar] [CrossRef]
  16. Feng, R.; Xu, J.; Chen, Z.; Roy, K.; Chen, B.; Lim, J.B. Numerical investigation and design rules for stress concentration factors of stainless-steel hybrid tubular joints. Thin Wall. Struct. 2021, 163, 107783. [Google Scholar] [CrossRef]
  17. Boone, T.J.; Yura, J.A.; Hoadley, P.W. Ultimate strength of tubular joints: Chord stress effects. In Proceedings of the Offshore Technology Conference, Houston, TX, USA, 7–9 May 1984. [Google Scholar] [CrossRef]
  18. Cao, J.J.; Packer, J.A.; Yang, G.J. Yield line analysis of RHS connections with axial loads. J. Constr. Steel Res. 1998, 48, 1–25. [Google Scholar] [CrossRef]
  19. Kang, C.T.; Moffat, D.G.; Mistry, J. Strength of DT tubular joints with brace and chord compression. J. Struct. Eng. 1998, 124, 775–783. [Google Scholar] [CrossRef]
  20. Al-Saadi, A.U.; Aravinthan, T.; Lokuge, W. Structural applications of fibre reinforced polymer (FRP) composite tubes: A review of columns members. Compos. Struct. 2018, 204, 513–524. [Google Scholar] [CrossRef]
  21. Fernando, D.; Yu, T.; Teng, J.G.; Zhao, X.L. CFRP strengthening of rectangular steel tubes subjected to end bearing loads: Effect of adhesive properties and finite element modelling. Thin Wall. Struct. 2009, 47, 1020–1028. [Google Scholar] [CrossRef]
  22. Teng, J.G.; Yu, T.; Fernando, D. Strengthening of steel structures with fibre-reinforced polymer composites. J. Constr. Steel Res. 2012, 78, 131–143. [Google Scholar] [CrossRef]
  23. Wei, C.; Shao, Y.; Hassanein, M.F.; Xiong, C.; Zhu, H. Static strengths of preloaded circular hollow section stub columns strengthened with carbon fibre reinforced polymer. Steel Compos. Struct. 2023, 47, 455–466. [Google Scholar] [CrossRef]
  24. Jiao, H.; Zhao, X.L. CFRP strengthened butt-welded very high strength (VHS) circular steel tubes. Thin Wall. Struct. 2004, 42, 963–978. [Google Scholar] [CrossRef]
  25. Cadei, J.C.; Stratford, T.J.; Duckett, W.G.; Hollaway, L.C. Strengthening Metallic Structures Using Externally Bonded Fibre-Reinforced Polymers; CIRIA: London, UK, 2004. [Google Scholar]
  26. Moy, S.S. FRP Composites: Life Extension and Strengthening of Metallic Structures; Thomas Telford: London, UK, 2001. [Google Scholar]
  27. Deng, P.; Zhao, S.; Zhu, Z.; Liu, Y.; Liu, X. Study on dynamic behavior of tubular T-joints subjected to out-of-plane impact loading. J. Constr. Steel Res. 2022, 198, 107556. [Google Scholar] [CrossRef]
  28. Deng, P.; Chen, X.; Yang, B.; Guo, J.; Liu, Y. Finite element analysis on the residual bearing capacity of axially preloaded tubular T-joints subjected to impacts. Structures 2021, 31, 286–304. [Google Scholar] [CrossRef]
  29. Shao, Y.B.; Chen, Z.M.; Zhou, Z. Experimental on static bearing capacity of corroded T-joints strengthened with CFRP. J. Civ. Eng. Manag. 2020, 37, 15–19. [Google Scholar]
  30. Hu, Y.F.; Chung, K.F.; Ban, H.; Nethercot, D.A. Structural testing and numerical modelling of T-joints between cold-formed S690 circular hollow sections under brace in-plane bending. Eng. Struct. 2022, 250, 113317. [Google Scholar] [CrossRef]
  31. Dassault Systèmes Simulia Corp. Abaqus 6.11 Analysis User’s Manual; Dassault: Paris, France, 2011. [Google Scholar]
  32. Pandey, M.; Chung, K.F.; Young, B. Design of cold-formed high strength steel tubular T-joints under compression loads. Thin Wall. Struct. 2021, 164, 107573. [Google Scholar] [CrossRef]
  33. Hashin, Z. Fatigue failure criteria for unidirectional fibre composites. J. Appl. Mech. 1980, 47, 329–334. [Google Scholar] [CrossRef]
  34. GB/T 50017-2017; Standard for Design of Steel Structures. China Architecture & Building Press: Beijing, China, 2017. (In Chinese)
  35. Lu, L.H.; Wardenier, J. Ultimate deformation criteria for uniplanar connections between I-beams and RHS columns under in-plane bending. In Proceedings of the International Ocean and Polar Engineering Conference, Osaka, Japan, 10 April 1994. [Google Scholar]
  36. Hoadley, P.W. Ultimate Strength of Tubular Joints Subjected to Combined Loads. Ph.D. Thesis, University of Texas, Austin, TX, USA, 1984. [Google Scholar]
  37. Nassiraei, H.; Rezadoost, P. SCFs in tubular X-connections retrofitted with FRP under in-plane bending load. Compos. Struct. 2021, 274, 114314. [Google Scholar] [CrossRef]
  38. Arbuckle, J.L. IBM SPSS Amos 20 User’s Guide; Amos Development Corporation & SPSS Inc.: Whitingham, VT, USA, 2011; pp. 226–229. [Google Scholar]
Figure 1. Geometry details of the verified models [29,30].
Buildings 14 00412 g001
Figure 2. Arrangement of the fibre-reinforced polymer (FRP) composite [29].
Buildings 14 00412 g002
Figure 3. Mesh and boundary conditions of the verified models.
Buildings 14 00412 g003
Figure 4. Comparison of the joint failure details (unit: Pa) [29,30].
Buildings 14 00412 g004
Figure 5. Comparison of the load-displacement curves [29,30].
Buildings 14 00412 g005
Figure 6. Boundary conditions and deformation monitoring position of numerical models.
Buildings 14 00412 g006
Figure 7. Distribution of failure modes among all numerical models.
Buildings 14 00412 g007
Figure 8. Typical failure phenomenon (stress unit: Pa).
Buildings 14 00412 g008
Figure 9. The principal stress contour of FRP composite subjected to IPB (unit: Pa).
Buildings 14 00412 g009
Figure 10. The principal stress contour of fibre-reinforced polymer (FRP) composite subjected to chord AX (unit: Pa).
Buildings 14 00412 g010
Figure 11. The principal stress contour of fibre-reinforced polymer (FRP) composite subjected to chord AX and IPB (unit: Pa).
Buildings 14 00412 g011
Figure 12. The principal stress contour of fibre-reinforced polymer (FRP) composite subjected to brace AX (unit: Pa).
Buildings 14 00412 g012
Figure 13. The principal stress contour of fibre-reinforced polymer (FRP) composite subjected to brace AX and IPB (unit: Pa).
Buildings 14 00412 g013
Figure 14. Influence of the n0 on the ultimate moment.
Buildings 14 00412 g014
Figure 15. Interaction of n0, β and FRP layer-count on the ultimate moment.
Buildings 14 00412 g015
Figure 16. Influence of the n1 on the ultimate moment.
Buildings 14 00412 g016
Figure 17. Interaction of n1, β, and FRP layer-count on the ultimate moment.
Buildings 14 00412 g017
Figure 18. Comparison of simulated and calculated joint strength.
Buildings 14 00412 g018
Table 1. Measured geometry of the verified models [29,30].
ModelChord/mmBrace/mm
d0t0l0d1t1l1
T-1/T-1-C16851960954536
M-T22501011991506600
Table 2. Material property of the verified models [29,30].
ModelMemberYoung’ Modulus
E/GPa
Yield Strength
fy/MPa
Tensile Strength
fu/MPa
T-1/T-1-CChord202386523
Brace204349521
M-T2Chord201766828
Brace202757811
Table 3. Variations and arrangements of the investigated parameter models.
GroupSpecimenChord/mmBrace/mmβγAxial Load ProportionFRP Layers
T-Cn0/Bn1-Llayerd0t0l0d1t1l1Chord (n0)Brace (n1)
T1T1-C0/+0.4/+0.8/−0.4/−0.8-L0/4/8168615007554100.446140/+0.4/+0.8/−0.4/−0.800/4/8
T2T2-C0/+0.4/+0.8/−0.4/−0.8-L0/4/81686150010054160.595140/+0.4/+0.8/−0.4/−0.800/4/8
T3T3-C0/+0.4/+0.8/−0.4/−0.8-L0/4/81686150012054160.714140/+0.4/+0.8/−0.4/−0.800/4/8
T4T4-B0/+0.4/+0.8/−0.4/−0.8-L0/4/81684150010054160.5952100/+0.4/+0.8/−0.4/−0.80/4/8
T5T5-B0/+0.4/+0.8/−0.4/−0.8-L0/4/81686150010054160.5951400/+0.4/+0.8/−0.4/−0.80/4/8
T6T6-B0/+0.4/+0.8/−0.4/−0.8-L0/4/81688150010054160.59510.500/+0.4/+0.8/−0.4/−0.80/4/8
Note: The specimen name was separated by “-” in three parts, representing three different properties of specimen: the belonged group of joint geometry (T); the type and proportion of AX (C or B); the FRP composite (L). The C denotes the chord AX; the B denotes brace AX; the L denotes the FRP wrapping layers to both the chord or brace. The included variables in each group were separated by the “/” in subscripts; the number of subscripts denotes the specific parameter of specimen.
Disclaimer/Publisher’s Note: The statements, opinions and data contained in all publications are solely those of the individual author(s) and contributor(s) and not of MDPI and/or the editor(s). MDPI and/or the editor(s) disclaim responsibility for any injury to people or property resulting from any ideas, methods, instructions or products referred to in the content.

