Article

When Trees Are Not an Option: Perennial Vines as a Complementary Strategy for Mitigating the Summer Warming of an Urban Microclimate

by
Andrew A. Millward
1,* and
Michelle Blake
1,2
1
Urban Forest Research & Ecological Disturbance (UFRED) Group, Department of Geography & Environmental Studies, Toronto Metropolitan University, Toronto, ON M5B 2K3, Canada
2
Environmental Applied Science & Management, Toronto Metropolitan University, Toronto, ON M5B 2K3, Canada
*
Author to whom correspondence should be addressed.
Buildings 2024, 14(2), 416; https://doi.org/10.3390/buildings14020416
Submission received: 23 November 2023 / Revised: 14 January 2024 / Accepted: 29 January 2024 / Published: 3 February 2024

Abstract

:
This study evaluates the potential of Boston Ivy (Parthenocissus tricuspidata) to reduce building surface temperature in a mid-latitude North American city center where vine use for this purpose is uncommon. Vegetation can regulate city summer temperatures by providing shade and evaporative cooling. While planting trees has been a focus for many urban municipalities, trees require space (above and below ground), access to water, costly planting and maintenance, and may only be desirable to some city residents. To explore viable vegetation alternatives with fewer growth constraints, we deployed temperature loggers on the exterior walls of buildings in the urban core of Toronto, Canada, a large mid-latitude city. Perennial vines shaded some walls, while others were bare. These devices systematically tracked exterior surface temperature fluctuations over six months, including the growing season, with full vine-leaf coverage. During peak solar access periods, average daily temperature differentials between vine-shaded and non-shaded building surfaces ranged from up to 6.5 °C on south-facing building exteriors to 7.0 °C on west-facing walls. Models were developed to estimate daily degree hour difference, a metric integrating the magnitude and duration of the temperature-moderating potential of vines. At ambient temperatures ≥ 23 °C, solar radiation intensity and ambient air temperature were positively correlated with vine effectiveness in mitigating the rise in built surface temperature; relative humidity was negatively associated. Installing vine cover on urban buildings in the form of green façades can complement tree planting as cities become hotter due to climate change, and space for growing trees diminishes with urban densification. Future research into the capacity of green façades to regulate outdoor temperature must establish uniform measurement protocols and undertake evaluations in diverse climatic scenarios.

1. Introduction

As cities expand, they often replace natural vegetation with paved surfaces [1]. Vegetation releases moisture into the air via evapotranspiration, shades built surfaces, and reflects incoming solar radiation, thus moderating temperature [2]. In contrast, asphalt and other built surfaces absorb solar radiation, store it, and reemit it as heat [3]. The combination of solar gain received by pavements and buildings and the loss of the natural cooling effect of treed land cover gives rise to higher air temperatures relative to surrounding rural regions, a phenomenon known as the urban heat island (UHI) effect [4]. As urbanization intensifies worldwide, the detrimental impacts of UHIs are accentuated, particularly with climate change contributing to escalating summer temperatures [5,6]. The imperative for solutions to mitigate urban microclimatic warming has revitalized interest in the thermal-moderating properties of vegetation [7,8].
Heat islands can occur at the micro-scale of a single city building or at the extent of an entire city [2,9]. During the summer, the average urban center can produce a warming effect (increase in ambient air temperature) of roughly 2.5 °C on a cloudless afternoon [10]. The UHI effect has significant implications for the sustainability of cities, causing substantial ecological, social and economic disruption [11,12]. Changing urban microclimates can negatively impact the activities of animals and plants, which can, in turn, affect the overall vitality of the landscape [13]. For every 1 °C increase in ambient temperatures above 18 °C, a 3 to 4% increase in air conditioning demand from city residents can be expected [11]. This demand (and need) for indoor cooling results in an increased financial burden and greater pollution from fossil fuel use to generate the electricity necessary to run air conditioners [6,14]. Heat-related deaths are more common in urban regions, where high ambient temperatures can cause heatstroke, fainting, heat exhaustion and heat cramps [15,16,17]. The frequency and severity of extreme heat and its associated adverse effects will intensify with climate change [12].
In search of location-specific and diverse strategies to mitigate UHIs, many municipal planning and policy approaches now require urban green infrastructure (UGI) [8,14,18]. Trees are a foundational form of UGI, offering various environmental benefits, including stormwater mitigation, soil stabilization, carbon sequestration and storage, wildlife habitat, and urban temperature moderation [19,20]. Yet, planting and growing trees face significant obstacles in urban settings. These include limited space due to dense infrastructure, underground utilities that restrict root development, poor soil conditions, and the heightened need for water and maintenance [20,21]. Additionally, urban pollution, climate extremes, neighborhood gentrification, and the potential for vandalism pose further challenges [22,23,24]. The careful selection of tree species to support biodiversity and overcome economic and policy constraints is also necessary, requiring significant public support and urban planning that prioritizes green space [20].
To limit the rise in urban summer temperatures, especially in space-constrained locations, there is a need to evaluate the potential of alternate forms of vegetation that can perform similar shading and evapotranspiration functions to trees. Green walls offer a compelling alternative where traditional tree planting may be impractical or unwanted. Vegetated vertical walls fall into two categories: green façades and living walls [25]. Green façades employ vining vegetation like ivy that climbs the outer surfaces of structures, either attaching directly to the façade or using an ancillary framework, with their roots anchored in the earth or within purposefully placed containers [26]. In contrast, living walls feature various plants distributed over the entire expanse of the wall, setting them apart from the terrestrial anchoring characteristic of green façades. With their space-efficient nature, vines require minimal ground area. They can be cultivated in constrained soil volumes, utilizing vertical spaces on existing structures, thus circumventing the need for expansive soil beds and avoiding underground utilities [27]
Many vine species exhibit a high tolerance for urban pollution and poor soil conditions and demand less water—qualities that make them particularly suitable for urban environments [28]. Their maintenance is often more straightforward and less costly than that of trees, and their rapid growth provides quick canopy cover, delivering faster shading and cooling effects. Vines can also enhance urban aesthetics, contribute to building insulation, and support biodiversity by attracting pollinators [29]. Moreover, vines often face fewer regulatory hurdles and may garner more public favor as they avoid common tree-related concerns like obstructed views or sidewalk damage. However, the potential for invasive growth and the need for structural support are essential considerations in the deployment of vines [28].
By diminishing surface temperatures on buildings, especially on south- and west-facing ones, green façades present a pragmatic tactic for decreasing reliance on air conditioning, curtailing energy use and its attendant costs. The burgeoning demand for cooling energy in major North American cities like Toronto poses a formidable challenge to electrical grids during summer peaks [19,30]. High air conditioning usage during elevated temperatures has been identified as a contributor to significant power disruptions, exemplified by the widespread blackout experienced across eastern North America in August 2003. On a global scale, air conditioners and electric fans account for a considerable segment of building-related electricity consumption [31]. The ecological contributions of green façades extend beyond UHI mitigation; they also augment biodiversity by providing habitats for small animals, including birds and insects [32]. This habitat is particularly vital in urban landscapes where concrete and asphalt predominate, leading to substantial reductions in urban biodiversity. Additionally, green façades aid in air purification, as vine leaves intercept particulate matter and other urban pollutants [11].
The past decade has seen a growth in the number of studies looking at the effectiveness of green façades as a form of UGI [33,34,35]. There is a long history of growing vines on buildings to moderate indoor and proximate outdoor (microclimate) temperatures. Where research has been conducted to measure this benefit, findings indicate that green façades improve the thermal microclimate in urban areas [36]. A 3.3 °C reduction in ambient outdoor temperature has been measured in the presence of a vegetated system on building walls [37]. Other studies have reported wide variations in wall-surface temperatures behind vegetation, many in the 8 to 12 °C range cooler than full sun, and one as much as 20.3 °C lower than non-shaded surfaces [38,39,40]. Models have been developed to assess the thermal impacts of plant-covered walls on indoor air temperature [41], and to simulate the effective shading performance of climbing plants [42]. Further advances have been made toward evaluating the thermal performance of a building wall microclimate given varying plant characteristics and environmental input parameters [43]. Most of these studies have occurred in Europe and Asia, with limited research in North America [27,44]. The requirement to address UHI concerns with a broad spectrum of approaches, including UGI, necessitates a more detailed understanding of green façades, notably in North America, where urban design, climatic conditions, and societal preferences may differ from other parts of the world.
The overall objective of this study was to investigate the impact of Boston Ivy (Parthenocissus tricuspidata) green façades on building surface temperatures in downtown Toronto, Canada. Temperature variations were analyzed on south- and west-facing walls, comparing vine-shaded and non-shaded areas to assess the vines’ influence on mitigating the rise in buildings’ wall temperatures. Additionally, descriptive models were developed to determine the vines’ effectiveness in moderating built surface temperature increases under specific meteorological conditions. The study provides baseline information that can inform decision makers on the potential role of perennial vine façades in improving outdoor human thermal comfort in mid-latitude North American cities during peak solar exposure and high temperatures.

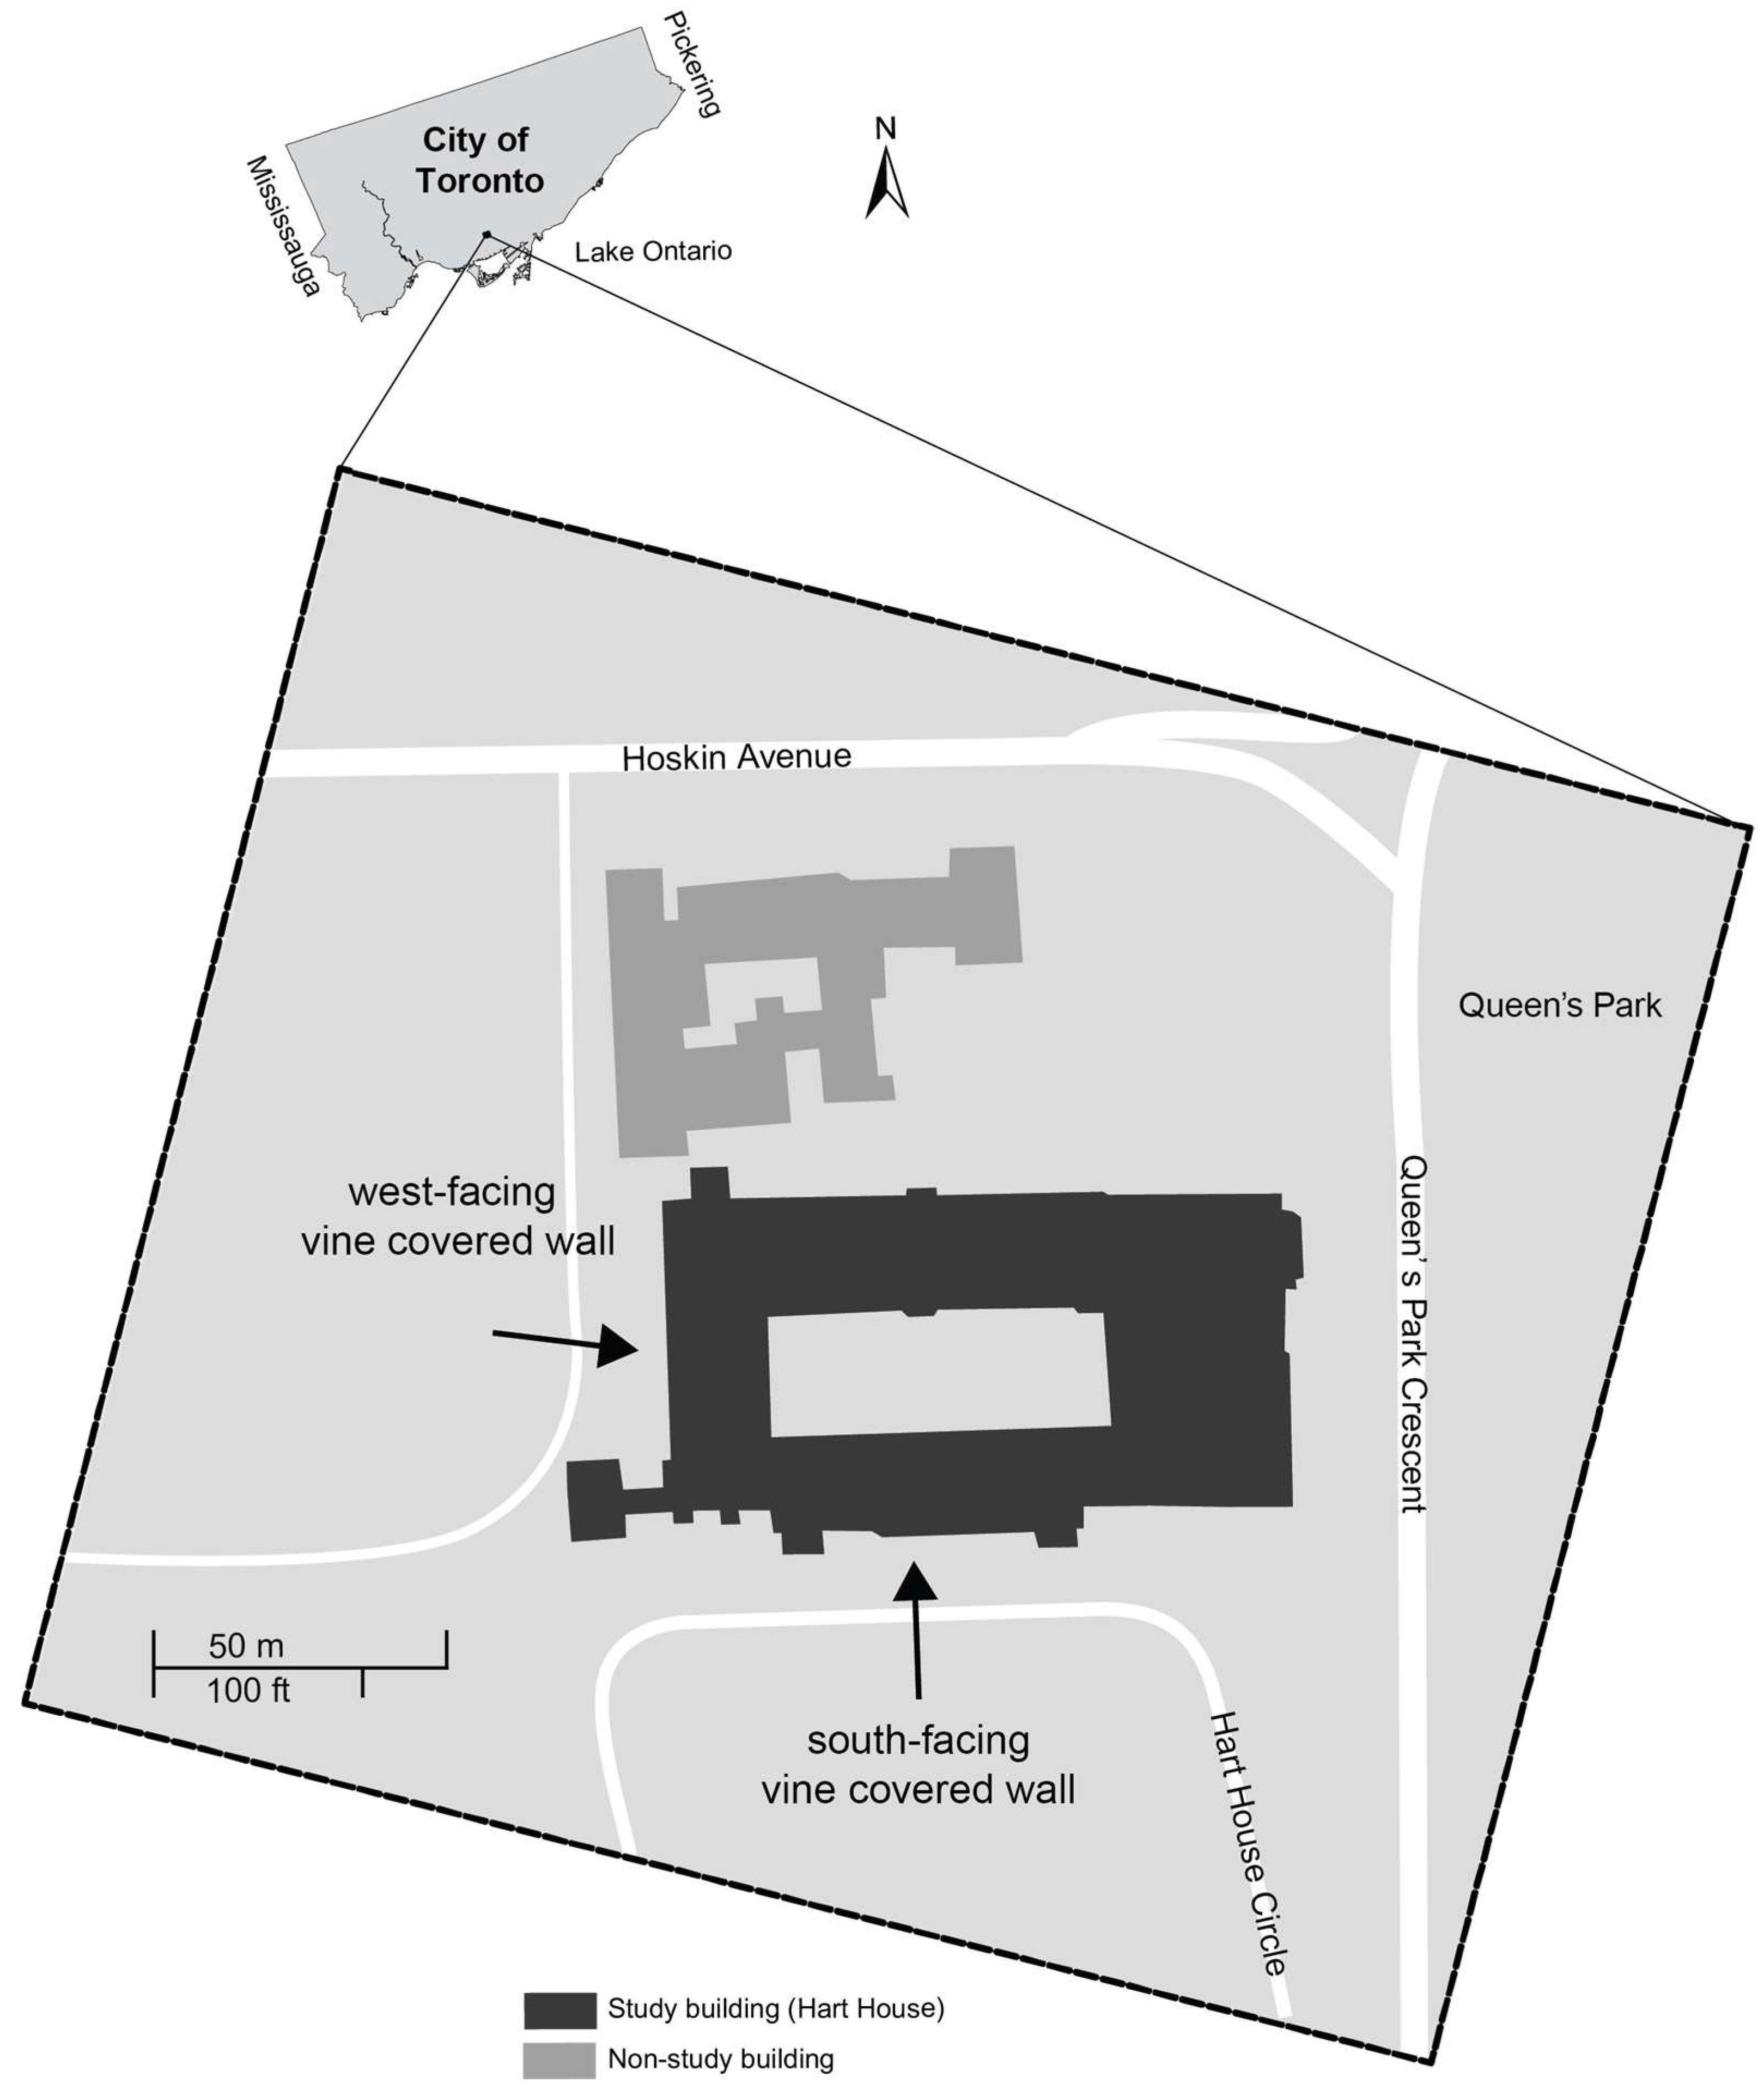
2. Materials and Methods

The study site was at the University of Toronto, 27 King’s College Circle, in the highly urbanized core of Toronto, Canada, where daytime May to October temperatures typically fluctuate between 15–25 °C. Specifically, this study examined Hart House, a building constructed with gray sandstone blocks and with extensive coverage of Boston Ivy, a perennial climbing vine, on the walls oriented approximately south and west (Figure 1). The south-facing green façade measured 182 m2 (height = 7 m, width = 26 m), while the west-facing one measured 172.5 m2 (height = 7.5 m, width = 23 m). Built in 1919, Hart House is a two-and-a-half-story building largely unshaded by surrounding features.
Indigenous to eastern Asia, Boston Ivy can now be found in many temperate locations worldwide and is characterized by its large, abundant, and lobed foliage [28,45]. Boston Ivy’s leaf layer and size are thickest in the summer, when its potential to mitigate warming is most needed, with leaf sizes reaching 25 cm [45]. It is easy to grow, adheres well to surfaces, has a long lifespan, and can withstand harsh environmental conditions [46]. Adhesive discs from its tendrils allow the vine to attach to substrate material, enabling the growth of Boston Ivy on common building materials, such as brick or stone, without significant damage to the surfaces or the mortar [47]. Where perennial vines are found on buildings in Toronto, Boston Ivy is a common species.
To monitor wall-surface and ambient temperatures, HOBO® Temperature Data Loggers (Onset Computer Corporation, Bourne, MA, USA) were chosen for their accuracy, small size, and large memory capacity. They are weather-resistant, transportable devices that record temperature readings in a digital format over a specified range of time. Loggers were mounted to the building surface and enclosed in a white louvred radiation shield made from UV-stabilized thermoplastic. Radiation shielding maximized surface albedo, which minimized the absorption of solar radiation and diminished the potential for artificially elevated temperatures.
The loggers’ similarity in temperature measurement was tested in a laboratory setting. During the test, 42 loggers were programmed to collect data simultaneously once every 15 min and over a one-week period, where temperature conditions varied from 2.5 to 26 °C. An ANOVA revealed that logger temperatures did not differ significantly F(41, 28,266) = 1.10, p = 0.305. Forty loggers were selected for the study, with two as backups.
To monitor the south- and west-facing walls, 20 loggers were sited on each wall: 12 vine-shaded, 6 non-shaded, and 2 for ambient temperature. Each was labelled by location and mapped. The vine-shaded and non-shaded loggers measured wall-surface temperatures. Ambient microclimatic temperatures adjacent to each wall (localized) were measured using temperature loggers fitted in louvred radiation shields and attached to lamp posts 5 m from the building walls at 2 m above the ground.
To ensure objectivity, the placement of vine-shaded and non-shaded loggers was determined randomly. The method involved photographing each wall and overlaying it with a grid. The grid cells were used to select vine-covered and non-shaded wall areas in proportionate regions. Each cell was assigned a number, and a random number generator was used to select a logger location for each region. This sampling method captured the entire wall between 2 and 5 m in elevation on the building. All vine-shaded logger sites had complete leaf coverage.
Only the building’s west- and south-facing walls were monitored, as the literature indicates that, during the growing season, these surfaces receive the greatest amount of net solar gain [19,40,48]. In contrast, the solar gain of north- and east-facing walls is not enough to significantly benefit from the temperature-moderating effects of vegetation [7,49]. Simultaneous temperature readings were recorded by all loggers every 15 min from May 9 to October 31, 2012. This captured the growing season of Boston Ivy (May to mid-late October) and the highest temperatures in Toronto (June through August). Because the loggers had limited memory, they were removed for an hour to download data five times during the study. Other meteorological data (wind speed, precipitation, relative humidity, and solar radiation) were obtained from a weather station operated by the University of Toronto (250 m from the study walls) and were collected every 15 min.
The analysis only considered temperatures recorded during peak solar periods. We used average solar radiation values and maximum non-shaded wall temperatures (south and west wall) during the warmest months of the year (July and August) to identify this period for each wall. For the south wall, the period was from 10:00 to 18:00, and for the west wall, it was from 12:00 to 20:00. To investigate daily temperatures throughout each month, the temperature readings from ambient, vine-shaded, and non-shaded sites were individually averaged daily over the 8 h peak solar access period. Median ambient temperatures were subtracted from median vine-shaded and median non-shaded logger recordings for each day, showing differences between wall and ambient temperatures. Additionally, vine-shaded temperatures were subtracted from non-shaded temperatures for each day, indicating the ability of vines to mitigate the rise in building surface temperature. For a seasonal perspective, these daily differences were averaged for each month.
Degree hour difference (DHD) was calculated for south and west walls when the ambient air temperature was ≥23 °C, a mid-threshold of human thermal comfort [50], and the air temperature around which demand for air conditioning is reported to occur [11,51,52]. DHD values were calculated for each wall by taking the difference between the hourly average of vine-shaded and non-shaded temperatures (when the ambient temperature was ≥23 °C) and summing them over the course of the day. Because DHD encompasses temperature differential and duration, it provides information on total daily thermal energy differences between vine-shaded and non-shaded microenvironments.
All statistical analyses were conducted using IBM SPSS software (version 24). Paired t-tests were conducted on temperature data after applying a square root transformation. To investigate the effectiveness of perennial vines in reducing urban built-surface temperature during summer under specific meteorological conditions, two models (one each for south- and west-facing walls) were produced using multiple regression analysis [53]. The temperature-moderating effectiveness of vines was based on DHD values, where higher DHD values indicate greater effectiveness. The multiple regression was a generalized least squares model with a moving average correlation structure to account for first-order autocorrelation. Independent variables included day difference (numeric variable for day of year), ambient temperature, solar radiation, wind speed, and three interaction terms (day difference * solar radiation, ambient temperature * wind speed, day difference * wind speed).

3. Results

3.1. Vine Characteristics

The leaf area index (LAI) of Boston Ivy was assessed each season [54]. It was found that the south wall consistently had a denser leaf area (i.e., higher leaf area index). The highest leaf area index values (2.5 for the south wall and 2.0 for the west wall) were observed during summer (late June to August), while the lowest values were during spring (May to early June). In the fall (September and October), the leaves began to senesce, decreasing shade to the walls [55]. The size of the leaves (midrib length) at the vine-shaded logger sites was also measured each season, with the highest average leaf size of 20 cm (SD = 1.35) observed during summer and the lowest of 17 cm (SD = 1.9) in spring. The vine cover was generally found to be healthy. Although there was a slight difference in leaf area index between the shaded walls, using 12 randomly placed vine-shaded sensors on each wall (south and west) provided a reliable average of surface temperature measurements.

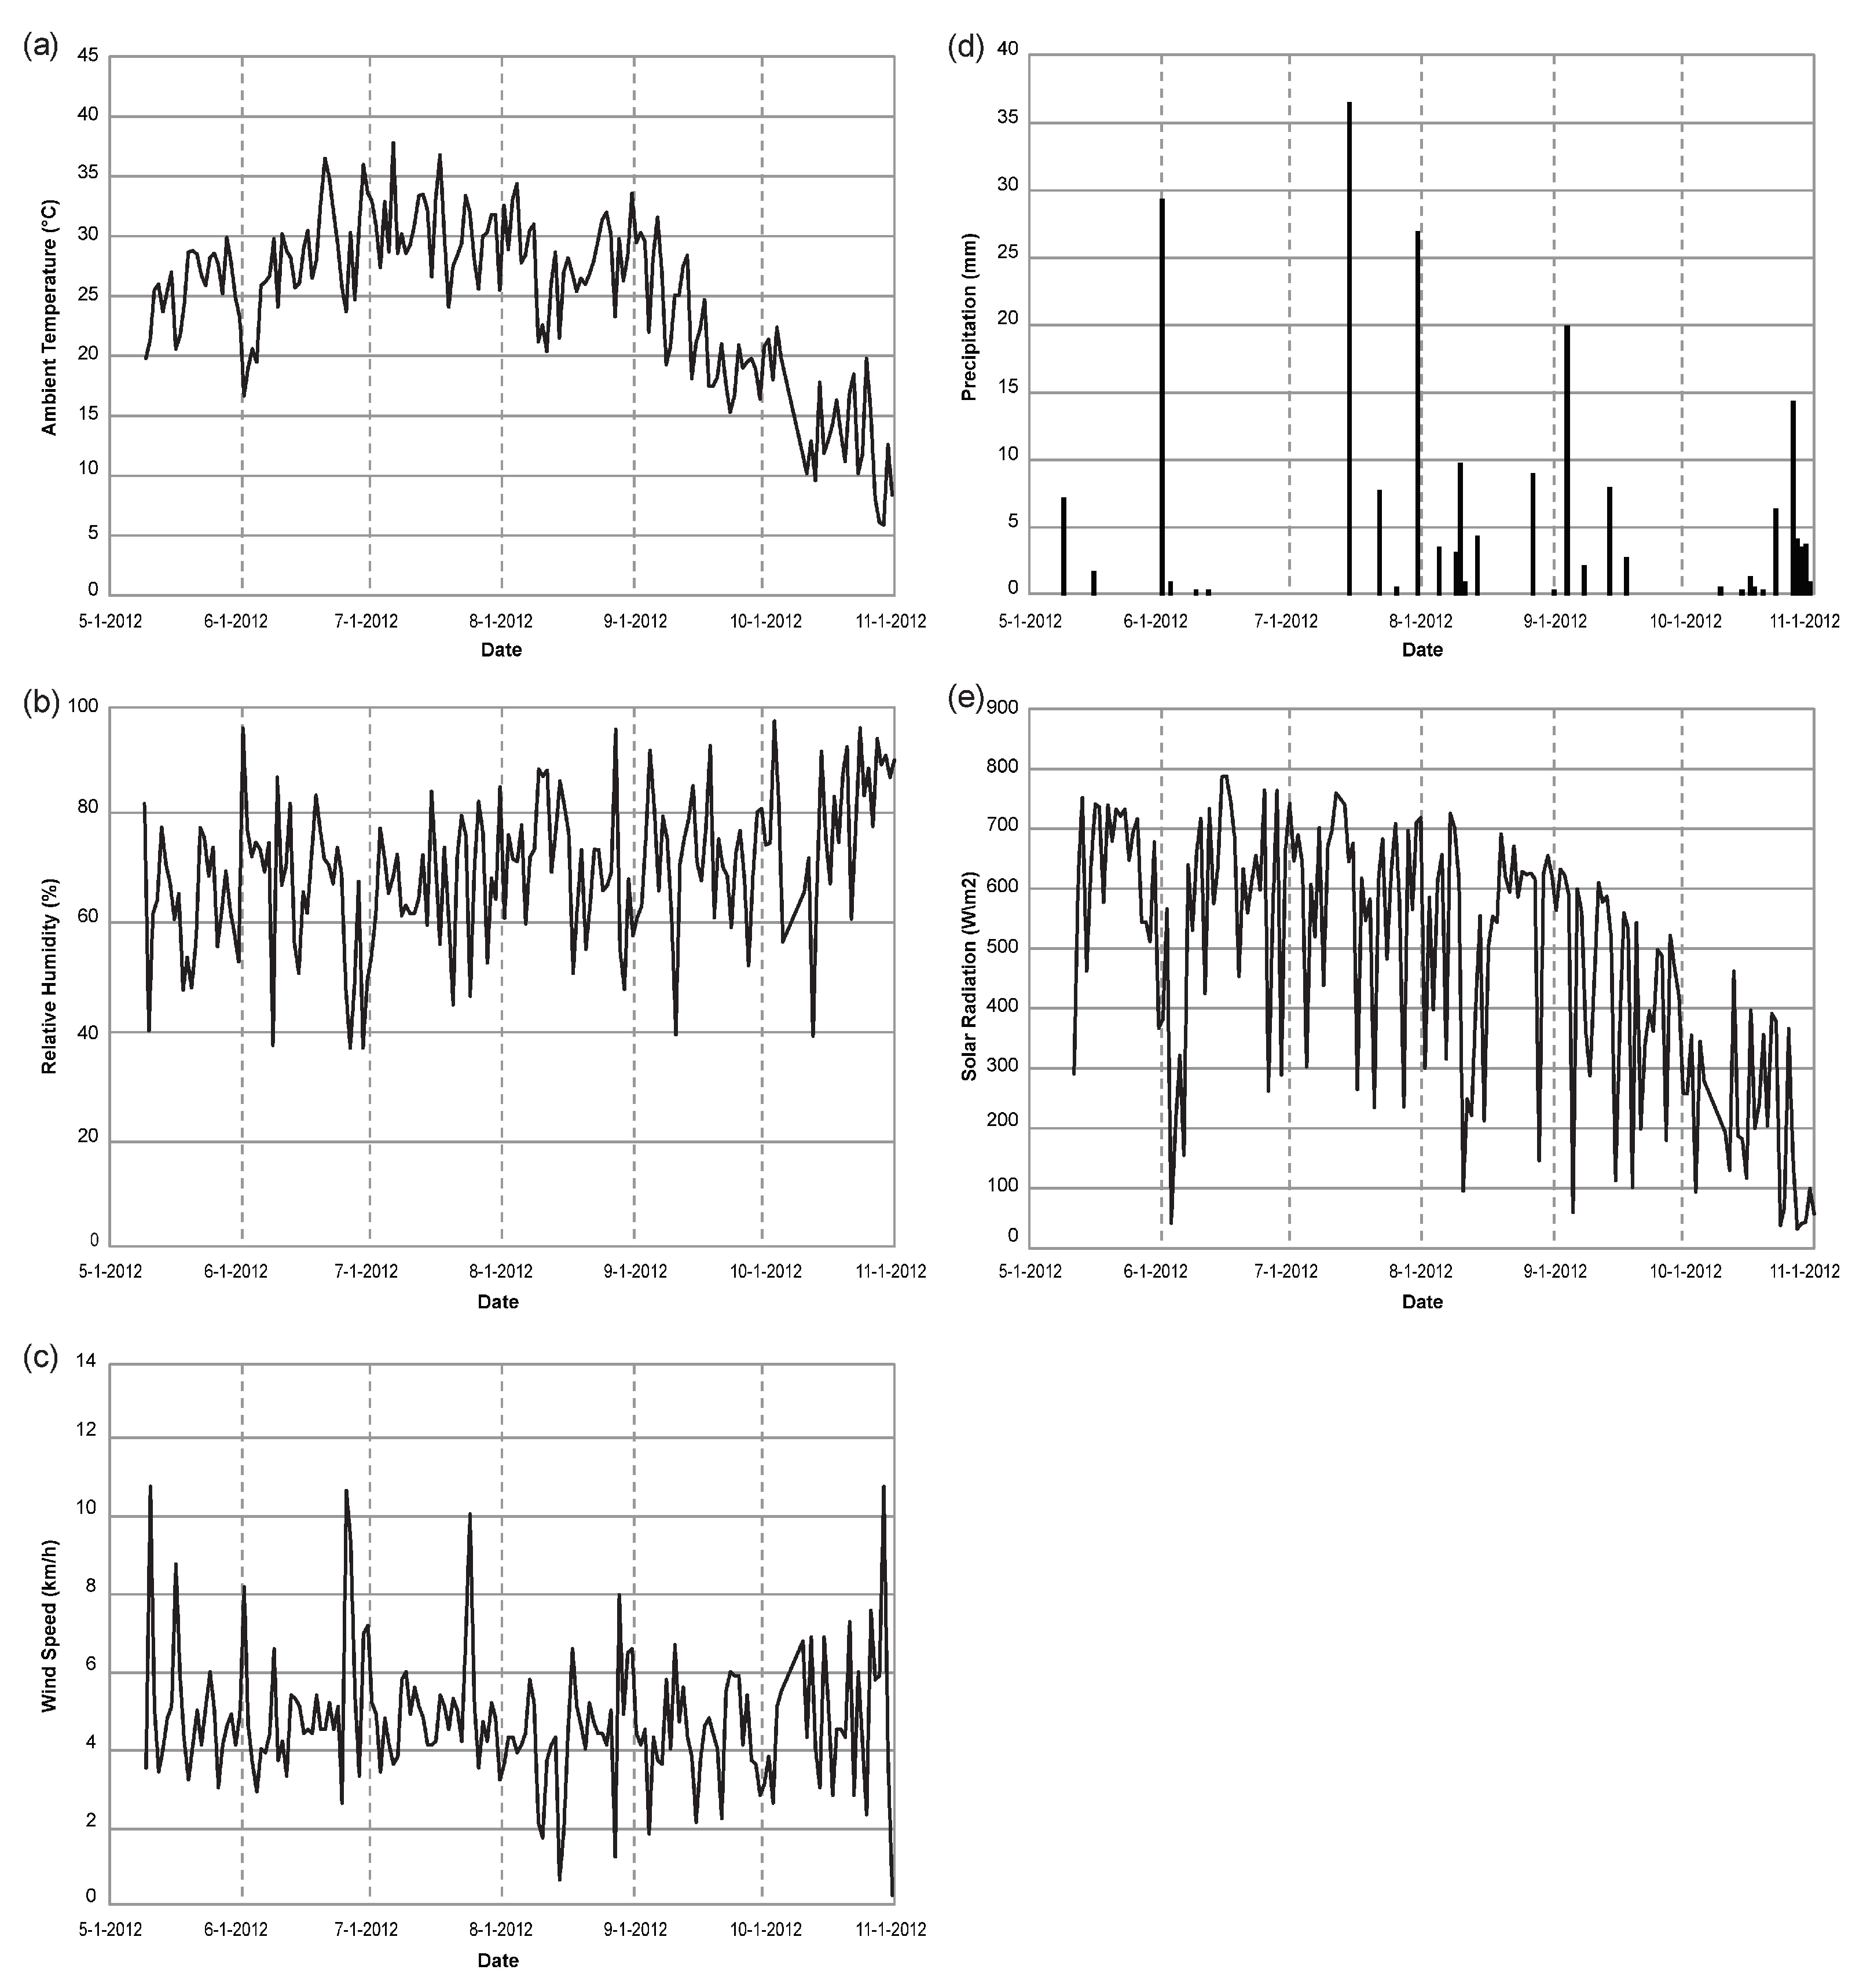
3.2. Meteorological Data

Figure 2 presents the study area’s average daily meteorological data (ambient temperature, relative humidity, wind speed, and solar radiation) during peak solar access periods. Precipitation is also included and was summed daily. These climatic trends correspond with standard weather conditions in Toronto, Canada, and reflect a dryer-than-average summer.

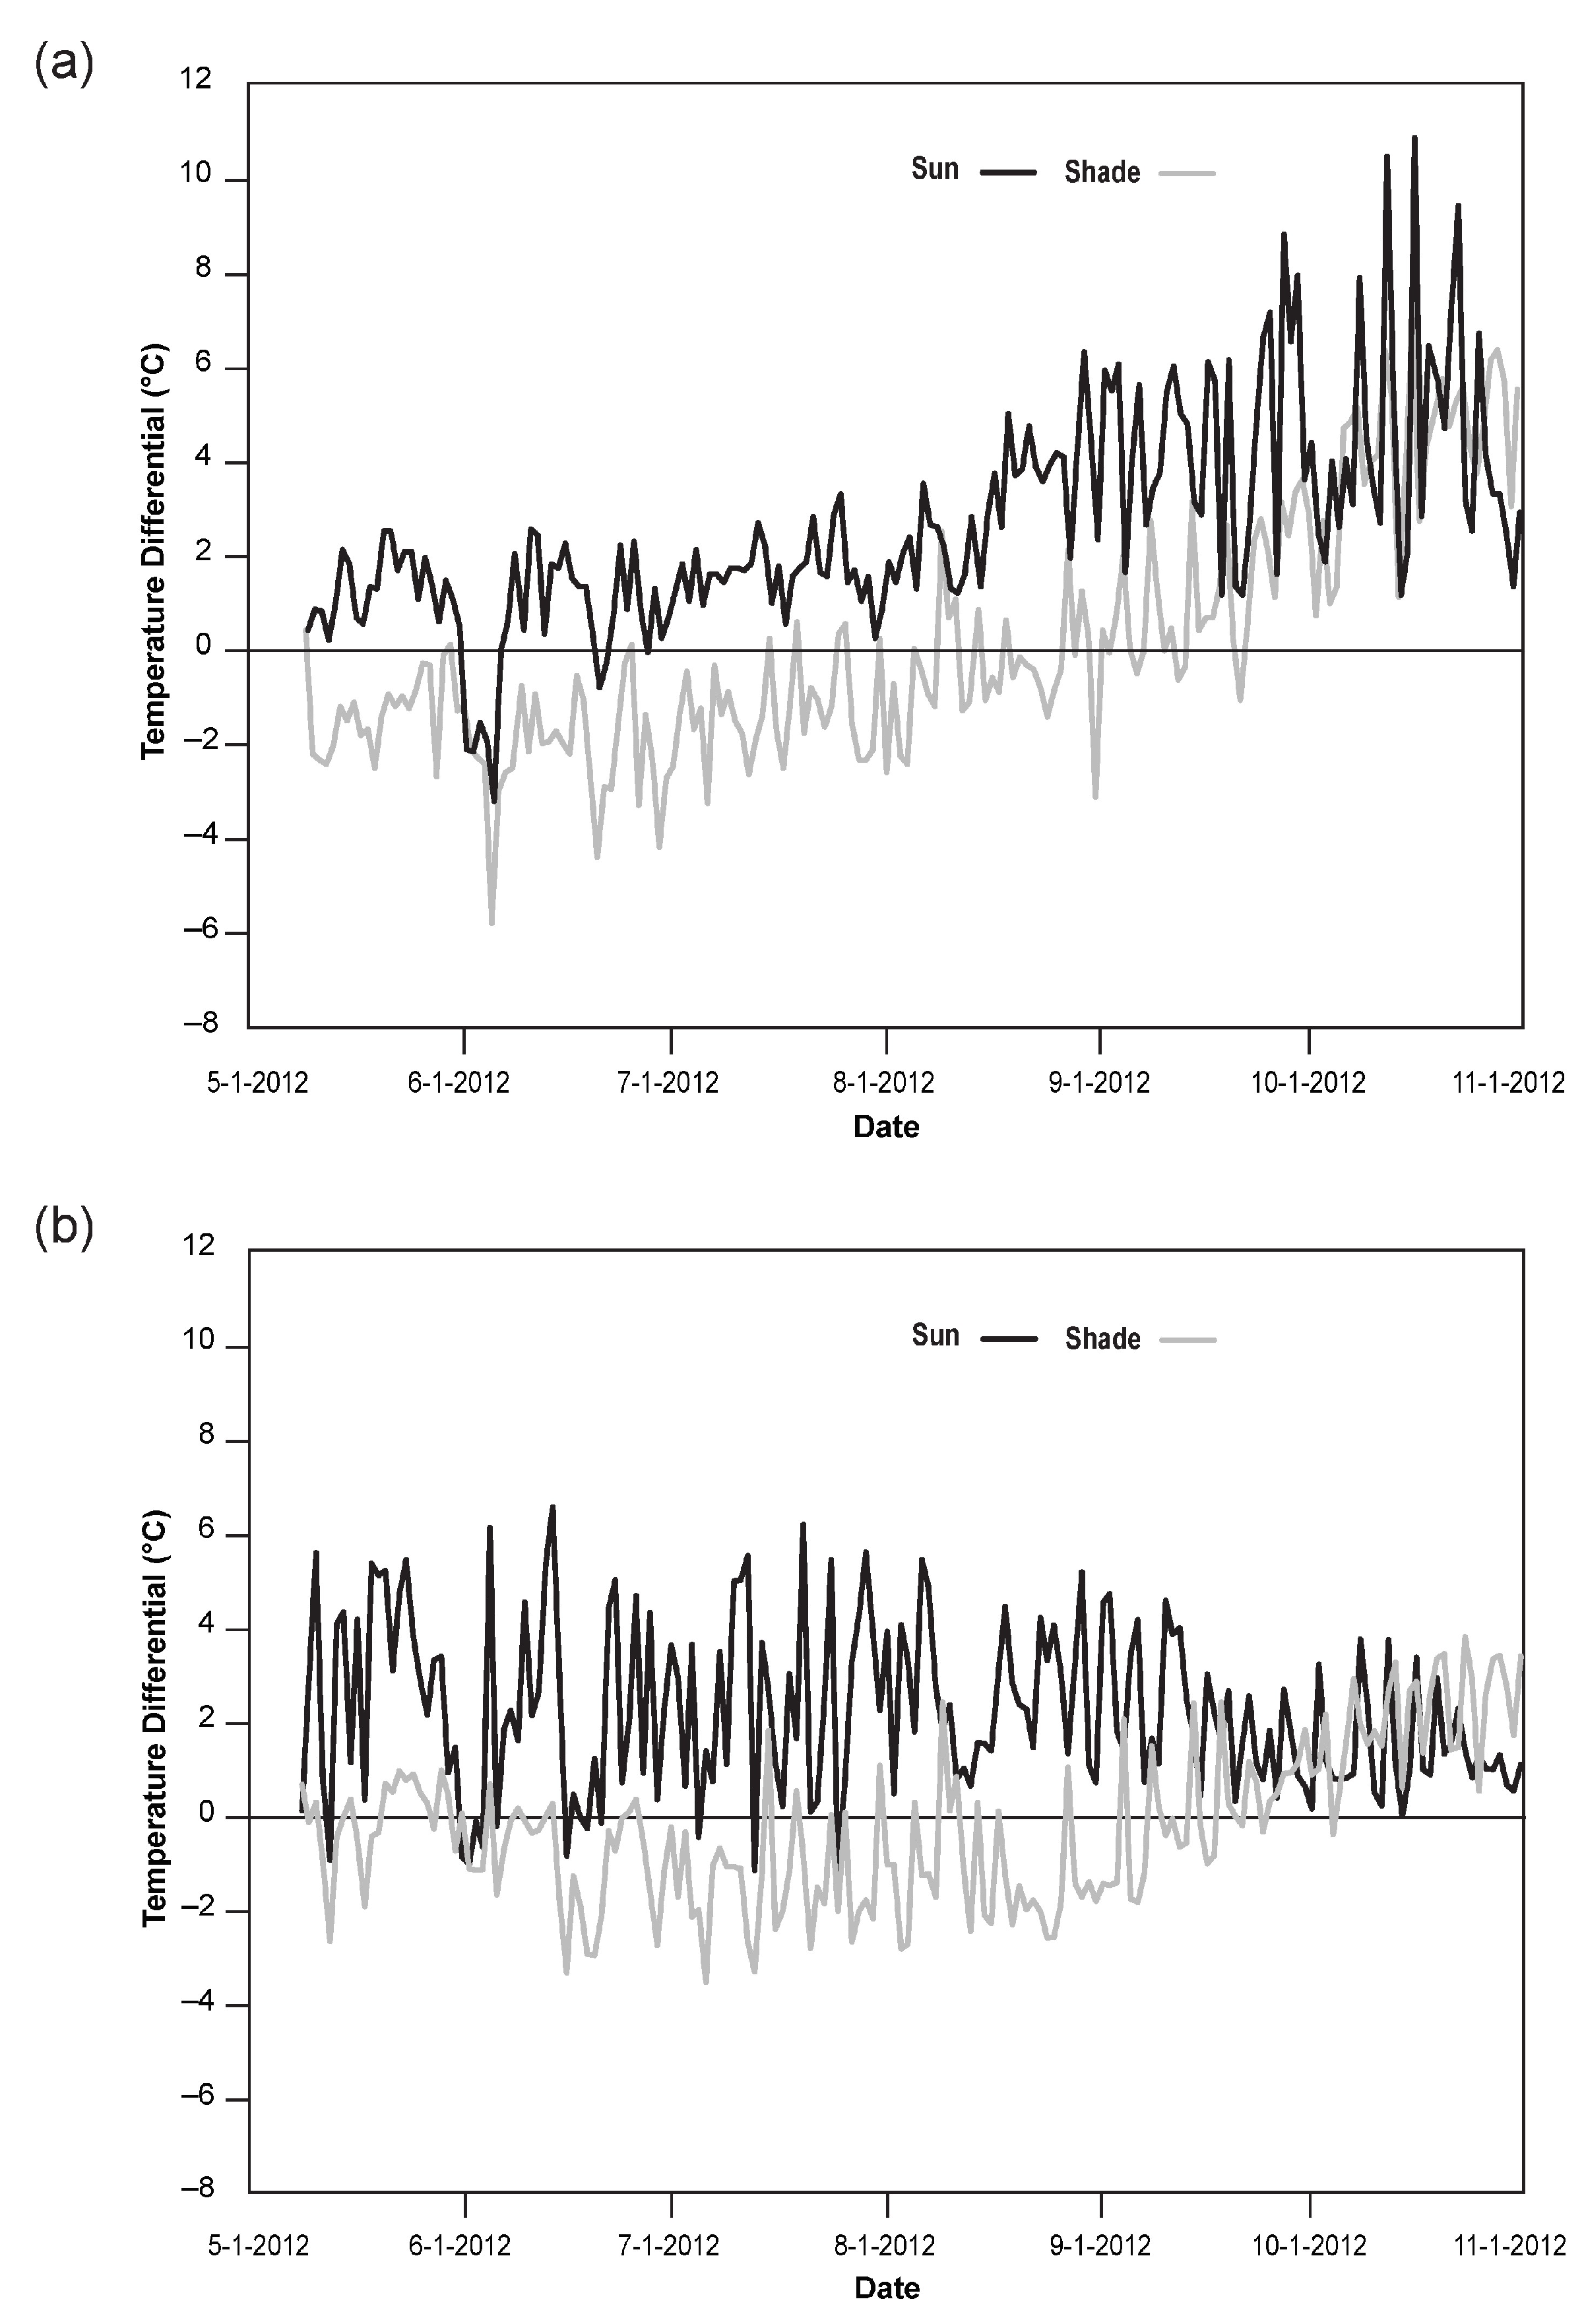
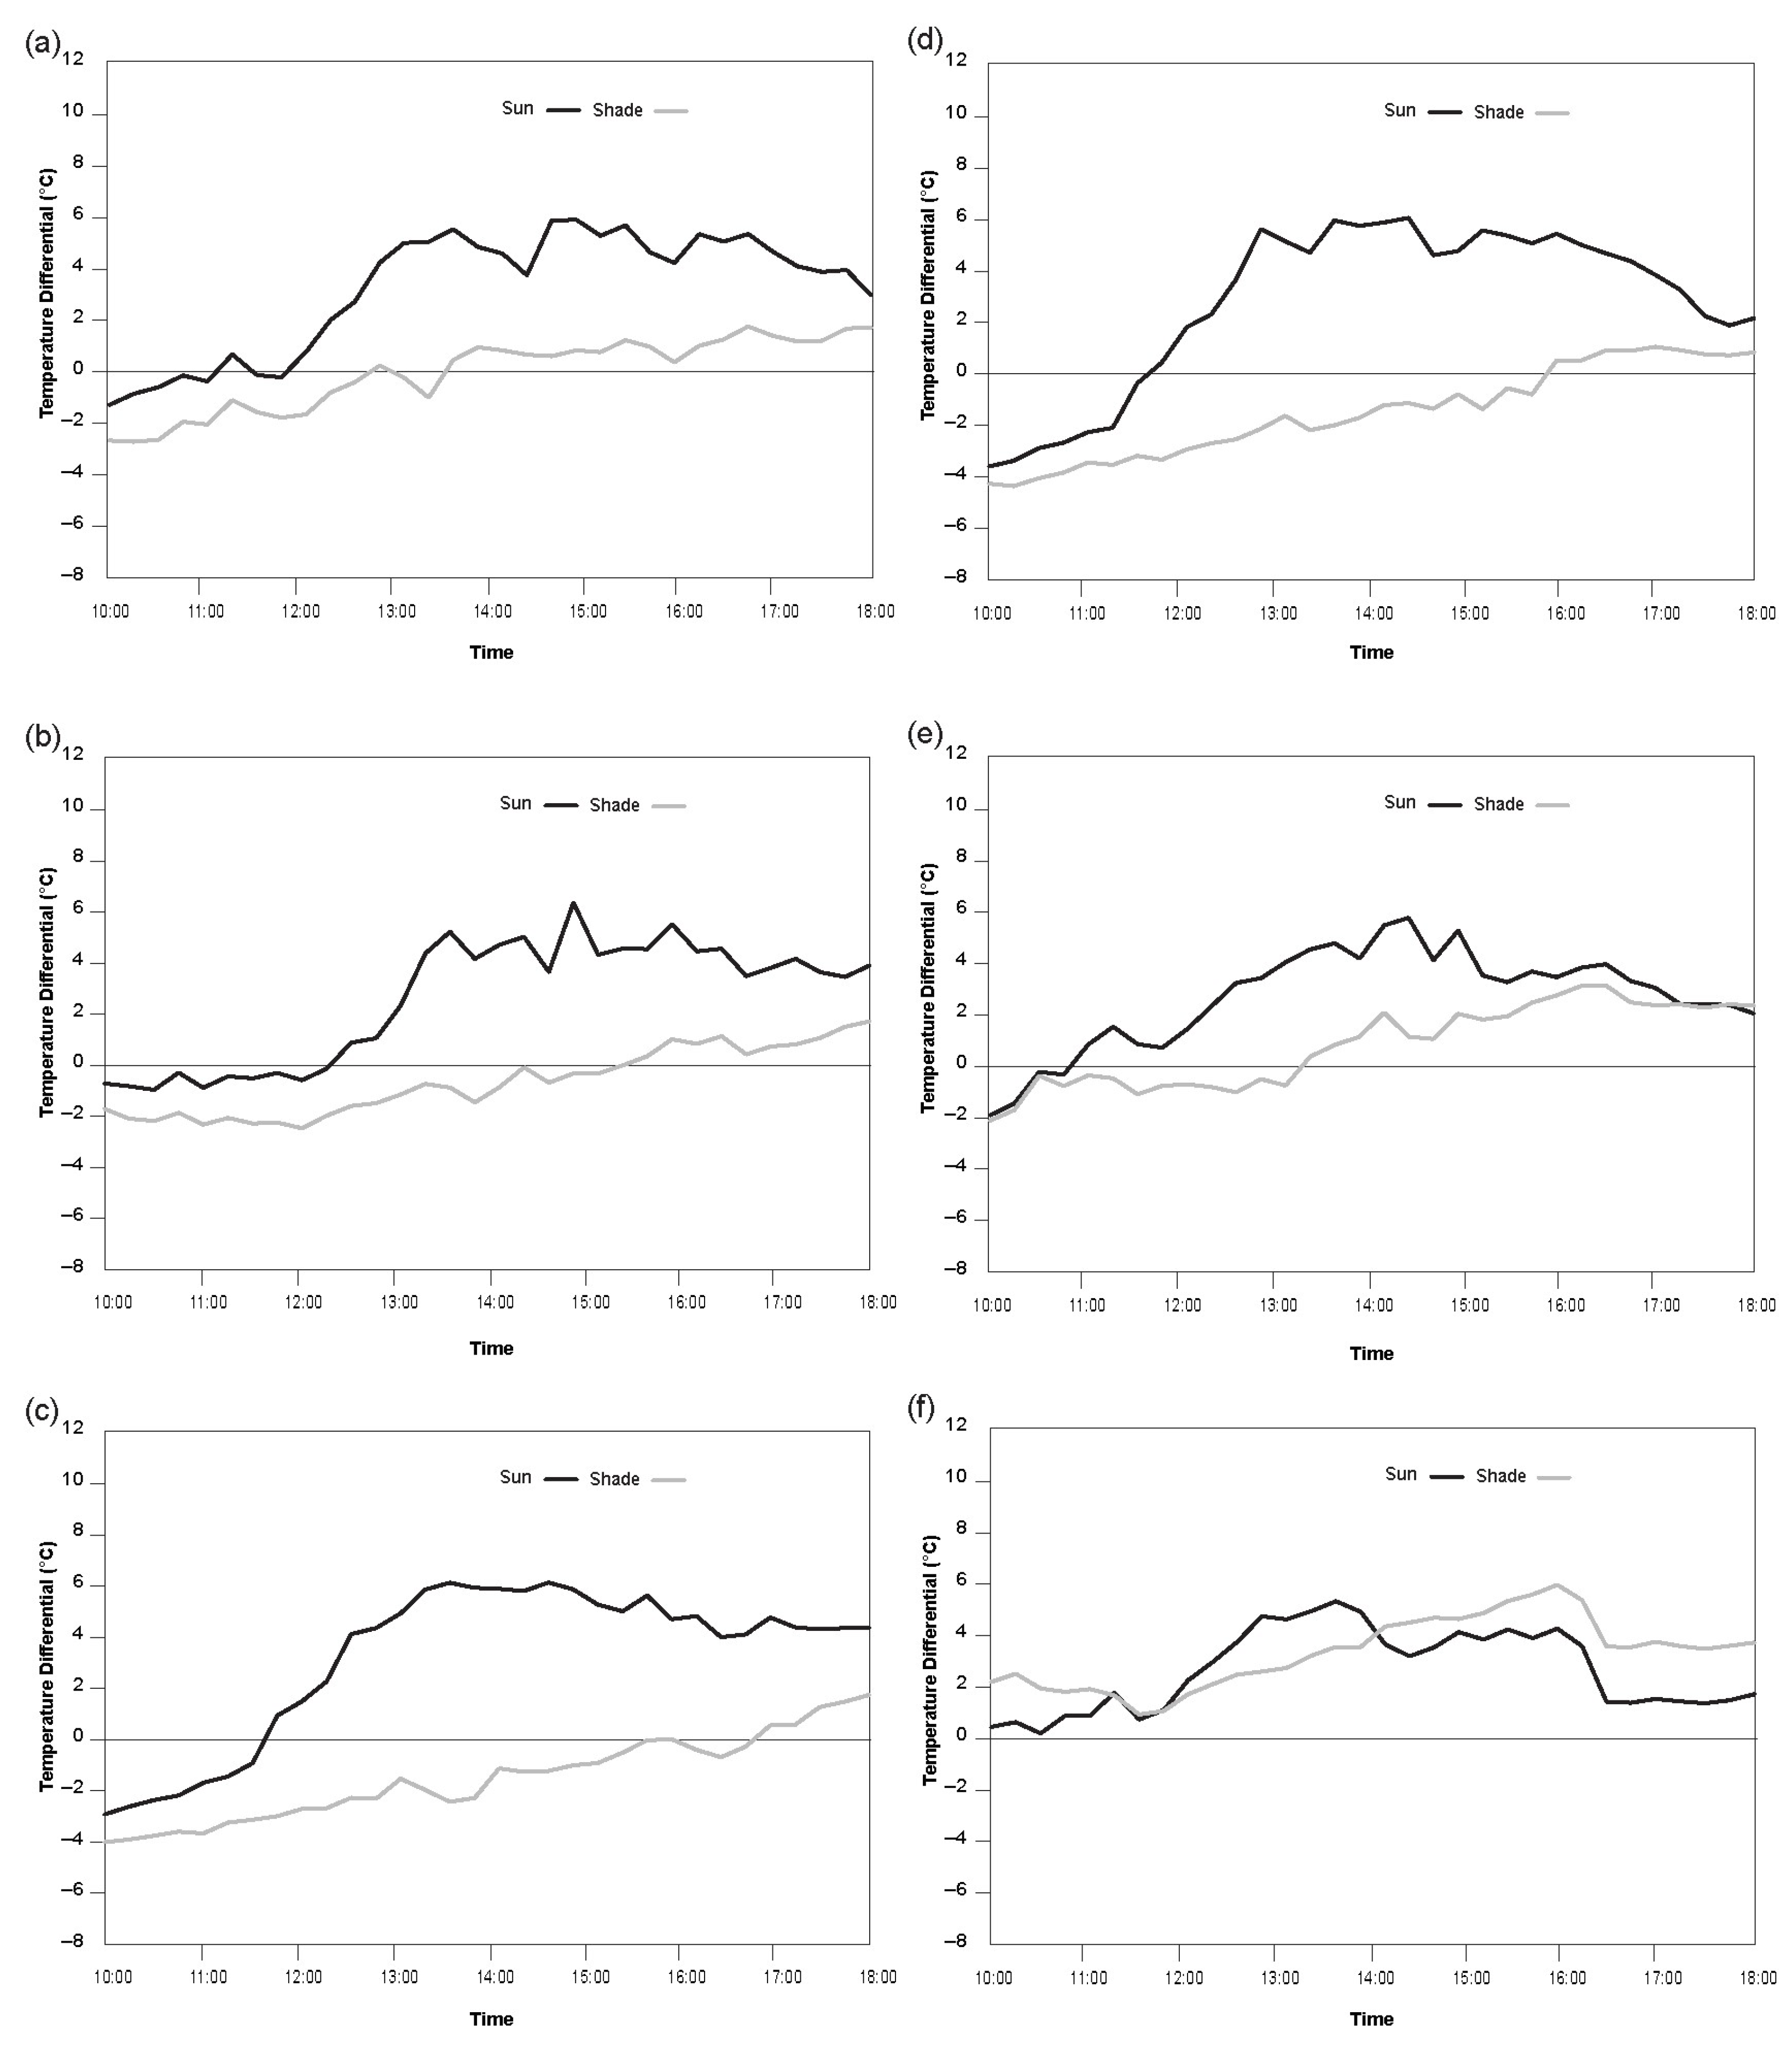
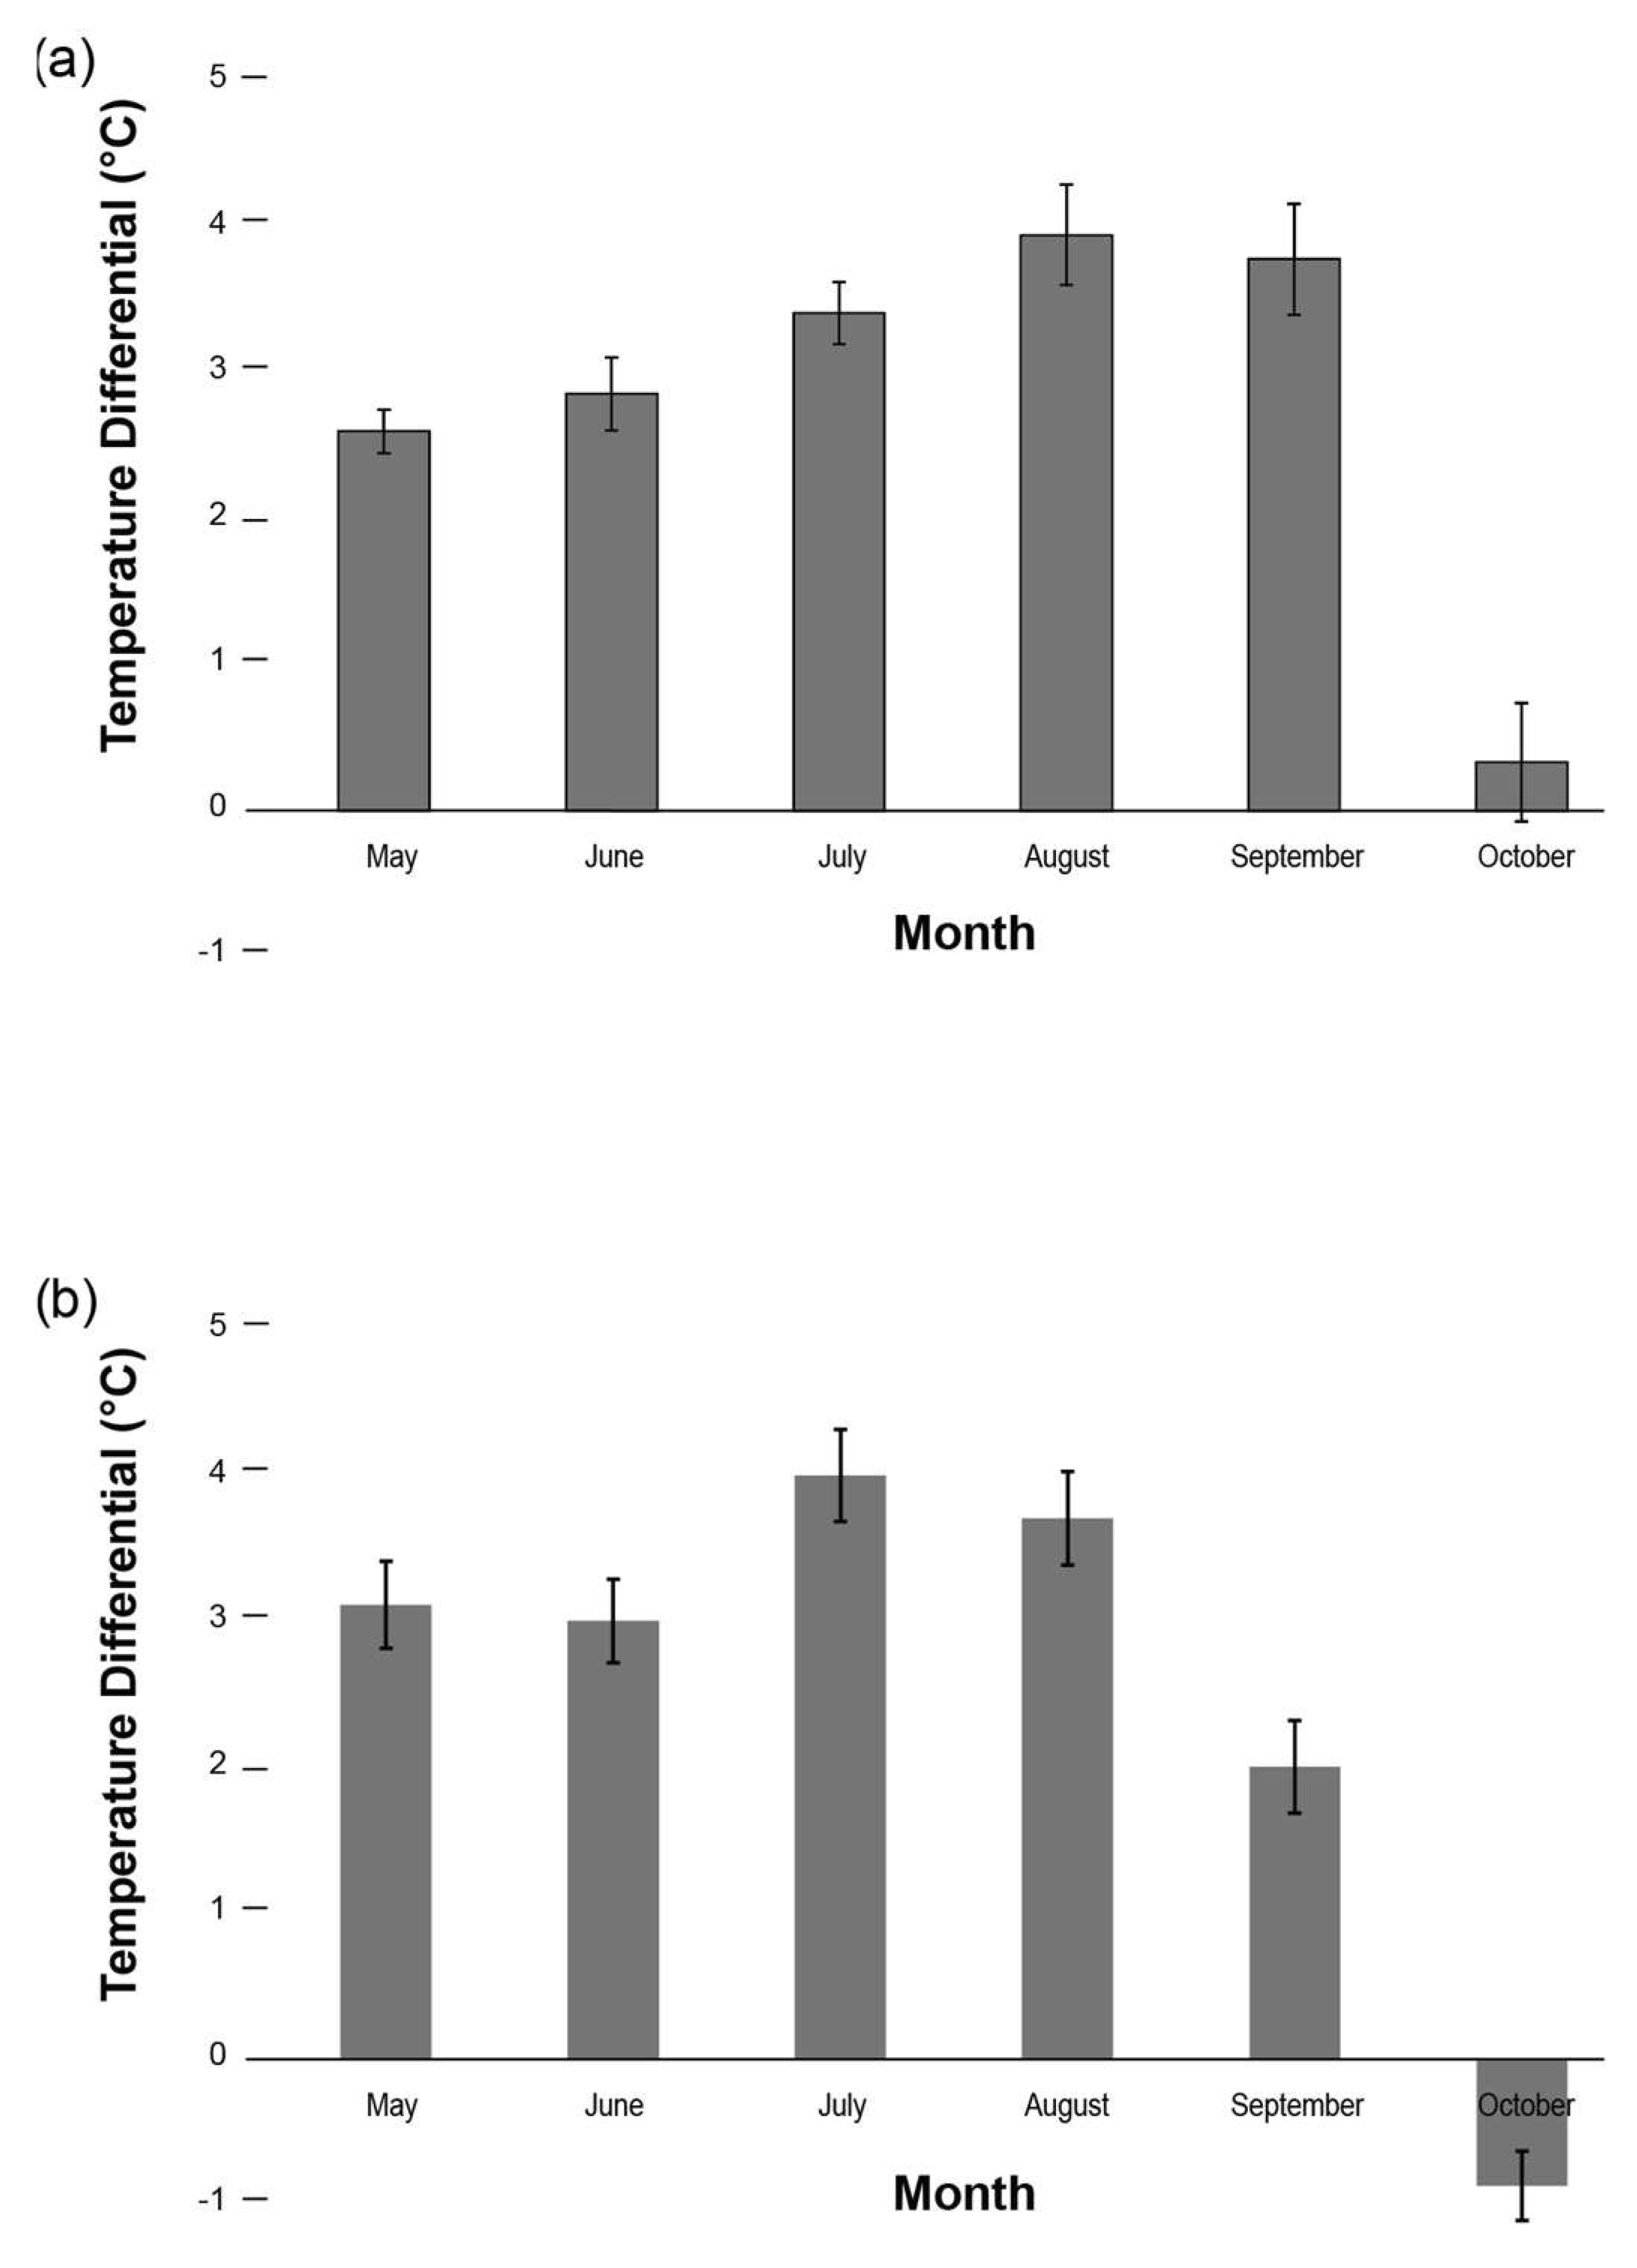
3.3. Sun and Shade Temperature Differentials

Overall, there was variability between daily average vine-shaded and non-shaded temperatures on both the south and west walls during their 8 h peak solar access periods. Vine-covered walls had less overall variance in temperature than non-shaded walls. While standard deviation values were 6.6 and 7.7 °C on the south and west non-shaded walls, respectively, those values dropped to 4.9 and 5.7 °C for the south and west vine-shaded walls. Non-shaded walls had higher daily maximum and lower daily minimum temperatures. The average daily temperatures for the non-shaded walls ranged from 8.3 to 39.0 °C for the south wall and 6.3 to 39.9 °C for the west wall. In contrast, the average daily temperatures for the vine-covered walls ranged from 11.5 to 34.4 °C for the south wall and 8.3 to 34.4 °C for the west wall.
Figure 3a shows the daily median ambient temperature (determined 5 m from the corresponding wall) subtracted from each of the daily median vine-shaded and non-shaded wall temperatures for the south wall during the 8 h peak solar access period (10:00 to 18:00) across the study season. From May to August, vine-shaded walls were generally cooler than ambient air temperatures, with differences ranging from much cooler (5.9 °C less) to slightly warmer (2.4 °C more). In September and October, the vine-shaded wall temperatures were typically higher than the corresponding ambient air, with differences ranging from slightly cooler (1.2 °C lower) to warmer (7 °C higher). The opposite holds for non-shaded wall temperatures, which ranged from the wall being slightly cooler (3.2 °C less) than ambient air to warmer (10.9 °C greater). The differential between vine-shaded and ambient temperatures remained lower than between non-shaded and ambient temperatures throughout the study period. However, the magnitude of the difference appeared to decrease in October.
Similar patterns are evident for the west wall (Figure 3b) during the 8 h peak solar access period (12:00 to 20:00) across the study period. The vine-shaded wall temperatures were modestly cooler (3.8 °C lower) to slightly warmer (2.6 °C higher) than ambient temperatures except for in mid-September and October. In September and October, the vine-shaded temperatures were generally higher than ambient temperatures, ranging from little difference (0.42 °C less) to moderately warmer (4.1 °C more). Non-shaded wall temperatures ranged from 1.2 °C lower to 7.1 °C higher than ambient temperatures. The vine-shaded differential remained lower than the non-shaded one for the duration of the study period, although the magnitude of the difference decreased in late September.
The median ambient air temperature subtracted from the corresponding median shaded and non-shaded wall temperatures for the south-facing wall and during the peak solar access period 10:00 to 18:00 was also evaluated at 15 min sampling intervals (Figure 4). Daily values for each month were averaged to provide a typical day-temperature pattern for each of the six months investigated. The temperature fluctuation is greater for the non-shaded wall than for the vine-shaded one. Vine-shaded temperatures were generally lower than ambient for May, June, July, and August, while non-shaded were generally higher than ambient. The most striking difference was seen in August, when non-shaded temperatures peaked at 9.1 °C above the ambient temperature, while shaded areas remained at or below ambient temperature. In September and October, vine-shaded and non-shaded wall temperatures were higher than ambient air temperatures. Vine-shaded temperature differentials for these months ranged from 0.1 to 3.2 °C (September) and 3.5 to 6.2 °C (October). Non-shaded temperature differentials ranged from 1.7 to 9.9 °C (September) and 3.8 to 7.6 °C (October). The vine-shaded temperature differential remained smaller than the non-shaded temperature differential for each month; however, the difference between the two differentials decreased appreciably in October.
On the west wall, the greatest differences between shaded and non-shaded areas also occurred in August (Figure 5), where temperatures tended to peak at 14:45 and remain high into the early evening. Temperatures in the shaded areas crept above ambient temperatures around 18:00, but the differential was still significantly less than between ambient and non-shaded wall temperatures.
The average daily non-shaded and vine-shaded temperature differentials for each month in the study period were assessed for the south wall during the 8 h peak solar access period (10:00 to 18:00) (Figure 6a). The average temperature of the vine-covered wall was lower than that recorded on the non-shaded wall for all months. The greatest average temperature differential was in August (mean = 3.9 °C, SE = 0.34), while the lowest was in October (mean = 0.33 °C, SE = 0.40). Temperature differences between vine-covered and non-shaded environments were statistically significant for all months except October (Table 1). Averaged over the 6-month study period, the vine-covered wall was significantly cooler (mean = 24.7 °C) than the non-shaded wall (mean = 27.5 °C), t(335) = 5.658, p < 0.001.
Similarly, Figure 6b displays the average daily non-shaded and shaded temperature differential for each month of the study period for the west wall during the 8 h peak solar access period (12:00 to 20:00). The average temperature of the vine-covered wall was lower than the non-shaded wall for all months except October. The greatest average temperature differential was in July (mean differential = 4.0 °C, SE = 0.31), and the lowest differential was in October (mean differential = −0.87 °C, SE = 0.24). Temperature differences between vine-shaded and non-shaded environments were statistically different for all months except September and October. Averaged over the 6-month study period, the vine-covered wall was significantly cooler (mean = 24.4 °C) than the non-shaded wall (mean = 27.1 °C), t(338) = 2.769, p = 0.006. Daily average temperature differentials of up to 6.5 °C were measured on the south-facing wall and 7.0 °C on the west-facing wall.

3.4. The South-Facing Versus the West-Facing Wall

For most months studied, the difference between the monthly average non-shaded and vine-shaded temperature for the south and west wall orientations (during their peak solar access periods) was not significant, except in September and October. However, when the average differential was calculated for the entire six-month study, vine-shading on the south-facing wall prevented the average rise in built surface temperature more effectively than on the west-facing wall, t(350) = 3.827, p < 0.001. The 6-month average difference in temperature between vine-covered and non-shaded areas of the south wall was 2.8 °C, while for the west wall it was 2.4 °C.

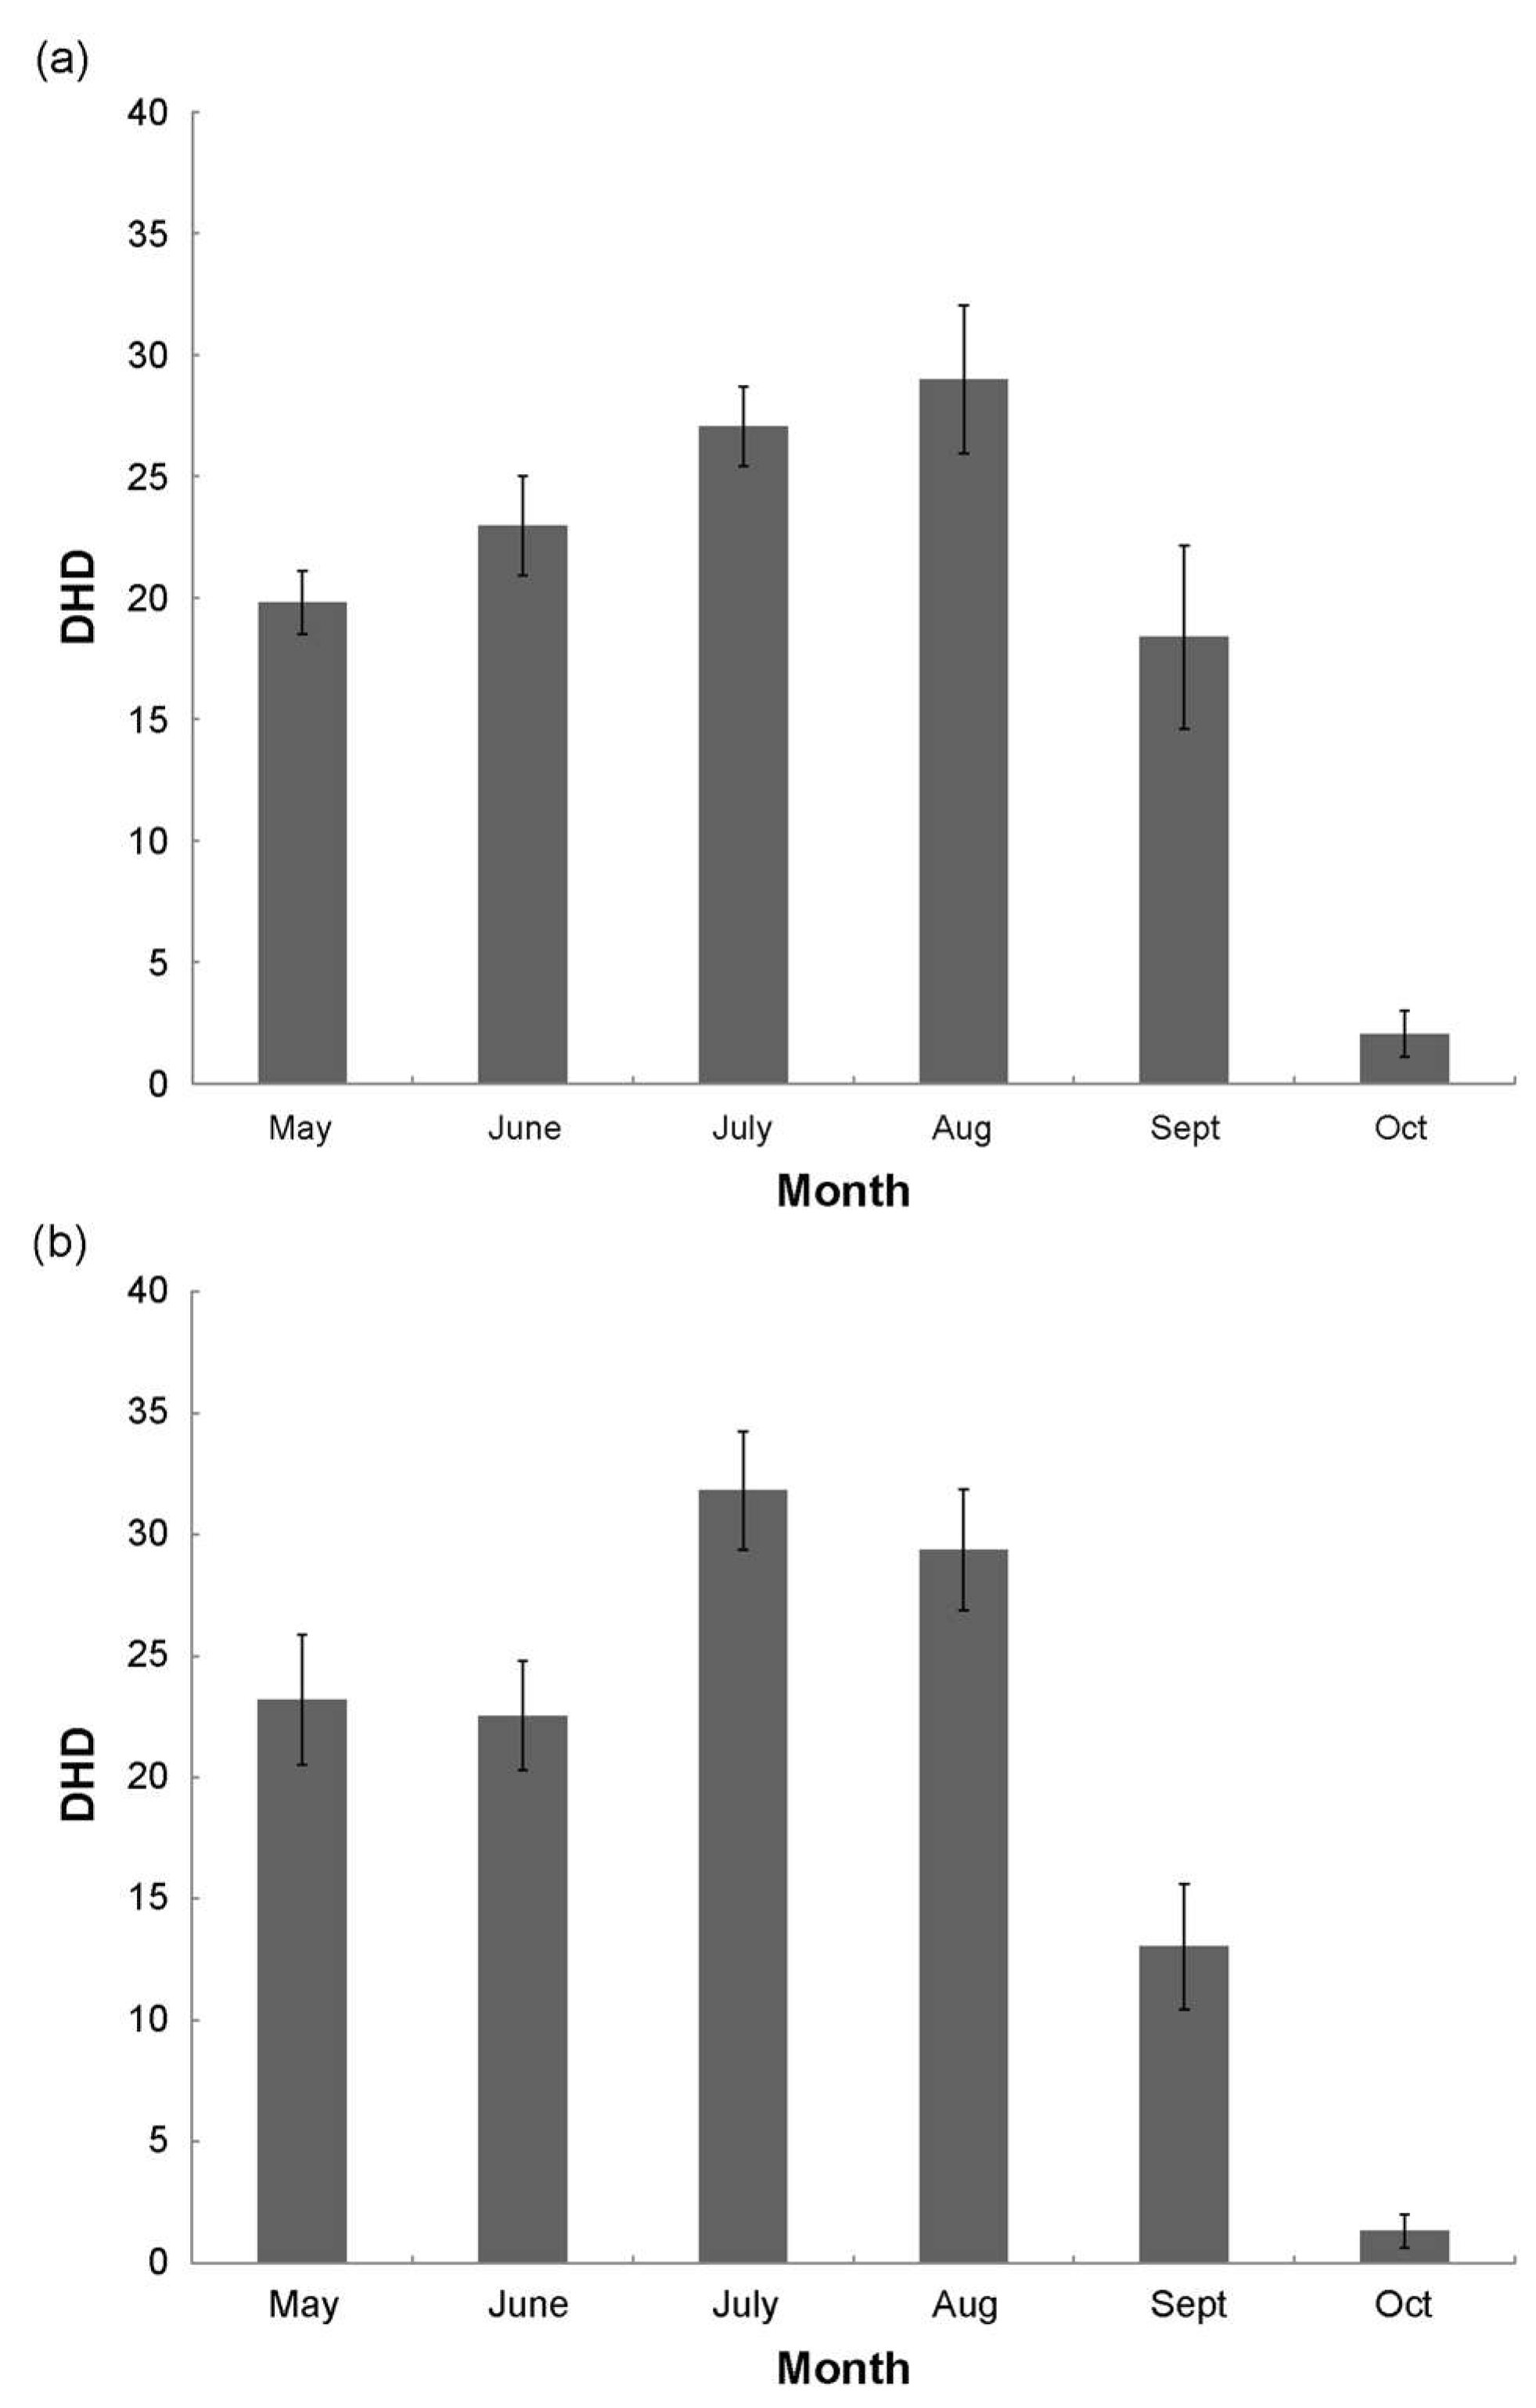
3.5. Degree Hour Difference (DHD)

Figure 7 shows daily average DHD values for each month of the study period for the south and west walls during their respective 8 h peak solar access periods, where ambient temperatures were ≥ 23 °C. For the south wall, the greatest average daily DHD value occurred in August (mean DHD = 29, SE = 3), while for the west wall, it occurred in July (mean DHD = 31.8, SE = 2.4). For both walls, the lowest daily average DHD value occurred in October (south wall: mean DHD = 2, SE = 0.94; west wall: mean DHD = 1.3, SE = 0.7).

3.6. Meteorological Conditions and DHD

A multiple regression model describes the south DHD value (Equation (1)). All independent variables added statistical significance to the model description (p < 0.01). Ambient temperature and solar radiation were the most significant climatic variables explaining the south DHD value.
The final regression model for south DHD can be written as follows:
South-DHD = −19.462 − 3.936 × D − 0.031 × I + 2.522 × AT + 0.706 × W
− 0.158 × RH + 0.009 × (D × I) − 0.197 × (AT × W) + 0.621 × (D × W)
r2 = 0.736, p < 0.001
where D is the numeric variable day difference (date-01/01)/(365/12), I is insolation (incoming solar radiation, W/m2), AT is ambient air temperature (°C), W is wind speed (m/s), and RH is relative humidity (%RH). I, AT, W, and RH were calculated as a daily average for the south-orientation peak solar access period (10:00 to 18:00).
Similarly, a multiple regression model was developed to predict daily west DHD values from meteorological variables (Equation (2)). Each independent variable added statistical significance to the model description (p < 0.01). As with south DHD, ambient temperature and solar radiation were the most important climatic variables for explaining west DHD.
The final multiple regression model can be written as follows:
West-DHD = −0.591 − 2.011 × D − 0.043 × I + 0.600 × AT
− 1.418 × W + 0.008(D × I) + 0.002(AT × I)
r2 = 0.852, p < 0.001
Each of I, AT, and W were calculated as a daily average for the west-orientation peak solar access period (12:00 to 20:00). Importantly, south DHD and west DHD were generated using data from May to October, and their application outside of this time frame is not recommended.

4. Discussion

In dense urban areas, the strategic value of green façades, particularly when compared to tree cover, becomes increasingly evident. While large trees offer substantial environmental benefits, including enhanced carbon sequestration and biodiversity, their feasibility in densely built urban settings is often limited by above-ground spatial constraints and the need for significant soil volumes [21,56]. In contrast, green façades, such as ivy-covered walls, present a more adaptable and space-efficient solution. They require considerably less soil and can be integrated into existing building structures, making them especially suitable for areas where ground space is at a premium.
Large trees require substantial soil volumes for their root systems and overall health, with 30 m3 being the recommended volume [57]. In contrast, ivy species, commonly found in green façades, require far less soil—up to 1 m3—to achieve optimal growth and coverage [58]. A New York City investigation revealed a pronounced tree mortality rate, with over 20% failing to endure beyond five to eight years [59]. This mortality is frequently connected to inadequate soil volume and urban development pressures [22]. Vine-covered walls have the advantage of being applicable in tightly packed urban environments where planting large trees may not be viable. This adaptability positions green façades as a strategic complement or alternative to tree planting in UHI mitigation and microclimate regulation, particularly in cities grappling with the challenges of limited space and dense construction.
There is a notable absence of published research on green façades in North America and their potential role in mitigating the rise in summer urban temperatures [27,29,34]. At the same time, North American scholars are leaders in research on urban forestry and the temperature-moderating benefits of city trees [60,61], thus suggesting a greater societal interest in trees. We speculate that North American urban design preferences and comparatively newer buildings have placed emphasis on trees as a climate moderator over other types of vegetation.
Perhaps the most well-known and widely cited North American study investigating perennial vines and urban heat was conducted on the campus of the University of Chicago, IL, which shares a similar regional climate to our study—hot and humid summers with cold and snow-prone winters [34]. These authors also investigated Boston Ivy growing on stone walls and observed vine-shaded walls to have a maximum temperature difference of 12.6 °C cooler than non-shaded walls with the same orientation. While this temperature difference was larger than what we observed, the Chicago study only ran for nine days; we recorded data in our Toronto study for almost six months. Our substantially longer time series of measurements provides a much wider time window with which to observe the many and varied climatic conditions in which vine performance as a temperature moderator was assessed. We believe this continuous half-year of measurements is advantageous to the creation of robust descriptive models such as daily DHD.
One of the pioneering research studies to investigate the summer-temperature-moderating potential of green façades occurred in Japan 36 years ago [36]. This author reported that ivy-covered walls in their study were up to 13 °C cooler than non-shaded walls, and corresponding indoor temperatures were as much as 7 °C cooler. More recent investigations have concentrated on Asia and Europe, where regional climate differs from mid-latitude North America. For example, research in Wuhan, China, a hot and humid city, reported a maximum external wall temperature difference of 20.8 °C cooler under vine shade [38]. Other findings from northern Greece, with warm dry summers, revealed that vine-covered walls created a maximum surface temperature reduction of 8.3 °C [40]. In New Delhi, India, vine-covered façades exhibited temperature reductions of up to 8.1 °C compared to bare surfaces [39], where these authors noted the diminished cooling efficiency of vines in conditions of high relative humidity. This result aligns with our Toronto findings, specifically the negative association with the predictor variable RH in our south DHD descriptive model. Findings like this are particularly pertinent for cities that experience high summer humidity levels, where such conditions reduce the ambient outdoor air temperatures necessary to instigate the risk of negative heat-related health outcomes [15].
Due to their quasi-two-dimensional growth habit, vines can require less leaf area to provide the same shading as trees. Because evapotranspiration is likely to be minimized with lower LAI, compared to trees, vine cover may contribute less to a localized rise in humidity, making it a more optimal selection of UGI in regions with high relative humidity. Conversely, trees’ comparatively greater evapotranspiration capacity in urban climates may be of greater importance concerning UGI potential for microclimatic cooling in dryer climates [62]. Assuming that soil volume and urban encroachment are not limiting factors for tree growth, more research is required to understand under what climatic conditions vines might be favored over trees.
As with our study, higher surface temperatures on plant-covered façades have been observed at night [63], likely due to vegetation inhibiting longwave radiation and convection cooling. This phenomenon points to a possible drawback of green façades—retarding thermal heat loss from a building at night. Some research has indicated that larger distances between the green façade and the building surface might offer better thermal performance [64], a factor that was not explicitly addressed in our study. Such a design feature could guide future research in optimizing green façade construction for enhanced thermal regulation.
In the United Kingdom, research on Virginia Creeper (Parthenocissus quinquefolia) determined that this vine species delivers dynamic solar-shading benefits, adapting to seasonal shifts in climate and thus influencing external building temperatures (and adjacent microclimates) in summer and winter [42,65]. Virginia Creeper, sharing the deciduous growth cycle of the Boston Ivy analyzed in our research, is advantageous in the fluctuating temperatures typical of mid-latitude North American cities, ranging from sweltering summers to frigid winters. Boston Ivy leaves are absent in Toronto during winter (November to March), leaving the vine’s branches bare. This allows solar radiation to reach the walls, aiding passive building warming and modest, desirable, microclimate heating.
Our study is unique in its creation of a daily DHD metric to assess the temperature-moderating capabilities of perennial vines. By confining our descriptive modelling to times when the ambient air temperature was above a minimum threshold (≥23 °C), we focused on time blocks where the heating of the local microclimate was most likely to negatively influence human outdoor thermal comfort. We found that the south-facing wall exhibited the highest temperature DHD values in August, while the west-facing wall showed the highest values in July. Vine-shaded walls delivered greater thermal regulation during periods of high ambient temperature and intense solar radiation (hot sunny days); a finding that has also been observed for trees [19,66]. Significant interactions were observed among model variables, namely D*I, AT*W, D*W, and AT*I, which impacted DHD. Both south and west DHD models showed that solar radiation had a greater effect on DHD when day differences (D) increased, suggesting that seasonal changes, such as variations in sun elevation or leaf characteristics, may affect vine-shading properties. The south DHD model identified that higher wind speeds could lessen the impact of ambient temperature on DHD, revealing the role of wind in dissipating heat from non-vegetated surfaces. This impact of wind was most pronounced in September and October.
Green façades can adopt various technological solutions. While our study focused on the most rudimentary form—unstructured vines emerging directly from the soil at the building’s base—research in the Netherlands has explored the temperature-regulating potential of diverse green façade designs, from simple vine-covered walls to more complex constructions involving planter boxes secured at various heights on the façade [67]. The authors discovered that using more complex soil arrangements to insulate building walls slows the warming process better than a basic vine structure. However, this may be impractical in most building retrofits due to the significant wall modifications required.
Creating a vine-covered green façade requires the careful consideration of several factors. These include the orientation of the building, which determines the amount of shade and cooling benefits the green façade can provide, the type of wall cladding, which affects the feasibility of vine support, and the choice of vine species, which often depends on whether deciduous or evergreen varieties are preferred [26]. The most straightforward green façade designs typically involve vines growing from a soil medium, either in-ground or in climate-appropriate planters, and use trellis systems to direct the vines upward and away from features like windows and ventilation equipment [68]. Trellising provides structural stability for the vine and protects the building exterior from damage [69]. Separating the vines from direct contact with the wall minimizes moisture accumulation, which can damage the building surface. Moreover, vines not directly adhered to a wall can be more easily pruned and shaped to meet structural and aesthetic requirements.
Using vine-covered walls as a UHI mitigation strategy does introduce specific challenges [69]. One of the main issues is maintenance. Unlike traditional building materials, green façades require ongoing care, including watering, pruning, and monitoring for effectiveness and appearance [28]. Additionally, choosing the appropriate vine species is essential to avoid potential structural damage to buildings [70]. These challenges and the expenses involved in wall modifications, such as trellising, must be weighed against the potential costs of planting and maintaining trees.
We did not explicitly measure Mean Radiant Temperature (MRT), the average temperature of all the surfaces that emit radiation in an environment, which affects how much heat the human body exchanges with its surroundings [71,72]. Many urban design studies are beginning to calculate Physiological Equivalent Temperature (PET) [71], which builds on MRT by considering the body’s response to a combination of atmospheric conditions such as temperature, humidity, wind, and radiation [73]. Resource availability did not permit the creation of a network of sensors to measure black globe temperature (the conventional method of measuring MRT). In a future study, multiple MRT measurements contributing to a time series of data would assist in further isolating the contribution of vine cover to moderating radiant temperature, thus influencing PET values experienced by humans in the vicinity of the green façade.
There were several limitations to our evaluation of the temperature-moderating ability of green façades. Restricted access to the entirety of the green façades (above 5 m) for temperature logger placement was not possible due to on-site safety restrictions. Moreover, to prevent public interaction with the study equipment, temperature loggers were placed at or above 2 m from the ground. Considering the areal extent of each green façade, the random placement of loggers was constrained to 78 m2 (43% of green façade) and 69 m2 (40% of green façade), for the south- and west-facing walls, respectively.
While our study walls were carefully selected to have minimal surrounding trees and buildings, microclimate variations resulting from surrounding asphalt and grass lawns may have confounded our ability to isolate the specific impacts of the vine façades. Our study did not attempt to quantify biological factors like vine growth inconsistency within and between the two green façades, and while we carefully positioned loggers to be completely covered and uncovered, some modest variation in leaf area was inevitable. However, we are confident that replicating and averaging multiple temperature loggers on each wall provided a robust and comprehensive measurement. The complex and unique architectural setting in which the green façades exist, as well as broader regional climatic conditions, limit the direct generalizability of findings to other settings.
Although many studies report similar temperature differences between shaded and non-shaded exterior walls, there is variability concerning the impact on indoor temperature. Moreover, the building materials upon which green façade research has been conducted vary widely from stone (in the case of our research) to brick, and even glass. Not all studies perform an analysis of the vine LAI to quantify the density of plant material, which is a proxy for its shading and evapotranspiration potential.
Our examination of the literature and recent review articles summarizing green façade research has identified the need for standardized approaches to experimental design and measurement [65]. In combination with multidisciplinary teams, the ability to replicate green façade designs while varying underlying building materials and exposure to changing climatic conditions are necessary steps to shift toward a more widespread adoption of green façades as a component of UGI responses to climate warming. Adopting a methodological approach to green façade evaluation that uses a time series of PET measurements may be one approach to standardizing data collection under various climatic conditions. Consistent guidelines necessary for the widespread adoption of green façades by the construction industry require a standardization of design and evaluation.

5. Conclusions

This research has revealed that perennial vines, principally Boston Ivy, have the potential to make a valuable contribution to UHI mitigation, substituting for trees in contexts where arboreal solutions are untenable. While green façades primarily composed of vines may not match the biodiversity or stormwater mitigation potential of trees, they are a more straightforward, low-maintenance alternative that addresses climate change challenges by moderating elevated summer temperatures and aiding in energy conservation. Green façades can serve to recalibrate the role of urban edifices, shifting them from solar energy repositories to entities that mitigate urban warming, thereby playing an important role in urban climate change readiness. The study’s descriptive models, developed in Toronto, highlight key meteorological factors influencing vine efficacy in tempering street-level temperatures, thus offering new insights into green façades within the context of a large mid-latitude North American city. When integrated with other human biometeorological models such as PET, these insights can support urban planners in further refining empirical methods to gauge the impact of vine incorporation within UGI initiatives. Future research on the outdoor temperature moderating potential of green façades requires the development of measurement standards and testing across varying climatic conditions.

Author Contributions

Conceptualization, A.A.M. and M.B.; methodology, A.A.M. and M.B.; formal analysis, A.A.M.; investigation, A.A.M. and M.B.; writing—original draft preparation, A.A.M. and M.B.; writing—review and editing, A.A.M.; visualization, A.A.M.; supervision, A.A.M.; funding acquisition, A.A.M. All authors have read and agreed to the published version of the manuscript.

Funding

The Dean’s Office of the Faculty of Arts at Toronto Metropolitan University (TMU) provided financial support for the editing of this manuscript. TMU’s Program in Applied Science and Management funded the purchase of temperature monitoring equipment.

Data Availability Statement

The data presented in this study are openly available at: https://doi.org/10.32920/25137140.

Acknowledgments

Undergraduate research assistants in TMU’s Geographic Analysis Program supported the data collection. Anna Bowen and Meredith Blackmore provided editorial support.

Conflicts of Interest

The authors declare no conflicts of interest.

References

  1. Hobbie, S.E.; Baker, L.A.; Buyarski, C.; Nidzgorski, D.; Finlay, J.C. Decomposition of Tree Leaf Litter on Pavement: Implications for Urban Water Quality. Urban. Ecosyst. 2014, 17, 369–385. [Google Scholar] [CrossRef]
  2. Taha, H. Urban Climates and Heat Islands: Albedo, Evapotranspiration, and Anthropogenic Heat. Energy Build. 1997, 25, 99–103. [Google Scholar] [CrossRef]
  3. Akbari, H.; Taha, H. The Impact of Trees and White Surfaces on Residential Heating and Cooling Energy Use in Four Canadian Cities. Energy 1992, 17, 141–149. [Google Scholar] [CrossRef]
  4. Oke, T.R. City Size and the Urban Heat Island. Atmos. Environ. 1973, 7, 769–779. [Google Scholar] [CrossRef]
  5. Keith, L.; Meerow, S.; Wagner, T. Planning for Extreme Heat: A Review. J. Extrem. Events 2019, 6, 2050003. [Google Scholar] [CrossRef]
  6. Gao, Z.; Hou, Y.; Chen, W. Enhanced Sensitivity of the Urban Heat Island Effect to Summer Temperatures Induced by Urban Expansion. Environ. Res. Lett. 2019, 14, 094005. [Google Scholar] [CrossRef]
  7. Solecki, W.D.; Rosenzweig, C.; Parshall, L.; Pope, G.; Clark, M.; Cox, J.; Wiencke, M. Mitigation of the Heat Island Effect in Urban New Jersey. Environ. Hazards 2005, 6, 39–49. [Google Scholar] [CrossRef]
  8. Marando, F.; Heris, M.P.; Zulian, G.; Udías, A.; Mentaschi, L.; Chrysoulakis, N.; Parastatidis, D.; Maes, J. Urban Heat Island Mitigation by Green Infrastructure in European Functional Urban Areas. Sustain. Cities Soc. 2022, 77, 103564. [Google Scholar] [CrossRef]
  9. Parker, J.H. Landscaping to Reduce the Energy Used in Cooling Buildings. J. For. 1983, 81, 82–105. [Google Scholar] [CrossRef]
  10. Rosenfeld, A.H.; Akbari, H.; Bretz, S.; Fishman, B.L.; Kurn, D.M.; Sailor, D.; Taha, H. Mitigation of Urban Heat Islands: Materials, Utility Programs, Updates. Energy Build. 1995, 22, 255–265. [Google Scholar] [CrossRef]
  11. Akbari, H.; Pomerantz, M.; Taha, H. Cool Surfaces and Shade Trees to Reduce Energy Use and Improve Air Quality in Urban Areas. Sol. Energy 2001, 70, 295–310. [Google Scholar] [CrossRef]
  12. Patz, J.A.; Campbell-Lendrum, D.; Holloway, T.; Foley, J.A. Impact of Regional Climate Change on Human Health. Nature 2005, 438, 310–317. [Google Scholar] [CrossRef]
  13. Lin, J.; Brown, R. Integrating Microclimate into Landscape Architecture for Outdoor Thermal Comfort: A Systematic Review. Land 2021, 10, 196. [Google Scholar] [CrossRef]
  14. Turner, V.K.; French, E.M.; Dialesandro, J.; Middel, A.; M Hondula, D.; Weiss, G.B.; Abdellati, H. How Are Cities Planning for Heat? Analysis of United States Municipal Plans. Environ. Res. Lett. 2022, 17, 064054. [Google Scholar] [CrossRef]
  15. Kershaw, S.E.; Millward, A.A. A Spatio-Temporal Index for Heat Vulnerability Assessment. Environ. Monit. Assess. 2012, 184, 7329–7342. [Google Scholar] [CrossRef]
  16. McGeehin, M.A.; Mirabelli, M. The Potential Impacts of Climate Variability and Change on Temperature-Related Morbidity and Mortality in the United States. Environ. Health Perspect. 2001, 109, 185–189. [Google Scholar] [CrossRef]
  17. Cheng, C.S.; Campbell, M.; Li, Q.; Li, G.; Auld, H.; Day, N.; Pengelly, D.; Gingrich, S.; Klaassen, J.; MacIver, D.; et al. Differential and Combined Impacts of Extreme Temperatures and Air Pollution on Human Mortality in South-Central Canada. Part I: Historical Analysis. Air Qual. Atmos. Health 2008, 1, 209–222. [Google Scholar] [CrossRef]
  18. Qi, J.; He, B.-J. Urban Heat Mitigation Strategies. In Climate Change and Cooling Cities. Urban Sustainability; Cheshmehzangi, A., He, B., Sharifi, A., Matzarakis, A., Eds.; Springer: Singapore, 2023; pp. 21–44. [Google Scholar]
  19. Sawka, M.; Millward, A.A.; Mckay, J.; Sarkovich, M. Growing Summer Energy Conservation through Residential Tree Planting. Landsc. Urban. Plan. 2013, 113, 1–9. [Google Scholar] [CrossRef]
  20. Millward, A.A.; Sabir, S. Benefits of a Forested Urban Park: What Is the Value of Allan Gardens to the City of Toronto, Canada? Landsc. Urban Plan. 2011, 100, 177–188. [Google Scholar] [CrossRef]
  21. De Kimpe, C.R.; Morel, J.L. Urban Soil Management: A Growing Concern. Soil Sci. 2000, 165, 31–40. [Google Scholar] [CrossRef]
  22. Ordóñez, C.; Sabetski, V.; Millward, A.A.; Steenberg, J.W.N.; Grant, A.; Urban, J. The Influence of Abiotic Factors on Street Tree Condition and Mortality in a Commercial-Retail Streetscape. Arboric. Urban For. 2018, 44, 133–145. [Google Scholar] [CrossRef]
  23. Ordóñez, C.; Duinker, P.N. Assessing the Vulnerability of Urban Forests to Climate Change. Environ. Rev. 2014, 22, 311–321. [Google Scholar] [CrossRef]
  24. Ordóñez, C.; Grant, A.; Millward, A.A.; Steenberg, J.; Sabetski, V. Developing Performance Indicators for Nature-Based Solution Projects in Urban Areas: The Case of Trees in Revitalized Commercial Spaces. Cities Environ. 2019, 12, 1. Available online: https://digitalcommons.lmu.edu/cate/vol12/iss1/1 (accessed on 15 November 2023).
  25. Riley, B. The State of the Art of Living Walls: Lessons Learned. Build. Environ. 2017, 114, 219–232. [Google Scholar] [CrossRef]
  26. Coma, J.; Pérez, G.; de Gracia, A.; Burés, S.; Urrestarazu, M.; Cabeza, L.F. Vertical Greenery Systems for Energy Savings in Buildings: A Comparative Study between Green Walls and Green Facades. Build. Environ. 2017, 111, 228–237. [Google Scholar] [CrossRef]
  27. Köhler, M. Green Facades—A View Back and Some Visions. Urban Ecosyst. 2008, 11, 423–436. [Google Scholar] [CrossRef]
  28. Dunnett, N.; Kingsbury, N. Planting Green Roofs and Living Walls; Timber: Portland, OR, USA, 2008. [Google Scholar]
  29. Irga, P.J.; Torpy, F.R.; Griffin, D.; Wilkinson, S.J. Vertical Greening Systems: A Perspective on Existing Technologies and New Design Recommendation. Sustainability 2023, 15, 6014. [Google Scholar] [CrossRef]
  30. Independent Electricity System Operator Demand Overview: Historical Demand. Available online: https://www.ieso.ca/en/Power-Data/Demand-Overview/Historical-Demand (accessed on 5 October 2023).
  31. Sherman, P.; Lin, H.; McElroy, M. Projected Global Demand for Air Conditioning Associated with Extreme Heat and Implications for Electricity Grids in Poorer Countries. Energy Build. 2022, 268, 112198. [Google Scholar] [CrossRef]
  32. Perini, K.; Ottelé, M.; Fraaij, A.L.A.; Haas, E.M.; Raiteri, R. Vertical Greening Systems and the Effect on Air Flow and Temperature on the Building Envelope. Build. Environ. 2011, 46, 2287–2294. [Google Scholar] [CrossRef]
  33. Bao, S.; Zou, S.; Zhao, M.; Chen, Q.; Li, B. Experimental Study on the Modular Vertical Greening Shading in Summer. Int. J. Environ. Res. Public Health 2022, 19, 11648. [Google Scholar] [CrossRef]
  34. Susorova, I.; Azimi, P.; Stephens, B. The Effects of Climbing Vegetation on the Local Microclimate, Thermal Performance, and Air Infiltration of Four Building Facade Orientations. Build. Environ. 2014, 76, 113–124. [Google Scholar] [CrossRef]
  35. Charoenkit, S.; Yiemwattana, S. Living Walls and Their Contribution to Improved Thermal Comfort and Carbon Emission Reduction: A Review. Build. Environ. 2016, 105, 82–94. [Google Scholar] [CrossRef]
  36. Hoyano, A. Climatological Uses of Plants for Solar Control and the Effects on the Thermal Environment of a Building. Energy Build. 1988, 11, 181–199. [Google Scholar] [CrossRef]
  37. Wong, N.H.; Kwang Tan, A.Y.; Chen, Y.; Sekar, K.; Tan, P.Y.; Chan, D.; Chiang, K.; Wong, N.C. Thermal Evaluation of Vertical Greenery Systems for Building Walls. Build. Environ. 2010, 45, 663–672. [Google Scholar] [CrossRef]
  38. Chen, Q.; Li, B.; Liu, X. An Experimental Evaluation of the Living Wall System in Hot and Humid Climate. Energy Build. 2013, 61, 298–307. [Google Scholar] [CrossRef]
  39. Nagdeve, S.S.; Manchanda, S.; Dewan, A. Thermal Performance of Indirect Green Façade in Composite Climate of India. Build. Environ. 2023, 230, 109998. [Google Scholar] [CrossRef]
  40. Kontoleon, K.J.; Eumorfopoulou, E.A. The Effect of the Orientation and Proportion of a Plant-Covered Wall Layer on the Thermal Performance of a Building Zone. Build. Environ. 2010, 45, 1287–1303. [Google Scholar] [CrossRef]
  41. Holm, D. Thermal Improvement by Means of Leaf Cover on External Walls—A Simulation Model. Energy Build. 1989, 14, 19–30. [Google Scholar] [CrossRef]
  42. Ip, K.; Lam, M.; Miller, A. Shading Performance of a Vertical Deciduous Climbing Plant Canopy. Build. Environ. 2010, 45, 81–88. [Google Scholar] [CrossRef]
  43. Susorova, I.; Angulo, M.; Bahrami, P.; Stephens, B. A Model of Vegetated Exterior Facades for Evaluation of Wall Thermal Performance. Build. Environ. 2013, 67, 1–13. [Google Scholar] [CrossRef]
  44. Pérez, G.; Coma, J.; Martorell, I.; Cabeza, L.F. Vertical Greenery Systems (VGS) for Energy Saving in Buildings: A Review. Renew. Sustain. Energy Rev. 2014, 39, 139–165. [Google Scholar] [CrossRef]
  45. Ckitchfield, W. Shoot Growth and Leaf Dimorphism in Boston Ivy (Parthenocissus Tricuspidata). Am. J. Bot. 1970, 57, 535–542. [Google Scholar] [CrossRef]
  46. Tenenbaum, F. Taylor’s Encyclopedia of Garden Plants; Houghton Mifflin: Boston, MA, USA, 2003. [Google Scholar]
  47. He, T.; Zhang, L.; Xin, H.; Deng, W. Morphology and Mechanics of the Adhesive Disc of Liana Parthenocissus Tricuspidata. Pure Appl. Chem. 2010, 82, 91–96. [Google Scholar] [CrossRef]
  48. Simpson, J.; McPherson, E. Potential of Tree Shade for Reducing Residential Energy Use in California. J. Arboric. 1996, 22, 10–18. [Google Scholar] [CrossRef]
  49. Givoni, B. Climate Considerations in Building and Urban Design; Wiley: Hoboken, NJ, USA, 1998. [Google Scholar]
  50. ANSI/ASHRAE Standard 55: 2017; Thermal Environmental Conditions for Human Occupancy. ASHRAE: Atlanta, NW, USA, 2017.
  51. Akbari, H.; Kurn, D.M.; Bretz, S.E.; Hanford, J.W. Peak Power and Cooling Energy Savings of Shade Trees. Energy Build. 1997, 25, 139–148. [Google Scholar] [CrossRef]
  52. Fountain, M.; Brager, G.; de Dear, R. Expectations of Indoor Climate Control. Energy Build. 1996, 24, 179–182. [Google Scholar] [CrossRef]
  53. Allison, P. Multiple Regression: A Primer; SAGE Publications: New York, NY, USA, 1998. [Google Scholar]
  54. Pérez, G.; Coma, J.; Sol, S.; Cabeza, L.F. Green Facade for Energy Savings in Buildings: The Influence of Leaf Area Index and Facade Orientation on the Shadow Effect. Appl. Energy 2017, 187, 424–437. [Google Scholar] [CrossRef]
  55. Noodén, L.; Leopold, A. (Eds.) Senescence and Aging in Plants; Elsevier: Amsterdam, The Netherlands, 1988; ISBN 9780125209205. [Google Scholar]
  56. Jim, C.Y. Urban Soil Characteristics and Limitations for Landscape Planting in Hong Kong. Landsc. Urban Plan. 1998, 40, 235–249. [Google Scholar] [CrossRef]
  57. DeepRoot Soil Volume Minimums for Street Trees Organized by State/Province. Available online: https://www.deeproot.com/blog/blog-entries/soil-volume-minimums-organized-by-stateprovince-2/ (accessed on 1 November 2023).
  58. DeepRoot Soil Volume Recommendations for Vines, Hedges, and Palms. Available online: https://www.deeproot.com/blog/blog-entries/soil-volume-recommendations-for-vines-hedges-and-palms/ (accessed on 1 November 2023).
  59. Lu, J.W.; Svendsen, E.S.; Campbell, L.K.; Greenfeld, J.; Braden, J. Biological, Social, and Urban Design Factors Affecting Young Street Tree Mortality in New York City. Cities Environ. (CATE) 2011, 3, 5. [Google Scholar]
  60. Akbari, H. Shade Trees Reduce Building Energy Use and CO2 Emissions from Power Plants. Environ. Pollut. 2002, 116, S119–S126. [Google Scholar] [CrossRef] [PubMed]
  61. Donovan, G.H.; Butry, D.T. The Value of Shade: Estimating the Effect of Urban Trees on Summertime Electricity Use. Energy Build. 2009, 41, 662–668. [Google Scholar] [CrossRef]
  62. Tams, L.; Paton, E.N.; Kluge, B. Impact of Shading on Evapotranspiration and Water Stress of Urban Trees. Ecohydrology 2023, 16, e2556. [Google Scholar] [CrossRef]
  63. Vox, G.; Blanco, I.; Fuina, S.; Campiotti, C.A.; Mugnozza, G.S.; Schettini, E. Evaluation of Wall Surface Temperatures in Green Facades. In Proceedings of the Institution of Civil Engineers—Engineering Sustainability; ICE Publishing: Leeds, UK, 2017; Volume 170, pp. 334–344. [Google Scholar]
  64. Safikhani, T.; Baharvand, M. Evaluating the Effective Distance between Living Walls and Wall Surfaces. Energy Build. 2017, 150, 498–506. [Google Scholar] [CrossRef]
  65. Blanco, I.; Convertino, F. Thermal Performance of Green Façades: Research Trends Analysis Using a Science Mapping Approach. Sustainability 2023, 15, 9981. [Google Scholar] [CrossRef]
  66. Millward, A.A.; Torchia, M.; Laursen, A.E.; Rothman, L.D. Vegetation Placement for Summer Built Surface Temperature Moderation in an Urban Microclimate. Environ. Manag. 2014, 53, 1043–1057. [Google Scholar] [CrossRef]
  67. Ottelé, M.; Perini, K. Comparative Experimental Approach to Investigate the Thermal Behaviour of Vertical Greened Façades of Buildings. Ecol. Eng. 2017, 108, 152–161. [Google Scholar] [CrossRef]
  68. Perini, K.; Ottelé, M.; Haas, E.; Raiteri, R. Greening the Building Envelope, Facade Greening and Living Wall Systems. Open J. Ecol. 2011, 1, 1–8. [Google Scholar] [CrossRef]
  69. Besir, A.B.; Cuce, E. Green Roofs and Facades: A Comprehensive Review. Renew. Sustain. Energy Rev. 2018, 82, 915–939. [Google Scholar] [CrossRef]
  70. Cameron, R.W.F.; Taylor, J.E.; Emmett, M.R. What’s ‘Cool’ in the World of Green Façades? How Plant Choice Influences the Cooling Properties of Green Walls. Build. Environ. 2014, 73, 198–207. [Google Scholar] [CrossRef]
  71. Höppe, P. The Physiological Equivalent Temperature—A Universal Index for the Biometeorological Assessment of the Thermal Environment. Int. J. Biometeorol. 1999, 43, 71–75. [Google Scholar] [CrossRef] [PubMed]
  72. Narimani, N.; Karimi, A.; Brown, R.D. Effects of Street Orientation and Tree Species Thermal Comfort within Urban Canyons in a Hot, Dry Climate. Ecol. Inform. 2022, 69, 101671. [Google Scholar] [CrossRef]
  73. Ketterer, C.; Matzarakis, A. Mapping the Physiologically Equivalent Temperature in Urban Areas Using Artificial Neural Network. Landsc. Urban Plan. 2016, 150, 1–9. [Google Scholar] [CrossRef]
Figure 1. Location of the study site (University of Toronto, 27 King’s College Circle, Toronto, Ontario), featuring the study building and an indication of the south-facing and west-facing walls (approximate directions) under investigation.
Buildings 14 00416 g001
Figure 2. Average daily meteorological data during one of the peak solar access periods (10:00 to 18:00): (a) ambient temperature, (b) relative humidity, (c) wind speed, (d) precipitation and (e) solar radiation.
Buildings 14 00416 g002
Figure 3. Difference of daily median ambient temperatures from non-shaded (sun) and vine-shaded wall temperatures: (a) south wall during south peak solar access period (10:00 to 18:00) and (b) west wall during west peak solar access period (12:00 to 20:00).
Buildings 14 00416 g003
Figure 4. Difference of daily median ambient temperatures from non-shaded (sun) and vine-shaded south-wall temperatures for 15 min sampling intervals. Differential measured during the south peak solar access period (10:00 to 18:00) for each month where (af) is May to October.
Buildings 14 00416 g004
Figure 5. Difference of daily median ambient temperatures from non-shaded (sun) and vine-shaded west-wall temperatures for 15 min sampling intervals. Differential measured during the west peak solar access period (12:00 to 20:00) for each month where (af) is May to October.
Buildings 14 00416 g005
Figure 6. Average temperature differential between non-shaded and vine-shaded wall for each month: (a) south wall during south peak solar access period (10:00 to 18:00) and (b) west wall during west peak solar access period (12:00 to 20:00).
Buildings 14 00416 g006
Figure 7. Average daily DHD for each month at ambient temperatures ≥ 23 °C: (a) south wall during the south peak solar access period (10:00 to 18:00) and (b) west wall during the peak solar access period (12:00 to 20:00).
Buildings 14 00416 g007
Table 1. Building orientation and the effect of vine shade on monthly mean temperature difference (°C) for daily peak solar access periods. Lower temperatures are denoted by (-).
MayJuneJulyAugustSeptemberOctober
South
(Shade to Sun)
(-) 2.6 **(-) 2.8 *(-) 3.4 ***(-) 3.9 ***(-) 3.7 **ns
West
(Shade to Sun)
(-) 3.1 *(-) 3.0 *(-) 4.0 ***(-) 3.5 ***nsns
Differential
(South to West)
nsnsnsns(-) 1.8 ***(-) 1.2 *
Non-significant (ns), * p < 0.5, ** p < 0.01, *** p < 0.001.
Disclaimer/Publisher’s Note: The statements, opinions and data contained in all publications are solely those of the individual author(s) and contributor(s) and not of MDPI and/or the editor(s). MDPI and/or the editor(s) disclaim responsibility for any injury to people or property resulting from any ideas, methods, instructions or products referred to in the content.

