Abstract
The construction industry performs many tasks scheduled and related to other activities. Companies must optimize their operations, increase efficiency, eliminate waste, and deliver better products to their customers. As a result, this study aims to identify the main challenges associated with the implementation of the Lean Construction model in small and medium-sized construction companies and optimize the implementation of this process using statistically-focused mathematical models. This study was conducted using the partial least squares (PLS-SEM) method and also carried out the principal component analysis to optimize Lean barriers so that they can be properly implemented in the construction industry. The most important obstacles are displayed, as well as the relationships with other factors. Significant relationships have been discovered between the barriers to Lean construction adoption, especially with regard to corporate culture, communication, training, leadership, and the influence of mentality on business and employee adaptability. Construction executives and managers can make well-informed policy and strategic decisions by having a thorough understanding of the main barriers to Lean implementation. This information enables them to focus on the implementation of Lean technologies in projects, to increase market competitiveness, reduce waste and enhance overall work efficiency.
1. Introduction
The construction industry is characterized by its significant variability and inherent risks in process execution and financial management. This variability and risk complexity present unique challenges and considerations that set the construction sector apart from many other industries [1]. Faced with this enormous variability and risk, the construction industry began to turn to other industries in search of methodologies to optimize waste and cost overruns [2]. Lean, a philosophy developed by Toyota in Japan in the 1980s, is based on the Toyota Production System (TPS) principles. The major goal of Lean is to meet the expectations and needs of both internal and external clients. Thus, it optimizes processes by identifying and removing waste while providing value. Engineer John Krafcik invented the phrase “Lean” in his master’s dissertation, and it acquired popularity through books such as “The Machine that Changed the World”. Initially, Toyota had misgivings owing to mass production challenges, but the TPS was finally designed, developed, and became known as Lean manufacturing [3].
Lean production is a manufacturing philosophy and strategy focusing on reducing waste and increasing customer value. Among the major principles of Lean manufacturing are [4]: identifying value, value stream mapping, analyzing and visualizing the workflow and processes to find waste and improvement opportunities, designing methods to ensure that workflows are constant and without pauses, implementing just-in-time manufacturing, Pursue Perfection.
These principles have increased efficiency and quality in various businesses and sectors, allowing organizations to thrive. The Lean manufacturing technique has been extended to include planning, design, and construction projects, giving rise to “Lean construction”. This word was coined by the International Group for Lean Building in 1993 to define a method of reducing waste in resources, time, and effort during building activities [5]. Lean construction seeks to maximize cost-effective value while adhering to the broad principles of Lean production. Companies attempt to optimize operations, increase efficiency, eliminate waste, and deliver more value to clients and stakeholders by using Lean concepts in construction projects. This emphasis on efficiency and value generation can dramatically improve project outcomes and overall industry performance [6].
Building and infrastructure project planning, design, and construction involve various professions and non-professionals. This collaborative approach can result in disjointed efforts and a difficult coordination process. Unfortunately, this complexity can inject non-value-added activities and processes into the construction industry’s supply chain. These non-value-added factors lead to inefficiency and low production, posing considerable problems to the entire business [7]. The previously described Lean building principles might address these issues and boost production. Therefore, the construction sector can streamline its processes, improve coordination, and raise overall efficiency by implementing Lean techniques and minimizing waste in materials, time, and effort. This strategy seeks to maximize the value-added activities in the supply chain [8].
The introduction of Lean principles to the construction industry in 1992 by Lauri Koskela marked a significant step towards improving efficiency and reducing waste in construction processes [9]. Koskela presented the Transformation-Flow-Value (TFV) theory based on three central concepts: Transformation, Flow, and Value [10].
In addition to Koskela’s work, Greg Howell and Glenn Ballard introduced the Last Planner System (LPS), a Lean tool specifically developed for the construction industry [5,9,11]. LPS emphasizes creating a social process involving discussions between planning and site staff to establish a reliable workflow. It helps improve communication, coordination, and collaboration among various stakeholders in a construction project. The Last Planner System has become one of the most well-known and widely used Lean construction tools for planning and control. In some cases, it is even used interchangeably with the term “Lean construction” as it is a practical tool to apply Lean thinking principles in the construction industry [12].
The introduction of Lean principles and tools like the Last Planner System has been instrumental in driving efficiency, reducing waste, and improving project outcomes in the construction industry. These concepts and practices continue to evolve and be adopted in construction projects worldwide. The shift to Lean Construction causes changes in the organization’s culture and philosophy, encouraging active engagement and inclusivity of all individuals in the project, regardless of position [13]. To fully reap the benefits of Lean Construction, everyone involved in the construction process must be completely engaged and committed.
2. Literature Review
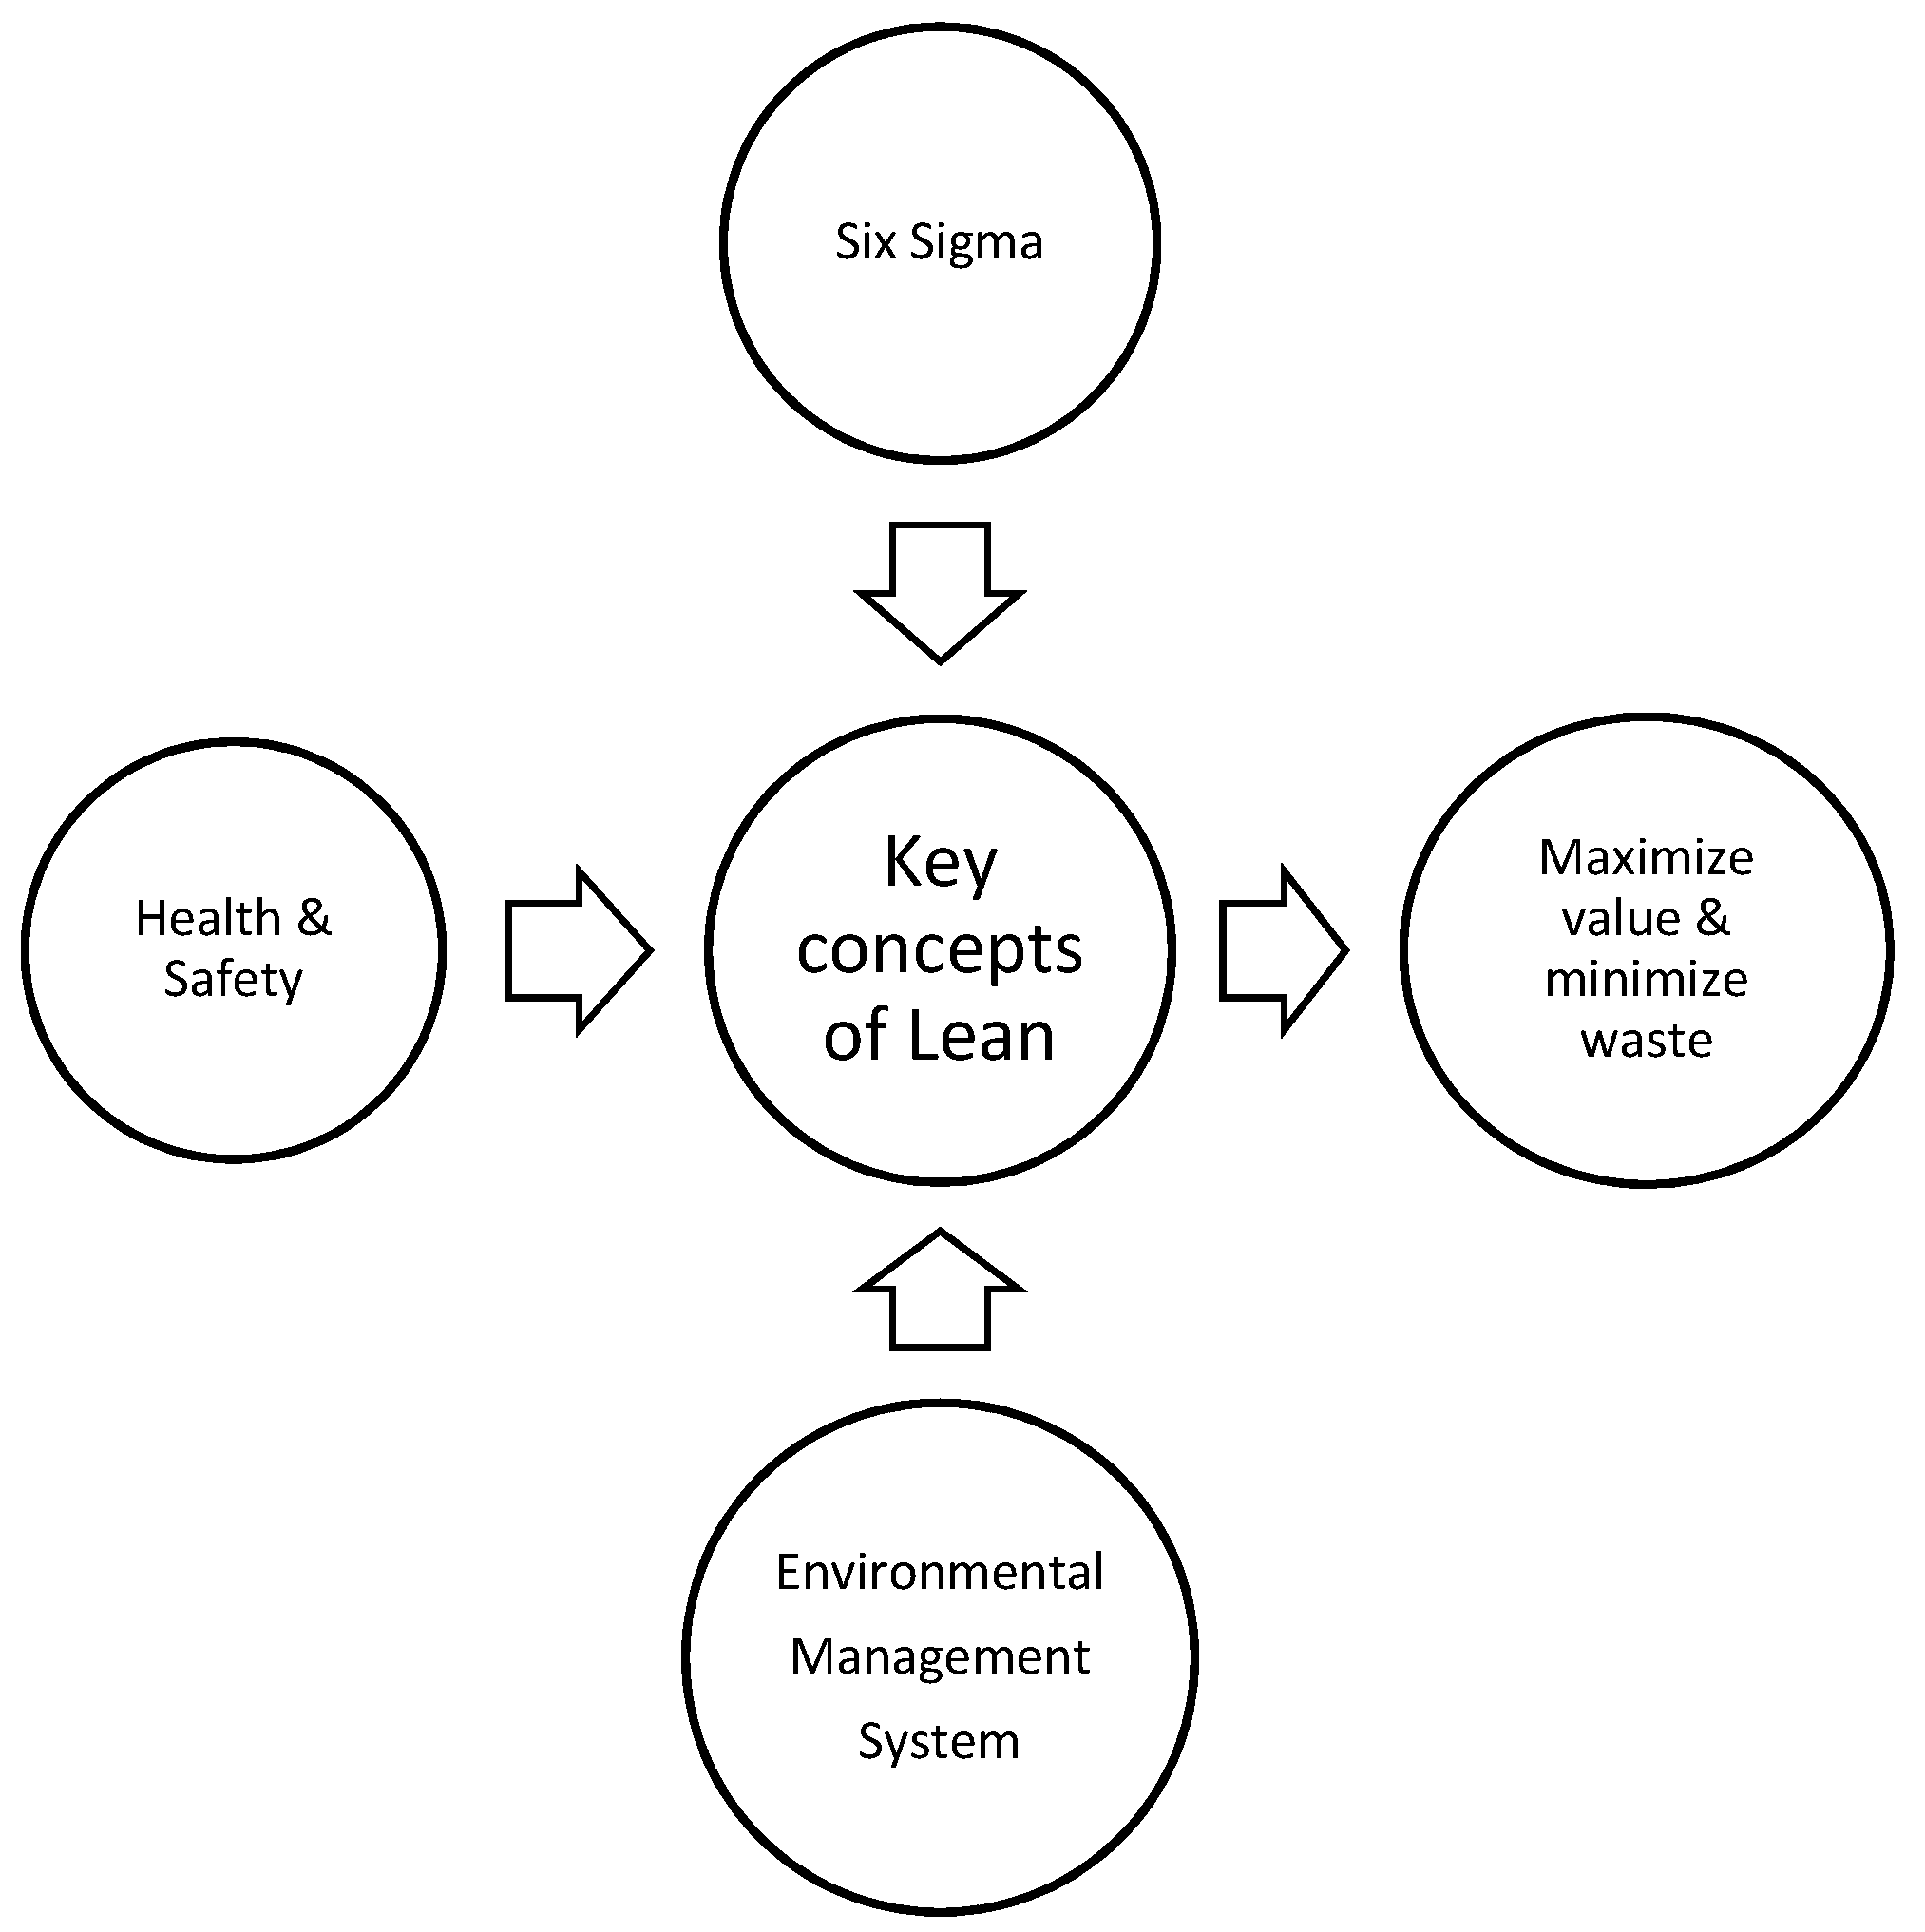
Adopting Lean Construction has significantly impacted the construction industry’s administrative methodologies and project management practices, as seen in Figure 1. Various methodologies and philosophies have emerged from applying Lean principles to construction processes. Some of the notable methodologies and philosophies that Lean Construction has influenced are described in Figure 1:
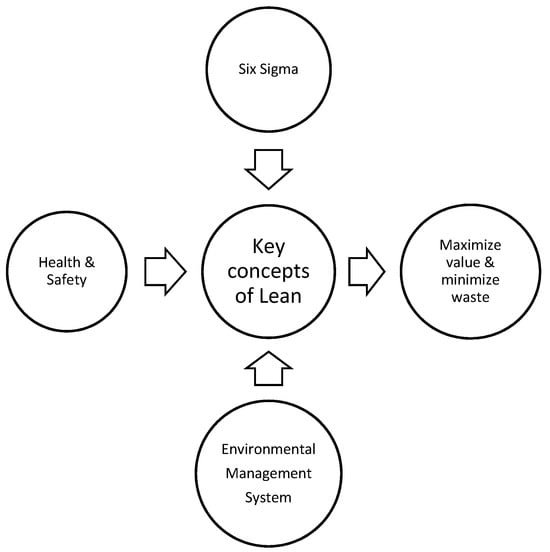
Figure 1.
Key concepts of Lean Construction [14].
Some of the most relevant definitions of Lean Construction had been introduced by Ahmed, Ballard, Li [11,15,16]. These definitions focus primarily on project quality, cost and waste minimization, on-time delivery, and project follow-up.
The goal is to streamline operations, provide value to consumers, foster collaboration, decrease costs, eliminate delays, improve quality, and set the groundwork for ongoing improvement [17]. Lean Construction is a paradigm shift in project delivery focusing on efficiency, value creation, and waste reduction. By implementing Lean principles, construction organizations can improve project performance, decrease delays, cut costs, increase customer satisfaction, and position themselves for success in a highly competitive industry [18].
Using the Lean approach in the construction industry provides numerous benefits that lead to more efficient and successful project management as can be seen in Table 1, this methodology is a relevant topic [19,20,21]. The advantages of the Lean technique and the primary obstacles to its use are covered in this chapter. In order to validate the factors that will be examined in this article, a number of pillar authors are offered in the study of the Lean methodology. These variables only relate to obstacles to implementation.

Table 1.
Lean Construction Benefits. Adapted from Babalola et al. [6].
A number of technical factors must be taken into account while implementing Lean technologies in order to optimize their efficacy and provide notable process improvements, as can be seen in Table 2.
Table 2.
Technical considerations in Lean implementation.
2.1. Barriers in Lean Construction
The adoption of Lean Construction philosophy can face various barriers, and they can be broadly classified into three categories: labor-related barriers, materials-related barriers, and external factors. Albalkhy and Sweis list a series of these categories of barriers [19]. Labor-related barriers face challenges such as resistance to change, lack of training, inadequate collaboration, and employee turnover. In Materials-related barriers such as limited availability of Lean materials and supply chain issues. External factors include project complexity, regulatory and contractual constraints, economic conditions, and industry culture. The internal environment includes a lack of leadership commitment, organizational structure and processes, silo mentality, and performance measurement and incentives [20].
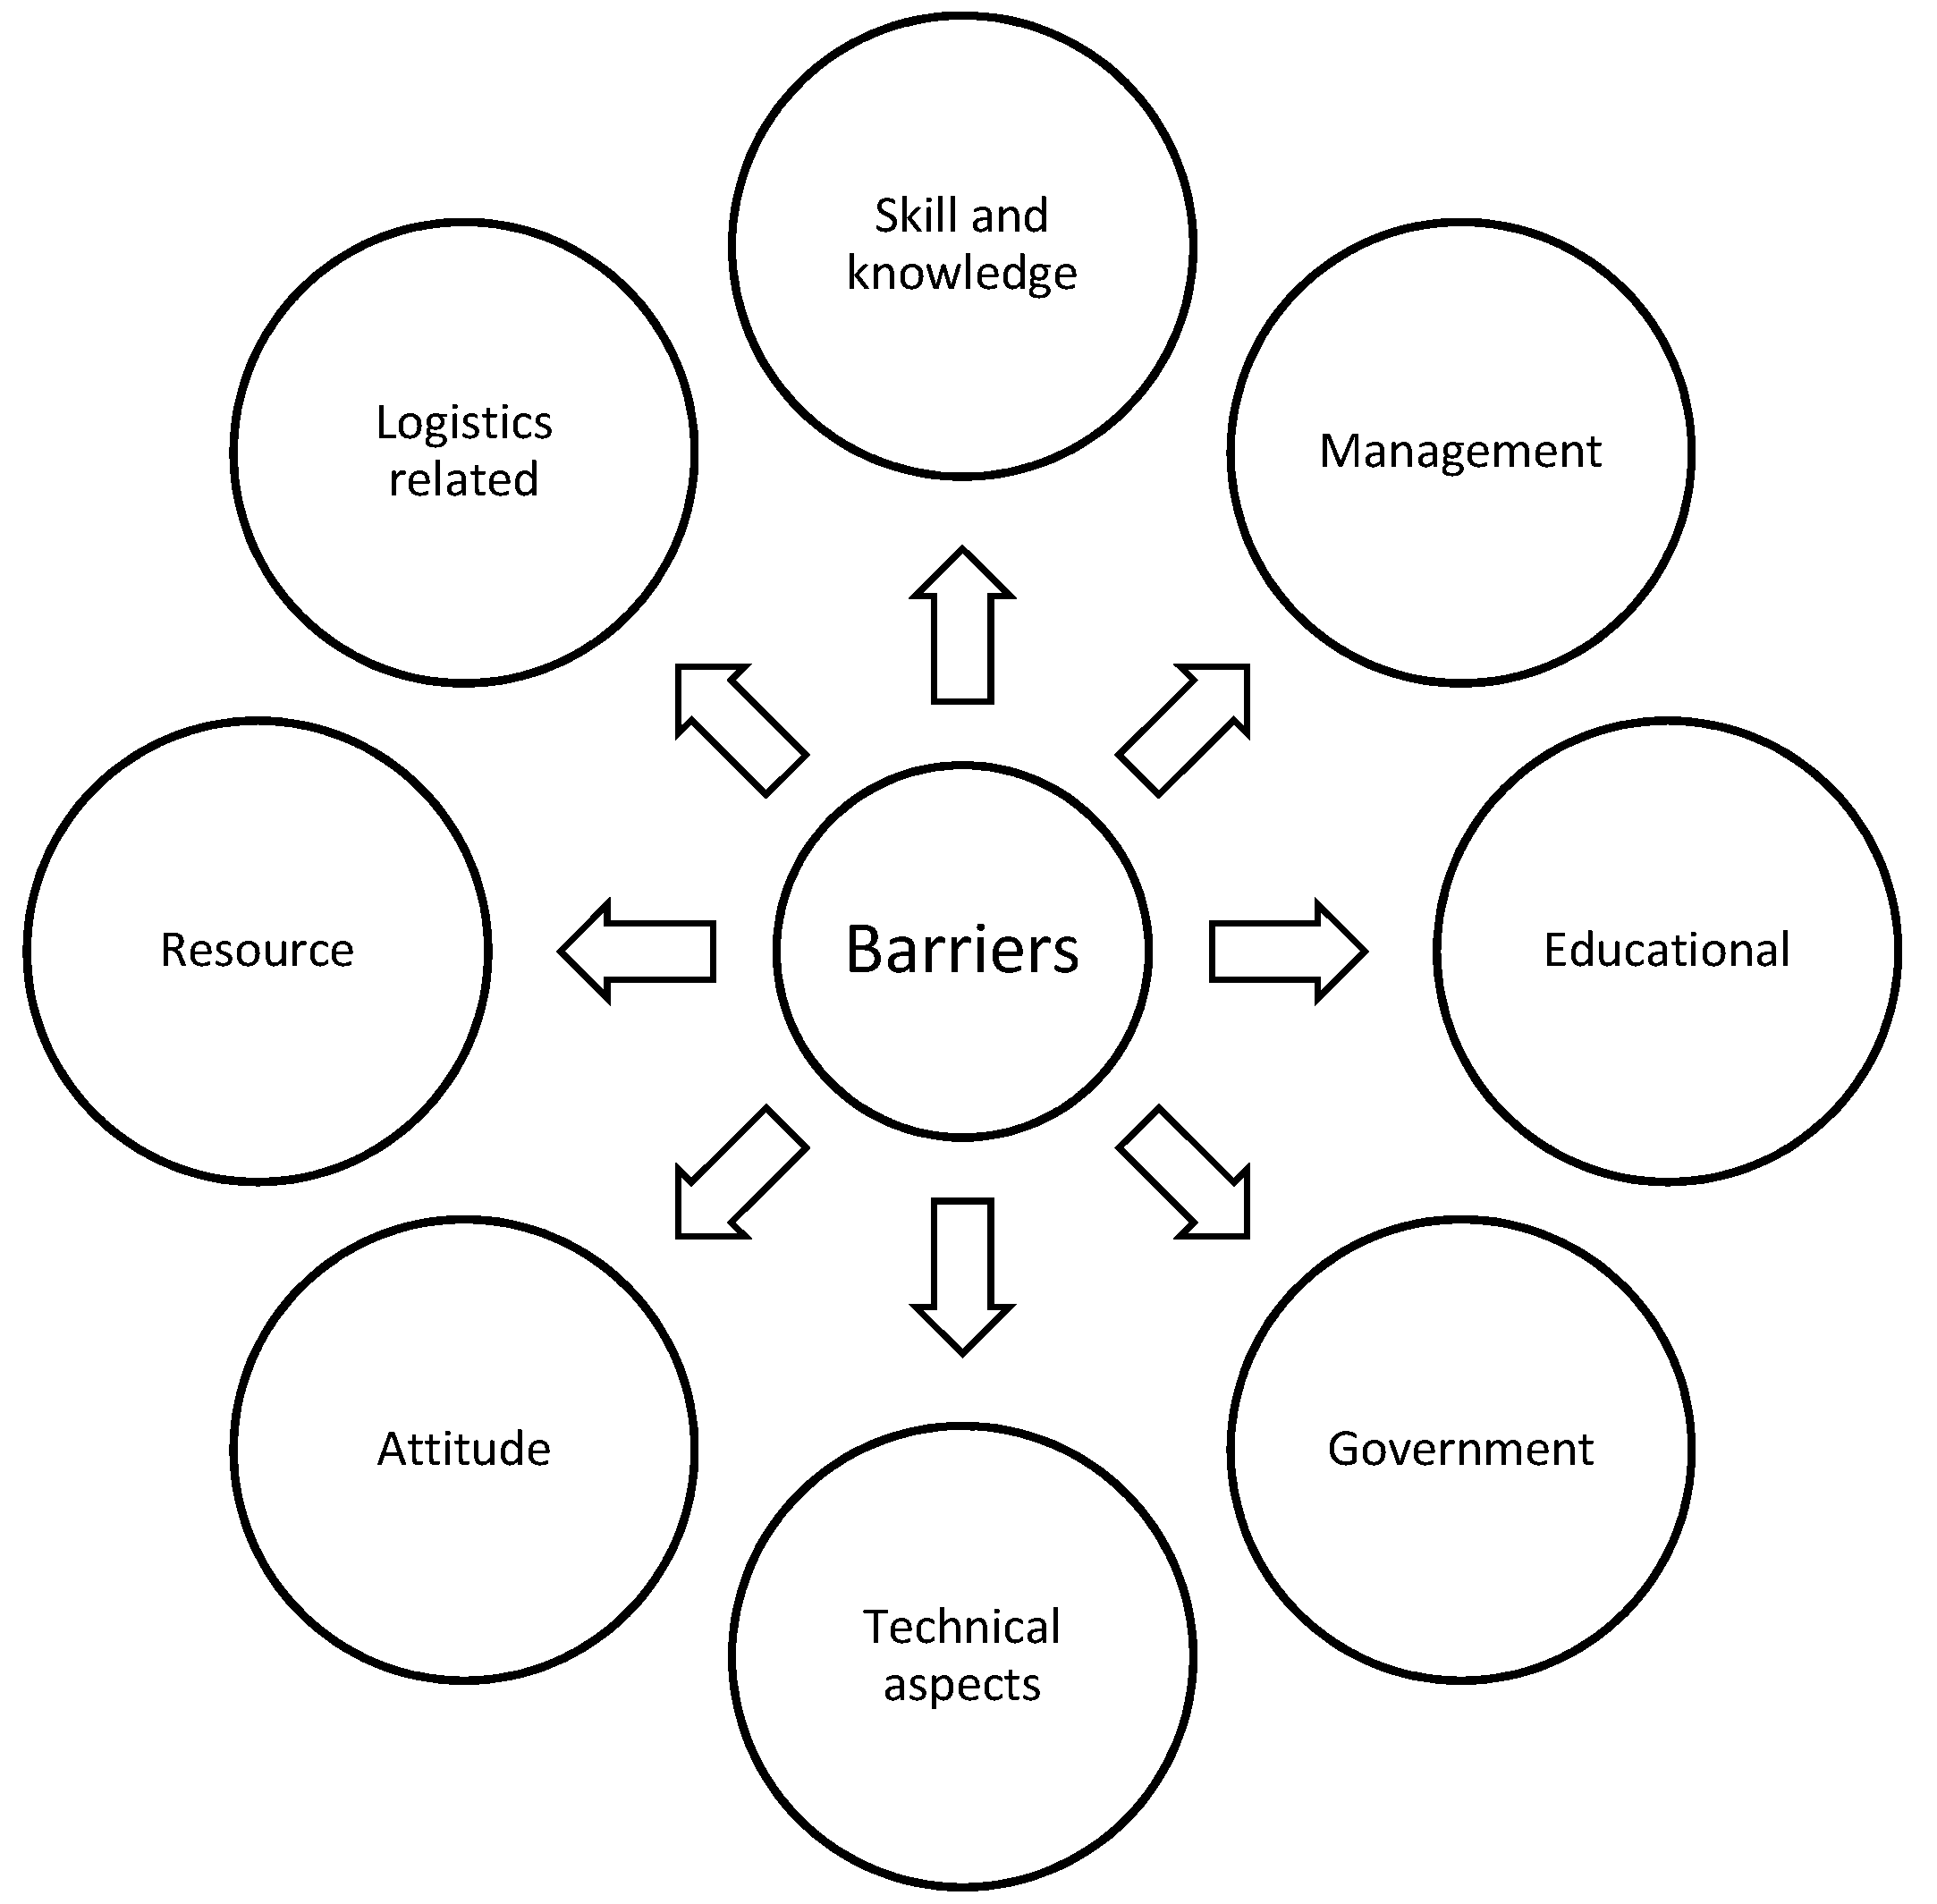
Addressing these financial barriers requires a strategic approach that involves proper financial planning, stakeholder engagement, performance-based incentives, and a focus on the long-term benefits of Lean Construction [21]. Figure 2 shows various barriers to implementing Lean Construction, such as skills and knowledge, worker education, governance, technical aspects, attitude, resources, and logistical aspects [26].
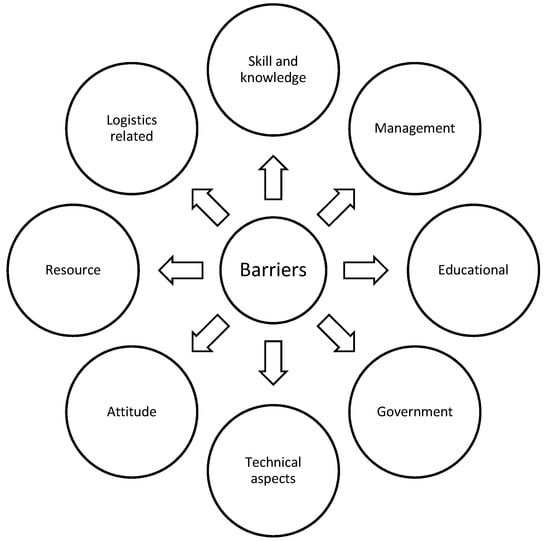
Figure 2.
Different aspects of Lean Construction barriers [26].
Overcoming these obstacles necessitates a methodical and thorough approach that tackles each dimension. Investing in training and education, establishing a culture of continuous improvement, giving leadership support, implementing appropriate technologies, and allocating resources strategically are all examples of what it entails. All stakeholders must work together for successful Lean Construction adoption [24].
2.2. Local Implications Barriers
Adopting the Lean philosophy in the construction industry is driven by competitiveness and the desire to address various challenges and capitalize on opportunities presented by a rapidly changing environment [27].
Embracing Lean practices allows construction companies to navigate the challenges of a rapidly changing environment and position themselves for continued success in the industry, Table 3 shows the main Lean Construction combination factors barriers to consider for Local implications [14].
Table 3.
Lean Construction combination factors. Adapted from Shaqour [14].
These driving reasons contribute to the construction industry’s growing popularity and widespread implementation of the Lean mindset. By addressing these numerous areas, construction firms can improve their project delivery procedures, and overall performance, and gain a competitive advantage in the volatile construction industry by identifying barriers.
For everything mentioned above this work analyzes how the different factors interact in the adaptation of the methodology. If the companies know how these factors are related then will be easier to implement these strategies.
3. Methodology
This chapter’s procedures involved first doing a thorough analysis of the material written by writers who are specialists in Lean Construction, identifying the primary obstacles, verifying the data with a questionnaire administered to Lean industry experts, and acquiring a database, thereafter, PLS-SEM and PCA analysis in Section 4 was made to ascertain the variables’ comprehension as well as the strongest factors and barriers to the adoption of the Lean concept, this process is shown in Figure 3. Numerous studies on the hurdles to Lean Construction adoption can be found in the literature. The present research is focused on Mexican construction companies, where there is no literature on Lean Construction barriers in small and medium-sized companies. A questionnaire was distributed to 120 professionals and individuals from small and medium-sized construction enterprises to validate the variables from the literature and gain information about the Lean Construction barriers that will be used in the PLS-SEM model.
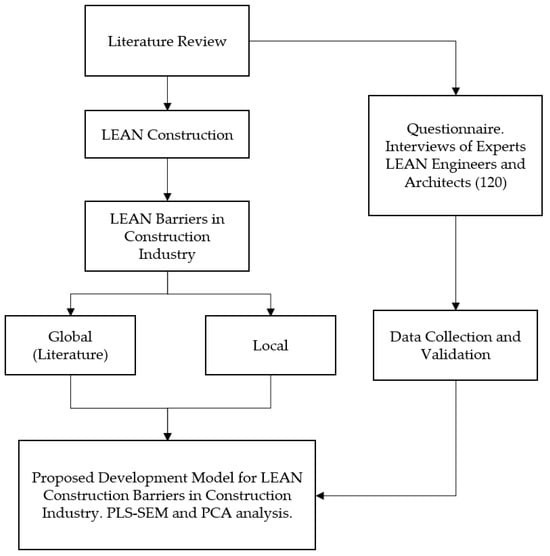
Figure 3.
Methodology Flow.
Prior to data collection and analysis, choosing the appropriate sample size for testing the proposed model is essential. For the present investigation, a sample of 120 specialists in Lean Construction was used with a Likert scale, only specialized architects and engineers were selected and accustomed to the use of the Lean methodology in their processes, constructions, and offices. The main justification of why this size of companies was selected is based on the work of [28,29] declaring that, adopting PLS-SEM (Structural Equation Modeling) in construction management in small or medium sample sizes is adequate for this methodology.
Considering the nature of the data we selected PLS-SEM method to analyze it. PLS-SEM is not a requirement that the dataset fully meets the assumptions of multivariate normality and linearity. This method is more robust against such assumptions and is particularly suitable for non-normal data and small sample sizes.
The research purposes focused on understanding the underlying relationships among latent variables and exploring possible complex structural models. PLS-SEM is better suited to these objectives as it excels in modeling non-linear relationships and effectively capturing latent components.
The primary formulation methodology for this study involved identifying the primary Lean Construction (LC) barriers via reputable study authors. Following the acquisition of these barriers, a questionnaire was developed to validate the variables with specialists in Mexico’s construction sector and the understanding of these barriers. Following the use of the measurement instrument, a database was obtained, enabling the construction of a PLS-SEM model to determine the degree of variable interaction with respect to these barriers. Finding construction industry specialists who understood the principles of LC and obtaining the necessary minimum sample size to implement the PLS-SEM approach were the primary application limitations.
3.1. PLS-SEM Method
The analysis of this model utilized Partial Least Squares (PLS) as a method. In recent times, PLS-SEM has gained prominence due to its numerous advantages, particularly in predicting latent variables. Structural equation modeling involves constructing models that connect criteria and concepts using arrows to define interrelationships between factors. As a modeling technique based on structural equation theory, PLS-SEM focuses primarily on predictive causal analysis supported by variance through modeling between parameters and their indicators, effectively assessing cause-and-effect relationships [30].
Structural Equation Modeling (SEM) is categorized into two primary types: measurement and structural models. These tools enable the representation of reality through increasingly intricate models, with techniques such as structural equation modeling facilitating multiple regressions between latent variables. Scholars have increasingly turned to PLS-SEM as it facilitates the modeling of factors and variables that are challenging to observe directly [31,32].
It is important to note that the relationships hypothesized between measurements and latent variables are guided by existing literature and theory. Adamy and Bakar [33] emphasize that PLS-SEM can be employed effectively in the construction industry to analyze correlations among factors, particularly when the model is innovatively used to measure variables that are inherently difficult to observe. Ingle and Mahesh [34] further underscore that applying PLS-SEM as an analytical method allows for observing how results can guide construction management, enhancing project performance, competitiveness, and aiding decision-making.
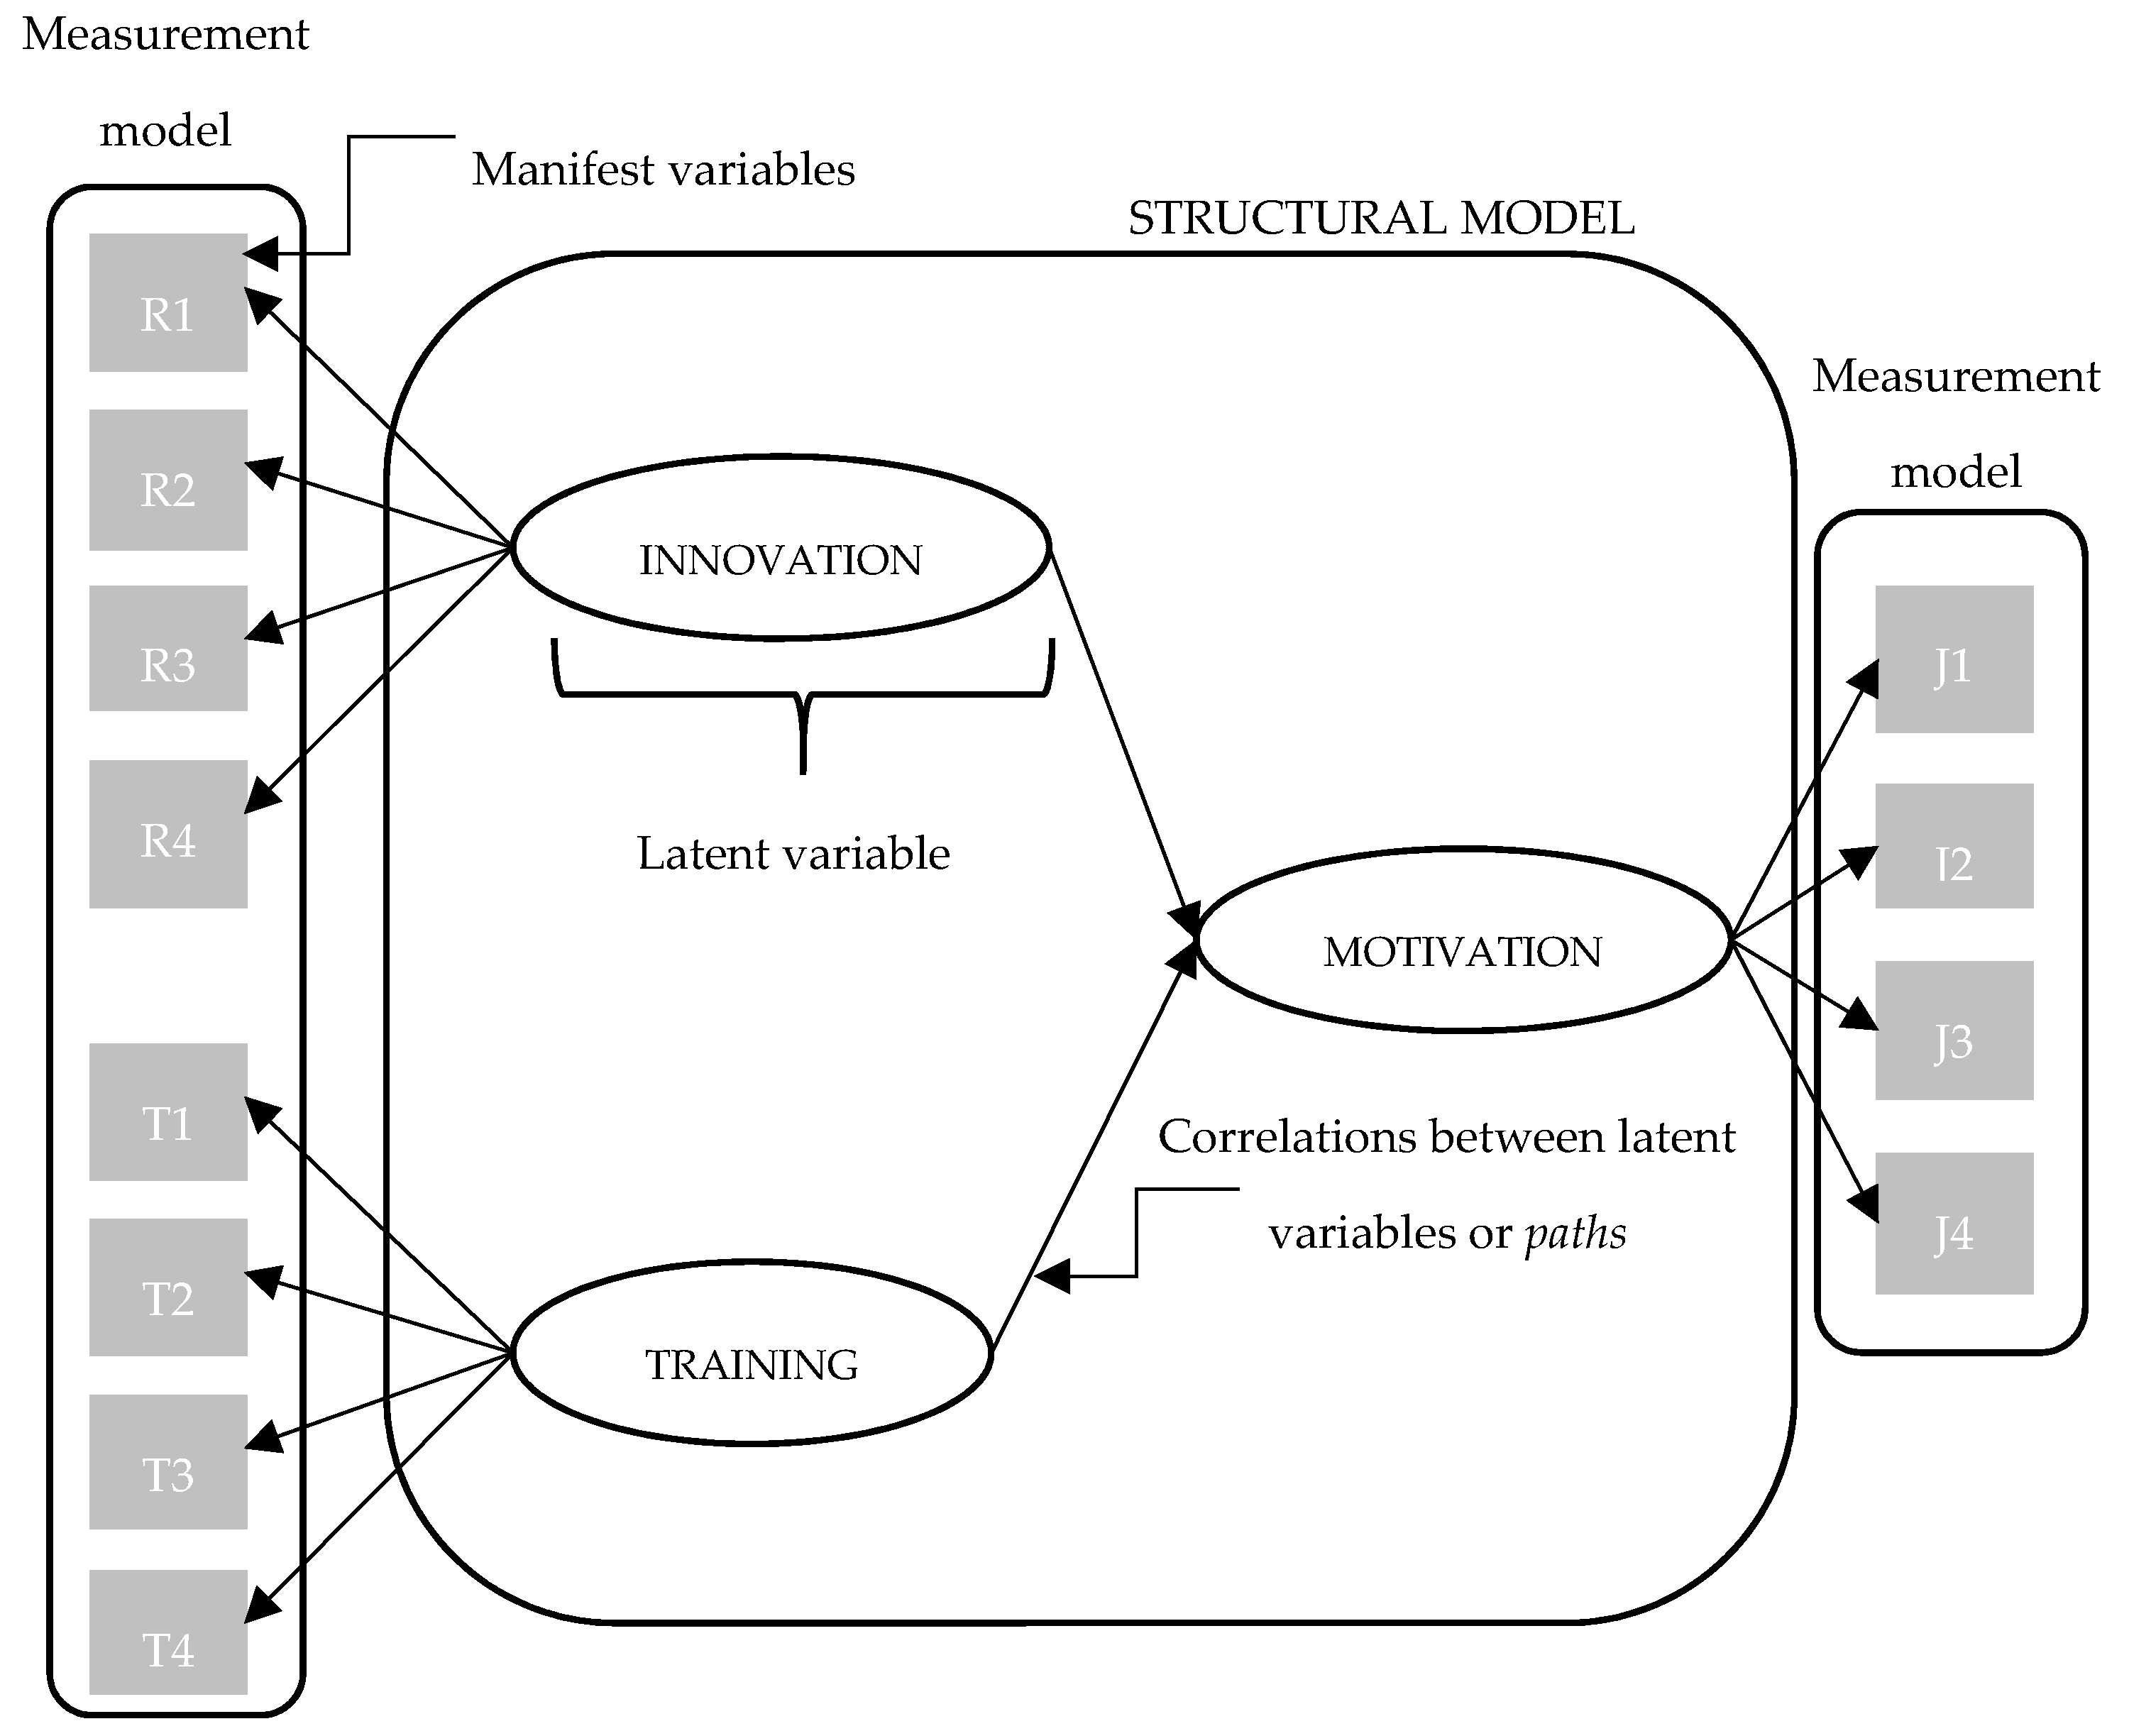
As depicted in Figure 4, the PLS-SEM model adheres to the structure proposed by Chin [30]:
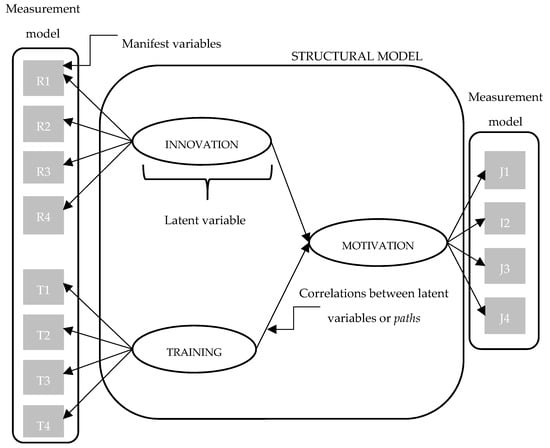
Figure 4.
PLS-SEM Structure [35].
- Rectangular forms represent manifest variables.
- Ovals represent latent variables.
- Relationships between variables are represented by straight arrows (paths).
PLS-SEM is a statistical method extensively used for regression analysis and structural equation modeling. It is particularly well-suited for situations involving several variables with complicated interrelationships and a limited sample size [36]. Dealing with multicollinearity or small sample sizes, PLS-SEM can manage scenarios where classic regression methods’ assumptions may not be met [37]. Some of the benefits and attributes of the PLS-SEM method are listed in Table 4.
Table 4.
Summary of the PLS-SEM attributes. Adapted from Barroso Castro et al. [38].
SEM is appropriate when complex models are analyzed, when prediction is the focus of the research—particularly out-of-sample prediction to support external validity, when data do not meet normal distribution assumptions when formative constructs are included, and when higher-order constructs facilitate a better understanding of theoretical models [31,39].
3.2. Proposal Lean Construction Barrier Model
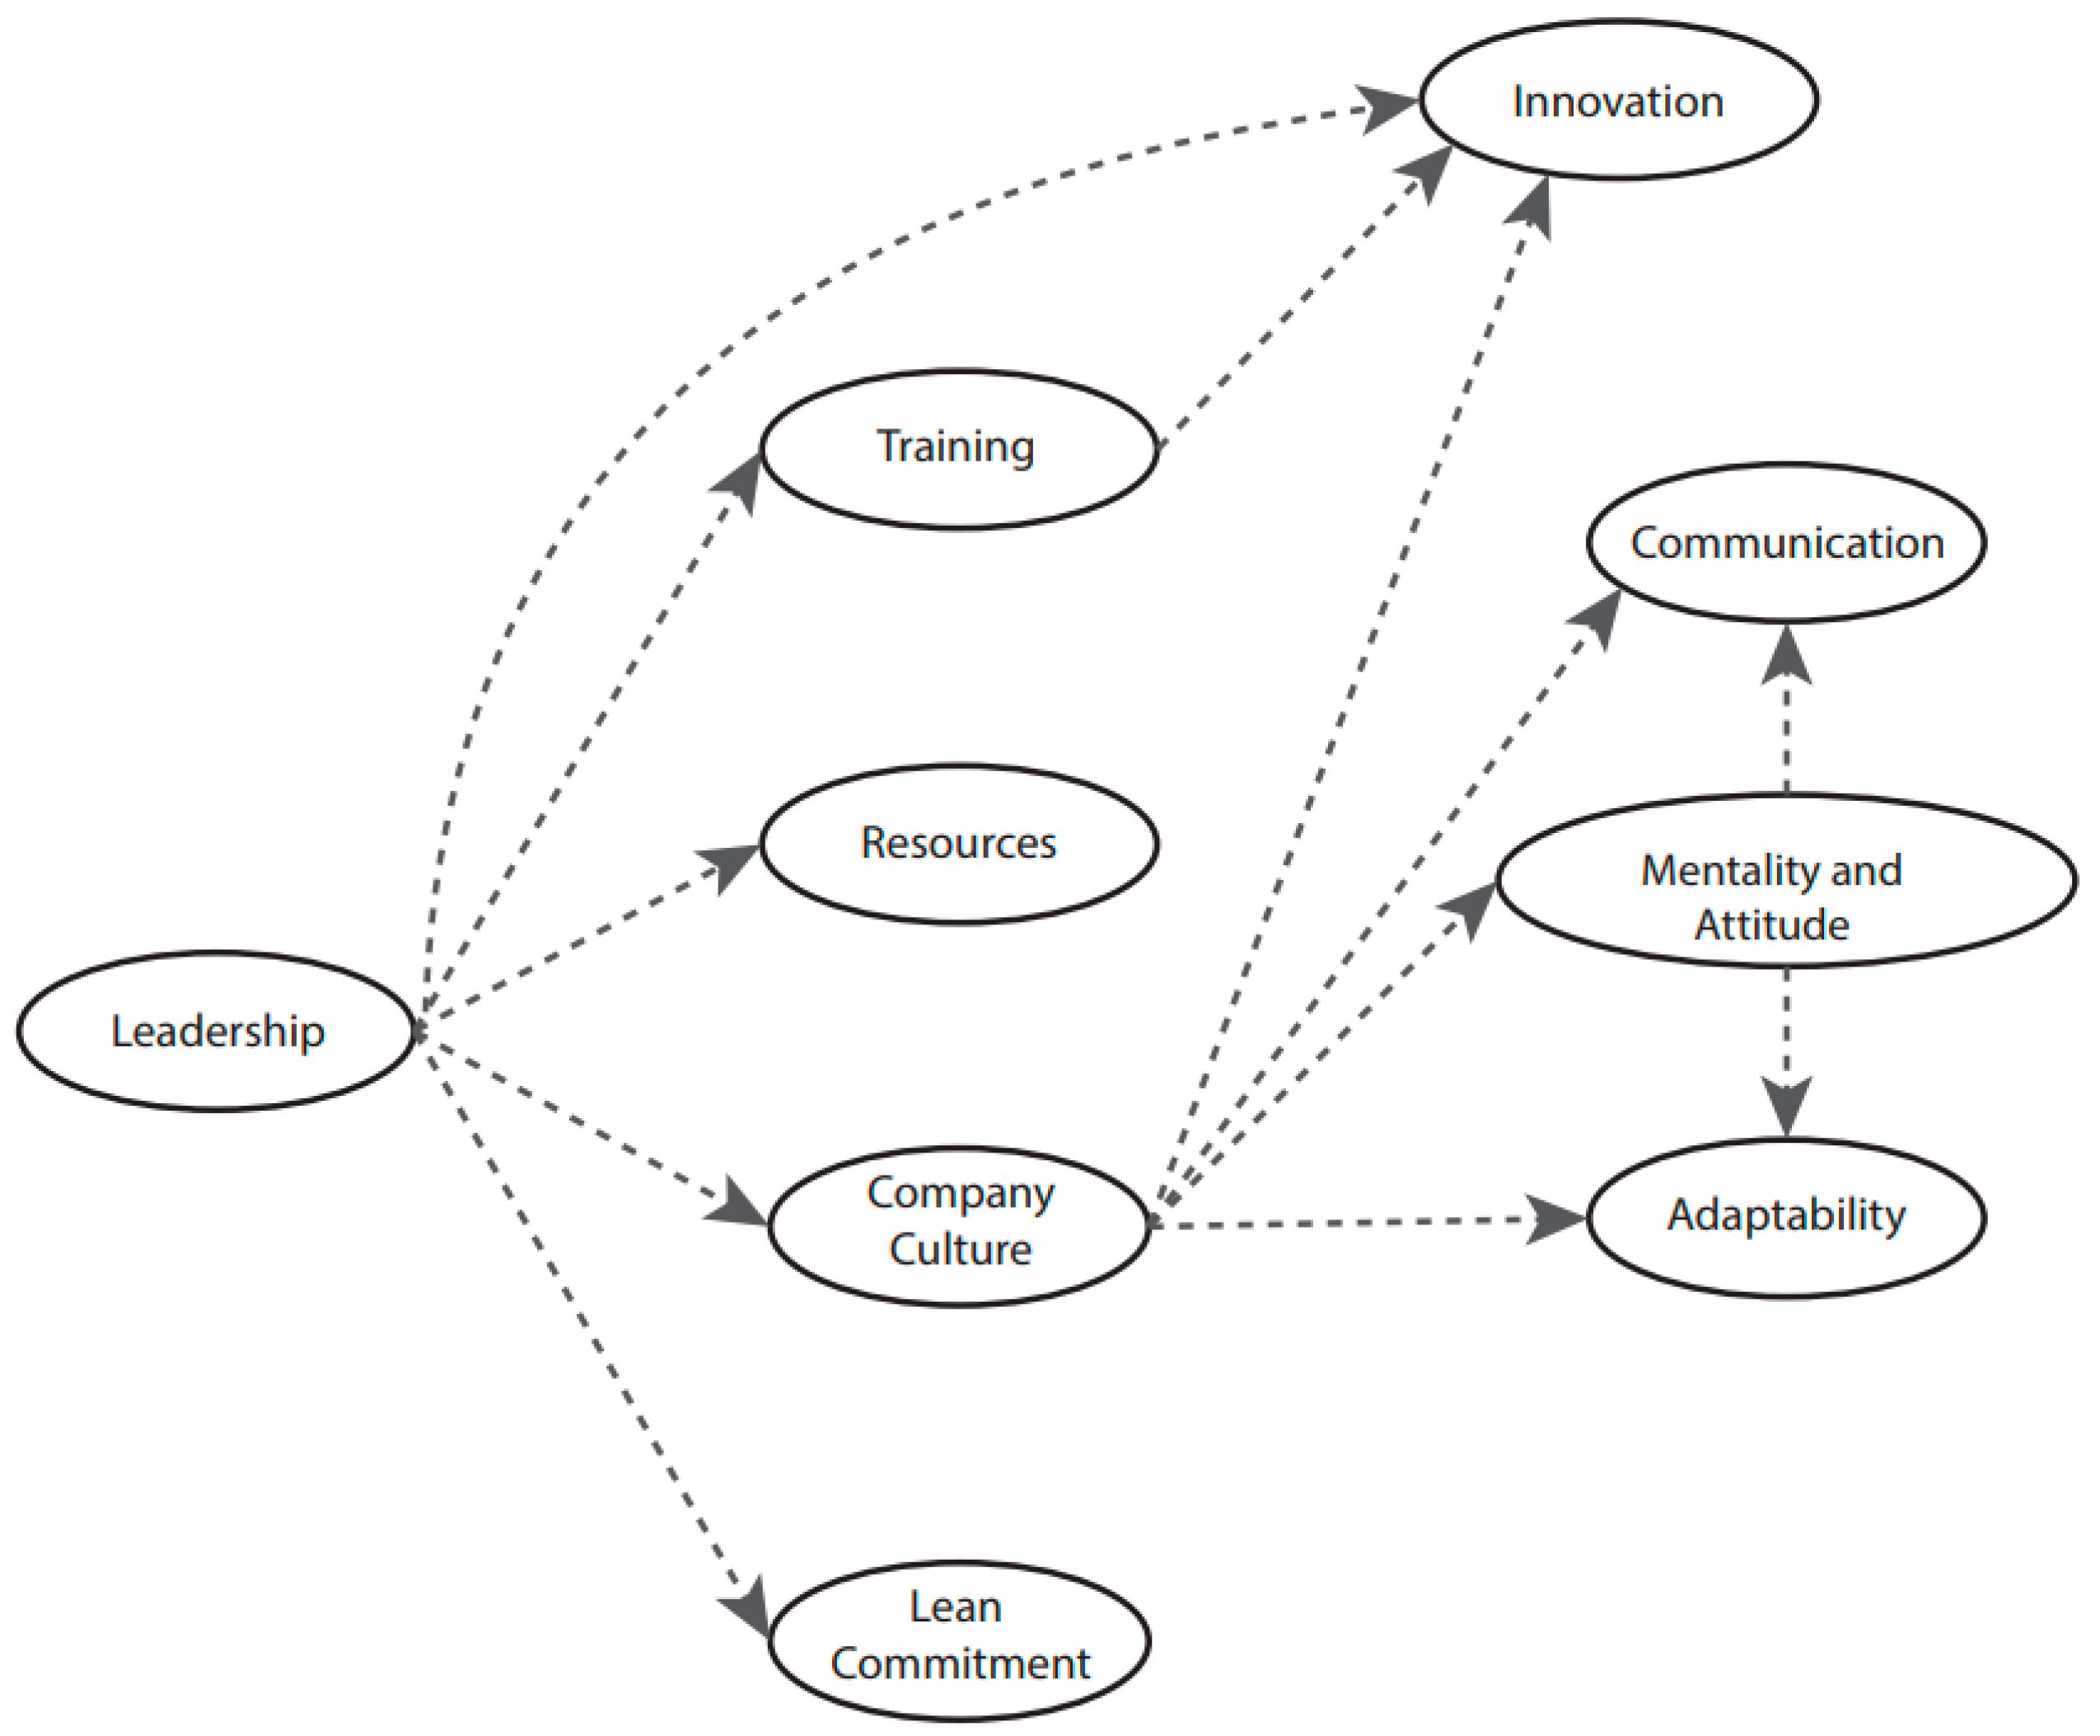
Falk & Miller (1992) [40] add that it is very important to first make a nomogram, a graphical representation of the relationships between variables, illustrated by a simple generic model with two constructs. Figure 5 depicts the suggested model, which tries to understand the interrelationship of variables that interact in Lean Construction Barriers. Many of these interrelationships are based on research and literature, while others are speculative. It is critical to note that this is a confirmatory model, meaning it will only affirm if the parameters meet the overall evaluation requirements. The variables of the proposed model represent the summary of the literature review regarding the main barriers to implementing Lean Construction. The selection of variables identified as barriers was based on a rigorous methodological approach that involved a comprehensive review of the existing literature on Lean in the construction industry. During this review, numerous previous studies addressing common difficulties and obstacles associated with adopting Lean principles in construction projects were identified. The selected variables were carefully chosen based on their relevance in the literature and their significance in the context of Lean implementation in construction. Furthermore, they were evaluated considering their ability to represent a wide range of challenges that construction professionals might face when adopting Lean approaches in their projects.
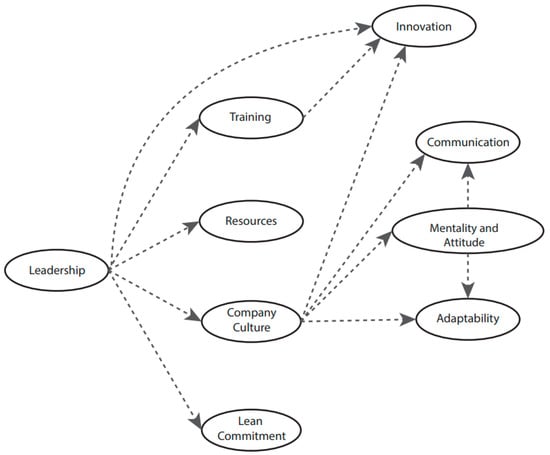
Figure 5.
Proposal Lean Construction Barriers model.
The variables selected to analyze Lean implementation barriers through PLS-SEM are Training, Communication, Adaptability, Company Culture, Mentality, Innovation, Leadership, Commitment, and Resources.
3.3. Indicators of the Measurement Model
Analyzing the item’s individual dependability, a scale’s internal consistency or reliability, convergent validity, and discriminant validity are all part of evaluating the measurement model. In a PLS model, individual item reliability is assessed by examining the loadings (, or simple correlations, of the measures or indicators with their respective construct. Loads ( refer to correlations between a latent variable and its manifest variable(s). A PLS model assesses the variables’ reliability by examining the measures, indicators’ loads, or simple correlations, with their respective latent variable.
Accordingly, refs. [38,41] the rule (which states that an indicator must have at least 0.7 loads to be considered as a member of a construction) is the most widely recognized and applied empirical research guideline. The close link between variables is explained by loads. For example, if a Load of 0.3025 is found, this indicates that the latent variable accounts for only 30% of the variance in the apparent variable. This suggests that the error variance is smaller than the shared variance of the construct and its indicators. Given that the loadings are correlations, a level of 0.707 or above indicates that the construct shares more than half of the variance of the observed variable. As can be seen in Table 4 the great majority of the variables satisfy the previously stated requirements.
3.4. Indicators of the Structural Model
The PLS (Partial Least Squares) model provides a structural framework for illustrating how the latent variables suggested in the conceptual model are interconnected. To create precise predictions regarding the correlations between variables, the PLS model primarily functions as a variance-based predictive model, which is important to note. Therefore, the PLS model’s validation method focuses primarily on its predictive skills, assessing how well it can foresee and explain fluctuations in the observed data [42,43].
The R2 value for dependent latent variables in a model is a gauge of its predictive ability, the coefficient of determination only applies to endogenous latent variables or dependents. The coefficient of determination measures the variance in the endogenous latent variable explained by its independent latent variables through the proposed model. The endogenous variables’ explained variance ought to be more than or equal to 0.1. The relationships that are developed as hypotheses in respect to this latent variable have a very poor predictive level, they point out, because values less than 0.1, despite being statistically significant, convey very little information [38].
According to Barroso, the PLS model lacks a firmly established universal optimization criterion, which results in the lack of a single all-encompassing adjustment function for assessing the model’s overall Goodness of Fit. Additionally, because it is a variance-centric model created for predictive purposes, its validation mostly focuses on its ability to make predictions [44,45]. Cronbach’s alpha and Dillon-Goldstein rho are reliability coefficients used to assess the internal consistency of a set of items or variables in a scale or instrument.
An effective measure of internal consistency and reliability is Cronbach’s alpha. It gauges how closely scale or survey questions relate to one another and aids in a precise evaluation of the underlying component. Cronbach’s alpha ranges from 0 to 1, with higher values indicating greater internal consistency. It is generally agreed that a Cronbach’s alpha value of 0.70 or higher is suitable for most research needs [46].
Cronbach’s alpha and Dillon-Goldstein rho detail how closely a scale’s elements reflect a common underlying construct. Researchers frequently use these coefficients to assess a scale’s or instrument’s consistency and reliability in the target idea. Even though these coefficients offer insightful information on internal consistency, it is vital to keep in mind that they do not account for other aspects of validity, such as content validity or criterion validity [47].
4. Analysis and Results
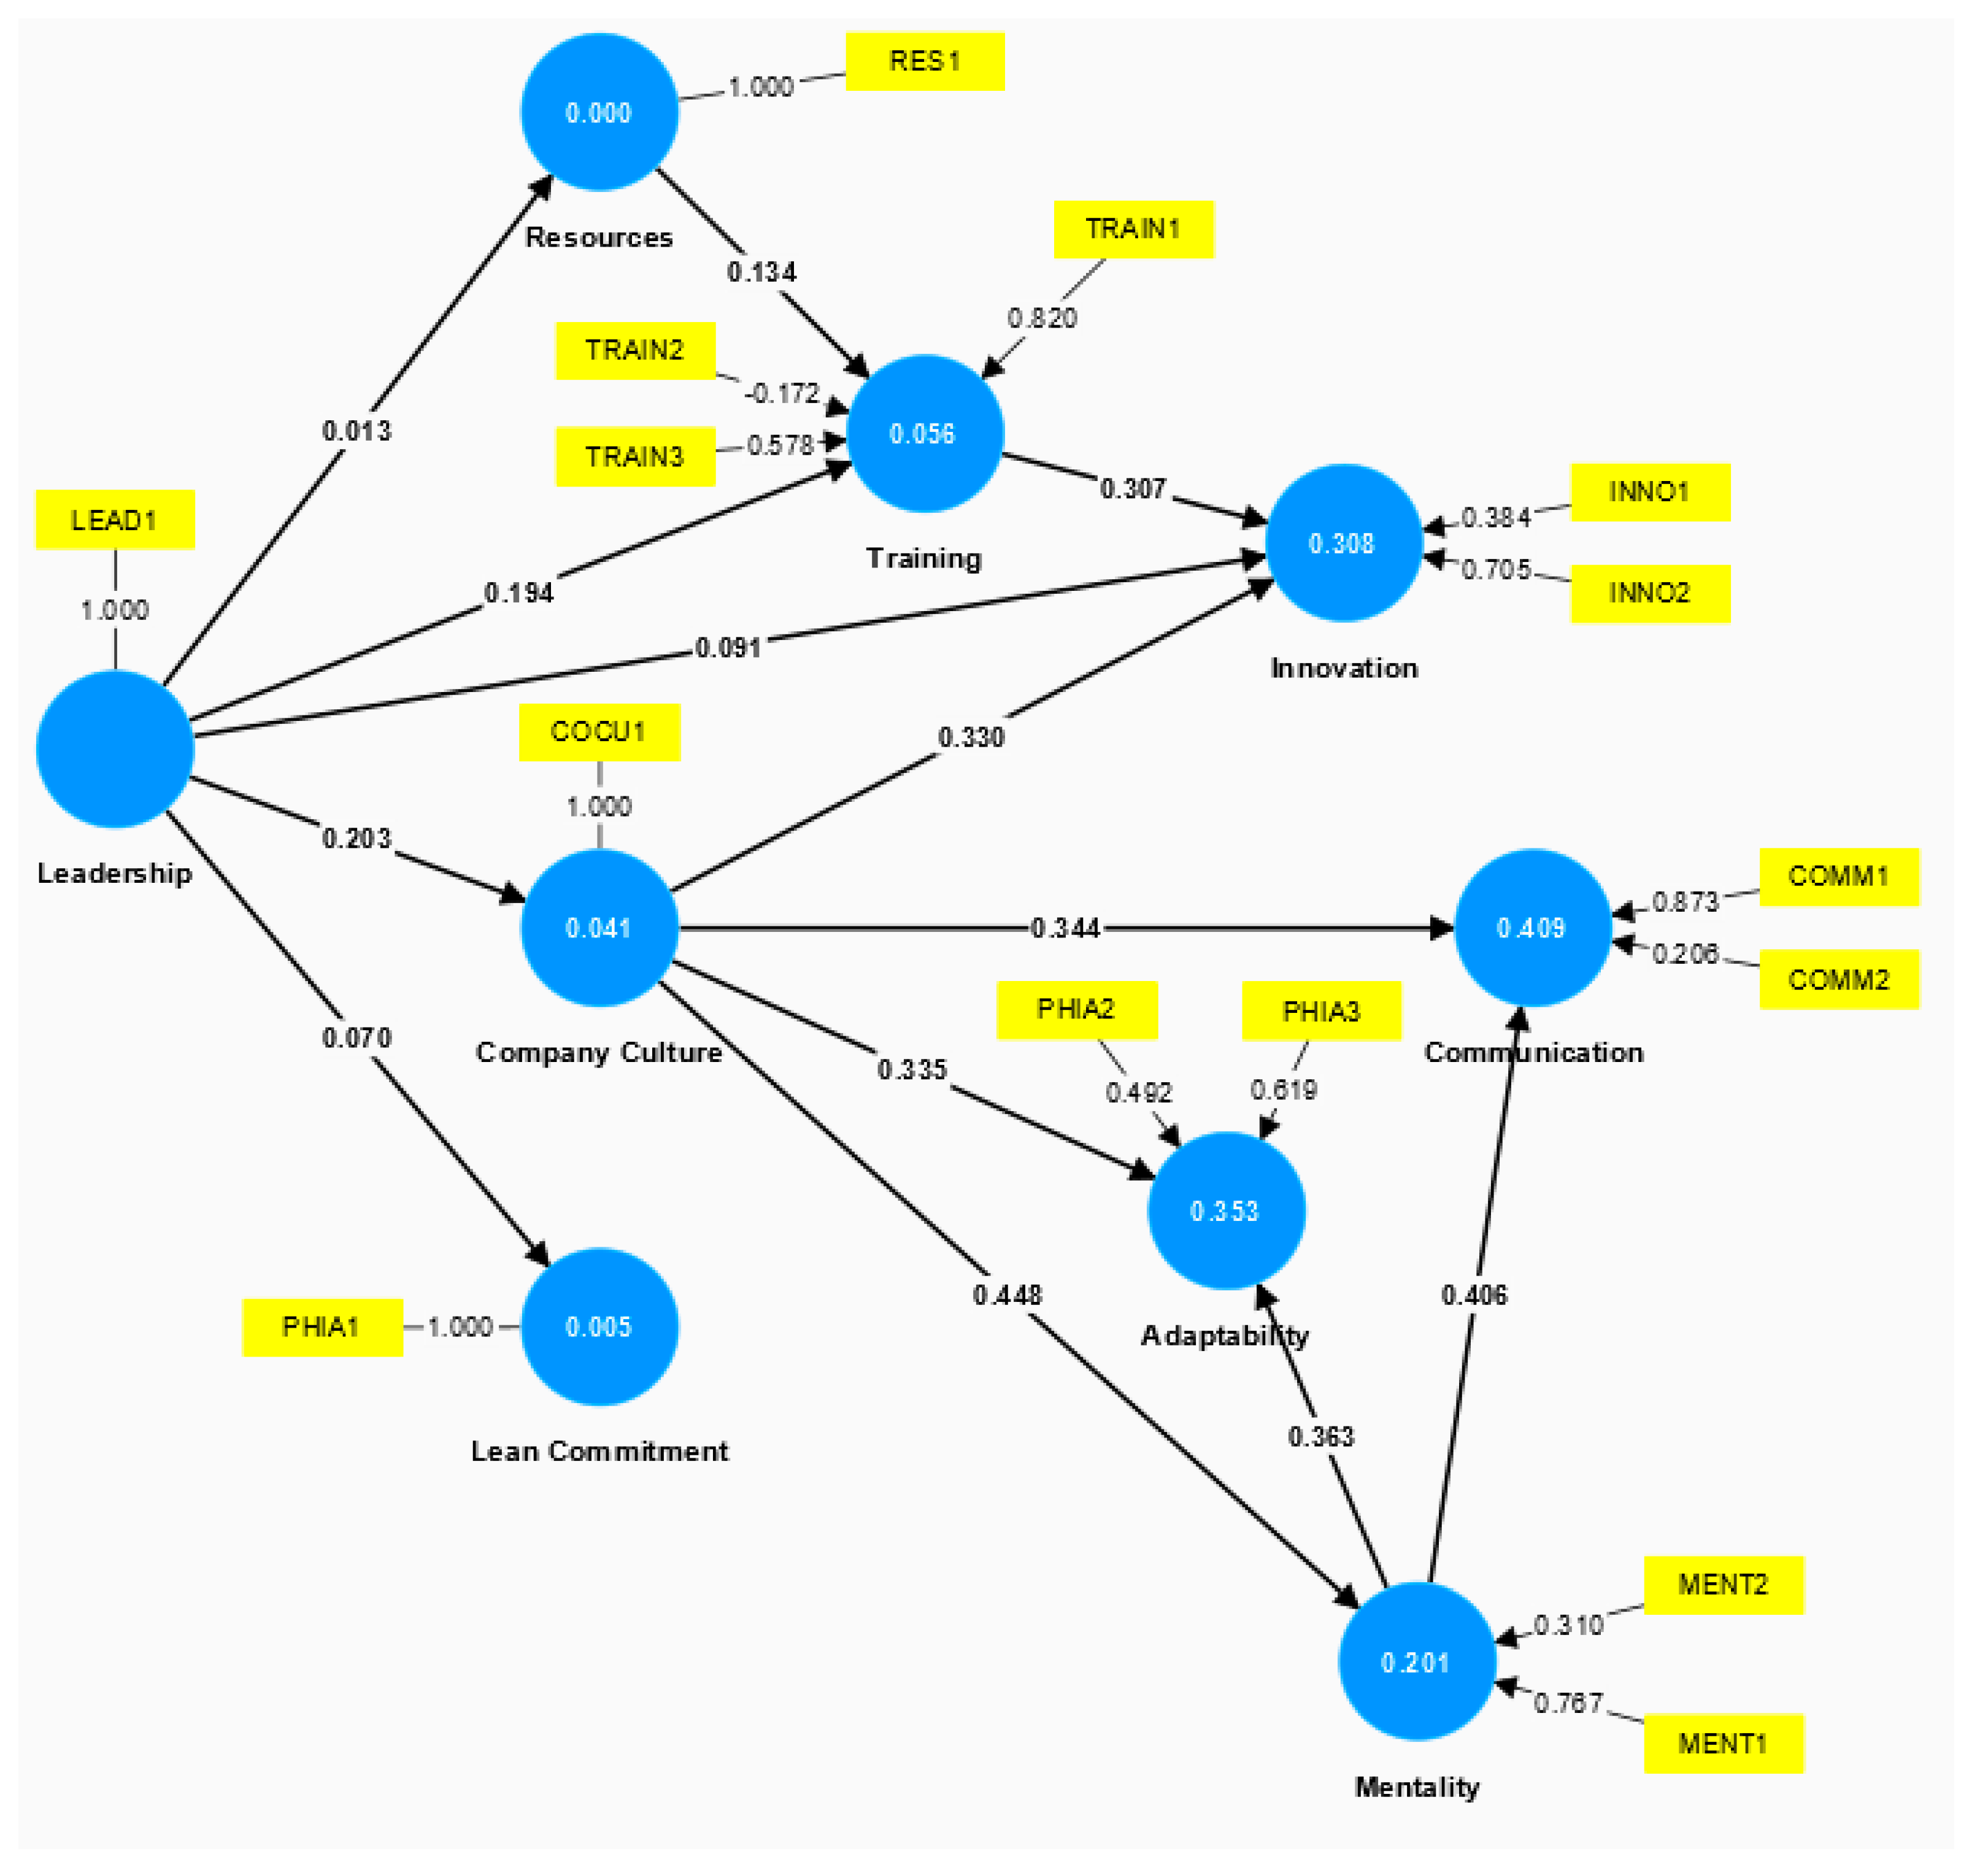
Once the questionnaire was applied inquiring about the employees’ perception of the barriers established in Figure 3, the statistical analysis was carried out, Figure 6 shows how these variables are related and the principal indicators among them.
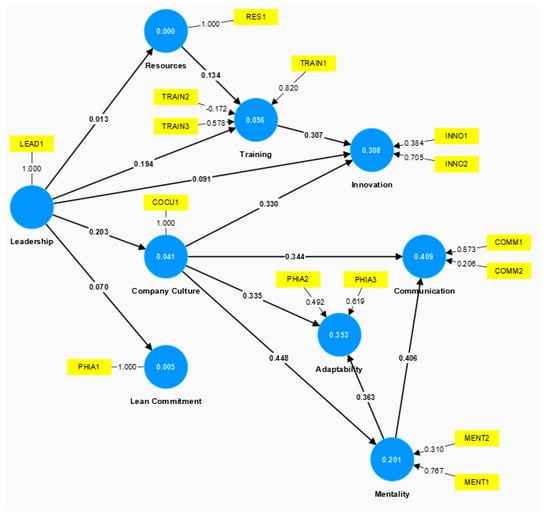
Figure 6.
PLS Diagram for Lean Construction Barriers.
We conducted the partial least squares structural equation modeling (PLS-SEM) analyses using the software SMARTPLS (version 4, SmartPLS GmbH, Bönningstedt, Germany).
Table 5, Table 6 and Table 7 show the behavior of the loadings, path coefficients, and the . In Table 4 is possible to observe the high correlation between the identification of employees with the company culture; communication of workers within the company, with the customers; customers’ demands with the difficulty of implementing the methodology; innovation with the ability to propose new ideas; support from management for employees in suggesting proposals; leadership with the perception of the workers about it; leadership and the correct implementation of Lean; mentality with the average mentality of the worker and the attitude of the workers; philosophy with the company’s commitment in Lean, with company’s adaptability to new strategies and the adaptability of the workers to new ways of working; resources for the company’s investment to implement Lean; time as a barrier to implement the methodology; training as an important point to implement the methodology and achieve success in the implementation.
Table 5.
Loadings.
Table 6.
Path coefficients.
Table 7.
Path coefficients .
From Table 6, is possible to observe that barriers are not correlated between them. Each aspect measures only the variables involved in each item. As can be seen in Figure 6 and Table 6, the path coefficients show path coefficients, these coefficients show the interrelationship of the Lean Construction variables, highlighting interrelationships such as Company Culture with Mentality, with a value of 0.448, Mentality with Communication with 0.406, Mentality with Adaptability with 0.363, Company Culture with Communication with 0.344. The Leadership variable is one of the most relevant as it has a greater amount of impact on the other variables. Good leadership in the company has a positive impact and pushes all other variables.
The criterion mentions that a value above 0 indicates that the model’s predictability is relevant, which is a predictive measure in the model. Otherwise, if the value of a dependent variable is greater than 0, then the model may account for a portion of its variation. It is important to keep in mind that a model does not always indicate that it is unimportant or meaningless just because its value is 0. All that signifies is that there isn’t any variance that the model can explain. In a similar vein, an value of 1 indicates that the model correctly predicts the dependent variable from the independent variable or variables [30,48].
Table 8 shows the internal consistency of the variables, it measures how closely scale or survey questions are related to each other, and in this case, all variables present a high consistency.
Table 8.
Cronbach’s Alpha.
The PLS-SEM model is examined in light of several variables. One of these is the Goodness of Fit index (GoF), which is better the higher it is, even if there is no set optimal value. When PLS-SEM is used, Tenenhaus et al. introduced a global criterion called the GoF index, which takes into account both the structural model and measurement and yields a single number representing the overall quality of the model [43].
The model’s validity % is used to represent the GoF index. The Goodness of Fit of the current PLS-SEM model is 84%. Similar to the GoF percentage found in this study, other writers who have used the PLS-SEM approach to analyze competitiveness in the Chilean construction industry, such as Orozco [2], have also found success. Additionally, it is both equal to and higher than the GoF that Duarte & Raposo [32] found in their study on telephone market analysis.
Based on the preceding criterion, the GoF produced here is deemed acceptable, indicating that the model functions generally and responds statistically in an appropriate manner, with accurate measurement of both its manifest and latent variables.
Table 9, shows statistical measures, the mean and the standard deviation for all variables are presented. All variables presented a high evaluation. The calculation of the mean and standard deviation for Likert-scale responses is a common and valuable practice in survey research and social science studies. Here are the reasons for using these measures: The mean allows us to summarize the central tendency of participants’ responses. It provides insight into the overall sentiment or opinion of the respondents regarding the items being evaluated. For instance, a high mean suggests a consensus of agreement, while a low mean indicates disagreement or neutrality. The standard deviation measures the spread or dispersion of responses around the mean. A low standard deviation implies that most participants’ responses are clustered closely around the mean, indicating a high level of agreement or consensus. Conversely, a high standard deviation suggests that responses are more spread out, indicating greater variability in opinions among participants. It is important to remember that the closer it is to 7 (maximum score), people agree with the importance of each variable in the implementation of Lean Construction and the importance of controlling these variables to achieve a better implementation of the methodology.
Table 9.
Statistical measures.
Another interesting analysis was carried out. It was selected according to the coefficient of Cronbach’s Alpha and the mean one variable for each factor. To measure leadership was selected question 3, for customer demand was selected question 2, resources were measured with question 1, culture with question 1, philosophy was analyzed with question 1, communication using question 2, training was used with question 2, and time was analyzed with only question, innovation with question 2 and finally mentality was measured with question 2. With these variables was carried out a Principal Component Analysis.
A Principal Component Analysis (PCA) is a mathematical statistical model to decrease the number of variables (dimensions) and the complexity of a problem and to find linear relations among variables. This is achieved by creating new variables (principal components, non-correlated among them). The objective of PCA is to explain the maximum amount of variance in the fewest number of components.
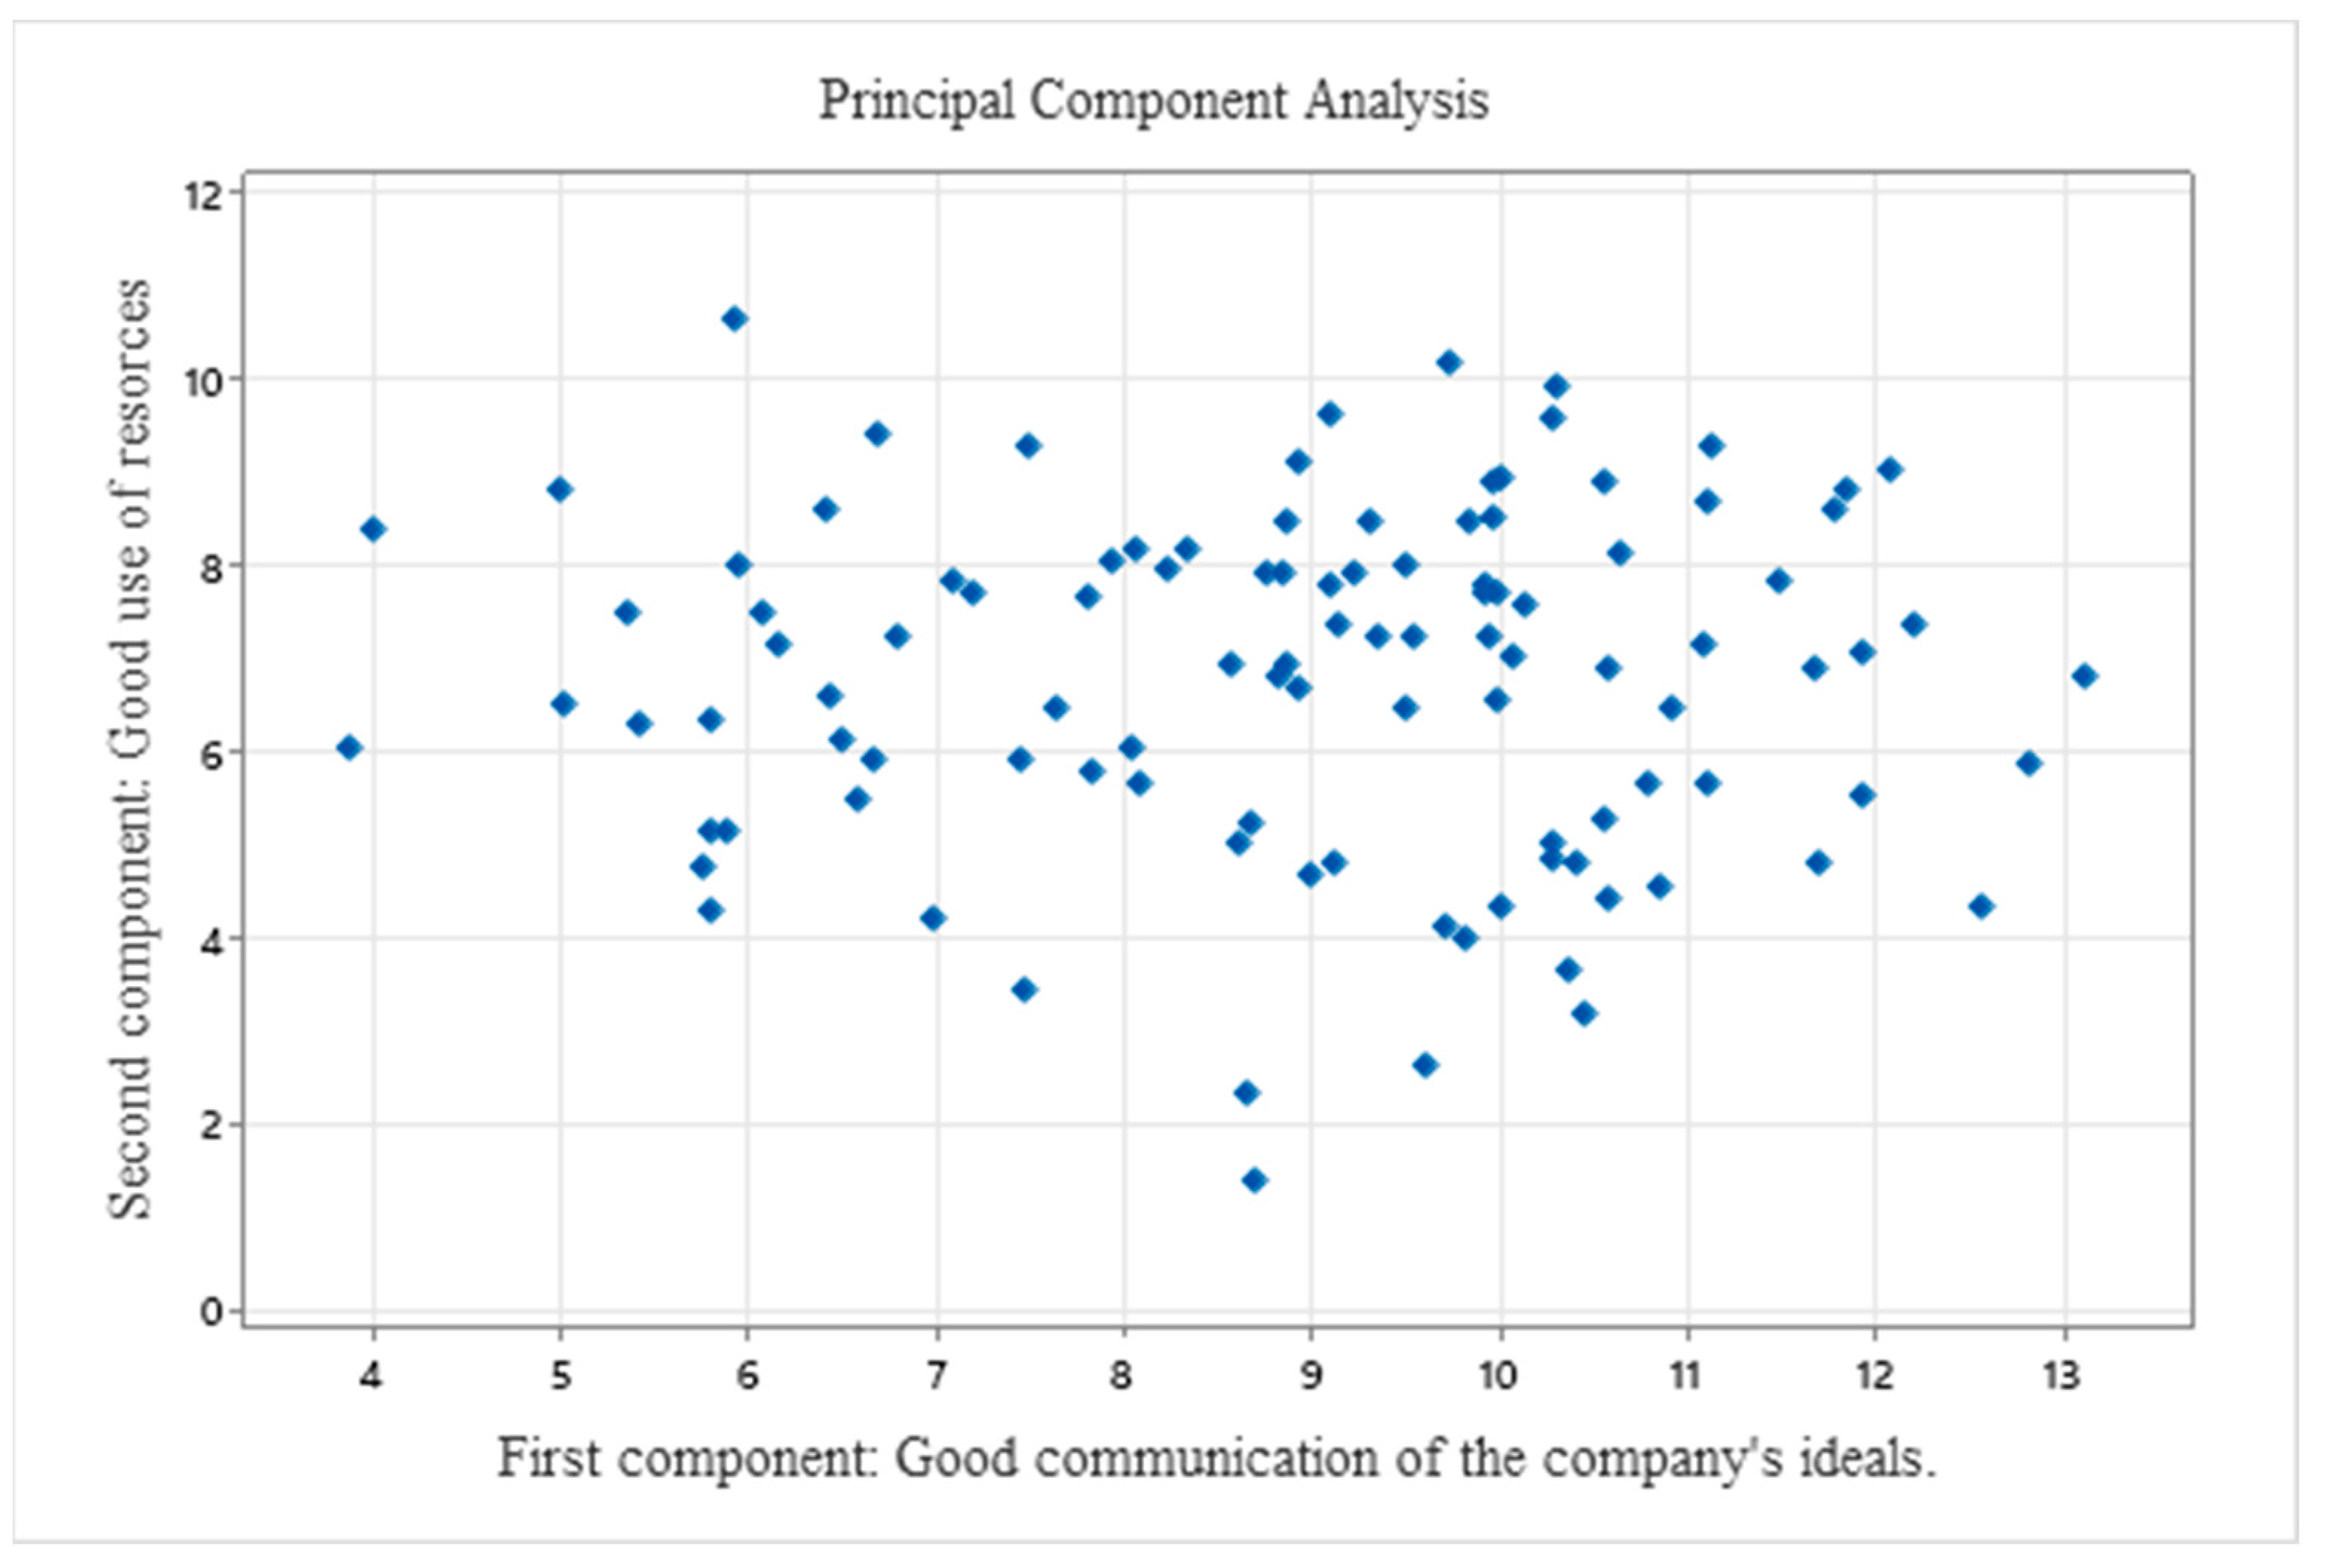
In this case was possible to create two components, due to the cumulative proportion of the data variability explained by those two principal components is 77%, meaning that the behavior of 77% of the scenarios can be explained in these two components. Each component containing several variables, in this case, the first component contains the next factors: culture, philosophy, and communication, and the second component contains the factors: relation with customers, resources, and time. The first component is considered as the communication of the company’s ideals and the second component is the use of the resources.
Figure 7 presents the PCA analysis. Each dot in the figure represents an individual’s answer out of the 120 Lean Construction specialists analyzed. Each point represents an individual. As the study is multivariate, it would not have been possible to see the graph in 2 dimensions if the principal components analysis had not been applied. It is possible to interpret that if the correct communication of the company’s ideals increases and the correct use of the resources increases then the implementation of the methodology (Lean Construction) will be easier.
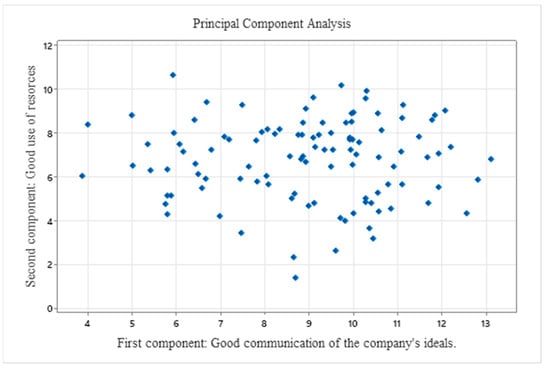
Figure 7.
Principal Component Analysis.
Finally, in Table 10, according to the questionnaire applied to specialists in the construction industry, a ranking of the barriers that most impact the implementation of the Lean methodology was obtained.
Table 10.
Ranking of Lean Construction barriers.
It is evident that the primary factor cited as impeding the adoption of Lean is Leadership. Experts have also mentioned other elements, such as Company Culture and the Resources allotted to its implementation, Training on Lean concerns, Customer Demands, and the execution times of a project are the barriers that can have the least impact on the implementation of Lean. As previously mentioned, leadership has the potential to play a significant role in the implementation of Lean in small and medium-sized construction firms.
5. Conclusions
The approach increasingly examines the obstacles to Lean Construction in small and medium-sized firms. After applying PLS-SEM and Principal Component Analysis (PCA) was possible to observe an important behavior of the factors that influence the application of the methodology. One of the biggest obstacles to the proper implementation of the technique is communication. Effective leaders-employee communication can facilitate the understanding of project performance benefits and help the organization make the most of its resources.
The Lean methodology aims to optimize and get rid of waste in administrative procedures as well as on the job site. Obstacles, including change aversion, poor leadership, poor communication, and lack of resources, make it challenging to apply the lean mindset. It is challenging for these businesses to invest resources in the early phases of a company’s growth because their major goals are to survive and win contracts. As a result, to shift the corporate culture to one that is more in line with Lean, the directors and managers of the enterprises must seek the training and inspiration of the entire staff.
Organizational culture must change to implement Lean. Adopting new techniques is important, but so is inspiring and educating the workforce to accept the changes. Therefore, business owners and managers must spend money on inspiring and training their staff to adopt Lean principles for successful implementation. Long-term prosperity depends on this cultural transformation.
One of the most important findings of this study is the observation that factors like Mentality, Adaptability, and Innovation are significantly impacted by Company Culture. This implies that other factors can be greatly impacted by properly irrigating the company’s culture. Leadership significantly affects variables like Company Culture and Communication. The PCA analysis supports the foregoing, identifying Communication and Resources allocated to the Lean approach as two of the most important factors influencing the obstacles to Lean implementation.
Among the prominent findings, we aimed to address the following questions: What are the actual obstacles to LC (Lean Construction)? According to this study, it is concluded that one of the major impediments to the implementation of LC is the lack of appropriate leadership. The leader must support and promote the methodology in alignment with the mentality through effective communication, resources, and training. Effective leadership and communication would help solve part of the LC implementation by improving employee commitment to the process. Finally, we sought to answer: What are the research’s weaknesses? The primary limitation of this study lies in the genuine commitment of directors, managers, architects, and engineers to implement the concept amidst fierce corporate competition.
The research indicates that Resources, Communication, and Leadership are the most pertinent hurdles. These barriers are also the most critical for small and medium-sized businesses. Successful leadership, ongoing idea sharing, and employee tool and process training are all essential for implementing the Lean ideology in businesses. Reducing waste in both materials and processes is the goal of Lean. Due to their competitive nature in a very resource-dense market, small businesses have several options when it comes to putting this strategy into practice. One of the major challenges of the research was locating and selecting construction industry experts who truly understood the principles, challenges, and practical applications of the Lean methodology.
While Lean has the potential to drive significant improvements, it requires commitment, strategic planning, and a willingness to address the various barriers that can arise during the implementation process. The right approach for implementing Lean in small- and medium-sized businesses may involve strong leadership and clear client communication.
Author Contributions
Conceptualization, R.R. and A.A.-R.; methodology, R.R., A.A.-R. and F.O.; software, A.A.-R.; validation, F.O.; formal analysis, R.R. and A.A.-R.; investigation, R.R., A.A.-R. and F.O.; resources, R.R. and A.A.-R.; data curation, R.R. and A.A.-R.; writing—original draft preparation, R.R., A.A.-R. and F.O.; writing—review and editing, R.R., A.A.-R. and F.O.; visualization, R.R. and A.A.-R.; supervision, F.O. and A.A.-R.; project administration, R.R. and A.A.-R.; funding acquisition, A.A.-R. All authors have read and agreed to the published version of the manuscript.
Funding
Authors would like to thank the founding from Universidad Panamericana via the Project UP-CI-2023-GDL-04-ING (“Estrategias de optimización numérica aplicadas en la toma de decisiones en problemas de ingeniería”).
Data Availability Statement
The data presented in this study are available on request from the corresponding author.
Acknowledgments
The authors would like to acknowledge the support provided by the Universidad Panamericana, Mexico.
Conflicts of Interest
The authors declare no conflict of interest.
References
- Forcael, E.; Garcés, G.; Backhouse, P.; Bastías, E. How Do We Teach? A Practical Guide for Engineering Educators. Int. J. Eng. Educ. 2018, 34, 1451–1466. [Google Scholar]
- Orozco, F.A.; Serpell, A.F.; Molenaar, K.R.; Forcael, E. Modelando Los Factores e Índices de Competitividad Para Constructoras: Hallazgos En Chile. J. Constr. Eng. Manag. 2014, 140. [Google Scholar] [CrossRef]
- Simonsen, E.M.; Herrera, R.F.; Atencio, E. Benefits and Difficulties of the Implementation of Lean Construction in the Public Sector: A Systematic Review. Sustainability 2023, 15, 6161. [Google Scholar] [CrossRef]
- Moyo, T.; Chigara, B. Barriers to Lean Construction Implementation in Zimbabwe. J. Eng. Des. Technol. 2023, 21, 733–757. [Google Scholar] [CrossRef]
- Howell, G.A. What Is Lean Construction-1999. In Proceedings IGLC; Citeseer: Princeton, NJ, USA, 1999; p. 1. [Google Scholar]
- Babalola, O.; Ibem, E.O.; Ezema, I.C. Implementation of Lean Practices in the Construction Industry: A Systematic Review. Build. Environ. 2019, 148, 34–43. [Google Scholar] [CrossRef]
- Musa, M.M.; Mallam Saleh, I.; Ibrahim, Y.; Adamu Dandajeh, M. Assessment of Awareness and Barriers to the Application of Lean Construction Techniques in Kano State, Nigeria. J. Constr. Bus. Manag. 2023, 6, 33–42. [Google Scholar] [CrossRef]
- Rashidian, S.; Drogemuller, R.; Omrani, S. Building Information Modelling, Integrated Project Delivery, and Lean Construction Maturity Attributes: A Delphi Study. Buildings 2023, 13, 281. [Google Scholar] [CrossRef]
- Koskela, L. Application of the New Production Philosophy to Construction. Stanf. Stanf. Univ. 1992, 72, 39. [Google Scholar]
- Koskela, L. An Exploration towards a Production Theory and Its Application to Construction; VTT Technical Research Centre of Finland: Espoo, Finland, 2000. [Google Scholar]
- Ballard, H.G. The Last Planner System of Production Control. Doctoral Dissertation, University of Birmingham, Birmingham, UK, 2000. [Google Scholar]
- Yuan, Z.; Fang, Y.; Hong, J.; Zhang, Q.; Zhang, Z.; Ni, G. Coupling Relationship between Capabilities and Benefits of Lean Construction for Precast Buildings from a Multivariable Moderation Perspective. J. Constr. Eng. Manag. 2022, 148. [Google Scholar] [CrossRef]
- Lohne, J.; Torp, O.; Andersen, B.; Aslesen, S.; Bygballe, L.; Bølviken, T.; Drevland, F.; Engebø, A.; Fosse, R.; Holm, H.T.; et al. The Emergence of Lean Construction in the Norwegian AEC Industry. Constr. Manag. Econ. 2022, 40, 585–597. [Google Scholar] [CrossRef]
- Shaqour, E.N. The Impact of Adopting Lean Construction in Egypt: Level of Knowledge, Application, and Benefits. Ain Shams Eng. J. 2022, 13, 101551. [Google Scholar] [CrossRef]
- Ahmed, S.; Hossain, M.d.M.; Haq, I. Implementation of Lean Construction in the Construction Industry in Bangladesh: Awareness, Benefits and Challenges. Int. J. Build. Pathol. Adapt. 2020, 39, 368–406. [Google Scholar] [CrossRef]
- Li, S.; Wu, X.; Zhou, Y.; Liu, X. A Study on the Evaluation of Implementation Level of Lean Construction in Two Chinese Firms. Renew. Sustain. Energy Rev. 2017, 71, 846–851. [Google Scholar] [CrossRef]
- Habibi Rad, M.; Mojtahedi, M.; Ostwald, M.J.; Wilkinson, S. A Conceptual Framework for Implementing Lean Construction in Infrastructure Recovery Projects. Buildings 2022, 12, 272. [Google Scholar] [CrossRef]
- Aslam, M.; Gao, Z.; Smith, G. Exploring Factors for Implementing Lean Construction for Rapid Initial Successes in Construction. J. Clean. Prod. 2020, 277, 123295. [Google Scholar] [CrossRef]
- Albalkhy, W.; Sweis, R. Barriers to Adopting Lean Construction in the Construction Industry: A Literature Review. Int. J. Lean Six. Sigma 2021, 12, 210–236. [Google Scholar] [CrossRef]
- Olatunji, J.O. Lean in Nigerian Construction State, Barriers, Strategies and “Go-Togemba” Approach. In Proceedings of the 16th Annual Conference of the International Group for Lean Construction, Mancherster, UK, 16–18 June 2008; pp. 16–18. [Google Scholar]
- Mohammadi, A.; Igwe, C.; Amador-Jimenez, L.; Nasiri, F. Applying Lean Construction Principles in Road Maintenance Planning and Scheduling. Int. J. Constr. Manag. 2022, 22, 2364–2374. [Google Scholar] [CrossRef]
- Marhani, M.A.; Jaapar, A.; Bari, N.A.A.; Zawawi, M. Sustainability Through Lean Construction Approach: A Literature Review. Procedia Soc. Behav. Sci. 2013, 101, 90–99. [Google Scholar] [CrossRef]
- Zhang, X.; Azhar, S.; Nadeem, A.; Khalfan, M. Using Building Information Modelling to Achieve Lean Principles by Improving Efficiency of Work Teams. Int. J. Constr. Manag. 2018, 18, 293–300. [Google Scholar] [CrossRef]
- Enshassi, A.; Saleh, N.; Mohamed, S. Barriers to the Application of Lean Construction Techniques Concerning Safety Improvement in Construction Projects. Int. J. Constr. Manag. 2021, 21, 1044–1060. [Google Scholar] [CrossRef]
- Ap, A.; Ek, A.; Nm, I.; Ee, I. Lean Management and Performance of Telecommunication Firms: The Mediating Role of Workplace Structure. Cogent Bus. Manag. 2020, 7, 1761637. [Google Scholar] [CrossRef]
- Radhika, R.; Sukumar, S. An Overview of the Concept of Lean Construction and the Barriers in Its Implementation. Int. J. Eng. Technol. Manag. Res. 2017, 4, 13–26. [Google Scholar]
- Huaman-Orosco, C.; Erazo-Rondinel, A.A.; Herrera, R.F. Barriers to Adopting Lean Construction in Small and Medium-Sized Enterprises—The Case of Peru. Buildings 2022, 12, 1637. [Google Scholar] [CrossRef]
- Ashraf, M. A Critical Look at the Use of Group Projects as a Pedagogical Tool. J. Educ. Bus. 2004, 79, 213–216. [Google Scholar] [CrossRef]
- Zeng, N.; Liu, Y.; Gong, P.; Hertogh, M.; König, M. Do Right PLS and Do PLS Right: A Critical Review of the Application of PLS-SEM in Construction Management Research. Front. Eng. Manag. 2021, 8, 356–369. [Google Scholar] [CrossRef]
- Chin, W.W. The Partial Least Squares Approach to Structural Equation Modeling. Mod. Methods Bus. Res. 1998, 295, 295–336. [Google Scholar]
- Henseler, J.; Hubona, G.; Ray, P.A. Using PLS Path Modeling in New Technology Research: Updated Guidelines. Ind. Manag. Data Syst. 2016, 116, 2–20. [Google Scholar] [CrossRef]
- Duarte, P.A.O.; Raposo, M.L.B. A PLS Model to Study Brand Preference: An Application to the Mobile Phone Market. In Handbook of Partial Least Squares; Springer: Berlin/Heidelberg, Germany, 2010; pp. 449–485. [Google Scholar]
- Adamy, A.; Bakar, A. Developing a Building-Performance Evaluation Framework for Post-Disaster Reconstruction: The Case of Hospital Buildings in Aceh, Indonesia. Int. J. Constr. Manag. 2021, 21, 56–77. [Google Scholar] [CrossRef]
- Ingle, P.V.; Mahesh, G. Construction Project Performance Areas for Indian Construction Projects. Int. J. Constr. Manag. 2020, 22, 1443–1454. [Google Scholar] [CrossRef]
- Romo, R.; Orozco, F.; Forcael, E.; Moreno, F. Towards a Model That Sees Human Resources as a Key Element for Competitiveness in Construction Management. Buildings 2023, 13, 774. [Google Scholar] [CrossRef]
- Becker, J.-M.; Cheah, J.-H.; Gholamzade, R.; Ringle, C.M.; Sarstedt, M. PLS-SEM’s Most Wanted Guidance. Int. J. Contemp. Hosp. Manag. 2023, 35, 321–346. [Google Scholar] [CrossRef]
- González-Huelva, I. Modelos PLS-PM. Bachelor’s Thesis, University of Seville, Seville, Spain, 2018. [Google Scholar]
- Barroso Castro, C.; Cepeda-Carrión, G.; Roldán Salgueiro, J.L. Investigar En Economía de La Empresa: ¿Partial Least Squares o Modelos Basados En La Covarianza? Universidad de Sevilla: Sevilla, Spain, 2007. [Google Scholar]
- Hair, J.; Alamer, A. Partial Least Squares Structural Equation Modeling (PLS-SEM) in Second Language and Education Research: Guidelines Using an Applied Example. Res. Methods Appl. Linguist. 2022, 1, 100027. [Google Scholar] [CrossRef]
- Falk, R.F.; Miller, N.B. A Primer for Soft Modeling; The University of Akron: Akron, OH, USA, 1992. [Google Scholar]
- Edward, G.C.; Richard, A.Z. Reliability and Validity Assessment; Sage Publications: Sauzendoaks, CA, USA, 1979; Volume 17. [Google Scholar]
- Hair, J.F.; Ringle, C.M.; Sarstedt, M. PLS-SEM: Indeed a Silver Bullet. J. Mark. Theory Pract. 2011, 19, 139–152. [Google Scholar] [CrossRef]
- Tenenhaus, M.; Amato, S.; Esposito Vinzi, V. A Global Goodness-of-Fit Index for PLS Structural Equation Modelling. Proc. XLII SIS Sci. Meet. 2004, 1, 739–742. [Google Scholar]
- Henningsson, M.; Sundbom, E.; Armelius, B.-A.; Erdberg, P. PLS Model Building: A Multivariate Approach to Personality Test Data. Scand. J. Psychol. 2001, 42, 399–409. [Google Scholar] [CrossRef]
- Cepeda Carrión, G.; Roldán Salgueiro, J.L. Aplicando En La Práctica La Técnica PLS En La Administración de Empresas. Masters’ Thesis, Universidad de Sevilla, Sevilla, Spain, 2004. [Google Scholar]
- Guenther, P.; Guenther, M.; Ringle, C.M.; Zaefarian, G.; Cartwright, S. Improving PLS-SEM Use for Business Marketing Research. Ind. Mark. Manag. 2023, 111, 127–142. [Google Scholar] [CrossRef]
- Barclay, D.W.; Higgins, C.; Thompson, R. The Partial Least Squares (PLS) Approach to Casual Modeling: Personal Computer Adoption Ans Use as an Illustration; Walter de Gruyter: Berlin, Germany, 1995. [Google Scholar]
- Wong, P.S.P.; Cheung, S.O. Structural Equation Model of Trust and Partnering Success. J. Manag. Eng. 2005, 21, 70–80. [Google Scholar] [CrossRef]

Disclaimer/Publisher’s Note: The statements, opinions and data contained in all publications are solely those of the individual author(s) and contributor(s) and not of MDPI and/or the editor(s). MDPI and/or the editor(s) disclaim responsibility for any injury to people or property resulting from any ideas, methods, instructions or products referred to in the content. |
© 2024 by the authors. Licensee MDPI, Basel, Switzerland. This article is an open access article distributed under the terms and conditions of the Creative Commons Attribution (CC BY) license (https://creativecommons.org/licenses/by/4.0/).