Article

Modeling the Causes and Mitigation Measures for Cost Overruns in Building Construction: The Case of Higher Education Projects

by
Yasir Alhammadi
1,*,
Mohammad S. Al-Mohammad
2 and
Rahimi A. Rahman
2,3,*
1
Department of Civil Engineering, College of Engineering, Prince Sattam bin Abdulaziz University, Al Kharj 11942, Saudi Arabia
2
Construction Industry Research Group, Faculty of Civil Engineering Technology, Universiti Malaysia Pahang Al-Sultan Abdullah, Kuantan 26300, Malaysia
3
Faculty of Graduate Studies, Daffodil International University, Dhaka 1341, Bangladesh
*
Authors to whom correspondence should be addressed.
Buildings 2024, 14(2), 487; https://doi.org/10.3390/buildings14020487
Submission received: 11 December 2023 / Revised: 19 January 2024 / Accepted: 2 February 2024 / Published: 9 February 2024
(This article belongs to the Section Construction Management, and Computers & Digitization)

Abstract

:
The formidable need for building projects places greater pressure on stakeholders to deliver these projects on time, within the budget, and with high quality. However, many building projects have experienced extensive cost overruns despite extensive research on their causes and mitigation measures. Thus, the effectiveness of mitigation measures is questionable. This study examines the status of cost overrun in building construction projects and develops a structural equation model to establish the relationships between causes of cost overrun and mitigation measures, using higher education building projects as a case study. This study analyzed cost overruns in 27 higher education building projects. Furthermore, 118 responses were collected using a questionnaire survey and analyzed using descriptive statistics, the Kruskal–Wallis H test, exploratory factor analysis, and partial least-squares structural equation modeling (PLS-SEM). The findings suggest that around 93% of the 27 higher education building projects experienced cost overrun, and the majority overran between 5% and 10%. The findings illustrate that bid evaluation and project planning mitigation measures positively affect efficiency and contract management- and design-related causes. Furthermore, project initiation and contractor selection mitigation measures positively affect claim management-, efficiency and contract management-, estimation and scheduling-, and design-related causes. These findings will help policymakers make informed decisions in selecting effective mitigation measures to reduce cost overrun and improve industry efficiency.

1. Introduction

Saudi Arabia dedicates substantial efforts towards achieving ‘Vision 2030’. The Vision’s goals assign a high priority to the development of higher education. One of the goals of ‘Vision 2030’ is to have at least five Saudi universities listed among the world’s top 100 by 2030 [1]. Higher education institutions in Saudi Arabia exhibit strong potential indicators, as evidenced by the government’s consistent increase in the education and training budget, reaching USD57.3 billion [2]. Among the 29 public universities in Saudi Arabia, 10, 15, and 4 were established between 1950 and 1998, between 2000 and 2009, and between 2011 and 2014, respectively [3]. This indicates that approximately 66% of public universities have been established in the last two decades. The strong focus on both quantity and quality in higher education indicates its importance in economic development [4]. Therefore, providing sufficient buildings is crucial for the enduring excellence and sustainability of higher education [5]. Ensuring the establishment of higher educational buildings can contribute significantly to achieving the goals outlined in ‘Vision 2030′ and fostering economic development at large.
However, achieving cost overrun-free building projects is challenging [6,7]. Many building projects have experienced extensive cost overruns [8]. According to Ref. [9], cost overruns are an intrinsic characteristic of construction projects irrespective of their size and complexity. Prior works investigating the causes of cost overrun in building projects are prolific but have been limited in scope, with a primary focus on investigating the primary causes of cost overrun as well as their interactions [8,10,11,12]. Although previous works have developed mitigation measures to reduce the impact of the causes [13,14,15,16], they lack effectiveness. The literature lacks empirical assessment of the relationships between causes of cost overrun and mitigation measures. By neglecting these relationships, existing works have failed to identify the high-priority causes and develop sensible mitigation measures to address them. As mitigation measures can help avoid/reduce the impact of cost overrun and promote project success, exploring the relationships between causes of cost overrun and mitigation measures warrants further investigation. Such an investigation can aid in identifying the most effective mitigation measures for reducing the impact of cost overrun on building projects [13]. It enables higher education institutions to operate effectively, fostering continuous improvement, producing highly skilled graduates, cultivating a knowledge-based society, and nurturing future professionals. Selecting effective mitigation measures for cost overruns in higher education buildings safeguards finances and promotes academic excellence and innovation [9].
This study analyzes cost overrun in higher education building projects and develops a relationship model between causes of cost overrun and mitigation measures using partial least squares structural equation modeling (PLS-SEM). To achieve that aim, the objectives are to (1) examine the status of cost overrun in higher education building projects, (2) identify the critical causes of cost overrun and mitigation measures in higher education building projects, (3) identify the underlying groupings of causes of cost overrun and mitigation measures, and (4) examine the relationships between the underlying groupings of the causes and mitigation measures. Riyadh, the capital of Saudi Arabia, was selected as the focus for extracting data related to higher education building projects. Riyadh is the political capital and economic hub of Saudi Arabia. It serves as the headquarters for many major national and international businesses, making it a central location for commercial and infrastructure development. Riyadh has experienced significant population growth and urbanization in recent years [4]. The expanding population of the city creates demand for various construction projects, including housing and education facilities [5]. This urbanization trend is likely to lead to a higher number of building projects. Finally, the Saudi government has been actively promoting economic diversification and development. Initiatives such as ‘Vision 2030’ have a strong focus on urban development, including the construction of new buildings and infrastructure projects [1]. Addressing the challenges associated with cost overruns can improve industry efficiency and contribute to ‘Vision 2030’ at large.
This study contributes to understanding the relationship between causes of cost overrun and mitigation measures in building projects. Such understanding can aid in the development of targeted mitigation measures aiming at improving project performance and mitigating the occurrence of cost overruns. By considering the causes and mitigation measures in the context of building projects, stakeholders can gain a deeper understanding of distinct challenges and create customized strategies to enhance project efficiency and success.

2. Literature Review

2.1. Causes of Cost Overrun

Several works provide insights into the causes of cost overrun, as shown in Table 1. For example, Ref. [10] evaluated the causes of cost overrun in public projects in Ghana and found that the main factors are ‘poor contract planning and supervision’, ‘change orders’, ‘weak institutional and economic environment of projects’, and ‘lack of effective coordination among the contracting parties’. Ref. [17] concluded that ‘poor control procedures’, ‘inadequate programming’, ‘inefficient design’, and ‘ineffective site management’ have the highest impact on cost performance in Australia. Ref. [18] used the relative importance index (RII) technique to rank the factors causing cost overruns in construction projects in the Gaza Strip. The combined view of clients, contractors, and consultants suggests that the top causes are ‘price fluctuations of construction materials’, ‘contractor delays in material and equipment delivery’, and ‘inflation’. Similarly, Ref. [11] employed RII to identify the leading factors causing cost overrun in government school buildings and concluded that financial difficulty by the client, delays in payments of completed works, and variations in designs are the top causes. Ref. [19] used factor analysis to analyze the causes of cost overrun in Vietnam and found that the main underlying groupings contributing to cost overrun are additional work, material cost, and delays. Ref. [20] investigated cost overrun factors in building projects in India and concluded that the most critical factors are ‘construction delays’, ‘design error’, ‘rework’, ‘inaccurate site investigation’, ‘awarding the contract to the lowest bidder’, ‘changes in the project’s scope’, ‘contractor’s poor site management’, and ‘increase in material price/wages’. Ref. [12] identified the relationships among the causes of cost overrun in building projects. The work suggested that scope creep, construction delays, rework, and the practice of awarding the contract to the lowest bidder are the major causes of cost overrun. Ref. [21] studied the causes of cost overrun in building projects and analyzed that financial difficulties faced by the client, poor communication, change in the price of material, delay of design, and poor site management are the major causes. Ref. [6] evaluated the relationships between the causes of cost overrun and found that the key causes are ‘poor contract planning and supervision’, ‘change orders’, ‘the competence of the project team’, and ‘lack of effective coordination among parties’. Ref. [7] indicated that ‘rework’, ‘labor productivity’, ‘contactor incompetency’, ‘consultant incompetency’, ‘execution delays’, ‘claims’, and ‘economic instabilities’ are critical causes of cost overrun. Ref. [22] illustrated that ‘unreasonable client expectations’ are the most critical causes of cost overrun in construction projects. Ref. [23] identified the main causes of cost overruns, including errors in design, bad weather, inadequate cost estimation, and payment delays. In addition to errors in design, Ref. [24] demonstrated that labor productivity, opportunistic behaviors, and poor planning are the critical causes of cost overrun.

2.2. Mitigation Measures

To navigate the causes of cost overrun and promote project success, several works have provided insights into potential mitigation measures that could help avoid cost overrun. Table 2 shows the list of mitigation measures identified from the literature. Refs. [25,26] illustrated that adopting effective bidding and contract award processes and prioritizing economically advantageous bids can foster a proactive approach to cost control. The bid evaluation process should consider criteria for selecting contractors with solid financial backgrounds [7,13]. This careful evaluation helps ensure that contractors possess the financial stability necessary to execute the project efficiently, minimizing the risk of unexpected financial challenges that could lead to cost overrun. Contractors, in turn, should strategically plan bids, integrating experienced site supervisors, pre-qualified suppliers, and synchronized payment milestones [13,15,27,28,29]. Ref. [30] suggested that contracts should include clauses for damages and incentives to encourage early project completion. By imposing financial penalties for delays, owners incentivize contractors to manage their time effectively, allocate resources efficiently, minimize disruptions, and complete the project within the agreed-upon timeframe. Conversely, early completion incentives motivate contractors to accelerate the construction process. Both penalties and incentives contribute to a reduction in overall project costs associated with prolonged construction durations. Furthermore, maintaining provisions for design contingencies, realistic plans, and flexible payment schedules contributes to project stability and cost reduction [7,27,29,31,32]. Additionally, incorporating management protocols for alterations, securing project funding before awarding contracts, and setting limits on outsourcing enhances project efficiency [14,33,34,35]. Establishing effective organizational structures and communication systems, clearly defining roles and responsibilities, and holding kick-off meetings to establish communication channels are crucial for cohesive project teams [15,36,37,38,39]. Ref. [13] illustrated that integrating Building Information Modeling (BIM) and Project Management Information Systems (PMIS) into project control systems can enhance project supervision and reduce unnecessary work that requires additional expenses. Ref. [40] demonstrated that contractors should promote regular communication and good rapport with the approving authority. Lastly, owners should eliminate payment process bottlenecks and unnecessary bureaucracy [26,27,34].

2.3. Research Gap

Extant studies investigating the causes of cost overruns in building projects are prolific. To effectively reduce the occurrence of cost overruns, previous works have developed several mitigation measures. However, the persistence of cost overruns underscores the importance of prioritizing mitigation measures to avoid their repetition in future projects. Yet, the literature lacks empirical evidence on the relationships between causes of cost overrun and mitigation measures. By neglecting these relationships, existing works have failed to identify the high-priority causes and develop corresponding mitigation measures. This study bridges this gap by identifying the underlying groupings of causes of cost overrun and mitigation measures and exploring their relationships.

3. Methodology

3.1. Phase 1: Anlysing Cost Overrun in Building Projects

This phase involved the collection of historical records and the analysis of cost overruns in building projects. A total of 27 building projects were collected, starting from 2009 to the present time of this study. All project information, collected from building projects, was accessed through one of the author’s networks, with one of the public universities located in Riyadh being the main client involved. The following data regarding project characteristics were extracted, as shown in Table 3: project name, project status (abandoned, ongoing, completed), initial contract sum in Saudi Riyal (SAR), actual construction cost (SAR), the rise in construction cost (SAR), and cost overrun (%). The names of the projects were undisclosed for confidentiality purposes. The percentage of cost overrun was expressed as the unexpected cost incurred in excess of the initial contract sum required to complete a project.

3.2. Phase 2: Exploring the Relationships between Causes of Cost Overrun and Mitigation Measures

This phase involved the development of a PLS-SEM model that describes the relationships between the causes of cost overrun and mitigation measures. The following subsections provide more details on the methods used in this phase.

3.2.1. Survey Development

This study used a questionnaire survey to collect opinions on the criticality of the causes of cost overrun and mitigation measures. A survey is an appropriate technique for collecting a wide range of opinions from professionals in the architecture, engineering, and construction industry (AEC) and is suitable for quantitative research (e.g., PLS-SEM). A survey is common in construction management research for soliciting professionals’ opinions on a specific topic [43]. It is a suitable data collection method for conducting exploratory factor analysis (EFA) and PLS-SEM, consequently capturing dimensions that represent theoretical constructs and exploring relationships [10]. Previous works with similar objectives have employed similar techniques for exploring the relationships between the latent constructs [44,45].
This study adopted the list of causes of cost overrun from Ref. [46] because (1) this work indicated that the vast majority of previous works had investigated almost similar causes in different project types and contexts, (2) this work focused on building projects and included building-specific causes, which fit this study’s context, and (3) research on the causes of cost overrun has experienced a notable increase, particularly in the period 2011–2021 [47]. Thus, Ref. [46], a recent work conducted in 2023 covering the literature within 2011–2021, may have effectively captured all variables related to the causes of cost overrun in building projects. The list of mitigation measures was identified through a literature review. Keywords, such as ‘cost overrun’, ‘project management’, ‘construction’, and ‘construction projects’ and mitigat* were used to identify potential articles that include mitigation measures. The Scopus database was selected for extracting relevant articles because of its widespread adoption for literature reviews in the construction management domain [43]. After screening the articles, mitigation measures for cost overrun were extracted.
The survey included three sections. Section 1 was related to the respondent profile. Section 2 asked the respondents to assess the criticality of the causes of cost overrun using a five-point Likert scale (1 = not critical, 2 = slightly critical, 3 = moderately critical, 4 = critical, and 5 = very critical). Section 3 asked the respondents to assess the criticality of the mitigation measures using the same scale.

3.2.2. Data Collection

This study’s population comprises AEC professionals with sufficient knowledge and hands-on experience in the AEC industry, representing clients, contractors, and consultants. Therefore, the purposive sampling technique was used to select eligible respondents [48]. Five professionals, including an architectural engineer, civil engineer, electrical engineer, mechanical engineer, and project manager were identified as the most likely professionals to offer useful insights. All respondents were approached using one of the authors’ established industry contacts. There were 25 projects overran and five eligible AEC professionals representing contractors and consultants separately. The target population of contractors and consultants accounted for 250 engineers ((5 + 5) × 25 = 250). Furthermore, 40 engineers working in the project management department from the client’s side (one of the public universities located in Riyadh) were also approached. As a result, the total population in this study was 290 (250 + 40 = 290). The minimum sample size was computed using the Krejcie and Morgan table for a known population [49]. The sample size was computed using a 5% error margin, 90% confidence level, 50% response distribution, and a population of 290. As a result, the minimum sample size was 141. Consequently, 290 questionnaire surveys were disseminated across the target population using an online survey platform and a hard copy format. This study collected 145 responses. Responses with missing values, amounting to 27 responses, were omitted. As a result, 118 responses were deemed valid for analysis. The response rate of 40.69% was deemed satisfactory compared to the typical range of 20–30% observed in most of the questionnaire surveys within the construction industry [50].

3.2.3. Data Analysis

Reliability Testing

Cronbach’s alpha (CA) was employed to assess the internal consistency of the causes of cost overrun and mitigation measures. The CA value spans from 0.00 to 1.00, with a higher value indicating a higher level of consistency of the items. Conversely, a low value implies that the survey should be improved to enhance the internal consistency among the variables [43].

Ranking Analysis

After reliability testing, the mean score ranking was used to rank the causes of cost overrun and mitigation measures. The standard deviation was then computed to differentiate between the variables possessing an equal mean. For example, if two variables had an equal mean, the variable with a lower standard deviation was ranked higher because its data are less spread out but closer to the mean. Finally, the normalized value technique was computed to identify the critical causes of cost overrun and mitigation measures. In contrast to the mean score, which selects almost half of the variables, the normalized value technique represents the aggregated perceived criticality of the respondents toward a particular variable. Consequently, the latter technique is better suited for identifying the critical causes of cost overruns and mitigation measures [51]. The causes of cost overrun or mitigation measures with a normalized value greater than 0.50 were deemed critical. Prior works in the construction management domain support the use of similar techniques for identifying critical variables [43,52].

Exploratory Factor Analysis

EFA was used to explore the underlying factor structure of the cause of cost overrun and mitigation measures. EFA is a statistical technique that reduces the number of variables into a manageable set of groupings, facilitating their interpretation [53]. Establishing the underlying structure using EFA is essential for hypothesis testing and theory building. During EFA, principal component analysis (PCA) with varimax rotation was used to group the variables. Using EFA is common in construction management research and plays a critical role in categorizing variables’ loads into different groupings [10,54].

Agreement Analysis

The Kruskal–Wallis (KW) test was carried out to examine any differences in the respondents’ opinions on the critically of the critical causes of cost overrun and mitigation measures based on AEC experience, number of projects involved, nature of business, company size, and company type. The KW is a nonparametric test that can analyze opinions from at least three groups when the normality assumptions are unjustified. A p-value less than 0.05 suggests a significant difference in the means between the groups [43].

Partial Least Squares Structural Equation Modeling

To identify the relationships between the causes of cost overrun and mitigation measures, this study used structural equation modeling (SEM). SEM is a causal modeling technique for analyzing interrelations between observed and latent variables [53]. Basic statistical models analyze a limited number of independent and dependent variables and cannot test the theoretical relations among multiple variables. Conversely, SEM permits relations among multiple variables to understand a complex phenomenon [55]. Given this study’s argument of the absence of relationships between the causes of cost overrun and mitigation measures, SEM is better suited to confirm or disconfirm theoretical models.
SEM comprises a measurement model and a structural model. A measurement model evaluates the relationships between each variable and its latent construct, while a structural model evaluates the relationships between the latent constructs [55]. There are two approaches for SEM, including covariance-based SEM (CB-SEM) and variance-based partial least squares (PLS-SEM). CB-SEM requires a large sample size and accuracy in parameter estimation. In contrast, PLSSEM analyzes non-normal datasets and does not require a large sample size, which suits the small sample size in this study [53]. Furthermore, PLS-SEM is ideal for exploratory research with weak theory (e.g., absence of the relationships between causes of cost overrun and mitigation measures).
The assessment of the measurement model includes testing reliability and validity. The internal consistency was assessed using CA and composite reliability (CR), which should be greater than 0.60. The indicator reliability was assessed using loadings of the variables on the corresponding construct (minimum of 0.50) [56]. The convergent validity was assessed using the average variance extracted (AVE) (minimum of 0.50) [53]. The discriminant validity was assessed using the Fornell–Larcker criterion and cross-loadings. The square root of the AVE of each construct should be higher than the inter-construct correlation. Furthermore, each indicator should have the highest loading on its corresponding construct. Finally, the structural model was assessed using the bootstrapping technique with a t-value greater than 2.58 at a significant level of 0.01 [55].

4. Results and Discussion of Phase 1: Analysis of Cost Overrun

This study analyzed 27 higher education building projects extracted from historical records. Of the 27 higher education building projects, 25 had a cost overrun. This indicates that the majority of the higher education building projects (around 93%) had exceeded their initial budgeted cost. Figure 1 presents the analysis of characteristics of the 25 higher education building projects that overran. The highest cost overrun is 10%, which is associated with projects 24 and 25. Of the 25 higher education building projects that overran their initial budget, 20% and 80% of projects experienced cost overruns of 0–5% and 5–10%, respectively. This indicates that 93% of the 27 projects experienced cost overrun, with the majority overran between 5% and 10%. The average cost overrun for the 25 projects analyzed was 6.86% with a standard deviation (SD) of 3.03%.

5. Results and Discussion of Phase 2

5.1. Respondent Profile

Table 4 shows the respondent profile. In terms of age, most respondents fall between the ages of 31–40 years (39.83%) and 41–50 years (34.75%). The majority of the sample hold a bachelor’s degree (65.25%). Respondents representing contractors and consultants contribute equally to the survey (34.57%), while those representing clients contribute by 30.5%. Regarding the AEC experience, 31.36% of the respondents have more than 20 years of experience. Professionals with 11–15 and 16–20 years of AEC experience represent 24.58% and 15.25% of the sample, respectively. Those with 6–10 and 1–5 years of AEC experience represent 11.86% and 11.02%, respectively. Professionals with less than one year of AEC experience are the least contributors to the survey (5.93%). Respondents who have worked on more than 10 projects represent 50% of the total, followed by those with 6–10 projects at 32%. Infrastructure is the most common project type (72.88%), followed by non-high-rise buildings (61.86%). Around 42% of the professionals are from large organizations, followed by professionals from medium to large organizations (32.20%). The majority of responses are from public entities (65.25%). Most companies are aged between 16 and 20 years, followed by those aged more than 20 years. The vast majority of companies operate on a domestic basis (96.61%). The respondent profile demonstrates sufficient experience and knowledge in construction projects, which further supports the reliability of the data.

5.2. Results for the Reliability Testing

The Reliability test was conducted using Cronbach’s alpha coefficient. The results showed that the coefficient value was 0.910 and 0.919 for causes of cost overrun and mitigation measures, exceeding 0.60, indicating high internal consistency and reliability.

5.3. Results for the Ranking Analysis

5.3.1. Critical Causes of Cost Overrun

Table 5 presents the results of the mean score (MS), SD, and normalized value (NV) techniques for the causes of cost overrun. The MSs range between 2.525 and 4.288. Of the 21 causes of cost overrun, 17 had an NV greater than 0.50, implying that 17 causes of cost overrun are critical in higher education building projects. ‘Poor contract management’ (CA03) is the most critical cause of cost overrun in higher education building projects (MS = 4.288). The second most critical cause of cost overrun is ‘poor cost estimation’ (CA13, MS = 4.271), followed by ‘contractor incompetency’ (CA04, mean = 4.178). The fourth and fifth critical causes of cost overrun are ‘delays in payments’ (CA15, MS = 4.153) and ‘execution delays’ (CA14, MS = 4.144). The results demonstrate that the top causes are associated with project management practices. The findings are consistent with Ref. [47], demonstrating that the primary causes of cost overrun are associated with project management and design, with the top five being related to project management practice. AEC professionals should carefully consider these causes and enhance project management practices.

Comparison with Previous Works

This subsection compares and discusses this study’s findings with extant literature on the causes of cost overrun in higher education building projects, as shown in Table 6. In general, the majority of the top ten causes identified in this study were commonly reported in previous works. Notably, ‘poor planning’ (CA12) is the most frequent cause of cost overrun. A recent scoping review suggests that ‘poor planning and schedule’ is the most critical cause of cost overrun irrespective of project type. The review also indicates that this factor has been constantly reported within higher education building projects in the period 2011–2021 [47]. ‘Poor planning’ appears to be a pervasive issue not only in higher education building projects but also in all construction projects on a global scale. In addition to ‘poor planning’, ‘contractor incompetency’ (CA04), ‘delays in payments’ (CA15), and ‘poor site supervision’ (CA19) were reported as major causes. This suggests that there is a common responsibility shared between the client and the contractor for cost overruns in higher education building projects.

5.3.2. Critical Mitigation Measures

Table 7 shows the results of the MS, SD, and NV techniques for mitigation measures. The MSs range between 3.271 and 4.391. Of the 23 mitigation measures, nine had an NV greater than 0.50, implying that nine mitigation measures are critical for cost overrun in higher education building projects. ‘Owners should ensure project funding is secured before awarding the contract’ (MM07) is the most critical mitigation measure for cost overrun (MS = 4.390). The second most critical mitigation measure is ‘in the bid evaluation process, owners should consider criteria that make it possible to select the most qualified contractors with solid financial background’ (MM10, MS = 4.22), followed by ‘owners should hire consultants grounded on their track records and experience in similar construction projects’ (MM08, MS = 4.136). The fourth and fifth critical mitigation measures are ‘construction projects should be awarded to contractors with the appropriate skills and experience in similar projects’ (MM12, MS = 4.068) and ‘owners should eliminate or reduce bottlenecks and unnecessary bureaucracy within the payment process’ (MM23, MS = 4.042).

5.4. Results for the Agreement Analysis

Table 8 presents the results of the KW test. The results illustrate some differences in the views on the criticality of the causes of cost overrun and mitigation measures. Notably, there are consistent views on the criticality of CA10, CA12, CA13, CA14, and CA15 based on AEC experience, number of projects involved, nature of business, and company size. Furthermore, there are consistent views among the different types of companies on the criticality of the mitigation measures. This indicates that these mitigation measures can be applied to reduce the cost overrun in higher education building projects irrespective of the company type.

5.5. Results for the Exploratory Factor Analysis

The sample size ratio to the number of variables was used to determine the sufficient sample size for the EFA. Ref. [65] suggests a sample–variable ratio between 5:1 and 20:1. In this study, the ratio of the sample size (118) to the number of critical causes of cost overrun (17) and critical mitigation measures (9) was 6.94 and 13.11, which is above the minimum ratio of 5:1.
PCA with Varimax rotation was employed to identify the underlying groupings. Regarding the causes of cost overrun, ‘poor planning’ (CA12) and ‘poor communication’ (CA10) had loadings less than 0.50, prompting their removal from the analysis. ‘Poor site supervision’ (CA19) had a substantial loading of 0.599 and 0.530 in two different underlying groupings, necessitating its removal from the analysis [65]. As a result, 14 causes of cost overrun were deemed eligible for another round of analysis. Table 9 and Table 10 show that four and two underlying groupings were extracted based on their eigenvalues (≥1.00) [47]. All loadings were greater than 0.50, ranging between 0.520 and 0.835 for the causes of cost overrun and between 0.518 and 0.866 for mitigation measures. The suitability of the data for EFA was evaluated using the Kaiser–Meyer–Olkin (KMO) test and Bartlett’s test of sphericity. The data were considered adequate for the analysis as the KMO values were 0.856 and 0.846 for the causes of cost overrun and mitigation measures, exceeding the minimum acceptable value of 0.60 [66]. The results of Bartlett’s test of sphericity were 810.660 and 353.162 for the causes and mitigation measures with a significant level of 0.000, suggesting that the correlation matrix is not an identity matrix, reinforcing the appropriateness of the EFA [47].
Table 9 and Table 10 illustrate that the four and two underlying groupings for the causes of cost overrun and mitigation measures explained 67.909% and 57.664% of the total variance, which is greater than the minimum threshold of 50% [47]. Each underlying grouping was assigned a distinct label to represent the underlying meaning. Accordingly, the four underlying groupings for the causes of cost overrun were named as follows: (1) claim management-related causes (CMCA), (2) efficiency and contract management-related causes (ECCA), (3) estimation and scheduling-related causes (ESCA), and (4) design-related causes (DECA). Furthermore, the two underlying groupings for mitigation measures were named as follows: (1) bid evaluation and project planning mitigation measures (BPMM) and (2) project initiation and contractor selection mitigation measures (PCMM).

Hypotheses Development

As this study aims to establish relationships between the causes and mitigation measures for cost overrun, EFA was used to uncover the underlying groupings. Consequently, the number of hypotheses was determined based on the results of EFA. Refs. [44,45] employed a similar process for developing the hypotheses. EFA grouped the causes and mitigation measures into four and two underlying groupings, respectively. Accordingly, the following eight hypotheses were developed to examine the relationships between the causes of cost overrun and mitigation measures:
Hypothesis 1 (H1):
Bid evaluation and project planning mitigation measures positively affect claim management-related causes.
Hypothesis 2 (H2):
Bid evaluation and project planning mitigation measures positively affect efficiency and contract management-related causes.
Hypothesis 3 (H3):
Bid evaluation and project planning mitigation measures positively affect estimation and scheduling-related causes.
Hypothesis 4 (H4):
Bid evaluation and project planning mitigation measures positively affect design-related causes.
Hypothesis 5 (H5):
Project initiation and contractor selection mitigation measures positively affect claim management-related causes.
Hypothesis 6 (H6):
Project initiation and contractor selection mitigation measures positively affect efficiency and contract management-related causes.
Hypothesis 7 (H7):
Project initiation and contractor selection mitigation measures positively affect estimation and scheduling-related causes.
Hypothesis 8 (H8):
Project initiation and contractor selection mitigation measures positively affect design-related causes.

5.6. Results for PLS-SEM

5.6.1. Measurement Model Evaluation

Figure 2 and Table 11 show the assessment of the measurement model. The loadings for all variables were greater than 0.50, indicating its significant contribution to their corresponding constructs. The CA and CR values were greater than 0.60, indicating an acceptable level of reliability. The AVE values for all constructs were greater than 0.50, suggesting an acceptable level of convergent validity. Table 12 shows that the square-rooted AVEs for the constructs were greater than the correlation coefficients between any two latent constructs, demonstrating an adequate level of discriminant validity. Furthermore, Table 13 shows that each indicator was loaded on its corresponding construct higher than other constructs, demonstrating the discriminant validity of the construct.

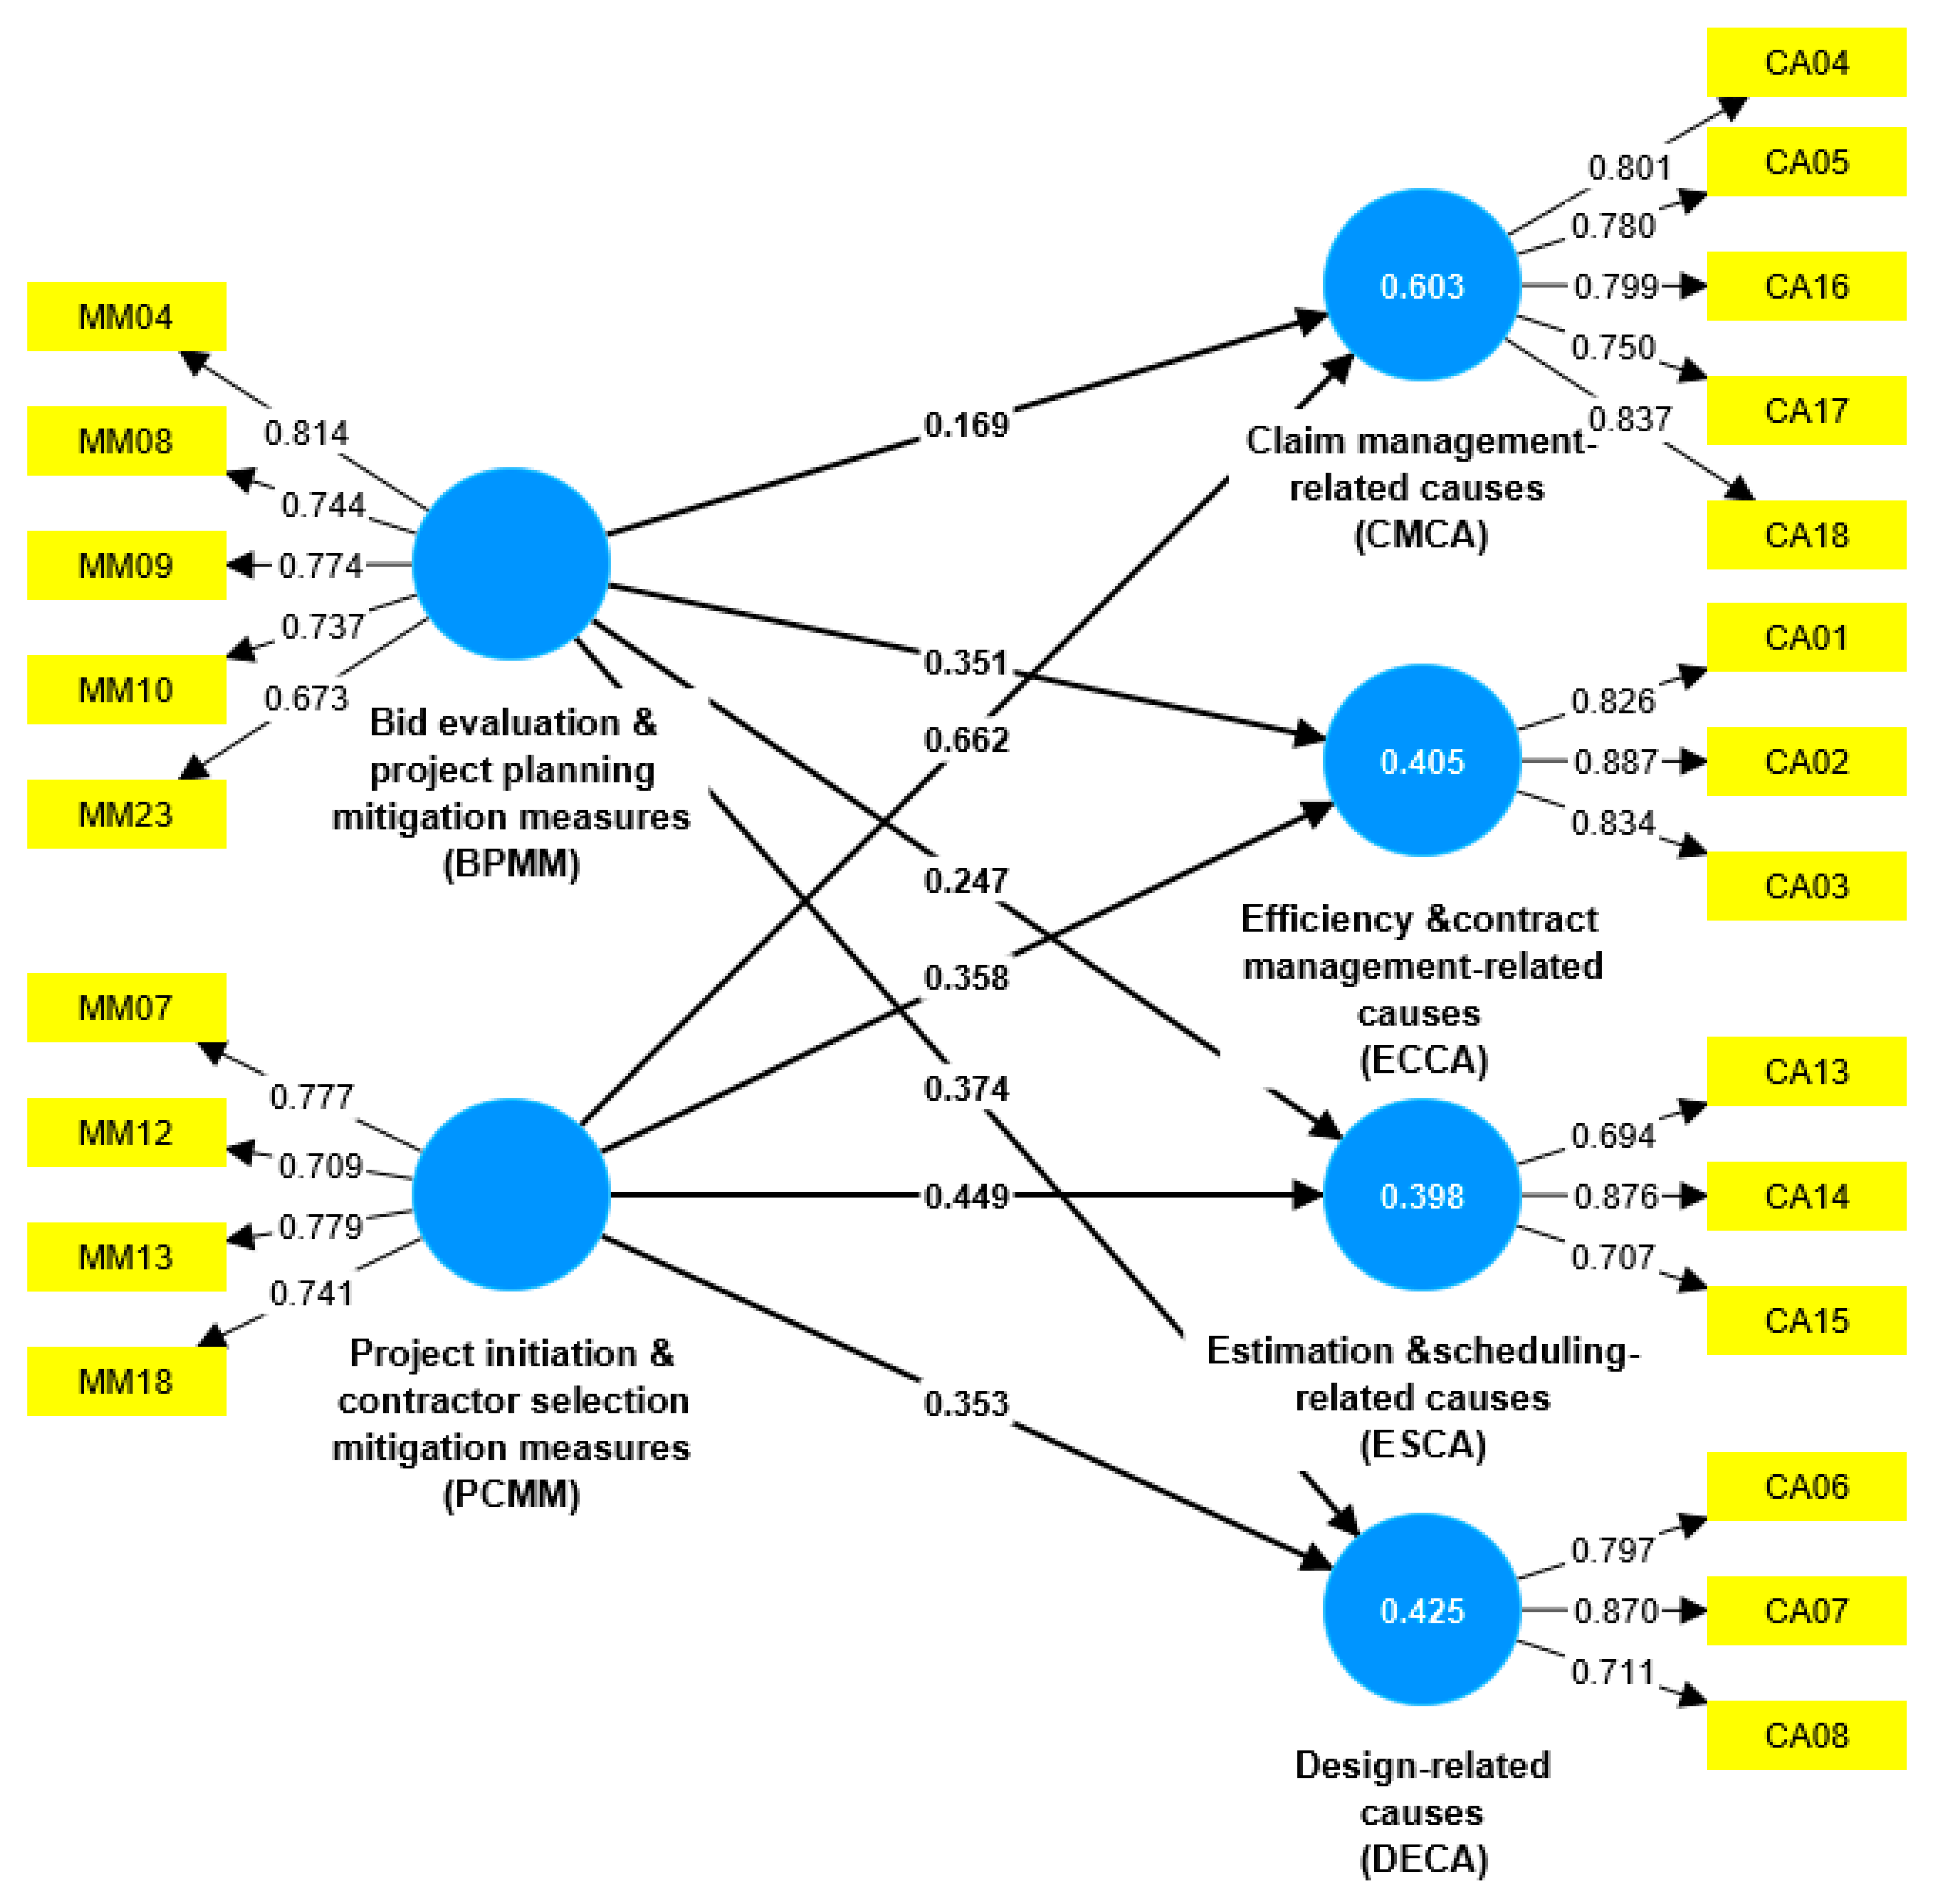
5.6.2. Structural Model Evaluation

The bootstrapping technique was used to estimate the hypothetical paths. The number of bootstrap samples was 5000. The critical t-value for a two-tailed test was 2.58 (significance level = 0.01) [67]. As a result, H2, H4, H5, H6, H7, and H8 were positive and supported as the t-value was greater than 2.58 at a significant level of 0.01. In contrast, the results did not provide support for H1 and H3 as the t-value was less than 2.58, and therefore, H1 and H3 were not supported.

The Relationship between Bid Evaluation and Project Planning Mitigation Measures and Efficiency and Contract Management-Related Causes

To effectively eliminate potential cost overruns, it is crucial to embrace bidding and contract award procedures that prioritize the most economically advantageous bid [67]. Conventional contract award methods, which primarily favor the lowest-priced proposal, often compel the contractor to lower their price, resulting in impractical contract conditions [26]. This method almost neglects other important criteria, including technical capabilities, financial background, and organizational skills of contractors [68]. This may give a chance to award the contract to an under-qualified contractor. Conversely, competent contractors are more likely to have effective project management and work processes in place, which can enhance overall productivity and minimize construction errors [8]. Therefore, bid evaluation is critical as it has a substantial impact on the project budget [69]. Furthermore, poor project planning can result in impracticable schedules and specifications [70]. For example, the contractor often attempts to strike a balance by sacrificing the quality of the project to reduce potential losses [71]. This might result in increased rework because of the owner’s high expectations of quality and the contractor’s failure to comply with the contract [69]. Therefore, adequate planning can contribute to greater adherence to the pre-agreed contracts and minimize potential legal costs that could rise from disputes over the scope of the project [10].

The Relationship between Bid Evaluation and Project Planning Mitigation Measures and Design-Related Causes

Ref. [72] recommends evaluating the bid based on the technical compliance of contractors with the design specifications. Bidders should have a clear understanding of the design requirements, and their proposals should align with these specifications [72]. The project initiation phase allows bidders to seek clarification and address design-related issues in their proposals [73]. Thus, contractors can submit alternative proposals that are advantageous both financially and technically, while also meeting quality standards [69]. Contractors may also propose an alternative construction method to the specified one in the specifications, offering a cost-effective approach while maintaining the same technical quality [74]. Ref. [75] indicates that variations in scope and design arise as a result of insufficient scheduling and budget allocation during the planning stage. Ref. [8] illustrates that changes in design occur due to inaccurate cost analysis and estimation. According to Ref. [76], design-related problems occur due to errors and changes to the design and additional work. As a result of the nature of construction, some design changes, such as changes in drawings, specifications, materials, etc., are inevitable and are attributed to poor project planning [76]. As a result, poor planning hinders project teams from delivering high-quality results [77]. Thus, effective planning is crucial for reducing design changes and rework during the construction stage [78].

The Relationship between Project Initiation and Contractor Selection Mitigation Measures and Claim Management-Related Causes

The success of a construction project hinges on the clarity and accuracy of the business case and the ability of the stakeholders to achieve it [77]. Project objectives, goals, and scope should be outlined in the initiation phase to ensure that stakeholders have a shared understanding of the project requirements and expectations [79]. Ambiguities and uncertainties in the project objectives can lead to disputes and claims [80]. These ambiguities can also create opportunities for scope creep, resulting in additional rework and claims for additional compensation, and eventually cost overrun. According to Ref. [81], the value of construction disputes amounted to USD 67 million worldwide, and the Asian region recorded the second highest dispute value. Ref. [82] concludes that 89% of risk factors affecting the causes of cost overrun can be recognized at project initiation. Thus, a well-established project initiation can have a positive impact on cost overrun reduction by eliminating conflicts and disputes between stakeholders [83]. Furthermore, well-established contractor selection procedures help identify seasoned contractors with a strong reputation in the market [84]. These contractors avoid claim situations for the sake of a claim activity. Nevertheless, it is common that the contractor inflates the amount of the claim to the extent possible. As the claimed activity may have a direct or indirect effect on other construction activities, it incurs additional costs for the project [85]. Selecting the right contractor can contribute to the reduction of claim-related issues [82].

The Relationship between Project Initiation and Contractor Selection Mitigation Measures and Efficiency and Contract Management-Related Causes

In the project initiation, the formation of an efficient working team is essential as it increases accountability to keep the work flowing smoothly [10]. Without an efficient project team, performing the required duties throughout the project cycle becomes challenging. Recruiting qualified and skilled personnel can ensure the team is well-prepared to perform their tasks efficiently and prevent unwanted extra work [11]. As the project’s objectives and scope are typically defined during project initiation, well-drafted contracts that clearly outline responsibilities, terms, conditions, and dispute-resolution mechanisms can minimize contract-related issues [80]. Furthermore, the selection of contractors with relevant experience and proven track records can contribute to cost-effective project outcomes [86]. The successful records of contractors, especially the amount of field-management experience in similar projects, reduce the likelihood of construction errors, inaccuracies, or omissions. An adequate owner–contractor evaluation leads to the smallest percent increase in the project cost [87].

The Relationship between Project Initiation and Contractor Selection Mitigation Measures and Estimation and Scheduling-Related Causes

The inadequate initial estimates of time and cost can impact the success of a project. The degree of variance from the initially agreed-upon time and cost in the contract serves as a measure of success. Deviating from these agreed-upon terms may lead to project delays and cost overruns [79]. For example, contractors frequently base their initial tender estimates on market prices at the time of tender submission. Due to the extended tender phase, fluctuations in materials prices during construction can contribute to cost overrun [18]. There is also a situation when contractors neglect to provide realistic construction schedules and operational plans, making monitoring project progress challenging [8]. Thus, the expertise of the client is vital for the accurate selection of contractors to mitigate variations that might result in a cost overrun [11]. The inadequate technical performance of the contractor is commonly attributed to a lack of accurate estimation and scheduling, leading to errors, rework, and a rise in project expenditures [12].

The Relationship between Project Initiation and Contractor Selection Mitigation Measures and Design-Related Causes

Early meetings and collaboration fosters a shared vision and understanding among team members, reducing the likelihood of design changes resulting from misunderstanding or conflict later in the project [15]. The establishment of clear objectives during project initiation allows stakeholders to avoid misaligned project expectations, which often lead to scope creep and, in the worst-case scenario, project failure [12]. Furthermore, during project initiation, the owner should allocate sufficient funds for the design phase [11]. Ref. [88] indicates that variations in design and insufficient funds are significant causes of delay that lead to time overrun. Construction projects with higher additional time tend to be delayed due to variations/errors in design as well as a lack of adequate finance by the client to finish the work. Both collaboration and upfront funds can reduce design changes and errors due to unforeseen site conditions and uncertainties and help control their effect on the project budget [6]. Under some procurement systems, such as design-build, the client contracts directly with a contractor who has the responsibility for developing the design. This increases the responsibilities of contractors, emphasizing the importance of careful selection when choosing the right contractor for this type of contract [89]. Contractors with knowledgeable design teams and similar work experiences can minimize design changes and eventually avoid cost overrun [90].

6. Limitations

This study’s sample is relatively small. However, the sample size was still valid as it satisfied the minimum requirement for PLS-SEM. The results of the agreement analysis demonstrated some discrepancies among the respondents based on the AEC experience, number of projects involved, nature of business, company type, and company size. Further research can investigate and justify these discrepancies. Furthermore, this study extracted only relevant data from building projects aligned with the study objectives. Other project characteristics were not recorded and, consequently, were not analyzed. Future research can extract different project characteristics (e.g., construction methodology) and analyze the data. This study is confined to higher education building projects in Riyadh. The generalizability of the findings to other sectors or locations depends on contextual factors and regulatory environments. Comparing the findings of this study with other geographical locations and sectors would provide valuable insights into symmetries and asymmetries in cost overrun and its major causes at national and international levels.

7. Conclusions

This study analyzed 27 higher education building projects and explored the relationship between the causes of cost overrun and mitigation measures using PLS-SEM. A questionnaire survey was disseminated to AEC professionals to assess the criticality of causes of cost overrun and mitigation measures. The data were analyzed using descriptive statistics, EFA, KW test, and PLS-SEM.
The findings demonstrate that 25 out of 27 projects (approximately 93%) experienced cost overrun, and the majority overran between 5% and 10%. The average cost overrun for the 25 analyzed projects was 6.86%. The analysis illustrates that 17 causes of cost overrun and nine mitigation measures are critical in higher education building projects. ‘Poor contract management’ is the most critical cause of cost overrun in higher education building projects (MS = 4.288), whereas ‘owners should ensure project funding is secured before awarding the contract’ is the most critical mitigation measure for cost overrun (MS = 4.390). Comparisons with previous works illustrate that ‘poor planning’ is a pervasive issue not only in higher education building projects but also in all construction projects on a global scale. The results of EFA suggest that there are four underlaying groupings for the causes of cost overrun: (1) claim management-related causes, (2) efficiency and contract management-related causes, (3) estimation and scheduling-related causes, and (4) design-related causes. In addition, there are two underlying groupings for mitigation measures: (1) bid evaluation and project planning mitigation measures and (2) project initiation and contractor selection mitigation measures. The results of PLS-SEM illustrate that six out of eight hypotheses are supported, as shown in Table 14.
The results of PLS-SEM illustrate that bid evaluation and project planning mitigation measures positively affect efficiency and contract management- and design-related causes. Therefore, bid evaluation should encompass a comprehensive analysis aimed at selecting the most economically advantageous bid that also conforms to the project quality standards. In addition, there is a necessity for adequate project planning, including practicable schedules and specifications, that allows contractors to implement effective time management, adhere to the pre-set contract, and avoid design-related issues. The findings also demonstrate that project initiation and contractor selection mitigation measures positively affect claim management-, efficiency and contract management-, estimation and scheduling-, and design-related causes. Therefore, a well-established project initiation, including clear objectives and scope, can minimize considerable changes that might result in delay, rework, disruption of project rhythm, and cost overrun. Selecting the right contractor is crucial as it directly impacts the overall project performance. Opting for a contractor with proficiency, a skilled project team, and proven track records, especially in similar projects, ensures a more streamlined construction process. This study provides empirical evidence of the relationships between the causes of cost overrun and mitigation measures. It enables the identification of the critical causes of cost overrun while offering effective mitigation measures to minimize their impact. By identifying effective mitigation measures, stakeholders can proactively manage potential cost overruns, thereby enhancing project cost control and ensuring the successful execution of the project.

Author Contributions

Conceptualization, Y.A., M.S.A.-M. and R.A.R.; Methodology, Y.A., M.S.A.-M. and R.A.R.; Software, M.S.A.-M.; Validation, Y.A. and R.A.R.; Formal analysis, M.S.A.-M.; Investigation, M.S.A.-M.; Resources, Y.A. and R.A.R.; Data curation, Y.A. and M.S.A.-M.; Writing—original draft, Y.A. and M.S.A.-M.; Writing—review & editing, R.A.R.; Visualization, M.S.A.-M.; Supervision, R.A.R.; Project administration, Y.A. and R.A.R.; Funding acquisition, Y.A. All authors have read and agreed to the published version of the manuscript.

Funding

This study is supported via funding from Prince sattam bin Abdulaziz University project number (PSAU/2024/R/1445).

Data Availability Statement

The data presented in this study are available upon request from the corresponding authors. The data are not publicly available due to some data being proprietary or confidential in nature. Therefore, the data may only be provided with restrictions.

Acknowledgments

The authors are grateful to the editors and anonymous reviewers for their insightful comments which improved this paper’s quality. The authors are also thankful to the indutry practitioners that participated in this work.

Conflicts of Interest

The authors declare no conflict of interest.

References

  1. Vision 2030. Kingdom of Saudi Arabia. 2016. Available online: https://www.vision2030.gov.sa/media/cofh1nmf/vision-2030-overview.pdf (accessed on 12 January 2024).
  2. Ghulam, Y.; Mousa, L. Estimation of productivity growth in the Saudi higher education sector. Technol. Forecast. Soc. Chang. 2019, 149, 119741. [Google Scholar] [CrossRef]
  3. Ministry of Education, Public Universities. 2022. Available online: https://moe.gov.sa/en/education/highereducation/Pages/UniversitiesList.aspx (accessed on 14 January 2024).
  4. Saudi Arabian Monetary Authority. Fifty-Fifth Annual Report. 2020. Available online: http://www.sama.gov.sa/en-US/EconomicReports/Pages/AnnualReport.aspx (accessed on 14 January 2024).
  5. Alshihri, S.; Al-gahtani, K.; Almohsen, A. Risk factors that lead to time and cost overruns of building projects in Saudi Arabia. Buildings 2022, 12, 902. [Google Scholar] [CrossRef]
  6. Asiedu, R.O.; Ameyaw, C. A system dynamics approach to conceptualize causes of cost overrun of construction projects in developing countries. Int. J. Build. Pathol. Adapt. 2021, 39, 831–851. [Google Scholar] [CrossRef]
  7. Jalal, M.P.; Shoar, S. A hybrid SD-DEMATEL approach to develop a delay model for construction projects. Eng. Constr. Archit. Manag. 2017, 24, 29–651. [Google Scholar] [CrossRef]
  8. Johnson, R.M.; Babu, R.I.I. Time and cost overruns in the UAE construction industry: A critical analysis. Int. J. Constr. Manag. 2020, 20, 402–411. [Google Scholar] [CrossRef]
  9. Asiedu, R.O.; Frempong, N.K.; Alfen, H.W. Predicting likelihood of cost overrun in educational projects. Eng. Constr. Archit. Manag. 2017, 24, 21–39. [Google Scholar] [CrossRef]
  10. Asiedu, R.O.; Adaku, E. Cost overruns of public sector construction projects: A developing country perspective. Int. J. Manag. Proj. Bus. 2020, 13, 66–84. [Google Scholar] [CrossRef]
  11. Famiyeh, S.; Amoatey, C.T.; Adaku, E.; Agbenohevi, C.S. Major causes of construction time and cost overruns: A case of selected educational sector projects in Ghana. J. Eng. Des. Technol. 2017, 15, 181–198. [Google Scholar] [CrossRef]
  12. Annamalaisami, C.D.; Kuppuswamy, A. Reckoning construction cost overruns in building projects through methodological consequences. Int. J. Constr. Manag. 2019, 22, 1079–1089. [Google Scholar] [CrossRef]
  13. Abbasi, O.; Noorzai, E.; Gharouni Jafari, K.; Golabchi, M. Exploring the causes of delays in the construction industry using a cause-and-effect diagram: Case study for Iran. J. Archit. Eng. 2020, 26, 05020008. [Google Scholar] [CrossRef]
  14. Prasad, K.V.; Vasugi, V.; Venkatesan, R.; Bhat, N.S. Critical causes of time overrun in Indian construction projects and mitigation measures. Int. J. Constr. Educ. Res. 2019, 15, 216–238. [Google Scholar] [CrossRef]
  15. Doloi, H.; Sawhney, A.; Iyer, K.C.; Rentala, S. Analysing factors affecting delays in Indian construction projects. Int. J. Proj. Manag. 2012, 30, 479–489. [Google Scholar] [CrossRef]
  16. Ullah, K.; Abdullah, A.H.; Nagapan, S.; Sohu, S.; Khan, M.S. Measures to mitigate causative factors of budget overrun in Malaysian building projects. Int. J. Integr. Eng. 2018, 10, 66–71. [Google Scholar] [CrossRef]
  17. Doloi, H. Cost overruns and failure in project management: Understanding the roles of key stakeholders in construction Projects. J. Constr. Eng. Manag. 2013, 139, 267–279. [Google Scholar] [CrossRef]
  18. Enshassi, A.; Al-Najjar, J.; Kumaraswamy, M. Delays and cost overruns in the construction projects in the Gaza Strip. J. Financ. Manag. Prop. Constr. 2009, 14, 126–151. [Google Scholar] [CrossRef]
  19. Kim, S.Y.; Tuan, K.N.; Lee, J.D.; Pham, H.; Luu, V.T. Cost overrun factor analysis for hospital projects in Vietnam. KSCE J. Civ. Eng. 2018, 22, 1–11. [Google Scholar] [CrossRef]
  20. Annamalaisami, C.D.; Kuppuswamy, A. Managing cost risks: Toward a taxonomy of cost Overrun factors in building construction projects. ASCE-ASME Journal of Risk Uncertain. Eng. Syst. Part A Civ. Eng. 2021, 7, 04021021. [Google Scholar] [CrossRef]
  21. Durdyev, S. Review of construction journals on causes of project cost overruns. Eng. Constr. Archit. Manag. 2020, 28, 1241–1260. [Google Scholar] [CrossRef]
  22. Lopez, R.; Love, P.E.D.; Edwards, D.J.; Davis, P.R. Design error classification, causation, and prevention in construction engineering. J. Perform. Constr. Facil. 2010, 24, 399–408. [Google Scholar] [CrossRef]
  23. Rahman, I.A.; Memon, A.H.; Azis, A.A.A.; Abdullah, N.H. Modeling causes of cost overrun in large construction projects with Partial Least Square-SEM Approach: Contractor’s perspective. Res. J. Appl. Sci. Eng. Technol. 2013, 5, 1963–1972. [Google Scholar] [CrossRef]
  24. Raouf, A.; Al-Ghamdi, S.G. Impact of project delivery systems on cost overruns of green building projects: System dynamics approach. In Proceedings of the International Conference on Sustainable Infrastructure 2019: Leading Resilient Communities through the 21st Century, Los Angeles, CA, USA, 6–9 November 2019; pp. 371–379. [Google Scholar]
  25. Oyegoke, A.S.; Al Kiyumi, N. The causes, impacts and mitigations of delay in megaprojects in the Sultanate of Oman. J. Financ. Manag. Prop. Constr. 2017, 22, 286–302. [Google Scholar] [CrossRef]
  26. Arantes, A.; Ferreira, L.M.D.F. A methodology for the development of delay mitigation measures in construction projects. Prod. Plan. Control 2021, 32, 228–241. [Google Scholar] [CrossRef]
  27. Assaf, S.A.; Al-Hejji, S. Causes of delay in large construction projects. Int. J. Proj. Manag. 2006, 24, 349–357. [Google Scholar] [CrossRef]
  28. Yap, J.B.H.; Goay, P.L.; Woon, Y.B.; Skitmore, M. Revisiting critical delay factors for construction: Analyzing projects in Malaysia. Alex. Eng. J. 2021, 60, 1717–1729. [Google Scholar] [CrossRef]
  29. Zidane, Y.J.T.; Andersen, B. The top 10 universal delay factors in construction projects. Int. J. Manag. Proj. Bus. 2018, 11, 650–672. [Google Scholar] [CrossRef]
  30. Odeh, A.M.; Battaineh, H.T. Causes of construction delay: Traditional contracts. Int. J. Proj. Manag. 2002, 20, 7–73. [Google Scholar] [CrossRef]
  31. Zewdu, Z.T. Construction projects delay and their antidotes: The case of Ethiopian construction sector. Int. J. Bus. Econ. Res. 2016, 5, 113. [Google Scholar] [CrossRef]
  32. Mpofu, B.; Ochieng, E.G.; Moobela, C.; Pretorius, A. Profiling causative factors leading to construction project delays in the United Arab Emirates. Eng. Constr. Archit. Manag. 2017, 24, 346–376. [Google Scholar] [CrossRef]
  33. Alnuaimi, A.S.; Taha, R.A.; Al Mohsin, M.; Al-Harthi, A.S. Causes, effects, benefits, and remedies of change orders on public construction projects in Oman. J. Constr. Eng. Manag. 2010, 136, 615–622. [Google Scholar] [CrossRef]
  34. El-Sayegh, S.; Ahmad, I.; Aljanabi, M.; Herzallah, R.; Metry, S.; El-Ashwal, O. Construction disputes in the UAE: Causes and resolution methods. Buildings 2020, 10, 171. [Google Scholar] [CrossRef]
  35. Gündüz, M.; Nielsen, Y.; Özdemir, M. Quantification of delay factors using the relative importance index method for construction projects in Turkey. J. Manag. Eng. 2012, 29, 133–139. [Google Scholar] [CrossRef]
  36. Wang, C.; Yap, J.B.H.; Wood, L.C.; Abdul-Rahman, H. Knowledge modeling for contract disputes and change control. Prod. Plan. Control 2019, 30, 650–664. [Google Scholar] [CrossRef]
  37. AL Mousli, M.H.; El-Sayegh, S.M. Assessment of the design–construction interface problems in the UAE. Archit. Eng. Des. Mana. 2016, 12, 353–366. [Google Scholar] [CrossRef]
  38. Abdul-Rahman, H.; Berawi, M.A.; Berawi, A.R.; Mohamed, O.; Othman, M.; Yahya, I.A. Delay mitigation in the Malaysian construction industry. J. Constr. Eng. Manag. 2006, 132, 125–133. [Google Scholar] [CrossRef]
  39. Kog, Y.C. Construction delays in Indonesia, Malaysia, Thailand, and Vietnam. Pract. Period. Struct. Des. Constr. 2019, 24, 4019013. [Google Scholar] [CrossRef]
  40. Faridi, A.S.; El-Sayegh, S.M. Significant factors causing delay in the UAE construction industry. Constr. Manag. Econ. 2006, 24, 1167–1176. [Google Scholar] [CrossRef]
  41. Arantes, A.; Ferreira, L.M.D.F.; Costa, A.A. Is the construction industry aware of supply chain management? The Portuguese contractors’ perspective. Supply Chain. Manag. 2015, 20, 404–414. [Google Scholar] [CrossRef]
  42. Asiedu, R.O.; Adaku, E.; Owusu-Manu, D.G. Beyond the causes: Rethinking mitigating measures to avert cost and time overruns in construction projects. Constr. Innov. 2017, 17, 363–380. [Google Scholar] [CrossRef]
  43. Al-Mohammad, M.S.; Haron, A.T.; Esa, M.; Aloko, M.N.; Alhammadi, Y.; Anandh, K.S.; Rahman, R.A. Factors affecting BIM implementation: Evidence from countries with different income levels. Constr. Innov. 2023, 23, 683–710. [Google Scholar] [CrossRef]
  44. Zhang, L.; Chu, Z.; He, Q.; Zhai, P. Investigating the constraints to buidling information modeling (BIM) applications for sustainable building projects: A case of China. Sustainability 2019, 11, 1896. [Google Scholar] [CrossRef]
  45. Hong, Y.; Hammad, A.W.A.; Akbarnezhad, A. Impact of organization size and project type on BIM adoption in the Chinese construction market. Constr. Manag. Econ. 2019, 37, 675–691. [Google Scholar] [CrossRef]
  46. Shoar, S.; Yiu, T.W.; Payan, S.; Parchamijalal, M. Modeling cost overrun in building construction projects using the interpretive structural modeling approach: A developing country perspective. Eng. Constr. Archit. Manag. 2023, 30, 365–392. [Google Scholar] [CrossRef]
  47. Gómez-Cabrera, A.; Gutierrez-Bucheli, L.; Muñoz, S. Causes of time and cost overruns in construction projects: A scoping review. Int. J. Constr. Manag. 2023. [Google Scholar] [CrossRef]
  48. Sharma, V.K.; Sharma, S.K.; Singh, A.P. Risk enablers modelling for infrastructure projects using Bayesian belief network. Int. J. Constr. Manag. 2019, 22, 993–1010. [Google Scholar] [CrossRef]
  49. Krejcie, R.V.; Morgan, D.W. Determining sample size for research activities. Educ. Psychol. Meas. 1970, 30, 607–610. [Google Scholar] [CrossRef]
  50. Akintoye, A. Analysis of factors influencing project cost estimating practice. Constr. Manag. Econ. 2000, 18, 77–89. [Google Scholar] [CrossRef]
  51. Phang, T.C.H.; Chen, C.; Tiong, R.L.K. New model for identifying critical success factors influencing BIM adoption from precast concrete manufacturers’ view. J. Constr. Eng. Manag. 2020, 146, 4020014. [Google Scholar] [CrossRef]
  52. Olawumi, T.O.; Chan, D.W.M. Developing project evaluation models for smart sustainable practices implementation in construction projects: A comparative study between Nigeria and Hong Kong. Eng. Constr. Archit. Manag. 2021, 29, 1522–1552. [Google Scholar] [CrossRef]
  53. Hair, J.F.; Black, W.C.; Babin, B.J.; Anderson, R.E. Multivariate Data Analysis, 7th ed.; Prentice Hall: Englewood Cliffs, NJ, USA, 2010. [Google Scholar]
  54. Yap, J.B.H.; Chow, I.N.; Shavarebi, K. Criticality of construction industry problems in developing countries: Analyzing Malaysian projects. J. Manag. Eng. 2019, 35, 04019020. [Google Scholar] [CrossRef]
  55. Schumacker, R.E.; Lomax, R.G. A Beginner’s Guide to Structural Equation Modeling, 2nd ed.; Lawrence Erlbaum Associates: Mahwan, India, 2004. [Google Scholar]
  56. Lee, S.; Yu, J.; Jeong, D. BIM acceptance model in construction organizations. J. Manag. Eng. 2015, 31, 04014048. [Google Scholar] [CrossRef]
  57. Amini, S.; Rezvani, A.; Tabassi, M.; Malek Sadati, S.S. Causes of cost overruns in building construction projects in Asian countries; Iran as a case study. Eng. Constr. Archit. Manag. 2023, 30, 2739–2766. [Google Scholar] [CrossRef]
  58. Obianyo, J.I.; Okey, O.E.; Alaneme, G.U. Assessment of cost overrun factors in construction projects in Nigeria using fuzzy logic. Innov. Infrastruct. Solut. 2022, 7, 1–20. [Google Scholar] [CrossRef]
  59. Memon, A.Q.; Memon, A.H.; Soomro, M.A. Contractor’s perception on factors causing cost overrun in construction works of Pakistan. Int. J. Sustain. Constr. Eng. Technol. 2020, 11, 84–92. [Google Scholar] [CrossRef]
  60. Shaikh, F.A. Financial mismanagement: A leading cause of time and cost overrun in mega construction projects in Pakistan. Eng. Technol. Appl. Sci. Res. 2020, 10, 5247–5250. [Google Scholar] [CrossRef]
  61. Olawale, Y.A.; Sun, M. Cost and time control of construction projects: Inhibiting factors and mitigating measures in practice. Constr. Manag. Econ. 2010, 28, 509–526. [Google Scholar] [CrossRef]
  62. Ali, A.S.; Kamaruzzaman, S.N. Cost performance for building construction projects in Klang Valley. J. Build. Perform. 2010, 1, 110–118. Available online: https://core.ac.uk/download/pdf/11491576.pdf (accessed on 14 January 2024).
  63. Luvara, V.G.M.; Phoya, S.; Tesha, D.N.G.A.K.; Lyimo, K.S. Critical factors causing delay and cost overrun in public building projects in Dar-Es-Salaam, Tanzania. Paripex-Indian J. Res. 2018, 7, 11–16. Available online: https://ssrn.com/abstract=3580627 (accessed on 14 January 2024).
  64. Haslinda, A.N.; Xian, T.W.; Norfarahayu, K.; Hanafi, R.M.; Fikri, H.M. Investigation on the factors influencing construction time and cost overrun for high-rise building projects in Penang. IOP Conf. Ser. J. Phys. Conf. Ser. 2018, 995, 012043. [Google Scholar] [CrossRef]
  65. Okakpu, A.; GhaffarianHoseini, A.; Tookey, J.; Haar, J.; Ghaffarianhoseini, A. Exploring the environmental influence on BIM adoption for refurbishment project using structural equation modeling. Archit. Eng. Des. Manag. 2020, 16, 41–57. [Google Scholar] [CrossRef]
  66. Kaiser, H.F. An index of factorial simplicity. Psychometrika 1974, 39, 31–36. [Google Scholar] [CrossRef]
  67. Moon, H.; Williams, T.P.; Lee, H.S.; Park, M. Predicting project cost overrun levels in bidding stage using ensemble learning. J. Asian Archit. Build. Eng. 2020, 19, 586–599. [Google Scholar] [CrossRef]
  68. Eke, G.; Elgy, J.; Wedawatta, G. Establishing a link between contractor selection strategy and project outcomes: Simulation study. J. Constr. Eng. Manag. 2019, 145, 04019062. [Google Scholar] [CrossRef]
  69. Olaniran, O.J. The effects of cost-based contractor selection on construction project performance. J. Financ. Manag. Prop. Constr. 2015, 20, 235–251. [Google Scholar] [CrossRef]
  70. Yap, J.B.H.; Abdul-Rahman, H.; Chen, W. Collaborative model: Managing design changes with reusable project experiences through project learning and effective communication. Int. J. Proj. Manag. 2017, 35, 1253–1271. [Google Scholar] [CrossRef]
  71. Doloi, H. Analysis of pre-qualification criteria in contractor selection and their impacts on project success. Constr. Manag. Econ. 2009, 27, 1245–1263. [Google Scholar] [CrossRef]
  72. Hasnain, M.; Thaheem, M.J.; Ullah, F. Best value contractor selection in road construction projects: ANP-based decision support system. Int. J. Civ. Eng. 2018, 16, 695–714. [Google Scholar] [CrossRef]
  73. Jeyakanthan, J.; Jayawardane, A.K.W. Mitigating delays in donor funded road projects in Sri Lanka. Engineer 2012, 45, 65–75. [Google Scholar] [CrossRef]
  74. Alsugair, A.M. Framework for evaluating bids of construction contractors. J. Manag. Eng. 1999, 15, 72–78. [Google Scholar] [CrossRef]
  75. Hanna, M.; Ruwanpura, J.Y. Simulation tool for manpower forecast loading and resource leveling. In Proceedings of the 2007 Winter Simulation Conference, Washington, DC, USA, 9–12 December 2007; pp. 2099–2103. [Google Scholar] [CrossRef]
  76. Le-Hoai, L.; Lee, Y.D.; Lee, J.Y. Delay and cost overruns in Vietnam large construction projects: A comparison with other selected countries. KSCE J. Civ. Eng. 2008, 12, 367–377. [Google Scholar] [CrossRef]
  77. Khan, S.; Saquib, M.; Hussain, A. Quality issues related to the design and construction stage of a project in the Indian construction industry. Front. Eng. Built Environ. 2021, 1, 188–202. [Google Scholar] [CrossRef]
  78. Safapour, E.; Kermanshachi, S. Identifying early indicators of manageable rework causes and selecting mitigating best practices for construction. J. Manag. Eng. 2019, 35, 04018060. [Google Scholar] [CrossRef]
  79. Hilali, A.; Charoenngam, C.; Barman, A. Barriers in contractual scope management of international development projects in Afghanistan. Eng. Constr. Archit. Manag. 2019, 26, 1574–1592. [Google Scholar] [CrossRef]
  80. Illankoon, I.M.C.S.; Tam, V.W.Y.; Le, K.N.; Ranadewa, K.A.T.O. Causes of disputes, factors affecting dispute resolution, and effective alternative dispute resolution for Sri Lankan construction industry. Int. J. Constr. Manag. 2022, 22, 218–228. [Google Scholar] [CrossRef]
  81. Cooper, R.; Mcpherson, D.; Luis, E.G.; Charles, J. Global Construction Disputes—Don’t Get Left Behind. 2017. Available online: https://go.adr.org/rs/294-SFS-516/images/2%20-%20Global%20Construction%20Disputes%20-%20Dont%20Get%20Left%20Behind.pdf (accessed on 12 January 2024).
  82. Elbashbishy, T.S.; Hosny, O.A.; Waly, A.F.; Dorra, E.M. Assessing the impact of construction risks on cost overruns: A risk path simulation–driven approach. J. Manag. Eng. 2022, 38, 04022058. [Google Scholar] [CrossRef]
  83. Ali, B.; Zahoor, H.; Nasir, A.R.; Maqsoom, A.; Khan, R.W.A.; Mazher, K.M. BIM-based claims management system: A centralized information repository for extension of time claims. Autom. Constr. 2020, 110, 102937. [Google Scholar] [CrossRef]
  84. Acheamfour, V.K.; Kissi, E.; Adjei-Kumi, T.; Adinyira, E. Review of empirical arguments on contractor pre-qualification criteria. J. Eng. Des. Technol. 2020, 18, 70–83. [Google Scholar] [CrossRef]
  85. Mirza, M.A. Construction project claim management. In Proceedings of the PMI® Global Congress 2005—Asia Pacific, Singapore, 21–23 February 2005; Project Management Institute: Newtown Square, PA, USA, 2005. [Google Scholar]
  86. Arantes, A.; Ferreira, L.M.D.F. Development of delay mitigation measures in construction projects: A combined interpretative structural modeling and MICMAC analysis approach. Prod. Plan. Control 2023, 13, 615. [Google Scholar] [CrossRef]
  87. Jaselskis, E.J.; Russell, J.S. Risk analysis approach to selection of contractor evaluation method. J. Constr. Eng. Manag. 1992, 118, 814–821. [Google Scholar] [CrossRef]
  88. Alenazi, E.; Adamu, Z.; Al-Otaibi, A. Exploring the nature and impact of client-related delays on contemporary Saudi construction projects. Buildings 2022, 12, 880. [Google Scholar] [CrossRef]
  89. Palaneeswaran, E.; Kumaraswamy, M.M. Contractor selection for design/build projects. J. Constr. Eng. Manag. 2000, 126, 331–339. [Google Scholar] [CrossRef]
  90. Farouk, A.M.; Rahman, R.A. Integrated applications of building information modeling in project cost management: A systematic review. J. Eng. Des. Technol. 2023. ahead-of-print. [Google Scholar] [CrossRef]
Figure 1. Cost overrun in higher education building projects.
Buildings 14 00487 g001
Figure 2. Measurement model.
Buildings 14 00487 g002
Table 1. Causes of cost overrun in building projects.
IDCauses of Cost OverrunSource
CA01Rework[6,7]
CA02Labor productivity[7,24]
CA03Poor contract management[10]
CA04Contractor incompetency[6,7]
CA05Consultant incompetency[6,7]
CA06Design changes[11,21]
CA07Design errors[17,23,24]
CA08Price fluctuation[11,18]
CA09Harsh weather[10,21,23]
CA10Poor communication[10,11]
CA11Opportunistic behavior[24]
CA12Poor planning[17,21,24]
CA13Poor cost estimation[21,23]
CA14Execution delays[7,19]
CA15Delays in payments[10,11,23]
CA16A request, demand, or assertion of rights by a seller against a buyer, or vice versa, for consideration, compensation, or payment under the terms of a legally binding contract, such as for a disputed change[6,7]
CA17Poor financial management[11,21]
CA18Change order[6,10]
CA19Poor site supervision[6,17]
CA20Economic instabilities[6,7]
CA21Unreasonable client expectations[22]
Table 2. List of mitigation measures.
IDMitigation MeasuresSource
MM01Bidding and contract award processes based on the most economically advantages bid should be adopted[25,41]
MM02Damages and incentive clauses for early construction project completion should be included in the contracts[30]
MM03Maintaining appropriate provisions in the contract for design continencies from the bidding stage up to completion[31]
MM04Realistic and accurate plans and schedules should be arranged and considered in the bidding and award process[29,32]
MM05The contract should allow flexibility in the payment schedule against mutually agreed milestones to meet the working capital needs of the contractor[7,27]
MM06The contract should comprise management protocol for alterations and extra work orders[14,33]
MM07Owners should ensure project funding is secured before awarding the contract[7,34,42]
MM08Owners should hire consultants grounded on their track records and experience in similar construction projects[26]
MM09Owners should allow enough time for contractors to carry out the project’s feasibility study and formulate a comprehensive financial plan before contracting[7]
MM10In the bid evaluation process, owners should consider criteria that make it possible to select the most qualified contractors with solid financial background[7,13]
MM11The contract should set limits to the outsourcing of work by the contractor to subcontractor[32]
MM12Construction projects should be awarded to contractors with the appropriate skills and experience in similar projects[35]
MM13Contractors should include site project managers and engineers with production expertise in their bid proposals.[27,28,29,32]
MM14Contractors should have a list of pre-qualified reliable and high-quality suppliers in their bid proposal[13,15]
MM15Contractors should synchronize payment milestones in their bid proposals with the payment terms for outsourced suppliers[7,13]
MM16Contractors should implement appropriate overall organizational structures and communication systems linking all project teams throughout the project’s lifetime.[15,36,37]
MM17The roles and responsibilities of those involved in the project team should be clearly defined, and the designated decision-makers should also be clearly identified[15]
MM18A kick-off meeting must take place at the start of the project to define communication channels by giving all personnel contact information[38,39]
MM19Seniors, and those authorized to make decisions, should join in regular meetings at the construction site to solve any operational issues[38]
MM20Establishing an effective communication management plan to encourage a collaborative culture that develops a cohesive project team, thus promoting active involvement in the decision making and establishing a platform for project learning with reusable project knowledge[15,28]
MM21The project control systems should adopt integrating Building Information Modeling (BIM) and Project Management Information Systems (PMIS)[13]
MM22Contractors should promote regular communication and good rapport with the approving authority[40]
MM23Owners should eliminate or reduce bottlenecks and unnecessary bureaucracy within the payment process[26,27,34]
Table 3. Project characteristics.
CodeProjectInitial Contract Sum (SAR) Actual Construction Cost (SAR)Rise in Construction Cost (SAR)Cost Overrun %
Status
PROJ01Completed 7,000,000 7,001,392 1392 0.02
PROJ02Completed 43,352,554 43,396,208 43,654 0.1
PROJ03Completed 224,398,709 228,930,639 4,531,930 2.02
PROJ04Completed 69,028,021 70,651,041 1,623,020 2.35
PROJ05Abandoned 110,020,214 114,991,923 4,971,709 4.52
PROJ06Abandoned 129,601,065 136,130,503 6,529,438 5.04
PROJ07Abandoned 109,746,009 116,303,015 6,557,006 5.97
PROJ08Ongoing 126,421,167 134,106,504 7,685,337 6.08
PROJ09Abandoned 123,976,309 131,689,707 7,713,398 6.22
PROJ10Abandoned 130,699,170 139,261,770 8,562,600 6.55
PROJ11Abandoned 29,412,996 31,507,116 2,094,120 7.12
PROJ12Ongoing 67,994,526 72,924,129 4,929,603 7.25
PROJ13Completed 71,808,381 77,409,435 5,601,054 7.8
PROJ14Ongoing 69,463,400 75,072,547 5,609,147 8.07
PROJ15Ongoing 58,508,559 63,233,125 4,724,566 8.07
PROJ16Abandoned 69,998,352 75,865,708 5,867,356 8.38
PROJ17Completed 189,110,685 205,421,229 16,310,544 8.62
PROJ18Completed 73,061,869 79,564,375 6,502,506 8.9
PROJ19Completed 113,794,605 124,148,100 10,353,495 9.1
PROJ20Ongoing 66,942,203 73,350,948 6,408,745 9.57
PROJ21Completed 164,376,661 180,509,428 16,132,767 9.81
PROJ22Completed 4,571,892 5,028,780 456,888 9.99
PROJ23Completed 112,400,000 123,632,772 11,232,772 9.99
PROJ24Ongoing 39,961,725 43,957,898 3,996,173 10
PROJ25Completed 7,996,900 8,796,590 799,690 10
PROJ26Completed 5,387,730 5,387,730 00
PROJ27Ongoing 89,084,161 89,084,161 00
Table 4. Respondent profile.
Type of DistributionDescriptionFrequency%Cumulative %
Age<301411.8611.86
31–404739.8351.69
41–504134.7586.44
>501613.56100.00
Total118100.00
Highest education levelDiploma75.935.93
Bachelor’s7765.2571.19
Master’s2924.5895.76
PhD54.24100.00
Total118100.00
Nature of businessClient3630.5030.50
Contractor4134.7565.25
Consultant4134.75100.00
Total118100.00
Working experience in the AEC industry<175.935.93
1–51311.0216.95
6–101411.8628.81
11–152924.5853.39
16–201815.2568.64
>203731.36100.00
Total118100.00
Number of projects involved1 project86.786.78
2–5 projects1916.1022.88
6–10 projects3227.1250.00
>10 projects5950.00100.00
Total118100.00
Project type involvedInfrastructure8672.88
High-rise buildings3327.97
Non-high-rise buildings7361.86
Industrial3832.2
Others75.93
Company sizeSmall (3–19)1210.1710.17
Small to medium (20–50)1815.2625.43
Medium to large (51–200)3832.2057.63
Large (>200)5042.37100.00
Total118100.00
Company typePublic2924.5824.58
Private7765.2589.83
Semi public1210.17100.00
Total118100.00
Company age1–5 years75.935.93
6–10 years54.2410.17
11–15 years3227.1237.29
16–20 years4134.7472.03
>203327.97100.00
Total118100.00
International presenceDomestic11496.6196.61
International43.39100.00
118118 100
Table 5. Ranking of the causes of cost overrun.
IDCauses of Cost OverrunMSSDNVR
CA03Poor contract management4.2881.13301.000 *1
CA13Poor cost estimation4.2711.05940.990 *2
CA04Contractor incompetency4.1780.99250.938 *3
CA15Delays in payments4.1530.94850.923 *4
CA14Execution delays4.1440.99810.918 *5
CA12Poor planning4.1101.04420.899 *6
CA19Poor site supervision4.0421.08130.861 *7
CA05Consultant incompetency3.9831.07800.827 *8
CA16A request, demand, or assertion of rights by a seller against a buyer, or vice versa, for consideration, compensation, or payment under the terms of a legally binding contract, such as for a disputed change3.8981.00760.779 *9
CA06Design changes3.8981.15760.779 *10
CA18Change order3.8641.14660.760 *11
CA17Poor financial management3.8391.00400.745 *12
CA07Design errors3.8391.08580.745 *13
CA08Price fluctuation3.6531.14260.639 *14
CA02Labor productivity3.6361.31180.630 *15
CA01Rework3.5851.30960.601 *16
CA10Poor communication3.4660.95790.534 *17
CA11Opportunistic behavior3.3811.17610.48618
CA20Economic instabilities3.2711.24490.42319
CA21Unreasonable client expectations3.2371.27220.40420
CA09Harsh weather2.5251.14510.00021
NV (normalized value) = mean − minimum mean/maximum mean − minimum mean; R = Rank; * indicates that the cause is critical.
Table 6. Causes of cost overrun in building projects in the selected countries.
CountryKSAKSAIRNIRNGHAINDUAENGAPAKPAKPSEUKAUSGHAGHAMYSTZAMYS
ID\SourceThis Study[5][57][46][6][12][8][58][59][60][18][61][17][10][11][62][63][64]
CA031
CA132
CA043
CA154
CA145
CA126
CA197
CA058
CA169
CA0610
✓ Indicates that the cause of cost overrun is critical in the given study.
Table 7. Ranking of the mitigation measures.
IDMitigation MeasuresMSSDNVR
MM07Owners should ensure project funding is secured before awarding the contract4.3900.96111.000 *1
MM10In the bid evaluation process, owners should consider criteria that make it possible to select the most qualified contractors with solid financial background4.2291.00780.856 *2
MM08Owners should hire consultants grounded on their track records and experience in similar construction projects4.1360.94200.773 *3
MM12Construction projects should be awarded to contractors with the appropriate skills and experience in similar projects4.0681.01040.712 *4
MM23Owners should eliminate or reduce bottlenecks and unnecessary bureaucracy within the payment process4.0421.10470.689 *5
MM04Realistic and accurate plans and schedules should be arranged and considered in the bidding and award process3.9581.05730.614 *6
MM13Contractors should include site project managers and engineers with production expertise in their bid proposals.3.9240.94420.583 *7
MM18A kick-off meeting must take place at the start of the project to define communication channels by giving all personnel contact information3.8980.98180.561 *8
MM09Owners should allow enough time for contractors to carry out the project’s feasibility study and formulate a comprehensive financial plan before contracting3.8981.01600.561 *9
MM17The roles and responsibilities of those involved in the project team should be clearly defined, and the designated decision-makers should also be clearly identified3.8051.01490.47710
MM02Damages and incentive clauses for early construction project completion should be included in the contracts3.7540.92390.43211
MM06The contract should comprise management protocol for alterations and extra work orders3.6951.15110.37912
MM16Contractors should implement appropriate overall organizational structures and communication systems linking all project teams throughout the project’s lifetime.3.6611.03960.34813
MM03Maintaining appropriate provisions in the contract for design continencies from the bidding stage up to completion3.6021.06330.29514
MM14Contractors should have a list of pre-qualified reliable and high-quality suppliers in their bid proposal3.6021.12580.29515
MM19Seniors, and those authorized to make decisions, should join in regular meetings at the construction site to solve any operational issues3.5931.04790.28816
MM20Establishing an effective communication management plan to encourage a collaborative culture that develops a cohesive project team, thus promoting active involvement in the decision making and establishing a platform for project learning with reusable project knowledge3.5761.16510.27317
MM15Contractors should synchronize payment milestones in their bid proposals with the payment terms for outsourced suppliers3.5680.96500.26518
MM05The contract should allow flexibility in payment schedule against mutually agreed milestones to meet the working capital needs of the contractor3.5510.96610.25019
MM22Contractors should promote regular communication and good rapport with the approving authority3.4751.12250.18220
MM21The project control systems should adopt integrating Building Information Modeling (BIM) and Project Management Information Systems (PMIS)3.3641.13730.08321
MM11The contract should set limits to the outsourcing of work by the contractor to subcontractor3.3221.17580.04522
MM01Bidding and contract award processes based on the most economically advantages bid should be adopted3.2711.25860.00023
NV (normalized value) = mean − minimum mean/maximum mean − minimum mean; R = Rank; * indicates that the mitigation measure is critical.
Table 8. Results for agreement analysis (Kruskal–Wallis test).
IDAEC ExperienceNo. of Projects InvolvedNature of BusinessCompany SizeCompany Type
CA010.000 *0.002 *0.5600.005 *0.868
CA020.1620.6850.5060.021 *0.809
CA030.008 *0.029 *0.9650.001 *0.614
CA040.2190.003 *0.3690.011 *0.041 *
CA050.017 *0.017 *0.1320.0640.027 *
CA060.3570.1510.008 *0.6180.064
CA070.048 *0.0670.021 *0.0870.360
CA080.1740.0740.6220.007 *0.431
CA100.5550.4180.6980.4880.005 *
CA120.3200.5700.8950.0560.662
CA130.0610.7730.3510.8820.001 *
CA140.3000.1130.1030.8200.002 *
CA150.1350.3800.8120.3040.807
CA160.2470.039 *0.026 *0.0740.129
CA170.1630.033 *0.5690.027 *0.331
CA180.006 *0.002 *0.6300.2230.990
CA190.021 *0.018 *0.1610.003 *0.456
MM040.001 *0.000 *0.035 *0.003 *0.104
MM070.034 *0.000 *0.5480.0670.589
MM080.013 *0.1780.1340.1400.223
MM090.000 *0.020 *0.045 *0.007 *0.188
MM100.4730.4810.2880.036 *0.850
MM120.6270.6560.9070.0680.263
MM130.3570.7730.028 *0.014 *0.293
MM180.008 *0.006 *0.3160.000 *0.132
MM230.043 *0.1020.1960.011 *0.068
* Indicates significant differences in views among the respondents.
Table 9. Results of EFA for causes of cost overrun.
IDDescriptionLoadings
CMCAECCAESCADECA
Claim management-related causes (CMCA)
CA16A request, demand, or assertion of rights by a seller against a buyer, or vice versa, for consideration, compensation, or payment under the terms of a legally binding contract, such as for a disputed change0.822
CA18Change order0.786
CA05Consultant incompetency0.577
CA04Contractor incompetency0.567
CA17Poor financial management0.520
Efficiency and contract management-related causes (ECCA)
CA01Rework 0.835
CA03Poor contract management 0.719
CA02Labor productivity 0.682
Estimation and scheduling-related causes (ESCA)
CA13Poor cost estimation 0.758
CA14Execution delays 0.714
CA15Delays in payments 0.628
Design-related causes (DECA)
CA07Design errors 0.748
CA06Design changes 0.730
CA08Price fluctuation 0.689
Eigenvalues6.0451.3621.0841.017
Variance explained (%)19.50016.69815.95915.752
Cumulative (%)19.50036.19852.15767.909
Extraction method: PCA. Rotation method: varimax with Kaiser normalization.
Table 10. Results of EFA for mitigation measures.
IDDescriptionLoadings
BPMMPCMM
Bid evaluation and project planning mitigation measures (BPMM)
MM10In the bid evaluation process, owners should consider criteria that make it possible to select the most qualified contractors with solid financial background0.822
MM04Realistic and accurate plans and schedules should be arranged and considered in the bidding and award process0.786
MM09Owners should allow enough time for contractors to carry out the project’s feasibility study and formulate a comprehensive financial plan before contracting0.577
MM23Owners should eliminate or reduce bottlenecks and unnecessary bureaucracy within the payment process0.567
MM08Owners should hire consultants grounded on their track records and experience in similar construction projects0.520
Project initiation and contractor selection mitigation measures (PCMM)
MM18A kick-off meeting must take place at the start of the project to define communication channels by giving all personnel contact information 0.809
MM13Contractors should include site project managers and engineers with production expertise in their bid proposals. 0.774
MM07Owners should ensure project funding is secured before awarding the contract 0.663
MM12Construction projects should be awarded to contractors with the appropriate skills and experience in similar projects 0.518
Eigenvalues4.0981.092
Variance explained (%)30.54727.117
Cumulative (%)30.54757.664
Extraction method: PCA. Rotation method: varimax with Kaiser normalization.
Table 11. Measurement model evaluation.
ConstructIDLoadingCACRAVE
CMCACA040.8010.8540.8590.630
CA050.780
CA160.799
CA170.750
CA180.837
ECCACA010.8260.8080.8240.721
CA020.887
CA030.834
ESCACA130.6940.6490.7160.583
CA140.876
CA150.707
DECACA060.7970.7080.7370.632
CA070.870
CA080.711
BPMMMM040.8140.8060.8180.562
MM080.744
MM090.774
MM100.737
MM230.673
PCMMMM070.7770.7440.7470.566
MM120.709
MM130.779
MM180.741
Table 12. Discriminant validity.
ConstructCMCAECCAESCADECABPMMPCMM
CMCA0.794
ECCA0.6380.849
ESCA0.6150.4130.763
DECA0.5440.5590.4770.795
BPMM0.5730.5700.5210.5890.750
PCMM0.7650.5720.6000.5810.6110.752
Table 13. Cross loadings.
ConstructIDCMCAECCAESCADECABPMMPCMM
CMCACA040.8010.5890.5380.3580.5020.634
CA050.7800.5340.5280.4610.6500.603
CA160.7990.4320.4230.4710.3930.634
CA170.7500.4580.5700.3840.2870.579
CA180.8370.5010.3740.4830.3740.578
ECCACA010.4810.8260.2010.3940.4060.372
CA020.6160.8870.3880.6070.5050.561
CA030.5160.8340.4290.4020.5240.498
ESCACA130.3420.2960.6940.2670.1950.363
CA140.5960.4130.8760.5110.5700.540
CA150.4150.2120.7070.2510.3290.442
DECACA060.4320.3920.3230.7970.4240.458
CA070.5140.5080.5310.8700.5780.518
CA080.3310.4270.2400.7110.3800.400
BPMMMM040.5830.5780.3740.4620.8140.467
MM080.4790.3290.3700.5320.7440.499
MM090.4810.4560.5060.4080.7740.487
MM100.2440.3940.2690.3540.7370.361
MM230.2720.3420.4120.4410.6730.460
PCMMMM070.6830.4510.4450.4560.5450.777
MM120.5040.3970.4630.4070.4330.709
MM130.4920.4450.5130.4820.4510.779
MM180.6130.4260.3860.4000.4000.741
Table 14. Results of structural model evaluation.
HypothesesDecision
Hypothesis 1: bid evaluation and project planning mitigation measures positively affect claim management-related causesNot supported
Hypothesis 2: bid evaluation and project planning mitigation measures positively affect efficiency and contract management-related causesSupported
Hypothesis 3: bid evaluation and project planning mitigation measures positively affect estimation and scheduling-related causesNot supported
Hypothesis 4: bid evaluation and project planning mitigation measures positively affect design-related causesSupported
Hypothesis 5: project initiation and contractor selection mitigation measures positively affect claim management-related causesSupported
Hypothesis 6: project initiation and contractor selection mitigation measures positively affect efficiency and contract management-related causesSupported
Hypothesis 7: project initiation and contractor selection mitigation measures positively affect estimation and scheduling-related causesSupported
Hypothesis 8: project initiation and contractor selection mitigation measures positively affect design-related causesSupported
Disclaimer/Publisher’s Note: The statements, opinions and data contained in all publications are solely those of the individual author(s) and contributor(s) and not of MDPI and/or the editor(s). MDPI and/or the editor(s) disclaim responsibility for any injury to people or property resulting from any ideas, methods, instructions or products referred to in the content.

