Article

Data-Driven Dynamic Bayesian Network Model for Safety Resilience Evaluation of Prefabricated Building Construction

1
Hainan Institute, Wuhan University of Technology, Sanya 572025, China
2
School of Civil Engineering and Architecture, Wuhan University of Technology, Wuhan 430070, China
3
Capital Construction Department, Wuhan University of Technology, Wuhan 430070, China
*
Author to whom correspondence should be addressed.
Buildings 2024, 14(3), 570; https://doi.org/10.3390/buildings14030570
Submission received: 18 December 2023 / Revised: 16 February 2024 / Accepted: 18 February 2024 / Published: 21 February 2024
(This article belongs to the Special Issue Advances in Life Cycle Management of Civil Engineering)

Abstract

:
Due to factors such as the availability of assembly equipment, technology, and site management level, prefabricated building construction safety accidents often occur. To ensure the safety of prefabricated buildings and effectively reduce the accident rate, the concept of resilience is introduced into the safety management of prefabricated buildings. Based on the resilience absorption capacity, adaptation capacity, recovery capacity, and optimization capacity, a comprehensive evaluation index system for the safety resilience of prefabricated buildings is established. By combining prior knowledge with structural learning and parameter learning, a dynamic Bayesian network (DBN) model is constructed to dynamically evaluate the safety resilience of prefabricated buildings. Through forward causal reasoning and backward diagnostic reasoning, the dynamic safety resilience value of prefabricated buildings and the chain of maximum failure causes are obtained. Finally, by conducting a sensitivity analysis on the target nodes, the key influencing factors of the safety resilience of prefabricated construction are identified, and improvement suggestions for enhancing resilience are proposed. The results indicate that establishing a resilience safety culture, preventing unsafe behaviors of personnel, safety management, and supervision on the construction site, emergency management actions, and building a risk management information system are crucial factors influencing the safety resilience of prefabricated buildings. The enhancement of absorption capacity has the greatest impact on the safety resilience of prefabricated buildings.

1. Introduction

In response to the high energy consumption and pollution characteristics of the construction industry, the Chinese government has vigorously developed prefabricated buildings in recent years, promoting industrial transformation and upgrading [1]. The “Opinions on Promoting Green Development of Urban and Rural Construction” issued by the General Office of the Communist Party of China Central Committee and the General Office of the State Council in October 2021 pointed out that prefabricated buildings should be vigorously developed, with emphasis on promoting the construction of steel structure prefabricated residential units. The aim is to continuously improve the standardization level of components and promote the formation of a complete industry chain, providing guidelines for the green development transformation of urban and rural construction [2]. The “Development Plan for Building Energy Conservation and Green Building in the 14th Five-Year Plan Period” issued by the Ministry of Housing and Urban-Rural Development stipulated that by 2025, the proportion of prefabricated buildings in newly constructed urban buildings should reach 30% [3].
Compared with traditional cast-in-place buildings, prefabricated buildings have the advantages of faster construction, less wet work on site, lower labor costs, energy saving and environmental friendliness, and shorter construction time [4,5]. However, the construction of prefabricated buildings, characterized by different construction methods, a significant quantity of large prefabricated components, and frequent human–machine interactions, poses a higher risk of serious safety accidents [6]. Such accidents can result in severe casualties, property damage, and profound negative social consequences [7]. Resilience-based safety management focuses on a system’s ability to respond to risks and adverse events, adapt, recover, and ultimately achieve a new state of safety through a variety of system actions [8]. Therefore, introducing resilience theory into prefabricated building construction safety management, establishing a reasonable evaluation system, and evaluating the safety resilience of prefabricated building construction through scientific methods is of great significance to improving the ability of prefabricated building construction systems to respond to safety accidents and ensuring construction safety.
Conventional qualitative and quantitative assessment methods have been used for safety risk analysis and assessment in prefabricated building construction. For example, Xu [9] evaluated the safety factor of prefabricated building construction by an interpretive structural model (ISM) and Analytical Network Process (ANP), which can better reduce safety risks in prefabricated building construction. Li [10] combined structural equation modeling (SEM) with a system dynamic model (SDM) to construct a safety risk assessment model for prefabricated building construction. Through the analytic hierarchy process (AHP) and the entropy weight method, Liu [11] proposed a cloud model-based safety evaluation method for prefabricated building construction, which is helpful to improve the safety performance in the process of prefabricated building construction and reduce safety accidents. However, conventional approaches are unable to utilize the real-time information collected to update prior beliefs [12] or to incorporate the multi-state variables encountered in modeling complex systems. Bayesian inference can solve the limitations of the above methods due to its characteristics of dealing with uncertainty and updating beliefs.
As an effective reasoning tool that can model both historical data and expert experience, Bayesian network (BN) models have been widely used in infrastructure resilience assessment [13,14,15,16]. However, traditional BN-based analyses are static models that represent a joint probability distribution for a fixed point or time interval. They cannot effectively capture the dynamics of changing variables [17]. DBNs incorporate the element of time and integrate key nodes representing the evolution of accidents, making them an extension of conventional BNs [18]. However, in research based on DBN models, most researchers rely heavily on subjective methods to determine the structure and parameters of the BN. This reliance on expert knowledge and experience can lead to the incomplete discovery of all relevant relationships between factors, which significantly affects the subsequent risk propagation analysis [19]. As a result, the research results obtained may differ significantly from the real-world situation. The emergence of data-driven BN learning methods has led to a response to this question.
Data-driven BNs are used to find a highly fitting BN structure given a specific data set. Amin et al. combined principal component analysis (PCA) with a data-driven Bayesian network (BN) and proposed a fault detection and diagnosis (FDD) method [20]. Joo et al. constructed a Bayesian network from a reproducible long-term data set to perform a probabilistic assessment of driver collision risk [21]. Furthermore, when a problem proves resistant to a straightforward and precise solution, data-driven approaches can construct an approximate model based on historical data to approach the actual scenario [22].
To overcome the above challenges, this paper constructs a resilience index system and evaluation model for the evaluation of safety management in the construction phase of prefabricated buildings. Based on the resilience theory, the concept of safety resilience in prefabricated building construction is proposed and the theoretical framework for the safety resilience evaluation of prefabricated building construction is constructed. Combined with the relevant literature and expert interviews, a systematic and dynamic safety resilience evaluation index system for prefabricated building construction is constructed from four perspectives: absorptive capacity, adaptive capacity, recovery capacity, and optimization capacity. In order to avoid the BN conditional probability assignment, which may produce a large deviation due to the strong subjectivity of the expert scoring method, this study proposes to firstly integrate the expert opinions to establish the mandatory relationship between factors and then combine with the optimization algorithm to carry out in-depth learning of the structure and parameters of the DBN model to construct the data-driven DBN-based dynamic evaluation model of the safety resilience of the prefabricated building construction. In this paper, the concept of resilience is integrated into risk management, which breaks the deficiency of existing risk management that mostly emphasizes on ex ante control and provides a new perspective and theoretical method for the research of safety management in the construction phase of prefabricated buildings. The research results of the resilience evaluation system of the prefabricated building construction system and the optimization suggestions provide reference for improving the risk-resistant capability of the prefabricated building construction system, the rapid recovery capability after the occurrence of risky accidents, and the adaptive learning capability of potential risky accidents, so as to reduce the probability of occurrence of risky accidents or to reduce the losses due to the occurrence of risky accidents.
The paper is organized as follows: Section 2 presents the relevant literature. Section 3 introduces the methodology and establishes a model for the problem of this paper. Section 4 performs numerical calculations and results analysis. Section 5 discusses the model and puts forward some relevant management suggestions. Section 6 summarizes the full text.

2. Literature Review

2.1. Safety Management of Prefabricated Building Construction

Most research on safety management in prefabricated building construction has been carried out in the following three aspects: (1) Identification of safety risk factors. Statistical analysis has identified falls from height and lifting injuries as the most common types of accidents in prefabricated construction. The source of risk has often been attributed to structural instability. The main contributing factors to accidents have been found to be poor safety culture within the company and lack of compliance with safety management rules and procedures by employees [6,23,24]. (2) Quantification of safety levels in prefabricated building construction. Firstly, through theories such as accident causation theory, WBS-RBS matrix analysis [25], or WSR methodology [26], risk factors in prefabricated building construction have been identified from five aspects: personnel, machinery, regulations, environment, and management, and an evaluation index system has been established. Weighting methods such as the analytical hierarchy process [27], entropy weighting method [28], and integrated weighting method were used to assign weights to the evaluation criteria. Qualitative and quantitative evaluation methods such as fuzzy comprehensive evaluation [29], rough set theory [30], and support vector machines [31] were used to evaluate risks and determine risk levels. (3) Integration of advanced technologies for effective safety management. To improve the effectiveness of construction safety management of prefabricated buildings, the integration of technologies such as Building Information Modeling (BIM), Radio Frequency Identification (RFID), Internet of Things (IoT), and Artificial Intelligence (AI) has been proposed to enable intelligent monitoring and supervision of the construction process [32,33].
Most existing research on construction safety risk assessment has primarily emphasized on evaluating risks in prefabricated buildings based on static time and stationary conditions. However, these studies often overlook the interactive coupling evolution among different factors and fail to capture the dynamic evolution process of risks during different construction phases. Moreover, the current approach to safety risk management in prefabricated buildings is predominantly passive and primarily emphasizes pre-control measures. The main emphasis is placed on risk identification, assessment, and early warning to proactively establish effective response measures, thereby achieving the goal of avoiding risk accidents. There is a lack of research on how to manage and control risk accidents during their occurrence to minimize the resulting losses. Similarly, there is a research gap on how to improve the ability to respond to hazard events after they occur. There is a need for systematic research on construction safety resilience assessment and the dynamic prediction that is aligned with project progress. Such research should focus on the development of strategies to effectively manage hazard events as they unfold and to improve the overall ability to respond to them.

2.2. Safety Resilience in Prefabricated Building Construction

The term “resilience” comes from the Latin word “resilio”, meaning “to bounce back” or “return to the original state”. Canadian ecologist Holling was the first to apply the concept of resilience to ecosystem research. It described the ability of an ecosystem to maintain normal functioning when faced with external threats or to recover a state of equilibrium after a disturbance [34]. The concept emphasized the connection between resilience and systems. Since the 1990s, scholars have extended the study of resilience to various domains such as urban systems [35,36,37], complex system design [38,39], supply chains [40,41], manufacturing industries [42,43], and infrastructure resilience [44,45,46]. The concept of resilience has gradually gained recognition and importance in many fields.
Currently, research on resilience measurement of infrastructure systems mainly focused on two perspectives: system performance curve-based measurement and resilience capacity characterization-based measurement. The measurement of infrastructure system resilience based on system performance curves, exemplified by Bruneau et al., involved quantifying resilience values by evaluating the area enclosed between the temporal variation curve of system performance and the target performance curve [47]. With further research, scholars have improved and refined the basic models and proposed alternative dynamic measurement methods. For instance, they have introduced the ratio between the area enclosed by the actual system performance curve after perturbation and the time axis, and the area enclosed by the target performance curve and the time axis as a representation of resilience value [18,48]. Another approach is to use the ratio of the system’s recovery performance to its loss performance as a measure of resilience [49]. Research on resilience measurement in infrastructure systems, based on the representation of resilience capabilities, focused on quantifying resilience according to the definition of resilience. Scholars, represented by Vugrin, quantified system resilience as a combination of “absorption capacity, adaptation capacity, and recovery capacity”. In this approach, suitable indicators were selected based on resilience capacity, and a combination of qualitative and quantitative methods were employed to measure resilience [44,50]. For example, Majeed et al. proposed that the resilience of engineering systems consists of absorption capacity, adaptation capacity, and recovery capacity. They conducted a resilience assessment of engineering systems using an object-oriented dynamic Bayesian network approach and found that adaptation capacity contributed the most to system resilience, followed by absorption capacity and recovery capacity [15].
Through the analysis and synthesis of relevant resilience studies, it is found that resilience, as a new research direction, has varying definitions across different fields. This study introduces resilience theory to safety management during the prefabricated construction phase. Considering the complexity, uncertainty, fuzziness, and resource limitations associated with prefabricated construction, the resilience of safety in prefabricated building construction throughout this paper is defined as follows: During the process refabicated construction, when faced with unknown disturbances or impacts, safety management can resist or even prevent risks through its resilience. In the event of a risky accident, the system can spontaneously recover and learn from the accident, optimizing itself to better cope with risks. Figure 1 illustrates the concept curve of safety resilience in prefabricated construction, quantifying it as a combination of absorption capacity, adaptation capacity, recovery capacity, and optimization capacity. The absorption capacity during the t0~t1 phase refers to the system’s ability to automatically absorb disturbances and minimize the consequences while in the initial safe state. At time t1, the system encounters a risk shock, and the adaptability during the t1~t2 phase refers to the system’s ability to adjust itself and respond to the disturbances without any recovery activities. The recovery capacity during the t2~t3 phase refers to the system’s ability to recover to an acceptable level of normal performance by taking necessary emergency measures to address the risk shock or disturbance. Finally, the optimization capacity during the t3~t4 phase refers to the ability of the system to improve its ability to respond again to risk disturbances by modifying its structure and components based on accident learning.

3. Materials and Methods

The process of constructing a DBN model for assessing the safety resilience of prefabricated building construction is shown in Figure 2. The first step is to identify and filter the evaluation indicators for the resilience of safety in prefabricated building construction. The data obtained are then used to construct the BN model. This process involves relying on expert knowledge and referring to different algorithm models to construct or optimize the structure of the BN model and the probability distributions of its nodes. Finally, BN reasoning is performed based on the constructed model. There are three main types of BN reasoning: causal reasoning, diagnostic reasoning, and sensitivity analysis. Causal reasoning, also known as forward reasoning or top-down reasoning, involves inferring the probabilities of different outcomes from known evidence and analyzing the factors that influence these outcomes. Diagnostic reasoning, also known as reverse reasoning or bottom-up reasoning, aims to infer the most probable causes and their probabilities based on known results. Sensitivity analysis examines the impact of small changes in parameters (in this case, probabilities) on the target object, quantitatively analyzing the importance of these parameters for the target object [51].

3.1. Establishment of Evaluation Index System

Constructing a systematic and comprehensive evaluation index system is the key to evaluating the safety resilience of prefabricated building construction. Based on the systemic structure of safety management, the resilience functions of the system are identified. Through analysis of the relevant literature on safety management in prefabricated building construction [7,10,52], investigation reports of production safety accidents, standards and specifications, and technical regulations, as well as research related to resilience theory [53,54], indicators are extracted. A preliminary library of resilience indicators has been refined based on the resilience connotation and the four resilient characteristic capabilities of prefabricated building construction safety management, namely absorption capability, adaptation capability, recovery capability, and optimization capability. The Delphi method was used to develop the initial resilience indicator questionnaire. Data were collected, organized, and analyzed to identify indicators with low consensus and significant deviations in factor correspondences were eliminated. Eventually, a total of 29 final indicators for evaluating the safety resilience of the entire process of prefabricated building construction were selected, as shown in Table 1. Among them, each resilience evaluation index corresponded to a BN node. In order to reduce the complexity of the BN structure and improve the computational efficiency of model learning, some related indicators were merged into nodes.

3.2. Data-Driven Construction of Static BN

A BN is a probabilistic graphical model that represents the relationship between variables by pointing through arrow lines. Each node in the network represents a variable, the root node represents the probability of node occurrence using a priori probability, and the conditional probability between nodes represents the strength of the association between nodes. Bayesian formulas are based on conditional probabilities to explore the causes of events. Let X1, X2, … …Xn constitute a complete event, the variables are mutually exclusive and P(Xi) > 0. Assuming that there exists an event Y, which occurs at the same time as the other events X1, X2, … …Xn, then there is a Bayesian formula as shown in (1):
P ( X i | Y ) = P ( X i ) P ( Y | X i ) j = 1 n P ( X i ) P ( Y | X i )
P(Xi) in the formula denotes the probability that Xi occurs and is the a priori probability of node Xi. P (Xi|Y) denotes the probability of event Xi occurring under the condition of event Y occurring and is the Xi’s posterior a priori probability. In a BN, the posterior probability can be obtained by updating the prior probability. P (Y|Xi) is the conditional probability solved using the BN.
The BN as a whole satisfies the conditional independence assumption, that is, each node is independent of its non-parent node. Therefore, the joint probability of all nodes in the network can be expressed as the product of the conditional probabilities of each node, as shown in Equation (2):
P X 1 , X 2 , , X n = i = 1 n P X i X 1 , X 2 , , X i 1 = i = 1 n P X i | P a X i

3.2.1. Structure Learning

Whether the subjective learning network is scientific and effective depends directly on expert knowledge, which is subjective and fails to make full use of the advantages of BN data-mining technology [55]. This method may fail to ensure objectivity and reliability. Constructing a BN structure using machine learning algorithms can achieve higher learning efficiency and eliminate subjective experience. However, the technical limitations of statistical methods raise concerns about the rationality of the network. Indeed, a widely recognized and effective approach is to combine both subjective and objective elements in the construction of a BN [20]. This involves initially using machine learning algorithms and objective datasets to build the network structure. Subsequently, expert knowledge is incorporated to make reasonable adjustments and refinements. By integrating subjective and objective information, the network model can be continuously optimized and improved. This approach aims to achieve a balance between the advantages of data-driven techniques and the expertise of domain specialists. Considering the data availability and model accuracy, this paper adopts a combination of expert knowledge and self-learning from the database to construct a BN. This approach takes advantage of the efficiency of self-learning and avoids the redundancy of nodes and the confusion of structures.
Structure learning is used to determine the most appropriate topology for a BN by utilizing a training sample set and prior knowledge. In BN learning, an effective structure learning algorithm is the foundation for constructing the optimal network structure. As a heuristic search algorithm, the Tabu-Search (TS) algorithm simulates the human memory function and prevents repeated searches of already searched areas through the tabu table, speeding up the search progress and marking the visited areas’ local optimal points, thus avoiding falling into the local optimal point during the search process and ultimately achieving global optimization [56,57]. The basic steps are as follows [21]:
(1)
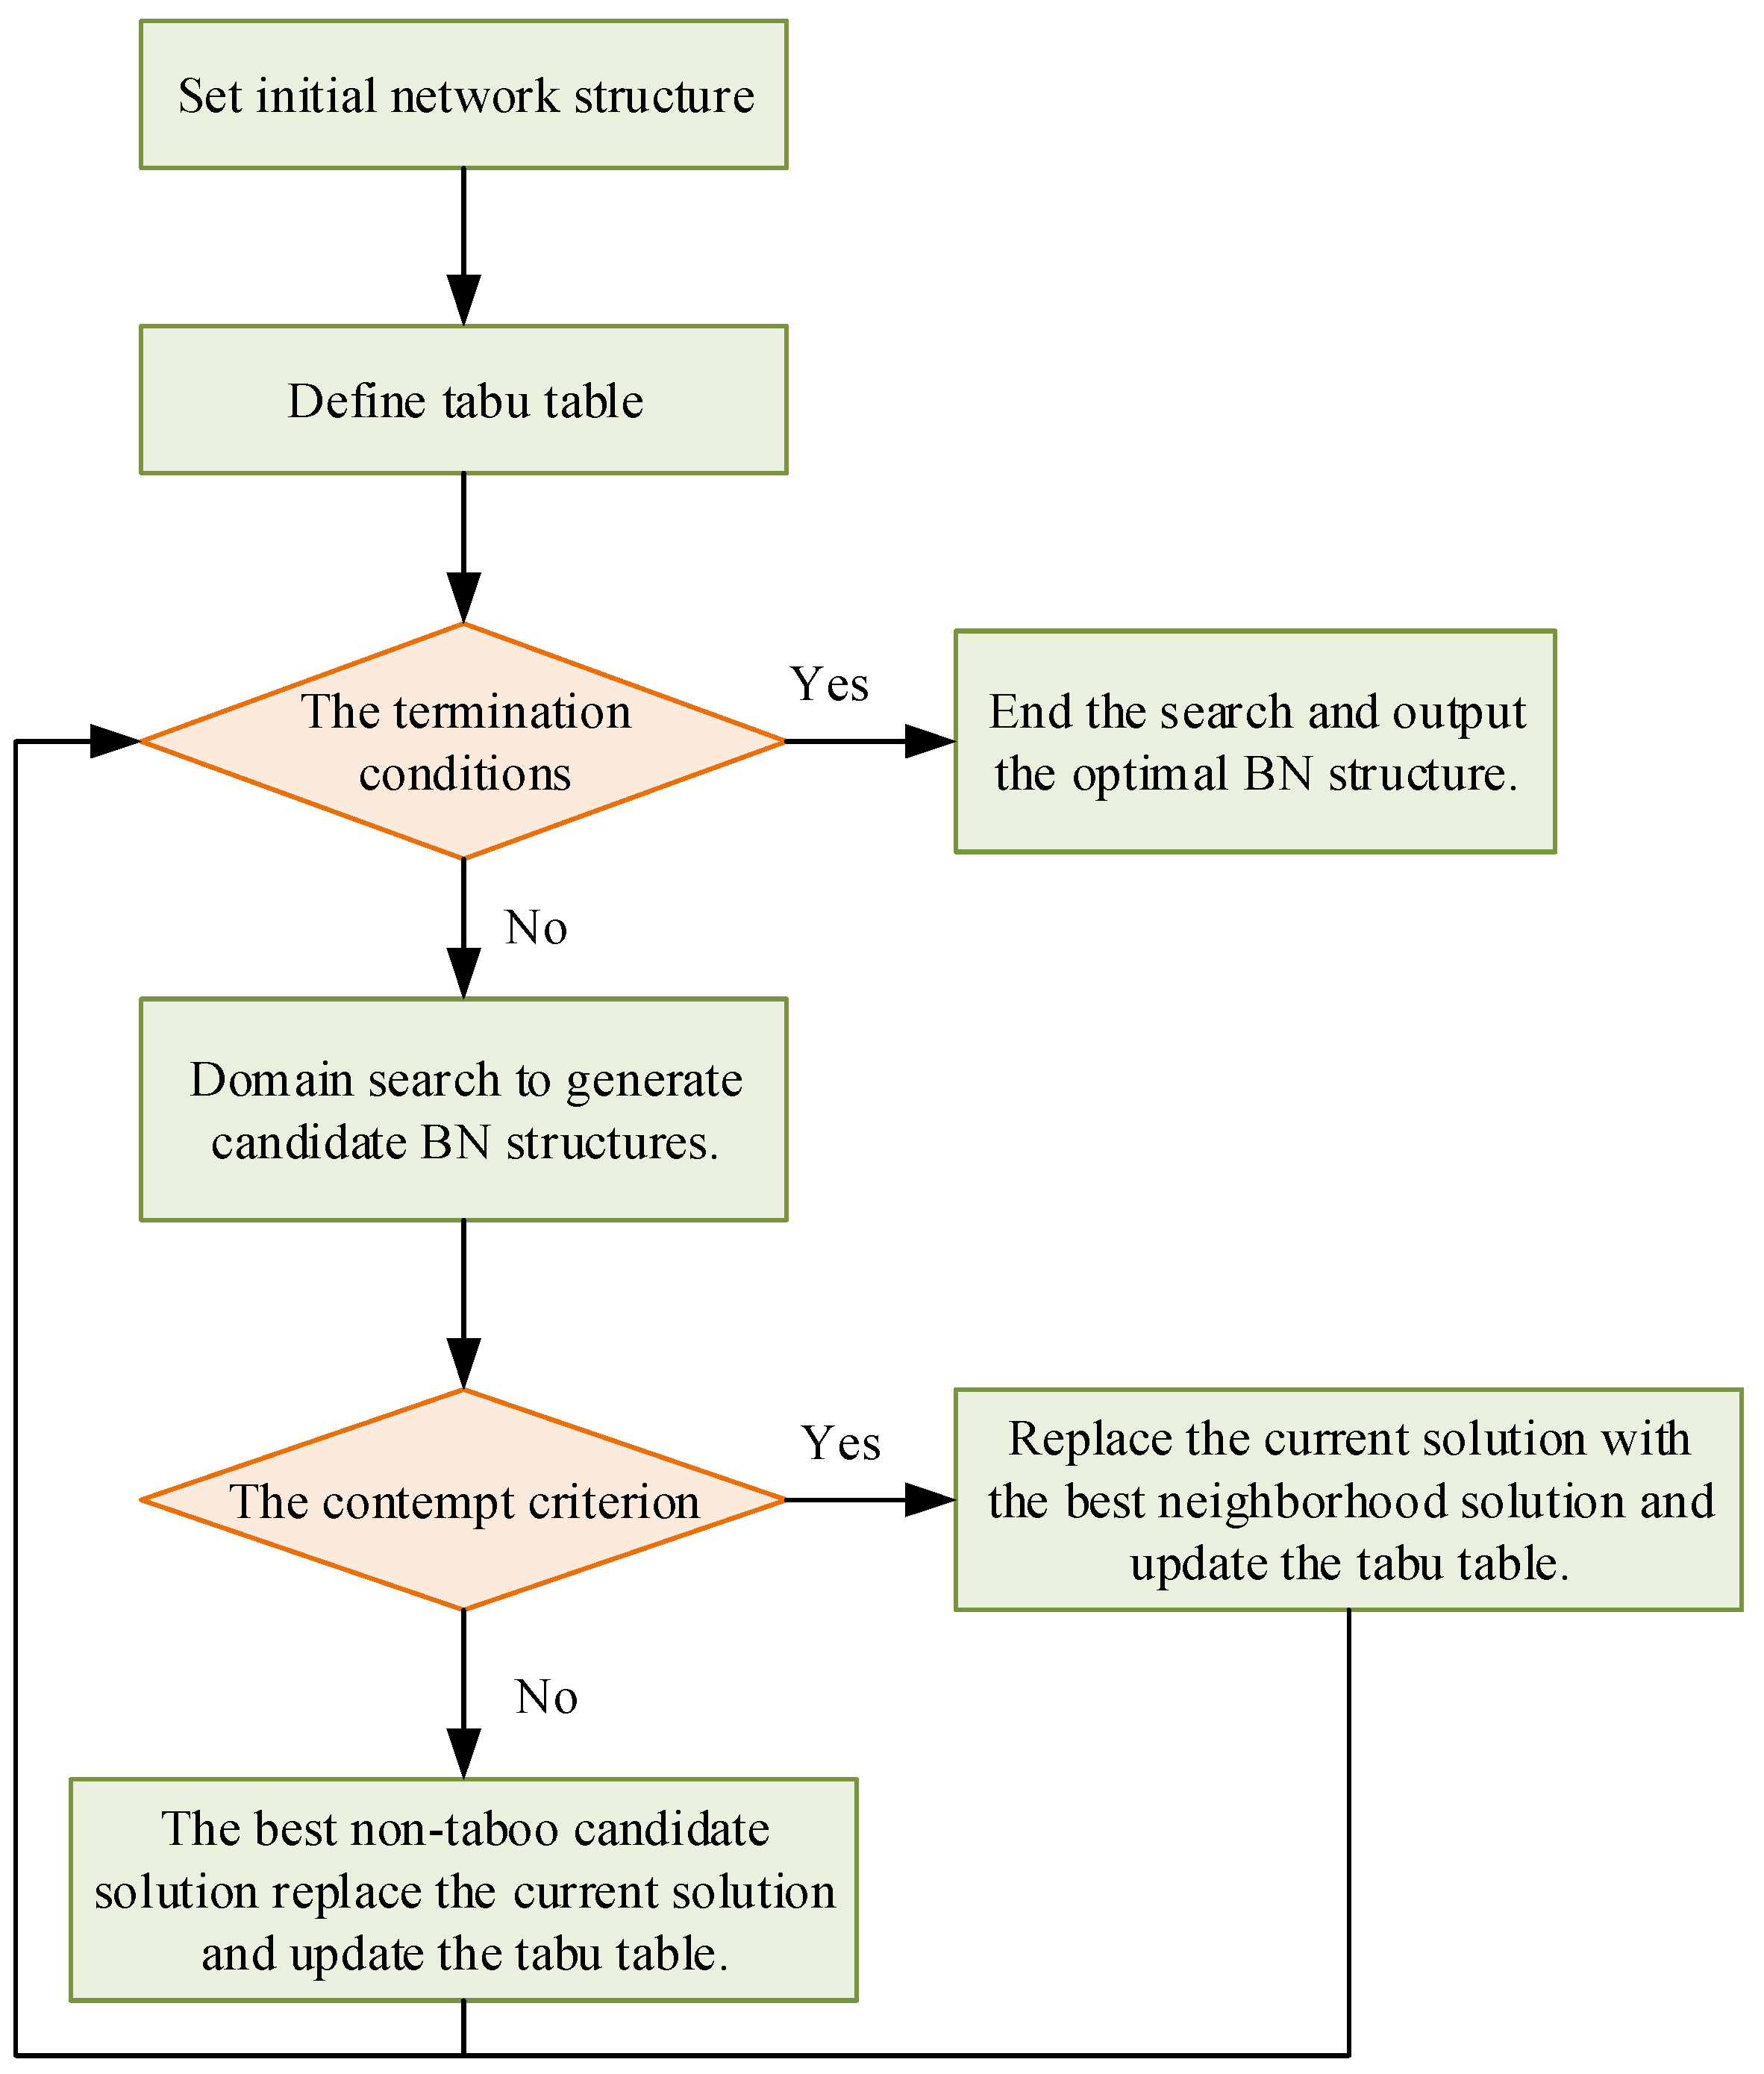
Set algorithm parameters and initialize network structure.
(2)
Define tabu table. Create a tabu table to record structures that have been banned from exploration to avoid duplication during the search process.
(3)
Determine termination conditions. The algorithm ends when a certain number of iterations is reached or the objective function value becomes stable.
(4)
Determine the current solution domain and generate candidate solutions. The algorithm generates a new structure by performing a neighborhood search on the current structure and evaluates its quality via an objective function.
(5)
Determine whether the candidate solution satisfies the contempt criterion. The defiance criterion compares the Bayesian scoring function values of two network structures to determine whether to accept a new structure that has been added to the tabu list, preventing the algorithm from missing the possible global optimal solution because it avoids taboo solutions during the search process. Improved algorithm flexibility.
(6)
Update tabu list. Update the tabu table with the taboo object corresponding to the new current solution, and then go to step (4).
The flow chart of the TS algorithm is shown in Figure 3.
To ensure the integrity and reliability of the data, this study collected reports of prefabricated building construction safety accidents from various sources, including the Ministry of Emergency Management of the People’s Republic of China, the Ministry of Housing and Urban-Rural Development, and the production safety supervision administration of various provinces and cities. The data collection spanned from 2010 to 2022, and a total of 267 prefabricated building construction safety accident reports were collected, of which 233 reports were deemed usable for analysis. The dichotomous processing of the extracted resilience index factors is beneficial for standardizing the data type and reducing parameter calculation complexity, as well as facilitating the subsequent quantification work. Therefore, there are only 2 simple cases of factors failing or not failing, with factors not failing recorded as “Yes” and factors failing recorded as “No”. Before learning the network structure, the researchers set a black-and-white list of arrow connections between nodes. The black list refers to the arrow connections that should not be learned, and the white list refers to the arrow connections that are specified to exist [19]. Based on the established safety resilience evaluation index system of prefabricated building construction and expert consultation opinions, a whitelist was set for nodes with known causal relationships to obtain the initial BN structure for structural learning, as shown in Figure 4.
The BN learning in this study was performed using the bnlearn package in R 4.2.2 software. The visualization and reasoning demonstration of the model was implemented using GENIE 3.0 software. The structure of the BN model developed by the TS algorithm is shown in Figure 5.

3.2.2. Parameter Learning

Parameter learning of the BN is used to determine the conditional probability distribution related to each node in the directed acyclic graph under the condition of knowing the topology of the BN. When complete data sets are available, the most commonly used parameter learning methods are maximum likelihood estimation and Bayesian methods, but in realistic situations, the collected data may be missing to varying degrees. When learning parameters for Bayesian networks with missing data, the Expectation-Maximization (EM) algorithm can be used. The essence of the EM algorithm is to transform incomplete data into complete data [58].
The EM algorithm is primarily composed of two steps: the E step to calculate the expectation and the M step to maximize it. By iterating these two steps until the algorithm converges, the estimates of the unknown parameters are calculated [59]. In fact, calculating the expectation is to calculate the lower bound of the log-likelihood function: set X as the unknown variable, Y as the observed variable, and D as the training set, and define q ( X = x | Y ) as the probability of X = x when the observed value is Y . Then, we can obtain x q ( X = x | Y ) = 1 .
Let the log-likelihood function L be
L ( θ ) = m log n P ( X = x i , Y = D )
Assuming that the function P ( X = x i , Y = D ) is a convex function with extremes, then according to Jensen’s inequality we can obtain
L = m log n q ( X | Y ) × P ( X = x i , Y = D ) q ( X | Y ) m n q ( X | Y ) × log P ( X = x i , Y = D ) q ( X | Y )
The EM algorithm obtains the lower bound of the parameter in the E step and updates the calculation in the M step to obtain its maximum value. Let q ( X = x | Y ) = P ( X | θ t ) , θ t represent the unknown parameter of the current iteration result and θ t + 1 be the parameter of the next iteration. Solving the lower bound of L is actually to find the parameter of the next iteration given the current parameter, with the lower bound of L set to Q ( θ t + 1 | θ ) , and then
Q ( θ t + 1 | θ ) = m n P ( X | θ t ) log P ( X , D | θ t + l )
Following the method in maximum likelihood estimation, find the parameter θ ^ ˙ t when Q ( θ t + 1 | θ ) is maximum.
θ ^ ˙ t = E N i j k E N i j
In the formula, E N i j k represents that the data set D satisfies X i = x i k , P a ( X i ) = P a ( X i ) j , that is, when the value of node i takes the k th value, the corresponding parent node is the data of j .
The BN network structure of this study has been determined. The research data were imported into GENIE, and the built-in EM algorithm of the GENIE 3.0 software was used to learn the parameters of the BN and finally obtain a complete static BN model that can be used for visual reasoning, as shown in Figure 6.

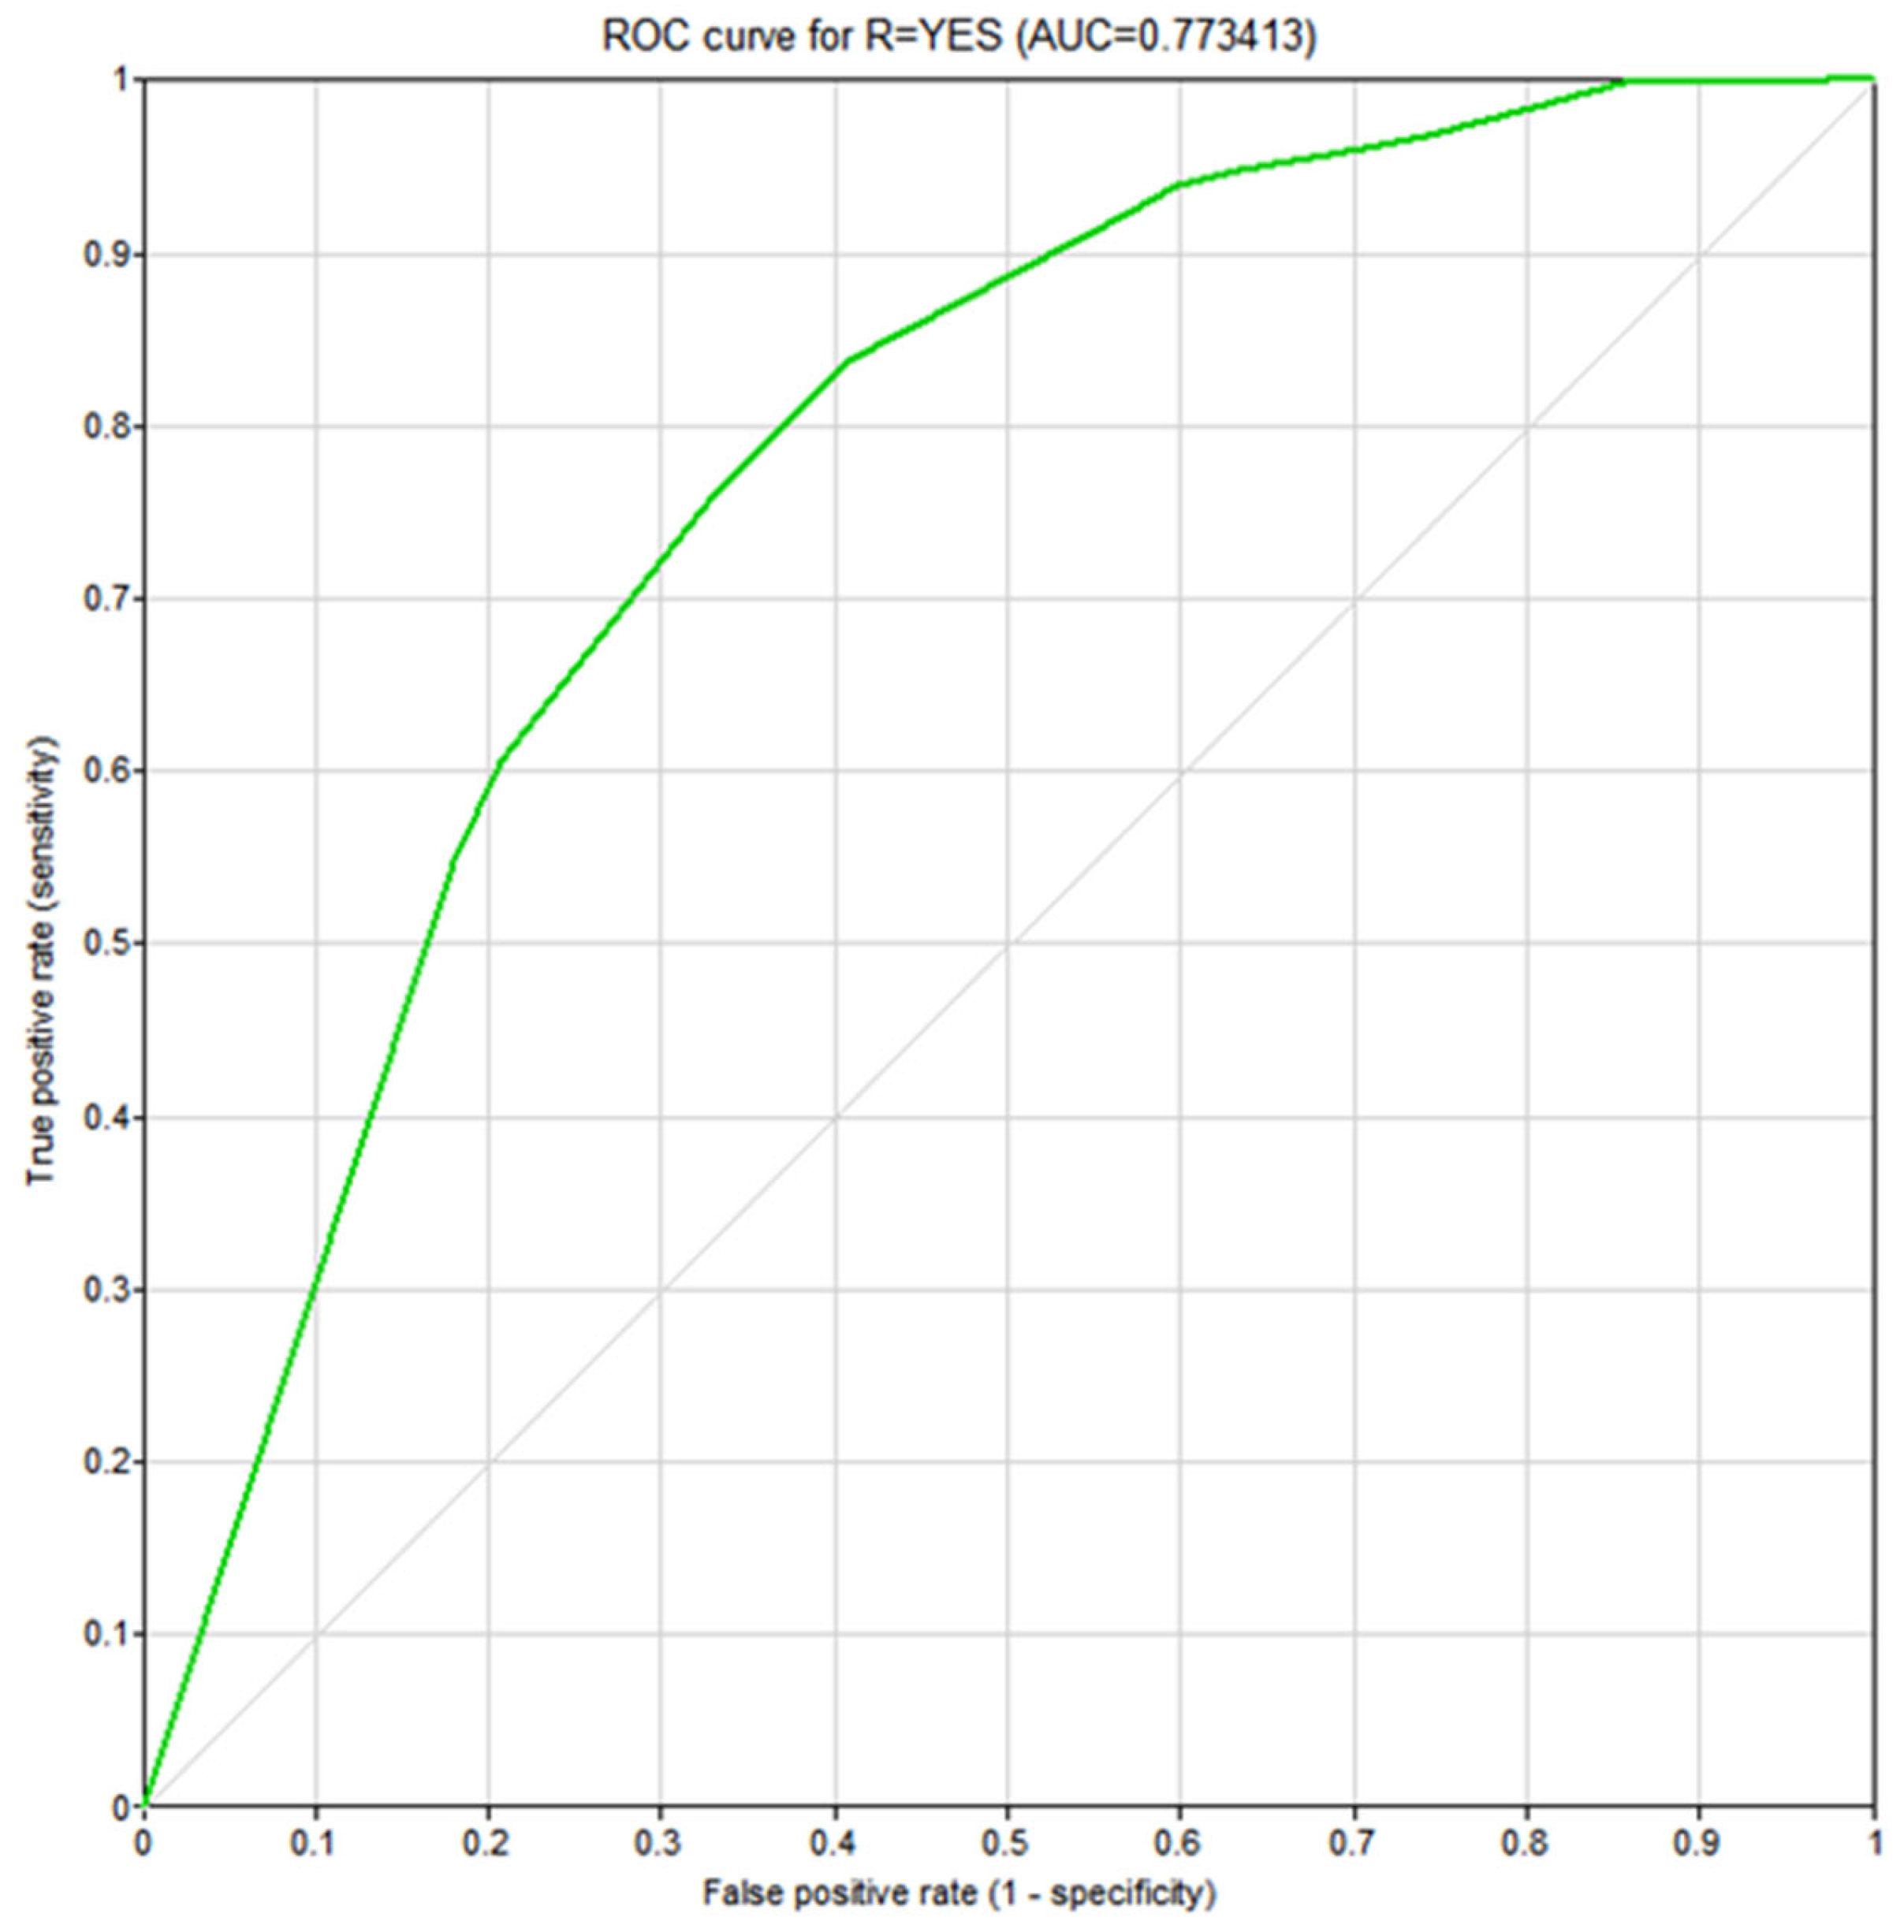
3.2.3. Model Validation

K-fold cross-validation is a method used to evaluate the performance and stability of BN models. In cross-validation, a value of k = 10 is commonly chosen, where the dataset is divided into 10 equal parts. The model is then trained using 9 of these parts, while the remaining part is used for testing. This process is repeated 10 times, each time using a different part as the test set. Finally, the average of the 10 test results is calculated as the performance metric of the model. Cross-validation of the BN helps evaluate the generalization ability of the model, i.e., how well it performs on new data [60]. After the k-fold cross-validation is completed, the receiver operating characteristic (ROC) curve and the confusion matrix of the model can be obtained. The area under the curve (AUC) of the ROC is usually used to measure the accuracy of the test results, and the model is considered to be of high utility when the AUC value is between 0.7 and 0.9 [61]. Figure 7 shows the validation of the ROC curve of the static evaluation model for the safety resilience of prefabricated building construction. The AUC value reached 0.773, which confirms the effectiveness of the model.
The confusion matrix emerges from a validation process, portraying the connection between the actual condition and the anticipated condition linked to the model [61]. To comprehensively evaluate the performance of the constructed BN model in the study, four evaluation metrics should be applied: Accuracy, Precision, Recall, and F1 Score [62]. These metrics can be calculated from the elements of the confusion matrix obtained from the output terminal of the model verification, as shown in Table 2. Each row of the confusion matrix represents the actual class, and each column represents the class predicted by the model. TN represents the total count of instances where incorrect categories are accurately predicted. FN indicates the total count of accurate categories classified as incorrect. FP is the total count of cases where the true category in the sample, marked as negative, is predicted as positive. TP signifies the total count of accurately predicted instances.
Accuracy is the proportion of correctly classified samples to the total number of samples. A higher Accuracy indicates a better classification performance of the model. The formula for calculating Accuracy is as follows:
A c c u r a c y = ( T P + T N ) / ( T P + T N + F P + F N )
The F1 Score is the harmonic mean of Precision and Recall. Precision represents the proportion of true positive samples among the samples predicted as positive, while Recall is the proportion of true positive samples correctly classified. The formulas for Precision, Recall, and F1 Score are as follows:
P r e c i s i o n = T P / ( T P + F P )
R e c a l l = T P / ( T P + F N )
F 1 S c o r e = 2 × P r e c i s i o n × R e c a l l / P r e c i s i o n + R e c a l l = 2 T P / 2 T P + F P + F N
The confusion matrix obtained by k-fold cross-validation of static BN for safety resilience assessment of prefabricated building construction is shown in Table 3.
According to Formulas (5)–(8), the Accuracy of the model is 81.55%, the Precision is 89.47%, the Recall is 85.96%, and the F1 Score is 87.68%. These results demonstrate that the model, constructed under the dual driving forces of both knowledge and data, performs well in terms of predictive performance.

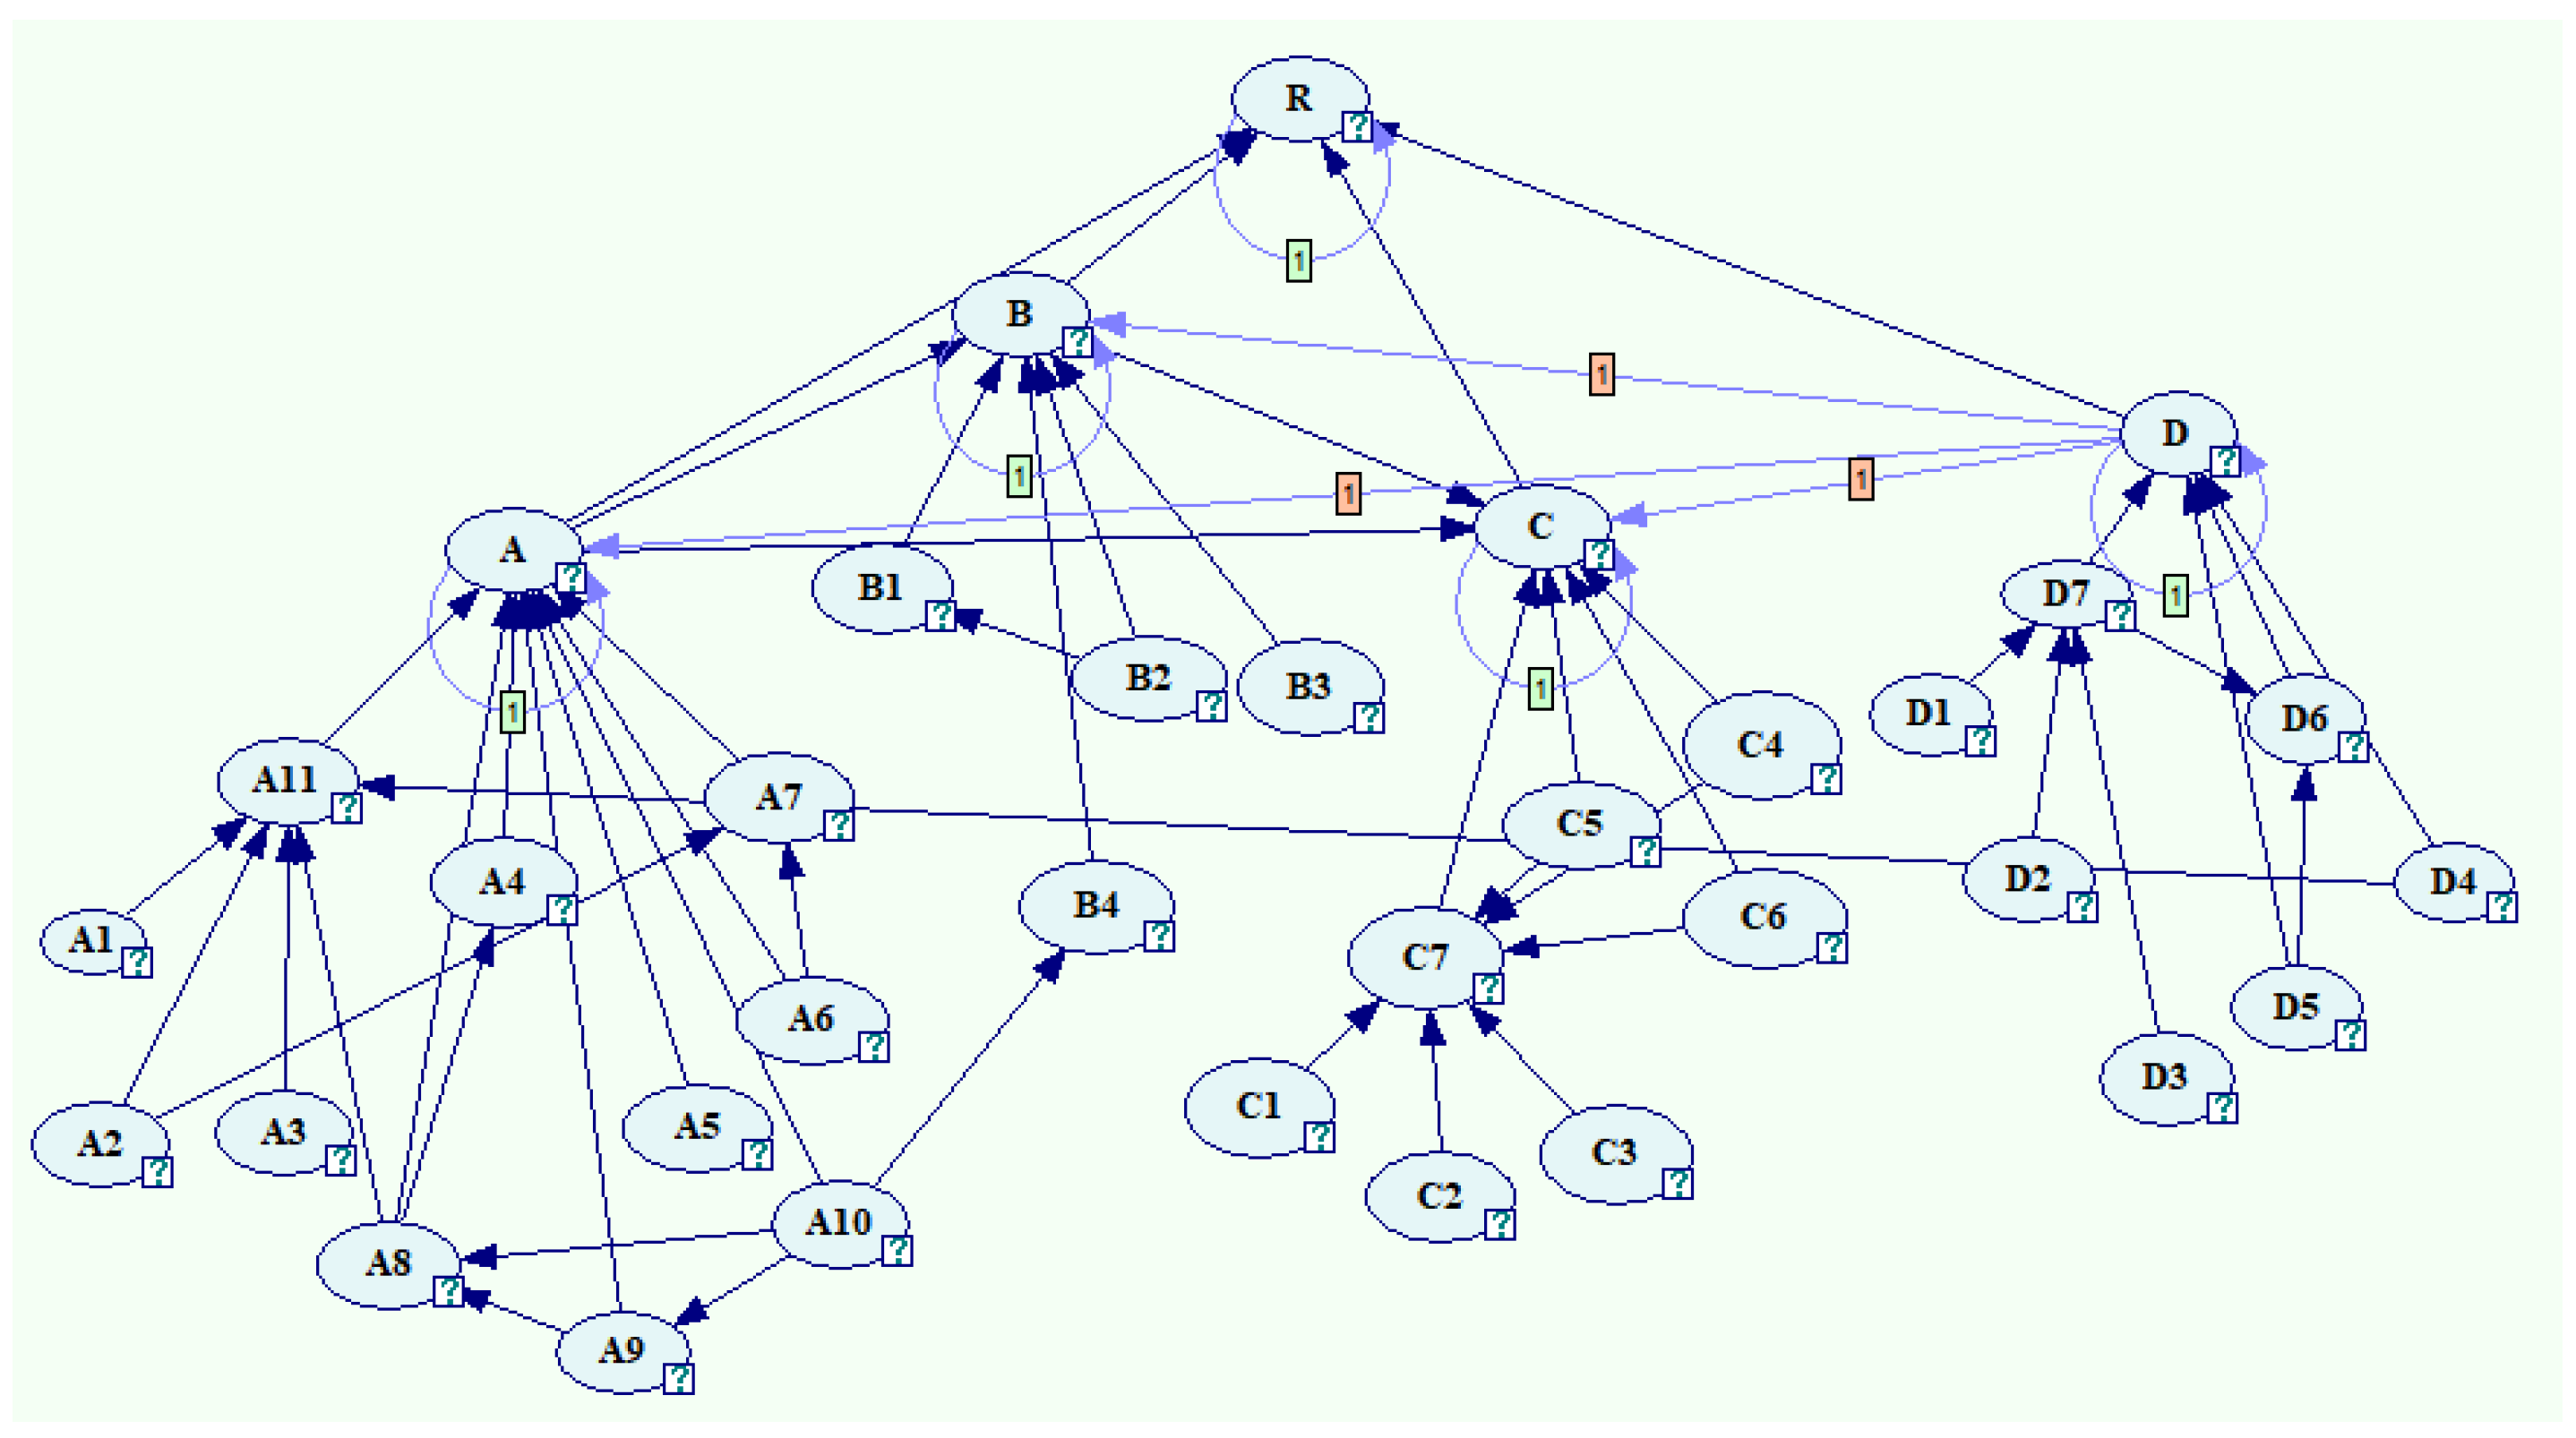
3.3. Construction of DBN

Prefabricated building construction risks will undergo complex changes over time, and a static BN cannot accurately reflect the dynamic evolution process of construction risks. A DBN is a new stochastic model formed by expanding a static BN on time series, which can mine the inherent development and change laws contained in the time series data of each variable state. In addition to having many advantages of static BNs, a DBN can also process time series data and perform quantitative reasoning of risks, dynamic prediction, evaluation and diagnostic analysis, etc. It has great advantages in representing complex random processes and studying the dynamic characteristics of things. The DBN theory usually holds based on two assumptions: one is the Markov assumption, which assumes that the probability of a node at time t is only affected by the moment t − 1, and is independent of time slices prior to the moment t − 1, i.e., it is not allowed to span time slices; and second is the stationarity, which means that the conditional probability of nodes and nodes between two time slices in the DBN transfer network is exactly the same as that in the initial network and that the conditional transfer probability is kept constant throughout the DBN and is a fixed value. The DBN can be expressed as (B0, B), where B0 is the BN defining the prior probability P ( X t ) and B is the transfer network. The conditional probability distribution can be expressed as Equation (9):
P ( X t + Δ t | X t ) = i = 1 n P ( X t + Δ t i | X t i )
Using the DBN model to evaluate the safety resilience of prefabricated building construction can consider the dynamic behavior of the system and perform transient analysis when the system is disturbed or impacted by unknown factors until the system fully recovers from the damaged state.

3.3.1. DBN Structure Determination

The initial network B0 of the DBN model is determined through the TS algorithm based on expert experience and prefabricated building construction safety accident investigation report data, as shown in Figure 5. The transfer network B is an extension of the initial network B0. By considering the mutual influence between variables in adjacent time slices, a causal relationship is established to reflect the probability changes between these variables. Transfer network B is manually constructed based on expert opinions, extending the prefabricated building construction safety resilience R, absorptive capacity A, adaptation capacity B, recovery capacity C, and optimization capacity D into transfer nodes. At the same time, different optimization capabilities D affect the absorptive capability A, adaptation capability B, and recovery capability C in future periods. The DBN network structure is shown in Figure 8.

3.3.2. Transfer Probability Matrix Determination

Determining a reasonable state transfer probability is a critical step in DBN reasoning. According to the assumption of transfer probability invariance, the transfer probability of the DBN is the same on all time slices. But because it is difficult to collect the historical data of all factors in different time slices from the investigation reports of prefabricated building construction accidents, it is impossible to learn such probabilities through training sample sets. In this paper, the transfer probability of each node is obtained by expert survey method using the fuzzy set theory, 7-level linguistic variables are introduced, and the expert language is transformed by triangular fuzzy number. The correspondence between natural language variables and triangular fuzzy number is shown in Table 4.
Six experts engaged in the field of construction engineering safety analysis and prefabricated building are invited to evaluate the transfer probability of the transfer node, and each expert has the same weight. The experts’ ratings are averaged, and the fuzzy mean probability is converted into a precise value through the mean area method. The calculation of the triangular fuzzy number average is as shown in Formula (9). The calculated value of node transition probability is shown in Table 5.
P i j , A = a i j + 2 b i j + c i j 4
The above probabilities were input into the model described in Section 3.3.1 to obtain the complete DBN model for the safety resilience evaluation and analysis of the prefabricated building construction.

4. Case Study

4.1. Project Overview

This study takes a prefabricated residential community in Wuhan, Hubei Province, China, as an example to evaluate the construction safety resilience using the established data-driven DBN model, thereby validating the effectiveness of the model. The project developed 15 high-rise residential buildings with a total construction area of 178,000 m2. The building structure adopted a prefabricated concrete shear wall structure, with prefabricated components used for the exterior walls, floor slabs, and stairs. The overall assembly rate was 51.2%, and the total construction duration was 300 days.

4.2. Resilience Evaluation

In this section, the construction safety resilience assessment model for prefabricated building construction, which was developed based on the safety resilience evaluation index system established in Section 3 and the integration of expert knowledge and data-driven approaches, is applied to dynamically evaluate the safety resilience at different stages of the construction process. The total construction duration of the project is 300 days, and the DBN model is divided into 10 time slices based on a monthly interval in the GENIE 3.0 software.
By the sixth month of the project (time piece T = 5), the state of construction site management was chaotic, with a lack of safety management and supervision on the construction site. The workers’ safety awareness was insufficient, resulting in improper use of construction machinery and equipment on-site. As a consequence, there were defects in material quality and construction safety accidents in that month. After the accident, the construction unit promptly conducted accident cause investigation and experience summary and enhanced safety education and training and drills. The above scenarios were input into the DBN model as evidence, i.e., P(A1/A2/A5/A8) = 0 and P(D1/D4) = 1. Figure 9 shows the DBN model with evidence input. Figure 10 shows the dynamic probability changes of construction safety resilience and the four resilience metric nodes with evidence input.
The value of absorptive capacity at time slice T = 5 rapidly decreased from 82.9% to 53.6%. Due to insufficient absorptive capacity, the system resilience value R decreased from 77.1% to 69.3% after the accident, and the probability of non-failure of the system’s adaptive capacity B and recovery capacity C also decreased. However, due to the fact that the construction company promptly conducted the accident cause investigation and experience summary, as well as strengthened the safety education, training, and drills, the optimization capability D non-failure probability of the construction system increased from 72.1% to 74.7%. Numerically analyzed, the value of safety resilience in prefabricated building construction meets the passing level but is not very high, indicating significant room for control and improvement. The three resilience metric node values of adaptation capacity, recovery capacity, and optimization capacity are generally above 70%, among which the adaptation capacity value is the most considerable. This suggests that the current prefabricated building construction system is capable of effectively withstanding the impact of accidents, promptly responding to control the damage caused by accident disturbances and reducing performance losses and other destructive consequences. The results are consistent with the actual situation on site, indicating that the proposed DBN model can accurately reflect the impact of accidents on the probability of resilience and the dynamic change characteristics of resilience.

4.3. Diagnostic Reasoning

The reverse diagnostic reasoning of the BN model is to calculate the posterior probabilities of other node variables given the known target node of the network model. Utilizing the model for reverse diagnosis can infer the weak links in the BN of construction safety resilience in prefabricated buildings. This helps strengthen inspections, preventive measures, and enhancements for nodes with lower posterior probabilities of non-failure. Based on the constructed DBN model, by setting the leaf node “safety resilience of prefabricated building construction (R)” as the evidence node with a failure probability of 100%, the posterior probability distribution of other nodes is derived and the Ratio of Variation (RoV) value of each sub-node is calculated. The RoV’s importance in sensitivity analysis is used to select key events by comparing the variation between the prior and posterior probabilities of basic events [63]. The basis for sensitivity analysis using the RoV value in the BN is to understand the impact of changes in node probabilities or parameters on the entire network. The RoV value is an indicator used to measure the relative degree of change. By changing the input (the probability or parameter of the node) and observing the relative change of the output, the dependence between nodes and the robustness of the network can be revealed. A higher RoV value for a basic event indicates a greater contribution of that event to the occurrence of the top-level event, thus requiring more attention. The calculation of RoV value is as follows:
V RO ( X i ) = π ( X i ) θ ( X i ) π ( X i )
In the formula, V R o is the ROV value of the node X i , X i is the root event, θ ( X i ) is the posterior probability of X i , and π ( X i ) is the prior probability of X i . By analyzing and comparing the posterior probability values of each node and ranking the importance of the root nodes based on their RoV values, key influencing factors affecting the safety resilience of prefabricated building construction are identified. The results are shown in Table 6 and Table 7.

5. Results and Discussions

Compared with the inference result of the static BN shown in Figure 6, the DBN inference results are slightly lower due to the indirect influences related to construction activities at different points in time are considered to affect the construction activities. In this case, the construction safety resilience transmission chain becomes longer, leading to a slight decrease in the safety resilience of the construction activities. The DBN model can effectively accumulate the inference results from the previous time step and feed them back to the new time nodes, obtaining more and more information over time. Thus, the method can continuously improve the accuracy of resilience assessment and effectively reduce the uncertainty of the assessment process [17]. Unlike a static BN, the DBN evaluation model can infer and update the states of other time points based on the current state information, allowing an effective combination of mathematical reasoning and expert experience. Therefore, in practical application, the model is not significantly biased by missing or distorted data at a particular moment in time.
Based on the posterior probability, when the safety resilience of prefabricated building construction completely fails, the order of the non-failure probabilities for the resilience metric node is as follows: optimization capability (60.89%) < absorption capability (64.22%) < recovery capability (65.21%) < adaptation capability (69.77%). The smaller the posteriori probability of a node, the higher the probability of its failure. The failure probability of the optimization capability is the largest. Starting from node R, the most approximate causal chain for safety resilience failure in prefabricated building construction can be found by searching backwards and downwards for the parent node with the smallest posterior probability of each child node. The causal chain for safety resilience failure is Building a risk management information system D7 → Establishing a resilience safety culture D6 → Optimization capability D → Prefabricated building construction safety resilience R.
According to the RoV value of the root nodes, D6 establishing a resilience safety culture, A11 preventing unsafe behaviors of personnel, A8 safety management and supervision on the construction site, C7 emergency management actions, and D7 building a risk management information system are the key factors influencing the safety resilience of prefabricated building construction. This indicates that the organization should focus on establishing a resilient safety culture during the construction of prefabricated buildings. Resilient safety culture is characterized by continuous improvement in safety performance, identifying and anticipating changing forms of safety risks in complex socio-technical systems, and aiming to achieve consistently high safety performance. Additionally, it is crucial to manage and supervise safety at construction sites and raise the safety awareness of construction personnel, while also taking preventive measures against unsafe behaviors by individuals [7]. After a safety accident occurs, prompt emergency management should be carried out to minimize casualties and accident losses. It is essential to improve the emergency management mechanisms and emergency plans, ensuring the adequacy of material reserves and other resources [64]. Building a risk management information system enables dynamic risk assessment of the information monitored in the construction of prefabricated buildings and the release of construction safety warning information, as well as monitoring construction quality to ensure project quality [65].
From a macroscopic perspective, the RoV values of the four resilience metric nodes go from absorption capacity > recovery capacity > adaptation capacity > optimization capacity, which means that the absorption capacity has the greatest impact on improving the safety resilience of prefabricated building construction. Therefore, when formulating a safety resilience improvement strategy for prefabricated building construction, in the case of limited resources and similar improvement effects of influencing factors of different capabilities, the influencing factors of absorption capacity should be improved first. Subsequently, the impact factors of recovery capacity should be enhanced, followed by those of adaptation capacity, and finally, the influencing factors of optimization capacity should be improved.

6. Conclusions

A DBN evaluation model for assessing the safety resilience of prefabricated building construction processes is developed in this paper. The model analyzes the pathways of resilience failure and identifies key resilience influencing factors. The findings provide valuable insights into how to comprehensively manage the construction risk of prefabricated buildings in the future and how to improve the anti-risk ability, rapid recovery ability after risk accidents, and adaptive learning ability of potential risk accidents. By reducing the probability of risk incidents and minimizing the losses caused by such incidents, the study aims to achieve safer and more efficient prefabricated construction projects. The main contributions of this paper are as follows:
(1)
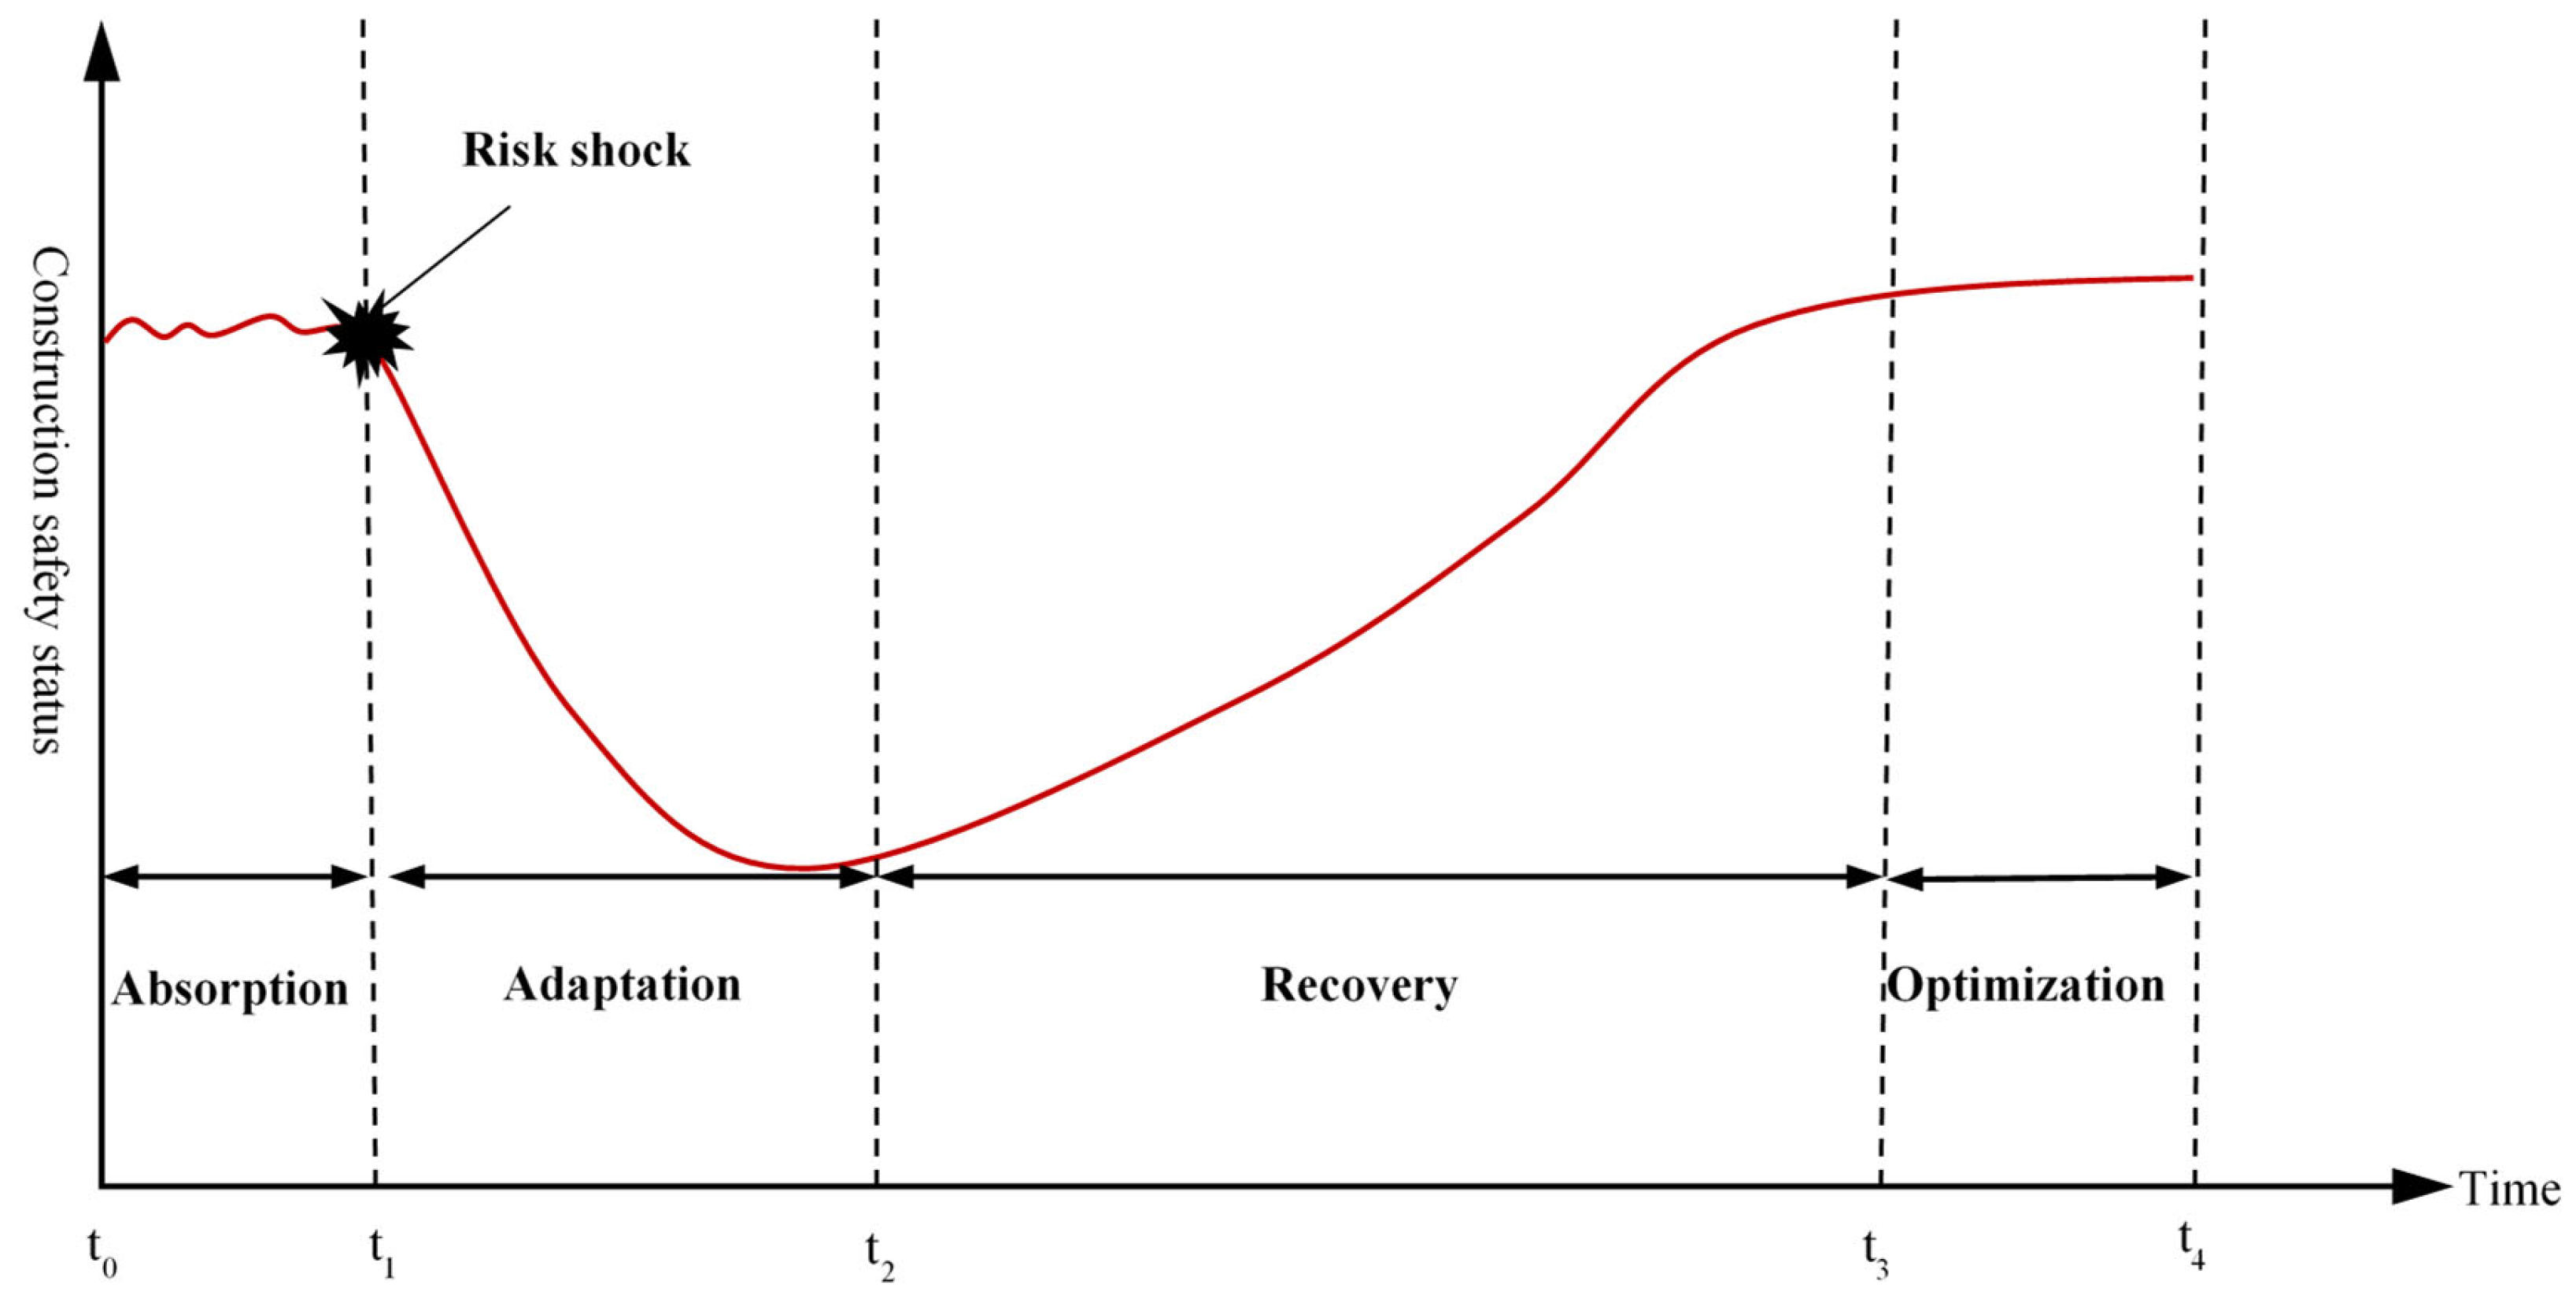
Based on the concept of resilience and its characteristics, combined with the characteristics of prefabricated building construction, the concept of safety resilience of prefabricated building construction is proposed. The evaluation index system of safety resilience of prefabricated building construction is constructed from the absorption capacity, adaptation capacity, recovery capacity, and optimization capacity. This paper integrates the concept of resilience into the safety risk management of prefabricated building construction, improving the existing risk management that only emphasizes prior control and focusing on the construction system’s adaptability to accidents and optimization capabilities. It emphasizes learning the impact experience of disturbance after the accident and improving the adaptability to uncertain events through accident review and learning to achieve system optimization. Resilience engineering is a new path and method for risk management and safety management in the face of increasingly complex socio-technical systems.
(2)
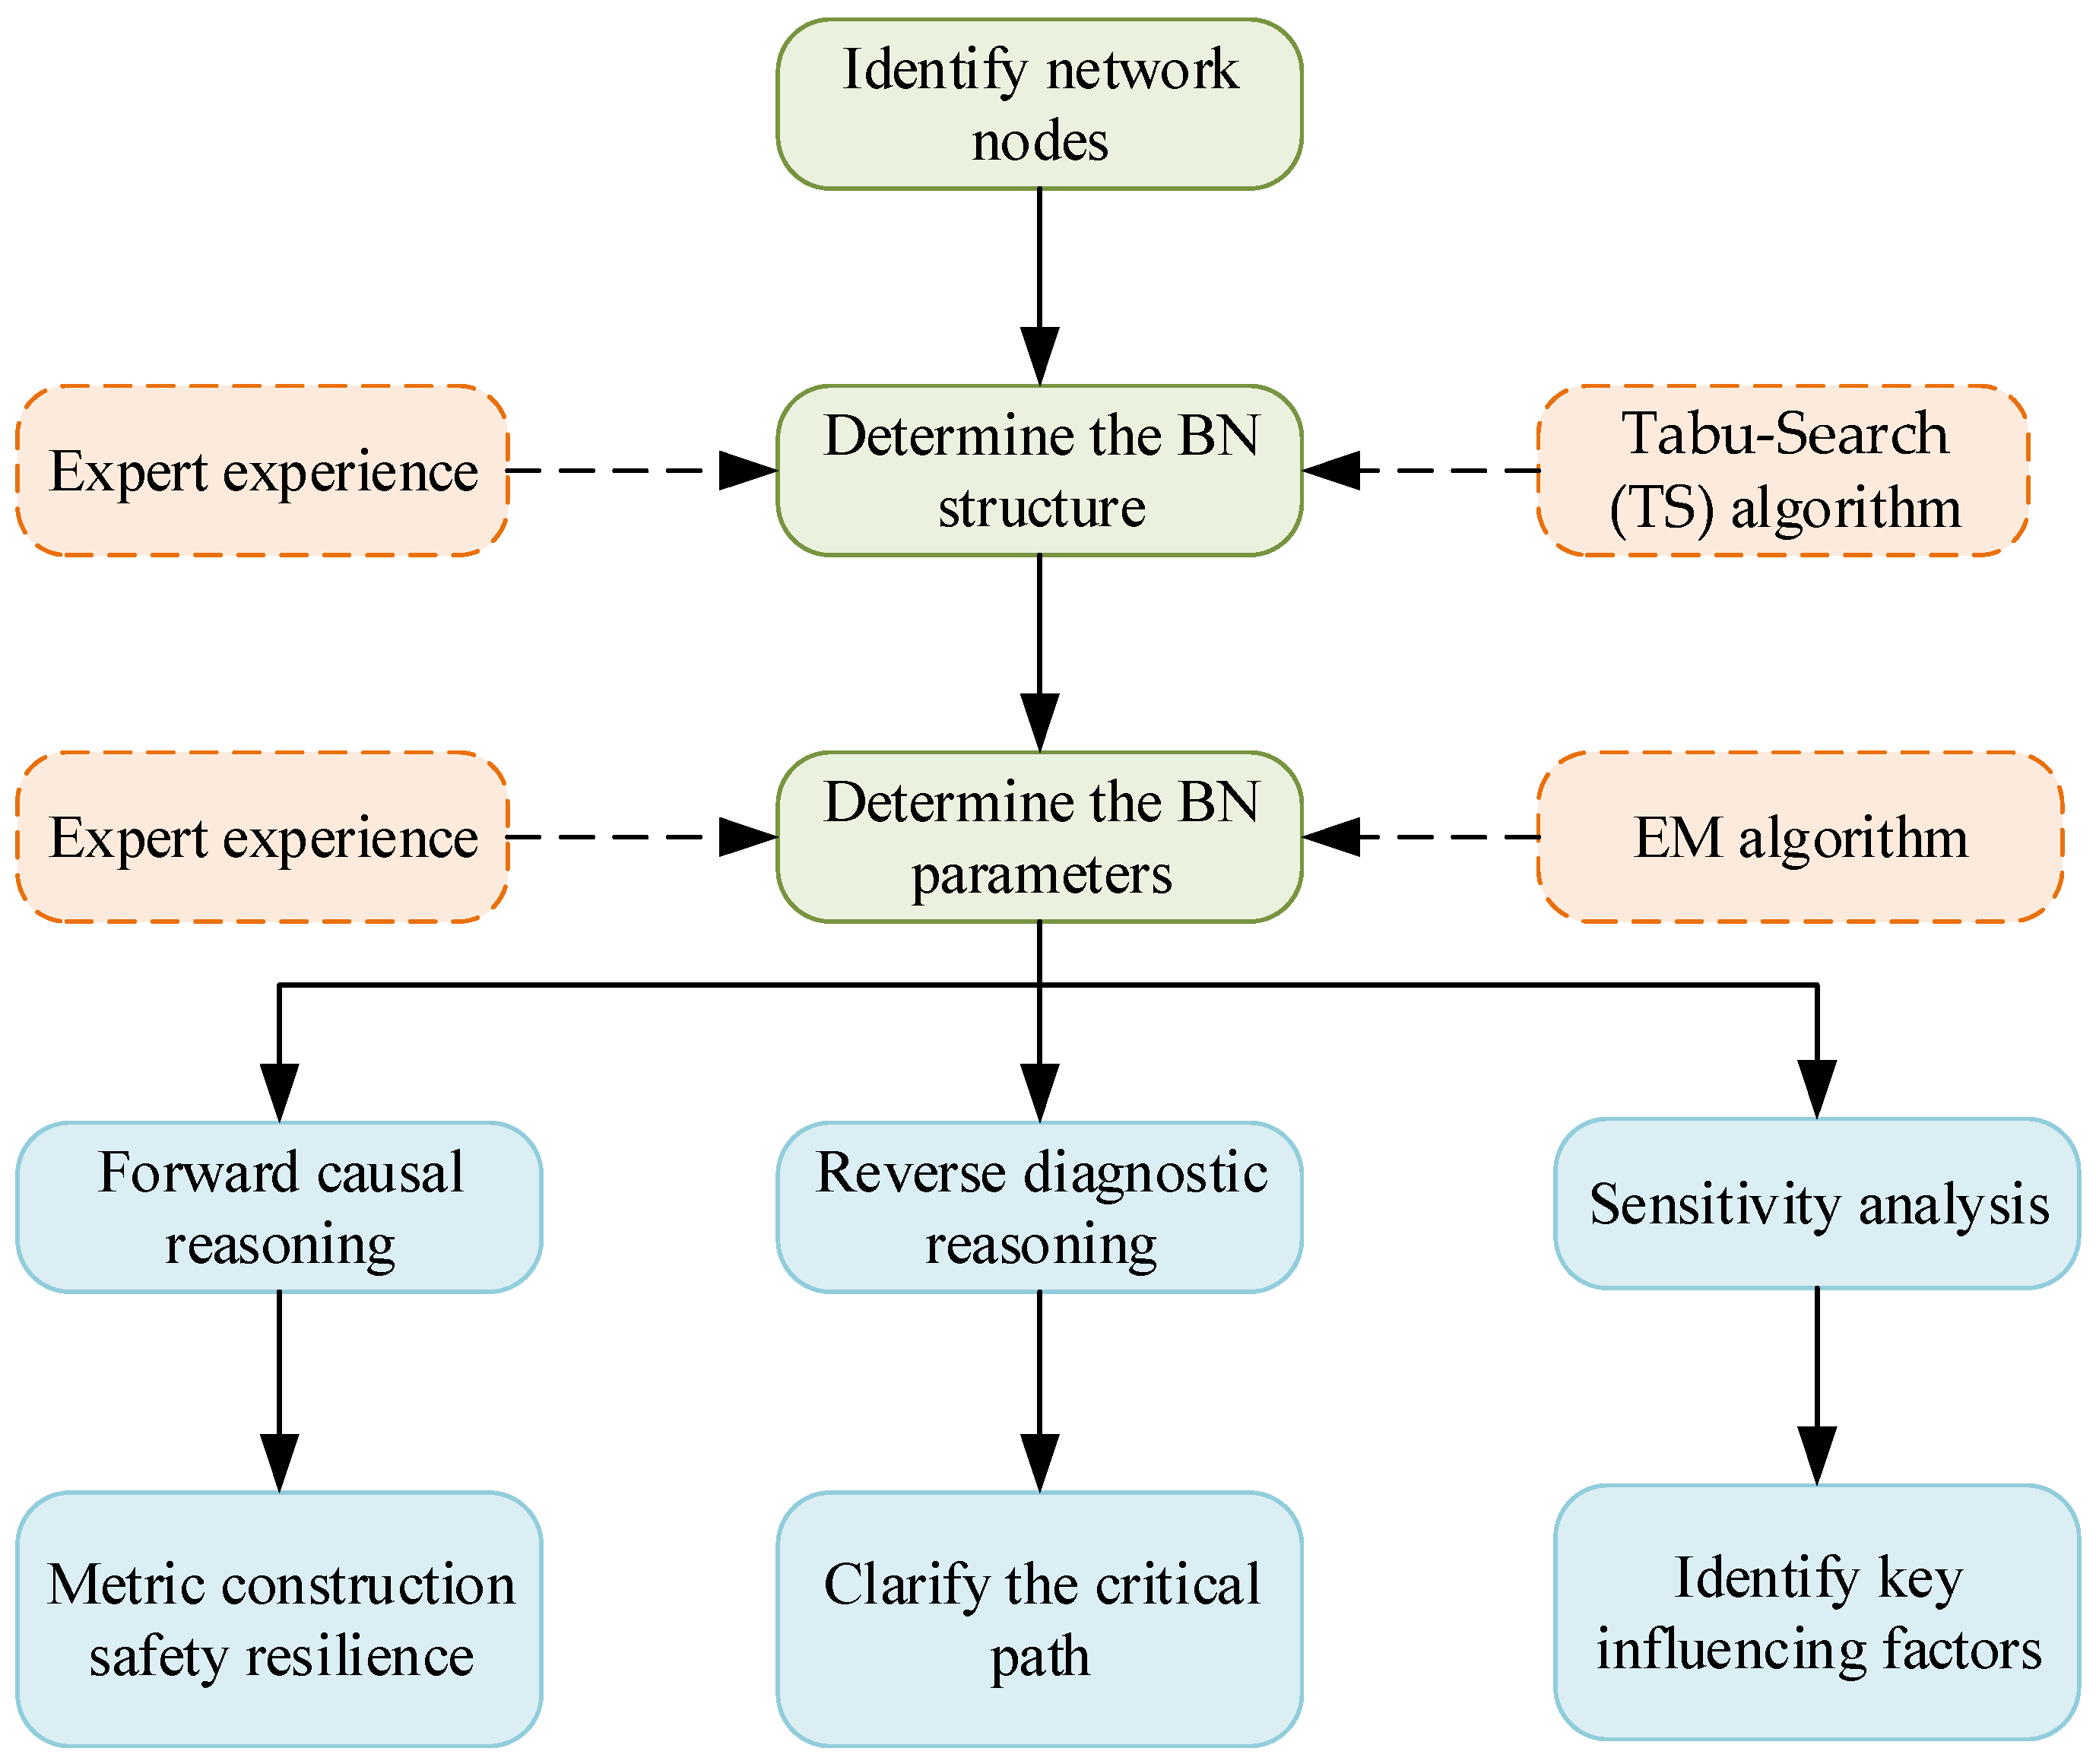
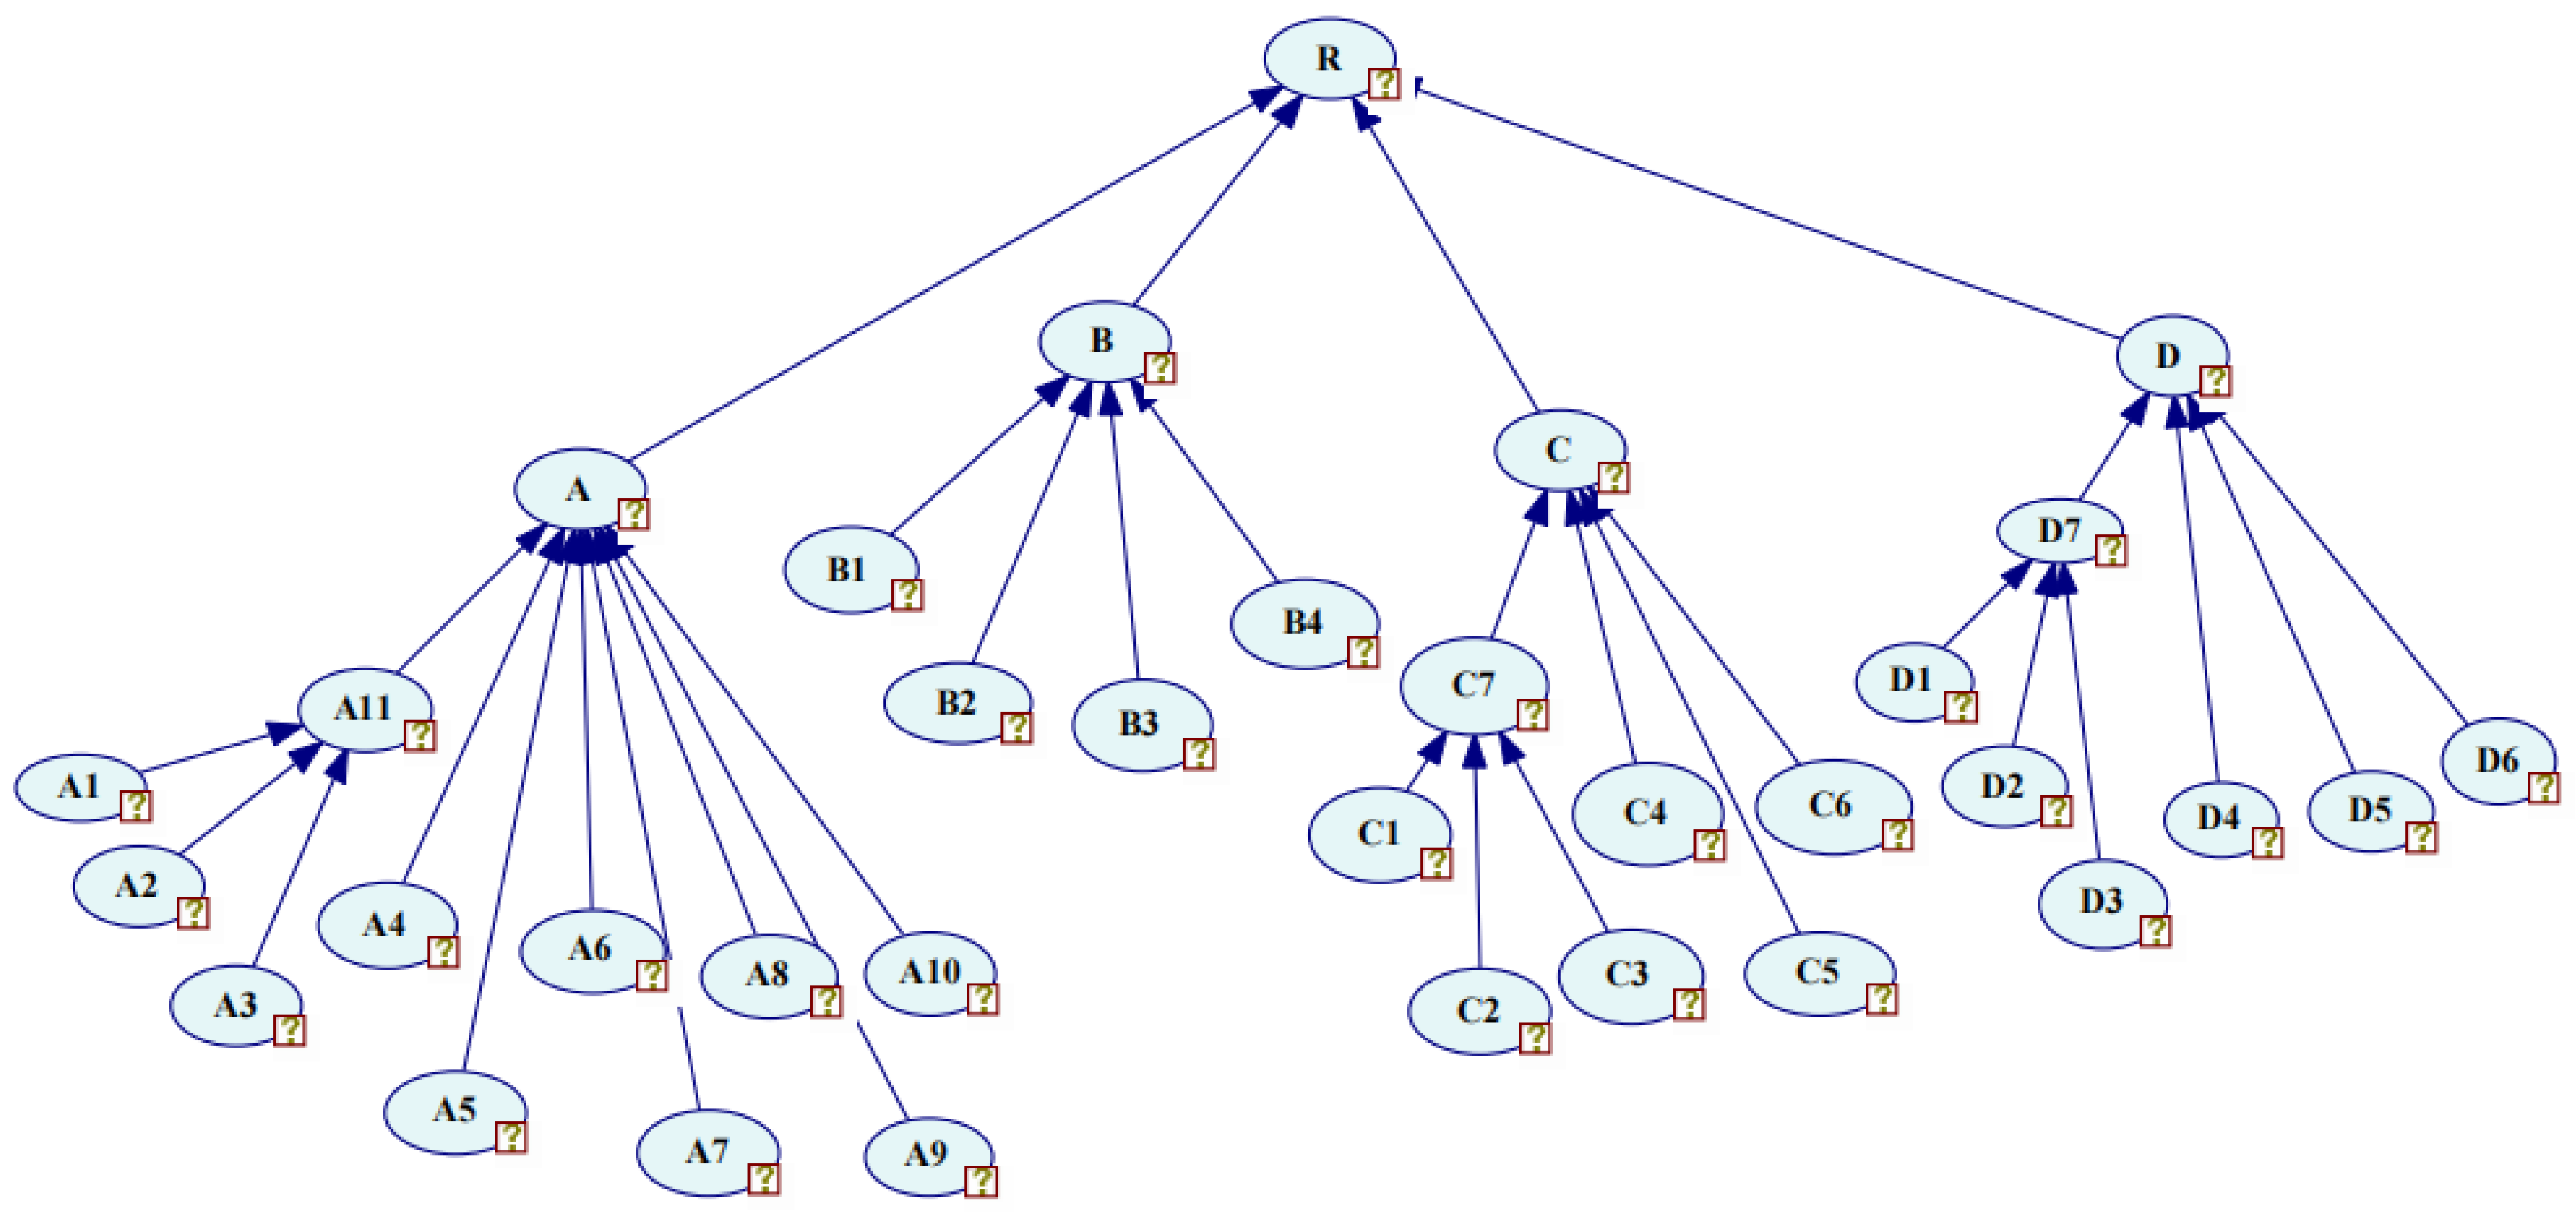
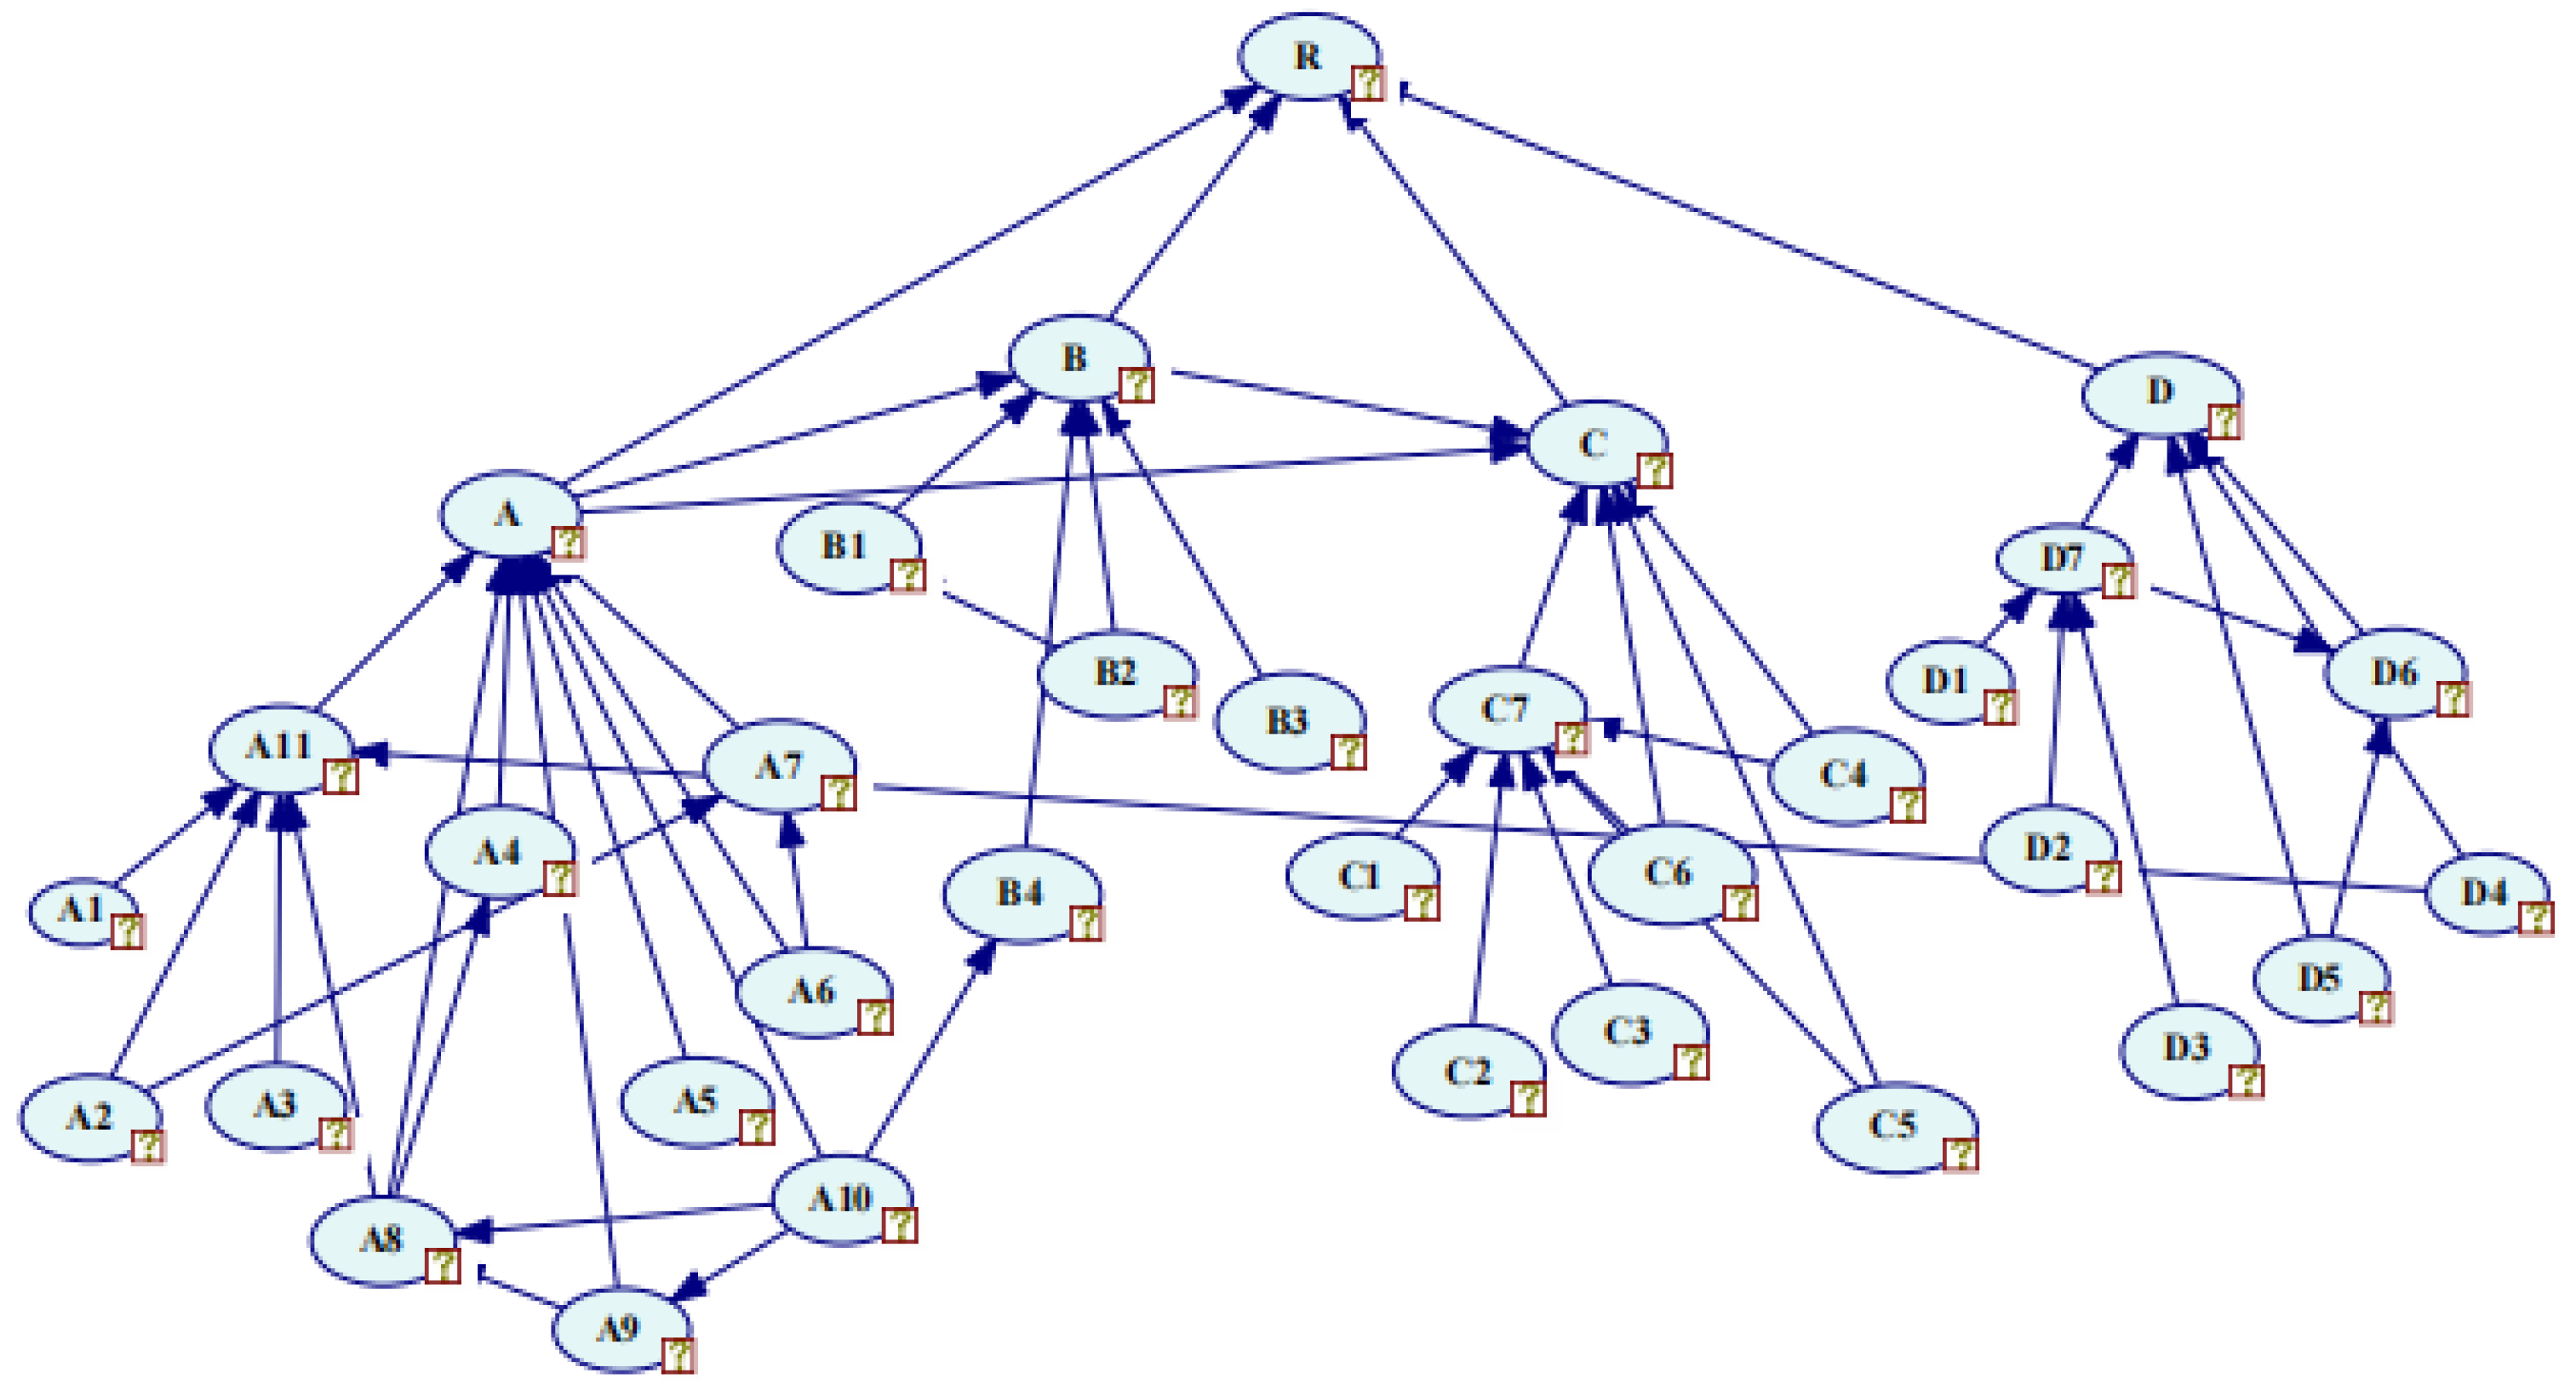
Combining the relevant literature and expert knowledge, structure learning by the TS algorithm and parameter learning by the EM algorithm are used to construct a DBN evaluation model for the safety resilience of prefabricated building construction. Compared with traditional BN model construction based on expert experience, data-driven BN construction can learn the structure and parameters of the model from a large amount of actual data without relying on the prior knowledge of domain experts. This makes the model more flexible and adaptable, capable of capturing complex relationships and patterns in the data. At the same time, data-driven BNs allow models to be dynamically updated to reflect changes in new data. This real-time update enables the model to continuously improve and optimize, adapting to changing environments and conditions. This has important implications for decision making and risk management during the construction of prefabricated buildings.
(3)
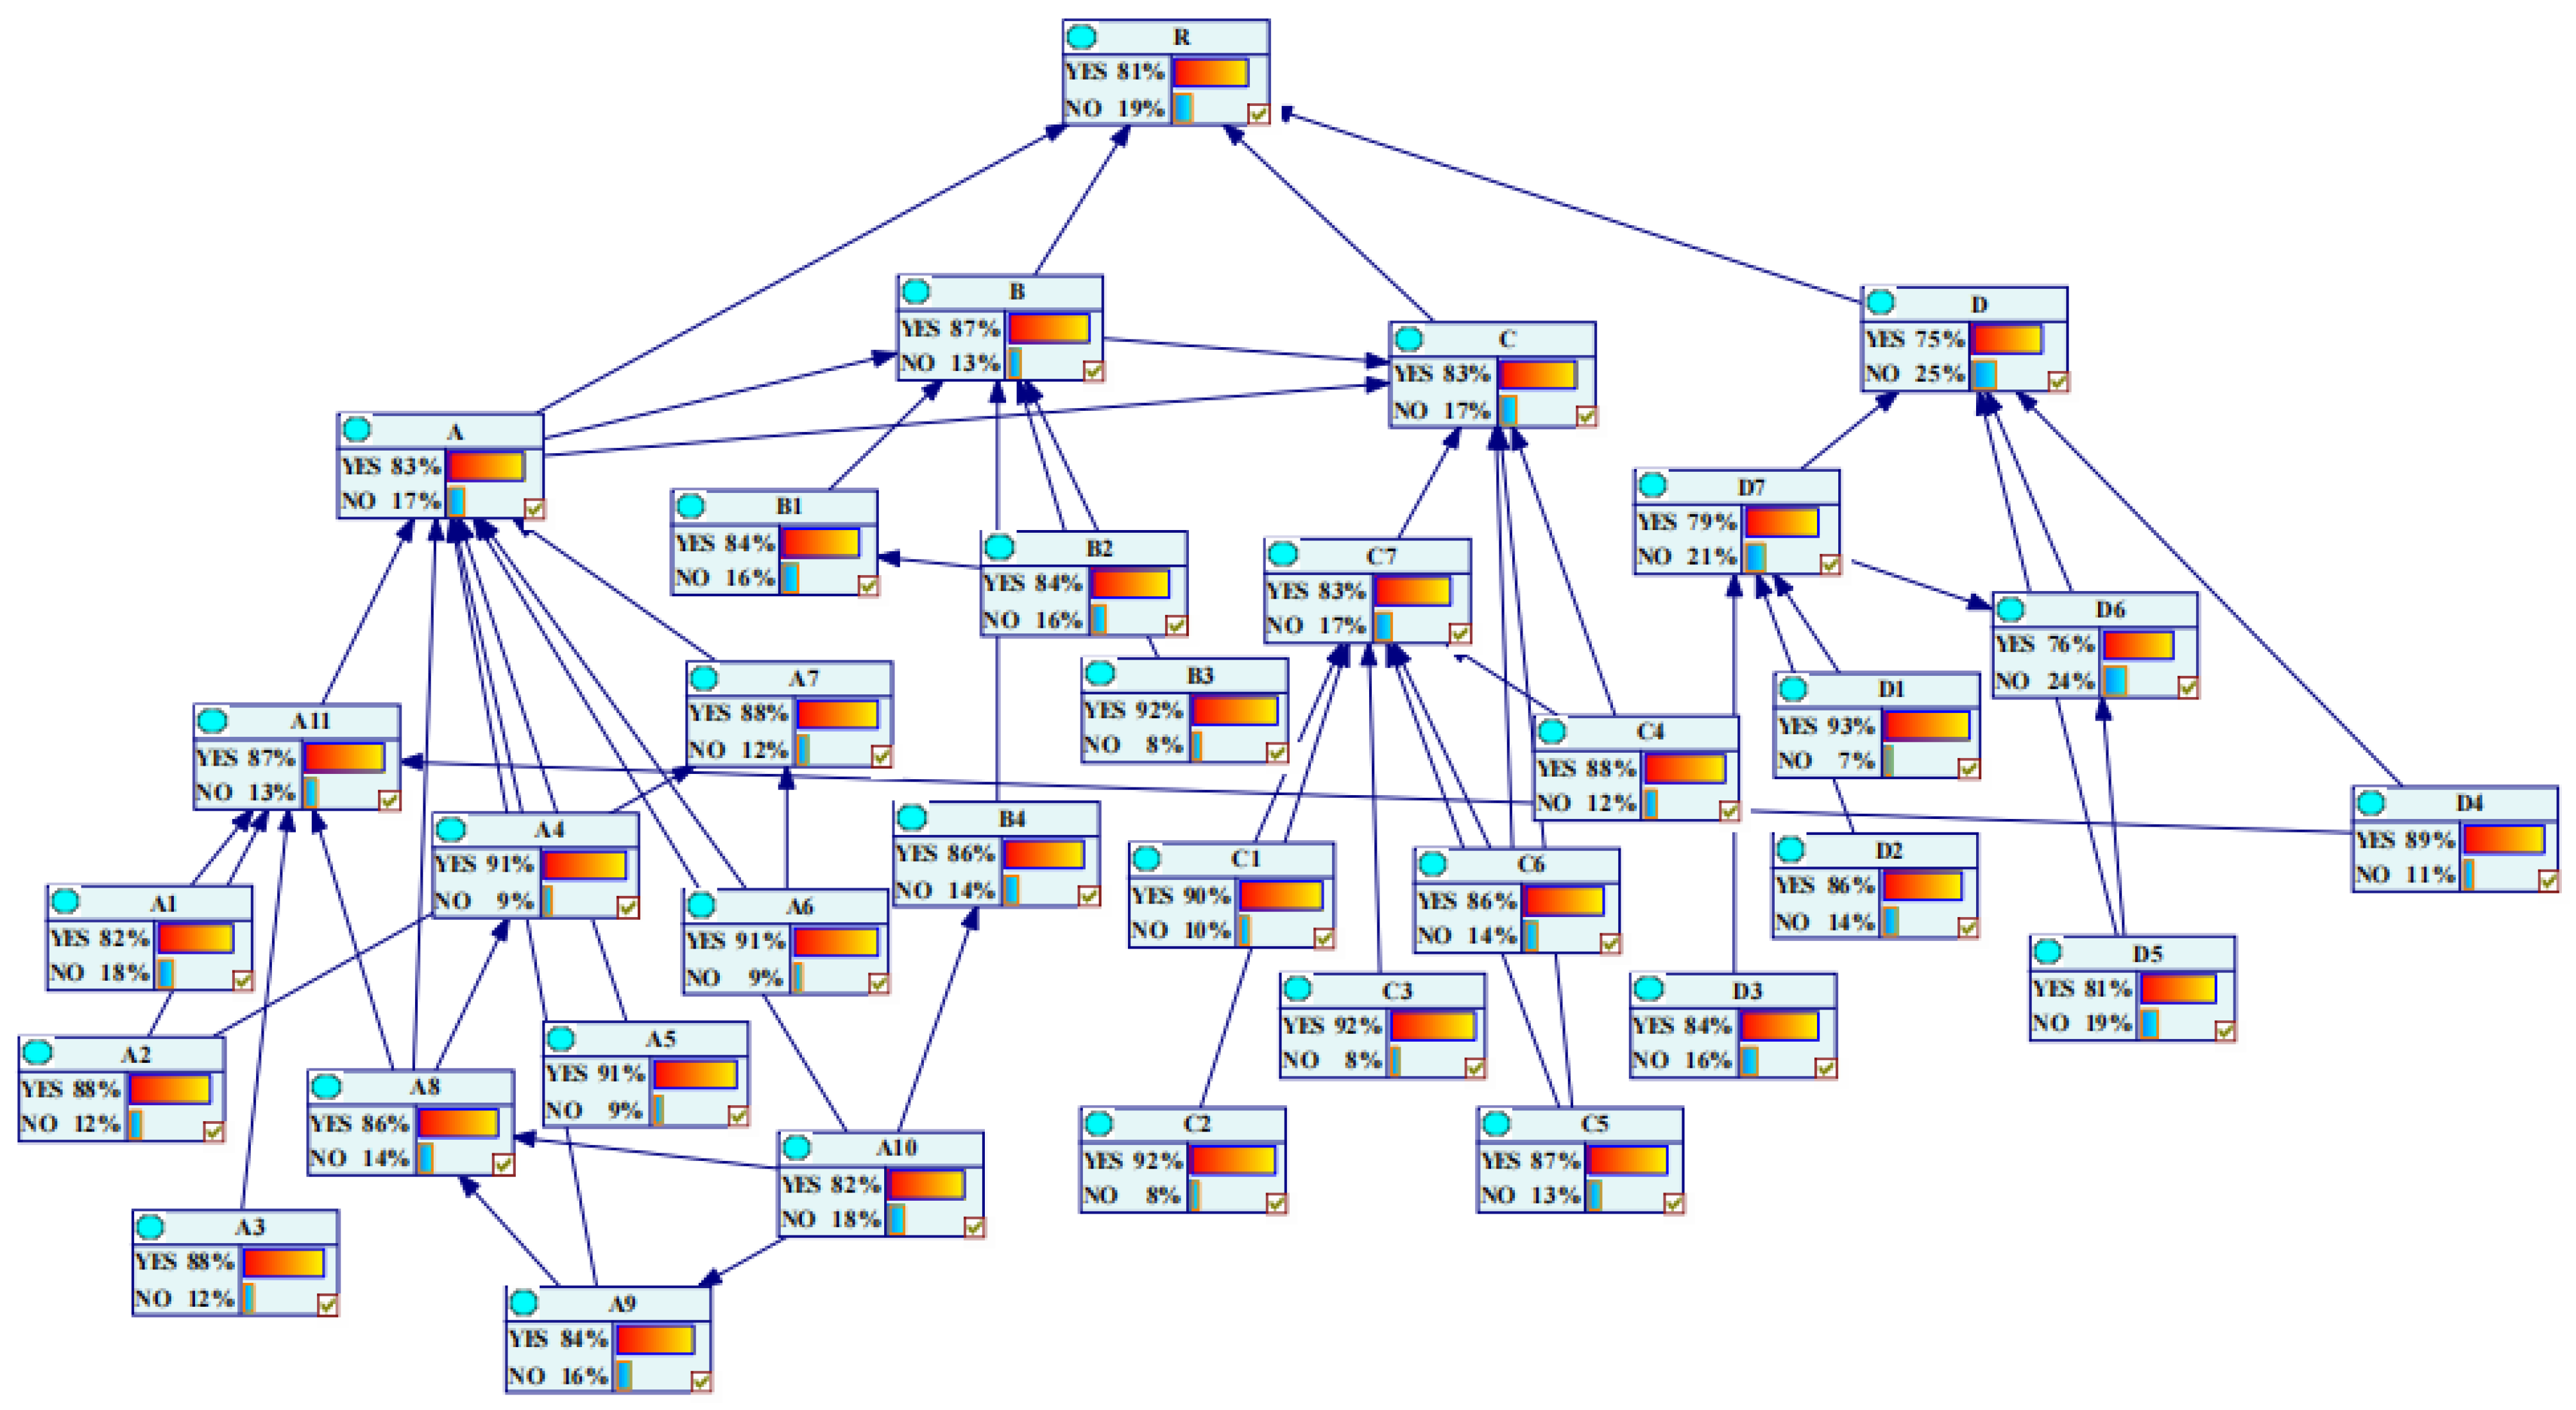
Combined with a specific engineering case, the model obtained the dynamic change curve of the safety resilience of prefabricated building construction when the evidence was input. With the help of the model’s reverse diagnosis reasoning, the top five key resilience factors of the case project were identified from the micro perspective as establishing a resilience safety culture, preventing unsafe behaviors of personnel, safety management and supervision on the construction site, emergency management actions, and building a risk management information system. From a macro perspective, the sensitivity of the four resilience metric nodes is absorption ability, recovery ability, adaptation capacity, and optimization ability from large to small.
This study also has some limitations. In the measurement of construction safety resilience based on a DBN, the influencing factors are set as discrete variables, and two states of “failure” and “no failure” are set. However, in practice, the influencing factors may be continuous variables, so continuous variables can be added in future research to further improve the accuracy of the construction safety resilience measure for prefabricated buildings. Moreover, this study obtained a large amount of data from prefabricated building construction safety accident reports as a training set. This process was laborious and prone to human error. Future work would focus on using automatic data collection technology to study real-time intelligent monitoring mechanisms and develop automatic decision-support systems.

Author Contributions

Conceptualization, Z.C. and J.W.; Data curation, J.H. and S.M.; Formal analysis, Z.C.; Funding acquisition, J.W. and S.M.; Investigation, J.H. and S.M.; Methodology, Z.C. and Y.S.; Software, Z.C. and Y.L.; Supervision, J.W.; Validation, Y.S. and Z.C.; Visualization, Z.C. and Y.L.; Writing—original draft, Z.C.; Writing—review and editing, Y.S. and Y.L. All authors have read and agreed to the published version of the manuscript.

Funding

The research was supported by the Major Science and Technology Plan Project of Hainan Province (Funding: Science and Technology Department of Hainan Province; Funding number: ZDKJ2021024 in 2021); the Special Funding Project of Sanya Yazhou Bay Science and Technology City (Funding number: SCKJ-JYRC-2022-81); and Research on multi-dimensional information confidence of marine engineering safety factors based on NLP-KG (2022KF0003).

Data Availability Statement

The raw data supporting the conclusions of this article will be made available by the authors on request.

Conflicts of Interest

The authors declare no conflicts of interest. The funders had no role in the design of the study; in the collection, analyses, or interpretation of data; in the writing of the manuscript, or in the decision to publish the result.

References

  1. Liu, S.; Li, Z.; Teng, Y.; Dai, L. A Dynamic Simulation Study on the Sustainability of Prefabricated Buildings. Sustain. Cities Soc. 2022, 77, 103551. [Google Scholar] [CrossRef]
  2. General Offifice of the Central Committee of the Communist Party of China, General Offifice of the State Council. Opinions on Promoting the Green Development of Urban and Rural Construction. 2021. Available online: https://www.gov.cn/ (accessed on 21 October 2021).
  3. Central People’s Government of the People’s Republic of China. Outline of the 14th Five-Year Plan for National Economic and Social Development of the People’s Republic of China and Vision in 2035. 2021. Available online: http://www.gov.cn/ (accessed on 13 March 2021).
  4. Shahpari, M.; Saradj, F.M.; Pishvaee, M.S.; Piri, S. Assessing the Productivity of Prefabricated and In-Situ Construction Systems Using Hybrid Multi-Criteria Decision Making Method. J. Build. Eng. 2020, 27, 100979. [Google Scholar] [CrossRef]
  5. Tavares, V.; Soares, N.; Raposo, N.; Marques, P.; Freire, F. Prefabricated versus Conventional Construction: Comparing Life-Cycle Impacts of Alternative Structural Materials. J. Build. Eng. 2021, 41, 102705. [Google Scholar] [CrossRef]
  6. Fard, M.M.; Terouhid, S.A.; Kibert, C.J.; Hakim, H. Safety Concerns Related to Modular/Prefabricated Building Construction. Int. J. Inj. Control Saf. Promot. 2017, 24, 10–23. [Google Scholar] [CrossRef] [PubMed]
  7. Wang, J.; Guo, F.; Song, Y.; Liu, Y.; Hu, X.; Yuan, C. Safety Risk Assessment of Prefabricated Buildings Hoisting Construction: Based on IHFACS-ISAM-BN. Buildings 2022, 12, 811. [Google Scholar] [CrossRef]
  8. Bergström, J.; Van Winsen, R.; Henriqson, E. On the Rationale of Resilience in the Domain of Safety: A Literature Review. Reliab. Eng. Syst. Saf. 2015, 141, 131–141. [Google Scholar] [CrossRef]
  9. Xu, G. The Construction Site Management of Concrete Prefabricated Buildings by ISM-ANP Network Structure Model and BIM under Big Data Text Mining. IJIMAI 2020, 6, 138. [Google Scholar] [CrossRef]
  10. Li, X.; Wang, C.; Kassem, M.A.; Alhajlah, H.H.; Bimenyimana, S. Evaluation Method for Quality Risks of Safety in Prefabricated Building Construction Using SEM–SDM Approach. Int. J. Environ. Res. Public Health 2022, 19, 5180. [Google Scholar] [CrossRef] [PubMed]
  11. Liu, J.; Gong, E.; Wang, D.; Teng, Y. Cloud Model-Based Safety Performance Evaluation of Prefabricated Building Project in China. Wirel. Pers. Commun. 2018, 102, 3021–3039. [Google Scholar] [CrossRef]
  12. Cai, B.; Liu, Y.; Ma, Y.; Liu, Z.; Zhou, Y.; Sun, J. Real-Time Reliability Evaluation Methodology Based on Dynamic Bayesian Networks: A Case Study of a Subsea Pipe Ram BOP System. ISA Trans. 2015, 58, 595–604. [Google Scholar] [CrossRef]
  13. Hosseini, S.; Barker, K. Modeling Infrastructure Resilience Using Bayesian Networks: A Case Study of Inland Waterway Ports. Comput. Ind. Eng. 2016, 93, 252–266. [Google Scholar] [CrossRef]
  14. Baroud, H.; Barker, K. A Bayesian Kernel Approach to Modeling Resilience-Based Network Component Importance. Reliab. Eng. Syst. Saf. 2018, 170, 10–19. [Google Scholar] [CrossRef]
  15. Abimbola, M.; Khan, F. Resilience Modeling of Engineering Systems Using Dynamic Object-Oriented Bayesian Network Approach. Comput. Ind. Eng. 2019, 130, 108–118. [Google Scholar] [CrossRef]
  16. Kammouh, O.; Gardoni, P.; Cimellaro, G.P. Probabilistic Framework to Evaluate the Resilience of Engineering Systems Using Bayesian and Dynamic Bayesian Networks. Reliab. Eng. Syst. Saf. 2020, 198, 106813. [Google Scholar] [CrossRef]
  17. Wu, X.; Liu, H.; Zhang, L.; Skibniewski, M.J.; Deng, Q.; Teng, J. A Dynamic Bayesian Network Based Approach to Safety Decision Support in Tunnel Construction. Reliab. Eng. Syst. Saf. 2015, 134, 157–168. [Google Scholar] [CrossRef]
  18. Yodo, N.; Wang, P.; Zhou, Z. Predictive Resilience Analysis of Complex Systems Using Dynamic Bayesian Networks. IEEE Trans. Reliab. 2017, 66, 761–770. [Google Scholar] [CrossRef]
  19. Meng, H.; An, X.; Xing, J. A Data-Driven Bayesian Network Model Integrating Physical Knowledge for Prioritization of Risk Influencing Factors. Process Saf. Environ. Prot. 2022, 160, 434–449. [Google Scholar] [CrossRef]
  20. Amin, M.T.; Khan, F.; Ahmed, S.; Imtiaz, S. A Data-Driven Bayesian Network Learning Method for Process Fault Diagnosis. Process Saf. Environ. Prot. 2021, 150, 110–122. [Google Scholar] [CrossRef]
  21. Joo, Y.-J.; Kho, S.-Y.; Kim, D.-K.; Park, H.-C. A Data-Driven Bayesian Network for Probabilistic Crash Risk Assessment of Individual Driver with Traffic Violation and Crash Records. Accid. Anal. Prev. 2022, 176, 106790. [Google Scholar] [CrossRef]
  22. Qazi, A.; Simsekler, M.C.E. Assessment of Humanitarian Crises and Disaster Risk Exposure Using Data-Driven Bayesian Networks. Int. J. Disaster Risk Reduct. 2021, 52, 101938. [Google Scholar] [CrossRef]
  23. Wang, T.; Gao, S.; Li, X.; Ning, X. A Meta-Network-Based Risk Evaluation and Control Method for Industrialized Building Construction Projects. J. Clean. Prod. 2018, 205, 552–564. [Google Scholar] [CrossRef]
  24. Zhou, W.; Zhao, T.; Liu, W.; Tang, J. Tower Crane Safety on Construction Sites: A Complex Sociotechnical System Perspective. Saf. Sci. 2018, 109, 95–108. [Google Scholar] [CrossRef]
  25. Jeong, J.; Jeong, J. Novel Approach of the Integrated Work & Risk Breakdown Structure for Identifying the Hierarchy of Fatal Incident in Construction Industry. J. Build. Eng. 2021, 41, 102406. [Google Scholar] [CrossRef]
  26. Ye, M.; Wang, J.; Si, X.; Zhao, S.; Huang, Q. Analysis on Dynamic Evolution of the Cost Risk of Prefabricated Building Based on DBN. Sustainability 2022, 14, 1864. [Google Scholar] [CrossRef]
  27. Raviv, G.; Shapira, A.; Fishbain, B. AHP-Based Analysis of the Risk Potential of Safety Incidents: Case Study of Cranes in the Construction Industry. Saf. Sci. 2017, 91, 298–309. [Google Scholar] [CrossRef]
  28. Xie, L.; Chen, Y. Sustainability Assessment of Prefabricated Building Based on ANP-Entropy Weight Method: Case Study of Guangzhou City. In Proceedings of the Construction Research Congress 2020, Tempe, AZ, USA, 8–10 March 2020; pp. 259–267. [Google Scholar] [CrossRef]
  29. Yang, M. Risk Management of Prefabricated Building Construction Based on Fuzzy Neural Network. Sci. Program. 2022, 2022, e2420936. [Google Scholar] [CrossRef]
  30. Guo, Z.L.; Zhang, W.B.; Ma, L.H. The Prefabricated Building Risk Decision Research of DM Technology on the Basis of Rough Set. IOP Conf. Ser. Earth Environ. Sci. 2017, 81, 012143. [Google Scholar] [CrossRef]
  31. Mangeli, M.; Shahraki, A.; Saljooghi, F.H. Improvement of Risk Assessment in the FMEA Using Nonlinear Model, Revised Fuzzy TOPSIS, and Support Vector Machine. Int. J. Ind. Ergon. 2019, 69, 209–216. [Google Scholar] [CrossRef]
  32. Tang, S.; Shelden, D.R.; Eastman, C.M.; Pishdad-Bozorgi, P.; Gao, X. A Review of Building Information Modeling (BIM) and the Internet of Things (IoT) Devices Integration: Present Status and Future Trends. Autom. Constr. 2019, 101, 127–139. [Google Scholar] [CrossRef]
  33. Liu, Z.; Li, A.; Sun, Z.; Shi, G.; Meng, X. Digital Twin-Based Risk Control during Prefabricated Building Hoisting Operations. Sensors 2022, 22, 2522. [Google Scholar] [CrossRef] [PubMed]
  34. Holling, C.S. Resilience and Stability of Ecological Systems. Annu. Rev. Ecol. Syst. 1973, 4, 1–23. [Google Scholar] [CrossRef]
  35. Zhou, Q.; Zhu, M.; Qiao, Y.; Zhang, X.; Chen, J. Achieving Resilience through Smart Cities? Evidence from China. Habitat Int. 2021, 111, 102348. [Google Scholar] [CrossRef]
  36. Rodríguez-Izquierdo, E.; Cid, A.; García-Meneses, P.M.; Peña-Sanabria, K.A.; Lerner, A.M.; Matus-Kramer, A.; Escalante, A.E. From Resilience Attributes to City Resilience. Landsc. Urban Plan. 2022, 226, 104485. [Google Scholar] [CrossRef]
  37. Cheek, W.; Chmutina, K. Measuring Resilience in the Assumed City. Int. J. Disaster Risk Sci. 2022, 13, 317–329. [Google Scholar] [CrossRef]
  38. Yodo, N.; Wang, P. Resilience Modeling and Quantification for Engineered Systems Using Bayesian Networks. J. Mech. Des. 2016, 138, 031404. [Google Scholar] [CrossRef]
  39. Yodo, N.; Wang, P. Engineering Resilience Quantification and System Design Implications: A Literature Survey. J. Mech. Des. 2016, 138, 111408. [Google Scholar] [CrossRef]
  40. Ambulkar, S.; Blackhurst, J.; Grawe, S. Firm’s Resilience to Supply Chain Disruptions: Scale Development and Empirical Examination. J. Oper. Manag. 2015, 33–34, 111–122. [Google Scholar] [CrossRef]
  41. Um, J.; Han, N. Understanding the Relationships between Global Supply Chain Risk and Supply Chain Resilience: The Role of Mitigating Strategies. Supply Chain Manag. Int. J. 2020, 26, 240–255. [Google Scholar] [CrossRef]
  42. Hu, J.; Khan, F.; Zhang, L. Dynamic Resilience Assessment of the Marine LNG Offloading System. Reliab. Eng. Syst. Saf. 2021, 208, 107368. [Google Scholar] [CrossRef]
  43. Zinetullina, A.; Yang, M.; Khakzad, N.; Golman, B.; Li, X. Quantitative Resilience Assessment of Chemical Process Systems Using Functional Resonance Analysis Method and Dynamic Bayesian Network. Reliab. Eng. Syst. Saf. 2021, 205, 107232. [Google Scholar] [CrossRef]
  44. Vugrin, E.D.; Warren, D.E.; Ehlen, M.A.; Camphouse, R.C. A Framework for Assessing the Resilience of Infrastructure and Economic Systems. In Sustainable and Resilient Critical Infrastructure Systems: Simulation, Modeling, and Intelligent Engineering; Gopalakrishnan, K., Peeta, S., Eds.; Springer: Berlin/Heidelberg, Germany, 2010; pp. 77–116. ISBN 978-3-642-11405-2. [Google Scholar]
  45. Petersen, L.; Lange, D.; Theocharidou, M. Who Cares What It Means? Practical Reasons for Using the Word Resilience with Critical Infrastructure Operators. Reliab. Eng. Syst. Saf. 2020, 199, 106872. [Google Scholar] [CrossRef]
  46. Sen, M.K.; Dutta, S.; Kabir, G. Flood Resilience of Housing Infrastructure Modeling and Quantification Using a Bayesian Belief Network. Sustainability 2021, 13, 1026. [Google Scholar] [CrossRef]
  47. Bruneau, M.; Reinhorn, A. Exploring the Concept of Seismic Resilience for Acute Care Facilities. Earthq. Spectra 2007, 23, 41–62. [Google Scholar] [CrossRef]
  48. Fang, Y.-P.; Zio, E. An Adaptive Robust Framework for the Optimization of the Resilience of Interdependent Infrastructures under Natural Hazards. Eur. J. Oper. Res. 2019, 276, 1119–1136. [Google Scholar] [CrossRef]
  49. Mooney, E.L.; Almoghathawi, Y.; Barker, K. Facility Location for Recovering Systems of Interdependent Networks. IEEE Syst. J. 2019, 13, 489–499. [Google Scholar] [CrossRef]
  50. Francis, R.; Bekera, B. A Metric and Frameworks for Resilience Analysis of Engineered and Infrastructure Systems. Reliab. Eng. Syst. Saf. 2014, 121, 90–103. [Google Scholar] [CrossRef]
  51. Ruiz-Tagle, A.; Lopez Droguett, E.; Groth, K.M. Exploiting the Capabilities of Bayesian Networks for Engineering Risk Assessment: Causal Reasoning through Interventions. Risk Anal. 2022, 42, 1306–1324. [Google Scholar] [CrossRef]
  52. Lv, R.; Chen, J.; Sun, Q.; Ye, Z. Design—Construction Phase Safety Risk Analysis of Assembled Buildings. Buildings 2023, 13, 949. [Google Scholar] [CrossRef]
  53. Hossain, N.U.I.; Nur, F.; Hosseini, S.; Jaradat, R.; Marufuzzaman, M.; Puryear, S.M. A Bayesian Network Based Approach for Modeling and Assessing Resilience: A Case Study of a Full Service Deep Water Port. Reliab. Eng. Syst. Saf. 2019, 189, 378–396. [Google Scholar] [CrossRef]
  54. Zeng, Z.; Fang, Y.-P.; Zhai, Q.; Du, S. A Markov Reward Process-Based Framework for Resilience Analysis of Multistate Energy Systems under the Threat of Extreme Events. Reliab. Eng. Syst. Saf. 2021, 209, 107443. [Google Scholar] [CrossRef]
  55. Zhang, G.; Thai, V.V. Expert Elicitation and Bayesian Network Modeling for Shipping Accidents: A Literature Review. Saf. Sci. 2016, 87, 53–62. [Google Scholar] [CrossRef]
  56. Constantinou, A.C.; Liu, Y.; Chobtham, K.; Guo, Z.; Kitson, N.K. Large-Scale Empirical Validation of Bayesian Network Structure Learning Algorithms with Noisy Data. Int. J. Approx. Reason. 2021, 131, 151–188. [Google Scholar] [CrossRef]
  57. Song, W.; Qin, Z.; Hu, X.; Han, H.; Li, A.; Zhou, X.; Li, Y.; Li, R. Using Bayesian Networks with Tabu-Search Algorithm to Explore Risk Factors for Hyperhomocysteinemia. Sci. Rep. 2023, 13, 1610. [Google Scholar] [CrossRef]
  58. Hu, J. A New Approach for Constructing Two Bayesian Network Models for Predicting the Liquefaction of Gravelly Soil. Comput. Geotech. 2021, 137, 104304. [Google Scholar] [CrossRef]
  59. Kamil, M.Z.; Taleb-Berrouane, M.; Khan, F.; Amyotte, P. Data-Driven Operational Failure Likelihood Model for Microbiologically Influenced Corrosion. Process Saf. Environ. Prot. 2021, 153, 472–485. [Google Scholar] [CrossRef]
  60. Marcot, B.G.; Hanea, A.M. What Is an Optimal Value of k in K-Fold Cross-Validation in Discrete Bayesian Network Analysis? Comput. Stat. 2021, 36, 2009–2031. [Google Scholar] [CrossRef]
  61. Simsekler, M.C.E.; Qazi, A. Adoption of a Data-Driven Bayesian Belief Network Investigating Organizational Factors That Influence Patient Safety. Risk Anal. 2022, 42, 1277–1293. [Google Scholar] [CrossRef]
  62. Hu, J.-L.; Tang, X.-W.; Qiu, J.-N. Assessment of Seismic Liquefaction Potential Based on Bayesian Network Constructed from Domain Knowledge and History Data. Soil Dyn. Earthq. Eng. 2016, 89, 49–60. [Google Scholar] [CrossRef]
  63. Zarei, E.; Khakzad, N.; Cozzani, V.; Reniers, G. Safety Analysis of Process Systems Using Fuzzy Bayesian Network (FBN). J. Loss Prev. Process Ind. 2019, 57, 7–16. [Google Scholar] [CrossRef]
  64. Tang, Y.; Bi, W.; Varga, L.; Dolan, T.; Li, Q. An Integrated Framework for Managing Fire Resilience of Metro Station System: Identification, Assessment, and Optimization. Int. J. Disaster Risk Reduct. 2022, 77, 103037. [Google Scholar] [CrossRef]
  65. Guo, Q.; Amin, S.; Hao, Q.; Haas, O. Resilience Assessment of Safety System at Subway Construction Sites Applying Analytic Network Process and Extension Cloud Models. Reliab. Eng. Syst. Saf. 2020, 201, 106956. [Google Scholar] [CrossRef]
Figure 1. The concept curve of safety resilience in prefabricated construction.
Buildings 14 00570 g001
Figure 2. The process of constructing a DBN model for safety resilience evaluation of prefabricated building construction.
Buildings 14 00570 g002
Figure 3. The flow chart of the TS algorithm.
Buildings 14 00570 g003
Figure 4. The BN structure based on expert experience.
Buildings 14 00570 g004
Figure 5. The BN structure based on expert experience and the TS algorithm.
Buildings 14 00570 g005
Figure 6. The static BN structure.
Buildings 14 00570 g006
Figure 7. The validation of the ROC curve of the static evaluation model.
Buildings 14 00570 g007
Figure 8. The DBN structure for the safety resilience evaluation of the prefabricated building construction.
Buildings 14 00570 g008
Figure 9. DBN model with evidence input.
Buildings 14 00570 g009
Figure 10. The dynamic probability changes of nodes with evidence input.
Buildings 14 00570 g010
Table 1. Evaluation index system of safety resilience of prefabricated building construction.
Target LayerPrimary IndicatorSecondary Indicator
Prefabricated building construction safety resilience RAbsorption capability ASafety awareness of personnel A1Preventing unsafe behavior of personnel A11
Professional technical level and operational proficiency of personnel A2
Personnel physiological and psychological state A3
Machinery and equipment condition and performance A4
Quality of prefabricated components A5
Maturity of key technologies for construction and installation of prefabricated components A6
Reliable connection of prefabricated components A7
Safety management and supervision on the construction site A8
Risk source assessment and countermeasures A9
Information monitoring and processing system setup A10
Adaptation capability BMultidimensional cooperation B1
Self-organizing ability of the organization B2
Substitutability of key resources B3
Integrity and efficiency of security messaging B4
Recovery capability CAccident emergency management system C1Emergency management actions C7
Emergency Response Plan C2
Emergency access and shelter settings C3
Emergency organization and dispatching capability for managers C4
Emergency life-saving capabilities for personnel C5
Emergency material supply C6
Optimization capability DAccident cause investigation and experience summary D1
Establishing security information sharing and management platform D2Building a risk management information system D7
Intelligent transmission of risk disaster safety early warning information D3
Safety education training and drills D4
Developing transformational leadership D5
Establishing a resilience safety culture D6
Table 2. The confusion matrix.
Predicted NegativePredicted Positive
Actual NegativeTN (True Negative)FP (False Positive)
Actual PositiveFN (False Negative)TP (True Positive)
Table 3. The confusion matrix of static BN.
Predicted NegativePredicted Positive
Actual Negative3718
Actual Positive25153
Table 4. Correspondence between natural language variables and triangular fuzzy numbers.
Linguistic TermsFuzzy Number
Very low(0, 0.1, 0.2)
Low(0.1, 0.2, 0.3)
Lower(0.3, 0.4, 0.5)
Moderate(0.5, 0.6, 0.7)
Higher(0.6, 0.7, 0.8)
High(0.7, 0.8, 0.9)
Very high(0.8, 0.9, 1.0)
Table 5. Node transfer probability table.
A(t + 1)A(t)B(t + 1)B(t)
YESNOYESNO
YES0.840.33YES0.820.38
NO0.160.67NO0.180.62
C(t + 1)C(t)D(t + 1)D(t)
YESNOYESNO
YES0.770.36YES0.730.29
NO0.230.64NO0.270.71
R(t + 1)R(t)A(t + 1)D(t)
YESNOYESNO
YES0.870.28YES0.780.26
NO0.130.72NO0.220.74
B(t + 1)D(t)C(t + 1)D(t)
YESNOYESNO
YES0.650.33YES0.710.31
NO0.350.67NO0.290.69
Table 6. Root node posterior probability and RoV value sorting (secondary indicator).
IndicatorPrior
Probability
Posterior ProbabilitySortRoV ValueSort
Safety awareness of personnel A10.82360.8112240.015110
Professional technical level and operational proficiency of personnel A20.87970.8713110.009517
Personnel physiological and
psychological state A3
0.88370.8756100.009219
Preventing unsafe behavior of
personnel A11
0.86950.8365190.03792
Machinery and equipment condition and performance A40.90690.900460.007220
Quality of prefabricated components A50.91220.909230.003325
Maturity of key technologies for
construction and installation of
prefabricated components A6
0.89490.891180.004224
Reliable connection of prefabricated
components A7
0.89160.887590.004623
Safety management and supervision on the construction site A80.85970.8296220.03503
Risk source assessment and
countermeasures A9
0.84330.8353210.009518
Information monitoring and processing system setup A100.81410.8033260.013314
Multidimensional cooperation B10.83700.8286230.010116
Self-organizing ability of the
organization B2
0.85170.8389160.015011
Substitutability of key resources B30.90510.892370.014113
Integrity and efficiency of security
messaging B4
0.85020.8380170.014312
Accident emergency management
system C1
0.90420.902850.001528
Emergency Response Plan C20.91360.911920.001927
Emergency access and shelter settings C30.91870.917510.001329
emergency management actions C70.8260.801270.03034
Emergency organization and
dispatching capability for managers C4
0.87610.8611140.01718
Emergency life-saving capabilities for
personnel C5
0.85130.8362200.01777
Emergency material supply C60.87950.8655130.01599
Accident cause investigation and
experience summary D1
0.92550.906540.02056
Establishing security information
sharing and management platform D2
0.85270.8426150.011815
Intelligent transmission of risk disaster safety early warning information D30.84030.8376180.003226
Building a risk management information system D70.78280.7609280.02805
Safety education training and drills D40.87400.8694120.005322
Developing transformational leadership D50.81160.8062250.006721
Establishing a resilience safety culture D60.72080.6898290.04301
Table 7. Root node posterior probability and RoV value sorting (primary indicator).
IndicatorPrior
Probability
Posterior ProbabilitySortRoV ValueSort
Absorption capacity A0.82390.642230.22051
Adaptation capacity B0.87060.697710.19863
Recovery capacity C0.82590.652120.21042
Optimization capacity D0.72240.608940.15714
Disclaimer/Publisher’s Note: The statements, opinions and data contained in all publications are solely those of the individual author(s) and contributor(s) and not of MDPI and/or the editor(s). MDPI and/or the editor(s) disclaim responsibility for any injury to people or property resulting from any ideas, methods, instructions or products referred to in the content.

