
Safety Risk Analysis of Urban Viaduct Construction Based on Dynamic Weight


1
School of Civil Engineering and Architecture, Wuhan University of Technology, Wuhan 430000, China
2
Wuhan Chedu Construction Development Co., Ltd., Wuhan 430000, China
3
School of Accountancy, Wuhan Textile University, Wuhan 430000, China
4
School of Infrastructure Engineering, Nanchang University, Nanchang 330047, China
*
Author to whom correspondence should be addressed.
Buildings 2024, 14(4), 1014; https://doi.org/10.3390/buildings14041014
Submission received: 18 March 2024
/
Revised: 2 April 2024
/
Accepted: 3 April 2024
/
Published: 5 April 2024
(This article belongs to the Special Issue Advances in Life Cycle Management of Civil Engineering)
Abstract
:The safety risk analysis of urban elevated bridge construction is an important management method to reduce the loss of safety accidents, and it has significant scientific research value and engineering application value. Therefore, this study proposes a novel analysis method to address these challenges. Firstly, this paper constructs a Work Breakdown Structure (WBS)–Risk Breakdown Structure (RBS) matrix for the safety risk of urban elevated bridge construction in order to achieve a comprehensive and complete identification of the indicator system. Then, a combination of static weights and dynamic weights calculation methods is developed. The static weights are obtained using the analytic hierarchy process, while the dynamic weights are obtained based on the relationship between the dynamic scores of construction safety risk indicators in different construction stages and the preset evaluation levels. Finally, a case study of the Longlingshan elevated bridge project in Wuhan, China, is conducted to validate the feasibility of the proposed model and its potential application in projects. The case analysis for the first time reveals that with the progress of construction, the weights of each indicator continuously change, and the secondary indicators related to environmental factors, such as extreme high-temperature weather, undergo the greatest changes. A comparison of different dynamic weight calculation methods is conducted to highlight the advancement of the proposed model. The research findings of this paper will provide new insights and guidance for improving the construction safety of urban elevated bridge projects.
1. Introduction
Cities worldwide, particularly those in developing countries, are constantly expanding their boundaries, presenting significant challenges for long-distance transportation within urban areas [1]. An elevated bridge refers to a bridge designed to be constructed above the ground due to constraints imposed by existing ground conditions. These bridges enable uninterrupted construction of roads by raising them above the ground surface. Moreover, an increasing number of urban elevated bridge projects have been undertaken, greatly enhancing urban transportation efficiency. Nevertheless, the construction of urban elevated bridges is considered a vast and intricate engineering endeavor involving several safety risks. Recently, there has been a surge in construction accidents associated with elevated bridges [2]. For example, on 7 September 2018, a collapse accident occurred during the construction of an elevated bridge project in Ganzhou, China, resulting in four fatalities. Consequently, conducting a scientific and systematic analysis of the construction safety risks associated with urban elevated bridges is imperative to effectively prevent safety accidents.
In recent years, numerous researchers have undertaken extensive studies on safety management in bridge construction. Following the general research paradigm of risk management [3], these studies can be categorized into three main themes: identification of construction safety risks; calculation of risk index weights; and determination of risk assessment levels. Moreover, risk identification and weight calculation stand out as pivotal components of risk analysis.
Utilizing the accident causation theory, Li et al. [4] established a highway bridge construction safety risk assessment index system, delving into the mechanism of safety accident occurrence. They employed the entropy weight method to calculate the objective weights of the indicators. Meanwhile, Chen et al. [2] constructed a risk system for bridge construction based on statistical data analysis of safety accidents in bridge construction projects. However, the index system derived solely from safety accident data captures only a fraction of the risk factors contributing to safety accidents, lacking comprehensive identification of all potential causative factors. In contrast, Naderpour et al. [5] devised a risk list for bridge construction projects in Iran using expert interviews and questionnaire surveys. However, given their study’s primary focus on construction risk, construction safety risk constituted only a small part of the risk list, resulting in completeness.
Adopting the Plan, Do, Check, Act cycle in quality management, Lin et al. [6] constructed a bridge construction safety risk system from the perspective of construction risk management. They employed expert surveys to identify safety risk indicators; however, the subjective opinions of the experts hindered the identification process. Furthermore, Wu and Lu [7] summarized commonly used methods for identifying construction safety risks, highlighting research focusing on pinpointing the sources of construction safety risks and categorizing safety risk indicators. In addition, they employed the Man, Machine, Material, Method, and Environments (4M1E) analysis method to encapsulate factors contributing to bridge construction safety risks.
Yet, bridge construction projects are characterized by diverse construction content, complex sources of construction safety risks, and intricate interrelationships among various influencing factors. These research endeavors tend to concentrate on identifying bridge construction safety risks from a singular dimension, failing to effectively address these characteristics or provide a basis for systematic research in related fields.
Moreover, Wu et al. [8] employed the Criteria Importance Through Intercriteria Correlation (CRITIC) method, a classic objective research approach, to statically calculate the influence of various safety risk factors on the construction safety risk of offshore bridges. In addition, Ji et al. [9] employed the Fuzzy Analytic Hierarchy Process (F-AHP) to determine the weights of safety risk evaluation indicators for bridge construction. In their study, the weights of all indicators were established before construction and remained constant throughout the entire construction process. Furthermore, Khan et al. [10] used the Analytic Hierarchy Process (AHP) to assess the structural performance of bridge projects under fire. The theoretical results in their paper diverged from the actual situation, possibly due to the oversight of the fast time-varying effects of fires.
Moreover, Peng [11] emphasized the significance of weight calculation in evaluating safety risks in bridge construction and used AHP to compute the weights of safety risk evaluation indicators for bridge construction. In evaluating safety risks in bridge construction, Ju et al. [12] adopted a game theory approach to combine the calculated results of subjective and objective weights. Given the evident dynamic characteristics of bridge construction projects, the impact of various risk indicators on the safety risk of bridge construction exhibits distinct dynamic features. However, whether employing subjective weight calculation methods or objective weight calculation methods, these study results analyze the influence of various factors on risk evaluation results statically, neglecting the dynamic nature of construction risks.
Based on the identified gaps in the relevant research field, this paper proposes a comprehensive method for analyzing construction safety risks in urban elevated bridge projects. This method integrates the Work Breakdown Structure–Resource Breakdown Structure (WBS-RBS) framework and dynamic weighting. Therefore, the main contributions of this paper are outlined as follows:
- (1)
- The WBS-RBS matrix is utilized to identify and establish an evaluation index system for construction safety risks in urban elevated bridge projects, considering the perspectives of construction activities and risk sources. This index system effectively tackles the challenges of diverse construction activities and complex risk factors, thereby laying a solid foundation for systematic research in the related field;
- (2)
- A novel dynamic weighting calculation method is introduced, tailored to better suit engineering practices and management requirements. This method aptly elucidates the dynamic impact of various evaluation indicators on risk assessment outcomes, thereby facilitating a more scientific and effective calculation of construction risk weights;
- (3)
- A case study of the Longlingshan elevated bridge project in Wuhan, China, is undertaken, resulting in numerous novel and valuable research findings that offer practical guidance for engineering.
To sum up, this paper is organized as follows: Section 2 establishes a safety risk analysis index system for urban overpass construction projects and proposes a construction safety risk analysis model based on dynamic weights. Moreover, Section 3 conducts a case study, whereas Section 4 discusses the research details of this article. Finally, Section 5 summarizes the research findings and limitations of this article and proposes some future works.
2. The Proposed Method for Safety Risk Analysis of Urban Viaduct Construction
2.1. Identification of Factors Influencing Construction Safety Risks in Urban Elevated Bridge Projects Based on WBS-RBS
2.1.1. WBS of Urban Elevated Bridge Projects
The superstructure of the main elevated bridge in urban viaducts typically comprises prefabricated small box beams, while the substructure of the main elevated bridge employs rectangular cap beams, and the ramps are constructed using cast-in-place beam structures. Consequently, the risk of accidents during construction arises in the following key processes are due to deep foundation pit construction (), tall pier column construction (), component lifting construction (), and cast-in-place formwork construction (). These four processes are detailed below:
- (1)
- Deep foundation pit construction. The deep foundation pit project for elevated bridges mainly includes the following construction activities: dewatering (); earthwork excavation (); pile foundation construction (); and pit monitoring ();
- (2)
- Pier construction. The construction of piers for elevated bridges primarily involves various stages, such as construction preparation (), scaffold erection and removal (), steel reinforcement processing and installation (), formwork installation and removal (), and concrete pouring and curing ();
- (3)
- Component hoisting construction. The construction of component hoisting mainly emphasizes several stages, including construction preparation (), crane fixing (), vertical transportation (), and horizontal transportation ();
- (4)
- Construction of cast-in-situ formwork. The construction of cast-in-situ formwork regroups the preparation for construction (), foundation treatment (), formwork erection and prestressing (), formwork installation and removal (), and concrete pouring and curing ().
2.1.2. RBS of Urban Elevated Bridge Project
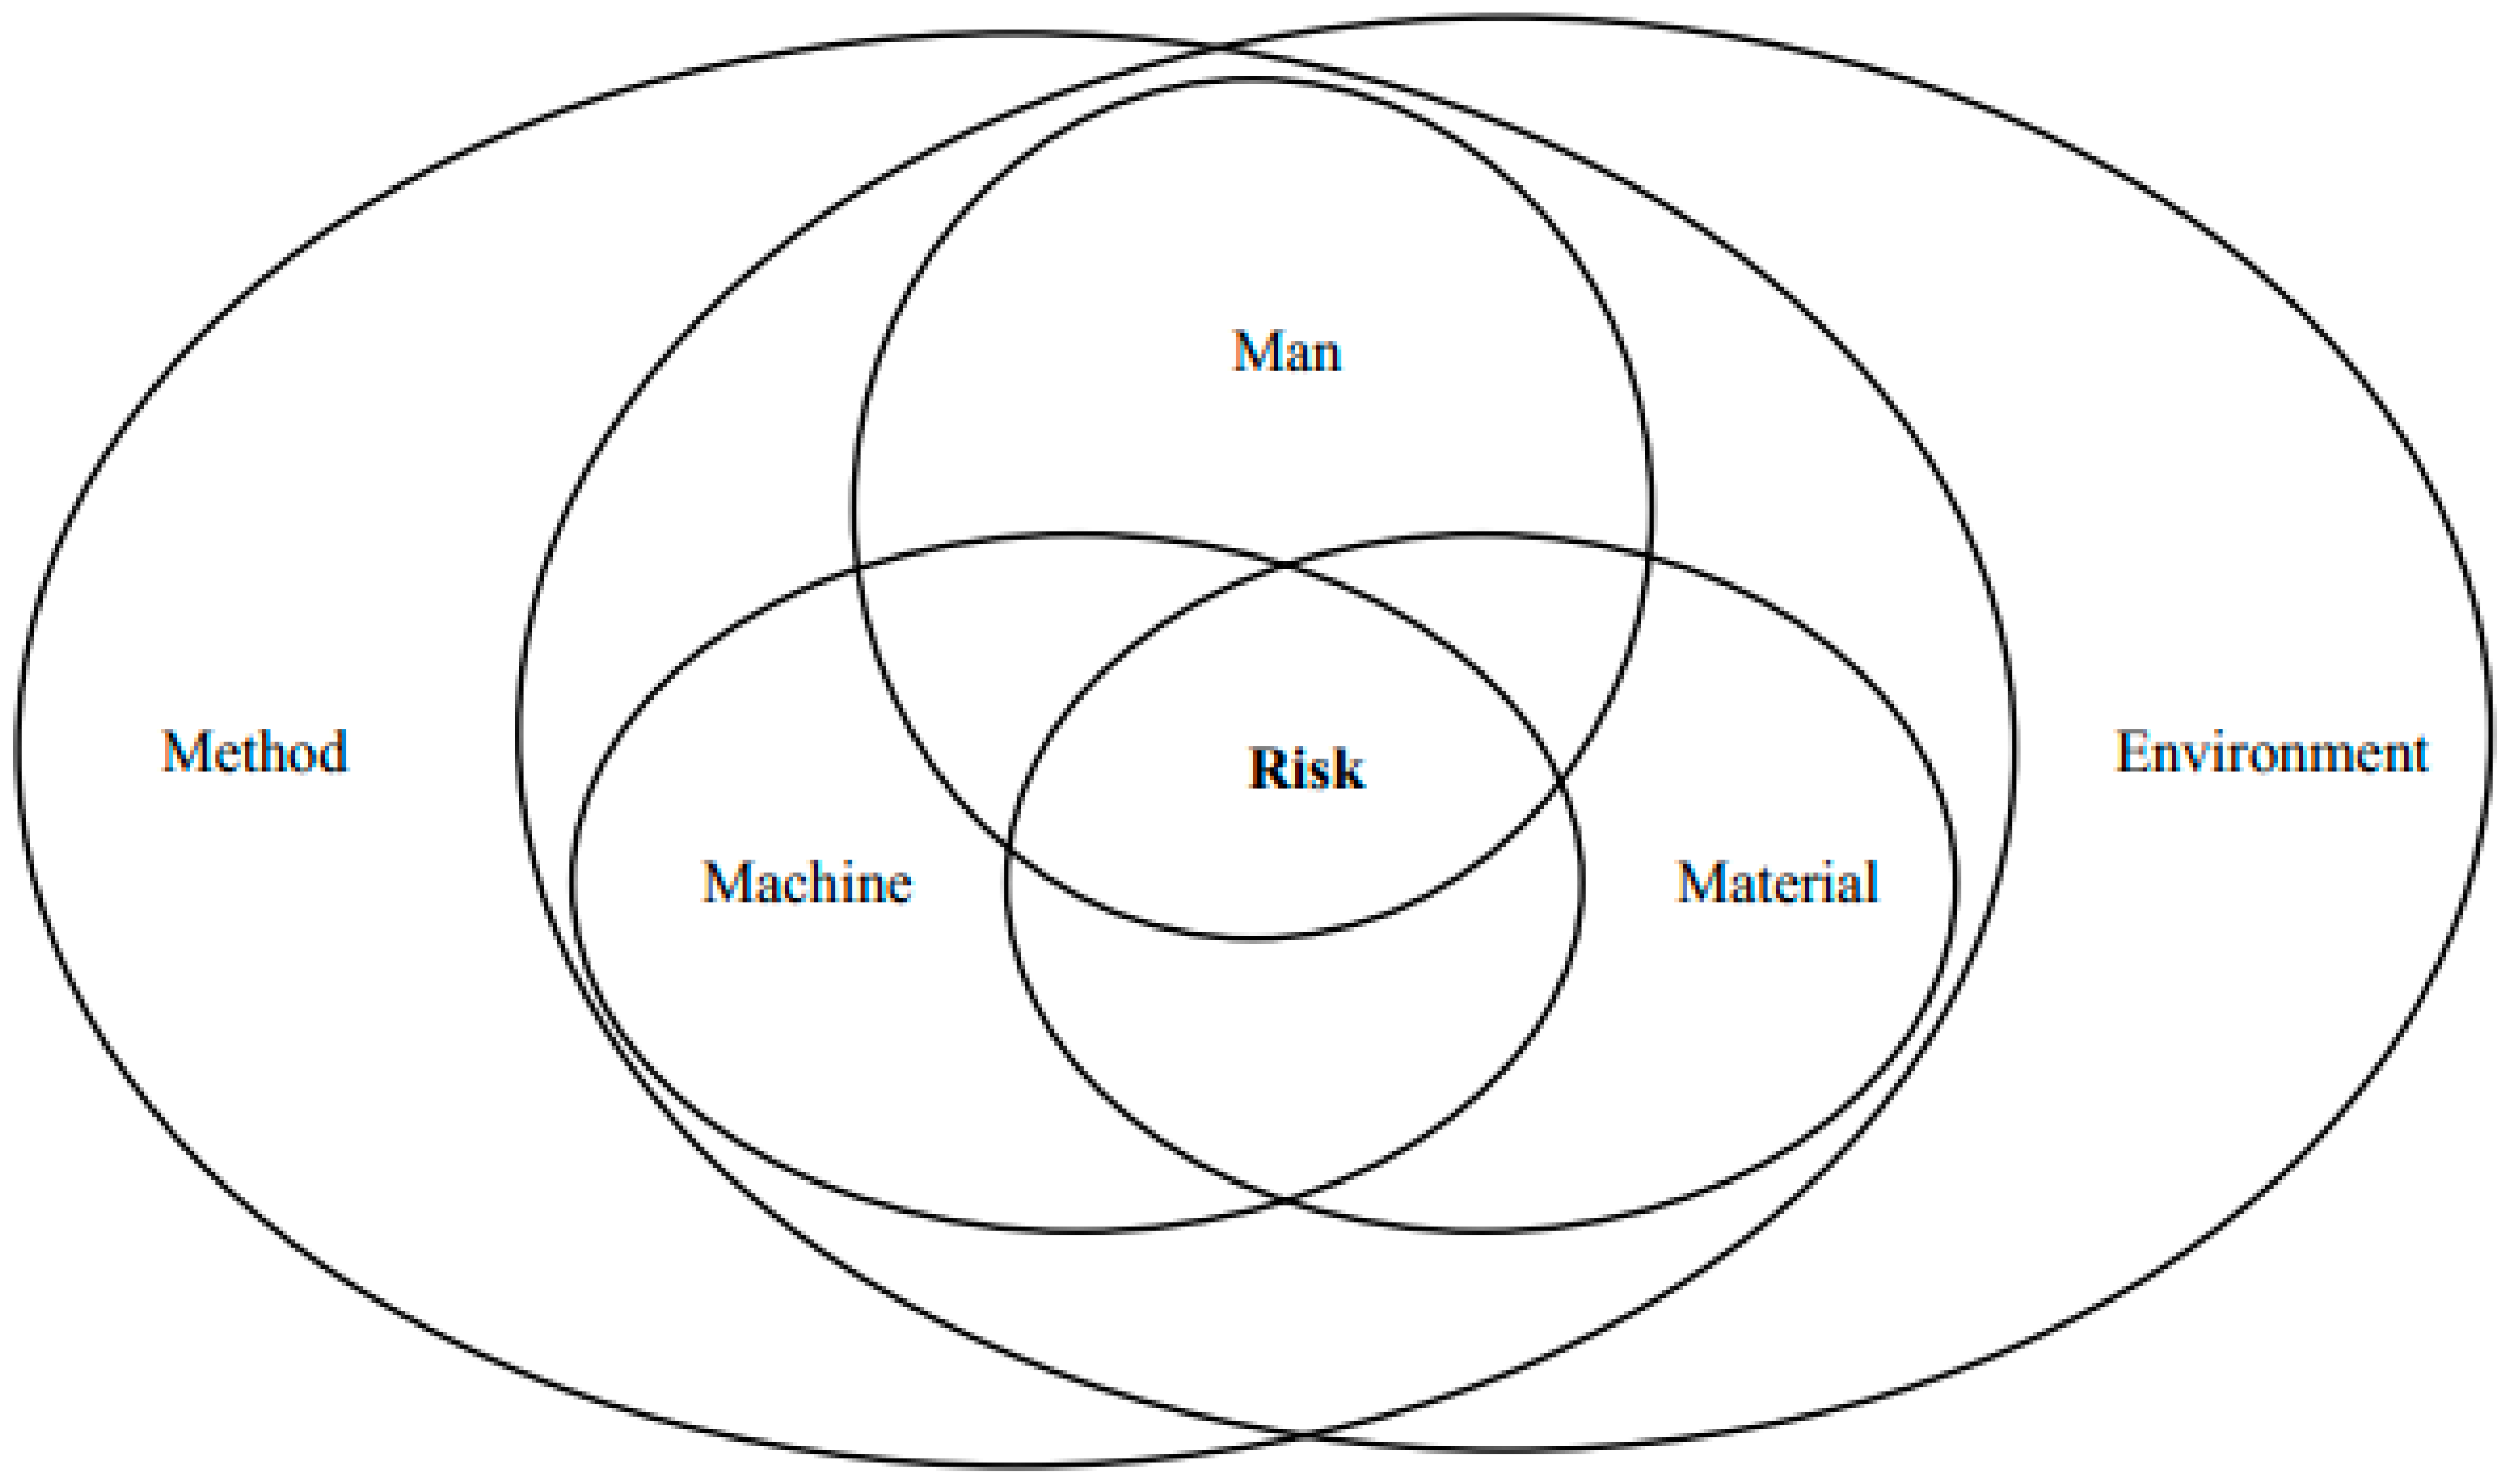
The sources of construction safety risks in urban elevated bridge projects primarily focus on personnel (), machinery (), materials (), construction environment (), and construction management () parameters [13]. Construction safety accidents occur due to the interplay, interaction, and impact among unsafe individual behavior, hazardous conditions of facilities and materials, and unfavorable on-site construction environments, all of which are influenced by construction management factors [14]. Figure 1 illustrates some of these actions.
(1) Man. According to statistics [2], a majority of construction safety accidents (over 90%) are attributed to unsafe human behavior. The risk factors associated with personnel primarily encompass psychological factors (), physiological factors (), and occupational education ();
(2) Machine. The unsafe conditions of machinery mainly encompass several aspects, namely, quality defects (), installation defects of the machinery equipment (), improper use (), and inadequate maintenance () of the machinery;
(3) Material. The construction materials used in urban elevated bridges primarily comprise prefabricated components, concrete, and reinforcement bars. Therefore, the unsafe conditions of these materials can be attributed to several factors, including quality defects in prefabricated components (), quality defects in concrete (), quality defects in reinforcement bars (), rough transportation of materials (), and improper storage practices ();
(4) Environment. The safety of construction activities on urban elevated bridges is closely linked to environmental factors. Such factors encompass adverse geological conditions (), unfavorable topographical conditions (), limited workspace (), disorganized work areas (), and abnormal weather conditions ();
(5) Management. The key management deficiencies in ensuring the safety of construction activities on urban elevated bridges encompass inadequate safety regulations and protocols (), lack of implementation of collective responsibility (), deficiencies in construction processes (), and absence of approved safety-specific plans ().
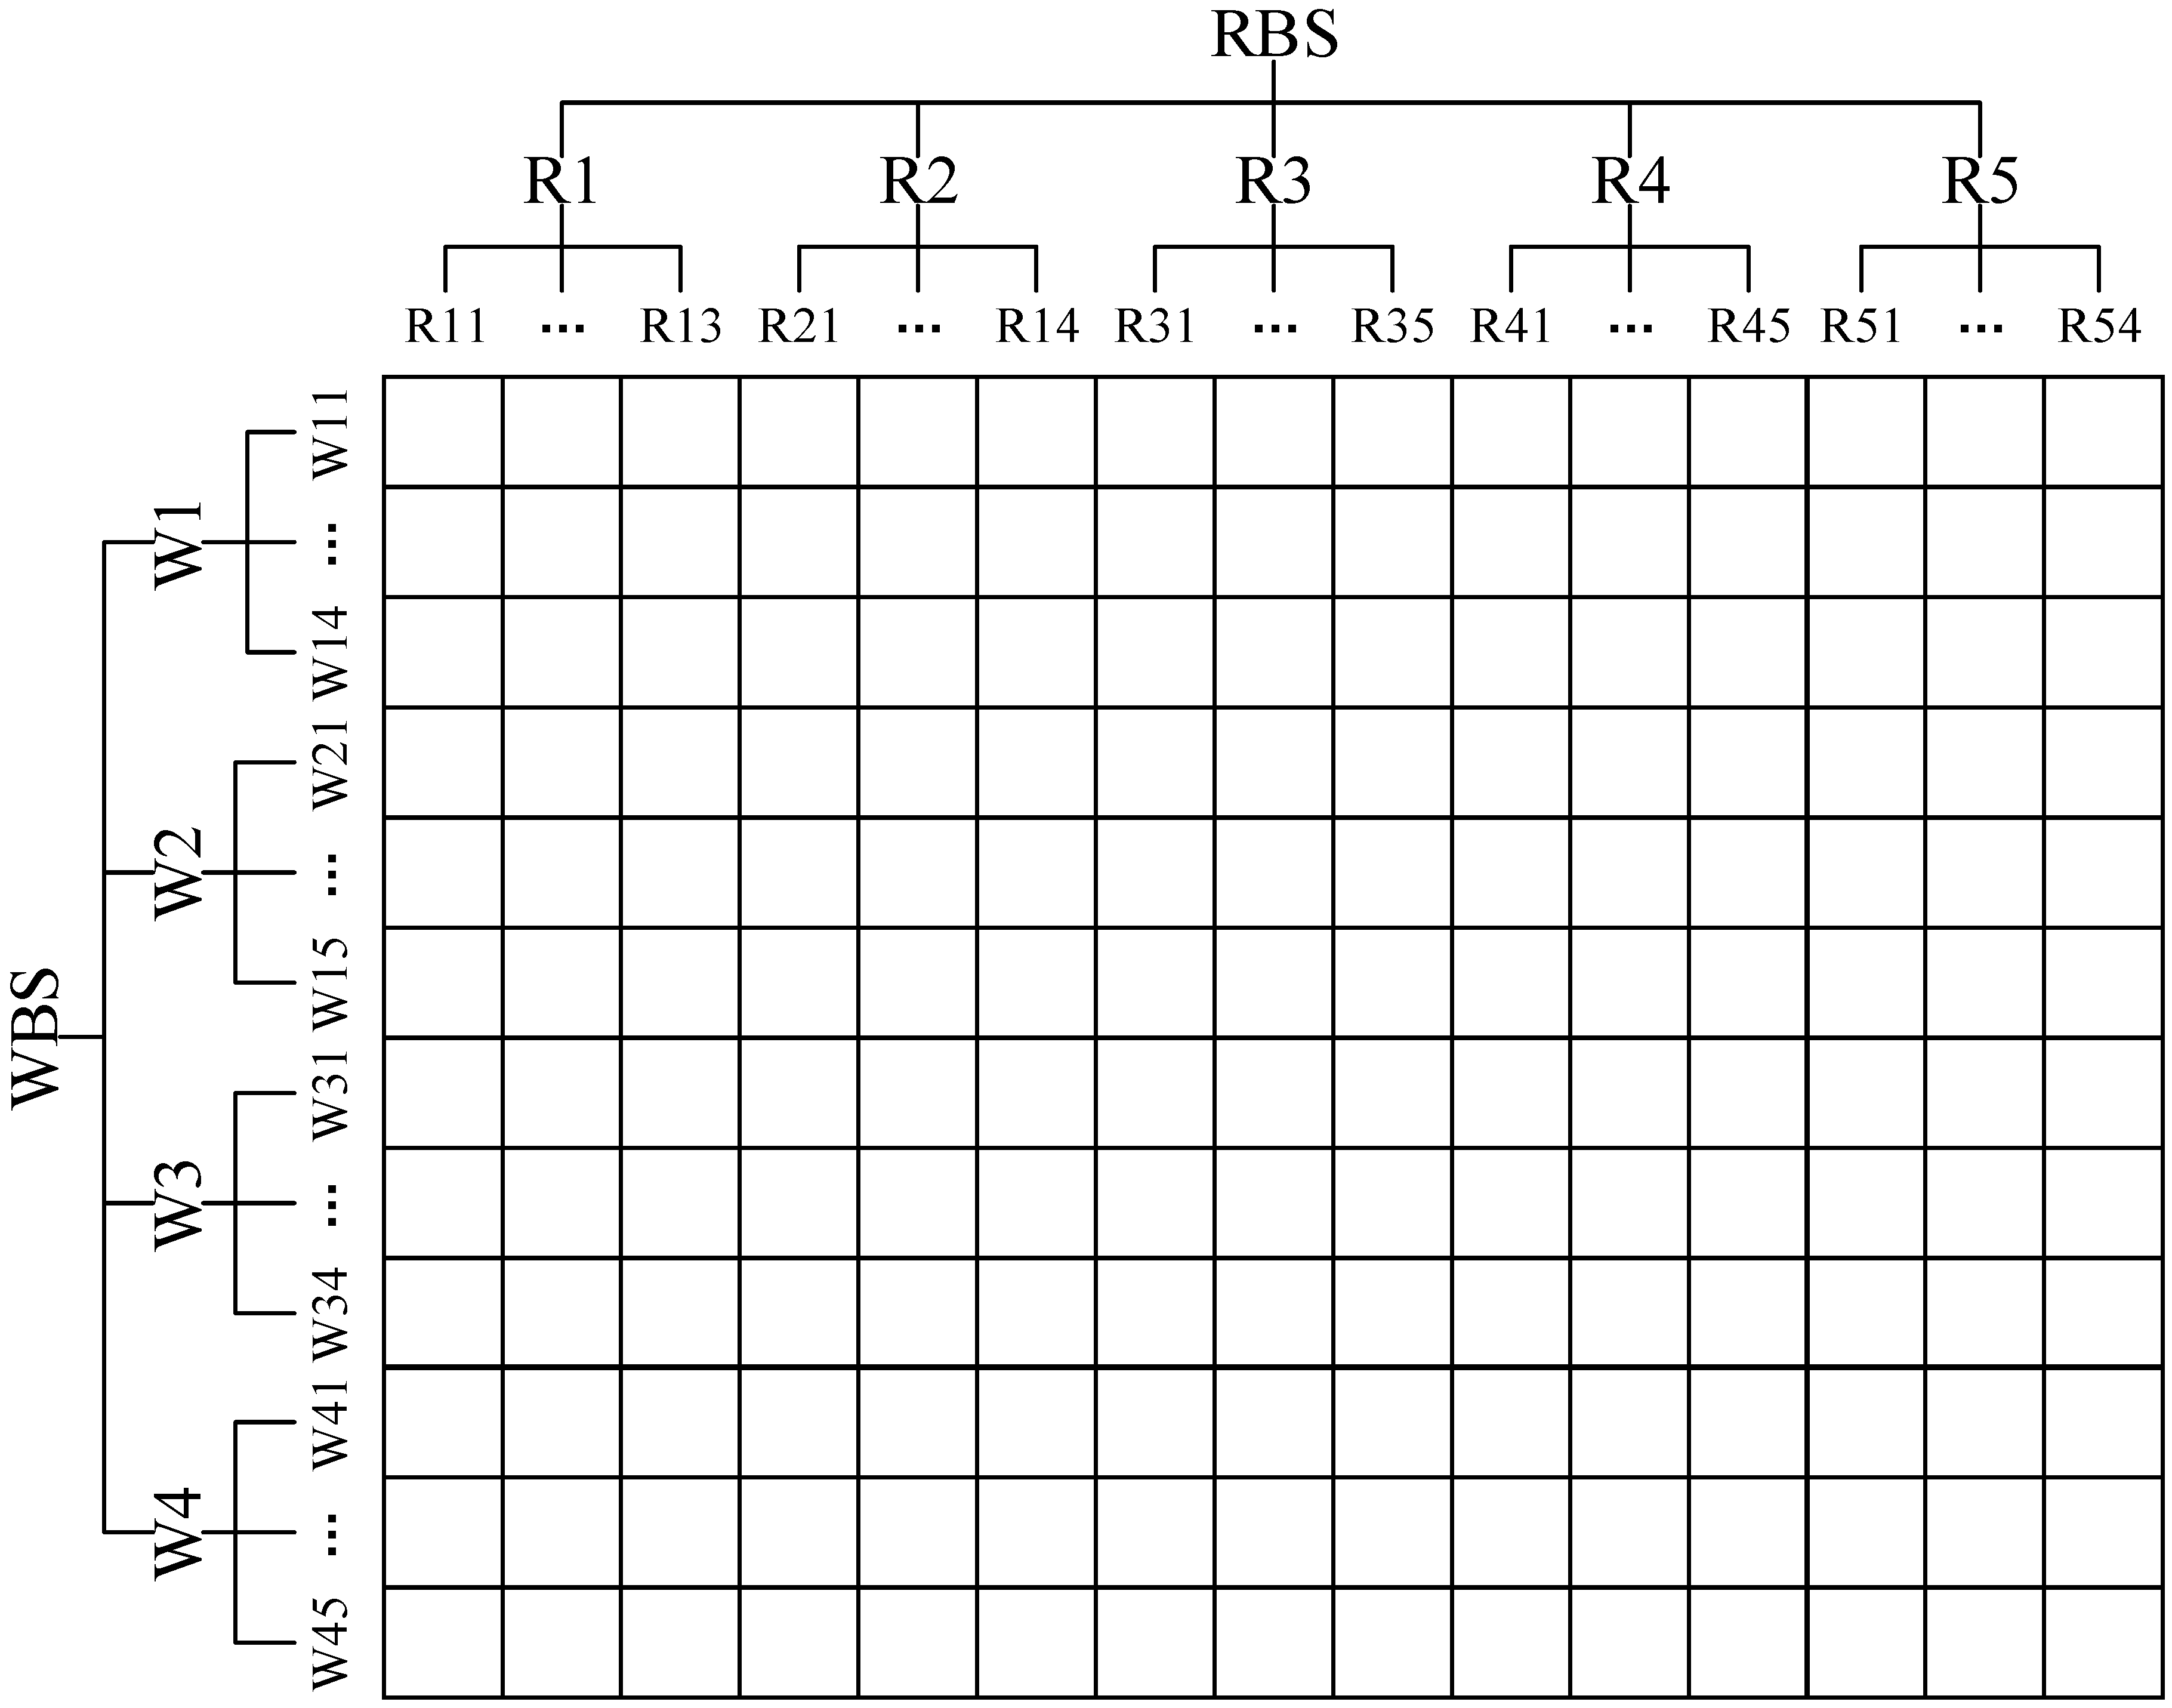
2.1.3. WBS-RBS Matrix for Construction Safety Risks of Urban Elevated Bridge Projects
The WBS-RBS matrix can be created by coupling the WBS as columns and the RBS as rows, as is displayed in Figure 2.
The WBS-RBS matrix serves as a framework for identifying construction safety risks in urban overpass bridge projects. The WBS or RBS can act as primary indicators, while specific secondary indicators need to be determined using methods such as the literature research.
2.2. Evaluation Indicator System Proposed in this Study
The initial indicator checklist constructed based on the WBS-RBS matrix offers the advantages of comprehensive indicator identification. However, it also suffers from the drawback of having an excessively large indicator system, often including numerous irrelevant indicators in the initial checklist [15]. Currently, the commonly used method for selecting risk indicators in the WBS-RBS matrix is based on questionnaire surveys [16]. In this study, 30 experts in relevant fields with extensive engineering experience were invited to assess the presence of each secondary indicator using the binary scoring method, where “0” indicates that the risk does not exist, and “1” showcases that the risk exists.
In this paper, the detailed procedures of the questionnaire survey are as follows. It should be emphasized that this is a general procedure:
- (1)
- Determine the goals and objectives of the questionnaire survey. It is to obtain experts’ judgment on the importance of safety risk factors in urban viaduct construction using the questionnaire survey of many experts;
- (2)
- Select experts. According to the research needs, select experts with relevant knowledge and rich experience, including engineers, architects, construction managers, safety consultants, etc.;
- (3)
- Design a questionnaire. Design a questionnaire according to the research objectives to ensure that the questions cover all research topics. When formulating questions, we should not only cover closed questions (such as multiple-choice questions and true–false questions) for quantitative analysis but also include open questions to collect in-depth responses. Design concise and clear instructions and questions to prevent misunderstanding. A pretest was conducted before the official release to test the understandability and effectiveness of the questionnaire;
- (4)
- Determine the sample. According to the purpose and needs of this study, the survey object is determined by random sampling, stratified sampling, or convenient sampling. Set the sample size, considering the reliability and statistical power of the data;
- (5)
- Collect data. Determine the distribution method of the questionnaire, which can be online (e.g., via e-mail or online survey platform) or offline (paper questionnaire);
- (6)
- Data processing and analysis. After collection, data entry and cleaning are carried out, including eliminating invalid questionnaires and dealing with missing data. Descriptive statistical analysis (such as mean and standard deviation) and inferential analysis (such as correlation analysis and regression analysis) are carried out to answer the research questions.
Based on reliability and validity tests, this study retains the secondary indicators with an average score greater than 0.8 [15,16]. This study organizes the construction risk sources as primary indicators and integrates similar or related indicators to establish a construction safety risk indicator system for urban elevated bridge projects, as illustrated in Table 1. Moreover, the third column in Table 1 represents the rows and columns of the secondary indicators in the WBS-RBS matrix proposed in this study. For instance, the position of the secondary indicator in the matrix is shows that this risk factor is located in all positions of the row. Furthermore, the position of the secondary indicator in the matrix is and highlight that this risk factor is located in the column of the row and the column of the row.
It is important to highlight that when construction content is used as the primary indicator to classify the risk list, there is often a duplication of risk factors [7]. As shown in Table 1, both and represent common safety risks across the four key construction processes, whereas notable disparities exist for , , and . Compared to traditional single-dimensional safety risk identification, the risk identification results derived from WBS-RBS unveil the construction safety risk list in a more systematic and detailed manner.
In Table 1, , , , , , , , , , , , , , , and serve as performance indicators, where higher scores indicate higher construction safety risk levels for urban elevated bridge projects. All other indicators are cost-type indicators, where lower scores yield higher construction safety risk levels. Moreover, , , , , , , , , , , , , , , and are quantitative indicators obtained using on-site statistical methods. The remaining ten indicators are qualitative indicators acquired using the questionnaire surveys or expert interviews.
To mitigate the influence of the indicators’ dimension and magnitude on subsequent calculation results, this study applied the linear normalization method to handle the scores of each indicator. Therefore, one can write the following:
2.3. Proposed Method for Dynamic Weight Calculation in This Article
According to the research findings in Section 2.2, there are several factors that influence the construction safety risks of urban elevated bridge projects. Moreover, due to the constant changes in personnel, materials, machinery, and engineering structures at the construction site, these factors also generate a significant dynamic impact on the assessment of construction safety risks [19]. For example, when considering heights, excessively high wind speeds can easily lead to construction safety, but in the deep foundation pit construction of elevated bridges, excessively high wind speeds are unlikely to cause construction safety accidents.
To better describe the influence of the different safety risk indicators on the construction safety of a viaduct project across various construction stages, this paper divides the non-normalized weight () of the i-th indicator into two parts as follows:
where . is the static weight, indicating the fixed impact of the i-th indicator on the construction safety risk of the viaduct project, whereas is the dynamic weight, denoting the dynamic impact of the i-th indicator on the construction safety risk of the viaduct project.
In this study, the static weight is determined using the AHP before the construction of the viaduct project and remains unchanged during the risk assessment. AHP represents a classic method for calculating weights [20]; yet, its computation principles and processes are not elaborated in this paper. The scoring standard of AHP is 1–5. On the other hand, the dynamic weight is determined based on the indicator scores. When these scores are within the safety risk levels I, II, and III, the dynamic weight is relatively small, with the static weight parameter playing a major role. However, as the indicator scores increase and approach the dangerous range (IV and V), the dynamic weight becomes larger.
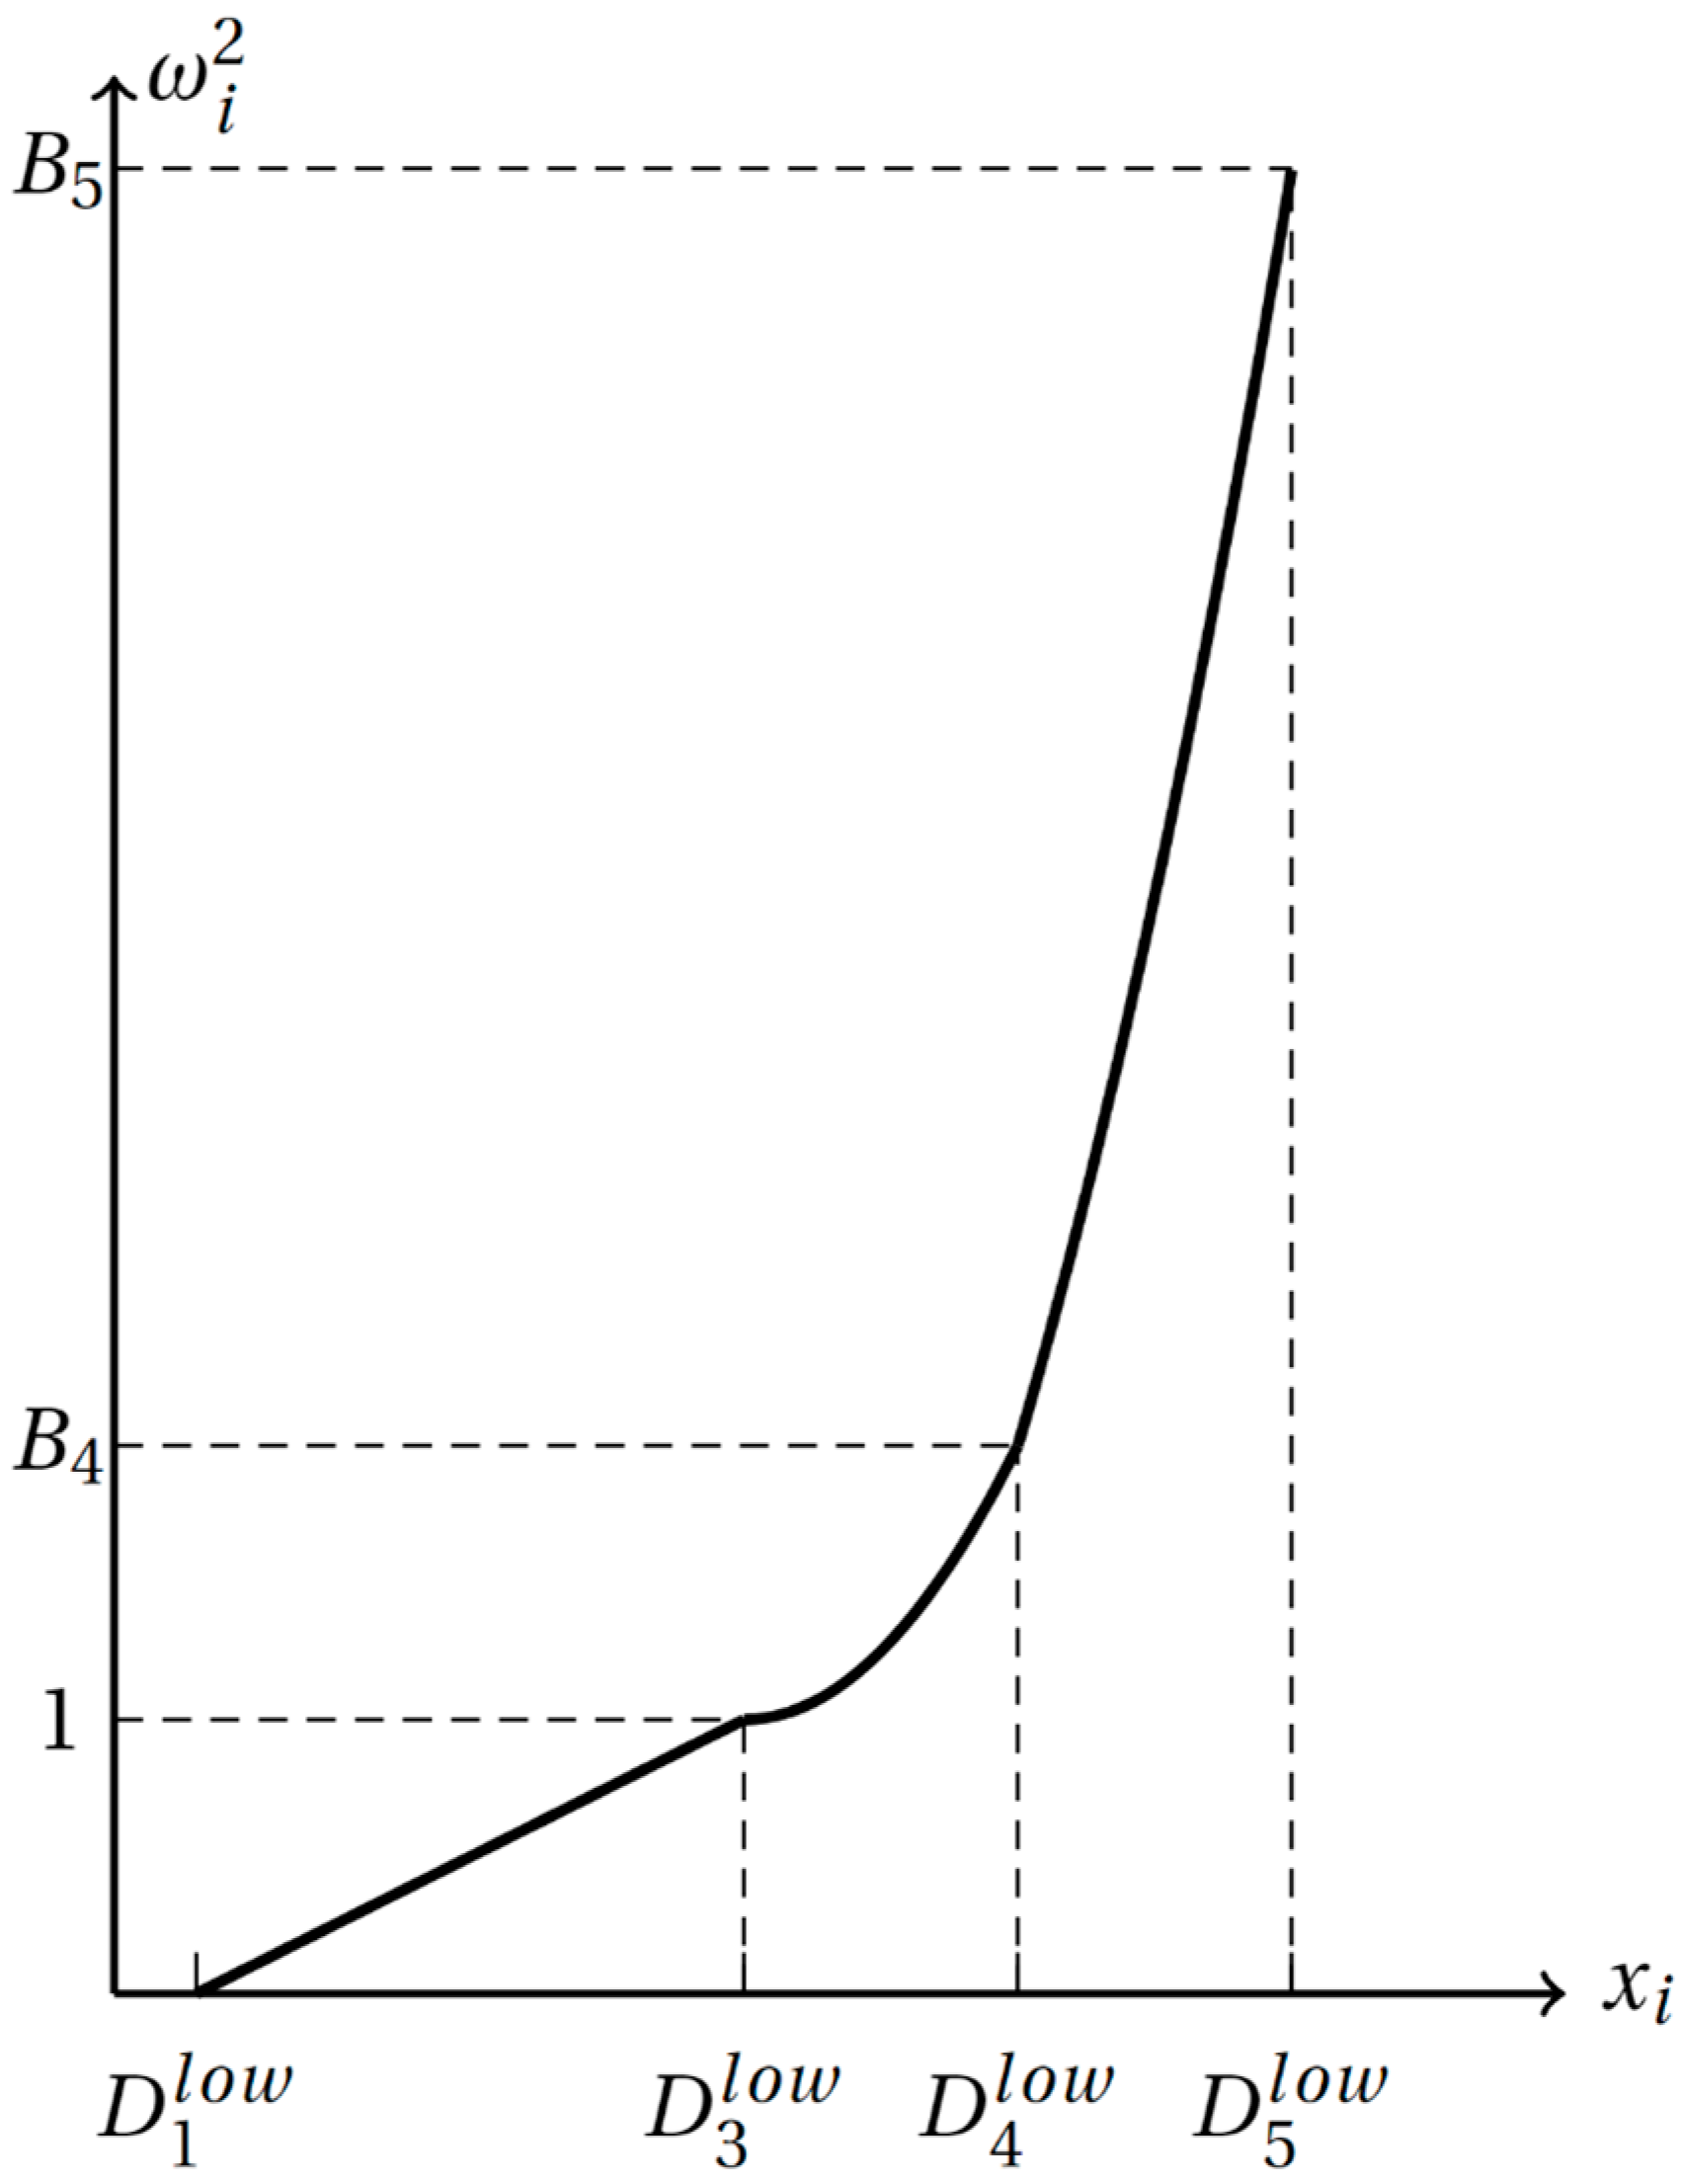
How to establish the mapping relationship between the dynamic scores of indicators and the dynamic weights is crucial to solving the dynamic weights. Therefore, this paper suggests applying the following method to establish the mapping relationship:
where is the score of the i-th indicator, and denotes the lower limit of risk level .
Moreover, Equation (4) proposed has significant engineering value. The interpretation of its engineering value is as follows:
- (1)
- When the indicator score is within the safe risk levels I, II, and III, project managers have a relatively optimistic attitude toward risk. Therefore, the dynamic weight is small and shows a linear and slow growth trend. At this point, the indicator weight mainly relies on static weights;
- (2)
- When the indicator score is within the safe risk level IV, it shows that the indicator is within a more dangerous score range, leading project managers to adopt a relatively pessimistic attitude toward the risk. Therefore, the dynamic weight of the indicator should not be ignored, and it increases rapidly in a quadratic function form;
- (3)
- When the indicator score is within the safe risk level V, it indicates that the indicator is within a highly dangerous score range, prompting project managers to adopt an extremely pessimistic attitude toward risk. At this juncture, the dynamic weight of the indicator significantly impacts the risk evaluation results, leading to a rapid increase in an exponential function form. The mapping relationship between the dynamic score of the indicator and the dynamic weight is depicted in Figure 3. It is important to note that the reference to Figure 3 is based on the context provided by the user. The precise content and description of this figure may vary and should be provided by the user for accurate translation.
The weights of indicators obtained using the computation of Equation (3) cannot be directly applied to practical calculations. In this study, Equation (5) is applied to normalize the weights [21]. It is expressed as follows:
where represents the normalized weights of the indicators.
It is worth mentioning that Section 4.2 of this paper discusses in detail the influence of various dynamic weight mapping relationships on the evaluation results.
2.4. Implementation Method of the Proposed Model
The specific steps of the proposed model for the risk assessment of construction safety in urban elevated bridge projects are as follows:
- Step 1.
- Divide the evaluation levels of each secondary indicator according to project management needs. For quantitative indicators, divide them based on practical requirements and regulatory standards. The evaluation levels of qualitative indicators are more complex, including quantitative evaluation ranges and corresponding qualitative language descriptors. Different qualitative indicators correspond to the same quantitative range but have completely different qualitative language descriptors;
- Step 2.
- Data Collection and Preprocessing. Qualitative indicators are gathered using questionnaire surveys or expert interviews and then converted into quantitative data. Moreover, quantitative indicators are collected and calculated using on-site statistical methods. Depending on the type of indicator, data from different time points are normalized using Equations (1) or (2);
- Step 3.
- Calculate the static weights for all indicators. Before the implementation of the project, expert judgments on the relative importance of different indicators are collected using a questionnaire survey. This paper suggests the use of a scoring rule of 1–5 or 1–9 [11] to collect these static weights. The classic AHP is then employed to compute the static weights for all indicators;
- Step 4.
- Calculate the dynamic weights for all the indicators. In this step, Equation (4) is used to calculate the dynamic weights , using the scores of the secondary indicators collected in Step 2;
- Step 5.
- Calculate the combined weights of the indicators for subsequent analysis. By applying the static and dynamic weights to Equation (5), the final weights for each indicator can be generated.
3. Case Study
3.1. Engineering Background and Data Acquisition
The Longlingshan Elevated Bridge project is situated in Wuhan City, China. The main bridge of the project spans a total length of 1.865 km, with an estimated total investment of approximately 400 million RMB. This project comprises 312 pile foundations, 112 tall piers, and 26 concrete box girders. The bridge deck width measures 18.5 m, with a height of 2.2 m. China Communications Second Navigation Engineering Bureau Co., Ltd. (Wuhan, China), a company with extensive experience in bridge construction, was responsible for undertaking the construction of this project. The contract duration of the project spans from 15 August 2020 to 31 December 2021. The safety risk management objective of the project consisted of ensuring that no fatalities or safety accidents involved three or more serious injuries.
The construction of all pile foundations for this project is concluded on dry land, with rotary drilling rigs serving as the main equipment. During the construction of piers, cranes are employed as vertical transport tools, and scaffolding is erected as the operating platform. Commercial concrete is utilized for the construction, with piers below 11 m in height poured in one go using a tower pump, while piers higher than 11 m are poured in two stages. Components on the construction site are lifted using mobile cranes. The construction technique for the bridge deck panels involves casting in situ using a form traveler support system. The corporate governance ability has an obvious influence on the management objectives, such as the safety performance of the project [22], and the construction unit of the project has good corporate governance ability.
In Wuhan city, the average temperature during the summer is 30 °C, while in winter, it drops to around 3 °C. The construction environment in summer is extremely harsh, whereas during winter, conditions are generally acceptable. Wuhan city experiences an annual average precipitation of 1300 mm. During summer, heavy rainfall and flooding disasters are common occurrences, along with drought disasters, posing significant challenges to the safety management of deep foundation pit construction projects.
Case studies involve two main types of data: weight calculation data; and indicator score data. Moreover, quantitative indicator data are collected via field surveys or by referencing project management materials. In this study, four field surveys were conducted at different time frames: October 2020; December 2020; May 2021; and August 2021. The first survey in October 2020 coincided with the initiation of the project, focusing on the prefabrication of bridge panels and foundation construction. As for the surveys for December 2020, May 2021, and August 2021, they were conducted during the comprehensive construction phase of the project. Therefore, the quantitative indicator data are shown in Table 2.
Referring to Table 2, investigates extreme high-temperature weather within one week. All quantitative indicators are cost-based, signifying that the smaller the indicator score, the lower the safety risk. Moreover, indicates the incorrect installation of rotary drilling machinery. In May 2021 and August 2021, no rotary drilling was employed at the construction site, resulting in a score of 0 for this indicator in both periods.
The expert opinions and scores regarding qualitative indicators required for static weight calculations were generated using a questionnaire survey. The personal information of the 30 experts who participated in this survey is displayed in Table 3.
Referring to Table 3, it can be seen that all the experts in this survey are from the field of urban elevated bridge engineering management; moreover, they hold intermediate and higher professional titles; 46.7% of the experts have a master’s degree or higher, and over 70% of them have more than 20 years of work experience. These statistical findings indicate that the 30 experts participating in the questionnaire have extensive engineering knowledge and work experience. In addition, the results of this questionnaire survey have been successfully tested for reliability and validity. Therefore, the results of this questionnaire survey are considered reliable [23,24]. Furthermore, the scores for all qualitative indicators are obtained by calculating the average of the scores given by experts, as depicted in Table 4.
All qualitative indicators in Table 4 are benefit-based indicators. According to the type of indicator, Equations (1) or (2) are used to normalize the data of the same indicator at different time points.
3.2. Calculation of Indicator Weights
The weight calculation in this section consists of three phases: static weight calculation ; dynamic weight calculation ; and weight combination calculation . Moreover, the AHP is used to handle expert importance judgments collected from questionnaire surveys to obtain static weights. The scoring rule for expert importance ranges from 1 to 9 [20]. In this study, the Super-Decision software 3.2 [25,26], a classic AHP calculation software, was used to calculate the static weights. The calculated weight results are depicted in the second column of Table 5. Additionally, this phase passed the consistency test of expert opinions in AHP for the first time.
According to Equation (4), before applying the proposed dynamic weight calculation method in this paper, it is necessary to define the rating criteria for each secondary indicator. To do so, this paper refers to the Safety Technical Specification for Bridge Construction (DB11/T 1885-2021), the Technical Specification for Construction of Highway Traffic Safety Facilities (JTG/T 3671—2021), the Technical Specification for Construction of Prefabricated Concrete Bridges on Highways (JTG/T 3654—2022), and the Code for Design of Municipal Bridges CJJ 11-2011 (2019 edition) to identify the rating criteria for most of the secondary indicators. It should be highlighted that for indicators not covered by these specifications, the rating criteria are determined based on the construction safety risk management objectives and engineering practices within the project. The final rating criteria are displayed in Table 6.
By incorporating the dynamic scores of each indicator in Table 2 and Table 4, as well as the evaluation criteria in Table 6 into Equation (4), the dynamic weights of the second-level indicators are computed and displayed in columns 3–6 of Table 5.
By substituting the static and dynamic weights into Equation (5), we can obtain the combined weights as presented in Table 7.
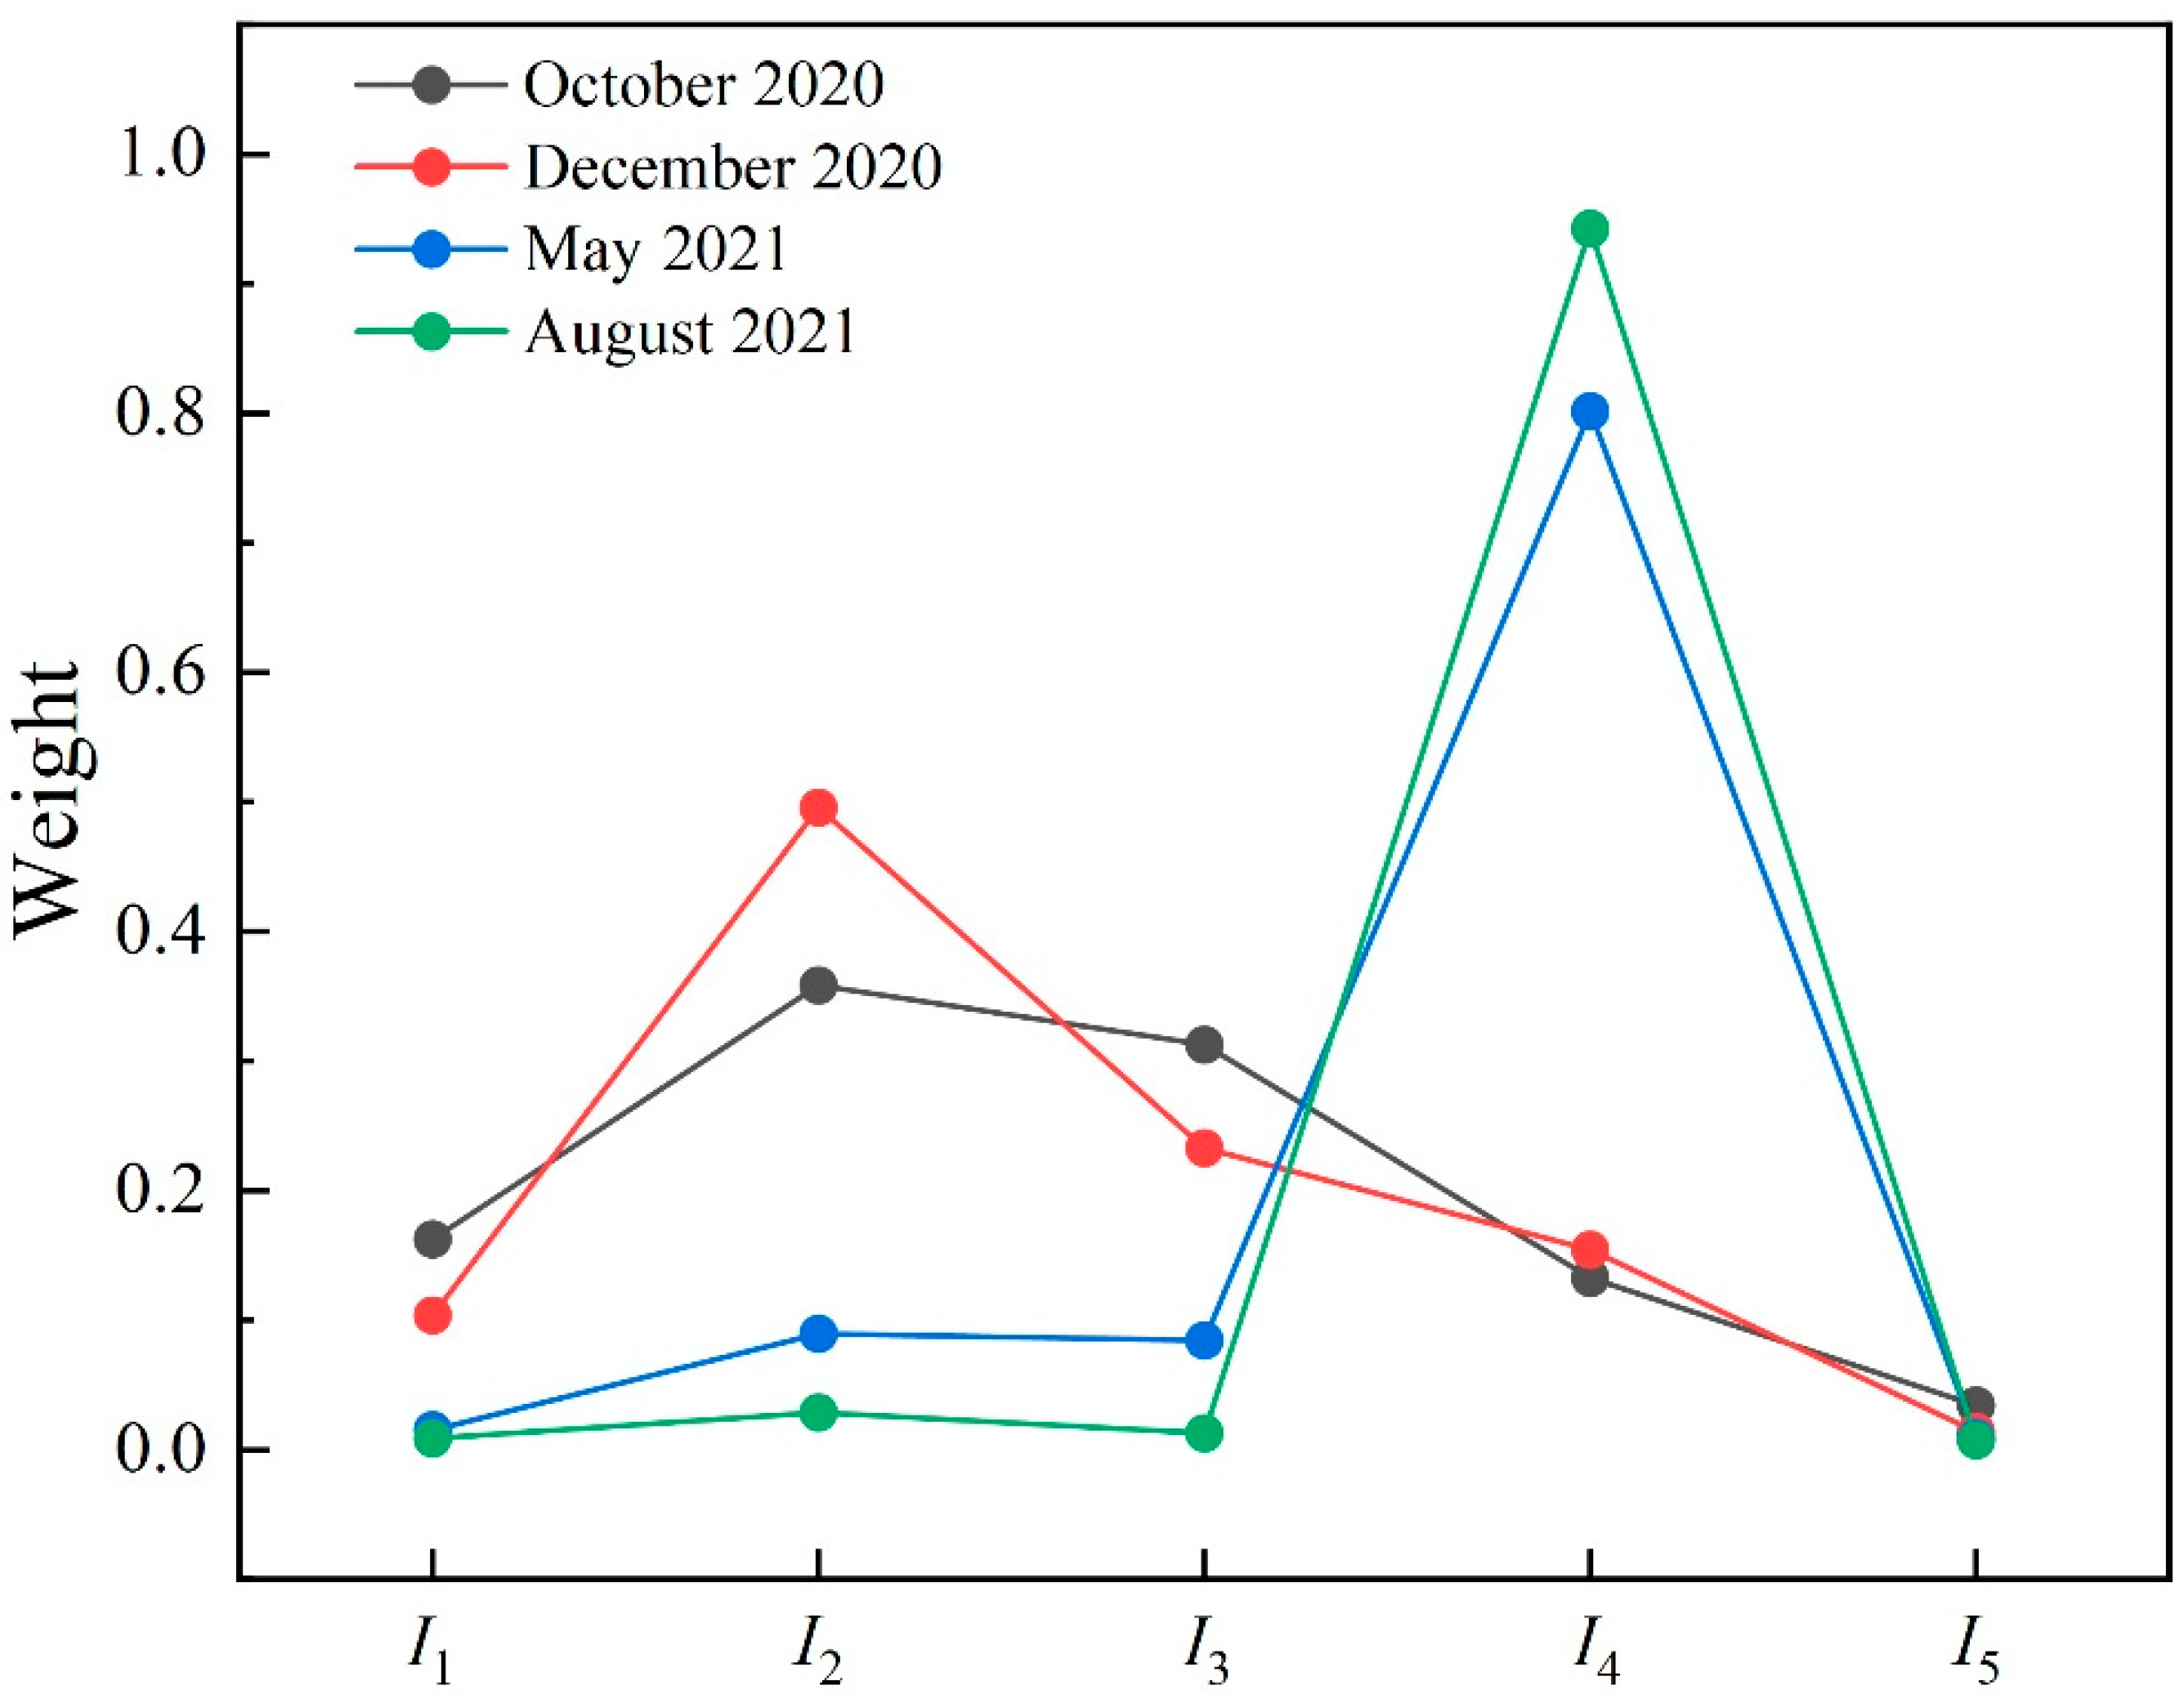
Referring to Figure 4, the 20 secondary indicators have significantly different impacts on construction safety risks at several construction stages. Among them, the weight change in the extreme high temperature weather () is the most pronounced. This weight variation is caused by the different seasons throughout the four construction stages. In October and December 2020, Wuhan had almost no extremely high-temperature weather, resulting in a small weight for this indicator in these two construction stages. However, in August 2021, Wuhan was in the summer season, and construction sites often experienced temporary work stoppages due to high temperatures. Furthermore, high-temperature weather seriously affected the condition of construction personnel, machinery, and materials. Therefore, in August 2021, became almost the most important secondary indicator. This condition is consistent with the actual situation of the project and is a phenomenon that has not been revealed by most current research studies. Therefore, the weights of the five primary indicators can be obtained by summing up the weights of their corresponding secondary indicators, as depicted in Figure 4.
Referring to Figure 4, it can be observed that in October 2020 and December 2020, had the highest weight, whereas in May 2021 and August 2021, had the highest weight. The weights of the five primary indicators also varied significantly during the construction stages. The weight of showed the greatest variation, potentially due to the most noticeable changes in extreme high-temperature weather (). However, the weight of remained almost unchanged, while the other three primary indicators exhibited some small changes. It is worth mentioning that the weight calculation results of this study differ significantly from previous research on construction safety:
- (1)
- The prevailing research suggests that man () or management () represent the most important primary indicators affecting construction safety. However, this study analyzed the weight variations in indicators during the construction stages and found that the most important primary indicators varied across different stages. Unlike typical construction projects, this case study involves an urban elevated bridge project that extensively applies construction machinery instead of relying heavily on construction workers. Therefore, it is reasonable to assign higher weights to machinery-related indicators;
- (2)
- Current research suggests that the uncertainty of construction risks appears to be evenly distributed among the five risk dimensions (e.g., man, machine, material, methods, and environment). However, the empirical results of this study highlight that the uncertainty of construction risks primarily stems from the construction environment (). This finding is attributed to the dynamic evaluation of this project. Wuhan is one of the hottest cities in China during the summer, and construction projects often experience work stoppages during high temperatures, while other factors are less likely to cause such disruptions. Hence, this unique condition in the present study is explainable.
To further investigate the attributes of combined weights, this study calculates the proportions of static weights in the combined weights, as presented in Table 8.
The expression for calculating the rate of change of the i-th indicator in Table 8 is expressed as follows:
where denotes the static weight proportion of the -th indicator in October 2020, while represents the static weight proportion of the i-th indicator in August 2021.
Referring to Table 8, it can be further determined that, as the construction progresses, the static weight proportions of various secondary indicators continuously change. The indicators , , and experience the highest changing rates.
With the help of ABC management method, which is the most commonly used in the field of management, this paper divides 20 secondary indicators into three categories: A; B; and C [27,28]. A-class indicators are the top 10% of the rankings, that is, and , and managers should focus on these two A-class indicators. As for class B indicators, they represent the top 10% to 30% indicators in the ranking, that is, , , , and . Managers should focus on monitoring this indicator. Finally, class C indicators are the remaining 70% of the secondary indicators, and managers can strictly implement safety supervision measures without taking additional management measures.
Combined with the WBS-RBS matrix and risk analysis results, this paper put forward the following risk mitigation strategies for environmental risks, which was the most serious indicator:
- (1)
- Adjust the construction plan according to the climate forecast to avoid construction under extreme weather conditions. Use construction materials and technologies suitable for various weather conditions. Conduct a detailed geological survey before construction and take measures to reinforce or change the construction scheme if the risk of landslide or debris flow is found. Monitor the change in water level in real time, set up flood control measures, and reserve sufficient drainage facilities. Adopt environmental protection construction methods, such as using construction equipment with low vibration and noise and reasonably arranging construction time;
- (2)
- Conduct emergency drills to ensure that all personnel are familiar with the emergency plan and improve the ability to respond rapidly. Prepare emergency materials, such as flood control sandbags, emergency lighting, first aid kits, and emergency evacuation facilities. Establish a rapid response mechanism, including the establishment of effective communication channels, so as to respond quickly when sudden environmental incidents occur;
- (3)
- Implement continuous environmental monitoring, including weather monitoring, geological stability monitoring, and hydrological condition monitoring, to ensure that key environmental information can be obtained in time. Regularly review and update the environmental risk management plan and adjust the management measures according to the project progress and emerging risk information. Train all construction personnel in environmental risk management and emergency response to improve their awareness of environmental changes and their ability to deal with emergencies. Emphasize safety culture and encourage employees to report potential environmental risks and put forward suggestions for improvement.
4. Discussion
4.1. Discussion on Different Risk Identification Methods
Risk identification is a key link in project management, which helps the team to prevent and deal with uncertain factors that may threaten the success of the project. At present, the 4M1E model is the mainstream method for constructing the construction safety risk evaluation index system [29]. The WBS-RBS model selected in this paper is a joint-use method, in which RBS includes the 4M1E model.
WBS decomposes Urban Viaduct Construction into smaller and more manageable parts, and each part has clear outputs and responsibilities. Then, RBS helps managers identify the risk categories that each part may encounter, thus achieving a comprehensive risk assessment. However, 4M1E can only distinguish the risk factors from the source of risk and cannot find the location where the risk factors occur [29].
Urban Viaduct Construction includes many construction contents, and the risk sources of different construction contents are significantly different. The WBS-RBS model provides a more structured risk identification framework. By refining project activities and directly associating them with potential risk sources, it can help the team identify more specific risk points. In Table 1, although many risk factors have the same name, they occur in different parts or stages of Urban Viaduct Construction. This is what 4M1E cannot do. For example, unacceptable topography and geomorphological conditions () may appear in , , and at the same time. The WBS-RBS model can describe this characteristic completely, but the 4M1E model can identify the risk factor but cannot judge where or at what stage the risk appears [30].
In addition, the WBS-RBS model promotes the deep identification and understanding of risks via the detailed decomposition of project activities [16]. This not only helps to identify the existing risks but also helps to foresee the possible risks in the future. The 4M1E model emphasizes the consideration of five aspects of the project. Although it can identify the risks in their respective fields, it may not be as deep as the WBS-RBS method.
4.2. Generalization of the Proposed Strategy in the Field of Weight Calculation
Equation (3) in Section 2.3 of this paper combines the dynamic weight in Equation (4) with the weight of AHP. In fact, there are many index weight calculation methods, such as the Entropy Weight Method (EWM) [37], Combination Ordered Weighted Averaging (C-OWA) [38], and Interval Intuitionistic Fuzzy Sets (IIFS) [39]. EWM is a classical weight algorithm, and C-OWA and IIFS are novel algorithms proposed in recent years. Combining EWM, C-OWA, and IIFS with the dynamic weight calculation method proposed in this paper can verify the generalization of the model proposed in this paper in the field of weight calculation. The calculation results are shown in Table 9 below.
According to Table 9, the dynamic weight calculation method and different weight models proposed in this paper have good adaptability. They can clearly reveal the dynamic change law of weight. The applicability and universality of AHP, EWM, C-OWA, and IIFS in the study of multi-attribute weights have been widely demonstrated [40,41]. According to the calculation results in Table 9, all the combined weight models can calculate multi-attribute weights quickly and can efficiently handle large-scale data sets. In addition, the strategy proposed in this paper hardly involves parameters, such as optimization, which further improves the generalization of this strategy.
It is worth mentioning that the generalization of the strategy proposed in this paper in the field of weight calculation needs more examples in the future.
In addition, this section directly compared the method proposed in this paper with the classical risk analysis method. There are some shortcomings in the single empowerment methods such as AHP, EWM, C-OWA, and IIFS. For example, AHP needs many questionnaires to ensure that it can pass the consistency test [20], and the calculation results of EWM are not interpretable [37]. Although C-OWA and IIFS are novel analysis methods, they are easily influenced by experts’ extreme opinions [38]. Therefore, this section mainly compares other combinatorial weighting methods, such as linear addition, multiplicative addition, and game theory. Obviously, these kinds of combination weighting methods are static analysis methods, which make it difficult to effectively describe the dynamic characteristics of construction safety risks. The new strategy proposed in this paper could update the risk analysis results in real time according to the change in the construction safety risk index score. However, the new strategy proposed in this paper needs to set multiple calculation parameters according to the characteristics of the research object. Compared with the classical method, more workload may restrict the popularization and use of this strategy.
5. Conclusions
In this study, the WBS-RBS method is used to identify the potential safety risks during the construction of urban viaducts, and a new dynamic weight strategy risk analysis method is proposed. Using the case analysis of the Longlingshan Elevated Bridge Project in Wuhan, we deeply explored the application effect of this method in practical engineering projects and verified its effectiveness and practicability. In this paper, the WBS-RBS method can systematically and comprehensively identify all potential risks in the construction of viaduct buildings and ensure the integrity of risk management. By introducing the dynamic weight strategy, this study can adjust the weight of risk factors according to different engineering stages and specific conditions, thus more accurately reflecting the actual importance of risks, which have been fully verified in the case analysis of the Longlingshan Elevated Bridge Project in Wuhan. The safety risk analysis method of urban viaduct construction based on dynamic weight proposed in this study shows great potential and value in theory and practice.
The main limitations of this paper are as follows: (1) It could expand the views and contributions of different stakeholders (such as construction workers, project managers, and local communities) to the risk assessment of urban viaduct projects; (2) Emerging technologies such as artificial intelligence, Internet of Things, and unmanned aerial vehicles could be integrated into the dynamic weighing system to enhance the real-time risk monitoring and management in the construction of urban elevated bridges; (3) More engineering examples will be selected for analysis in the future; (4) In this paper, only 30 experts were selected to conduct a questionnaire survey, and a larger sample of questionnaires can be conducted in the future.
Author Contributions
Conceptualization, R.R. and J.F.; methodology, R.R. and J.F.; software, S.W.; validation, R.R., S.W., J.F. and Y.W.; formal analysis, R.R.; investigation, S.W.; resources, Y.W.; data curation, R.R.; writing—original draft preparation, R.R., S.W., J.F. and Y.W.; writing—review and editing, R.R., S.W., J.F. and Y.W.; supervision, J.F.; project administration, R.R. and J.F.; funding acquisition, R.R. All authors have read and agreed to the published version of the manuscript.
Funding
This research was personally funded by Ruijiang Ran.
Data Availability Statement
The data needed for this case study can be obtained from the correspondent for scientific research.
Conflicts of Interest
Jun Fang was employed by the Wuhan University of Technology. The remaining authors declare that the research was conducted in the absence of any commercial or financial relationships that could be construed as a potential conflict of interest.
References
- Buyukozkan, G.; Feyzioglu, O.; Gocer, F. Selection of sustainable urban transportation alternatives using an integrated intuitionistic fuzzy Choquet integral approach. Transp. Res. Part D Transp. Environ. 2018, 58, 186–207. [Google Scholar] [CrossRef]
- Chen, F.Y.; Ji, H.C.; Wei, Y.C. Using Network Theory to Explore the Risk Characteristics of Bridge-Tunnel Hybrid Construction. IEEE Access 2019, 7, 116038–116046. [Google Scholar] [CrossRef]
- Okpala, I.; Nnaji, C.; Karakhan, A.A. Utilizing Emerging Technologies for Construction Safety Risk Mitigation. Pract. Period. Struct. Des. Constr. 2020, 25, 04020002. [Google Scholar] [CrossRef]
- Li, Q.F.; Zhou, J.P.; Feng, J.H. Safety Risk Assessment of Highway Bridge Construction Based on Cloud Entropy Power Method. Appl. Sci. 2022, 12, 8692. [Google Scholar] [CrossRef]
- Naderpour, H.; Kheyroddin, A.; Mortazavi, S. Risk Assessment in Bridge Construction Projects in Iran Using Monte Carlo Simulation Technique. Pract. Period. Struct. Des. Constr. 2019, 24, 04019026. [Google Scholar] [CrossRef]
- Lin, J.R.; Zhang, J.P.; Zhang, X.Y.; Hu, Z.Z. Automating closed-loop structural safety management for bridge construction through multisource data integration. Adv. Eng. Softw. 2019, 128, 152–168. [Google Scholar] [CrossRef]
- Wu, Y.; Lu, P.Z. Comparative Analysis and Evaluation of Bridge Construction Risk with Multiple Intelligent Algorithms. Math. Probl. Eng. 2022, 2022, 2638273. [Google Scholar] [CrossRef]
- Wu, H.; Liu, S.; Wang, J.W.; Yang, T.Y. Construction Safety Risk Assessment of Bridges in the Marine Environment Based on CRITIC and TOPSIS Models. J. Coast. Res. 2020, 108, 206–210. [Google Scholar] [CrossRef]
- Ji, T.; Liu, J.W.; Li, Q.F. Safety Risk Evaluation of Large and Complex Bridges during Construction Based on the Delphi-Improved FAHP-Factor Analysis Method. Adv. Civ. Eng. 2022, 2022, 5397032. [Google Scholar] [CrossRef]
- Khan, M.A.; Khan, A.A.; Anwar, G.A.; Usmani, A. Framework for fire risk assessment of bridges. Structures 2021, 33, 523–532. [Google Scholar] [CrossRef]
- Peng, K.K. Risk Evaluation for Bridge Engineering Based on Cloud-Clustering Group Decision Method. J. Perform. Constr. Facil. 2019, 33, 04018105. [Google Scholar] [CrossRef]
- Ju, W.Y.; Wu, J.; Kang, Q.C.; Jiang, J.C.; Xing, Z.X. A method based on the theories of game and extension cloud for risk assessment of construction safety: A case study considering disaster-inducing factors in the construction process. J. Build. Eng. 2022, 62, 105317. [Google Scholar] [CrossRef]
- Elmarzouky, M.; Hussainey, K.; Abdelfattah, T. The key audit matters and the audit cost: Does governance matter? Int. J. Account. Inf. Manag. 2023, 31, 195–217. [Google Scholar] [CrossRef]
- Ostenfeld, K.H.; Andersen, E.Y. Major bridge projects—A multi-disciplinary approach. Front. Struct. Civ. Eng. 2011, 5, 479–495. [Google Scholar] [CrossRef]
- Wang, J. Construction of Risk Evaluation Index System for Power Grid Engineering Cost by Applying WBS-RBS and Membership Degree Methods. Math. Probl. Eng. 2020, 2020, 6217872. [Google Scholar] [CrossRef]
- Chen, J.H.; Li, K.; Yang, S. Electric Vehicle Fire Risk Assessment Based on WBS-RBS and Fuzzy BN Coupling. Mathematics 2022, 10, 3799. [Google Scholar] [CrossRef]
- Bilal, M.; Ali, G.; Iqbal, M.W.; Anwar, M.; Malik, M.S.A.; Kadir, R.A. Auto-Prep: Efficient and Automated Data Preprocessing Pipeline. IEEE Access 2022, 10, 107764–107784. [Google Scholar] [CrossRef]
- Felix, E.A.; Lee, S.P. Systematic literature review of preprocessing techniques for imbalanced data. IET Softw. 2019, 13, 479–496. [Google Scholar] [CrossRef]
- Li, Y.K.; Hu, Y.; Xia, B.; Skitmore, M.; Li, H. Proactive behavior-based system for controlling safety risks in urban highway construction megaprojects. Autom. Constr. 2018, 95, 118–128. [Google Scholar] [CrossRef]
- Finan, J.S.; Hurley, W.J. Transitive calibration of the AHP verbal scale. Eur. J. Oper. Res. 1999, 112, 367–372. [Google Scholar] [CrossRef]
- Ji, B.; Ye, Y.; Xiao, Y. A Combination Weighting Algorithm Using Relative Entropy for Document Clustering. Int. J. Pattern Recognit. Artif. Intell. 2014, 28, 1453002. [Google Scholar] [CrossRef]
- Shohaieb, D.; Elmarzouky, M.; Albitar, K. Corporate governance and diversity management: Evidence from a disclosure perspective. Int. J. Account. Inf. Manag. 2022, 30, 502–525. [Google Scholar] [CrossRef]
- Cha, Y.J.; Lee, J.J.; Kim, D.H.; You, J.H. The validity and reliability of a dynamic neuromuscular stabilization-heel sliding test for core stability. Technol. Health Care 2017, 25, 981–988. [Google Scholar] [CrossRef] [PubMed]
- Dijksterhuis, M.G.K.; Jozwiak, I.; Braat, D.D.M.; Scheele, F. An exploratory study into the effect of time-restricted internet access on face-validity, construct validity and reliability of postgraduate knowledge progress testing. BMC Med. Educ. 2013, 13, 147. [Google Scholar] [CrossRef] [PubMed]
- Mu, E.; Pereyra-Rojas, M. Ratings Models Using Super Decisions v3. In Practical Decision Making Using Super Decisions V3: An Introduction to the Analytic Hierarchy Process; SpringerBriefs in Operations Research; Springer: Berlin/Heidelberg, Germany, 2018; pp. 61–70. [Google Scholar]
- Shirai, G.A.; Nematpour, L. Evaluation of resilience engineering using super decisions software. Health Promot. Perspect. 2019, 9, 191–197. [Google Scholar] [CrossRef] [PubMed]
- Jerie, S.; Shabani, T.; Mudyazhezha, O.C.; Shabani, T. A review towards developing a hierarchical model for sustainable hospital solid waste management in rural areas of Zimbabwe. Environ. Monit. Assess. 2024, 196, 308. [Google Scholar] [CrossRef] [PubMed]
- Lefort, A.; Bourdais, R.; Ansanay-Alex, G.; Guéguen, H. Hierarchical control method applied to energy management of a residential house. Energy Build. 2013, 64, 53–61. [Google Scholar] [CrossRef]
- Zhou, H.; Zhao, Y.H.; Shen, Q.; Yang, L.; Cai, H.B. Risk assessment and management via multi-source information fusion for undersea tunnel construction. Autom. Constr. 2020, 111, 103050. [Google Scholar] [CrossRef]
- You, Q.; Zhang, Z.W.; Wang, H.T.; Xu, M.Y. Risk identification of subway tunnel shield construction based on WBS-RBS method. Int. J. Crit. Infrastruct. 2023, 19, 261–273. [Google Scholar] [CrossRef]
- Chang, C.G.; Dai, B.B. Safety Risk Optimization of Prefabricated Building Construction based on Improved Bat Algorithm. In Proceedings of the 41st Chinese Control Conference (CCC), Hefei, China, 25–27 July 2022; pp. 2059–2064. [Google Scholar]
- Dong, S.H.; Li, S.Q.; Yu, F.; Wang, K. Risk Assessment of Immersed Tube Tunnel Construction. Processes 2023, 11, 980. [Google Scholar] [CrossRef]
- He, Z.G.; Guo, J.N. Security Risk Assessment of Multimodal Transport Network Based on WBS-RBS and PFWA Operator. In Proceedings of the 4th International Conference on Intelligent Transportation Engineering (ICITE), Singapore, 5–7 September 2019; pp. 203–206. [Google Scholar]
- Kim, K.N.; Kim, T.H.; Lee, M.J. Analysis of Building Construction Jobsite Accident Scenarios Based on Big Data Association Analysis. Buildings 2023, 13, 2120. [Google Scholar] [CrossRef]
- Liu, S.H.; Song, Z.P.; Zhang, Y.; Guo, D.S.; Sun, Y.H.; Zeng, T.; Xie, J.S. Risk assessment of deep excavation construction based on combined weighting and nonlinear FAHP. Front. Earth Sci. 2023, 11, 1204721. [Google Scholar] [CrossRef]
- Wang, X.; Lu, H.L.; Su, W.Y.; Zhu, X.H. Risk Analysis and Assessment of Shield Tunnel Construction in Karst Area. In Proceedings of the 8th International Conference on Hydraulic and Civil Engineering—Deep Space Intelligent Development and Utilization Forum (ICHCE), Xian, China, 25–27 November 2022; pp. 674–680. [Google Scholar]
- Kumar, R.; Singh, S.; Bilga, P.S.; Singh, J.; Singh, S.; Scutaru, M.L.; Pruncu, C.I. Revealing the benefits of entropy weights method for multi-objective optimization in machining operations: A critical review. J. Mater. Res. Technol. JMRT 2021, 10, 1471–1492. [Google Scholar] [CrossRef]
- Xu, G.X.; Liu, P.D. The Evaluation Study of Human Resource Based on Extended C-OWA Operators and TOPSIS Method. In Proceedings of the 3rd International Conference on Wireless Communications, Networking and Mobile Computing (WiCOM 2007), Shanghai, China, 21–25 September 2007; pp. 4461–4465. [Google Scholar]
- Liu, X.H.; Yang, J.; Lu, J.; Yao, Z.C. Evaluation method for HRRP imaging quality based on intuitionistic interval fuzzy set. SN Appl. Sci. 2020, 2, 79. [Google Scholar] [CrossRef]
- Akhtar, N.; Ishak, M.I.S.; Ahmad, M.I.; Umar, K.; Yusuff, M.S.M.; Anees, M.T.; Qadir, A.; Almanasir, Y.K.A. Modification of the Water Quality Index (WQI) Process for Simple Calculation Using the Multi-Criteria Decision-Making (MCDM) Method: A Review. Water 2021, 13, 905. [Google Scholar] [CrossRef]
- Sánchez-Lozano, J.M.; Teruel-Solano, J.; Soto-Elvira, P.L.; García-Cascales, M.S. Geographical Information Systems (GIS) and Multi-Criteria Decision Making (MCDM) methods for the evaluation of solar farms locations: Case study in south-eastern Spain. Renew. Sustain. Energy Rev. 2013, 24, 544–556. [Google Scholar] [CrossRef]
Figure 1.
Sources of construction safety risks in urban elevated bridge projects.

Figure 2.
WBS-RBS matrix proposed in this study.

Figure 3.
Mapping relationship between dynamic scores of indicators and dynamic weights.

Figure 4.
Calculation results of weighting of first-level indicators in different construction stages.
Figure 4.
Calculation results of weighting of first-level indicators in different construction stages.


Table 1.
Evaluation indicator system proposed in this study.
| Primary Index | Secondary Index | Position in the Matrix |
|---|---|---|
| : Man | : Safety protection capability of construction workers | |
| : Physical condition of construction workers | ||
| : Psychological state of construction workers | ||
| : Safety responsibility of management personnel | ||
| : Machine | : Mismatched types of lifting machinery equipment | |
| : Mismatched types of large-scale transportation equipment | ||
| : Power malfunction of rebar processing equipment | ||
| : Incorrect installation of rotary drilling rig machinery | ||
| : Improper machinery maintenance and repair | All elements except | |
| : Unstable machinery performance | ||
| : Material | : Quality defects of precast components | |
| : Concrete quality defects | ||
| : Quality defects of steel reinforcement | ||
| : Rough handling during material transportation | ||
| : Improper storage of materials | ||
| : Environment | : Poor geological conditions | |
| : Extreme high-temperature weather | ||
| : Unfavorable topography and geomorphological conditions | ||
| : Complicated bridge positioning | ||
| : Complex construction site | ||
| : Management | : Immature construction techniques | |
| : Non-compliant construction safety control | ||
| : Unreasonable construction plan | ||
| : Inadequate safety organizational structure | ||
| : Insufficient security measures |
Table 2.
Early warning index system for the construction safety risk of subway stations.
| Secondary Index | October 2020 | December 2020 | May 2021 | August 2021 |
|---|---|---|---|---|
| 2.3% | 18.5% | 6.8% | 4.6% | |
| 13.2% | 9.7% | 6.0% | 11.8% | |
| 1.0% | 2.8% | 5.5% | 0.8% | |
| 15.9% | 2.5% | 0% | 0% | |
| 9.7% | 6.8% | 5.2% | 3.0% | |
| 19.3% | 26.8% | 13.3% | 35.9% | |
| 2.45% | 1.24% | 1.99% | 0.51% | |
| 1.94% | 1.36% | 1.38% | 1.86% | |
| 2.71% | 2.76% | 2.18% | 2.11% | |
| 0.44% | 0.58% | 1.13% | 0.62% | |
| 7.84% | 5.54% | 12.91% | 8.45% | |
| 36 | 12 | 35 | 41 | |
| 3.6% | 7.4% | 2.0% | 1.5% | |
| 16.3% | 34.9% | 21.2% | 19.4% | |
| 3.8% | 6.0% | 2.1% | 0.5% |
Table 3.
Summary of expert information.
| Work Unit | Professional | Degree | Years of Work Experience |
|---|---|---|---|
| Scientific research institutions | No professional title | No degree | |
| 10 | 0 | 0 | 0 |
| Design institute | Junior professional title | Bachelor | |
| 3 | 0 | 16 | 3 |
| Construction company | Intermediate professional title | Master | |
| 13 | 12 | 6 | 6 |
| Regulatory authority | Senior professional title | Doctor | |
| 4 | 18 | 8 | 21 |
Table 4.
Overview of qualitative indicator scores.
| Secondary Index | October 2020 | December 2020 | May 2021 | August 2021 |
|---|---|---|---|---|
| 85.33 | 67.00 | 76.67 | 89.33 | |
| 94.33 | 86.67 | 75.33 | 72.00 | |
| 86.33 | 75.67 | 67.00 | 89.67 | |
| 42.00 | 63.33 | 85.67 | 32.67 | |
| 84.67 | 83.33 | 72.67 | 67.67 | |
| 73.33 | 87.33 | 71.67 | 80.33 | |
| 62.67 | 83.67 | 71.33 | 72.00 | |
| 81.33 | 74.67 | 81.00 | 72.67 | |
| 83.67 | 81.33 | 82.33 | 61.00 | |
| 72.67 | 81.33 | 92.67 | 83.33 |
Table 5.
Results of static and dynamic weight calculations.
| Secondary Index | Static Weight | Dynamic Weights without Normalization | |||
|---|---|---|---|---|---|
| October 2020 | December 2020 | May 2021 | August 2021 | ||
| 0.0610 | 0.1333 | 0.3250 | 0.0833 | 0.2333 | |
| 0.0502 | 0.3583 | 0.1668 | 0.1168 | 0.2000 | |
| 0.0005 | 0.1583 | 0.1083 | 0.3250 | 0.2418 | |
| 0.0183 | 0.9500 | 0.4168 | 0.1418 | 1.1833 | |
| 0.0461 | 0.7700 | 0.8500 | 1.3200 | 0.5400 | |
| 0.0283 | 0.3400 | 0.5150 | 0.7000 | 0.4100 | |
| 0.0406 | 0.8000 | 0.4400 | 0.1000 | 0.8400 | |
| 0.0017 | 0.2050 | 0.8750 | 0 | 0 | |
| 0.0485 | 0.5150 | 0.6600 | 0.7400 | 0.8500 | |
| 0.0406 | 0.9300 | 1.6800 | 0.3300 | 2.5900 | |
| 0.0534 | 0.4900 | 0.2480 | 0.3984 | 0.1021 | |
| 0.0623 | 0.3880 | 0.2720 | 0.2761 | 0.3722 | |
| 0.0472 | 0.5422 | 0.5521 | 0.4361 | 0.4224 | |
| 0.0242 | 0.0880 | 0.1160 | 0.2262 | 0.1242 | |
| 0.0628 | 1.5681 | 1.1080 | 2.5822 | 1.6901 | |
| 0.0269 | 0.1168 | 0.0833 | 0.1833 | 0.3083 | |
| 0.0611 | 0.5000 | 1.0000 | 37.4159 | 206.4435 | |
| 0.0623 | 0.1668 | 0.1833 | 0.2083 | 0.0082 | |
| 0.0439 | 0.4333 | 0.0918 | 0.2168 | 0.2000 | |
| 0.0519 | 0.0333 | 0.1333 | 0.0250 | 0.1833 | |
| 0.0656 | 0.0002 | 0.0011 | 0.0003 | 0.0008 | |
| 0.0185 | 0.0009 | 0.0037 | 0.0003 | 0.0002 | |
| 0.0408 | 0.0041 | 0.0035 | 0.0045 | 0.0049 | |
| 0.0220 | 0.0918 | 0.0333 | 0.0583 | 1.4870 | |
| 0.0217 | 0.1833 | 0.0333 | 0.3168 | 0.0833 | |
Table 6.
Criteria for evaluation levels of all secondary indexes for case objects.
| Secondary Index | I | II | III | IV | V |
|---|---|---|---|---|---|
Table 7.
Calculation of the final results for combination weights.
| Secondary Index | October 2020 | December 2020 | May 2021 | August 2021 |
|---|---|---|---|---|
| 0.0155 | 0.0339 | 0.0022 | 0.0012 | |
| 0.0372 | 0.0181 | 0.0029 | 0.0010 | |
| 0.0156 | 0.0105 | 0.0078 | 0.0011 | |
| 0.0942 | 0.0412 | 0.0041 | 0.0054 | |
| 0.0776 | 0.0844 | 0.0281 | 0.0025 | |
| 0.0346 | 0.0511 | 0.0149 | 0.0019 | |
| 0.0803 | 0.0443 | 0.0120 | 0.0049 | |
| 0.0202 | 0.0851 | 0.0094 | 0.0036 | |
| 0.0526 | 0.0660 | 0.0159 | 0.0040 | |
| 0.0931 | 0.1648 | 0.0073 | 0.0118 | |
| 0.0503 | 0.0261 | 0.0088 | 0.0006 | |
| 0.0406 | 0.0288 | 0.0063 | 0.0018 | |
| 0.0552 | 0.0554 | 0.0095 | 0.0020 | |
| 0.0096 | 0.0122 | 0.0050 | 0.0006 | |
| 0.1568 | 0.1101 | 0.0548 | 0.0078 | |
| 0.0125 | 0.0091 | 0.0041 | 0.0014 | |
| 0.0516 | 0.0995 | 0.7866 | 0.9389 | |
| 0.0188 | 0.0202 | 0.0049 | 0.0001 | |
| 0.0443 | 0.0106 | 0.0049 | 0.0010 | |
| 0.0053 | 0.0149 | 0.0009 | 0.0009 | |
| 0.0025 | 0.0026 | 0.0005 | 0.0001 | |
| 0.0008 | 0.0011 | 0.0002 | 0.00003366 | |
| 0.0020 | 0.0019 | 0.0004 | 0.0001 | |
| 0.0099 | 0.0041 | 0.0014 | 0.0068 | |
| 0.0189 | 0.0041 | 0.0068 | 0.0004 |
Table 8.
Proportions of static weights in total weights.
| Secondary Index | October 2020 | December 2020 | May 2021 | August 2021 | Rate of Change |
|---|---|---|---|---|---|
| 31.39% | 15.80% | 42.27% | 20.73% | −194.30% | |
| 12.29% | 23.13% | 30.06% | 20.06% | 258.05% | |
| 0.31% | 0.46% | 0.15% | 0.21% | −190.18% | |
| 1.89% | 4.21% | 11.43% | 1.52% | −415.05% | |
| 5.65% | 5.14% | 3.37% | 7.87% | 354.83% | |
| 7.68% | 5.21% | 3.89% | 6.46% | −526.14% | |
| 4.83% | 8.45% | 28.88% | 4.61% | −2101.50% | |
| 0.82% | 0.19% | 0.17% | 0.17% | −26.00% | |
| 8.61% | 6.85% | 6.15% | 5.40% | −168.21% | |
| 4.18% | 2.36% | 10.96% | 1.54% | −58.47% | |
| 9.83% | 17.72% | 11.82% | 34.34% | 140.09% | |
| 13.84% | 18.64% | 18.41% | 14.34% | 2850.00% | |
| 8.01% | 7.88% | 9.77% | 10.05% | 491.99% | |
| 21.57% | 17.26% | 9.66% | 16.31% | −309.94% | |
| 3.85% | 5.36% | 2.37% | 3.58% | −1336.80% | |
| 18.72% | 24.41% | 12.80% | 8.03% | −75.04% | |
| 10.89% | 5.76% | 0.16% | 0.03% | −0.27% | |
| 27.19% | 25.37% | 23.02% | 88.37% | 144.45% | |
| 9.20% | 32.35% | 16.84% | 18.00% | 204.54% | |
| 60.92% | 28.02% | 67.49% | 22.07% | −56.80% | |
| 99.70% | 98.35% | 99.54% | 98.80% | 99.70% | |
| 95.36% | 83.33% | 98.40% | 98.93% | 95.36% | |
| 90.87% | 92.10% | 90.07% | 89.28% | 90.87% | |
| 19.33% | 39.78% | 27.40% | 1.46% | 19.33% | |
| 10.59% | 39.45% | 6.41% | 20.67% | 10.59% |
Table 9.
Rate of change Results of Different Combination Strategies.
| Secondary Index | AHP-Dynamic Weight | EWM-Dynamic Weight | C-OWA–Dynamic Weight | IIFS-Dynamic Weight |
|---|---|---|---|---|
| −194.30% | −175.12% | −178.87% | −157.89% | |
| 258.05% | 272.87% | 264.31% | 285.12% | |
| −190.18% | −178.25% | −175.99% | −164.48% | |
| −415.05% | −404.83% | −407.30% | −386.86% | |
| 354.83% | 369.84% | 367.90% | 383.67% | |
| −526.14% | −518.49% | −517.52% | −524.12% | |
| −2101.50% | −2097.22% | −2096.32% | −2074.98% | |
| −26.00% | −24.29% | −19.45% | 10.24% | |
| −168.21% | −156.01% | −156.70% | −151.57% | |
| −58.47% | −53.76% | −47.86% | −43.68% | |
| 140.09% | 140.86% | 159.36% | 148.88% | |
| 2850.00% | 2865.93% | 2865.37% | 2860.48% | |
| 491.99% | 493.42% | 499.51% | 504.25% | |
| −309.94% | −299.40% | −302.72% | −298.18% | |
| −1336.80% | −1331.89% | −1331.31% | −1316.18% | |
| −75.04% | −71.36% | −69.38% | −62.27% | |
| −0.27% | 1.83% | 4.93% | 19.99% | |
| 144.45% | 145.74% | 152.33% | 182.38% | |
| 204.54% | 213.24% | 219.94% | 216.00% | |
| −56.80% | −47.53% | −43.18% | −49.57% | |
| 99.70% | 103.27% | 110.03% | 103.62% | |
| 95.36% | 112.77% | 97.22% | 100.40% | |
| 90.87% | 103.37% | 91.96% | 109.72% | |
| 19.33% | 37.69% | 28.09% | 53.41% | |
| 10.59% | 20.41% | 17.21% | 15.46% |
Disclaimer/Publisher’s Note: The statements, opinions and data contained in all publications are solely those of the individual author(s) and contributor(s) and not of MDPI and/or the editor(s). MDPI and/or the editor(s) disclaim responsibility for any injury to people or property resulting from any ideas, methods, instructions or products referred to in the content. |
© 2024 by the authors. Licensee MDPI, Basel, Switzerland. This article is an open access article distributed under the terms and conditions of the Creative Commons Attribution (CC BY) license (https://creativecommons.org/licenses/by/4.0/).
Share and Cite
MDPI and ACS Style
Ran, R.; Wang, S.; Fang, J.; Wang, Y. Safety Risk Analysis of Urban Viaduct Construction Based on Dynamic Weight. Buildings 2024, 14, 1014. https://doi.org/10.3390/buildings14041014
AMA Style
Ran R, Wang S, Fang J, Wang Y. Safety Risk Analysis of Urban Viaduct Construction Based on Dynamic Weight. Buildings. 2024; 14(4):1014. https://doi.org/10.3390/buildings14041014
Chicago/Turabian StyleRan, Ruijiang, Shengmin Wang, Jun Fang, and Yajie Wang. 2024. "Safety Risk Analysis of Urban Viaduct Construction Based on Dynamic Weight" Buildings 14, no. 4: 1014. https://doi.org/10.3390/buildings14041014
Note that from the first issue of 2016, this journal uses article numbers instead of page numbers. See further details here.