Article

Shear Behavior and Design of Innovative Stud-Reinforced Embedded Shear Connectors with Flanges

1
School of Civil Engineering, Zhengzhou University, Zhengzhou 450001, China
2
CCCC Second Highway Consultants Co., Ltd., Wuhan 430056, China
3
Henan D.R. Construction Group Steel Structure Co., Ltd., Xinxiang 453200, China
4
Zhengzhou Urban Construction Group Investment Co., Ltd., Zhengzhou 450007, China
*
Author to whom correspondence should be addressed.
Buildings 2024, 14(3), 632; https://doi.org/10.3390/buildings14030632
Submission received: 24 January 2024 / Revised: 9 February 2024 / Accepted: 20 February 2024 / Published: 28 February 2024
(This article belongs to the Section Building Materials, and Repair & Renovation)

Abstract

:
The embedded shear connector with flanges (ESCF) exhibits excellent shear performance in the steel–concrete composite beam. The ESCF consists of embedded corrugated steel web as the shear connector and shape-matched flanges for construction convenience. However, previous research showed that the steel flange of the ESCF was prone to local buckling when subjected to shear force, resulting in insufficient shear strength of the connector. In this paper, head studs were adopted to reinforce the ESCF at the flange with a large width-to-thickness ratio. Nine stud-reinforced embedded shear connectors with flanges (SR-ESCF) were manufactured to conduct the push-out test to investigate the shear performance of SR-ESCF. The effects of the reinforcing studs, thickness of the web, width-to-thickness ratio of the flange, embedding depth of the web, and diameter of the combined rebar on shear strength of the SR-ESCF were revealed and discussed thoroughly. The push-out test results showed that the head studs significantly improved the initial stiffness and load-bearing capacity of the ESCF, which were increased by 17% and 15%, respectively. Moreover, the head studs prevented local buckling of the steel flange. The shear strength of the specimens was greatly influenced by the embedding depth of the web, the width-to-thickness ratio of the flange as well as the reinforcing studs. However, the diameter of the combined rebar and thickness of the web had negligible effects on the shear capacity of the SR-ESCF. According to the test results, the nonlinear finite element model (FEM) and the shear capacity of SR-ESCF prediction formula were created and verified. Furthermore, the layout of the reinforcing studs welded on the flange of the SR-ESCF was optimized by the validated FEM, which indicated that the shear-bearing capacity of the SR-ESCF could be significantly increased by adding studs on the steel flange near the original studs. This research will be of great significance to the design and implementation of the steel–concrete composite beam bridge with corrugated steel web.

1. Introduction

The steel–concrete composite bridge with corrugated web has been widely used in railway and highway bridges for ages [1,2]. Using corrugated steel web instead of concrete web results in reduction in the weight of the bridge, which is favorable for on-site construction. Meanwhile, the impact of creep and shrinkage of the concrete is generally eliminated. In 1975, the prestressed concrete composite bridge with corrugated steel web was employed for the first time in a bridge in France. For connecting steel and concrete components in composite structures, the shear connector is the most important component [3,4,5]. The stud connector, Perfobond shear connector (PBL), embedded shear connector (ESC), and angle steel connector are commonly applied in steel–concrete composite bridges, as illustrated in Figure 1.
Because the stud connector is frequently utilized in composite bridges, lots of research has been conducted to explore the shear performance of stud connectors [6,7,8]. Kruszewski et al. [9] studied the shear performance of stud connectors embedded in UHPC and analyzed factors which influence the shear performance of the stud connector. It was found that the concrete strength grade and the diameter, spacing, and layout of the stud mainly influenced the shear performance of stud connectors. Duan et al. [10] and other researchers [11,12,13] proposed the head stud connector in UHPC slabs, and found that the head studs were well-matched with the UHPC slabs. Deng et al. [14] put forward the cluster stud connector and studied the shear behavior by conducting finite element analysis with various interlayer spacing and number of the stud rows. Compared with stud connectors, angle steel connectors are better than stud connectors with regard to ductility and shear strength [15,16].
The PBL connector was formed by perforated steel plate welding on the flange and the transverse rebar penetrating through the perforated steel plate [17,18]. Oguejiofor et al. [19,20,21] studied the impacts of the number of holes, hole spacing, concrete strength, and other elements of the shear strength of the PBL connector based on push-out tests. Correspondingly, regression analysis was applied to the proposed equation to calculate the shear capacity of PBL. Liu et al. [22] conducted 144 extended finite element analysis (FEA) models and three group of push-out tests of PBL. The results showed that concrete dowels and perforated rebars had remote impact on the lateral shear strength, and the expressions for the rigidity of PBL were put forward. Wang et al. [23] proposed an innovative connection with perforated plate connectors and studied the failure modes, shear stiffness, shear strength, and relative slip characteristics based on the tests and FEA.
The embedded shear connector (ESC) was first proposed in 1999 to be applied in steel–concrete composite bridges [24]. Novak [25] and Rohm [26] investigated the shear strength of the ESC with corrugated steel web under the transverse bending moment and longitudinal shear load, respectively. Depending on the research, simplified design methods for ESC with corrugated steel web based on the ultimate limit state were put forward. Kanchanadevi et al. [27] investigated the effect of embedding depth, the reinforcing zone for the dowel bar, and the reinforcement in the concrete dowel on the shear resistance of ESCs when using corrugated steel web according to the push-out test. Additionally, an equation for a credible estimation of shear resistance was obtained using the outcomes of the push-out test. Cheng et al. [28] completed 45 tests of the integrated push-out tests of double-row-pin connectors to investigate the shear resistance and failure mode. The ultimate shear capacity of the connector was predicted by using an equation created from 44 FE models in total. Shi [29] proposed the embedded shear connector with flanges (ESCF) based on the ESC, as shown in Figure 1d. The shape-matched flanges were welded along both sides on the corrugated web, so as to make the shear performance of the connector better and to ease the pouring of the concrete slab. In accordance with the outcomes of the ESCF push-out test, the ESC with thin flange was prone to local buckling of the flange, which obviously reduced the ultimate shear strength, as shown in Figure 2.
To overcome the above limitation, the stud-reinforced embedded shear connector with flanges (SR-ESCF) was put forward in this paper to further strengthen the shear performance of the ESCF, and the detailed structure is shown in Figure 3. Nine tests of push-out were proposed to investigate the impact of the studs, thickness of the web, embedding depth of the web, diameter of the combined rebar, and the width-to-thickness ratio of the flange. Resulting from the tests, FEM and the estimation equation of shear strength of the SR-ESCF were put forward and verified. Furthermore, the layout of the studs welded on the flange of the SR-ESCF was optimized through FEA.

2. Experimental Program

2.1. Specimen Design

Nine full-scale specimens labeled from ESCF-SR1 to ESCF-SR8 and ESCF-9 are fabricated and tested under push-out loading to study the failure modes and shear property of the innovative connector. The geometrical characteristics of the samples are displayed in Table 1 and Figure 4. ESCF-9 is a benchmark specimen without studs and the others are reinforced by studs. Parameters to be taken into account include embedding depth of the web, thickness of the web, diameter of the combined rebar, and width-to-thickness ratio of the flange. The length, width, and thickness of the concrete slab were 600 mm, 250 mm, and 1000 mm, respectively. Figure 5 shows the typical sequence adopted for manufacture of the specimens including arrangement of the steel part, erection of the formwork, casting of the concrete flange, and natural curing.
The tested specimens are composed of embedded corrugated steel web (ECSW), concrete flange, steel bar, and reinforcing studs. In this study, three cubic samples of 150 mm side length were employed to measure 28 days of compression strength of concrete [30], and the push-out test samples were treated under the same natural conditions. Table 2 shows the concrete properties from the material property test. All the steel parts were made from Grade Q345B steel. Based on Metallic materials-Tensile testing at ambient temperature (GB/T228-2002) [31], the mechanical properties of the specimens used including ultimate strength, elastic modulus and yield strength of the stud, reinforcement, and steel plate were measured, as listed in Table 2.

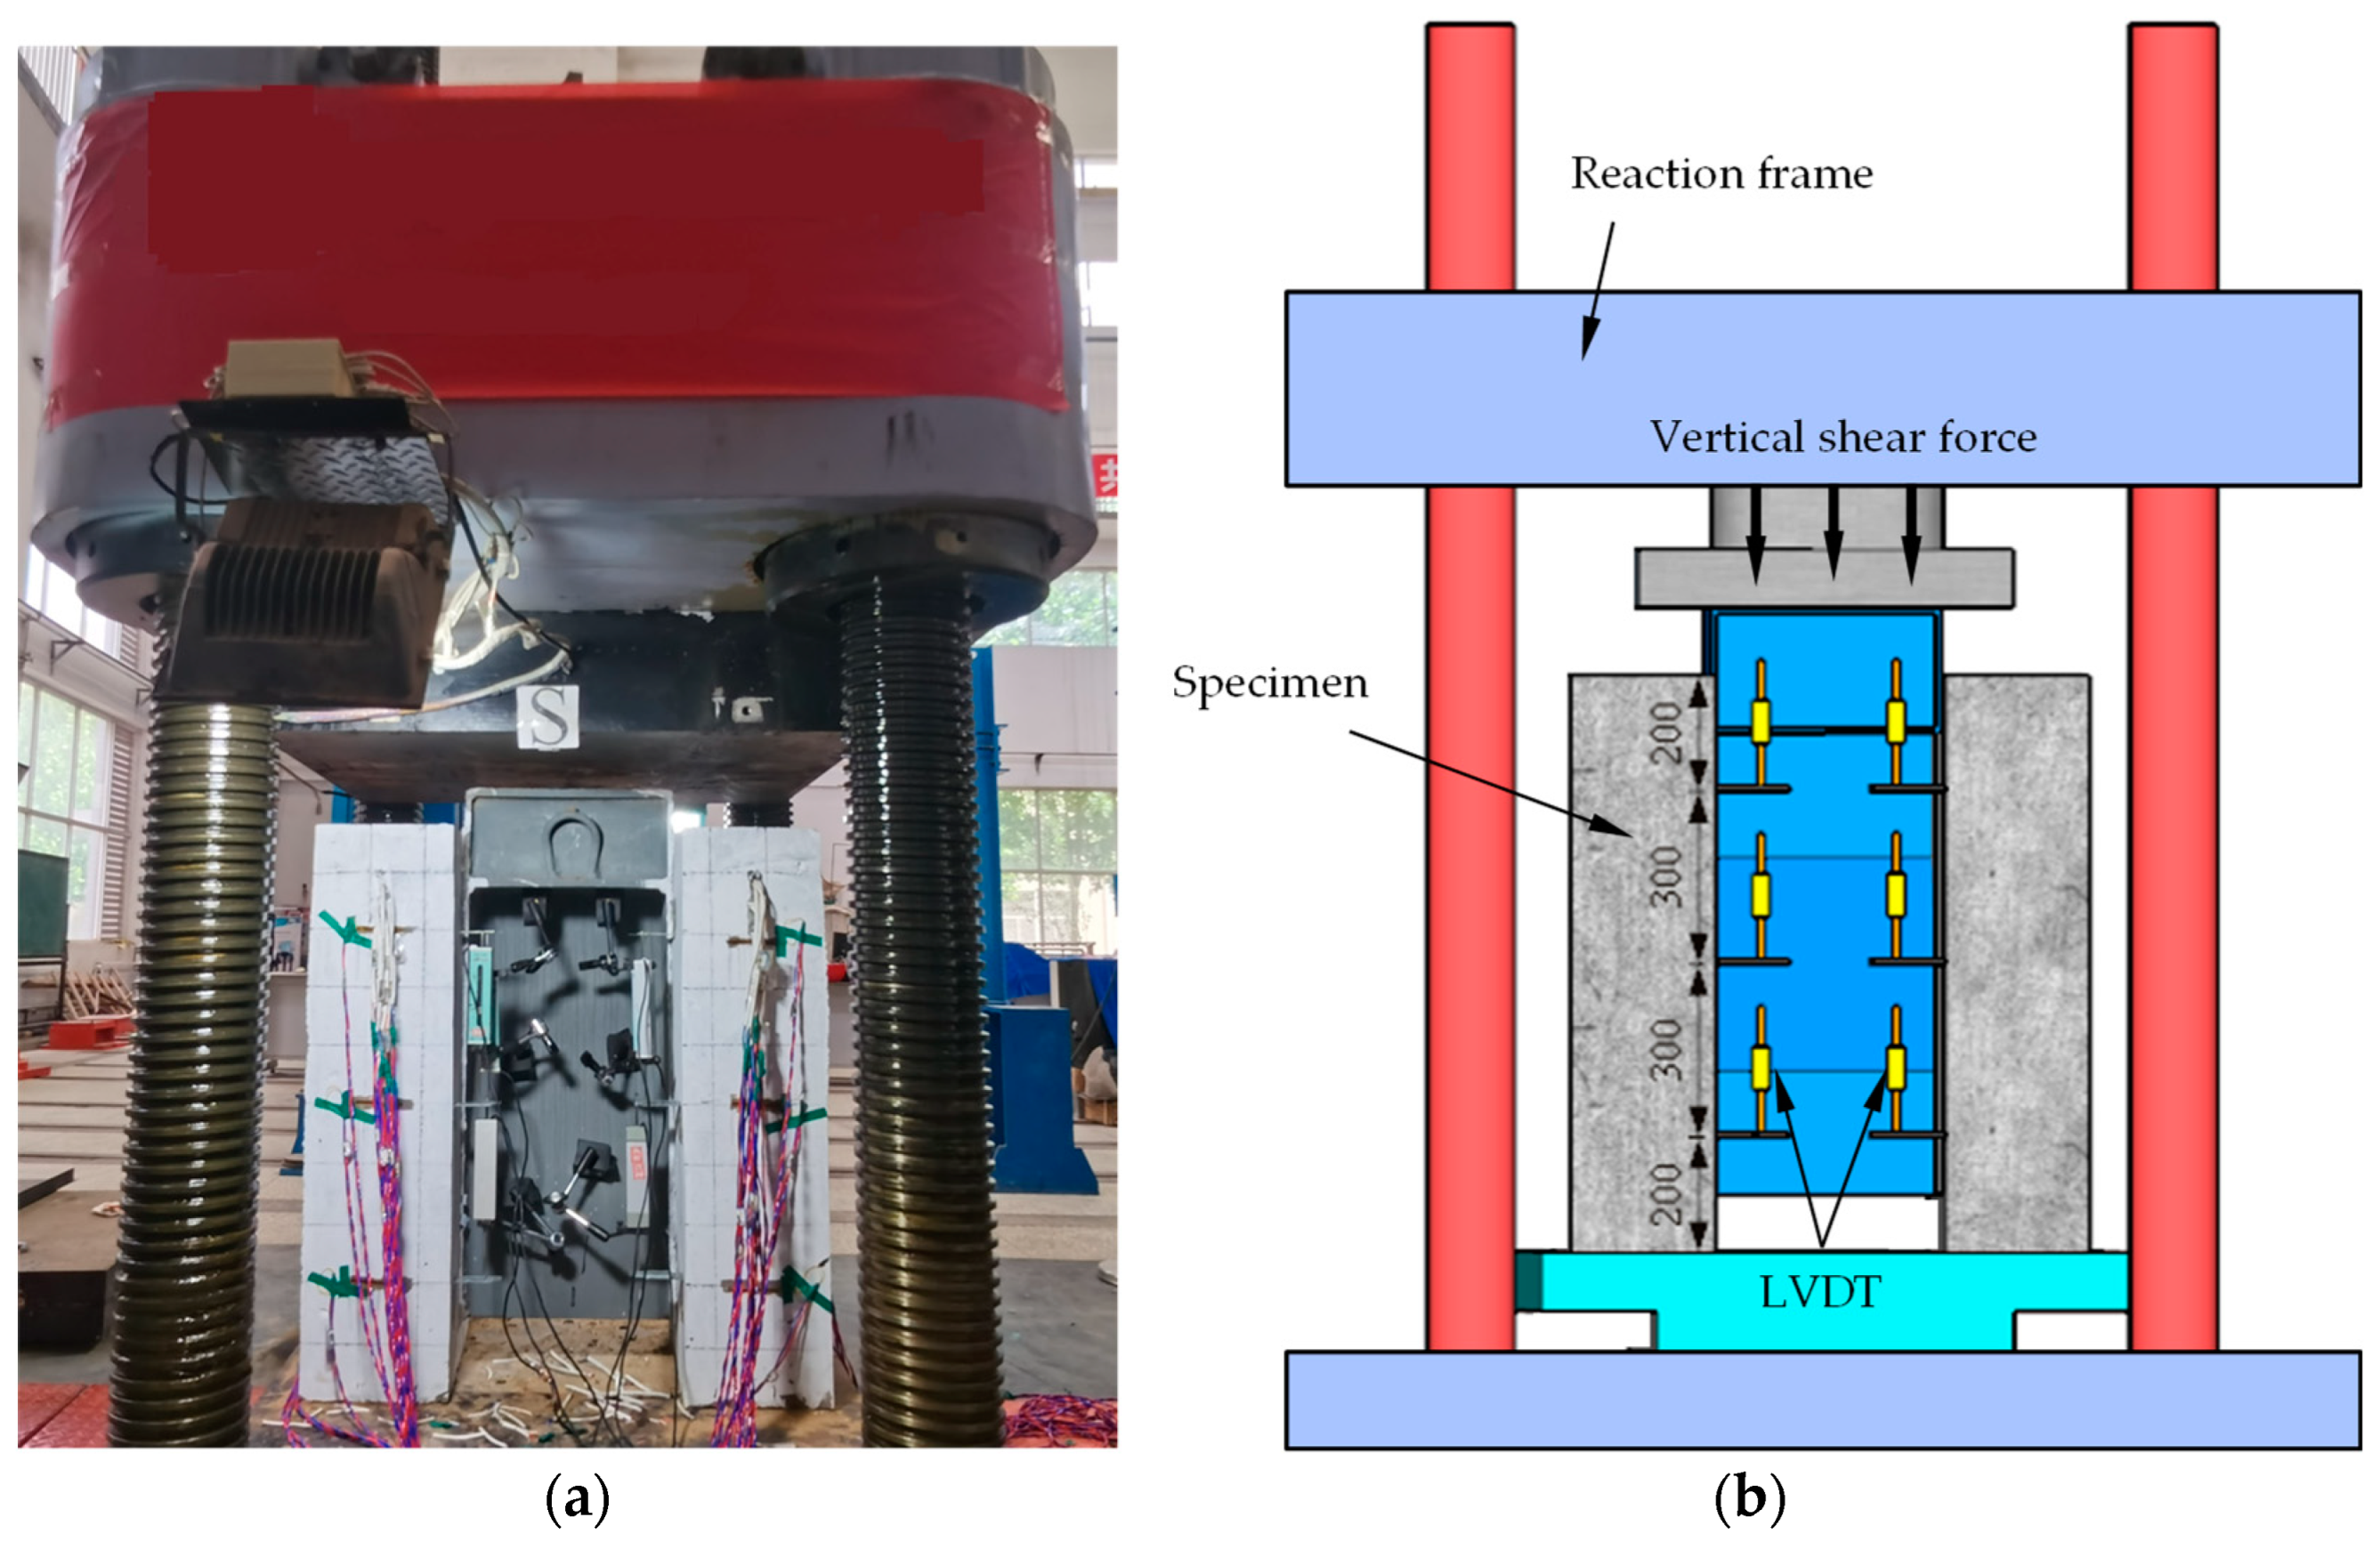
2.2. Test Setup and Instrumentation

The push-out test is carried out with a hydraulic tester, as displayed in Figure 6. For the purpose of uniformly distributing the force applied to the specimen, a loading cell was set up at the top of the specimen. The center line was drawn on the bottom plate of the equipment and the concrete blocks to facilitate positioning of the specimen, and a layer of sand was laid uniformly between the test apparatus and loading cell to make sure the load was transferred to the specimens evenly. For the purpose of measuring the displacement of the steel flange, six linear variable differential transformers (LVDTs) were installed symmetrically on the surface of the steel flange, and fixed at the same height, as shown in Figure 6. By averaging the results of the LVDTs, which were continually and automatically recorded, it is feasible to measure the relative slip between the steel flange and the concrete slab.
In accordance with the Eurocode 4 [32], the loading procedure can be classified into preloading and formal loading. Before the formal loading, 10% of the estimated ultimate load capacity was applied. The load needs to be maintained for 5 min after the stable readings of the LVDTs [33]. After the preloading, a multistage loading method was used in the formal loading with an increment of 200 kN and held for 5 min until complete failure of the test specimens. The velocity of the loading was 0.5 kN/s.

3. Experimental Results and Discussion
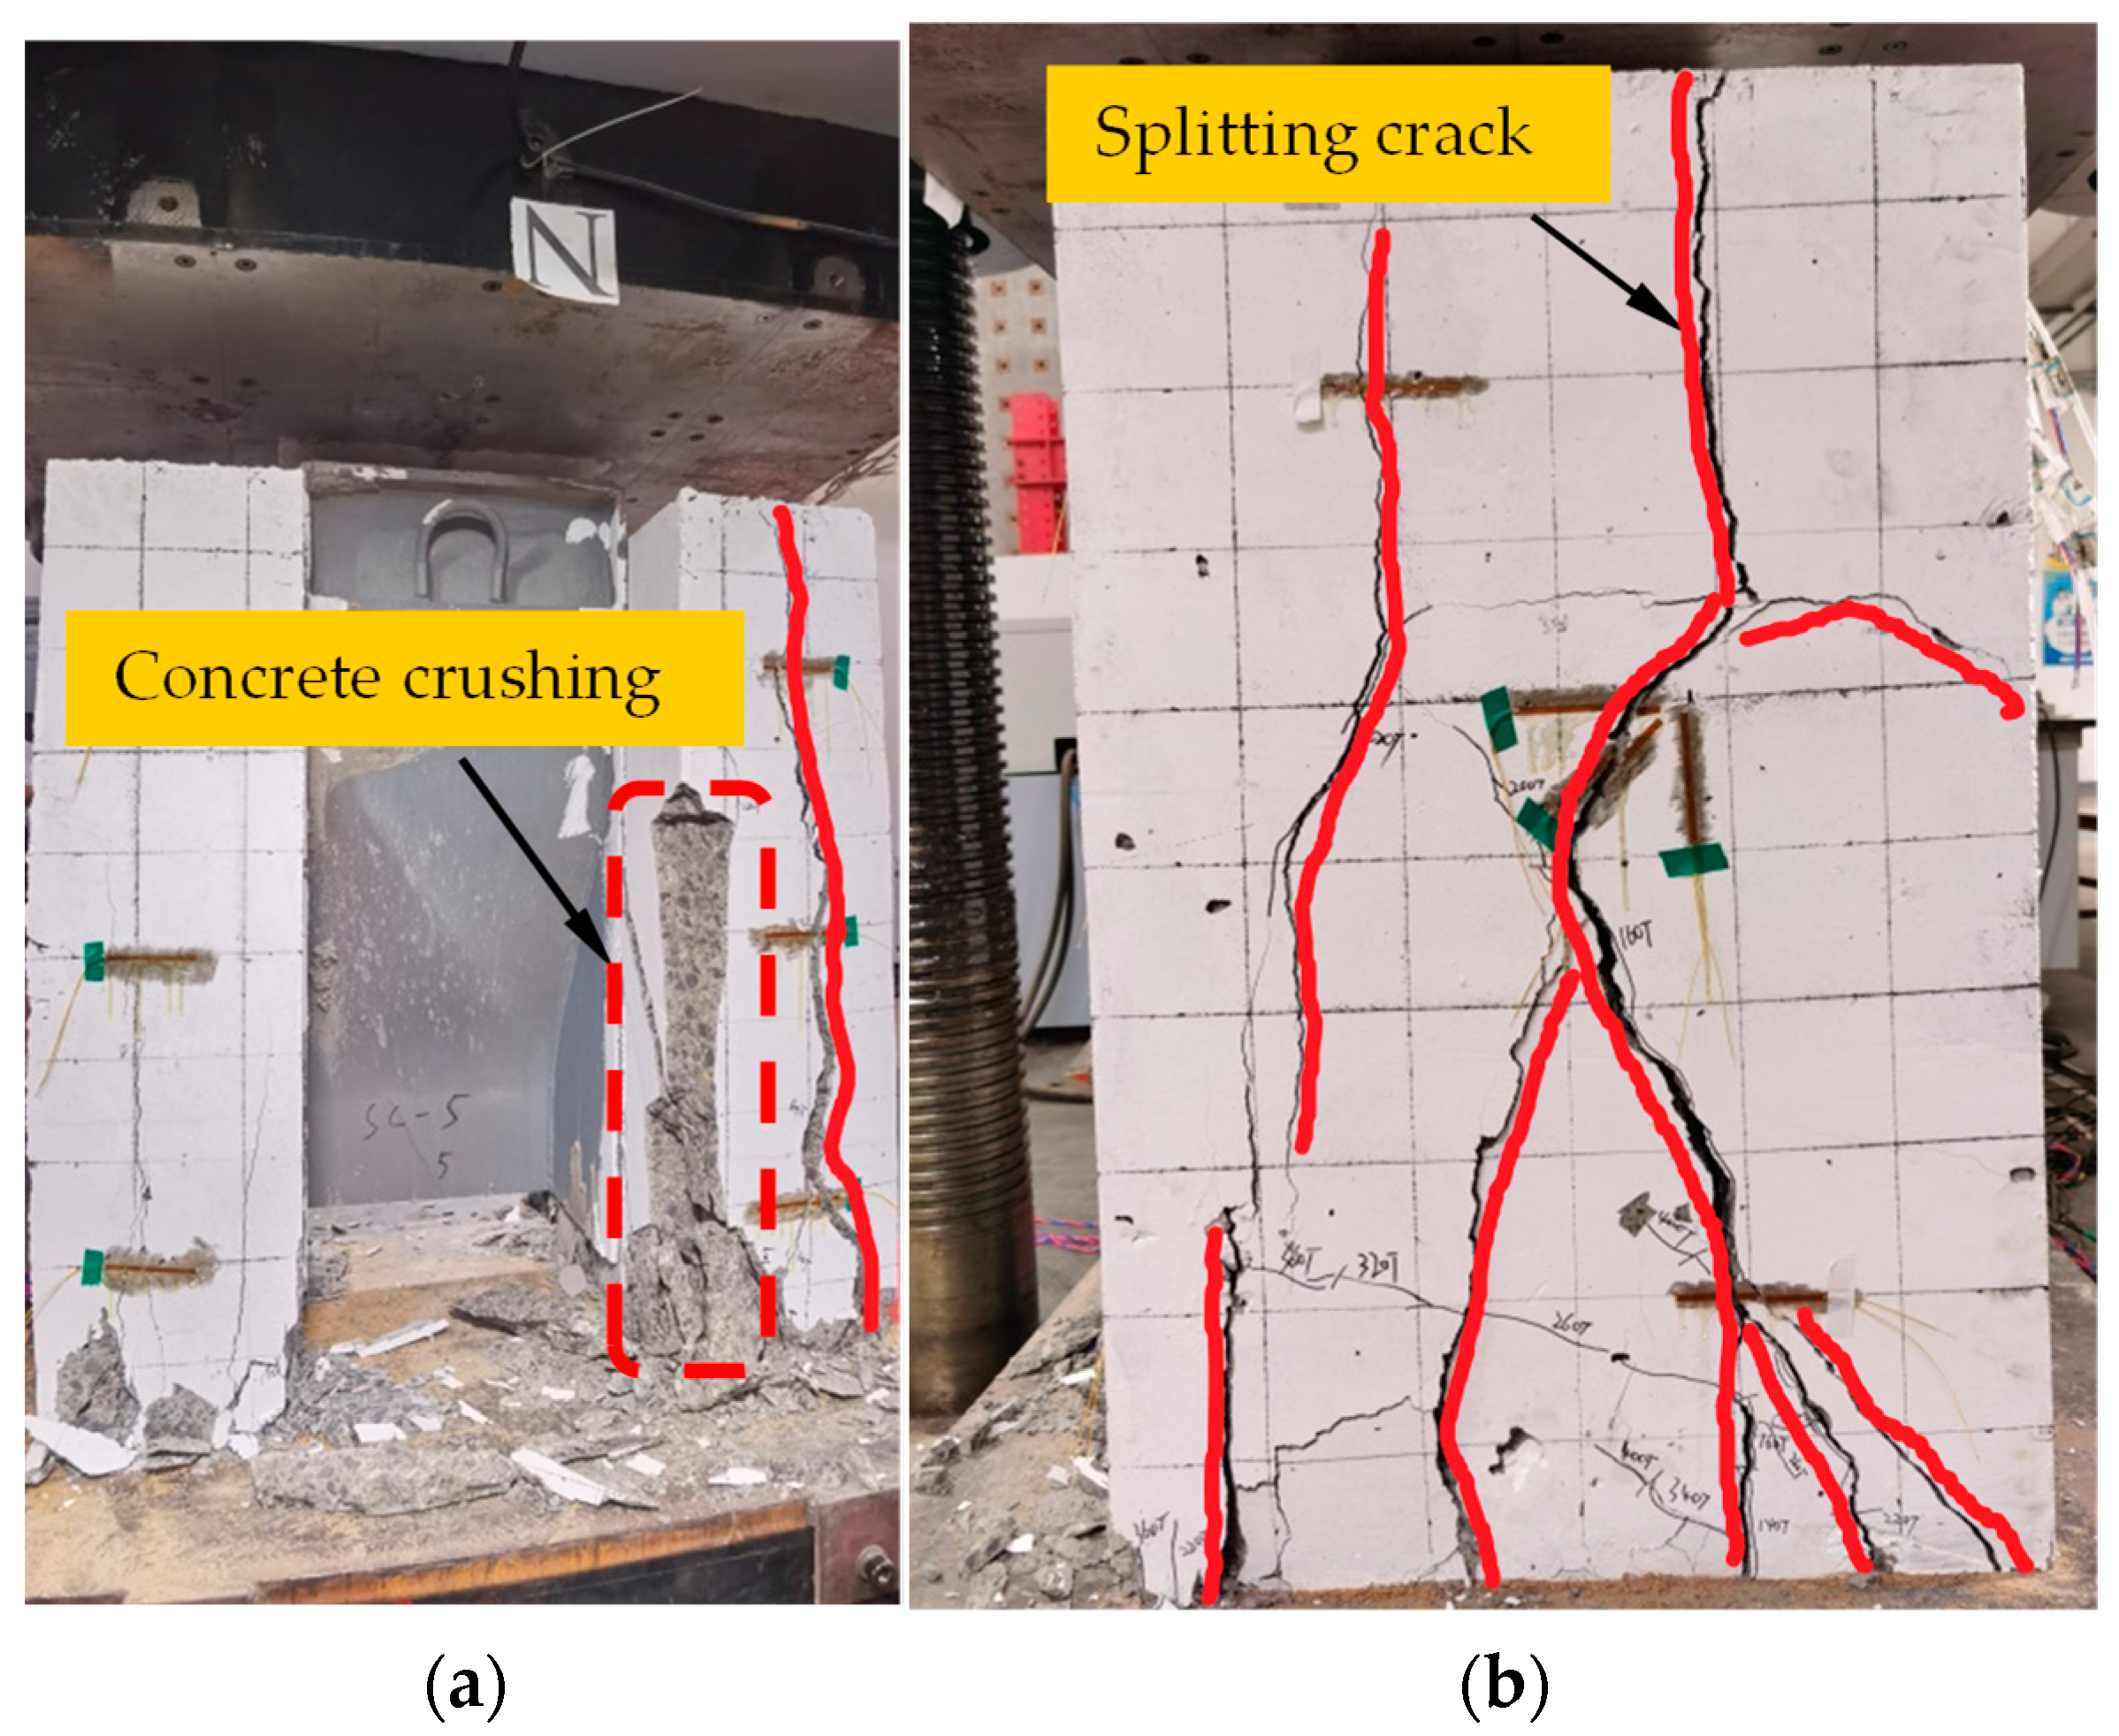
3.1. Failure Modes

The experimental results including ultimate load, the failure modes, relative slip, and stiffness at the ultimate load of the tested specimen are presented in Table 3. The failure mechanisms of the samples were mainly characterized as the local buckling of the steel flange and splitting of the concrete slab, taking Specimens ESCF-SR1 and ESCF-SR5 as examples.
Local buckling of the steel flange happened with the specimen ESCF-SR1, as presented in Figure 7. At the lowest position of the concrete slab, the initial crack emerged in width direction and developed toward the top and lateral direction gradually with increasing applied load. At the time of the vertical load reached 1600 kN, local buckling appeared at one side of the flange near the stud. As the loading continued, the specimen was broken because of the local buckling of the flange, as shown in Figure 7b.
Figure 8 illustrates the splitting of the concrete flange for Specimen ESCF-SR5. The bottom corner of the concrete slab experienced some minor crushing, and the first crack was visible running in the thickness direction. With increasing applied shear load, the initial crack developed along the combined rebar and concrete crushing occurred at the lowest position of the concrete slab, as shown in Figure 8a. Figure 8b shows that the concrete slab was damaged by a main crack along the corrugated web along the thickness direction. The failure models of the Specimens ESCF-SR2–ESCF-SR7 are similar to that of the Specimen ESCF-SR5.

3.2. Parametric Study

To estimate the influence of the width-to-thickness ratio of the steel flange, the embedding depth of the web, reinforcing studs, the thickness of the web, and diameter of the combined rebar on the shear behavior of SR-ESCF, the load–slip curves of specimens with various parameter variations were compared and explained in this part.

3.2.1. Effect of the Width-to-Thickness Ratio of the Steel Flange

The width-to-thickness ratios of 25, 30, and 37.5 were used to ascertain the impact of this ratio on the ultimate strength of the connector. The load–slip curves of the push-out results are shown in Figure 9a. As the ratio of width-to-thickness increased from 25 to 37.5, the ultimate load of the SR-ESCF decreased by 47.5% from 2982 kN to 2021 kN. Moreover, the stiffness of the SR-ESCF increased by 37.2% from 1700 kN/mm to 2710 kN/mm, which showed that the shear behavior of the SR-ESCF was remarkably affected by the width-to-thickness ratio of the steel flange. In the case of the same width of the flange, increasing the thickness of the flange significantly increases the shear resistance of the SR-ESCF.

3.2.2. Effect of the Embedding Depth of the Web

Figure 9b shows the load–slip curves with different embedding depths of web. The ultimate load of the connector decreased by 7.7% when the embedding depth of web increased from 150 mm to 180 mm. When the embedded depth increased from 180 mm to 210 mm, the shear strength of SR-ESCF increased by 7%. Therefore, the ultimate load of the SR-ESCF does not slow a linear variation when the embedding depth of web ranged from 150 mm to 210 mm. This finding implies that the optimal embedding depth of the corrugated steel web needs to be explored further [29].

3.2.3. Effect of the Reinforcing Studs

Figure 9c represents the impact of the reinforcing studs on the load–slip curves. When the studs are welded on the steel flange with a larger width-to-thickness ratio, the initial stiffness and shear capacity of Specimen ESCF-SR2 are 17% and 15% higher than that of Specimen ESCF-9 without studs, respectively. Therefore, the welded studs can effectively increase the shear capacity as well as the stiffness of the connector.

3.2.4. Effect of the Thickness of the Web

The effects of the thickness of the web on ultimate shear strength were displayed in Figure 9d. It can be learned that when the thickness of web developed from 12 mm to 14 mm, the shear strength enhanced slightly, only by 0.4%, from 2291 kN to 2301 kN. In addition, the thickness of the web had a marginal effect on the shear stiffness, which was increased by 2% from 1720 kN/mm to 1755 kN/mm for Specimens ESCF-SR2 and ESCF-SR4.

3.2.5. Effect of the Diameter of the Combined Rebar

For the purpose of investigating the effects on shear behavior of SR-ESCF, the diameter of the combined rebar was designed as 16 mm and 22 mm. The ultimate load of the specimens increased by 1.7% from 2301 kN to 2340 kN when the diameter of the combined rebar decreased from 22 mm to 16 mm, as displayed in Figure 9e. Therefore, it can be concluded that the diameter of the combined reinforcement has negligible influence on the shear strength of the SR-ESCF. It indicates that only the minimum reinforcement requirements need to be satisfied when arranging the combined rebar [28].

4. Theoretical Calculation of Shear Capacity of the SR-ESCF

Based on the failure modes of the SR-ESCF, it can be learned that the load-transferring mechanism and shear behavior of SR-ESCFs is analogous to that of the corrugated perforated plate connectors (PBLs) and embedded shear connectors (ESCs). Consequently, the shear strength of the SR-ESCFs obtained from the push-out tests was compared with the existing equations for the corrugated perforated plate connectors (PBLs) and embedded shear connectors (ESCs).
The Chinese standard CJJT 272-2017 [35] provides an equation which could be employed to predict the ESC’s ultimate shear strength, as expressed by Equation (1). Shi [29] used the push-out tests to establish an empirical equation for the ESCF, which enhanced the contribution of the slope concrete compression capacity to the ESCF shear capacity, as given by Equation (2). Additionally, Li and Wan [36] suggested using Equation (3) to calculate the ultimate strength of corrugated PBL connectors.
V1 = fcuA1 + fy1A2
V2 = μ1fcuA1 + μ2fy2A2
V 3 = 49.2 × 10 3 + 1.327 ( 1 0.145 l a ) ( Φ 1 2 Φ 2 2 ) f cu + 1.245 Φ 2 2 f y + 1.219 l a f cu
where V1, V2, and V3 are the shear strength of the connectors estimated by Equations (1)–(3), respectively; fcu, fy1, and fy2 are the cubic compressive strength of the concrete, yield strength of the combined rebar and transverse rebar, respectively; μ1 and μ2 are the contribution coefficient of the inclined concrete on shear strength of the ESCF and shear coefficient of the combined rebar, which are equal to 1.44 and 1.0, respectively; A1 and A2 are the horizontal projection sector of the corrugated steel web and cross-section sector of the combined rebar, respectively; l and a are the embedded height and wave height of the perforated corrugated plate, respectively; and Φ1 and Φ2 are the diameter of holes on the perforated corrugated plate and the transverse rebar, respectively.
The shear strength of the specimens was calculated using Equations (1)–(3). For evaluating the applicability of those calculation equations, the predicted shear capacities were contrasted to the test shear capacities, as shown in Table 4. It can be found that Equations (1) and (2) underestimated the shear strength of the SR-ESCF significantly with the mean values of V1/P and V2/P being 0.52 and 0.73, respectively. By comparing with the test results, Equation (3) was suggested to provide the most reasonable prediction of the shear capacity of SR-ESCFs among the above-mentioned equations with the average value of V3/P being 0.71 and the variation coefficient being 0.12. Consequently, Equation (3) is being changed to indicate shear strength of the SR-ESCF, taking into account the similar structural characteristics it shares with the PBL connector.
This study proposed Equation (4) to forecast the shear load of the SR-ESCF based on the corrugated perforated plate connector. The shear strength of the SR-ESCF was divided into three parts, namely, concrete dowel, perforating transverse rebar, and concrete key. The proposed equation for the shear strength of SR-ESCF was validated by comparing our results with the results calculated by all the above equations, as listed in Figure 10 and Table 4. Since the mean value of the predicted results to test results ratio is 0.87, Equation (4) can be used to determine the shear strength of SR-ESCF with greater accuracy, which indicated that the proposed equation can be employed to predict the shear strength of SR-ESCF. However, the proposed equation was only validated by limited test data, further validations are still necessary.
V4 = 9.27 × 10⁵ + 0.5λ1(Φ2Φs2) fc + 0.95λ2Φ22fy + 307 × 104fc(la)−0.5
where V4 is the shear capacity of the SR-ESCF; λ1 and λ2 denote the number of concrete dowels and transverse reinforcement, respectively; fc and fy are the cubic compressive strength of the concrete and yield strength of transverse rebar, respectively; Φ and Φs are the diameter of the holes on the perforated corrugated plate and the diameter of the transverse reinforcement, respectively; and a and l are the wave height of the perforated corrugated plate and embedded depth of the corrugated steel web, respectively.

5. Finite Element Analysis and Optimization

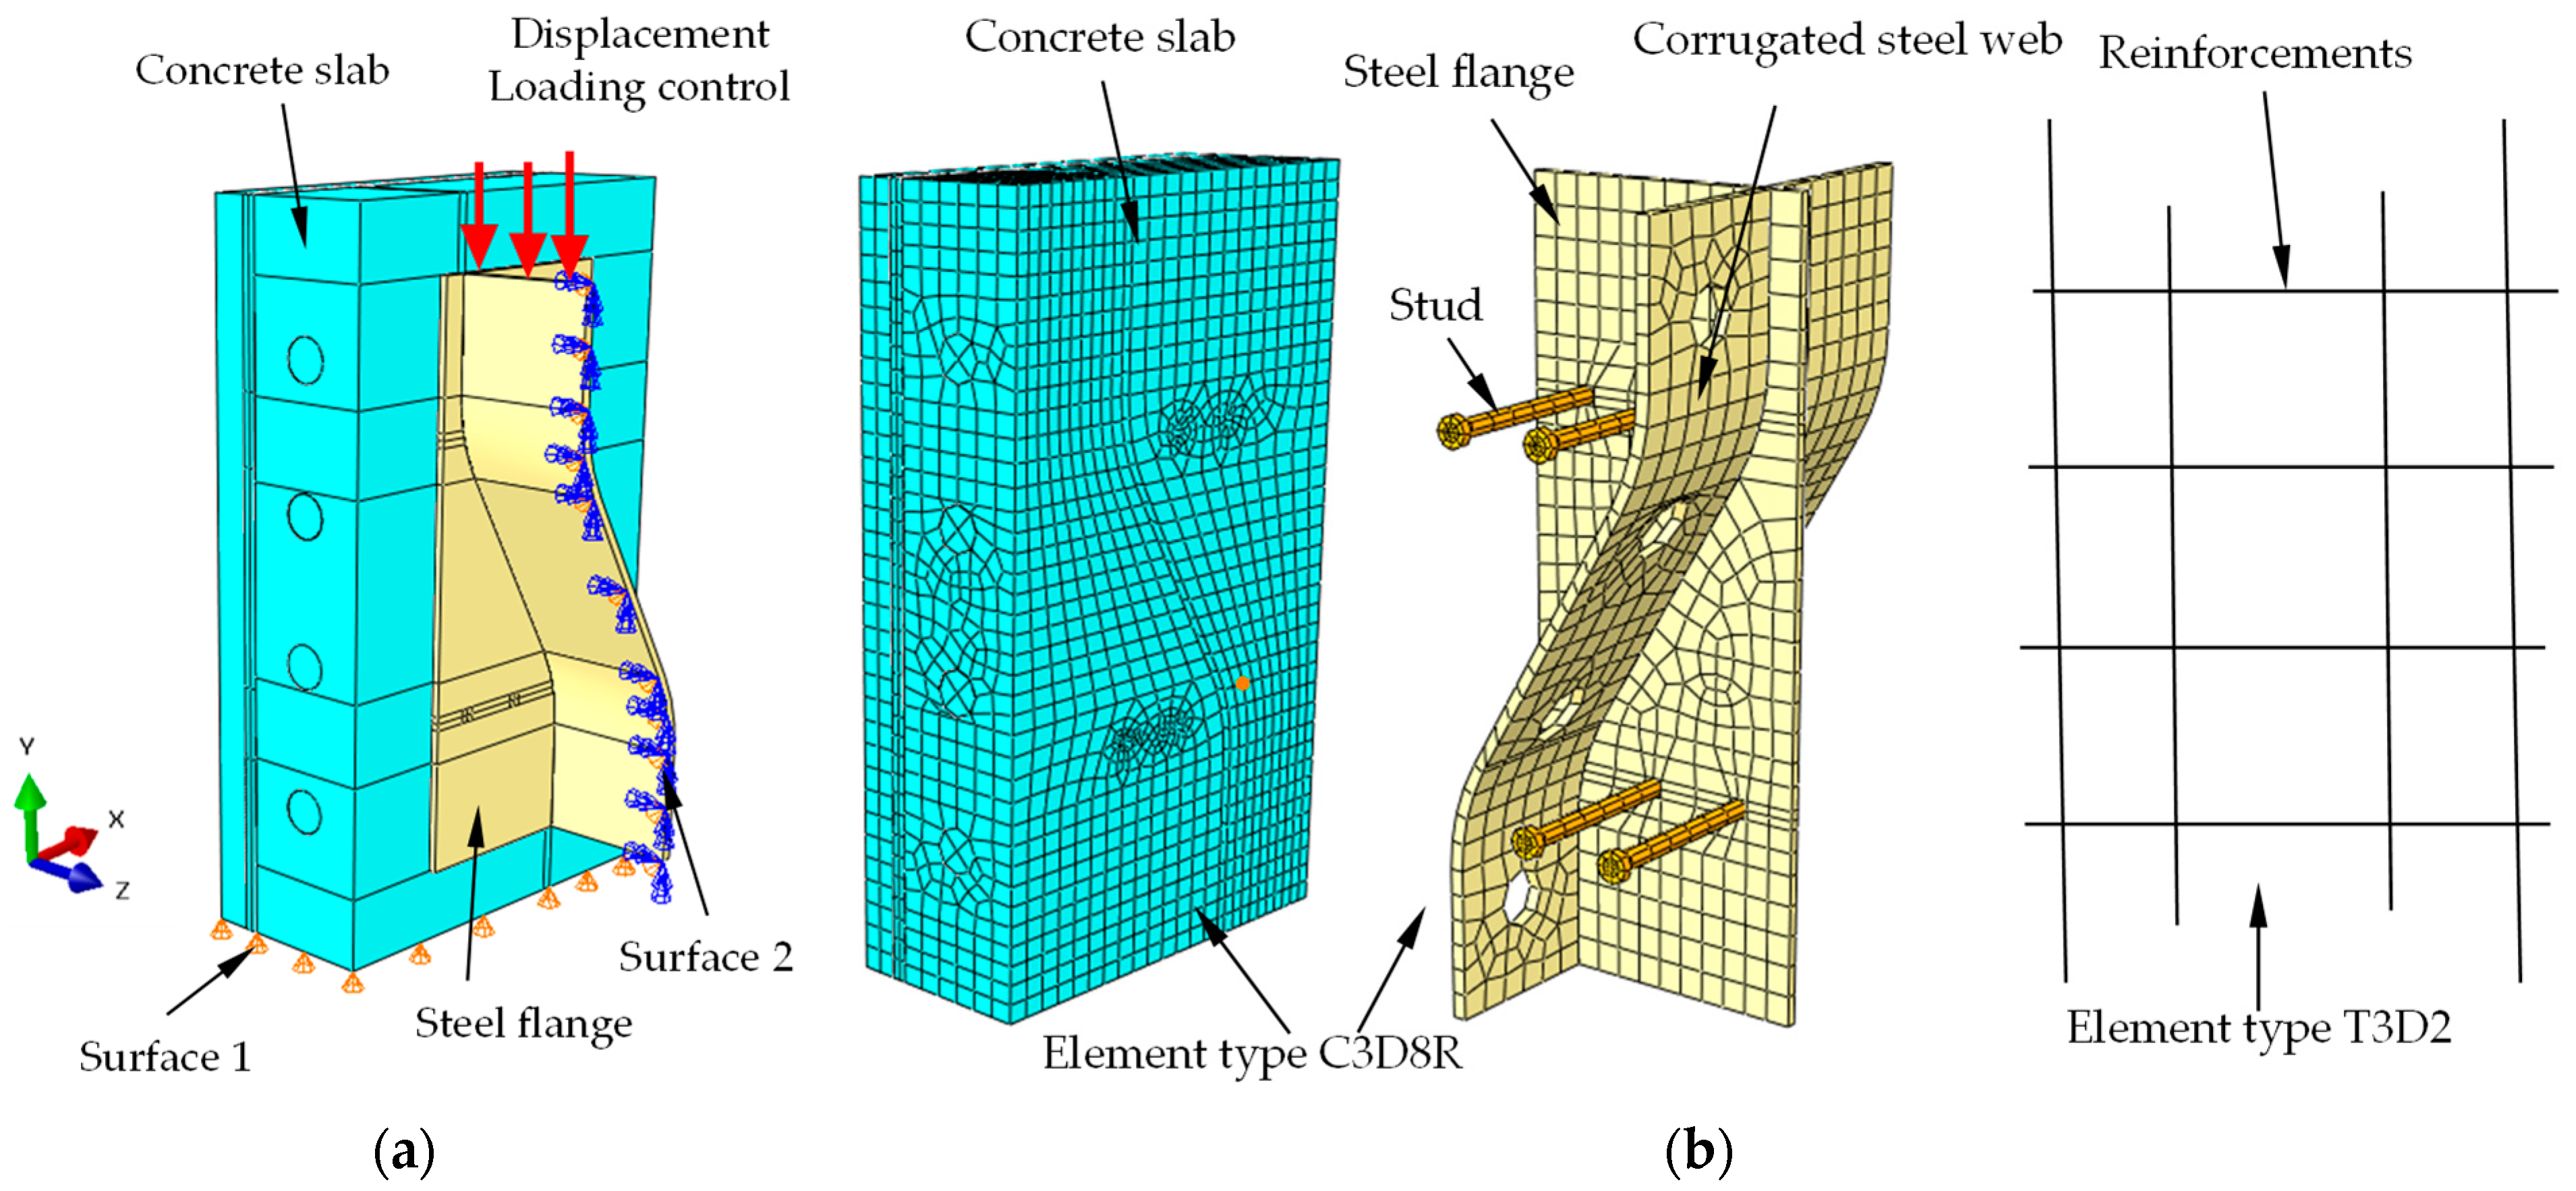
5.1. Element Type and Meshing

The nonlinear finite element (FE) analysis program ABAQUS 2021 was implemented to simulate the whole process of the push-out test. Considering the symmetric property of the test specimen, half of the push-out test sample was set up. The main components of the specimens, including embedded corrugated steel web, concrete slabs, reinforcing mesh, and reinforcing studs, were modeled. It was necessary to take into account the interaction between different components and the material nonlinearity. Different interactions, element types, boundary conditions, and mesh sizes were attempted to ensure the efficiency and reliability of the FE models.
To make the FEM more accurate, the three-dimensional eight-node reduced integration solid element (C3D8R) was used to model the reinforcing studs and concrete slabs as well as the embedded corrugated steel web. And the three-dimensional two-node truss element (T3D2) was applied for the reinforcements. After conducting a convergence test, for the purpose of balancing the calculation time and accuracy, the global mesh size was selected as 20 mm. In order to give a more precise forecast of the shear performance and failure mechanism of the SR-ESCF, the area around the holes of the integrated corrugated web and the stud were refined using the smaller mesh of 5 mm.

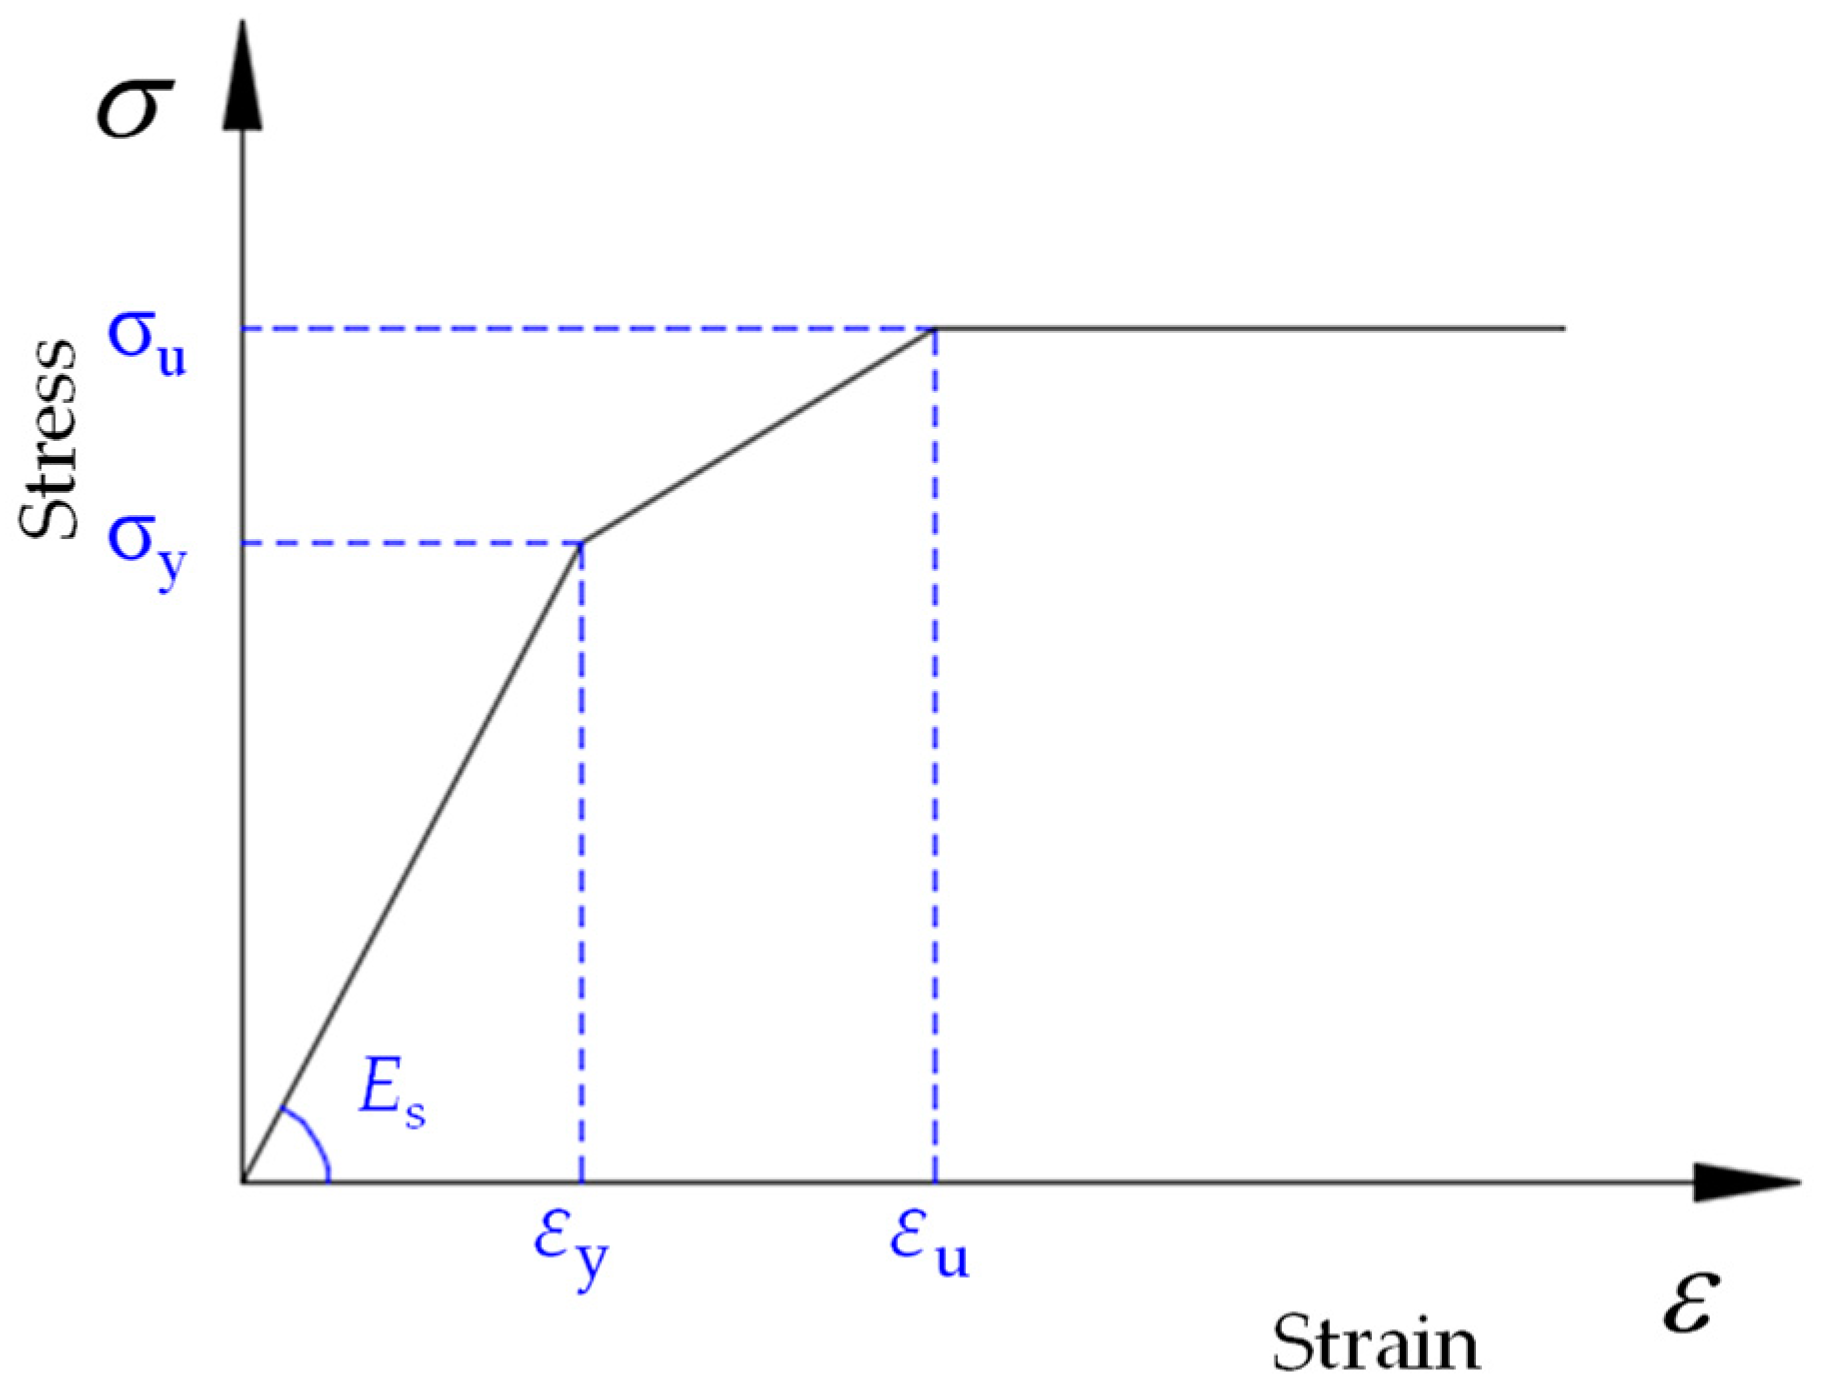
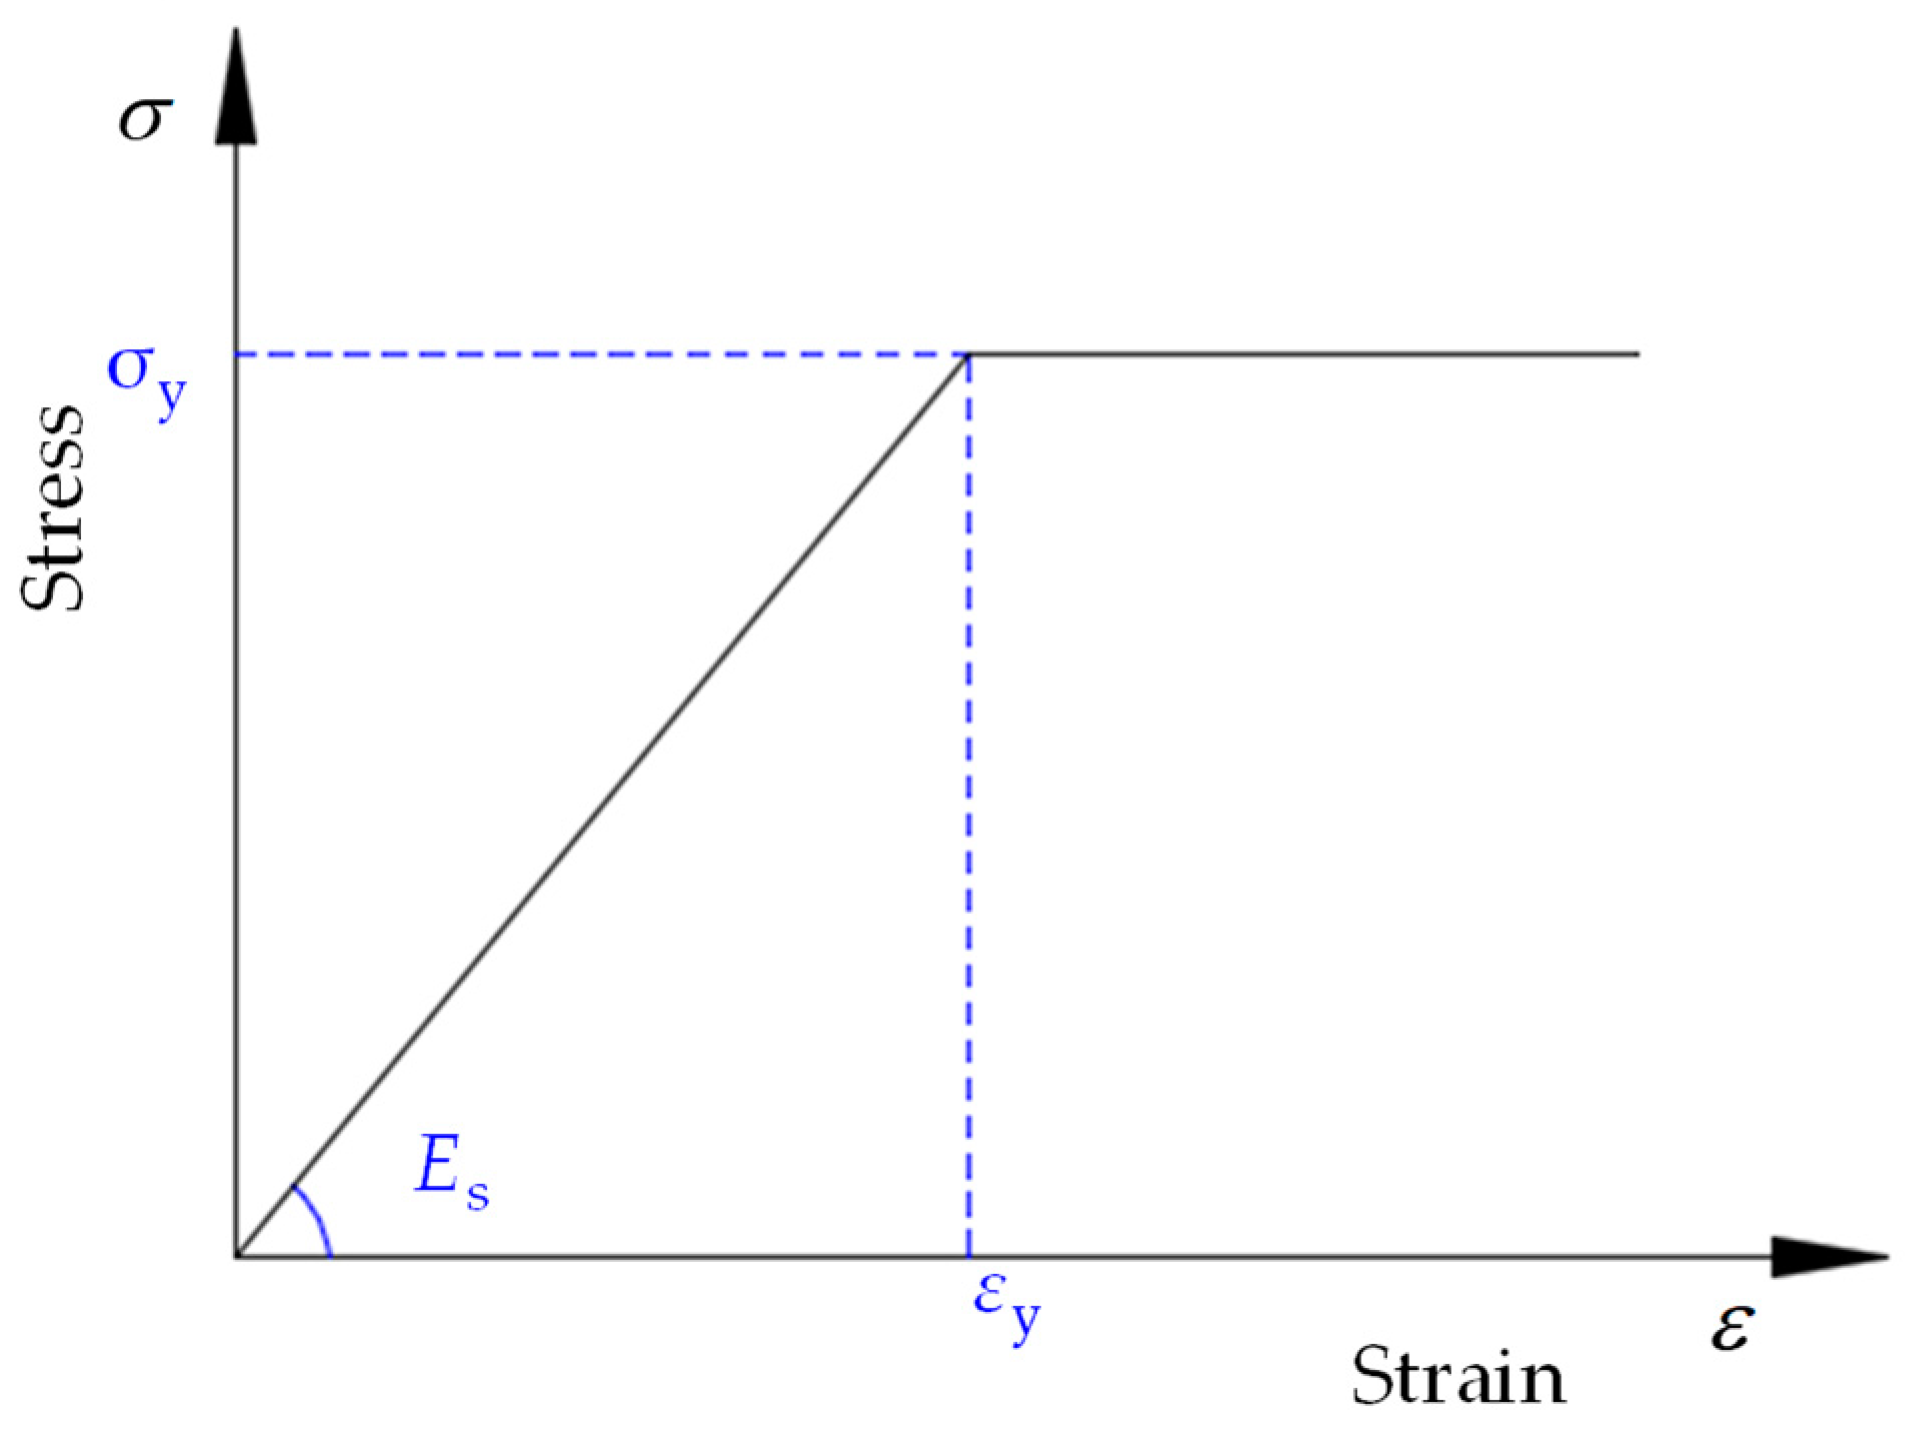
5.2. Material Properties

The nonlinear behavior of the concrete was represented by tensile stress–strain and uniaxial compressive curves, as displayed in Figure 11. When concrete is under compression, the stress and strain relationship of concrete is composed of three parts. The elastic stage with a linearly increasing stress–strain relationship is considered to be the initial stage, when the stress is less than 0.4 f ck , as presented by Equation (5).
σc = εEc
where fck = 0.8fcu; fcu denotes the cubic compressive strength of the concrete; and ε and Ec indicate the strain and Yong’s modulus of the concrete, respectively.
The plastic stage, represented by the second segment of the stress–strain curve, shows the nonlinear growth relationship, which increases from 0.4fck to the maximum stress fck, as shown in Equation (6).
σ c = k n n 2 1 + ( k 2 ) n f ck
where k = 1.1Ecεc/fck; n = ε/εc; σc denotes the stress of concrete; εc denotes the ultimate compressive strain of concrete; and the value of εc is taken as 0.0022.
The strain–stress curve for the tensile behavior can be divided into two halves. The tensile stress will, firstly, rise linearly with strain until the concrete reaches its maximum tensile strength. In the second stage, since the concrete cracks, unable to continue bearing load, the stress shows a linear decrease until it decreases to zero, as shown in Figure 11.
The tri-linear curve [37] was used in the stress–strain relationship of the steel part, as shown in Figure 12, which can be expressed as the following:
σ = E s ε                                                       ( ε ε y ) σ y + 0.01 E s ε ε y           ( ε y ε ε u ) σ u                                                             ( ε ε u )
where σu = 1.2σy; εu = 21εy; Es denotes the Young’s modulus of the steel; εu and εy are the ultimate strain and yield strain of the steel; and σu and σy are the ultimate stress and yield stress of the steel.
The ideal elastoplastic constitutive relation curves were used for the stress–strain relationship of the stud and rebar, as displayed in Figure 13, which can be expressed as the following:
σ = E s ε         ( ε ε y ) σ y             ( ε ε y )

5.3. Interaction and Boundary Conditions

The separate components including the embedded corrugated steel web, concrete slabs, and reinforcing studs were assembled, as can be seen from Figure 14. The boundary between the concrete slab and steel plate adopts face-to-face contact. The normal direction between the concrete slab and steel flange is hard contact, and the tangent direction is friction contact. It is assumed that the boundary between the concrete slab and the steel plate has a tangential friction coefficient of 0.3. Tie interaction was applied at the boundary of the reinforcing bolt and steel flange, as well as on the interface between the bolt and the hole in the concrete slab. Meanwhile, “embedded region” constraint was applied to the boundary between the reinforcement and concrete slab.
The symmetric plane, designated as Surface 2 in Figure 14a, received a symmetric boundary condition. For the nodes in Surface 2, the rotations among the transverse direction (X) and the vertical direction (Y) were restricted, as well as the displacement in thickness direction (Z). Surface 1 was also restrained to prohibit sliding of the concrete slab. To evenly distribute the shear stress, the displacement loading was delivered at the top position of the steel web.

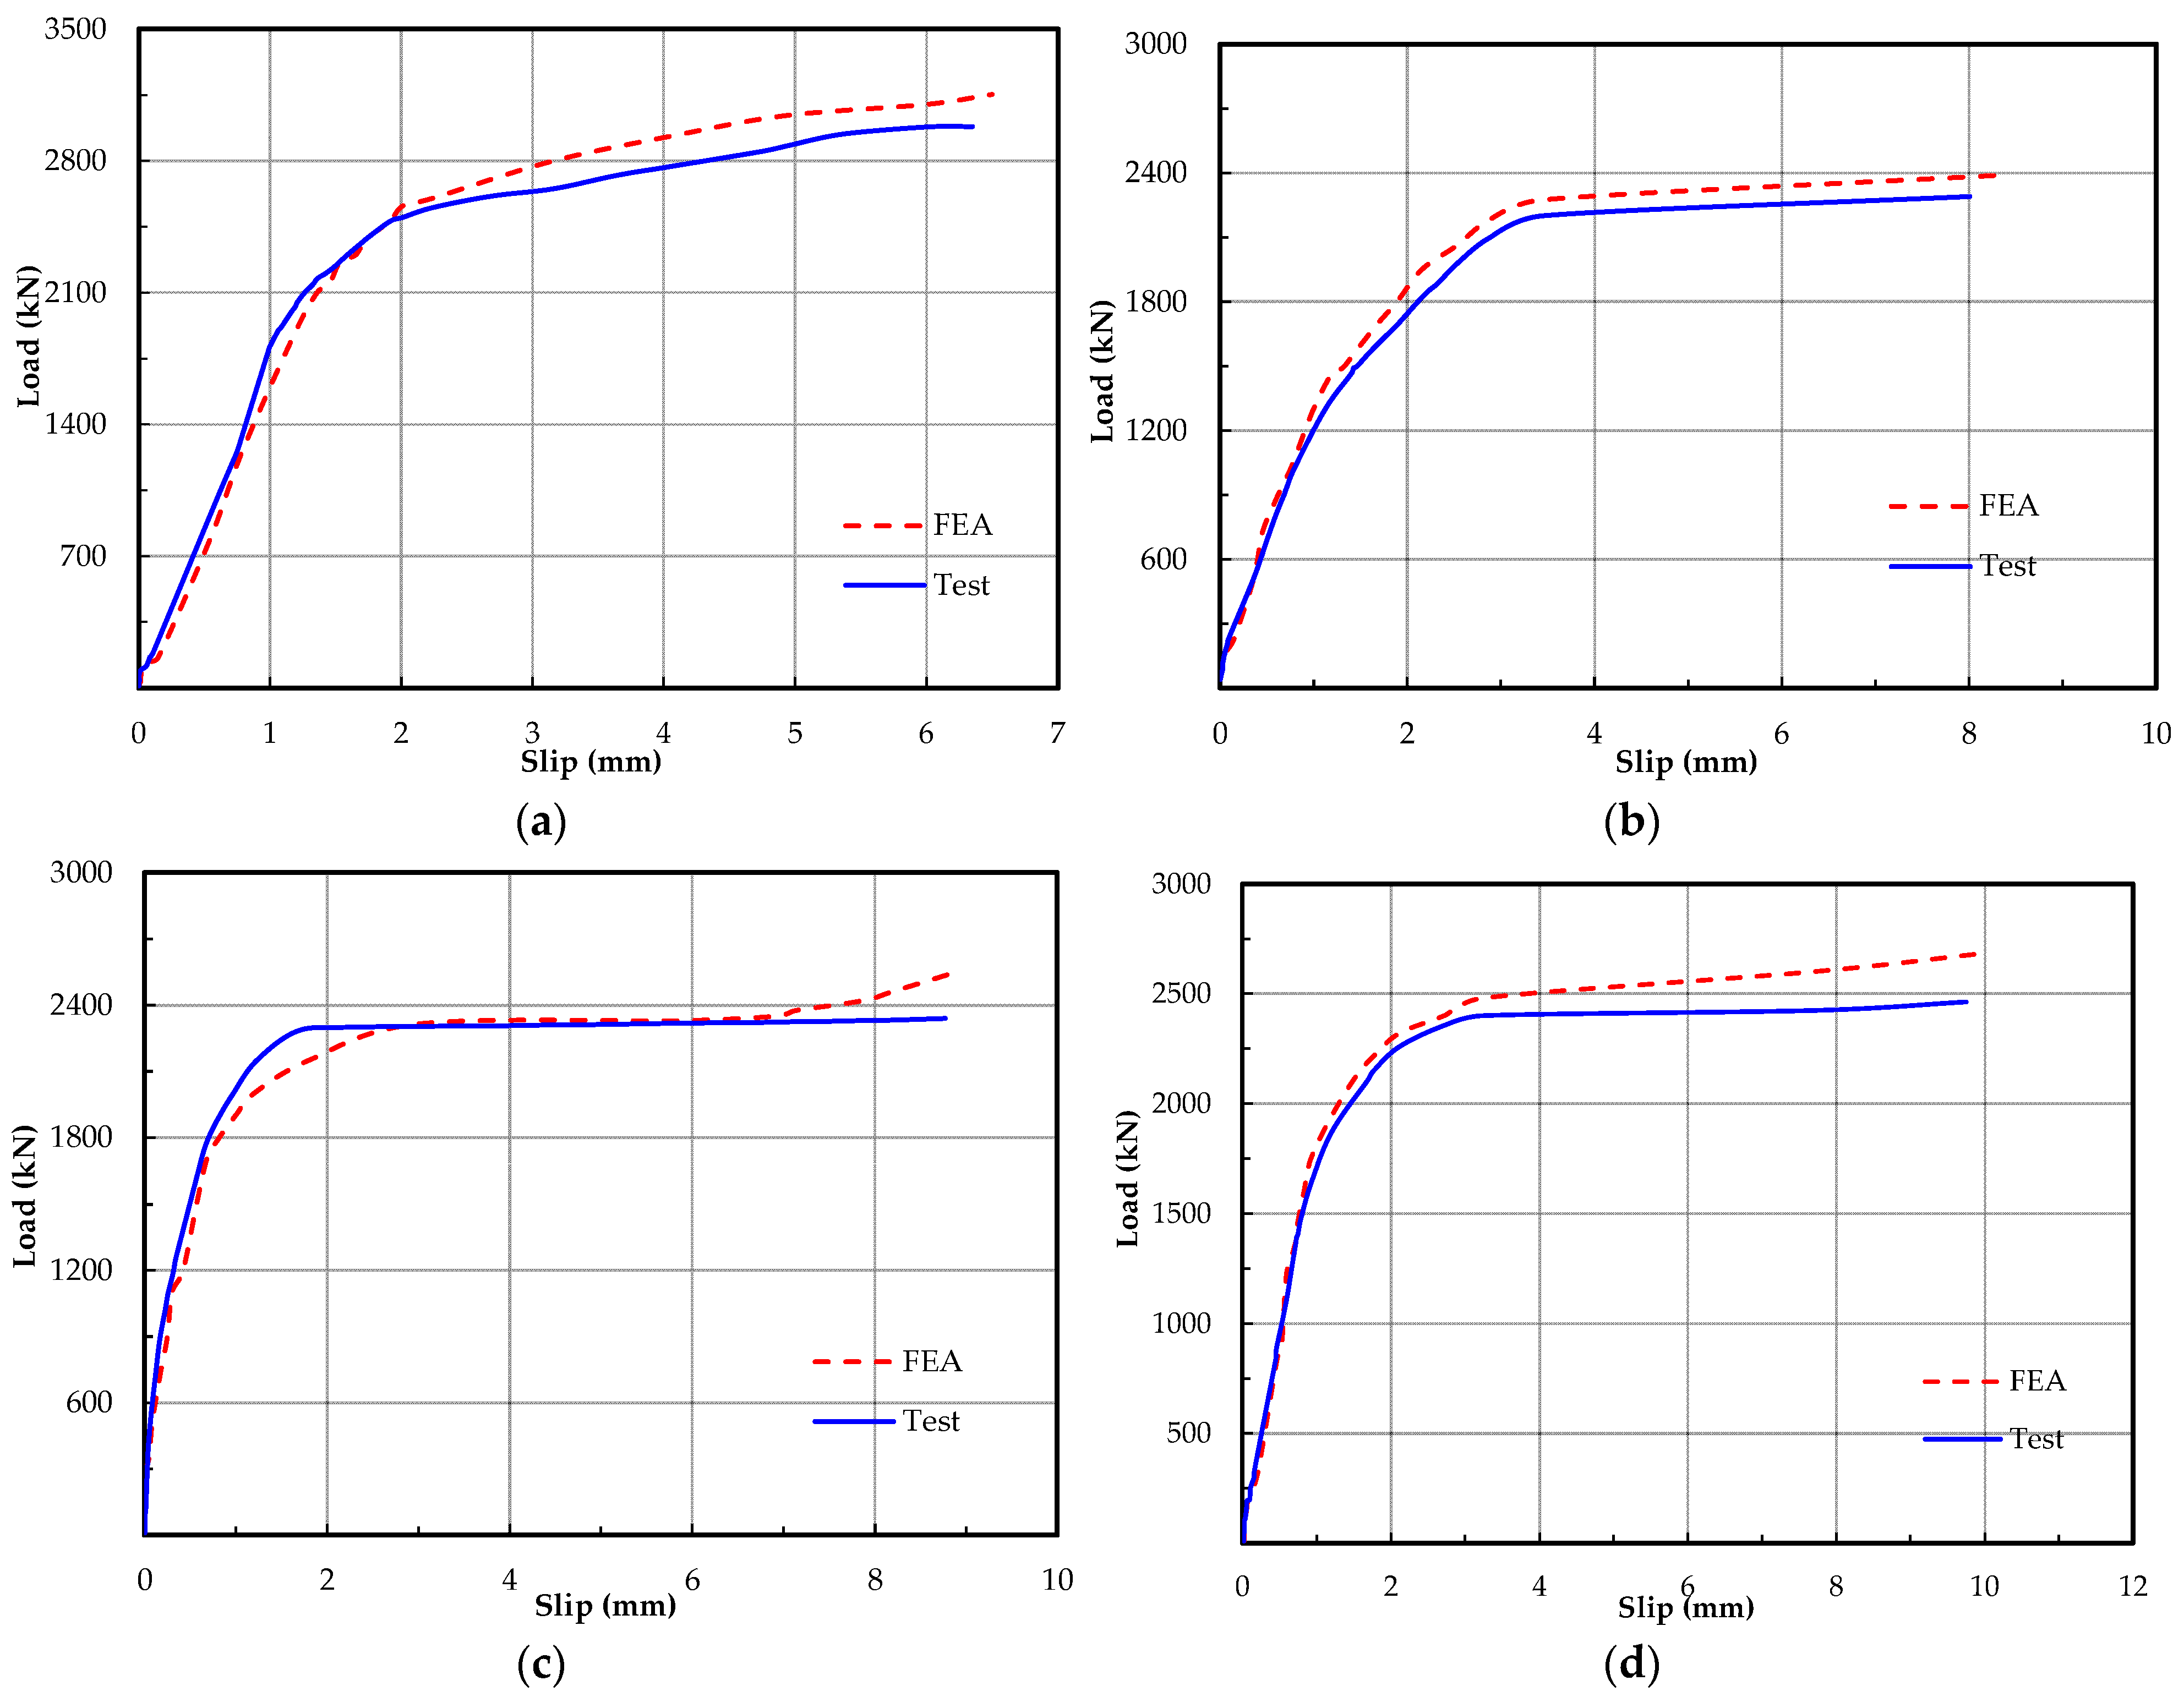
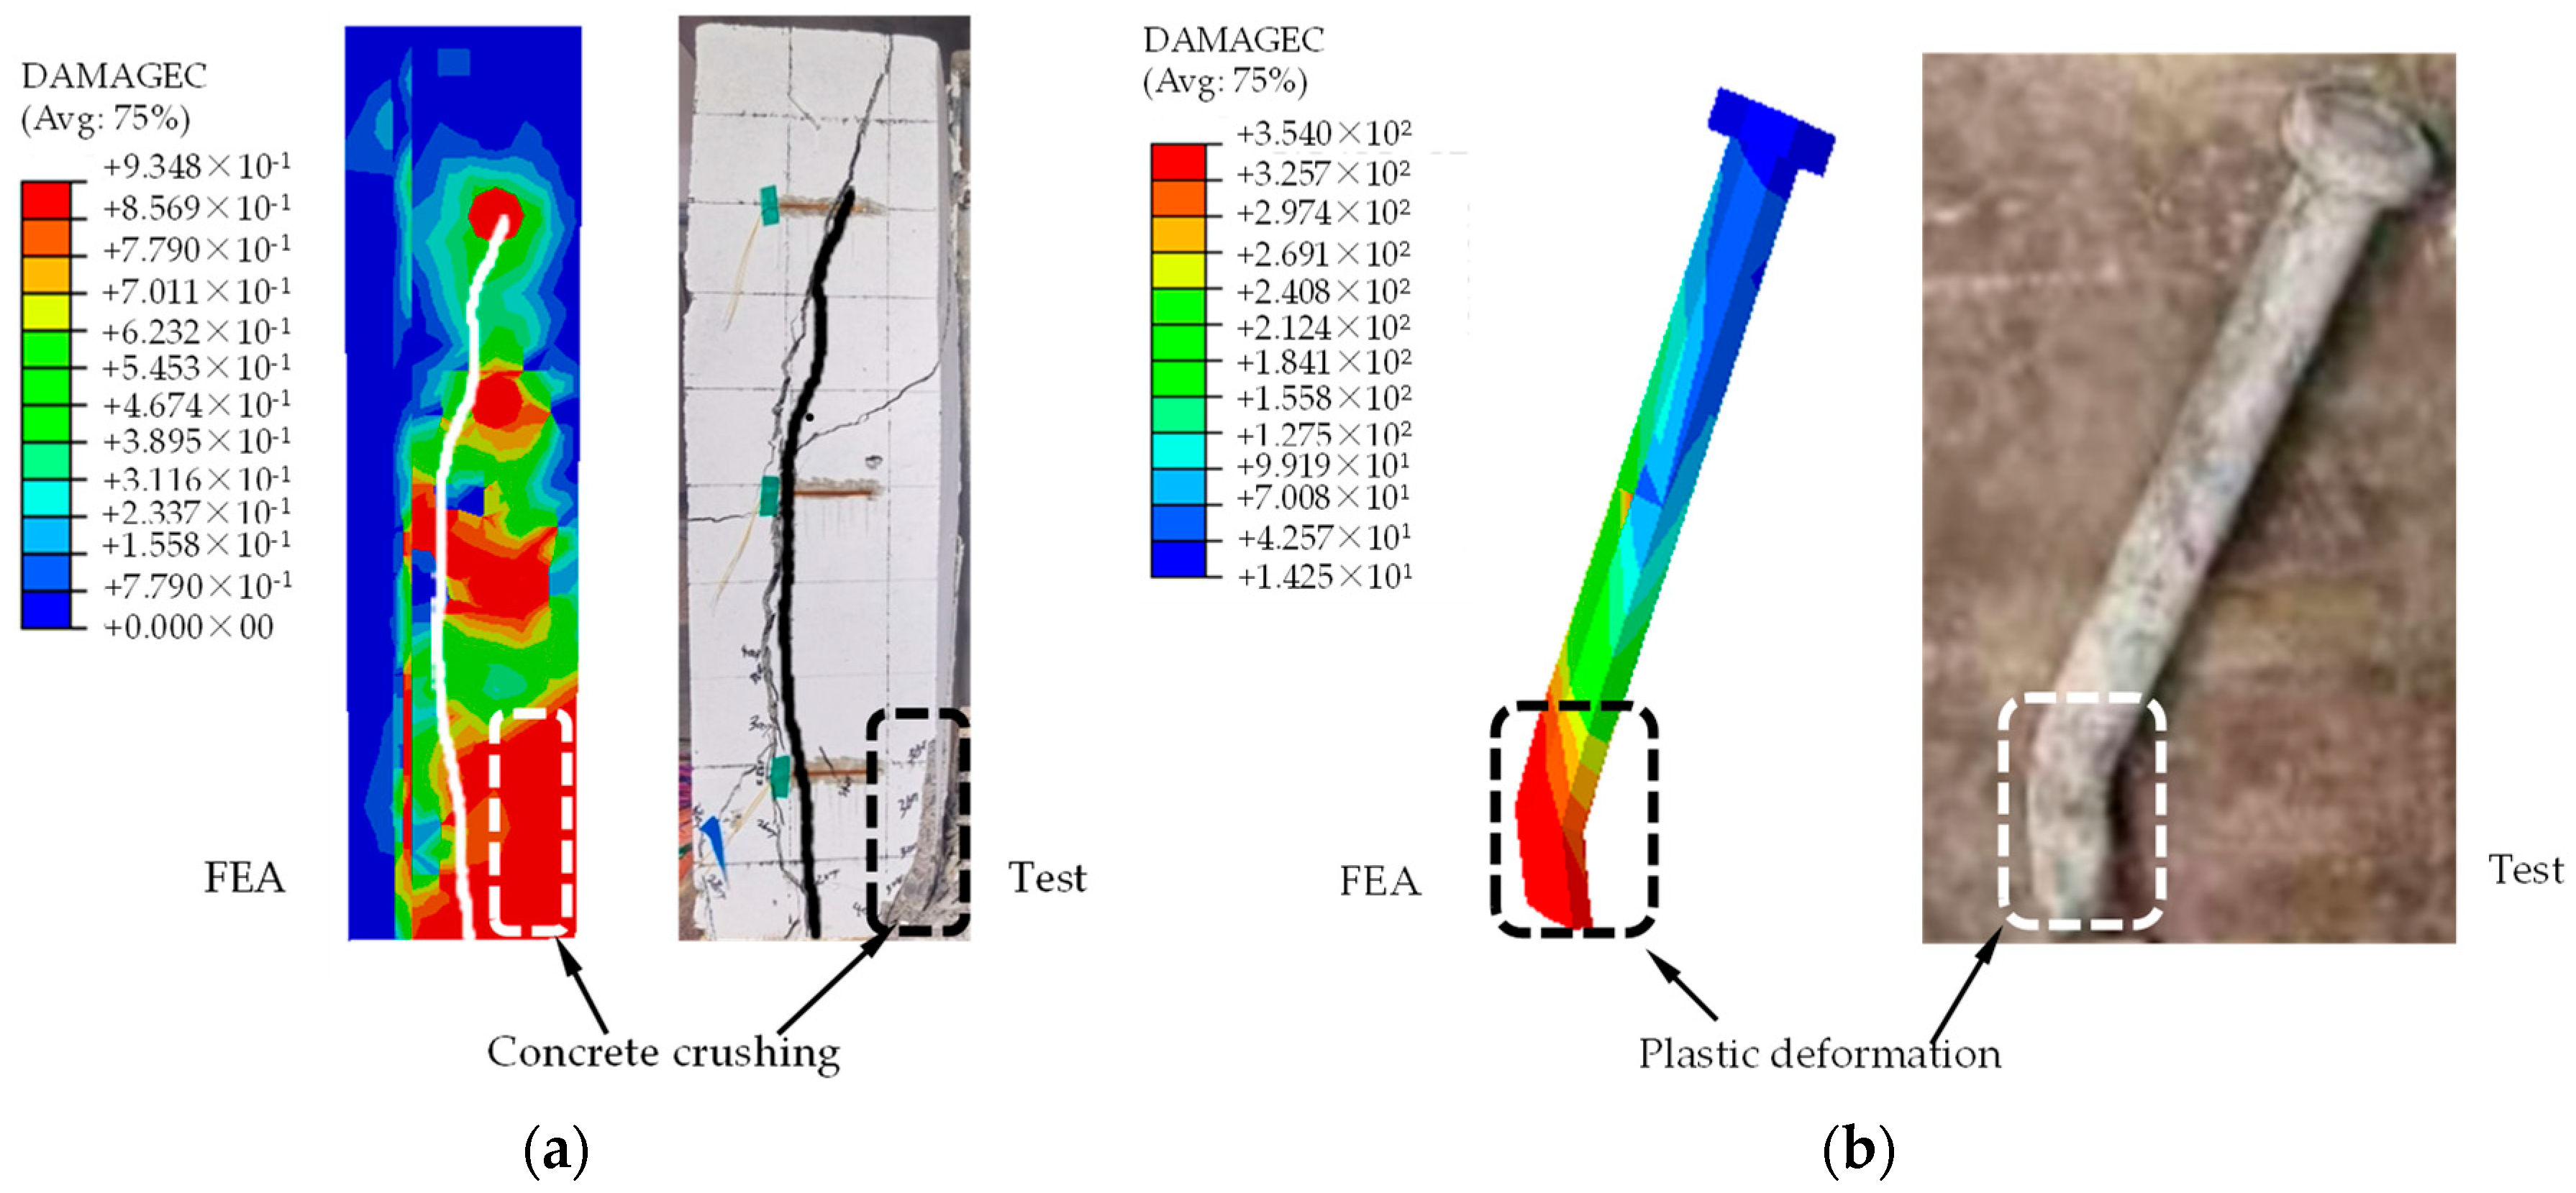
5.4. Verification of the FEM

The results of the shear capacity and load–slip curve of FEM were compared with those of the push-out test. The comparison of the several characteristic values and load–slip curves between the FEA and push-out test results can be seen from Table 5 and Figure 15, respectively. The slopes of the load–slip curve from the FEA are comparable to that from the push-out tests, demonstrating the feasibility of the FEM.
Table 5 shows that the FEA results averagely overestimated the ultimate shear capacity and the ultimate slip of the SR-ESCF with FEA-to-test ratio ranging from 1.03 to 1.10 and 1.01 to 1.09, respectively. The errors are basically within 10%. In addition, the failure modes and crack distribution from the FEA were similar to those of the test outcomes, as displayed in Figure 16. The location of the main crack and the compressive damage in the concrete slab were consistent with each other. Meanwhile, the shear failure of the studs simulated by FEM was nearly matched with the test results, as shown in Figure 16b. These comparisons validated the accuracy of the FEM further.

5.5. Optimization of the Shear Capacity of the Connector

The results indicate that the failure of SR-ESCFs is mainly caused by local buckling and cracking of the concrete flange. The reinforcing effect of the studs on the flange is not obvious for a thin steel flange because of the local buckling of the flange, such as in Specimens ESCR-SR1 and ESCR-SR8. In order to optimize the reinforcing effect on the shear capacity and the failure mode of the SR-ESCF, two additional studs were added for Specimens ESCF-SR1 and ESCF-SR8.
The two additional studs are welded on the steel flange near the original studs of the Specimens ESCF-SR1 and ESCF-SR8 to improve the lateral stiffness of the flange. The other parameters remained the same as the test specimen. The optimized layout of the studs on the flange is displayed in Figure 17. Table 6 shows the ultimate shear strength and failure modes of the optimal ESCF-SR1 (ESCF-OSR1), as well as the optional ESCF-SR8 (ESCF-OSR8).
The load–slip curves of the optional stud-reinforced embedded shear connector with flanges and SR-ESCF are compared in Figure 18. The shear capacity of ESCF-OSR1 (Figure 18a) was increased by 12.2% from 2027 kN to 2268 kN by adding the two studs. The shear capacity of ESCF-OSR8 (Figure 18b) was increased by 15.2% from 2050 kN to 2362 kN by adding the two studs. It can be concluded that the shear-bearing capacity of the SR-ESCF could be significantly increased by adding studs on the steel flange near the original studs. This is attributable to the fact that the reinforcing studs are effective in preventing the local buckling of the steel flange under shear force, which results in the improvement of initial stiffness and load-bearing capacity.

6. Concluding Remarks

An innovative stud-reinforced embedded shear connector with flange (SR-ESCF) was proposed. The failure mechanism of the SR-ESCF under shear force and the main factors influencing shear properties of the connector were studied experimentally, numerically, and theoretically. Moreover, test results were used to validate the FEM and calculation equation for the shear strength of an SR-ESCF. From the present studies, the major conclusions are summarized as follows:
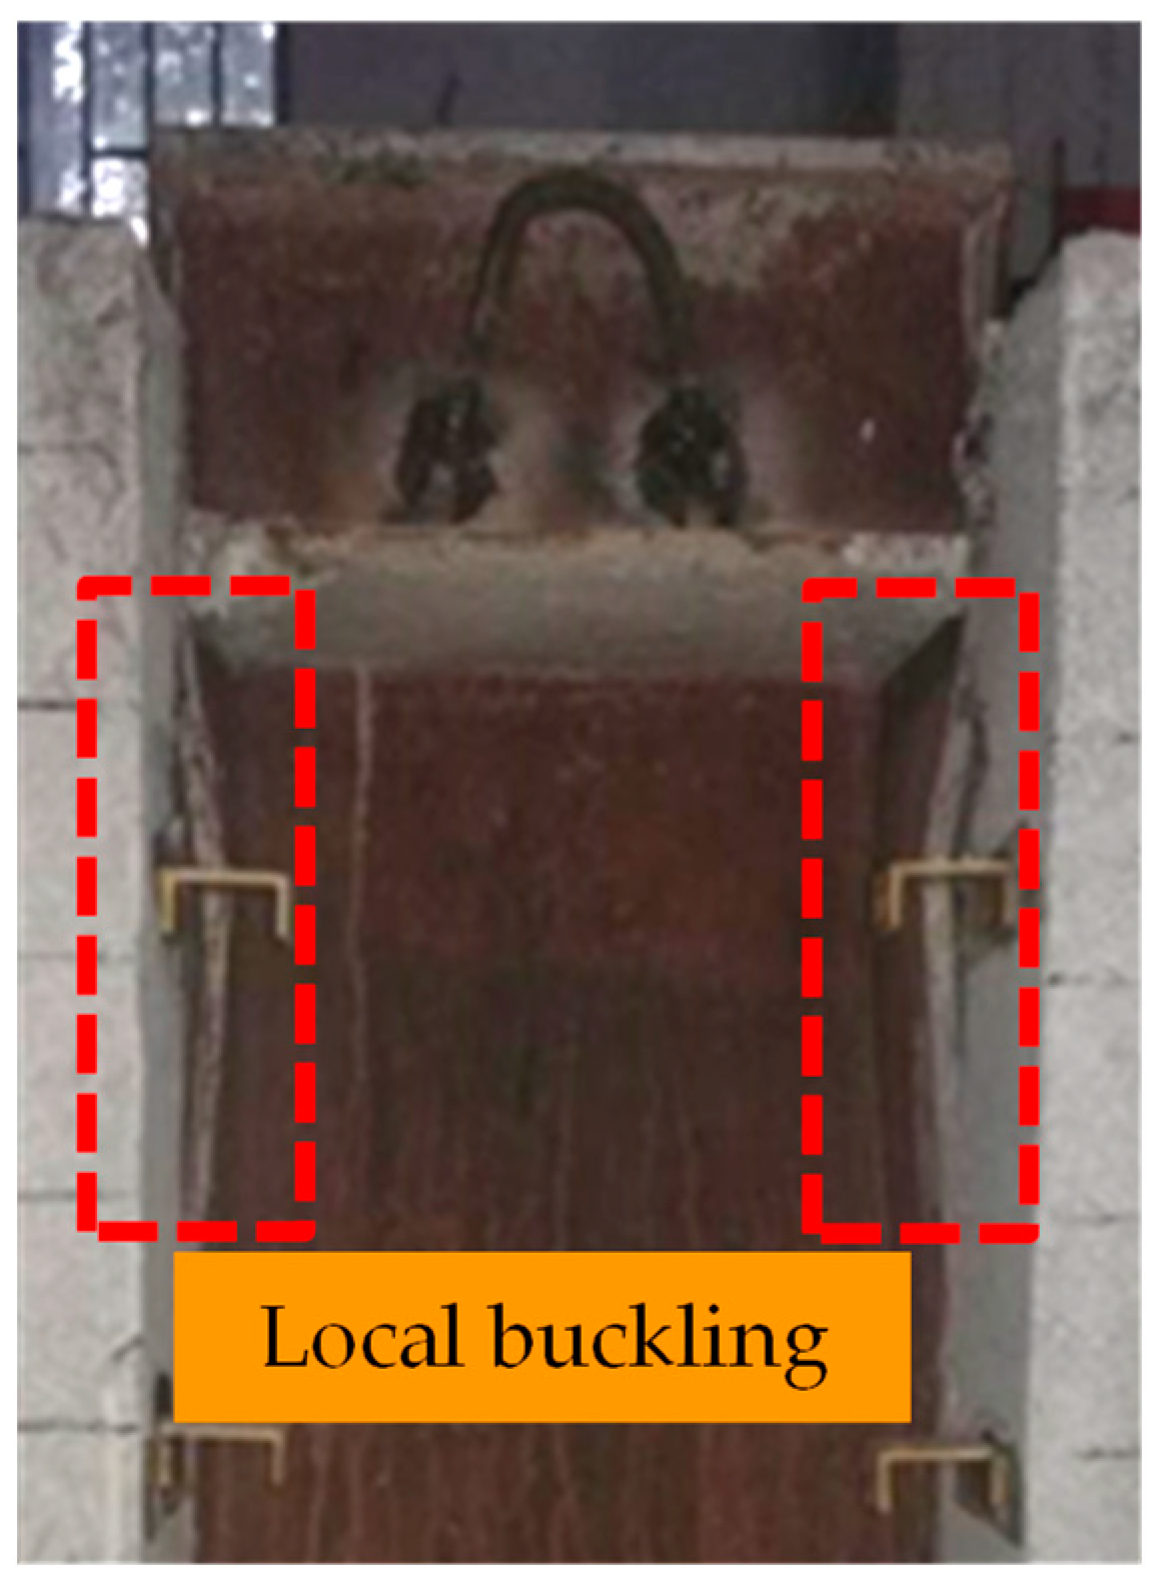
  • According to the push-out tests, the failure modes of the SR-ESCF are mainly controlled by local buckling and the splitting of the concrete, which were characterized as the local buckling of flange around the welded stud and the cracks developing along the corrugated web on the concrete slab, respectively.
  • With the studs welded at the flange, the SR-ESCF exhibited larger shear stiffness and shear capacity than the ESCF, which were increased by 17% and 15%, respectively. Moreover, the head studs prevented local buckling of the steel flange. The number of the studs should be adjusted to enhance the shear capability when the SR-ESCF is designed with a thin steel flange.
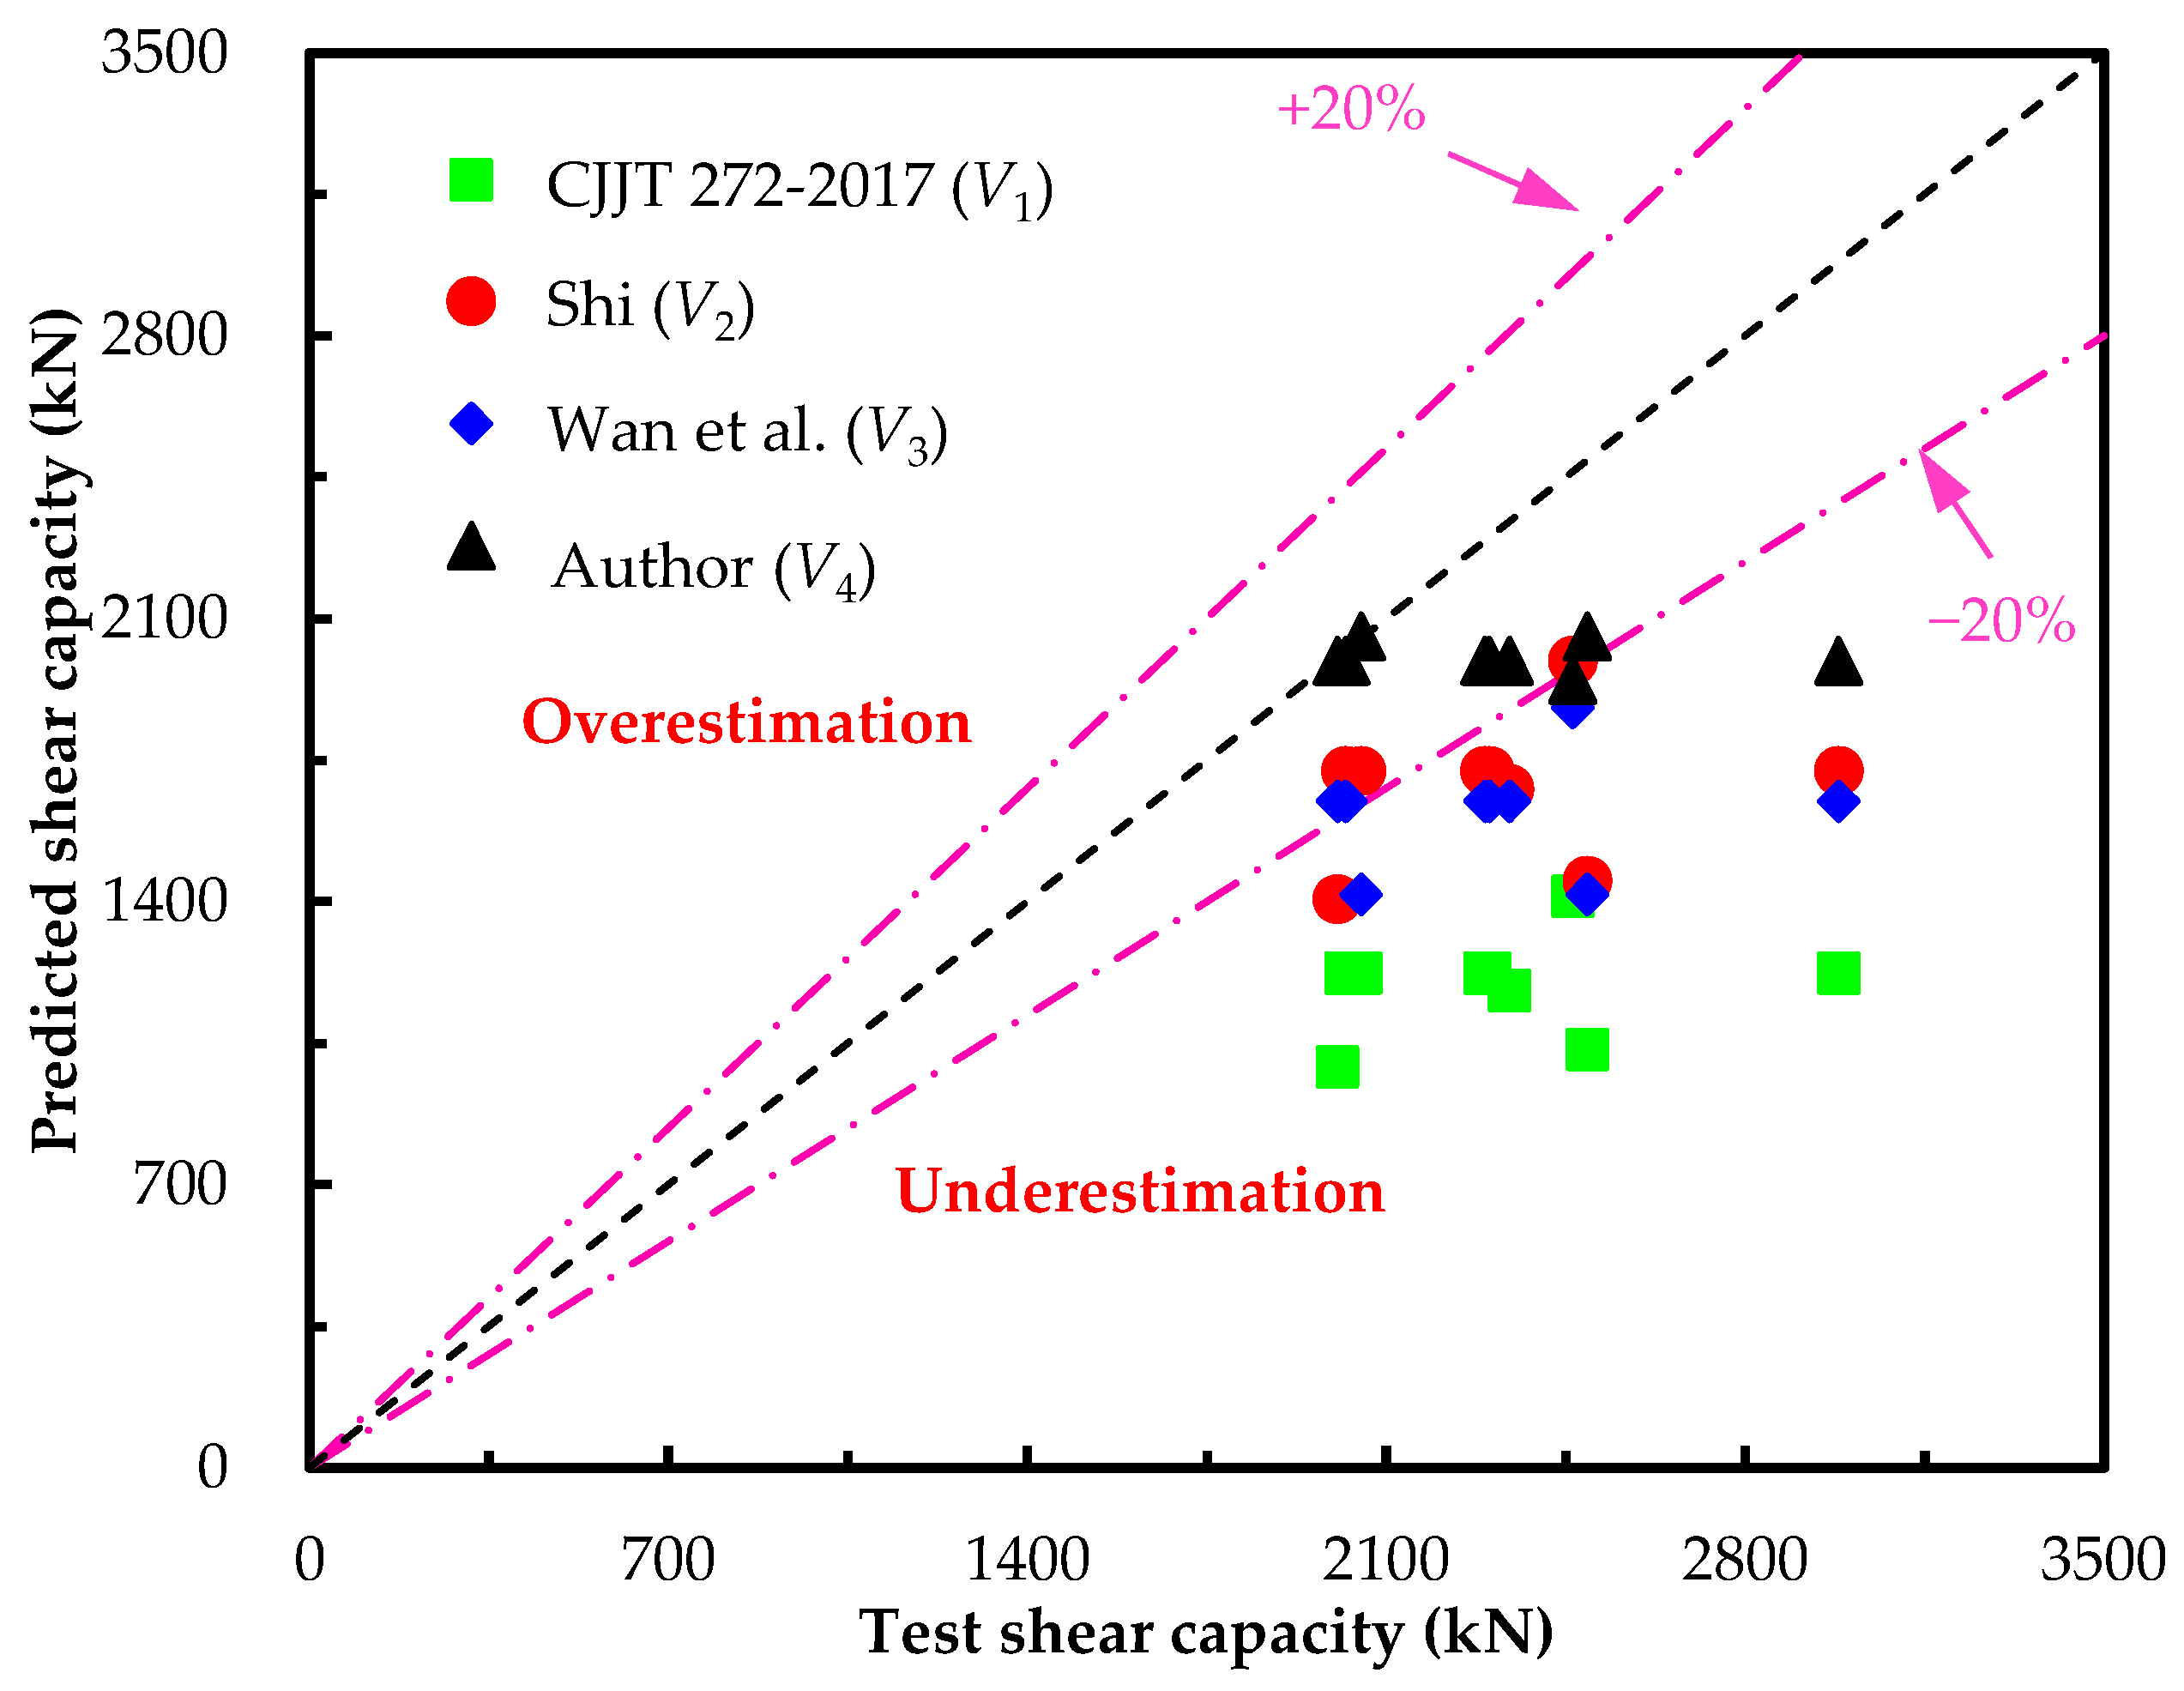
  • According to the parametric analysis, the reinforcing stud, the embedding depth of web, and the width-to-thickness ratio of the flange have a significant effect on the shear strength of the SR-ESCF. However, the thickness of web and the diameter of combined rebar have a negligible effect. The proposed design formula for the shear capacity of the SR-ESCF is consistent with the test results, with the mean value of the predicted results to test results ratio and the variation coefficient being 0.87 and 0.13, respectively. However, the proposed equation was only validated by limited test data, and further validations are still necessary.
  • The result of FEM including the ultimate shear strength, failure modes, and load–slip curves were good with the push-out test results. Moreover, the shear capacity of the connector was increased by about 15% by optimizing the layout of the studs. The reinforcing studs exhibited a great impact on the failure mode and shear capacity of the SR-ESCF, which changed the failure mode of the SR-ESCF from local buckling to concrete-splitting crack.

Author Contributions

Z.Z.: Methodology, Conceptualization, Investigation, Writing—review and editing, Funding acquisition; W.J.: Conceptualization, Software, Writing—original draft, Writing—review and editing; E.D.: Conceptualization, Software, Supervision, Funding acquisition; C.Y.: Investigation, Writing—review and editing; W.W.: Software, Supervision; C.D.: Investigation, Writing—review and editing; L.Z.: Investigation, Writing—review and editing; S.W.: Software, Supervision. All authors have read and agreed to the published version of the manuscript.

Funding

This work was graciously supported by the National Natural Science Foundation of China (Nos. 52378206, 51908511 and 51478437) and the Transportation Science and Technology Plan Project of Henan Province (Nos. 2020J-2-7 and 2021J3).

Data Availability Statement

The data presented in this study are available on request from the authors. The data are not publicly available due to privacy.

Conflicts of Interest

Author Weidong Wan was employed by the company CCCC Second Highway Consultants Co., Ltd. Author Changzhi Duan was employed by the company Henan D.R. Construction Group Steel Structure Co., Ltd. Authors Lian Zhang and Shibo Wang were employed by the company Zhengzhou Urban Construction Group Investment Co., Ltd. The remaining authors declare that the research was conducted in the absence of any commercial or financial relationships that could be construed as a potential conflict of interest.

References

  1. Deng, W.; Liu, D.; Xiong, Y.; Zhang, J. Experimental study on asynchronous construction for composite bridges with corrugated steel webs. J. Constr. Steel Res. 2019, 157, 93–102. [Google Scholar] [CrossRef]
  2. Huang, D.; Wei, J.; Liu, X.; Xiang, P.; Zhang, S. Experimental study on long-term performance of steel-concrete composite bridge with an assembled concrete deck. Constr. Build. Mater. 2019, 214, 606–618. [Google Scholar] [CrossRef]
  3. Zhou, Z.; Wang, Y.; Zhai, X. Tensile resistance of novel interlocked angle connectors used in steel-concrete-steel sandwich structures. Constr. Build. Mater. 2022, 341, 127774. [Google Scholar] [CrossRef]
  4. Zhuang, B.; Liu, Y. Study on the composite mechanism of large Rubber-Sleeved Stud connector. Constr. Build. Mater. 2019, 211, 869–884. [Google Scholar] [CrossRef]
  5. Zou, Y.; Qin, F.; Zhou, J.; Zheng, Z.; Huang, Z.; Zhang, Z. Shear behavior of a novel bearing-shear connector for prefabricated concrete decks. Constr. Build. Mater. 2021, 268, 121090. [Google Scholar] [CrossRef]
  6. Cui, C.; Song, L.; Liu, R.; Liu, H.; Yu, Z.; Jiang, L. Shear behavior of stud connectors in steel bridge deck and ballastless track structural systems of high-speed railways. Constr. Build. Mater. 2022, 341, 127744. [Google Scholar] [CrossRef]
  7. He, Y.; Guo, S.; Wang, L.; Yang, Y.; Xiang, Y. Experimental and numerical analysis of grouped stud shear connectors embedded in HFRC. Constr. Build. Mater. 2020, 242, 118197. [Google Scholar]
  8. Xu, X.; Zhou, X.; Liu, Y. Behavior of rubber-sleeved stud shear connectors under fatigue loading. Constr. Build. Mater. 2020, 244, 118386. [Google Scholar] [CrossRef]
  9. Kruszewski, D.; Wille, K.; Zaghi, A. Push-out behavior of headed shear studs welded on thin plates and embedded in UHPC. Eng. Struct. 2018, 173, 429–441. [Google Scholar] [CrossRef]
  10. Duan, M.; Zou, X.; Bao, Y.; Li, G.; Chen, Y.; Li, Z. Experimental investigation of headed studs in steel-ultra-high performance concrete (UHPC) composite sections. Eng. Struct. 2022, 270, 114875. [Google Scholar] [CrossRef]
  11. Wang, J.; Qi, J.; Tong, T.; Xu, Q.; Xiu, H. Static behavior of large stud shear connectors in steel-UHPC composite structures. Eng. Struct. 2019, 178, 534–542. [Google Scholar] [CrossRef]
  12. Liu, Y.; Zeng, D.; Cao, L.; Lu, N.W. Experimental Study on an Innovative Shear Connector in Steel-UHPC Composite Structure. Adv. Civil Eng. 2021, 2021, 6643291. [Google Scholar] [CrossRef]
  13. Hu, Y.; Yin, H.; Ding, X.; Li, S.; Wang, J. Shear behavior of large stud shear connectors embedded in ultra-high-performance concrete. Adv. Struct. Eng. 2020, 23, 3401–3414. [Google Scholar] [CrossRef]
  14. Deng, W.; Hu, K.; Liu, D.; Zhao, X.; Zha, S.; Zhang, J. Experimental Study and Calculation Method of Shear Capacity for Cluster Studs Connector. China J. Highw. Transp. 2022, 35, 194–204. [Google Scholar]
  15. Sedghi, Y.; Zandi, Y.; Shariati, M.; Ahmadi, E.; Azar, V.; Toghroli, A.; Safa, M.; Mohamad, E.; Khorami, M.; Wakil, K. Application of ANFIS technique on performance of C and L shaped angle shear connectors. Smart Struct. Syst 2018, 22, 335–340. [Google Scholar]
  16. Shariati, M.; Tahmasbi, F.; Mehrabi, P.; Bahadori, A.; Toghroli, A. Monotonic behavior of C and L shaped angle shear connectors within steel-concrete composite beams: An experimental investigation. Steel Compos. Struct. 2020, 35, 237–247. [Google Scholar]
  17. Kim, K.; Han, O.; Choi, J.; Kim, S. Hysteretic performance of stubby Y-type perfobond rib shear connectors depending on transverse rebar. Constr. Build. Mater. 2019, 200, 64–79. [Google Scholar] [CrossRef]
  18. Zou, Y.; Di, J.; Zhou, J.; Zhang, Z.; Li, X.; Zhang, H.; Qin, F. Shear behavior of perfobond connectors in the steel-concrete joints of hybrid bridges. J. Constr. Steel Res. 2020, 172, 106217. [Google Scholar] [CrossRef]
  19. Oguejiofor, E.; Hosain, M. Numerical analysis of push-out specimens with perfobond rib connectors. Comput. Struct. 1997, 62, 617–624. [Google Scholar] [CrossRef]
  20. Oguejiofor, E.; Hosain, M. A parametric study of perfobond rib shear connectors. Can. J. Civil Eng. 1994, 21, 614–625. [Google Scholar] [CrossRef]
  21. Oguejiofor, E.; Hosain, M. Tests of full-size composite beams with perfobond rib connectors. Can. J. Civil Eng. 1995, 22, 80–92. [Google Scholar] [CrossRef]
  22. Liu, Y.; Wang, S.; Xin, H.; Liu, Y. Evaluation on out-of-plane shear stiffness and ultimate capacity of perfobond connector. J. Constr. Steel Res. 2020, 167, 105850. [Google Scholar] [CrossRef]
  23. Wang, S.; He, J.; Liu, Y.; Li, C.; Xin, H. Shear capacity of a novel joint between corrugated steel web and concrete lower slab. Constr. Build. Mater. 2018, 163, 360–375. [Google Scholar] [CrossRef]
  24. Nemeth, G.; Jager, B.; Kovesdi, B.; Kovacs, N. Experimental investigation of steel-concrete composite push-out tests with embedded corrugated web. Adv. Struct. Eng. 2022, 25, 2332–2347. [Google Scholar] [CrossRef]
  25. Novak, B.; Roehm, J. The use of corrugated steel webs in bridge constructions—Load bearing behaviour of concrete dowels in combination with corrugated steel webs under longitudinal shear. Beton Stahlbetonbau 2009, 104, 562–569. [Google Scholar]
  26. Roehm, J.; Novak, B. Behavior of Composite Structures with Corrugated Steel Webs under Transverse Bending using Concrete Dowels. Beton Stahlbetonbau 2010, 105, 176–185. [Google Scholar]
  27. Kanchanadevi, A.; Ramanjaneyulu, K.; Gandhi, P. Shear resistance of embedded connection of composite girder with corrugated steel web. J. Constr. Steel Res. 2021, 187, 106994. [Google Scholar] [CrossRef]
  28. Cheng, C.; Wan, S.; Song, A. Experimental and numerical study on the mechanical properties of embedded double-row-pins connectors. Structures 2022, 35, 214–232. [Google Scholar] [CrossRef]
  29. Shi, J. Experimental Study on Shear Bearing Capacity of Embedded Connector with Flange Plate; Zhengzhou University: Zhengzhou, China, 2019. (In Chinese) [Google Scholar]
  30. GB/T 50081-2002; Standard for Test Methods of Mechanical Properties of Ordinary Concrete. Standards Press of China: Beijing, China, 2003. (In Chinese)
  31. GB/T 228-2002; Metallic Materials-Tensile Testing at Ambient Temperature. Standards Press of China: Beijing, China, 2002. (In Chinese)
  32. EUROCODE 4; EN 1994-1-1; Design of Composite Steel and Concrete Structures Part 1.1 General Rules and Rules for Buildings. EN: Brussels, Belgium, 2005.
  33. Deng, E.; Zhang, Z.; Zhang, C.; Tang, Y.; Wang, W.; Du, Z.; Gao, J. Experimental study on flexural behavior of UHPC wet joint in prefabricated multi-girder bridge. Eng. Struct. 2023, 275, 115314. [Google Scholar] [CrossRef]
  34. Gu, J.; Liu, D.; Deng, W.; Zhang, J. Experimental study on the shear resistance of a comb-type perfobond rib shear connector. J. Constr. Steel Res. 2019, 158, 279–289. [Google Scholar] [CrossRef]
  35. CJJT 272-2017; Technical Standard of Composite Girder Bridge with Corrugated Steel Webs. China Building Industry Press: Beijing, China, 2017. (In Chinese)
  36. Li, S.; Wan, S. Push-out test of the perforated corrugated plate shear connectors in steel-concrete composite structure. J. Chang. Univ. (Nat. Sci. Ed.) 2015, 2, 75–82. (In Chinese) [Google Scholar]
  37. Wan, Q.; Xue, D.; Pan, Z.; Ma, W. Nonlinear finite element analysis of multi-stud shear connectors. J. Jiangsu Univ. Sci. Technol. (Nat. Sci. Ed.) 2019, 5, 104–109. (In Chinese) [Google Scholar]
Figure 1. Different types of shear connector with corrugated steel web in composite girder: (a) stud connector; (b) PBL connector; (c) angle steel connector; (d) embedded connector with flange.
Buildings 14 00632 g001
Figure 2. Local buckling of the flange of ESCF [29].
Buildings 14 00632 g002
Figure 3. Configuration of stud-reinforced embedded shear connector with flange.
Buildings 14 00632 g003
Figure 4. Details of the test specimens (unit: mm): (a) specimen configuration; (b) front view; (c) side view.
Buildings 14 00632 g004
Figure 5. Manufacture process of the specimens: (a) assembly of the steel part; (b) erection of the formwork; (c) casting of the concrete flange; (d) natural curing.
Buildings 14 00632 g005
Figure 6. Test setup and layout of the LVDTs. (unit: mm): (a) on-site picture; (b) schematic diagram.
Buildings 14 00632 g006
Figure 7. Failure model of specimen ESCF-SR1: (a) front view; (b) back view.
Buildings 14 00632 g007
Figure 8. Failure model of specimen ESCF-SR5: (a) front view; (b) sideview.
Buildings 14 00632 g008
Figure 9. Load–slip curves of specimens with various parameters: (a) effect of the width-to-thickness ratio of flange; (b) effect of the embedded depth of web; (c) effect of the reinforcing studs; (d) effect of the thickness of web; (e) effect of the diameter of combined rebar.
Buildings 14 00632 g009
Figure 10. Comparison between predicted and test results for the shear capacity of SR-ESCF [23,29,35].
Buildings 14 00632 g010
Figure 11. Stress–strain relationships of the concrete.
Buildings 14 00632 g011
Figure 12. Stress–strain relationships of the steel.
Buildings 14 00632 g012
Figure 13. Stress–strain relationships of the stud and rebar.
Buildings 14 00632 g013
Figure 14. FEM of the push-out test: (a) geometric model; (b) modeling and meshing for different components.
Buildings 14 00632 g014
Figure 15. Comparison of the load–slip curves from FEA and test results: (a) Specimen ESCF-SR3; (b) Specimen ESCF-SR4; (c) Specimen ESCF-SR5; (d) Specimen ESCF-SR6.
Buildings 14 00632 g015
Figure 16. Comparisons of failure modes between test results and FEA: (a) crushing of the concrete flange; (b) shear failure of the stud.
Buildings 14 00632 g016
Figure 17. Details of the optimization models: (a) configuration of the optimization model; (b) layout of the studs of the ESCF-OSR1; (c) layout of the studs of the ESCF-OSR8.
Buildings 14 00632 g017
Figure 18. Comparison of the load–slip curves between the optimization design model and test results: (a) Specimen ESCF-SR1; (b) Specimen ESCF-SR8.
Buildings 14 00632 g018
Table 1. Summary of the test specimens.
Specimen No.tf/mml/mmtw/mmd/mmStud
ESCF-SR181801422Yes
ESCF-SR2101801422Yes
ESCF-SR3121801422Yes
ESCF-SR4101801222Yes
ESCF-SR5101801416Yes
ESCF-SR6102101422Yes
ESCF-SR7101501422Yes
ESCF-SR881501216Yes
ESCF-9101801422No
Note: tf and l denote the thickness of the flange and embedded depth, respectively; tw and d denote thickness of the web and diameter of the combined rebar, respectively.
Table 2. Measured material properties.
MaterialYield Strength
(MPa)
Ultimate Strength
(MPa)
Cubic Compressive Strength
(MPa)
Elastic Modulus
(GPa)
Rebar470.8635.6-200.0
Steel384.5517.3-206.0
Stud321.0409.0-210.0
Concrete--57.335.5
Table 3. Experimental results.
Specimen No.S/mmP0.2/kNP/kNk/kN·mm−1Failure Mode
ESCF-SR17.2154220212710LB
ESCF-SR27.3435123011755SC
ESCF-SR36.3534029821700SC
ESCF-SR48.0134422911720SC
ESCF-SR58.7796423404820SC
ESCF-SR69.7539724631985SC
ESCF-SR75.6952924922985SC
ESCF-SR815.8427720501385LB
ESCF-96.0130020041500LB
Note: S and P denote the ultimate slip of test results and ultimate shear load of testing specimen, respectively; P0.2 and k denote the load and secant stiffness of the specimen at the slip of 0.2 mm [28,34], respectively; SC and LB denote the splitting of the concrete flange and local buckling of the steel flange, respectively.
Table 4. Comparisons of the shear capacity between theoretical design equations and test results.
Specimen No.P/kNV1/kNV1/PV2/kNV2/PV3/kNV3/PV4/kNV4/P
ESCF-SR1202112240.6117230.8516490.8219960.99
ESCF-SR2230112240.5317230.7516490.7219960.87
ESCF-SR3298212240.4117230.5816490.5519960.67
ESCF-SR4229112240.5317230.7516490.7219960.87
ESCF-SR5234011790.5016780.7216490.7019960.85
ESCF-SR6246314130.5719950.8118810.7619480.79
ESCF-SR7249210350.4214510.5814170.5720560.83
ESCF-SR8205012240.6017230.8414170.8020561.00
ESCF-920049900.4914060.7016490.7119961.00
Average--0.52-0.73-0.71-0.87
Variation coefficient--0.13-0.13-0.12-0.13
Note: V1, V2 and V3 are the ultimate shear strength predicted by Equations (1)–(3), individually.
Table 5. Comparisons of the test results and FEA.
Specimen No.P/kNPu/kNS/mmSu/mmPu/PSu/S
ESCF-SR1202121937.38.01.081.09
ESCF-SR22301251217.218.21.081.05
ESCF-SR3298231546.36.51.051.03
ESCF-SR4229123888.08.31.031.03
ESCF-SR5234025388.78.81.081.01
ESCF-SR6246326849.710.21.081.05
ESCF-SR7249227305.76.11.081.07
ESCF-SR82050224715.816.01.081.01
ESCF-9200422086.016.51.101.08
Note: Pu denotes the ultimate shear strength of FEA; S and Su denote the ultimate slip of test results and FEA, respectively.
Table 6. Comparisons of the test results and optimization design results.
Specimen No.tw/mml/mmd/mmStudPu(kN)Failure Mode
ESCF-SR1141802242021Local buckling
ESCF-OSR1141802262268Splitting crack
ESCF-SR8121501642050Local buckling
ESCF-OSR8121501662362Splitting crack
Disclaimer/Publisher’s Note: The statements, opinions and data contained in all publications are solely those of the individual author(s) and contributor(s) and not of MDPI and/or the editor(s). MDPI and/or the editor(s) disclaim responsibility for any injury to people or property resulting from any ideas, methods, instructions or products referred to in the content.

