
Field Experimental Study on the Uplift and Lateral Capacity of Deep Helical Anchors and Grouped Helical Anchors in Clays

Abstract
:1. Introduction
2. Test Site and Design
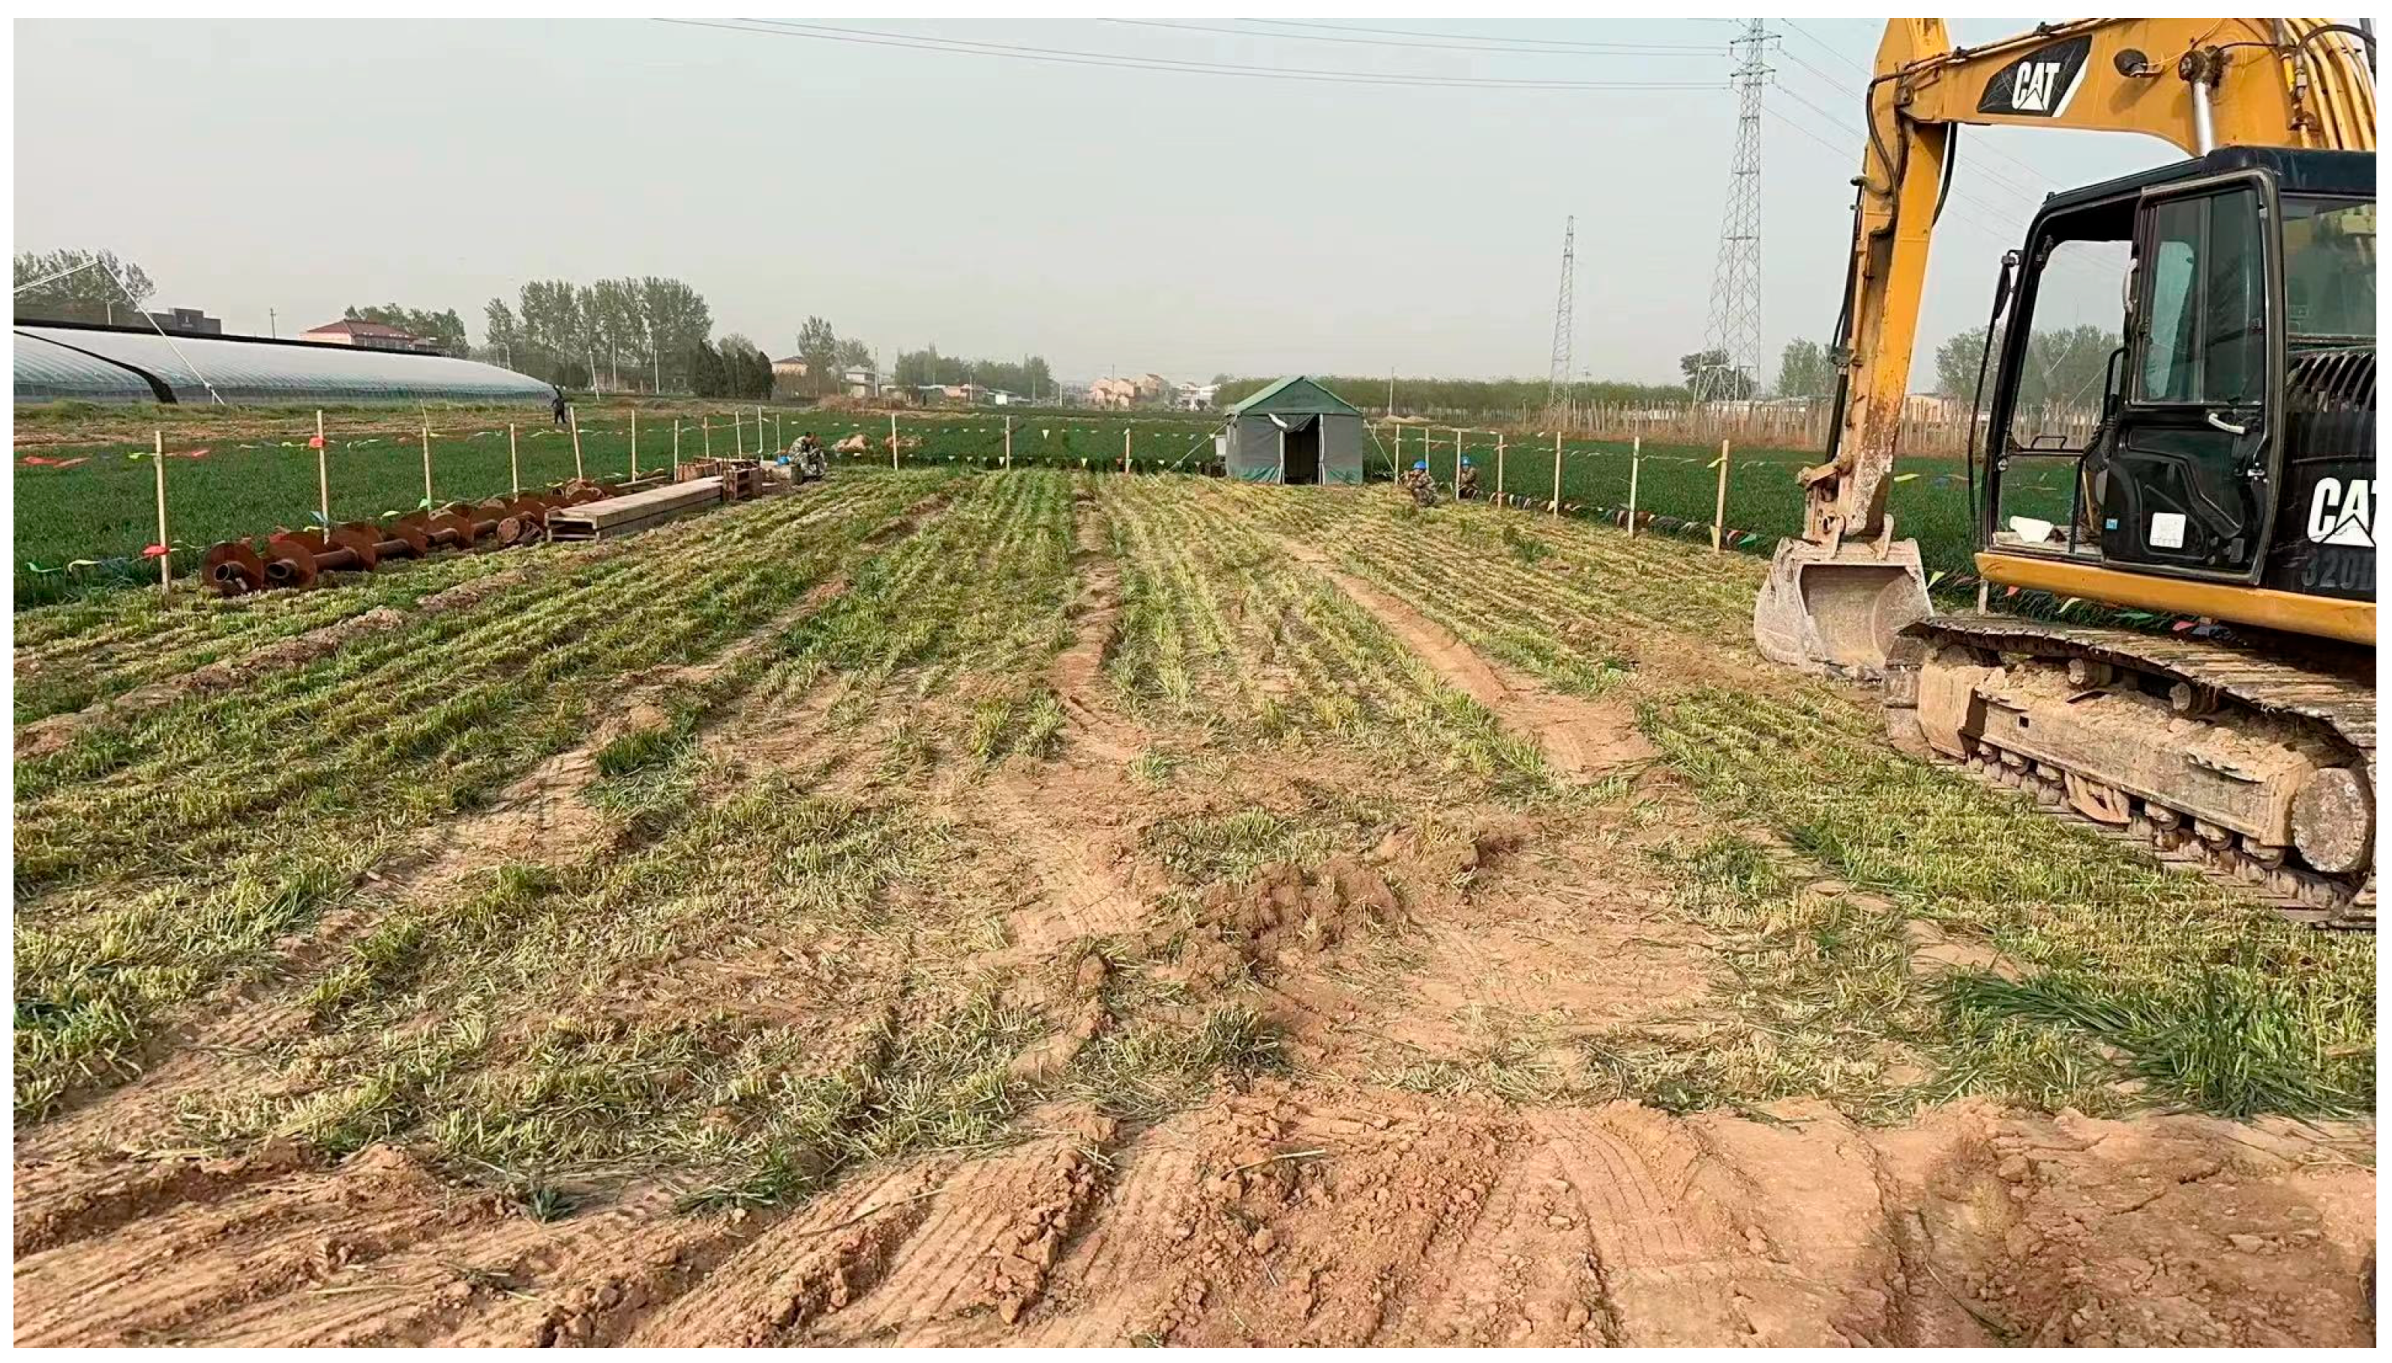
2.1. Test Site
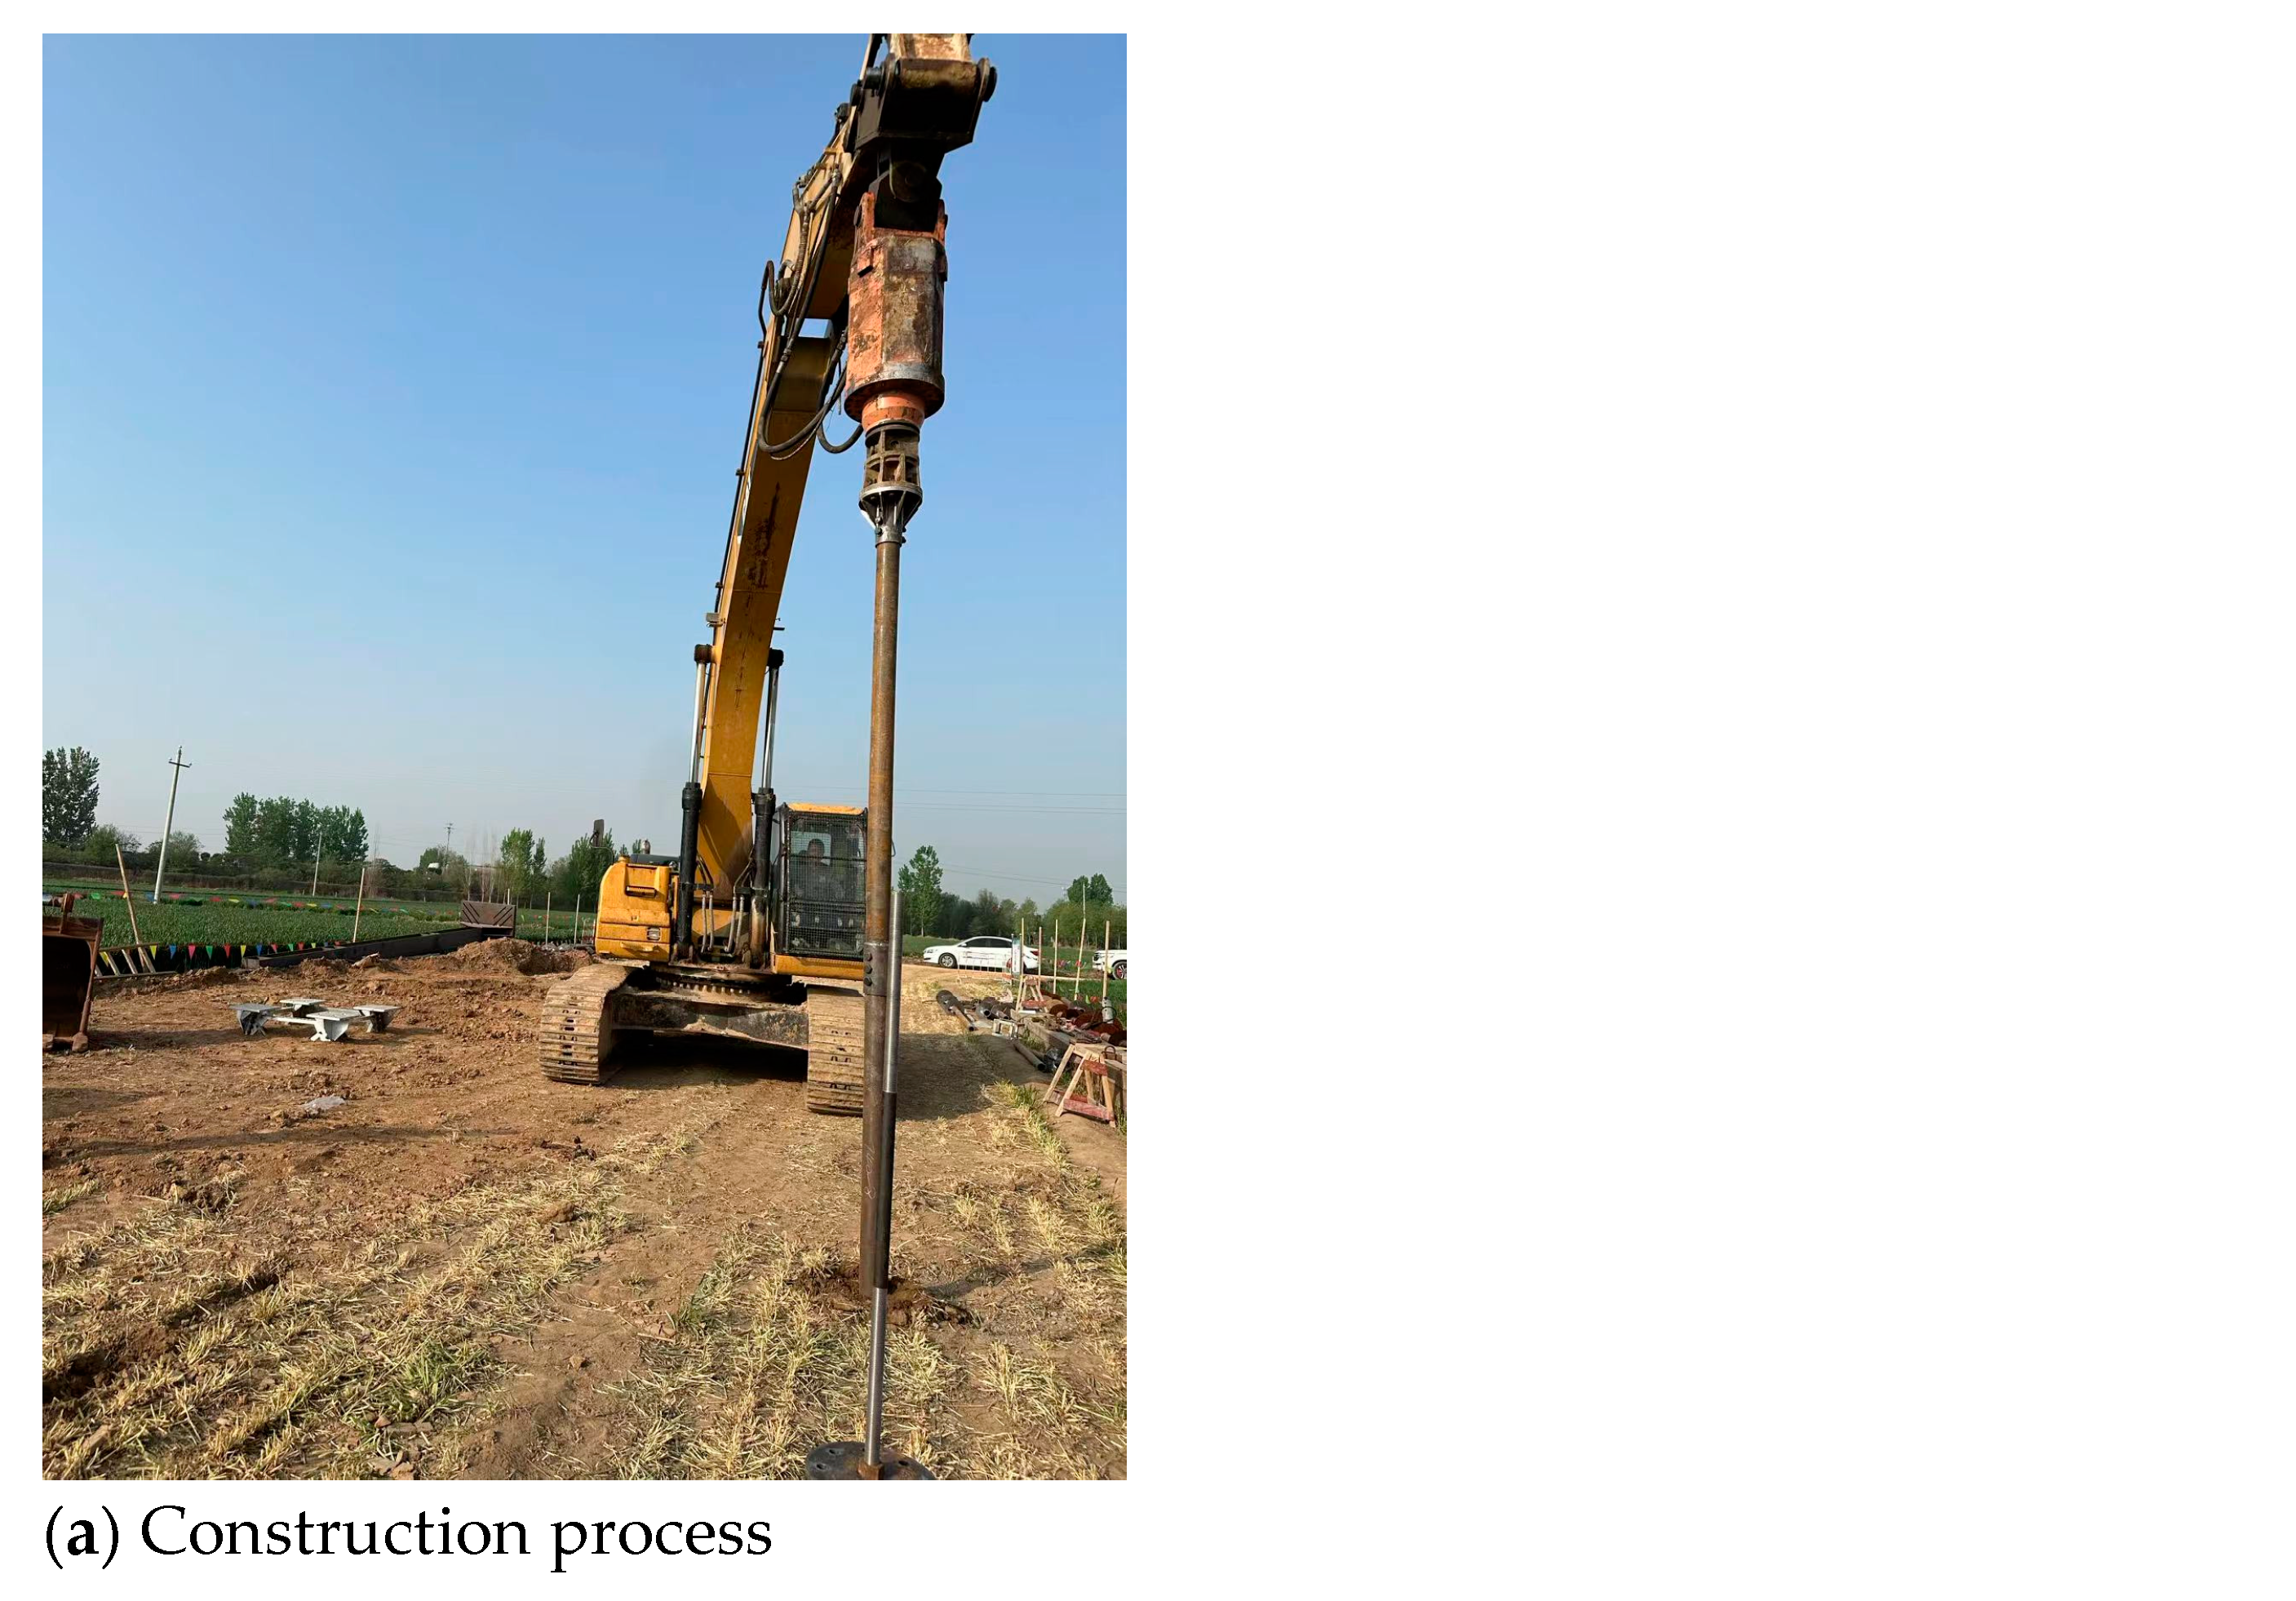
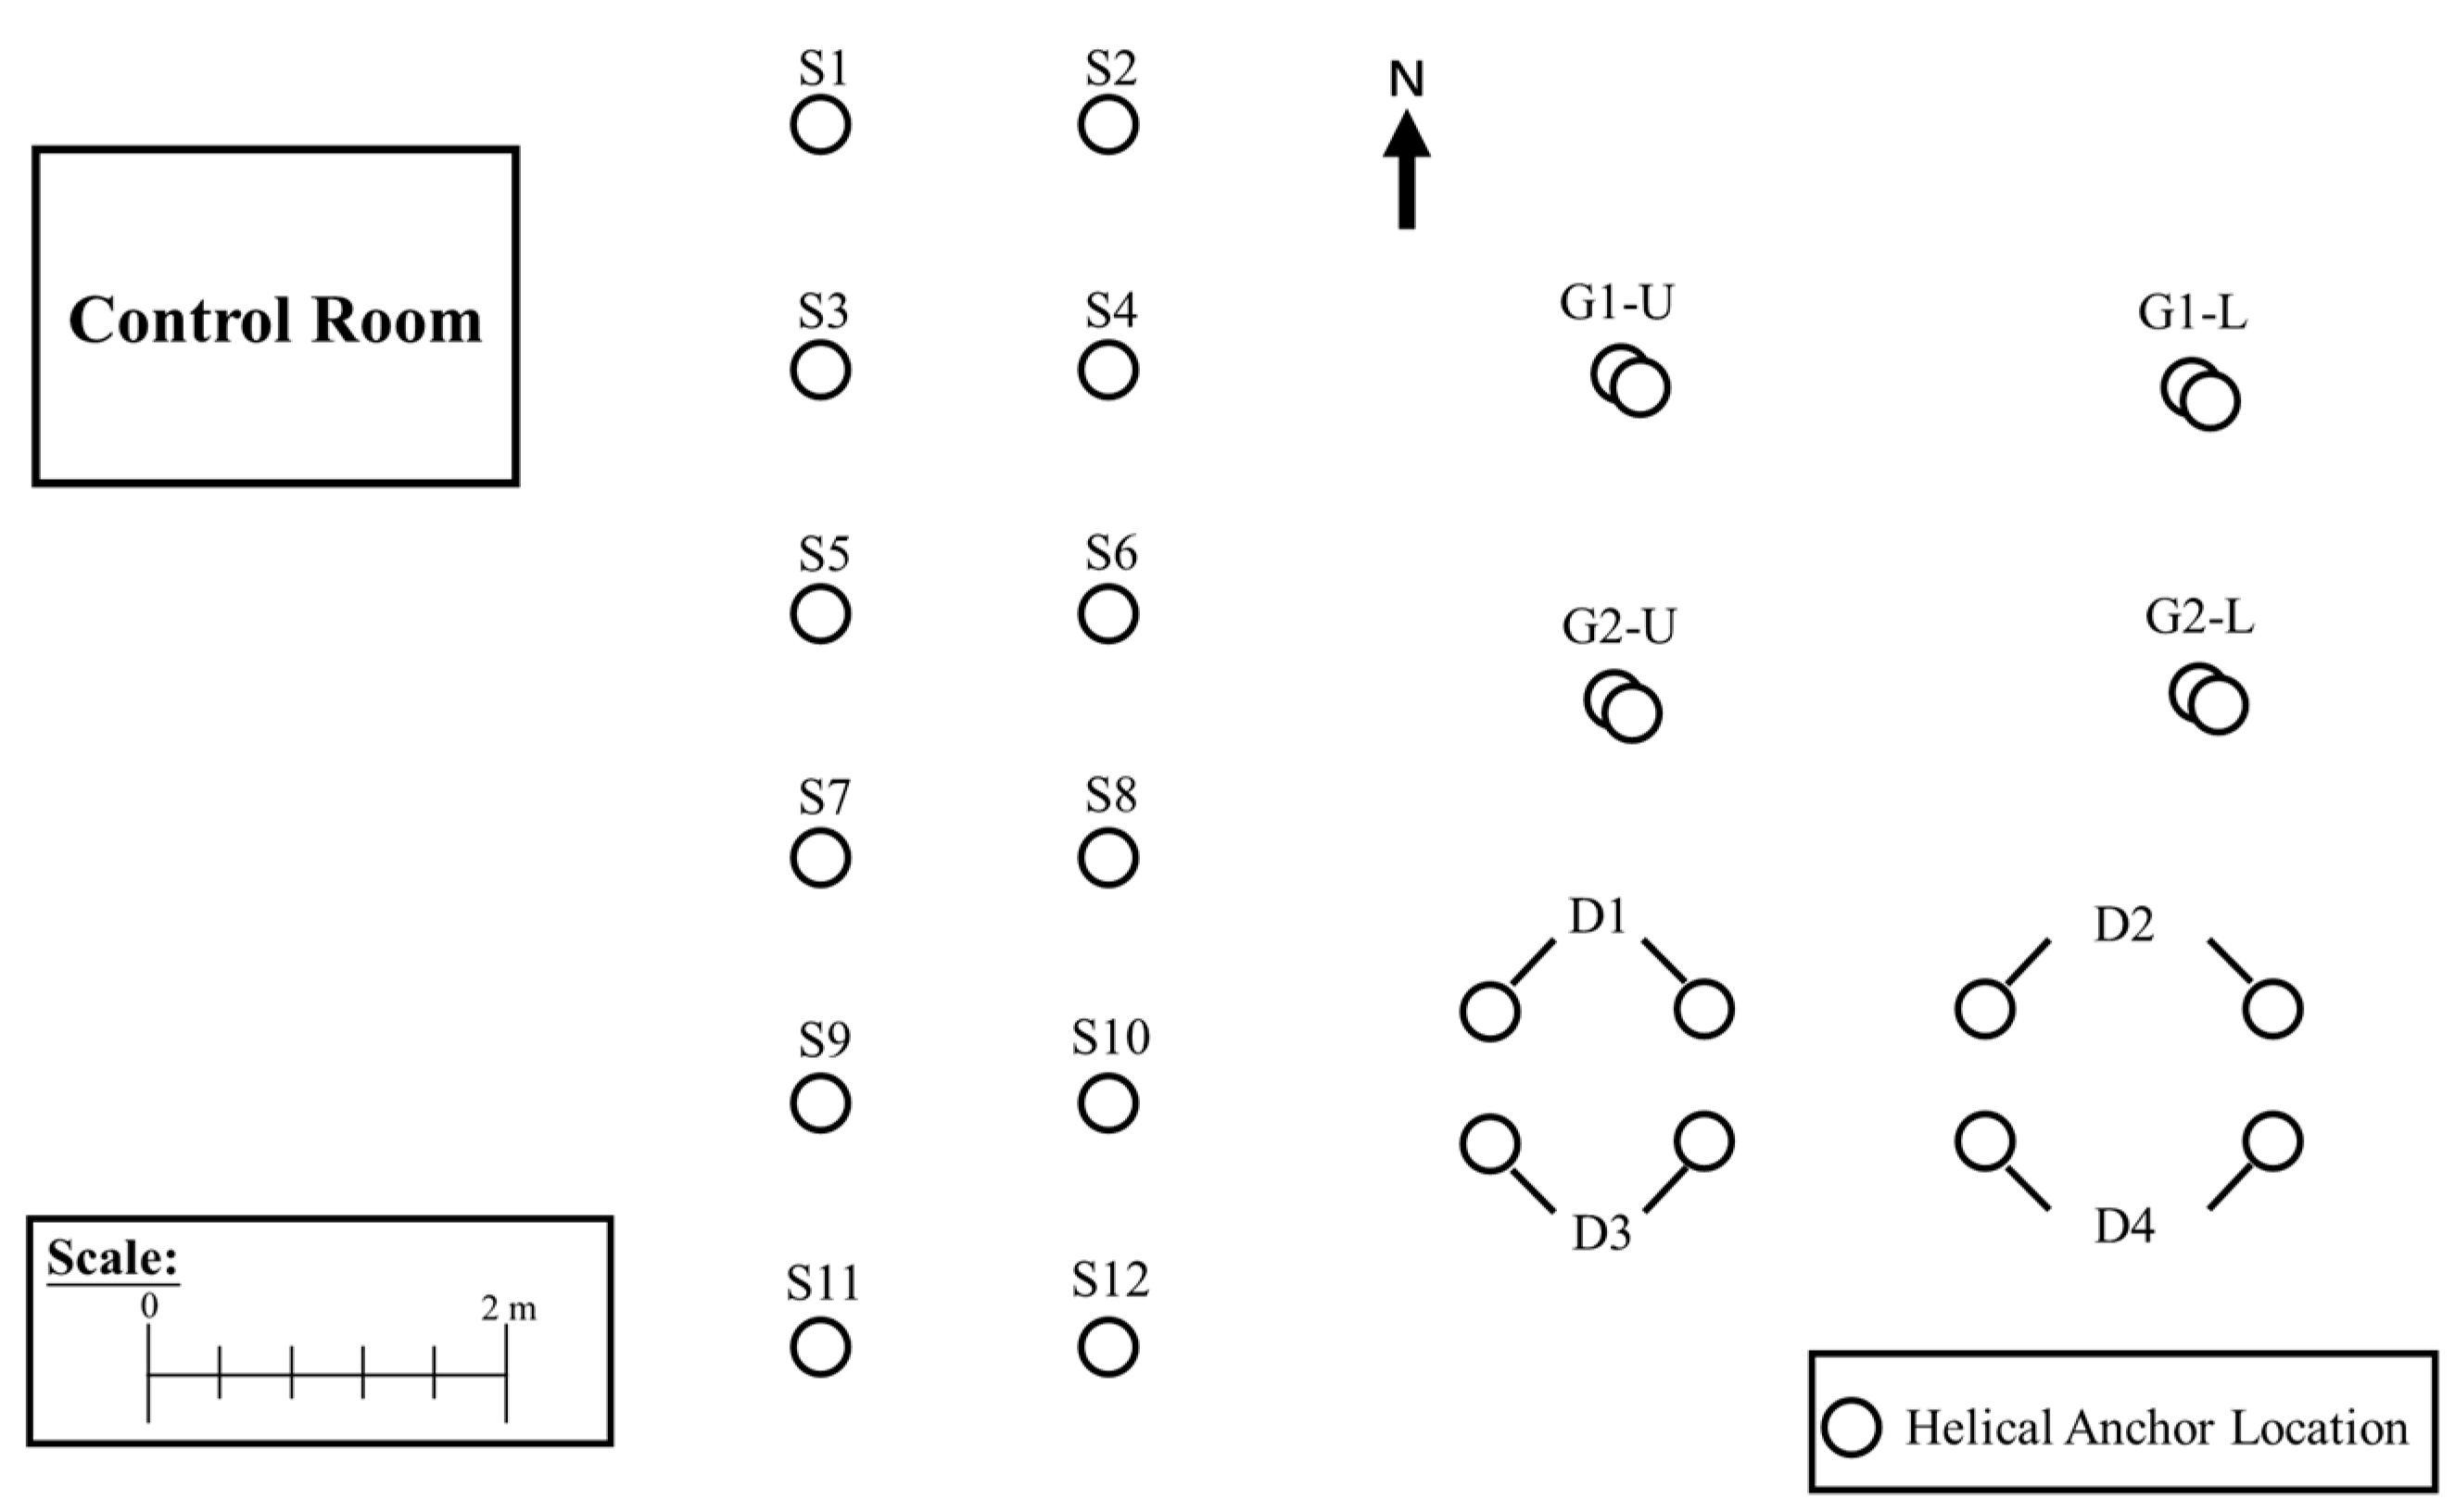
2.2. Test Design
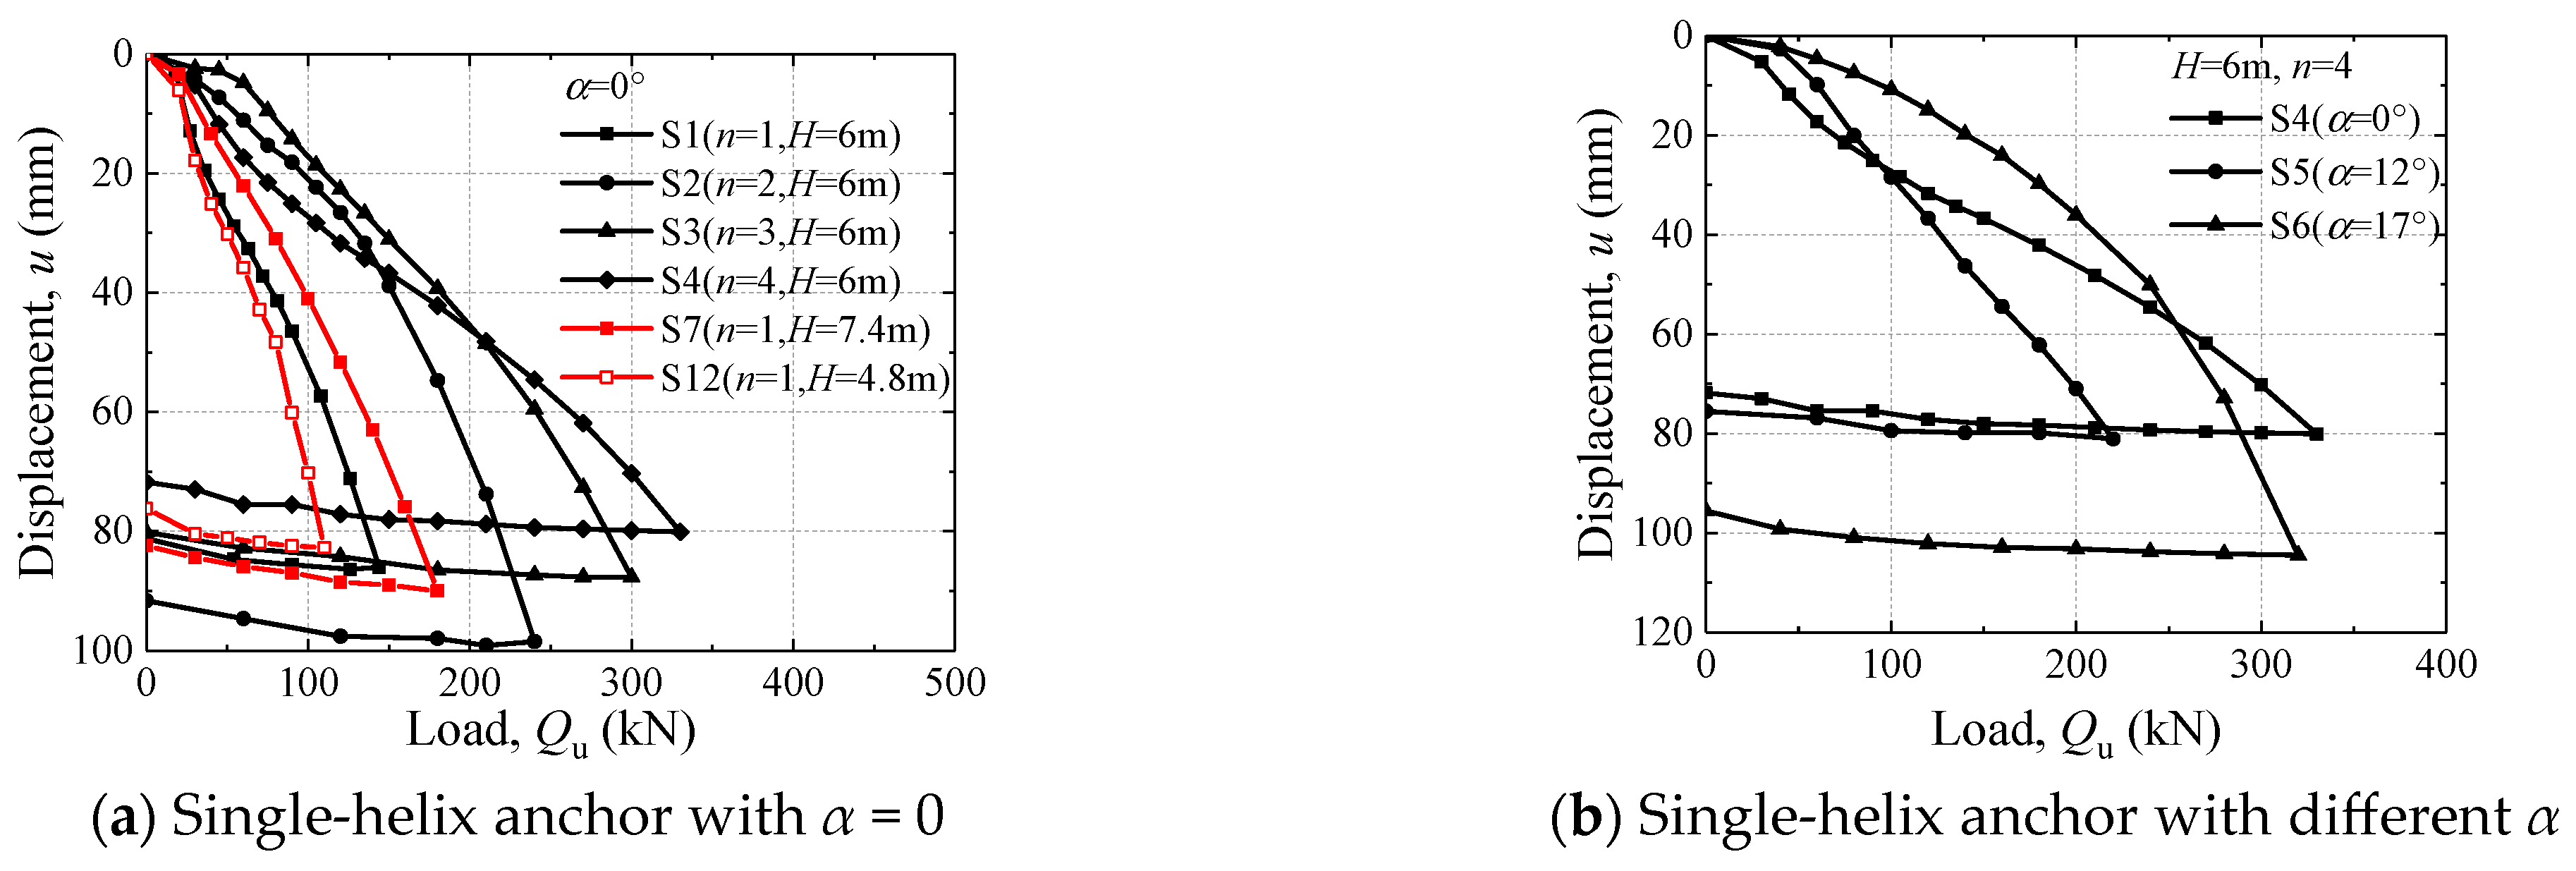
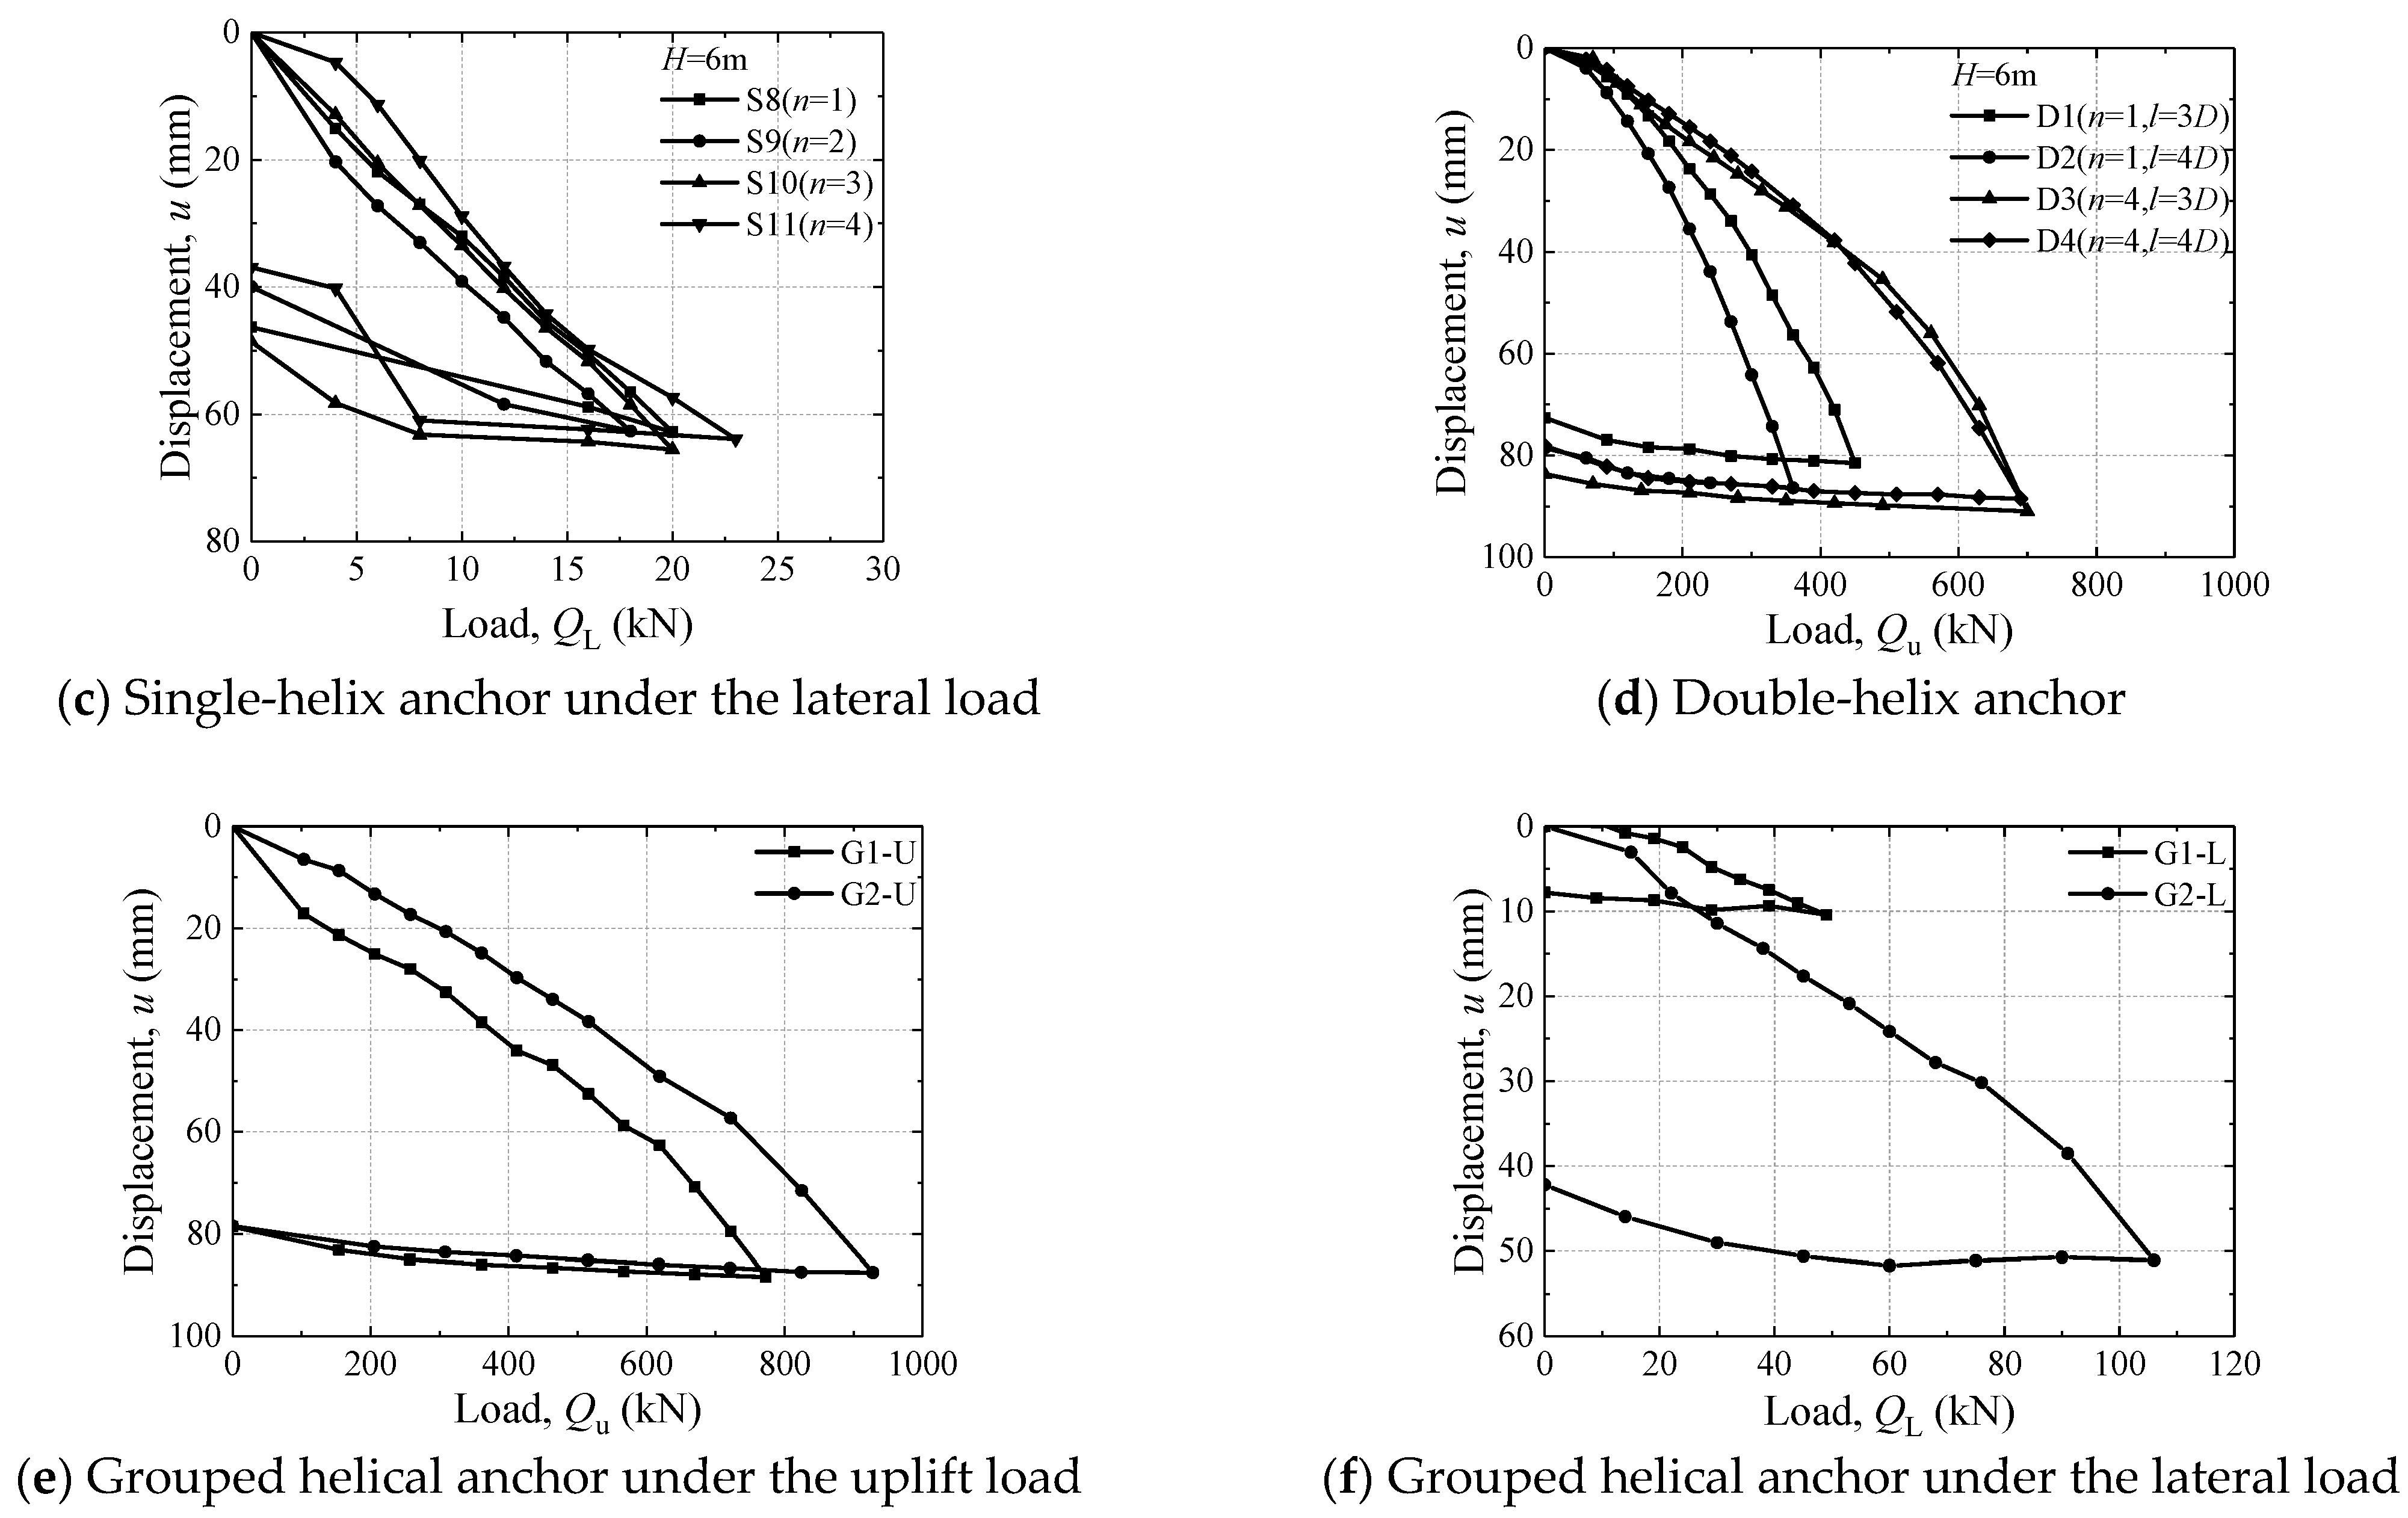
3. Results
4. Discussion
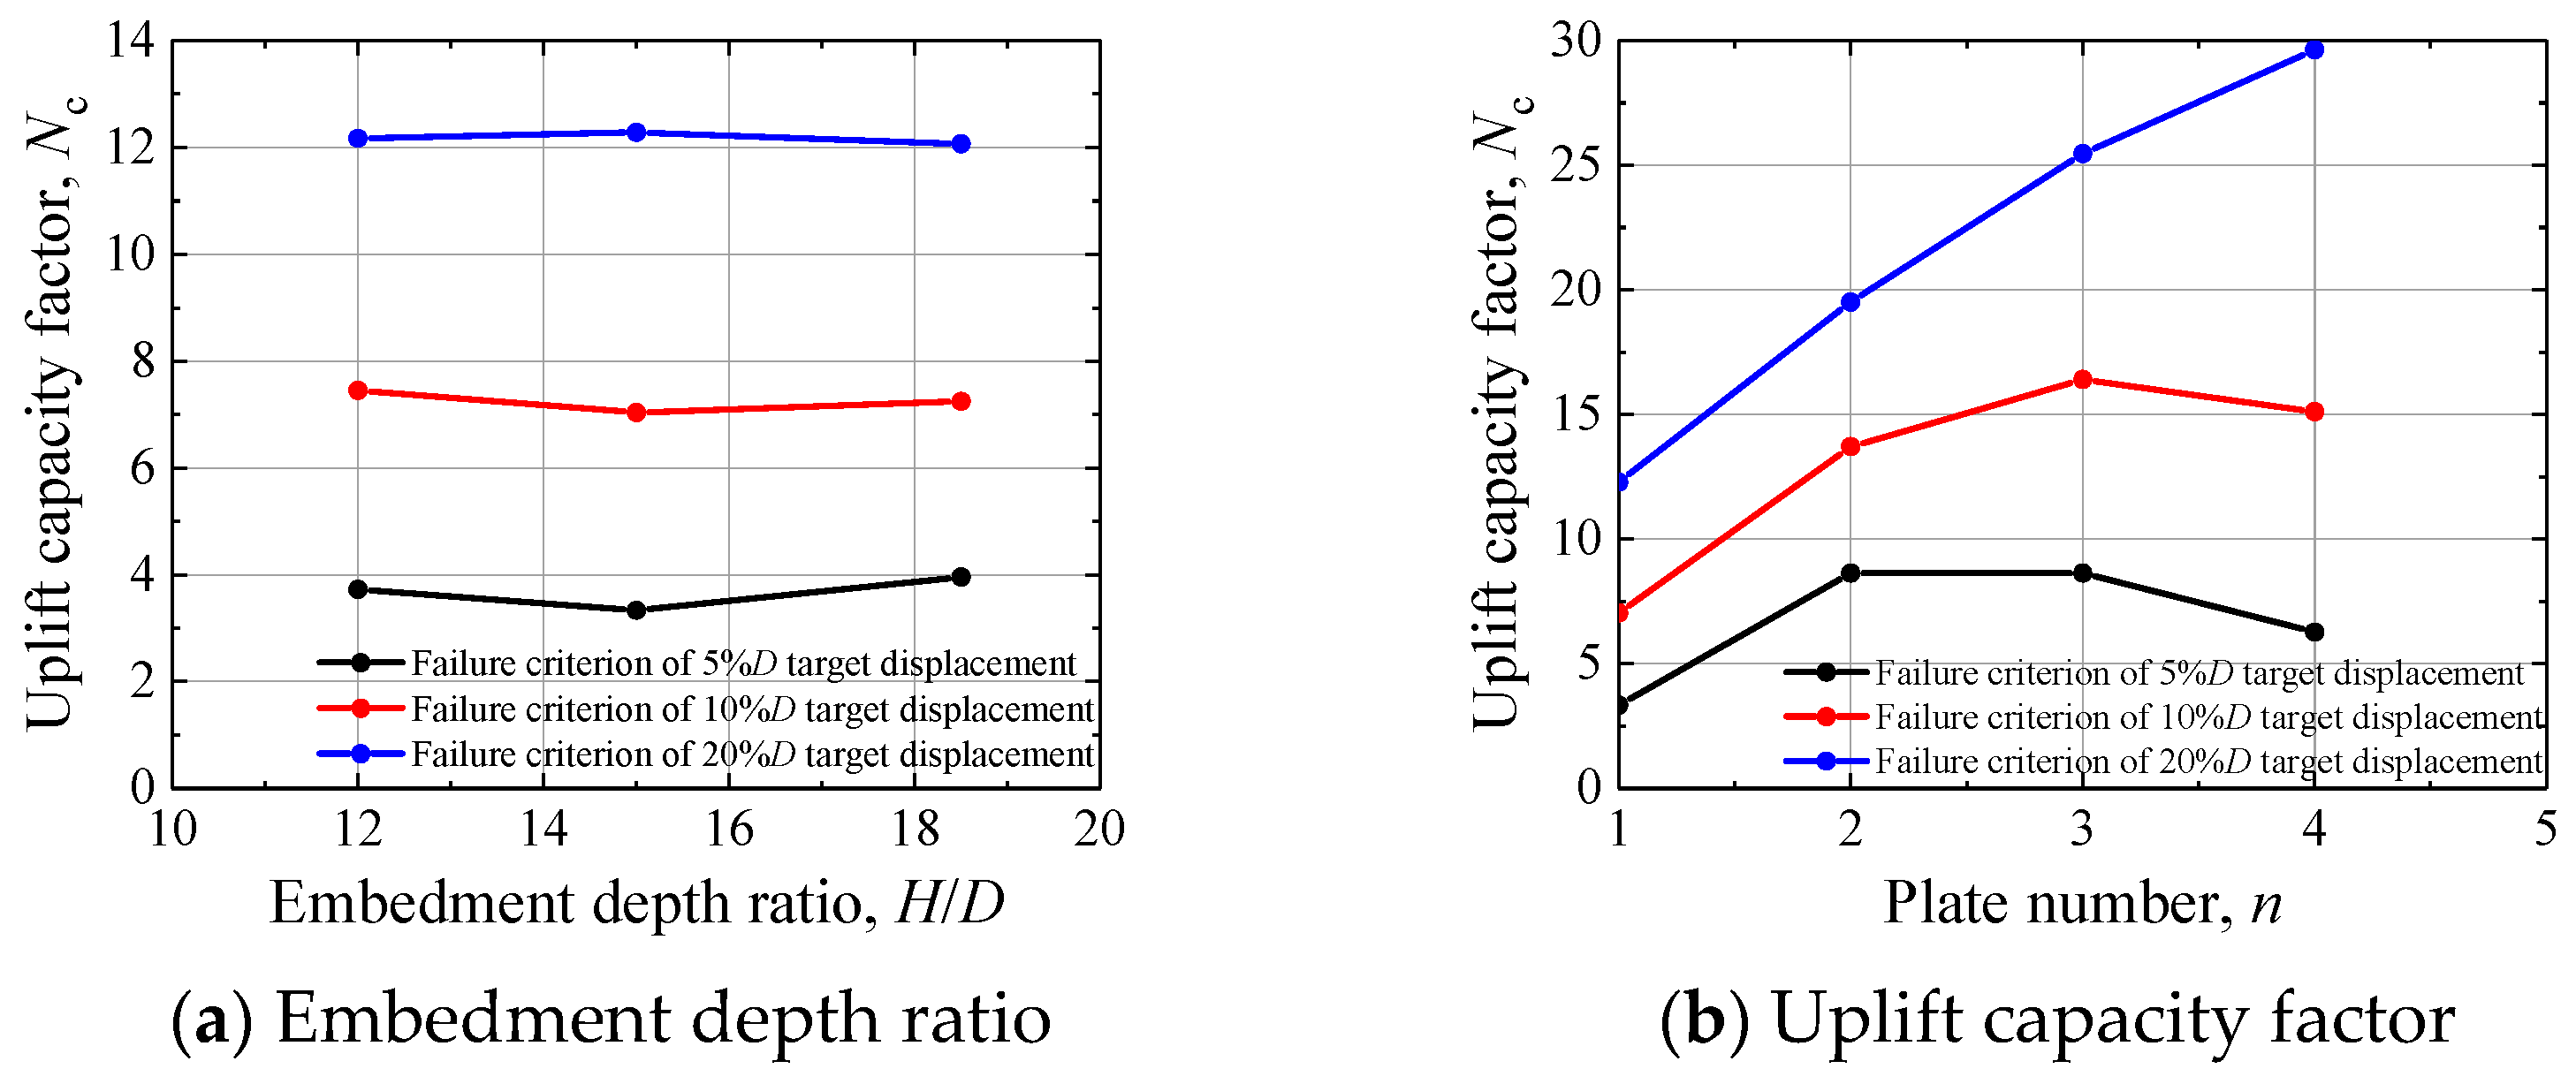
4.1. Effect of the Embedment Depth and Plate Number
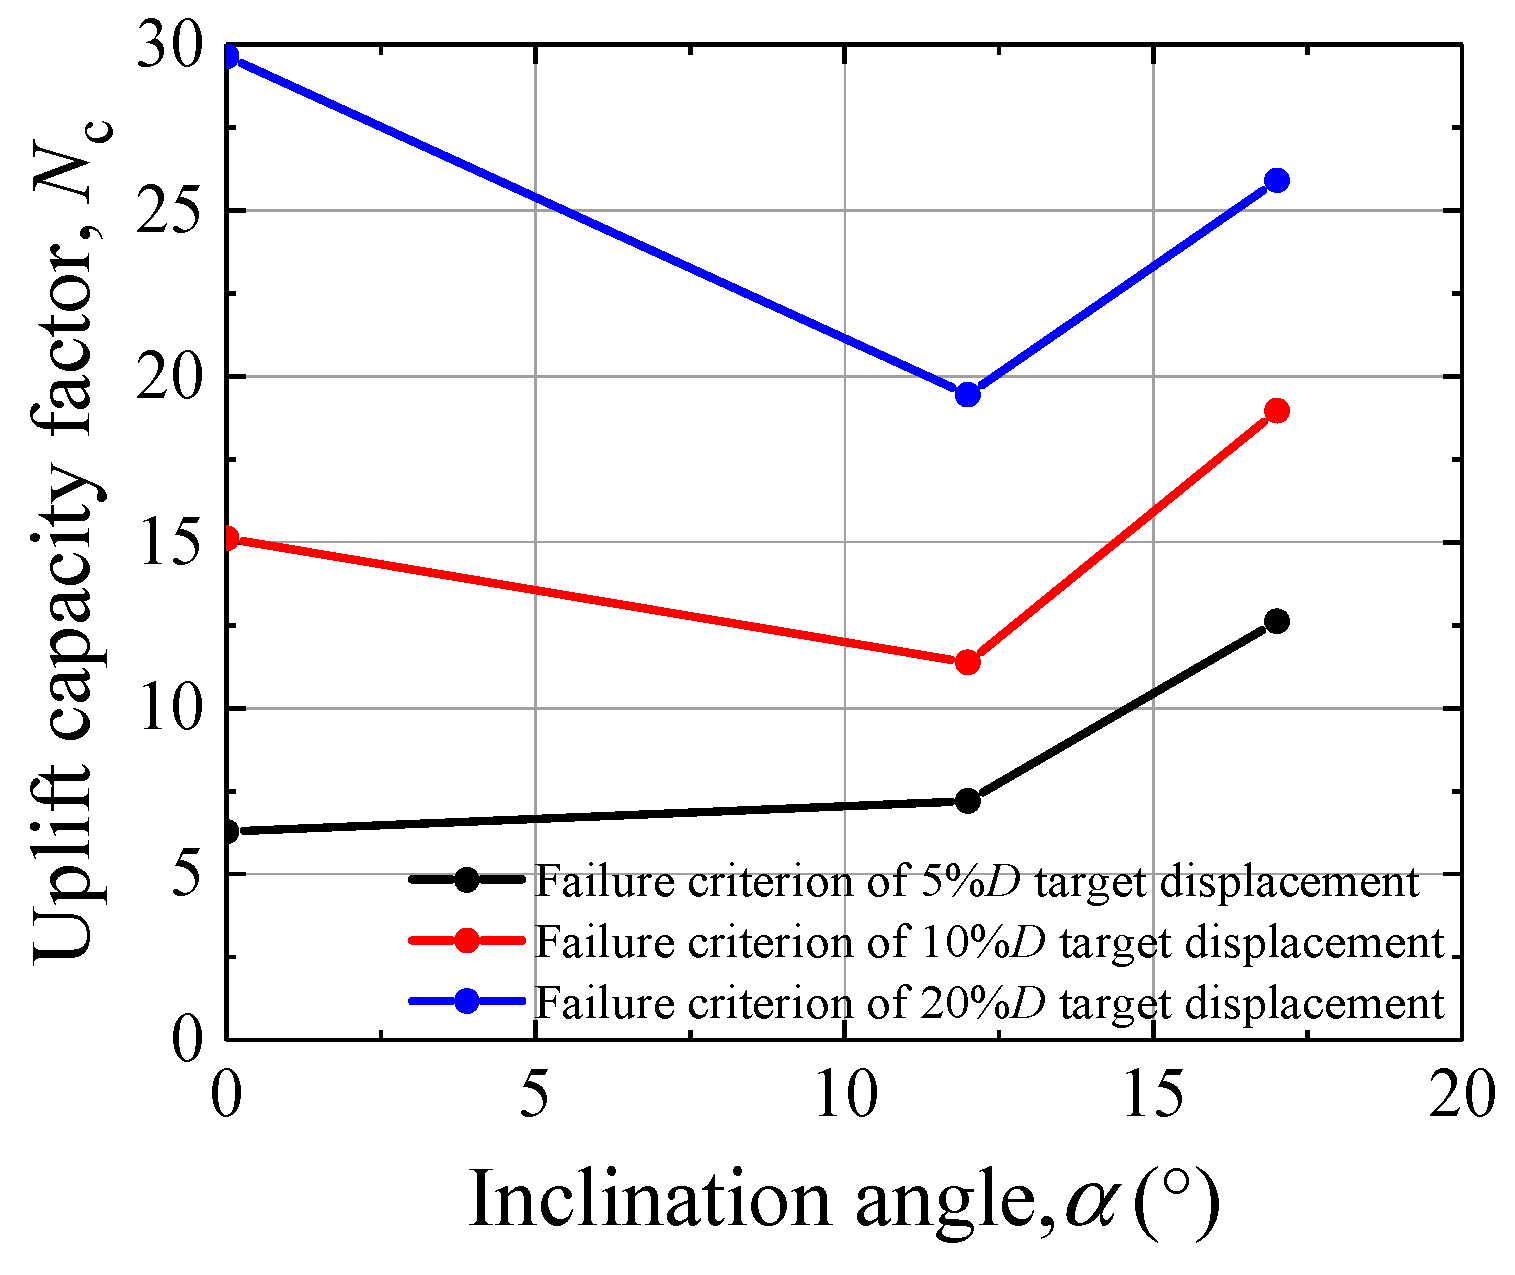
4.2. Effect of the Inclination Angle
4.3. Group Effect
5. Conclusions
Author Contributions
Funding
Data Availability Statement
Conflicts of Interest
References
- Livneh, B.; El Naggar, M.H. Axial testing and numerical modeling of square shaft helical piles under compressive and tensile loading. Can. Geotech. J. 2008, 45, 1142–1155. [Google Scholar] [CrossRef]
- Merifield, R. Ultimate uplift capacity of multiplate helical type anchors in clay. J. Geotech. Geoenviron. Eng. 2011, 137, 704–716. [Google Scholar] [CrossRef]
- Wang, D.; Merifield, R.; Gaudin, C. Uplift behaviour of helical anchors in clay. Can. Geotech. J. 2013, 50, 575–584. [Google Scholar] [CrossRef]
- Stanier, S.A.; Black, J.A.; Hird, C.C. Modelling helical screw piles in soft clay and design implications. Proc. Inst. Civ. Eng. Geotech. Eng. 2014, 167, 447–460. [Google Scholar] [CrossRef]
- Wang, L.; Wu, M.; Chen, H.; Hao, D.; Tian, Y.; Qi, C. Efficient Machine Learning Models for the Uplift Behavior of Helical Anchors in Dense Sand for Wind Energy Harvesting. Appl. Sci. 2022, 12, 10397. [Google Scholar] [CrossRef]
- Ghaly, A.; Hanna, A.; Hanna, M. Uplift behavior of screw anchors in sand. I: Dry sand. J. Geotech. Eng. 1991, 117, 773–793. [Google Scholar] [CrossRef]
- Drescher, A.; Detournay, E. Limit load in translational failure mechanisms for associative and non-associative materials. Géotechnique 1993, 43, 443–456. [Google Scholar] [CrossRef]
- Hsu, S.; Liao, H. Uplift behaviour of cylindrical anchors in sand. Can. Geotech. J. 1998, 35, 70–80. [Google Scholar] [CrossRef]
- Tappenden, K.M.; Sego, D.C. Predicting the axial capacity of screw piles installed in Canadian soils. In Proceedings of the Canadian Geotechnical Society (CGS), OttawaGeo2007 Conference, Ottawa, ON, Canada, 21–24 October 2007; pp. 1608–1615. [Google Scholar]
- White, D.; Cheuk, C.; Bolton, M. The uplift resistance of pipes and plate anchors buried in sand. Géotechnique 2008, 58, 771–779. [Google Scholar] [CrossRef]
- Newgard, J.; Schneider, J.; Thompson, D. Cyclic response of shallow helical anchors in a medium dense sand. In Proceedings of the Frontiers in Offshore Geotechnics III: Proceedings of the 3rd International Symposium on Frontiers in Offshore Geotechnics (ISFOG 2015), Oslo, Norway, 10–12 June 2015; Taylor & Francis Books Ltd.: London, UK, 2015; pp. 913–918. [Google Scholar]
- Cerfontaine, B.; Knappett, J.A.; Brown, M.J.; Bradshaw, A.S. Effect of soil deformability on the failure mechanism of shallow plate or screw anchors in sand. Comput. Geotech. 2019, 109, 34–45. [Google Scholar] [CrossRef]
- Tsuha, C.d.H.C.; Aoki, N.; Rault, G.; Thorel, L.; Garnier, J. Physical modelling of helical pile anchors. Int. J. Phys. Model. Geotech. 2007, 7, 01–12. [Google Scholar]
- Hao, D.; Wang, D.; O’Loughlin, C.D.; Gaudin, C. Tensile monotonic capacity of helical anchors in sand: Interaction between helices. Can. Geotech. J. 2019, 56, 1534–1543. [Google Scholar] [CrossRef]
- Al Hakeem, N.; Aubeny, C. Numerical investigation of uplift behavior of circular plate anchors in uniform sand. J. Geotech. Geoenviron. Eng. 2019, 145, 04019039. [Google Scholar] [CrossRef]
- Giampa, J.R.; Bradshaw, A.S.; Schneider, J.A. Influence of dilation angle on drained shallow circular anchor uplift capacity. Int. J. Geomech. 2017, 17, 04016056. [Google Scholar] [CrossRef]
- Spagnoli, G.; de Hollanda Cavalcanti Tsuha, C. A review on the behavior of helical piles as a potential offshore foundation system. Mar. Georesources Geotechnol. 2020, 38, 1013–1036. [Google Scholar] [CrossRef]
- Abdelghany, Y.; El Naggar, M.H. Monotonic and Cyclic Behavior of Helical SCREW Piles under Axial and Lateral Loading. Ph.D. Thesis, The University of Western Ontario, London, ON, Canada, 2010. [Google Scholar]
- Davidson, C.; Brown, M.J.; Cerfontaine, B.; Al-Baghdadi, T.; Knappett, J.; Brennan, A.; Augarde, C.; Coombs, W.; Wang, L.; Blake, A. Physical modelling to demonstrate the feasibility of screw piles for offshore jacket-supported wind energy structures. Géotechnique 2022, 72, 108–126. [Google Scholar] [CrossRef]
- Cerfontaine, B.; Knappett, J.; Brown, M.J.; Davidson, C.; Sharif, Y. Optimised design of screw anchors in tension in sand for renewable energy applications. Ocean Eng. 2020, 217, 108010. [Google Scholar] [CrossRef]
- Vignesh, V.; Muthukumar, M. Experimental and numerical study of group effect on the behavior of helical piles in soft clays under uplift and lateral loading. Ocean Eng. 2023, 268, 113500. [Google Scholar] [CrossRef]
- Zhang, R.; Meng, R.; Sang, J.; Hu, Y.; Li, X.; Zheng, C. Modelling individual head-related transfer function (HRTF) based on anthropometric parameters and generic HRTF amplitudes. CAAI Trans. Intell. Technol. 2023, 8, 364–378. [Google Scholar] [CrossRef]
- Luo, C. KELL: A Kernel-Embedded Local Learning for Data-Intensive Modeling. Artif. Intell. Appl. 2024, 2, 38–44. [Google Scholar] [CrossRef]
- Zhang, Y.; Hu, Y.; Gao, X.; Gong, D.; Guo, Y.; Gao, K.; Zhang, W. An embedded vertical-federated feature selection algorithm based on particle swarm optimisation. CAAI Trans. Intell. Technol. 2023, 8, 734–754. [Google Scholar] [CrossRef]
- Simani, S.; Lam, Y.P.; Farsoni, S.; Castaldi, P. Dynamic Neural Network Architecture Design for Predicting Remaining Useful Life of Dynamic Processes. J. Data Sci. Intell. Syst. 2023. [Google Scholar] [CrossRef]
- Khan, J.; Lee, E.; Kim, K. A higher prediction accuracy–based alpha–beta filter algorithm using the feedforward artificial neural network. CAAI Trans. Intell. Technol. 2023, 8, 1124–1139. [Google Scholar] [CrossRef]
- Toma, S.; Seto, K.; Chen, W.F. Comparisons of Static and Dynamic Analyses on Toppling Behaviors of Pile Driving Machinery, etc., on Soft Foundation. Arch. Adv. Eng. Sci. 2023, 1–15. [Google Scholar] [CrossRef]
- Ghaly, A.; Hanna, A. Model investigation of the performance of single anchors and groups of anchors. Can. Geotech. J. 1994, 31, 273–284. [Google Scholar] [CrossRef]
- Mittal, S.; Mukherjee, S. Vertical uplift capacity of a group of helical screw anchors in sand. Indian Geotech. J. 2013, 43, 238–250. [Google Scholar] [CrossRef]
- Mittal, S.; Mukherjee, S. Vertical pullout capacity of a group of helical screw anchors in sand: An empirical approach. Indian Geotech. J. 2014, 44, 480–488. [Google Scholar] [CrossRef]
- Mittal, S.; Mukherjee, S. Behaviour of group of helical screw anchors under compressive loads. Geotech. Geol. Eng. 2015, 33, 575–592. [Google Scholar] [CrossRef]
- Sakr, M.; Nazir, A.; Azzam, W.; Sallam, A. Uplift capacity of group screw piles with grouted shafts in sand. Capacité d’élévation des pieux à visser de groupe avec des arbres cimentés dans le sable. In Proceedings of the 19th International Conference on Soil Mechanics and Geotechnical Engineering, Seoul, Republic of Korea, 17–21 September 2017. [Google Scholar]
- Roy, S.; Bhalla, S.K. Role of geotechnical properties of soil on civil engineering structures. Resour. Environ. 2017, 7, 103–109. [Google Scholar]
- Bradshaw, A.S.; Cullen, L.; Miller, Z. Field study of group effects on the pullout capacity of “deep” helical piles in sand. Can. Geotech. J. 2022, 59, 538–545. [Google Scholar] [CrossRef]
- Ghosh, P.; Samal, S. Interaction effect of group of helical anchors in cohesive soil using finite element analysis. Geotech. Geol. Eng. 2017, 35, 1475–1490. [Google Scholar] [CrossRef]
- Albusoda, B.S.; Abbase, H.O. Performance assessment of single and group of helical piles embedded in expansive soil. Int. J. Geo-Eng. 2017, 8, 25. [Google Scholar] [CrossRef]
- Lutenegger, A.J. Axial uplift of square-shaft single-helix helical anchor groups in Clay. Innov. Geotech. Eng. 2018, 403–416. [Google Scholar] [CrossRef]
- Lanyi-Bennett, S.A.; Deng, L. Axial load testing of helical pile groups in glaciolacustrine clay. Can. Geotech. J. 2019, 56, 187–197. [Google Scholar] [CrossRef]
- Elsherbiny, Z.H.; El Naggar, M.H. Axial compressive capacity of helical piles from field tests and numerical study. Can. Geotech. J. 2013, 50, 1191–1203. [Google Scholar] [CrossRef]
- Perko, H.A. Helical Piles: A Practical Guide to Design and Installation; John Wiley & Sons: Hoboken, NJ, USA, 2009. [Google Scholar]
- Radhakrishna, H. Helix Anchor Tests in Stiff Fissured Clay; Ontario Hydro Research Division Research Report; Ontario Hydro Research Division: Parkes, Australia, 1975; pp. 75–123. [Google Scholar]
- Al-Baghdadi, T.A.; Brown, M.J.; Knappett, J.A.; Al-Defae, A.H. Effects of vertical loading on lateral screw pile performance. Proc. Inst. Civ. Eng. Geotech. Eng. 2017, 170, 259–272. [Google Scholar] [CrossRef]
- Clemence, S.P.; Pepe, F. Measurement of lateral stress around multihelix anchors in sand. Geotech. Test. J. 1984, 7, 145–152. [Google Scholar] [CrossRef]
- Dickin, E.A. Uplift behavior of horizontal anchor plates in sand. J. Geotech. Eng. 1988, 114, 1300–1317. [Google Scholar] [CrossRef]
- Sakr, M. Lateral resistance of high capacity helical piles–case study. In Proceedings of the 63rd Canadian Geotechnical and 6th Canadian Permafrost Conference, Calgary, AB, Canada, 12–15 September 2010; pp. 12–16. [Google Scholar]
- Wu, W.; Lu, C.; Chen, L.; Mei, G.; El Naggar, M.H.; Liu, H. Horizontal vibration characteristics of pile groups in unsaturated soil considering coupled pile–pile interaction. Ocean Eng. 2023, 281, 115000. [Google Scholar] [CrossRef]
- Liu, X.; Wu, W.; El Naggar, M.H.; Sun, J.; Tang, L. Theoretical analysis of dynamic performance of concrete-filled steel tube pile under vertical load. Comput. Geotech. 2024, 165, 105884. [Google Scholar] [CrossRef]
- Yang, X.; Wang, C.; Cao, S.; Wang, F.; Wu, W. Lateral Dynamic Response of Helical Pile in Viscoelastic Foundation Considering Shear Deformation. Appl. Sci. 2023, 13, 12220. [Google Scholar] [CrossRef]
- Chen, L.; Yao, Y.; Liu, H.; Liu, X.; Wu, W.; Mei, G.; El Naggar, M.H. Horizontal vibration characteristics of offshore twin–pile foundations. Ocean Eng. 2023, 290, 116101. [Google Scholar] [CrossRef]
- Wu, W.; Zhang, Y. A review of pile foundations in viscoelastic medium: Dynamic analysis and wave propagation modeling. Energies 2022, 15, 9432. [Google Scholar] [CrossRef]
- Kavvadas, M.; Amorosi, A. A constitutive model for structured soils. Géotechnique 2000, 50, 263–273. [Google Scholar] [CrossRef]
- Savvides, A.A.; Papadrakakis, M. A computational study on the uncertainty quantification of failure of clays with a modified Cam-Clay yield criterion. SN Appl. Sci. 2021, 3, 659. [Google Scholar] [CrossRef]
- ASTM D3689/D3689M-07(2013)e1; Standard Test Methods for Deep Foundations under Static Axial Tensile Load. ASTM: West Conshohocken, PA, USA, 2013. [CrossRef]
- Zhang, D.J.Y. Predicting Capacity of Helical Screw Piles in Alberta Soils. Master’s Thesis, University of Alberta, Edmonton, AB, Canada, 1999. [Google Scholar]


| Soil Type | Water Content (%) | Density (g/cm3) | Gravity | Void Ratio (%) | Compression Modulus (MPa) | Liquid Limit (%) | Plastic Limit (%) | Internal Friction Angle (°) | Cohesion (kPa) |
|---|---|---|---|---|---|---|---|---|---|
| Clay | 12.4 | 1.48 | 2.7 | 1.055 | 7.59 | 23.6 | 14.9 | 27.1 | 15.9 |
| Test Number | Direction of Test Load | Embedment Depth H (m) | Anchor Plate Number n | Anchor Plate Spacing S (m) | Inclination Angle α (°) |
|---|---|---|---|---|---|
| S1 | Uplift | 6.0 | 1 | 0 | 0 |
| S2 | Uplift | 6.0 | 2 | 1.2 | 0 |
| S3 | Uplift | 6.0 | 3 | 1.2 | 0 |
| S4 | Uplift | 6.0 | 4 | 1.2 | 0 |
| S5 | Uplift | 6.0 | 4 | 1.2 | 12° |
| S6 | Uplift | 6.0 | 4 | 1.2 | 17° |
| S7 | Uplift | 7.4 | 1 | 0 | 0 |
| S8 | Lateral | 6.0 | 1 | 1.2 | 0 |
| S9 | Lateral | 6.0 | 2 | 1.2 | 0 |
| S10 | Lateral | 6.0 | 3 | 1.2 | 0 |
| S11 | Lateral | 6.0 | 4 | 1.2 | 0 |
| S12 | Uplift | 4.8 | 1 | 0 | 0 |
| D1 | Uplift | 6.0 | 1 | 0 | 0 |
| D2 | Uplift | 6.0 | 1 | 0 | 0 |
| D3 | Uplift | 6.0 | 4 | 1.2 | 0 |
| D4 | Uplift | 6.0 | 4 | 1.2 | 0 |
| G1-U | Uplift | 6.0 | 4 | 1.2 | 0, 7, 7, 10 |
| G1-L | Lateral | 6.0 | 4 | 1.2 | 0, 7, 7, 10 |
| G2-U | Uplift | 6.0 | 4 | 1.2 | 12, 17, 17 |
| G2-L | Lateral | 6.0 | 4 | 1.2 | 12, 17, 17 |
| Test Number | Nc-5% | Nc-10% | Nc-20% | Test Number | kL |
|---|---|---|---|---|---|
| S1 | 3.33 | 7.04 | 12.29 | S8 | 0.27 |
| S2 | 8.63 | 13.71 | 19.51 | S9 | 0.20 |
| S3 | 8.63 | 16.40 | 25.47 | S10 | 0.31 |
| S4 | 6.28 | 15.11 | 29.64 | S11 | 0.55 |
| S5 | 7.20 | 11.38 | 19.44 | G1-H | 4.85 |
| S6 | 12.62 | 18.96 | 25.91 | G2-H | 2.57 |
| S7 | 3.96 | 7.25 | 12.07 | ||
| S12 | 3.72 | 7.46 | 12.17 | ||
| D1 | 16.94 | 26.43 | 39.89 | ||
| D2 | 13.30 | 20.21 | 30.89 | ||
| D3 | 20.35 | 39.17 | 59.34 | ||
| D4 | 23.26 | 38.77 | 58.37 | ||
| G1-U | 12.29 | 47.72 | 64.99 | ||
| G2-U | 26.87 | 33.45 | 78.84 |
Disclaimer/Publisher’s Note: The statements, opinions and data contained in all publications are solely those of the individual author(s) and contributor(s) and not of MDPI and/or the editor(s). MDPI and/or the editor(s) disclaim responsibility for any injury to people or property resulting from any ideas, methods, instructions or products referred to in the content. |
© 2024 by the authors. Licensee MDPI, Basel, Switzerland. This article is an open access article distributed under the terms and conditions of the Creative Commons Attribution (CC BY) license (https://creativecommons.org/licenses/by/4.0/).
Share and Cite
Yuan, C.; Hao, D.; Ding, S.; Ding, M. Field Experimental Study on the Uplift and Lateral Capacity of Deep Helical Anchors and Grouped Helical Anchors in Clays. Buildings 2024, 14, 662. https://doi.org/10.3390/buildings14030662
Yuan C, Hao D, Ding S, Ding M. Field Experimental Study on the Uplift and Lateral Capacity of Deep Helical Anchors and Grouped Helical Anchors in Clays. Buildings. 2024; 14(3):662. https://doi.org/10.3390/buildings14030662
Chicago/Turabian StyleYuan, Chi, Dongxue Hao, Shijun Ding, and Mintao Ding. 2024. "Field Experimental Study on the Uplift and Lateral Capacity of Deep Helical Anchors and Grouped Helical Anchors in Clays" Buildings 14, no. 3: 662. https://doi.org/10.3390/buildings14030662