Abstract
Due to the impact of climate change, extreme rainfall events are becoming more frequent, resulting in shallow slope collapse and erosion that trigger debris flows. While traditional reinforcement methods like anchoring and nailing are effective, they can be costly and environmentally unfriendly. To address this issue, researchers have investigated using in situ soil reinforcement with vegetation, which is a more sustainable and economical option. In this study, a soil improvement agent was developed using leaf mold and herbal medicine to promote vegetation growth. Adding microcement and gypsum hemihydrate increased the shear strength of the soil, preventing surface erosion. A laboratory test confirmed that the combination of these ingredients effectively increased the soil’s resistance to erosion caused by rainfall. The soil improvement agent proposed in this study was applied to the case of the slope failure in the Gwangju area, South Korea, to confirm the slope stability for 10 days of rainfall. The results of numerical analysis confirmed that the reinforced slope cured by the pozzolanic reaction using the developed material improved the slope stability by 36% compared to the original soil slope during the rainy season.
1. Introduction
Due to global climate change, slope collapse is particularly prevalent during the rainy season, when typhoons and extreme rainfall occur. Even slopes designed for safety are susceptible to erosion of the ground surface, water infiltration, tensile cracking, and soil deformation caused by debris flows, which can compromise ground structure safety over time. Shallow failure parallel to the slope is a common type of slope failure, which is primarily caused by erosion and scour generated by water flow on the ground surface [1,2].
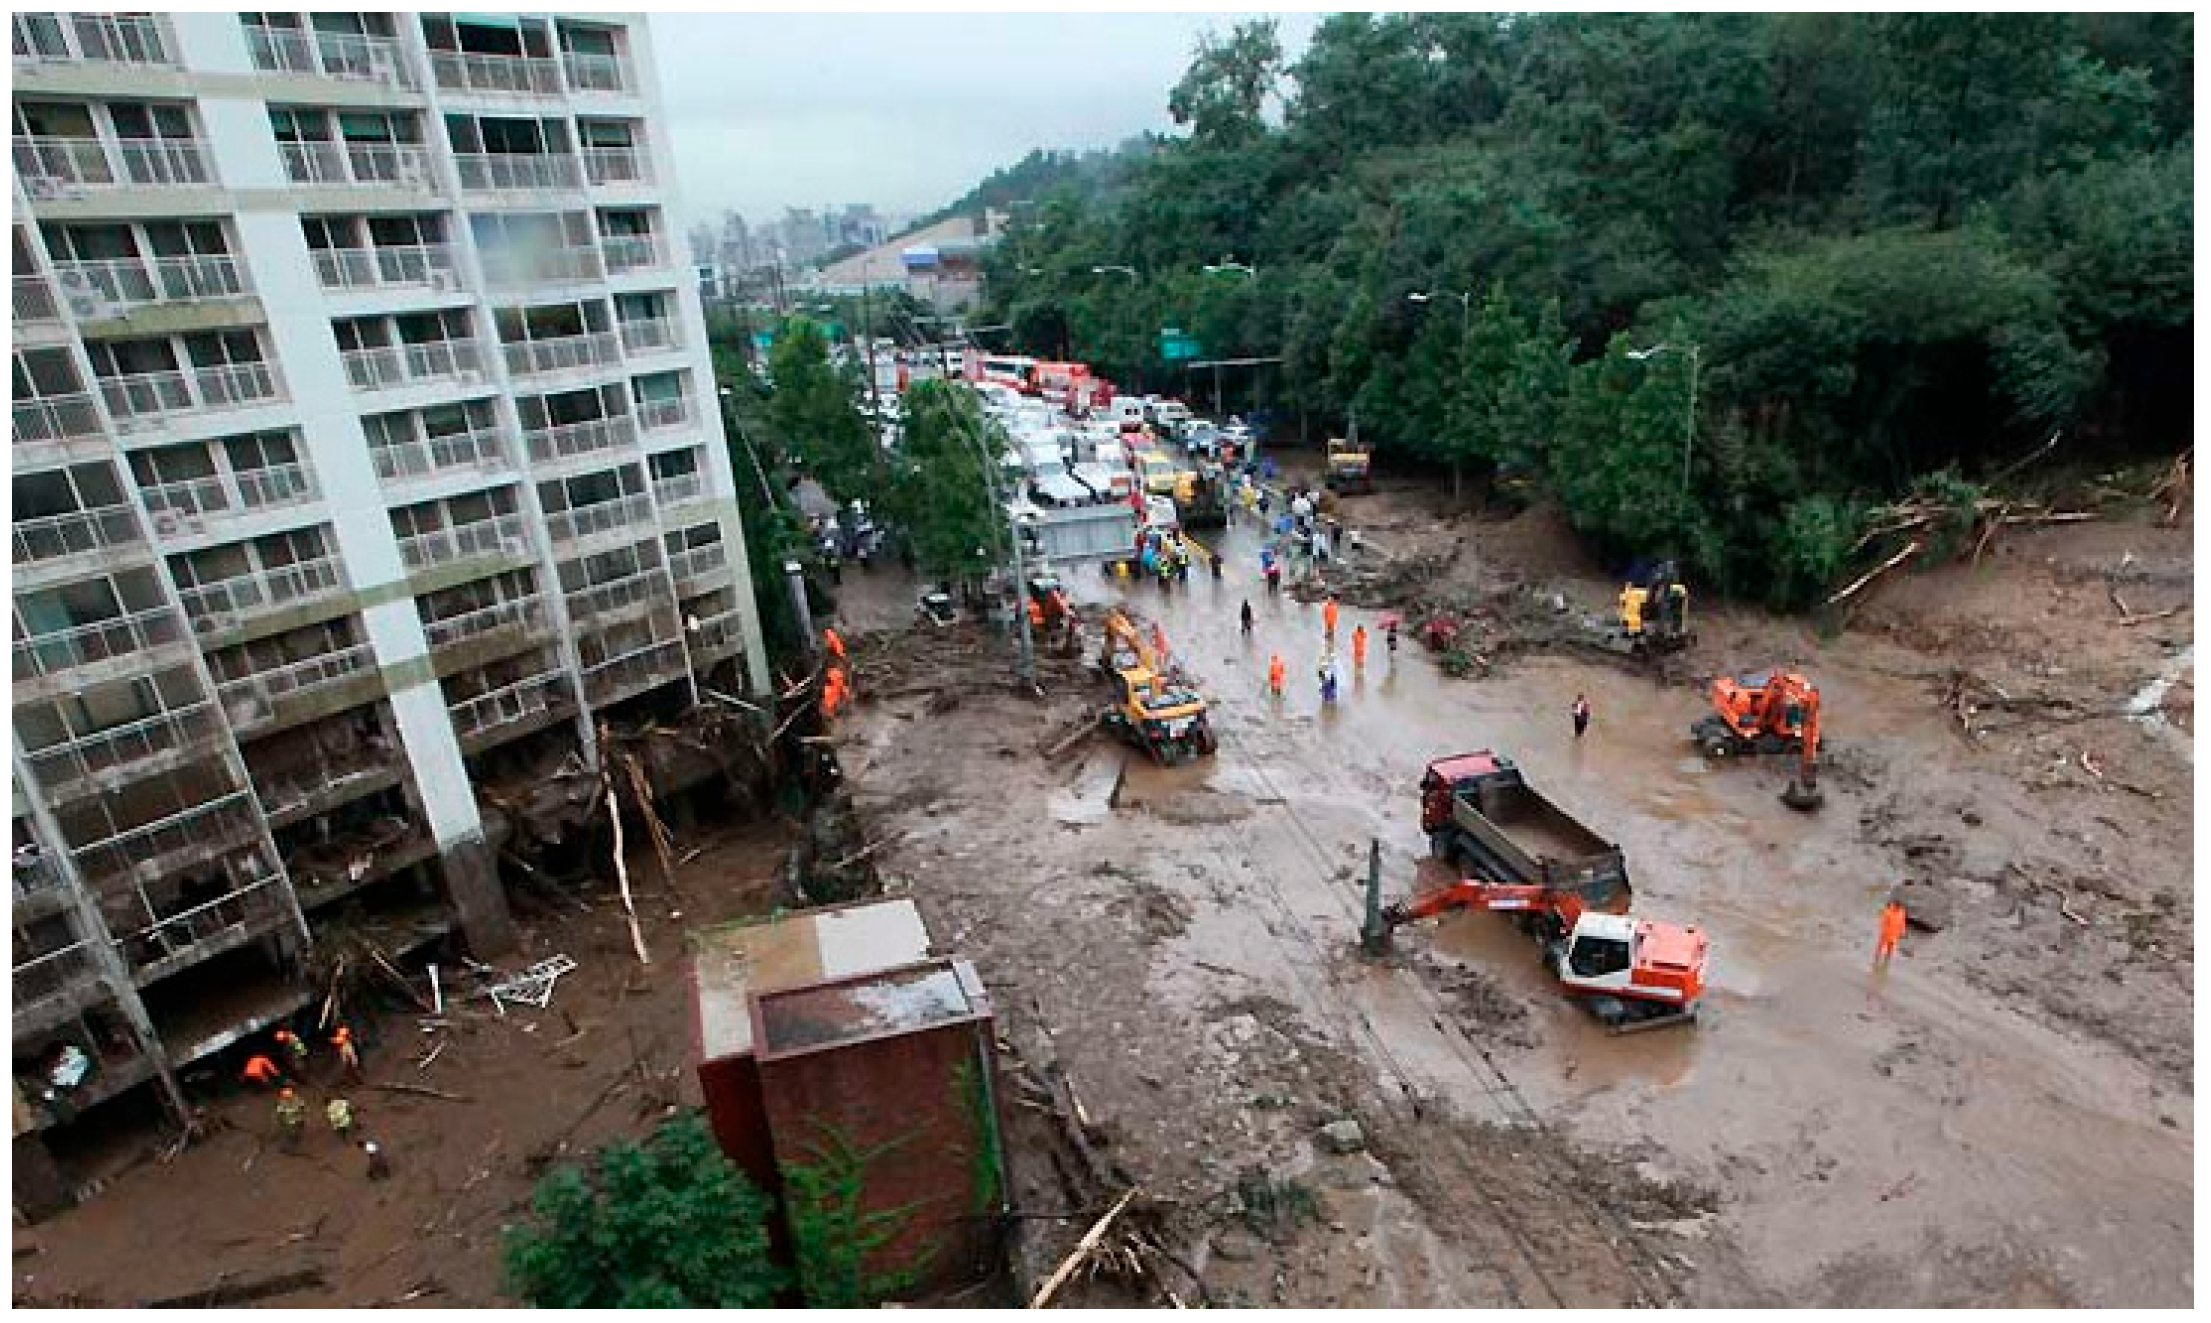
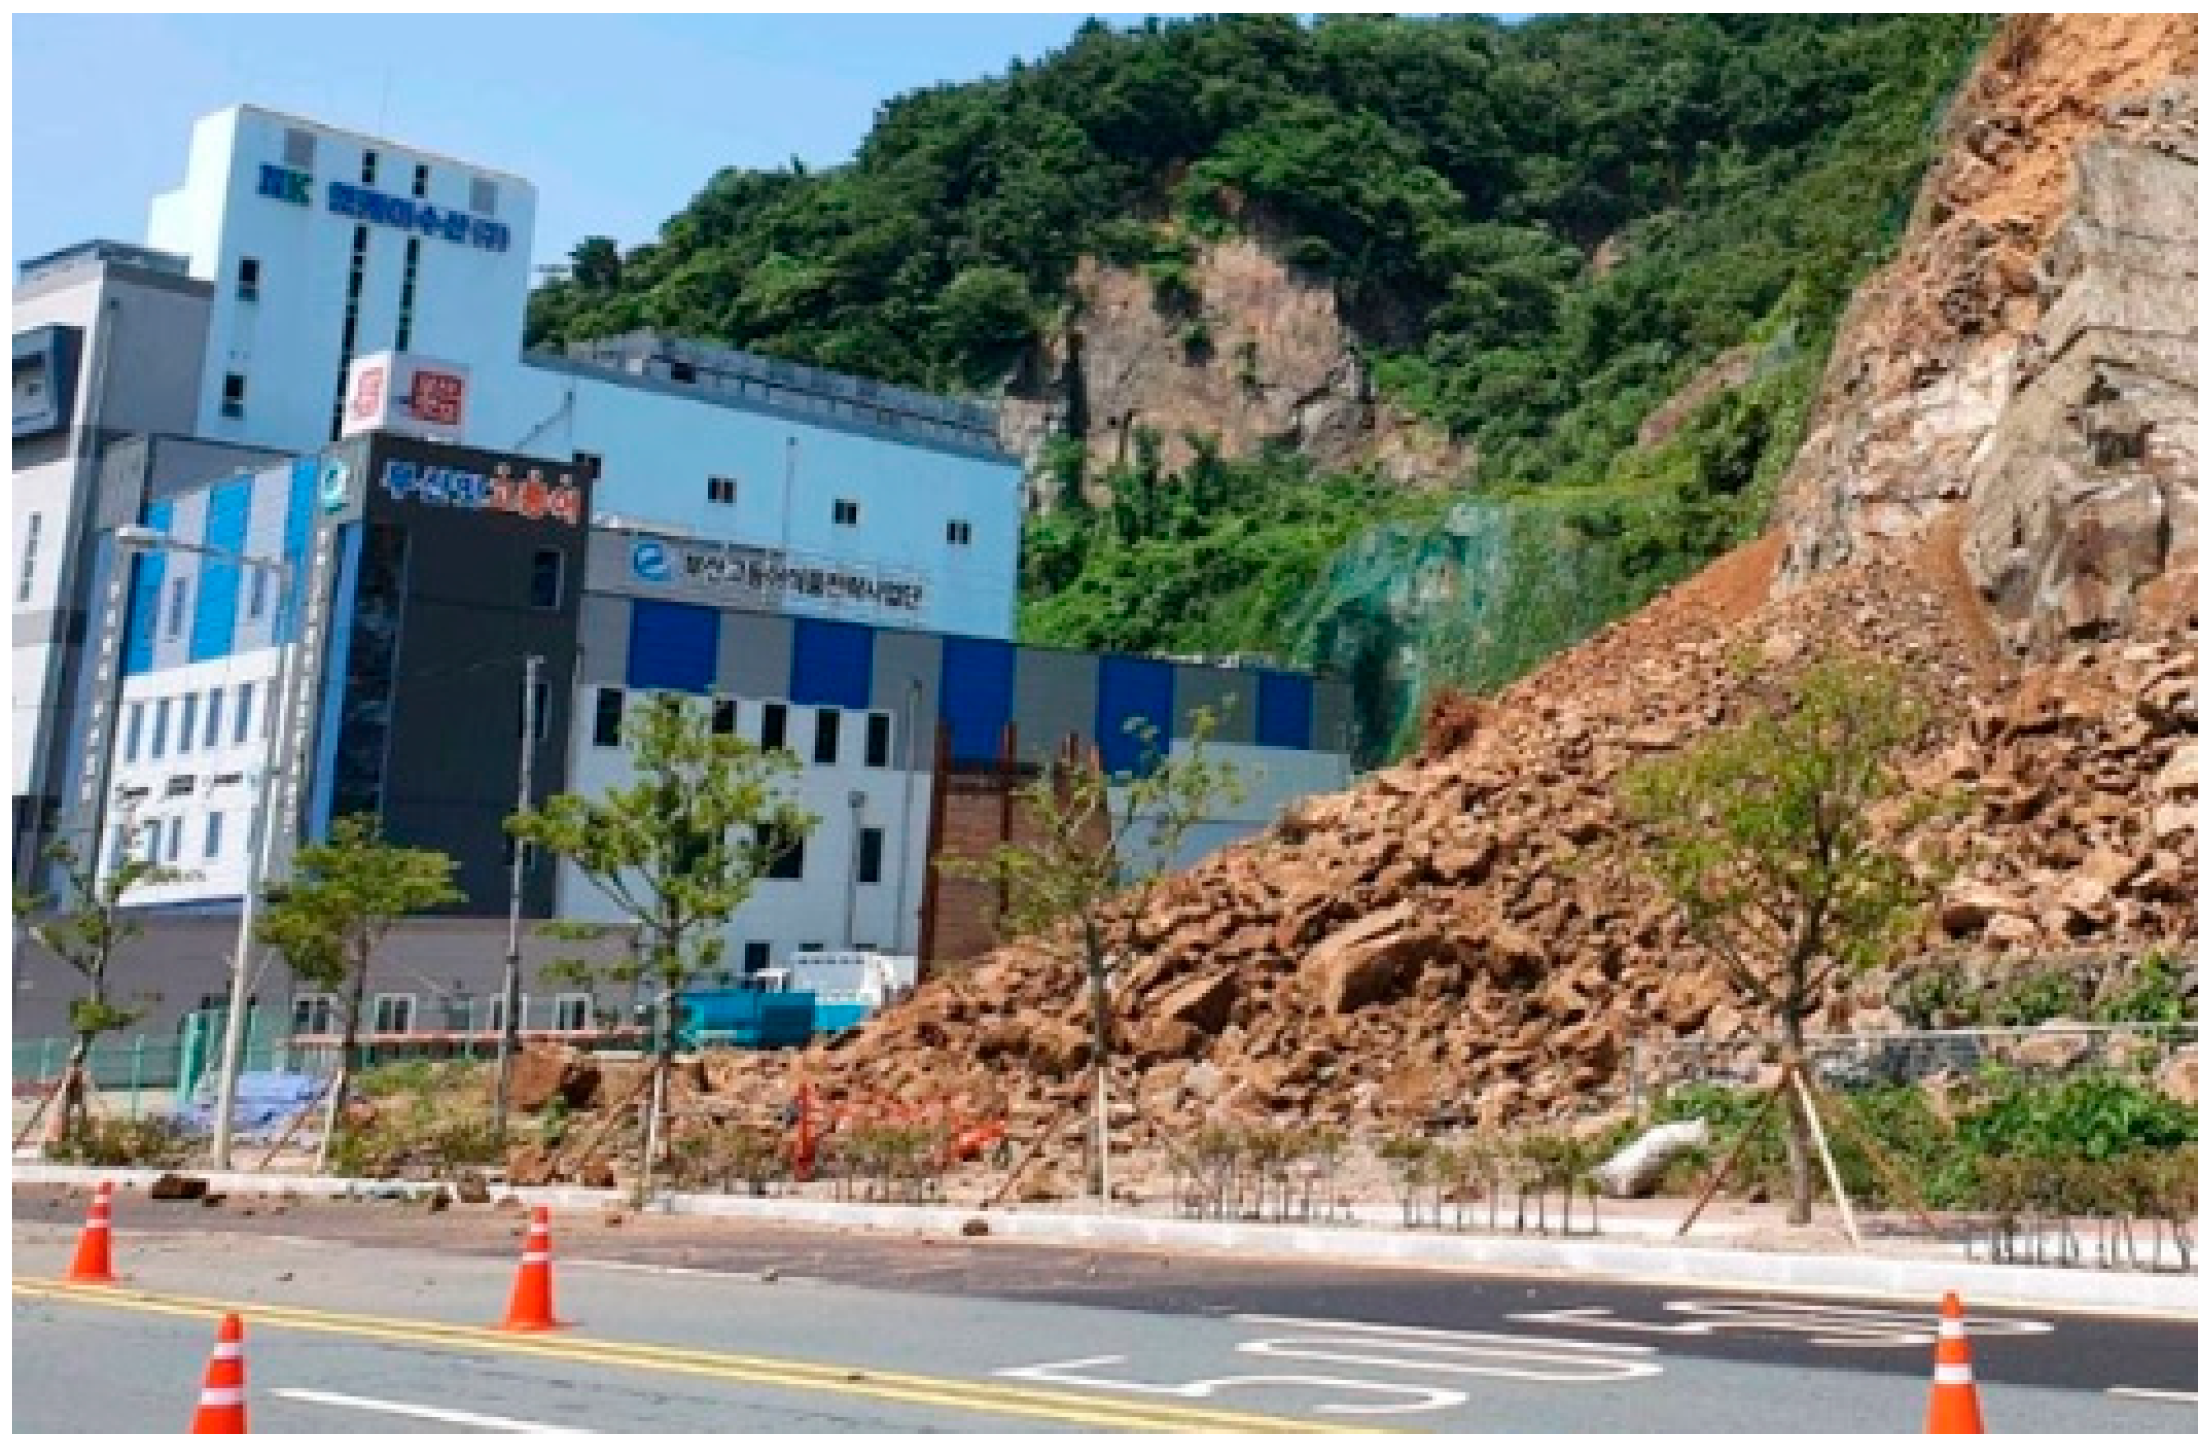
On 27 July 2011, many landslides and debris flows occurred simultaneously in the study area. A total of 151 landslides and 33 debris flows expanded from one or more landslides were reported (Figure 1) [1]. While traditional reinforcement methods such as outwardly rugged and threatening anchoring and nailing have been widely used, slopes in urban areas require eco-friendly reinforcement methods to reduce property and human damage. Figure 2 also shows that the slope around the building structure is subject to dangerous conditions due to the weathering and scouring of soil slopes.

Figure 1.
Inundation of apartments caused by debris flow on surrounding slopes due to heavy rain (Umyeonsan Mt. in Seoul, Korea, 2011).

Figure 2.
Building damage caused by weathering and scouring of soil slope in urban areas (Busan, Korea, 2021).
The method of reinforcing the surface of the slope using the original soil in situ is an economical and effective method among other reinforcement methods. Various reinforcement methods are available depending on the cement mixing ratio, and each method may or may not promote vegetation growth. Vegetation is known to significantly improve the shear strength of the surface layer, thereby preventing erosion and scour damage that can cause shallow or circular failure [3,4].
Continuous rainfall during the rainy season can penetrate deep into the ground over time, causing most of the rainwater to flow along the slope surface due to the sealing effect. Many studies have reported that a reduction in shear strength caused by infiltration fronts penetrating into the ground is the primary cause of slope failure due to rainfall [5,6]. Therefore, studies have been conducted to simulate the rainfall-induced behavior of unsaturated soil, including water infiltration and erosion on the ground surface. Although it is difficult to analyze the processes of scour and erosion, many studies have evaluated the effectiveness of surface reinforcement against these phenomena through unsaturated soil analysis. For example, Cui et al. [7] observed the onset of shallow failure on a large slope considering ground flow and surface runoff, while Meier et al. [8] proposed a probabilistic evaluation method to estimate the thickness and volume of a small and shallow initial landslide collapse based on surface area.
This study focuses on an eco-friendly soil improvement agent that promotes surface vegetation, which can effectively prevent scour and erosion caused by rainfall while enhancing the strength of the slope surface layer. Conventionally, the instability of the surface layer or soil erosion is addressed by using fly ash or cement as ground improvement agents for slope reinforcement. However, the use of fly ash significantly declined due to environmental pollution concerns, as noted by Kim et al. [2]. In contrast, a soil improvement agent offers a practical and effective slope reinforcement method to prevent debris flows resulting from shallow slope failure caused by rainfall, as emphasized by Edil et al. [5].
To evaluate the effectiveness of the reinforcement method, this study conducted laboratory tests on rainfall erosion and verified the results using numerical analysis by applying the shear strength obtained from uniaxial compression tests. The degree of erosion was evaluated by comparing the results of the laboratory test for the no-reinforcement slope with the surface-reinforced slopes that utilized four soil improvement agents. The reinforcement effects of the soil improvement agents were assessed by analyzing the strength increase according to the soil improvement agent’s curing period and comparing the loss rate of the slope surface layer in the rainfall experiment for each added material. Furthermore, this study applied herbal medicine, which is not typically found in conventional soil improvement agents, as an additive to serve as fertilizer that accelerates the growth of vegetation. The findings of this study demonstrate that a soil improvement agent that promotes surface vegetation, particularly C-82-9-9, exhibits superior performance in preventing soil erosion and reinforcing slope surface layer strength. The C-82-9-9-9 type, which has the most active pozzolanic activity, provides an alternative to filling the void in the new material matrix and increasing its strength to reinforce rainfall-induced instability [9,10,11].
2. Characteristics of Soil Improvement Agents
2.1. Main Ingredients and Additives
To investigate the impact of rainfall on slope surface erosion and scour, this study utilized weathered granite soil located in Unam-dong, Gwangju, as in situ soil. A laboratory test was conducted to determine the shear strength of the soil based on various additive mix proportions outlined in Table 1. The main ingredients of the soil improvement agents included in situ soil, leaf mold, used herbal medicine, and natural fibers, which comprised 82–84% of the weight ratio. Additives such as a bonding agent, hardener, powder multiplier agent, high-absorbent polymer, and humectant made up 7–10% of the overall content. Mix proportions were adjusted to enhance strength.

Table 1.
Mixing specification of soil improvement mixture.
To prevent the scour and erosion of the slope surface layer caused by extreme rainfall, additives were utilized to enhance the strength of the original soil. The soil improvement agents included humectant and used herbal medicine, which promote natural scenery and vegetation over an extended period of time. As for the evaluation of environmental pollution, it is judged that there are no environmentally harmful substances to water pollution or soil through the fish poison test.
A laboratory test was conducted to determine the optimal mix proportions and compare the physical and mechanical properties of four types of soil improvement agents, including the original soil sample. The main ingredients, excluding moisture content, constituted 90% of the sample, with in situ soil being the predominant ingredient. The four soil improvement agents were categorized into two groups, with two samples having 82% of the main ingredients and two samples having 84%. Within each group, the samples were further divided into those containing 8% of the additives and those containing 9%.
2.2. Physical and Mechanical Properties of Samples
To conduct this study, in situ soil was collected from a weathered granite slope in Unam-dong, Gwangju. The physical properties of the original soil sample were evaluated through laboratory testing, and the results are presented in Table 2.
Table 2.
Physical properties of basic soil.
Based on the laboratory test results conducted on the sample collected from the slope, it was found that the uniformity coefficient (Cu) and coefficient of curvature (Cc) were 12.1 and 0.6, respectively. These values indicate that the soil belongs to the SP group, which is classified as sandy soil with poor particle size distribution according to the Unified Soil Classification System (USCS).
The soil compaction test was carried out by ASTM D-698, A-method, and the relative density (Dr) of the lab. test was adjusted to around 70–75%, similar to the field density in South Korea. Similar to the concrete curing system, the curing process was performed by mixing a soil improvement agent to form a sample, and the strength was measured after each day at room temperature (20–25 °C) in the indoor laboratory [12].
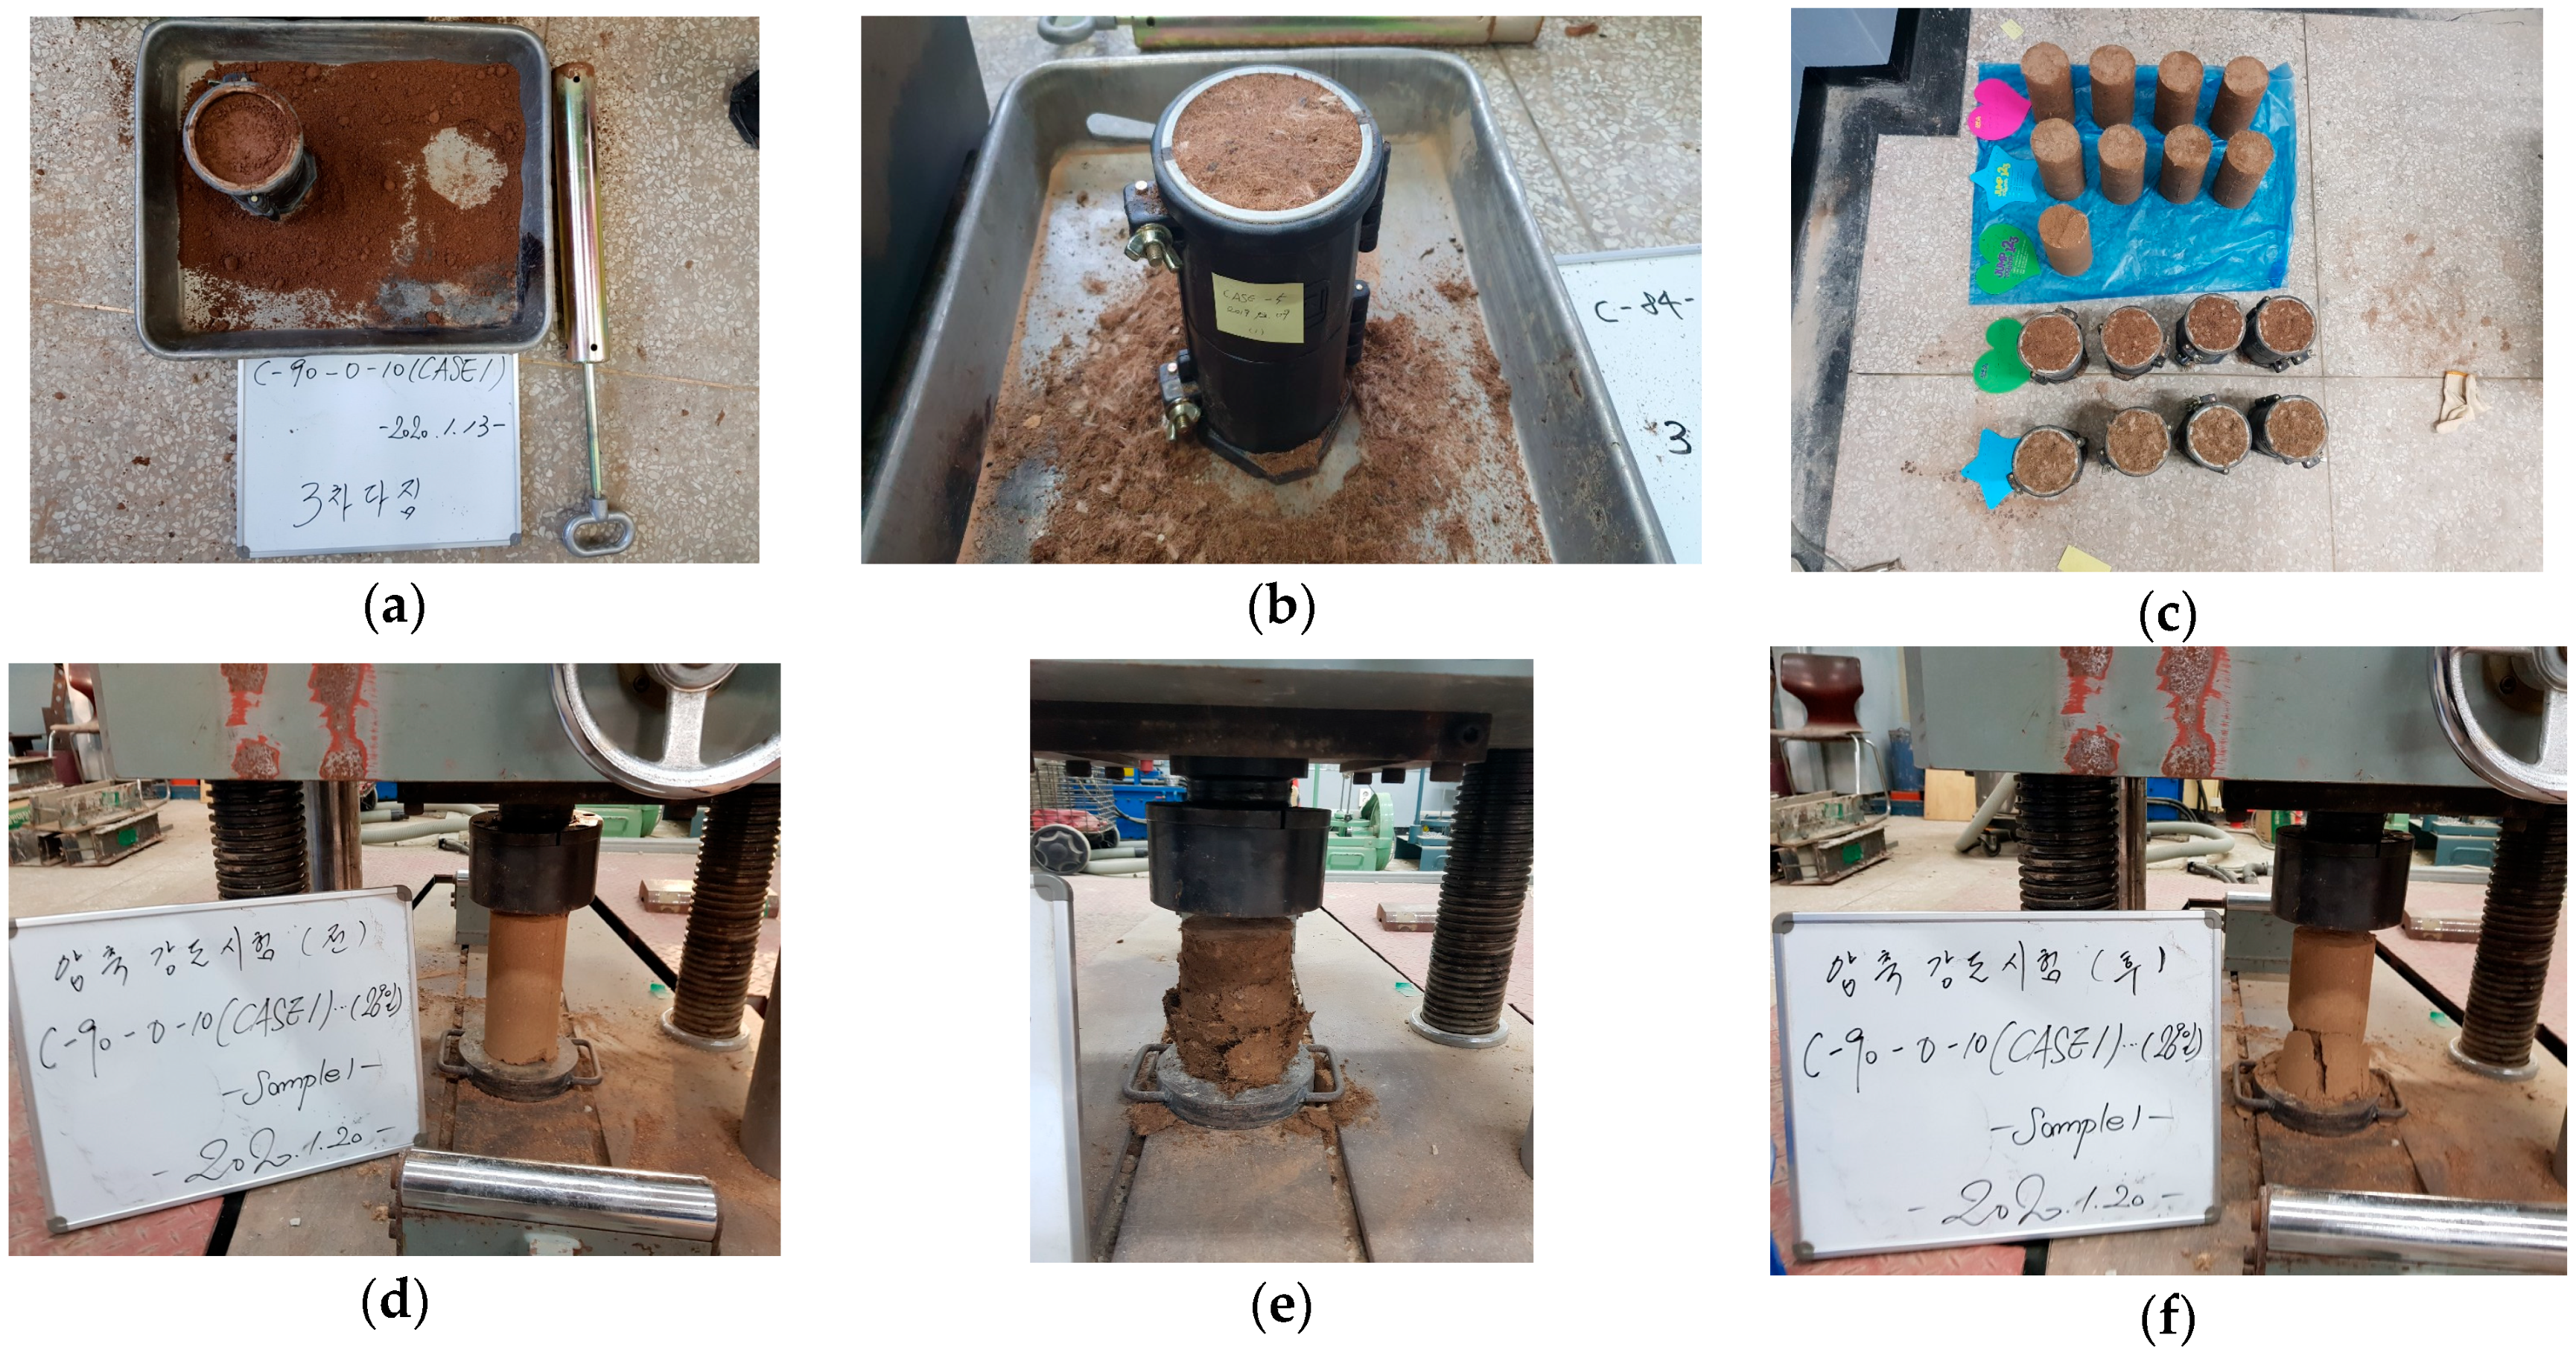
Figure 3 and Table 3 present the results of the uniaxial compression test conducted on cylindrical specimens (∅10 × 20 cm) prepared from five soil samples, including the original soil and four soil improvement agents. The test aimed to compare the uniaxial compressive strength of the samples according to the content of the soil improvement agents. The specimens containing cement-based additives, except for the original soil sample, were tested for strength improvement at different curing times (3, 7, and 28 days).

Figure 3.
Sample preparation and uniaxial compression test. (a) Mixture preparation; (b) compaction of soil mixture; (c) soil mixture with curing time; (d) uniaxial compression test; (e) failure of uniaxial test; (f) measurement by type.
Table 3.
Uniaxial compressive strength according to proportion of agent with curing time.
The uniaxial compressive strength of the original soil sample (C-90-0-10) was found to be 2.22 MPa after 28 days. However, the other samples showed a significant increase in strength, with values 6 to 10 times higher than the original soil sample at the same age. Among the soil improvement agents, C-84-8-8 showed the highest development of the uniaxial compressive strength at 3 and 7 days, with a strength of 9.35 MPa. However, it had a relatively small increase in strength at 28 days compared to other agents, with a strength of 13.29 MPa. On the other hand, C-82-9-9 showed the highest uniaxial compressive strength of 22.12 MPa at 28 days, but its initial strength at 3 days was relatively low at 4.73 MPa.
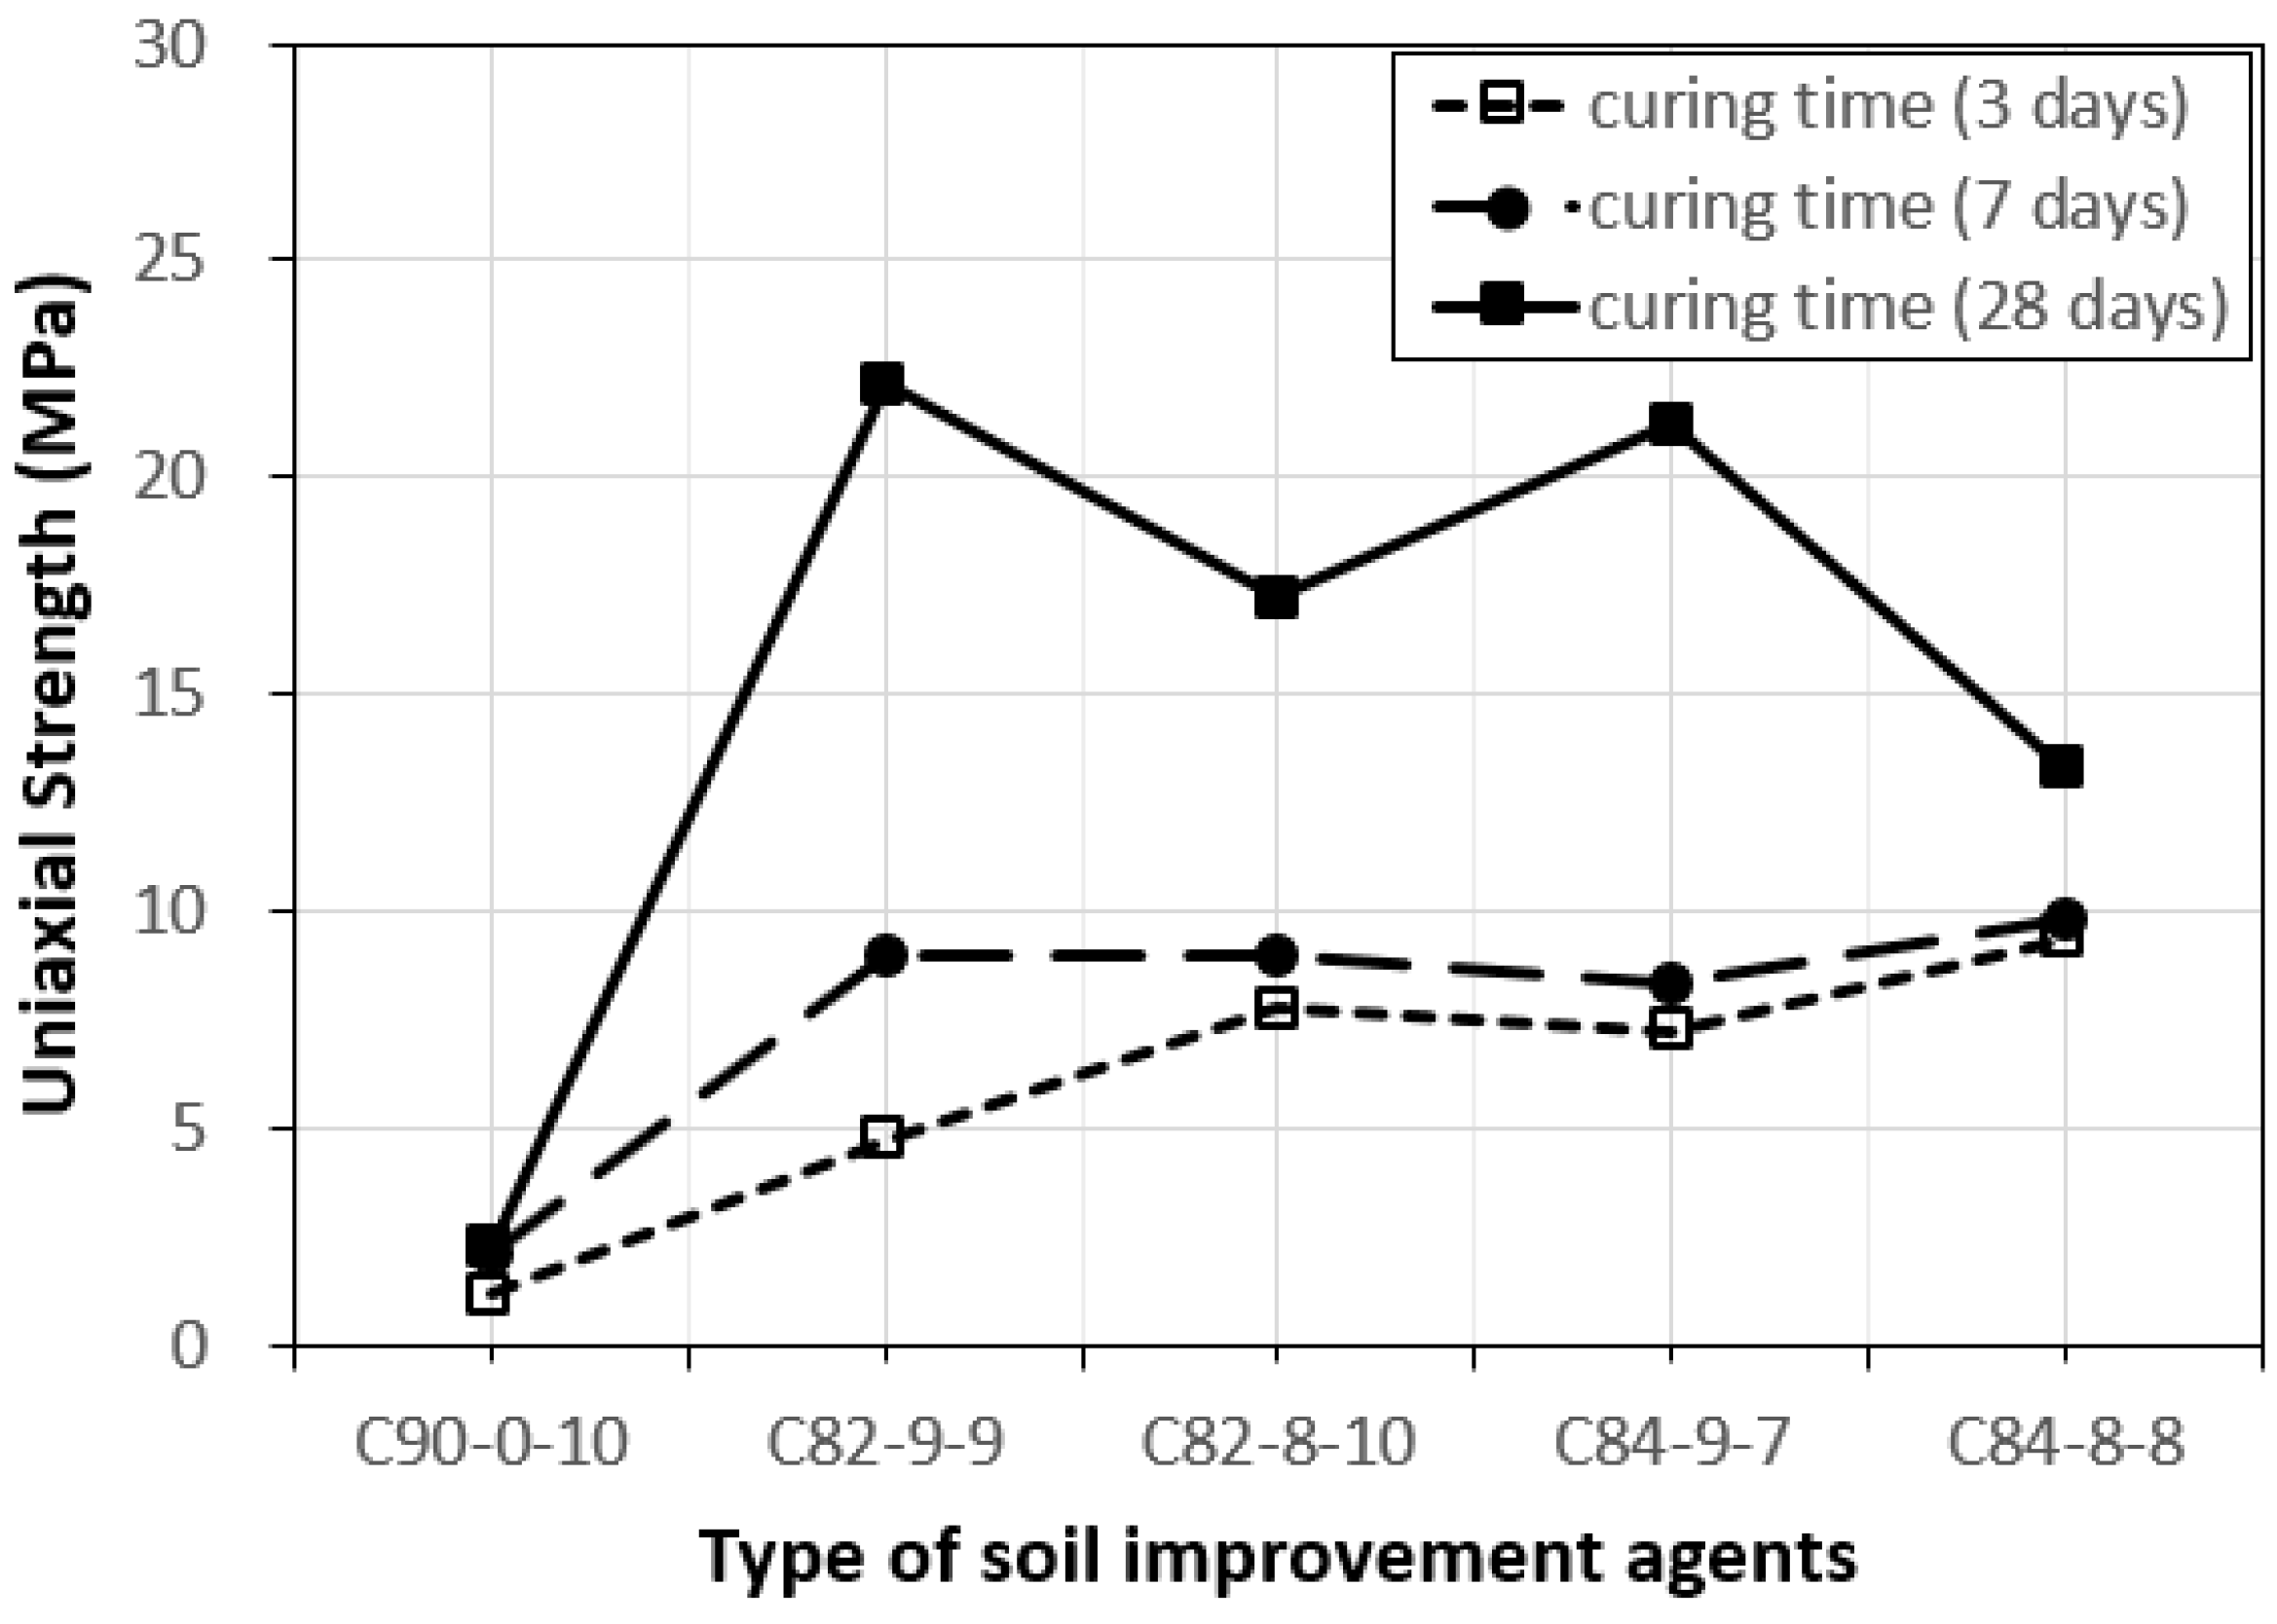
Figure 4 illustrates the uniaxial compressive strengths of soils mixed with four soil improvement agents, including the original soil (C-90-0-10) sample, at curing times of 3, 7, and 28 days. Among the samples mixed with soil improvement agents, C-84-8-8 showed the highest initial uniaxial compressive strength, but its strength at 28 days was the lowest. On the other hand, C-82-9-9 exhibited the highest uniaxial compressive strength at 28 days, but its initial strength was the lowest. This could be due to the low weight content of the original soil and the significant improvement in strength with increasing curing time, thanks to the high content of the microcement and hardener.
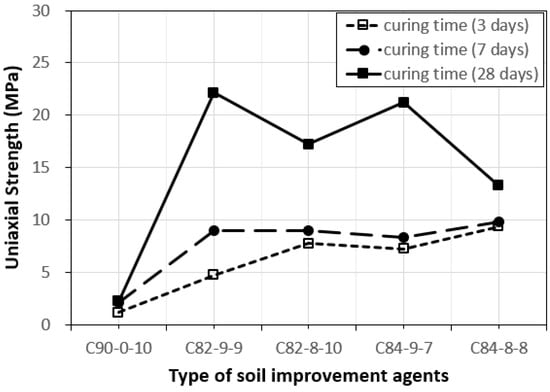
Figure 4.
Uniaxial compressive strength of mixed soils.
In applications where soil mixed with a soil improvement agent is necessary, an appropriate level of initial uniaxial compressive strength is required to maintain slope stability during rainfall. For the long-term maintenance of the soil surface layer stability, high uniaxial compressive strength at 28 days is also needed. Increasing the weight ratio of the original soil and additives and reducing the water content are necessary to improve the initial uniaxial compressive strength. It is expected that the uniaxial compressive strength at 28 days will increase as the proportion of the hardener increases.
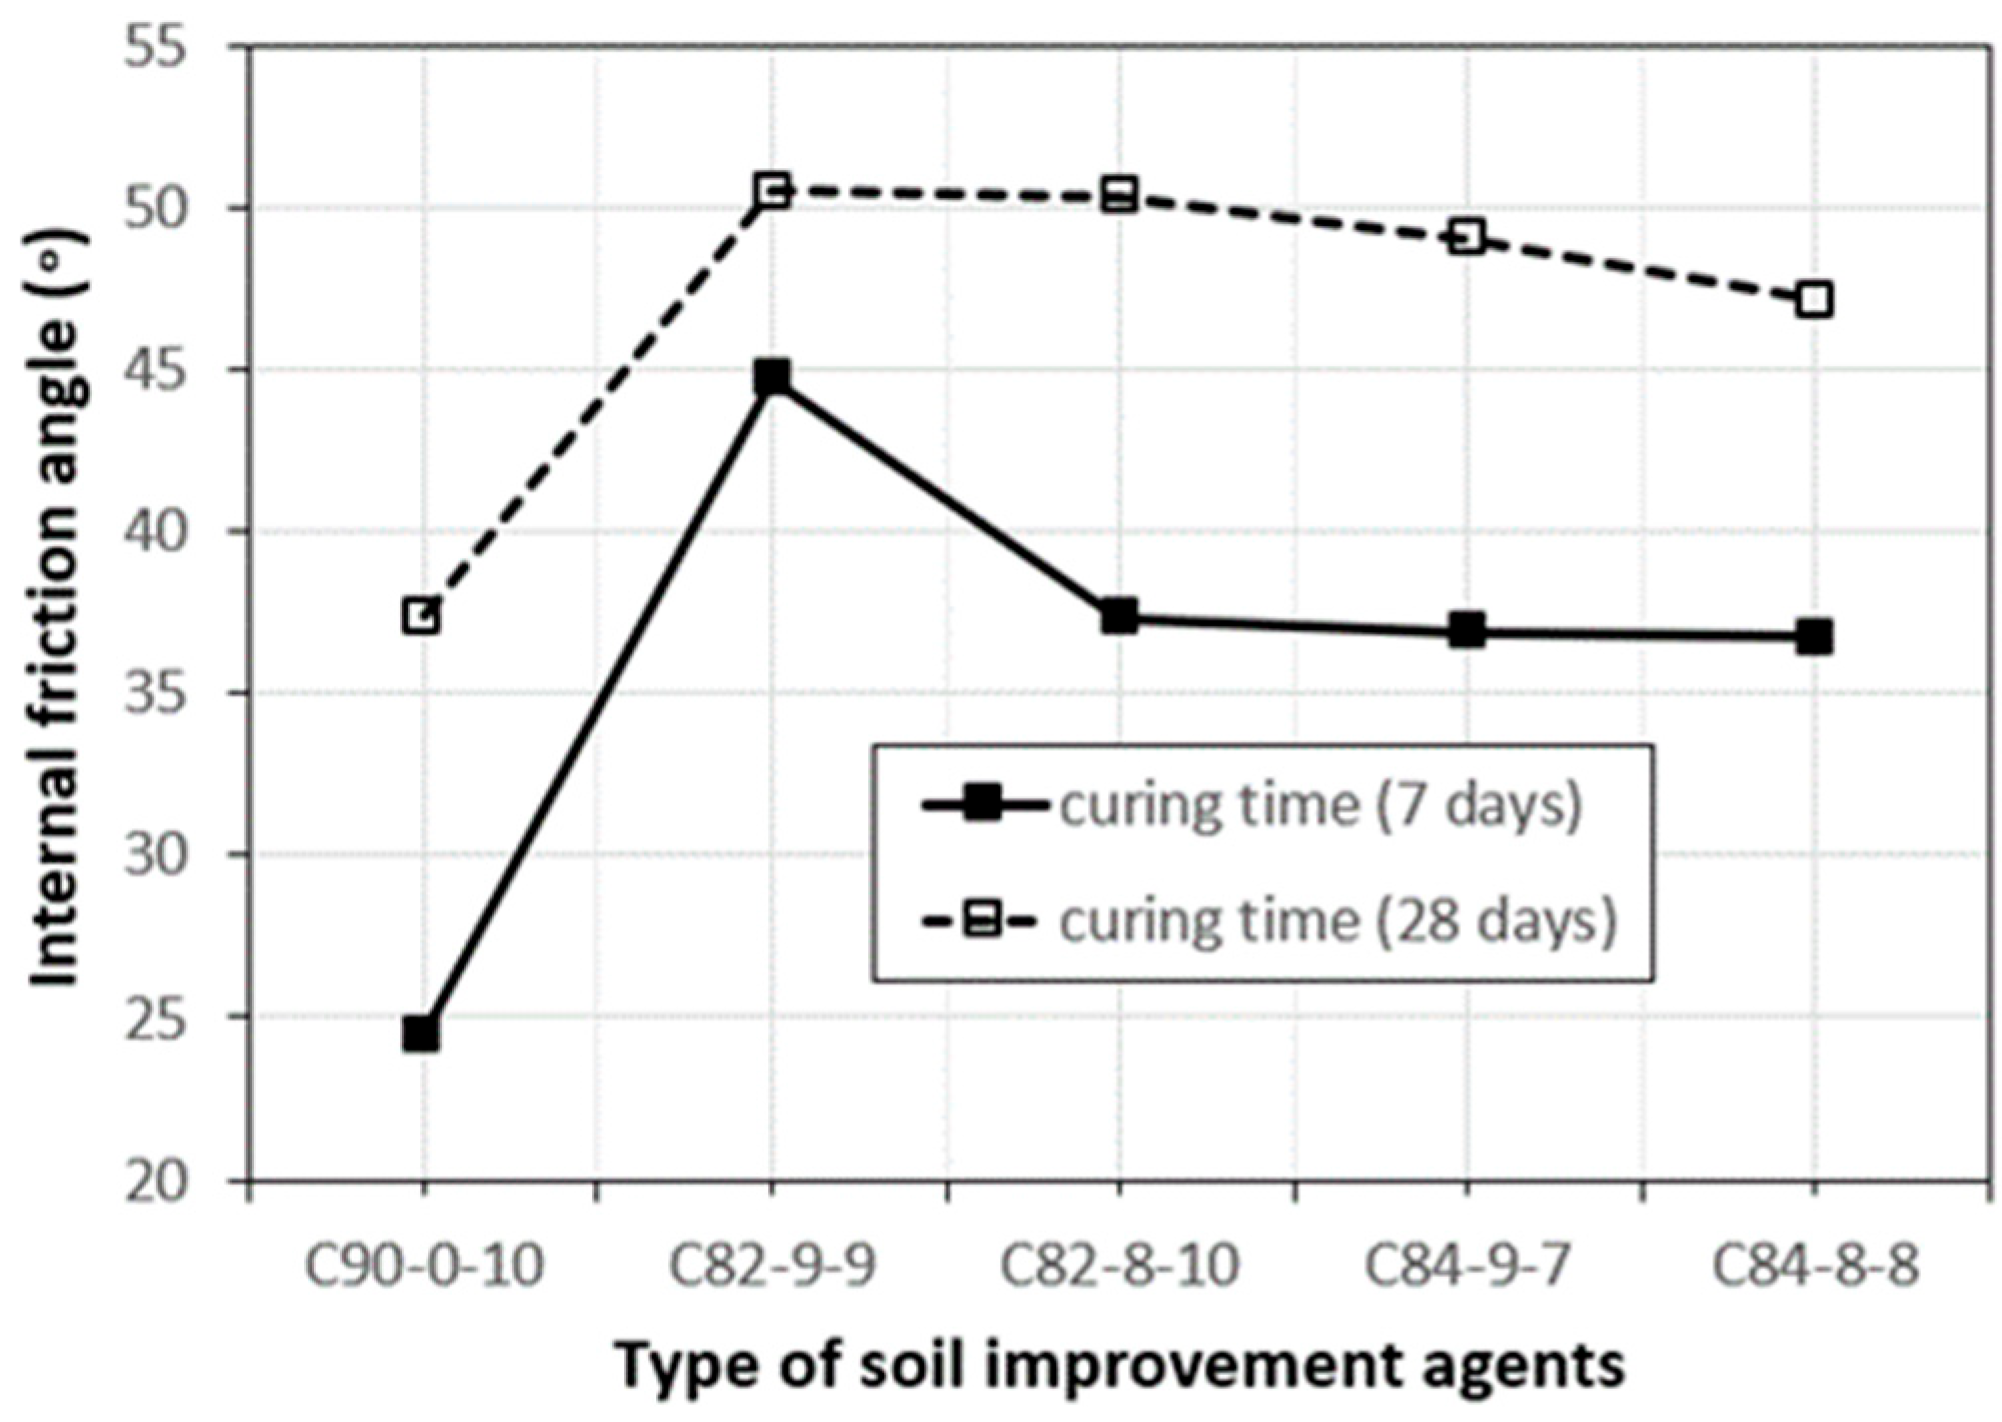
To ensure the reliability of the uniaxial compression test results, the direct shear test was conducted to compare the internal friction angle and the magnitude of the shear strength of cohesion. The test was performed using cylindrical specimens with a diameter of 60 mm and a length of 20 mm in accordance with KS F 2343. Table 4 clearly shows that both the cohesion and internal friction angle increased as the curing time increased for each test case compared to the original soil (C-90-0-10). The cohesion of C-84-8-8 was the highest at 7 days of age (65.43 kPa) but decreased to 39.59 kPa at 28 days. On the other hand, the cohesion of C-82-9-9 was only 44.13 kPa at 7 days but increased to 54.64 kPa at 28 days, indicating slight differences in the curing action depending on the additives. In terms of the cohesion and internal friction angle in the direct shear test results, C-82-9-9 showed a 78% increase in cohesion and an 82% increase in the internal friction angle compared to the original soil at 7 days and a 255% increase in cohesion and a 35% increase in the internal friction angle at 28 days. These findings suggest that the strength improvement agents obtained from the direct shear test are similar to those obtained from the uniaxial compression test.
Table 4.
Shear strength parameter according to proportion of agent with curing time.
Figure 5 and Figure 6 present a graphical comparison of the cohesion and internal friction angle results reported in Table 4. The data suggest that the C-82-9-9 soil improvement agent consistently improved the strength of the soil, showing a steady increase in cohesion and the internal friction angle at both 7 and 28 days of age.
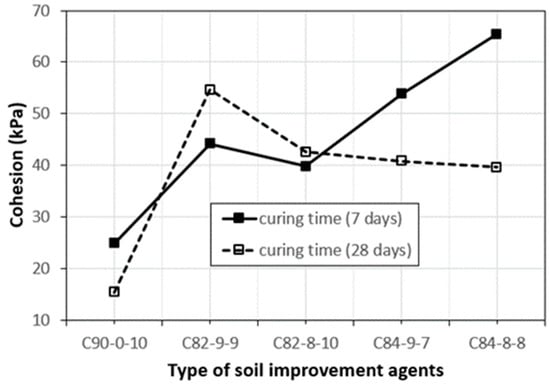
Figure 5.
Cohesion variation of mixture.
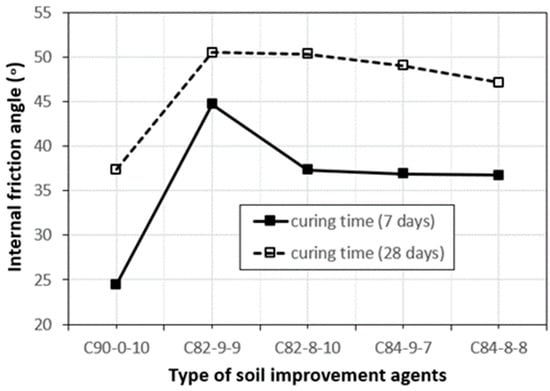
Figure 6.
Friction angle variation of mixture.
3. Laboratory Model Test
3.1. Experimental Setup for Rainfall Model Test
An experimental setup was created in the laboratory to investigate the effectiveness of materials in reinforcing the ground surface against heavy rainfall. To analyze the surface failure types and scour in response to soil improvement agents, soil slope plates were prepared, and an experimental setup was constructed as shown in Figure 7. The original soil was mixed with additives and compacted to create soil slope models. The test was then conducted by simulating rainfall conditions artificially. Rectangular soil slope plates (40 × 84 × 7 cm) were fabricated as specimens to resemble the slope conditions, and they were supported by an angle frame, as shown in Figure 7d. Four specimens were prepared for each test case with a compaction rate of over 90%, and the slope of the model test slope was set to 1:1.5 (vertical–horizontal), based on the design standards of the Ministry of Land, Infrastructure, and Transport [3] for slopes ranging from 0 to 6 m in height and 5 m or higher in cutting earth slope. An acrylic box was also created to function as a rainfall simulator capable of storing water. The rainfall model test for erosion in the soil slope applied a rainfall intensity of 30 mm/hr, which is the average value of showers most common during the rainy season in South Korea. The experimental setup allowed for the examination of the surface failure types and scour, taking into account the effects of various soil improvement agents on the slope.
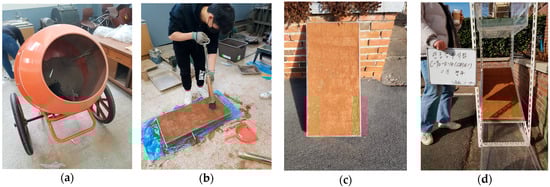
Figure 7.
Experimental procedure for soil slope erosion test by rainfall. (a) mixing process of samples; (b) compaction of soil mixture; (c) curing time by type; (d) slope frame set for rainfall test.
3.2. Rainfall Erosion Test Results
To observe and analyze the effects of rainfall on soil erosion and scour, a model test was conducted using a rainfall simulator, wooden frame, and soil box, as depicted in Figure 8 and Figure 9. The test included five samples, including in situ soil, but only photographs of the in situ soil slope and C-82-9-9, which showed the largest difference in the loss rate, were presented as rainfall test results over time, as shown in Figure 8 and Figure 9. The results of the in situ soil (C-90-0-10) rainfall test showed a clear soil loss in the form of scour immediately after the start of rainfall. Over time, the degree of scour became increasingly severe, and after 15 min, rainwater infiltrated the soil and caused the surface to slide, resulting in failure [2,13].

Figure 8.
Erosion test due to rainfall with various times (original soil: C-90-0-10). (a) 5 min after rainfall; (b) 10 min after rainfall; (c) 15 min after rainfall; (d) 20 min after rainfall; (e) 30 min after rainfall.
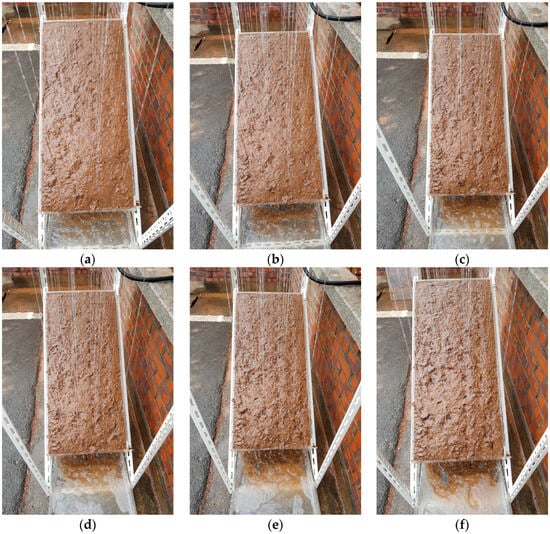
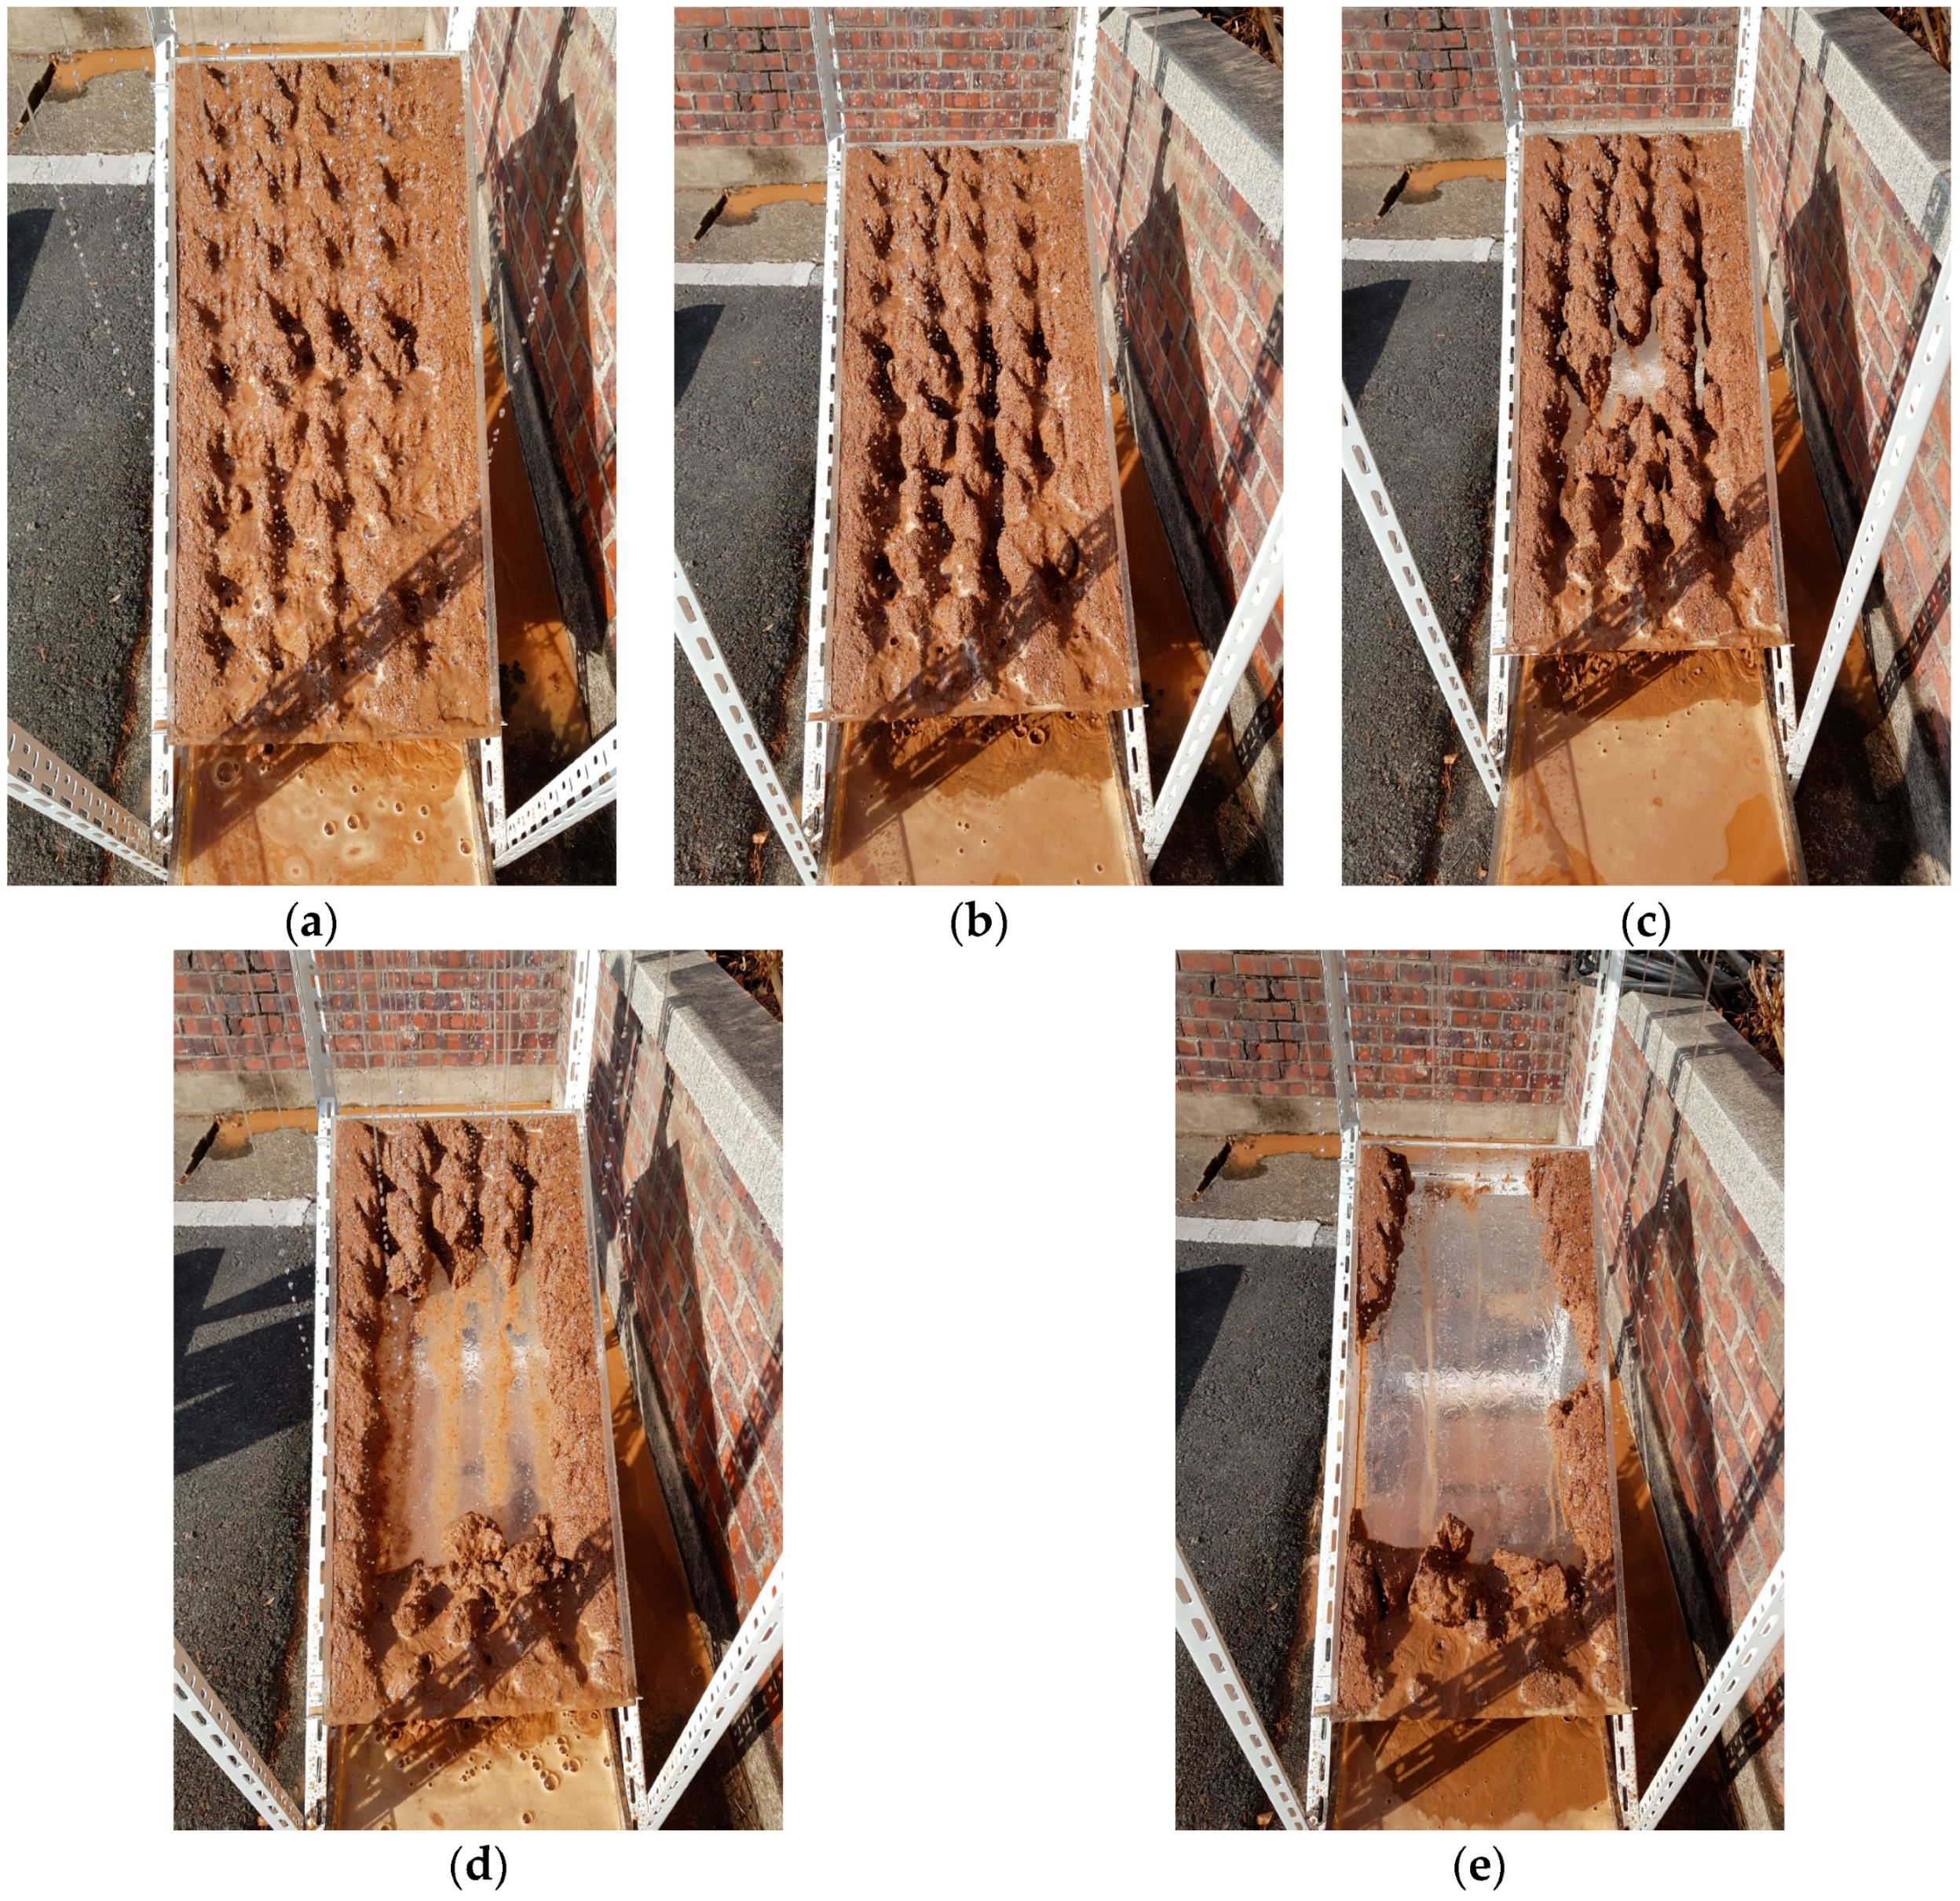
Figure 9.
Erosion test due to rainfall with various times (mixed soil: C-82-9-9). (a) 5 min after rainfall; (b) 10 min after rainfall; (c) 20 min after rainfall; (d) 30 min after rainfall; (e) 40 min after rainfall; (f) 60 min after rainfall.
As shown in Figure 9, the rainfall test results of C-82-9-9 demonstrate that the surface soil loss was significantly reduced, and the properties of the surface were maintained immediately after rainfall, unlike in situ soil (C-90-0-10). In the rainfall test results of C-82-8-10, the soil loss was reduced compared to in situ soil (C-90-0-10), and scour loss caused by a fall did not occur. In the rainfall test results of C-84-9-7, scour caused by a fall occurred, but almost no soil loss occurred compared to in situ soil. In the rainfall test results of C-84-8-8, the soil loss was significantly reduced compared to in situ soil (C-90-0-10). However, scouring began to occur on the surface due to the fall of rainwater after 30 min, even though there was almost no surface loss until 20 min.
The soil improvement agents containing 2% more additive components (C-84-9-7 and C-84-8-8) exhibited slightly more erosion compared to those with 82% of main ingredients (C-82-9-9 and C-82-8-10) in various mixes. However, it was observed that the use of hardeners, such as microcement, hauyne cement, and gypsum hemihydrate, improved erosion resistance during the 30 mm rainfall test, with the level of improvement being dependent on the curing period.
The weight of the original soil sample (C-90-0-10) decreased from 34.5 kg to 26.7 kg after the test, indicating a soil loss of 77%. However, all of the soil improvement agents showed a remarkably low loss rate (0.40 to 0.94%) in comparison to the original soil (C-90-0-10). Among the various agents tested, C-82-9-9 demonstrated the highest resistance to rainfall-induced erosion, with the lowest loss rate of only 0.40%. The main ingredients and additives of the C-82-9-9 type, with its inherent pozzolanic activity and filler effect, not only fill voids in the new material matrix but also enhance its strength [9,10,11].
Table 5 presents the results of the soil runoff during the rainfall equipment test, highlighting that C-82-9-9 exhibited the highest resistance to rainfall compared to in situ soil (C-90-0-10) among the four samples mixed with additives for improvement. Figure 10 displays the loss rate of the slope caused by rainfall. The soil improvement agent samples mixed with additives demonstrated similar reinforcement effects, which can be attributed to the weight ratio of additives not differing significantly from the total weight of in situ soil. This suggests that slight variations in the curing period or additive content can be tolerated.
Table 5.
Soil runoff according to rainfall.
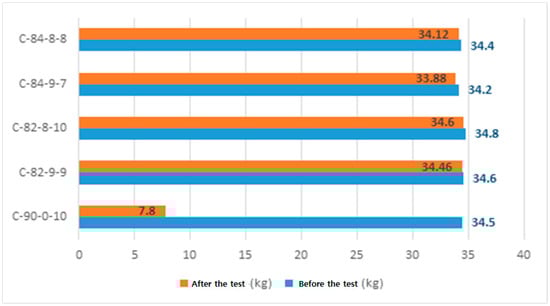
Figure 10.
Erosion test due to rainfall over time (mixed soil: C-82-9-9).
Table 6 presents the components of the materials mixed with soil improvement agents. Through physical and mechanical tests, an appropriate mixing ratio was determined by examining the strength change according to age. The results show that the C-82-9-9 soil improvement agent has the highest reinforcement effect, with the smallest soil runoff under scour effects from erosion in the rainfall model test. Therefore, it is expected to exhibit excellent performance in sites with slopes.
Table 6.
Mixing proportion of soil improvement agent.
4. Numerical Analysis for Slope Stability
4.1. Overview of Slope Failure Site
The area for numerical analysis by applying the soil improvement agent to the collapsed slope is the slope behind a high school, located in Gwangju, South Korea. The slope behind the school building collapsed on 31 August 2018, owing to heavy rainfall as shown in Figure 11 and Figure 12. A large amount of seepage water flowed out of the slope surface, and the surface failure was caused by excessive rainwater.
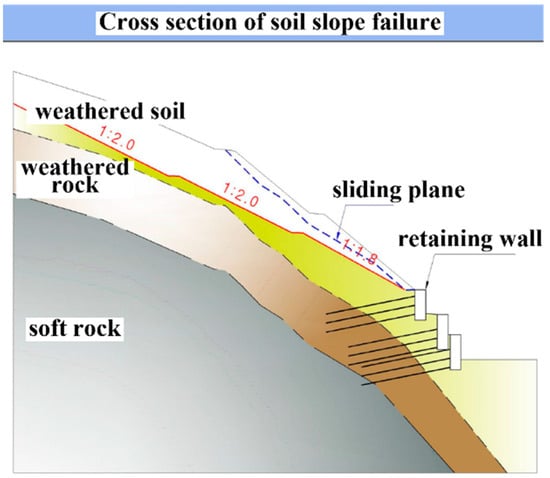
Figure 11.
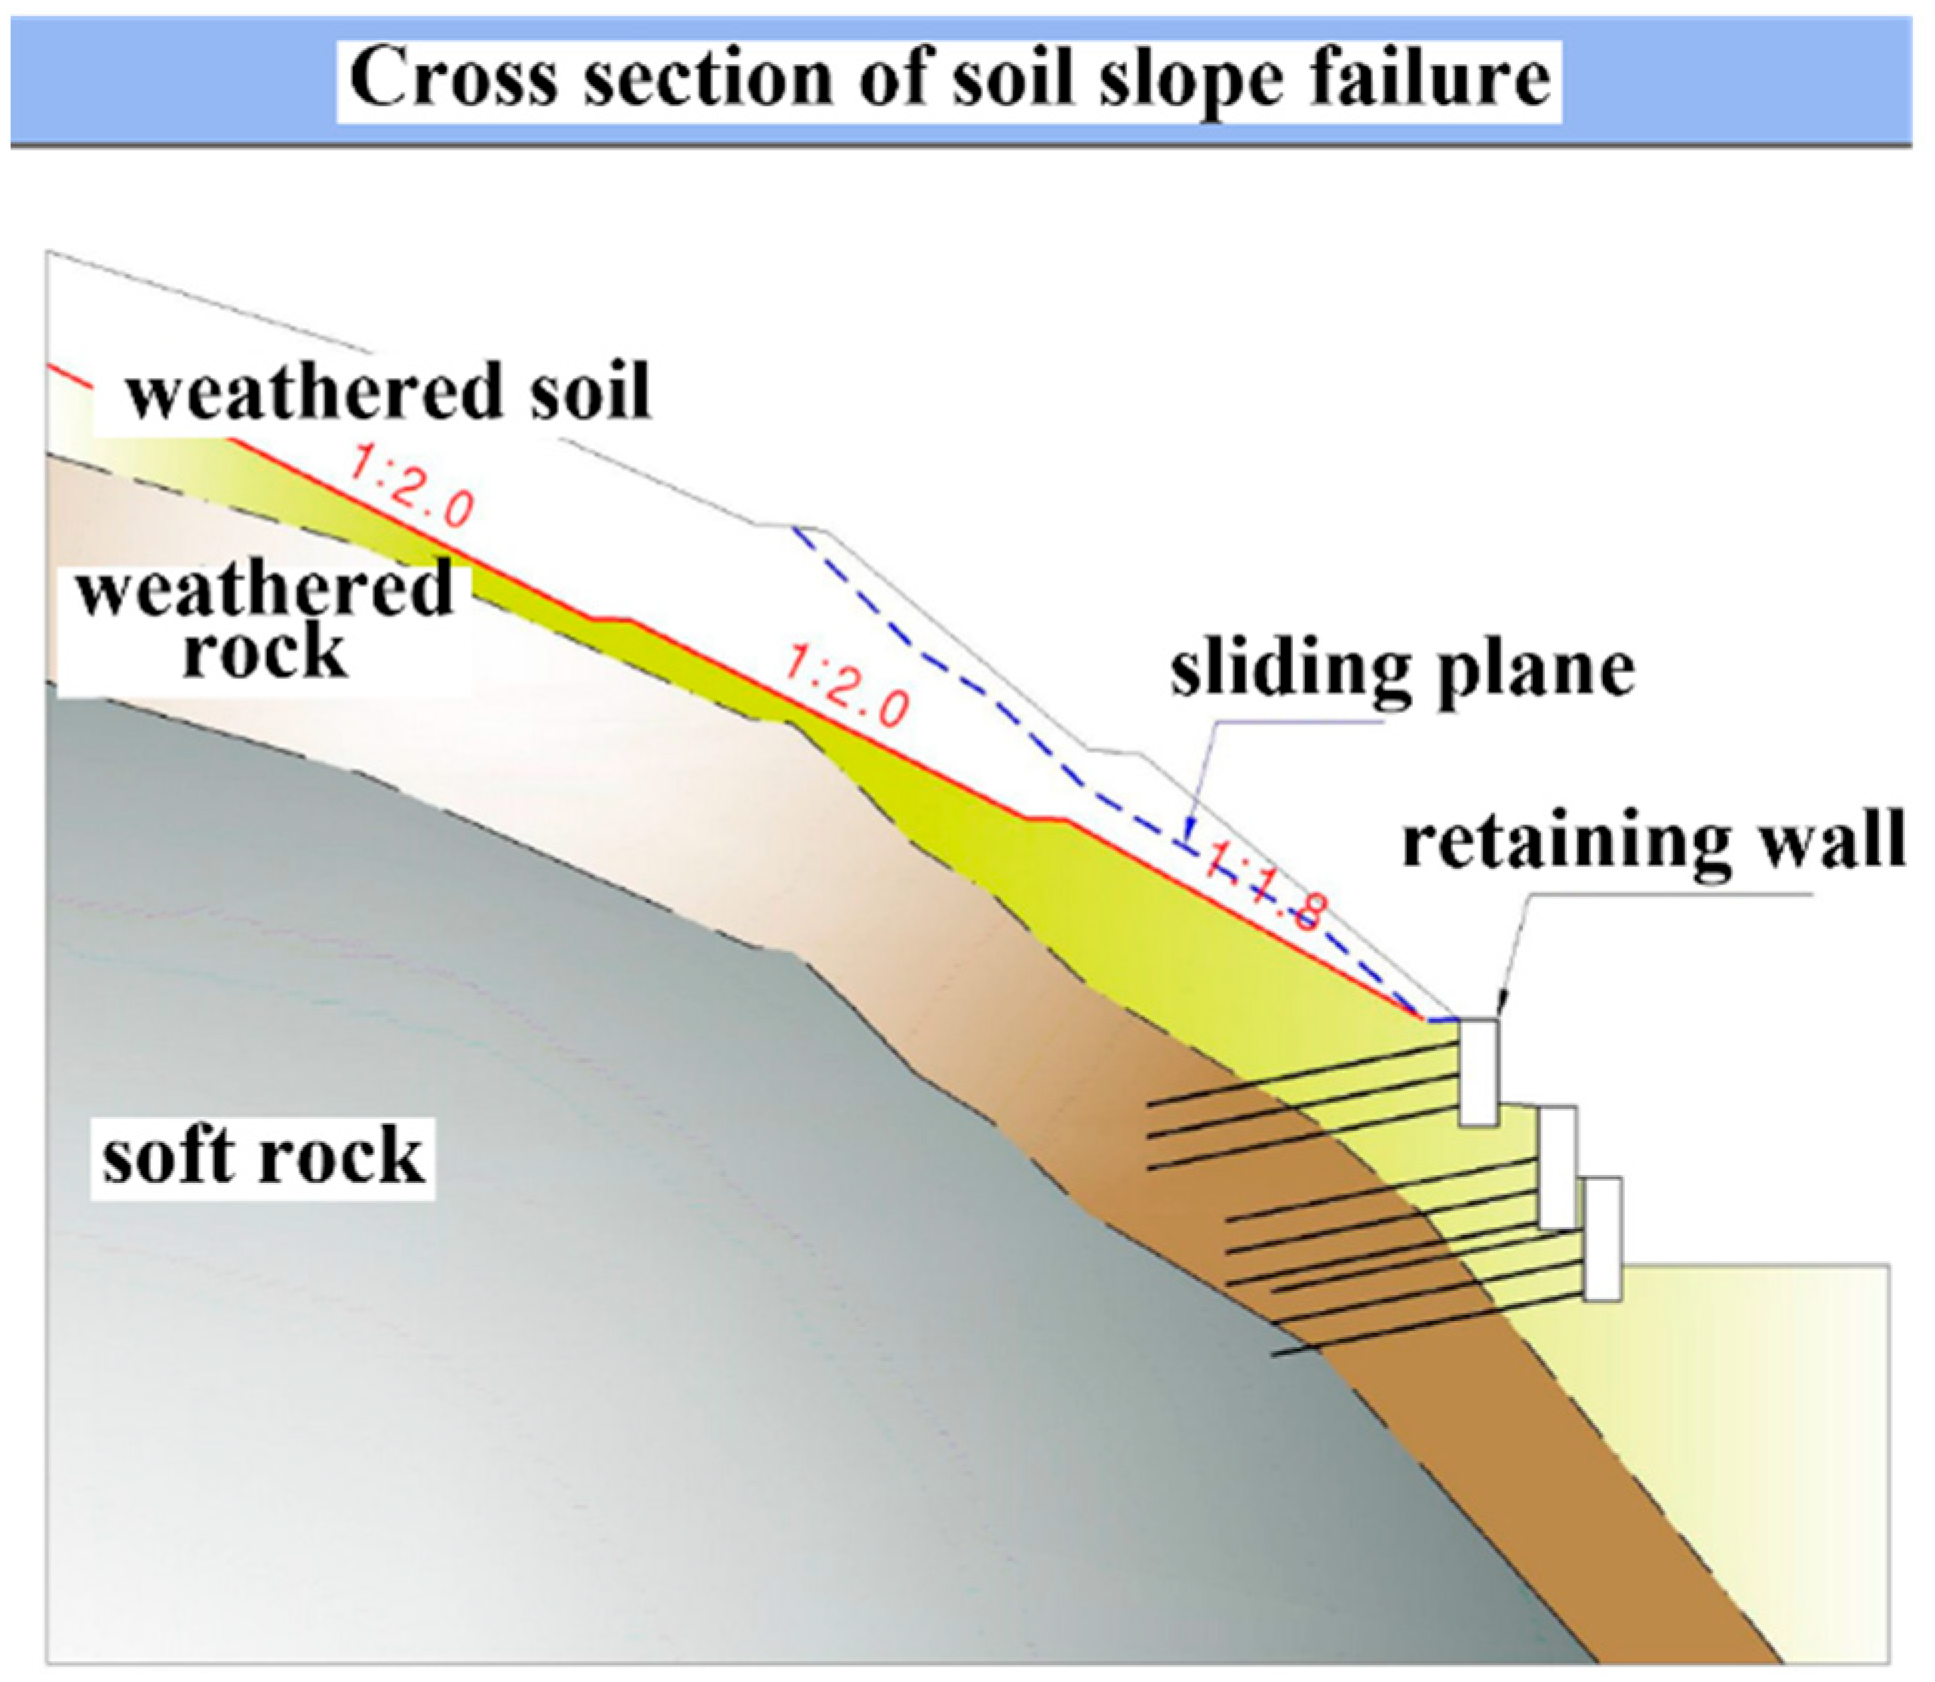
Cross-section of collapsed slope.
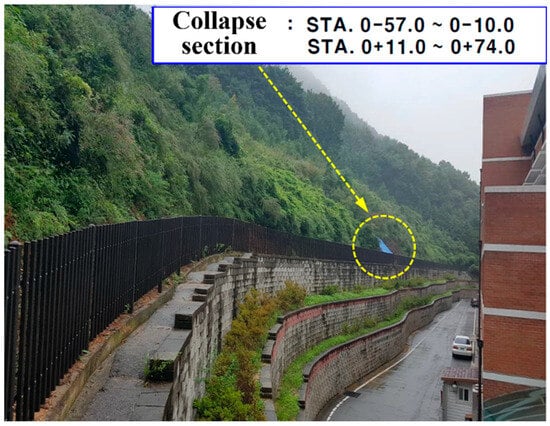
Figure 12.
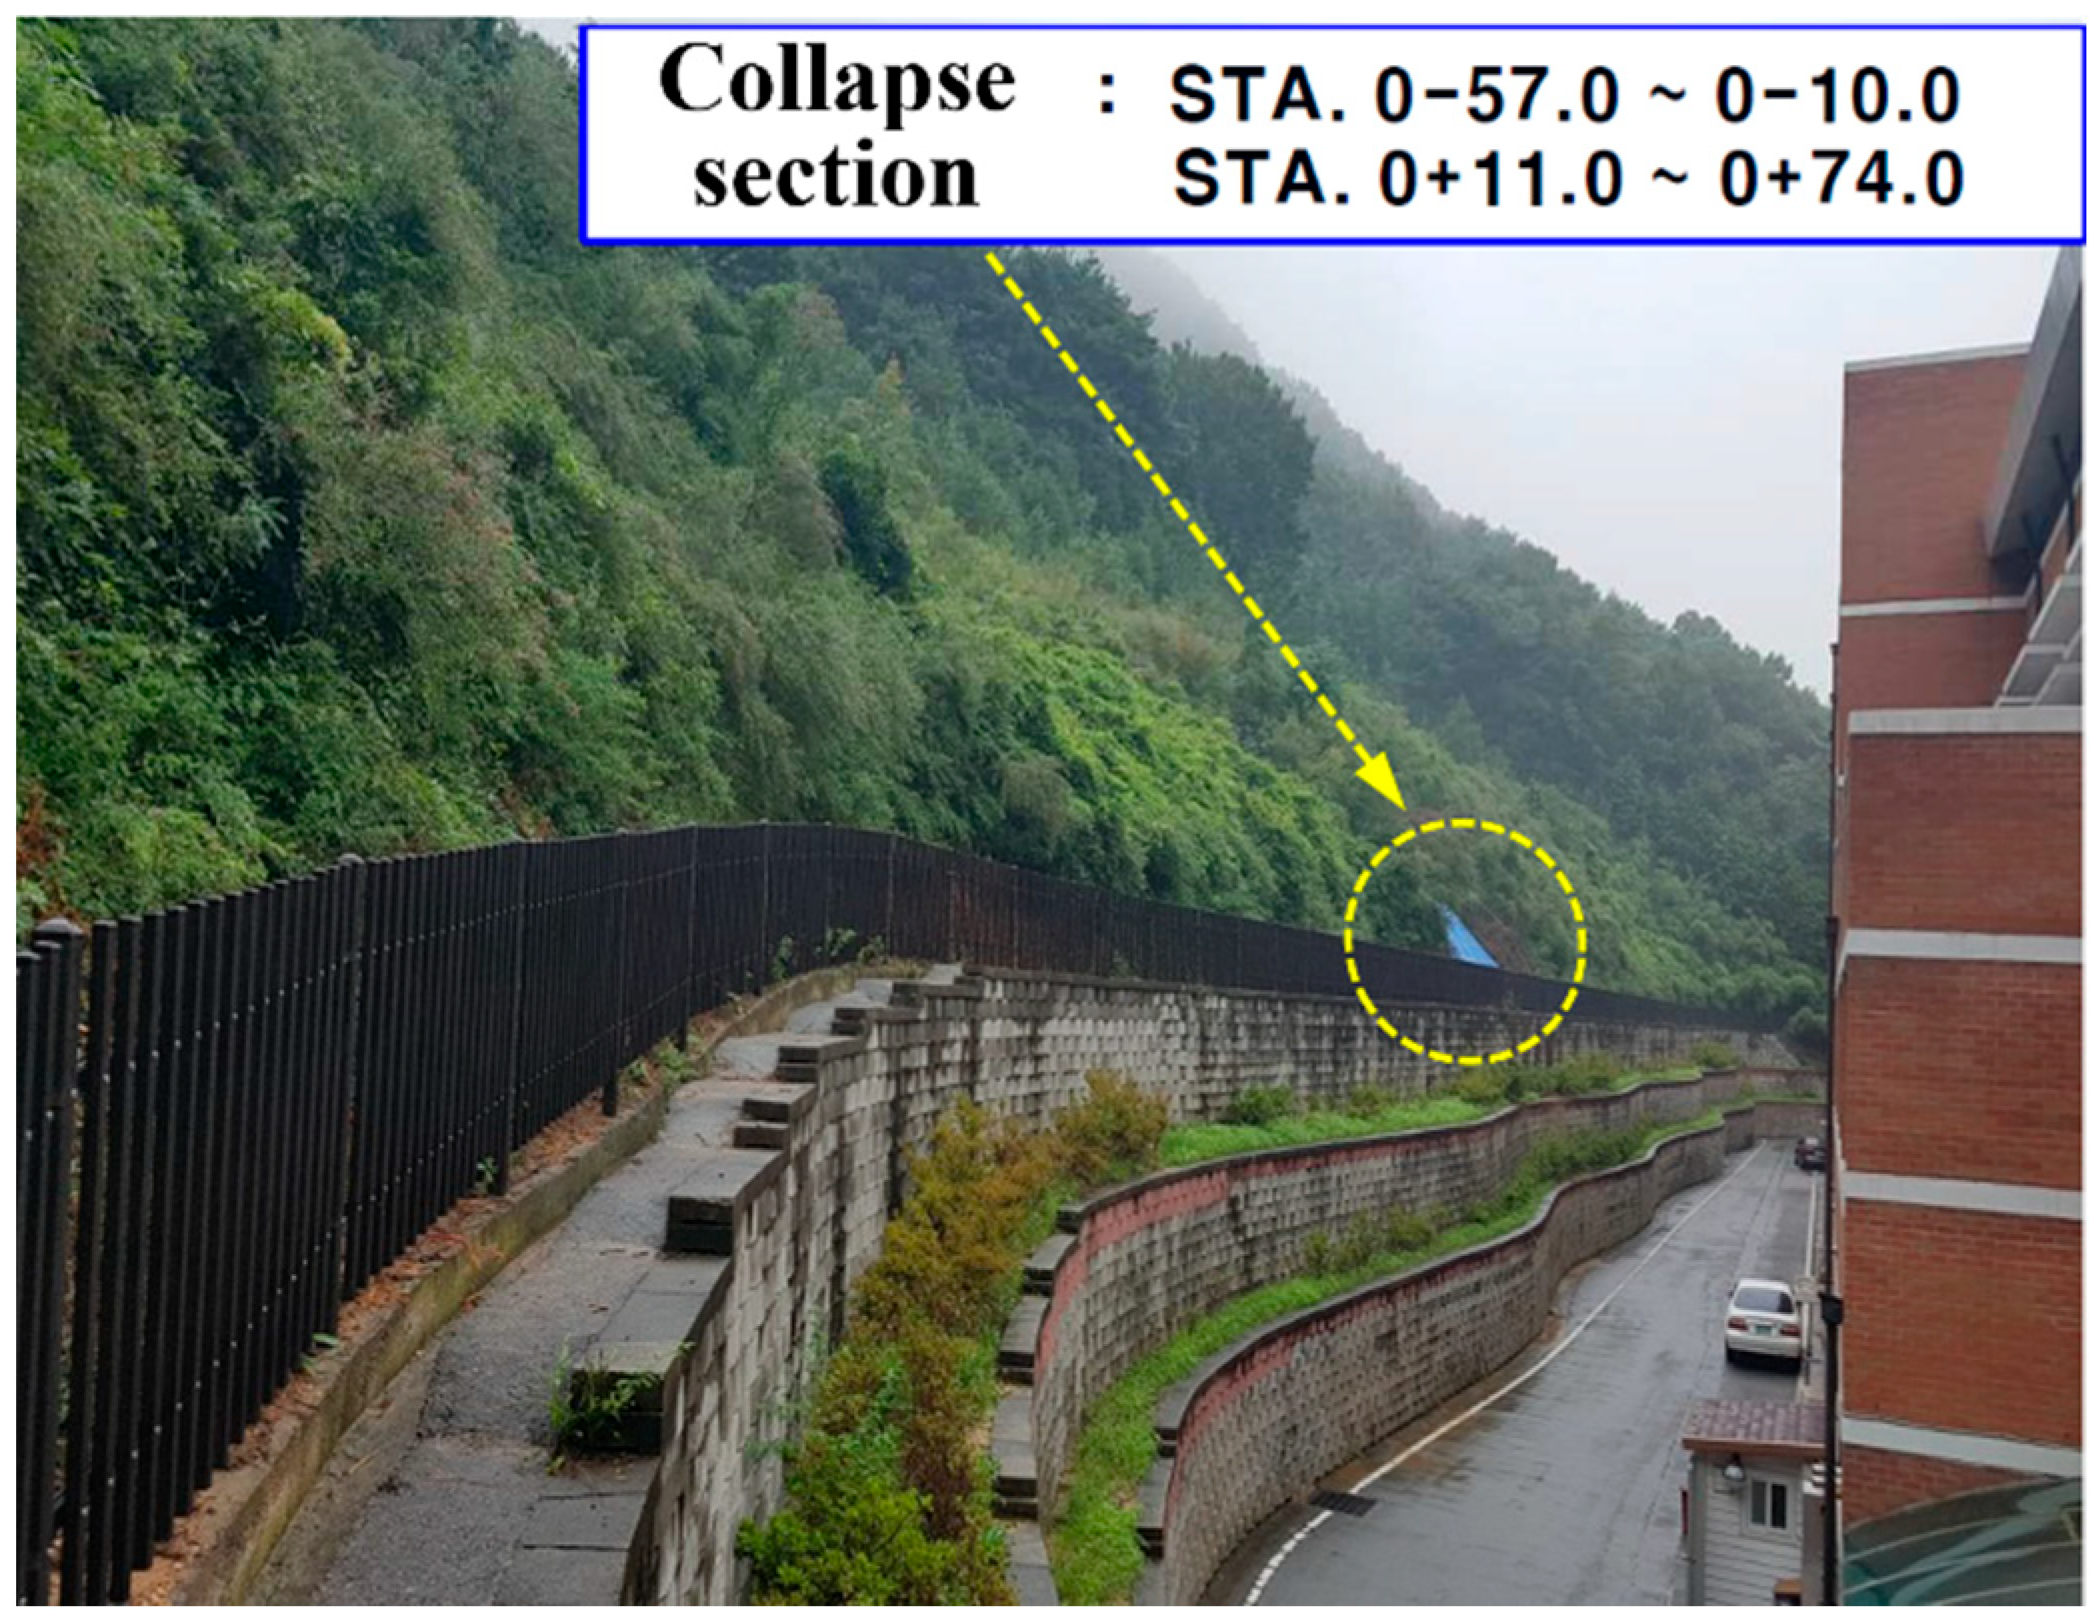
Slope failure site behind the high school building.
Figure 11 shows a cross-section of the slope reinforcement design. The site slope was gentler (1:1.7 to 1.4) than a standard slope (1:1.2 to 1.5); however, many traces of scouring in the form of shallow failures owing to heavy rainfall were found. Figure 12 shows the location of the collapse of the retaining wall’s slope behind the high school building. The site covered by blue tarpaulin is the area where the collapse occurred. The failure occurred in the soil layer; however, there was no damage to the retaining wall structure.
The slope behind the high school collapsed on 31 August 2018, due to heavy rainfall. The slope section where the surface layer collapsed has already been repaired and reinforced by the soil nailing method, but numerical analysis was performed to compare the slope stability when the slope was reinforced by applying the soil improvement agent developed in this paper.
A stability analysis was conducted for the retaining wall’s slope failure behind the high school building in Gwangju to identify the time of the collapse and the stages proceeding it by applying hourly rainfall data and conducting an unsaturated seepage analysis. Table 7 lists the physical properties of each stratum obtained through a geotechnical investigation at the time of the initial collapse. As shown in Figure 11, the slope consisted of weathered soil, weathered rock, and soft rock (i.e., bedrock).
Table 7.
Soil properties of unsaturated soil.
4.2. Seepage and Slope Stability for Soil Improvement Agent
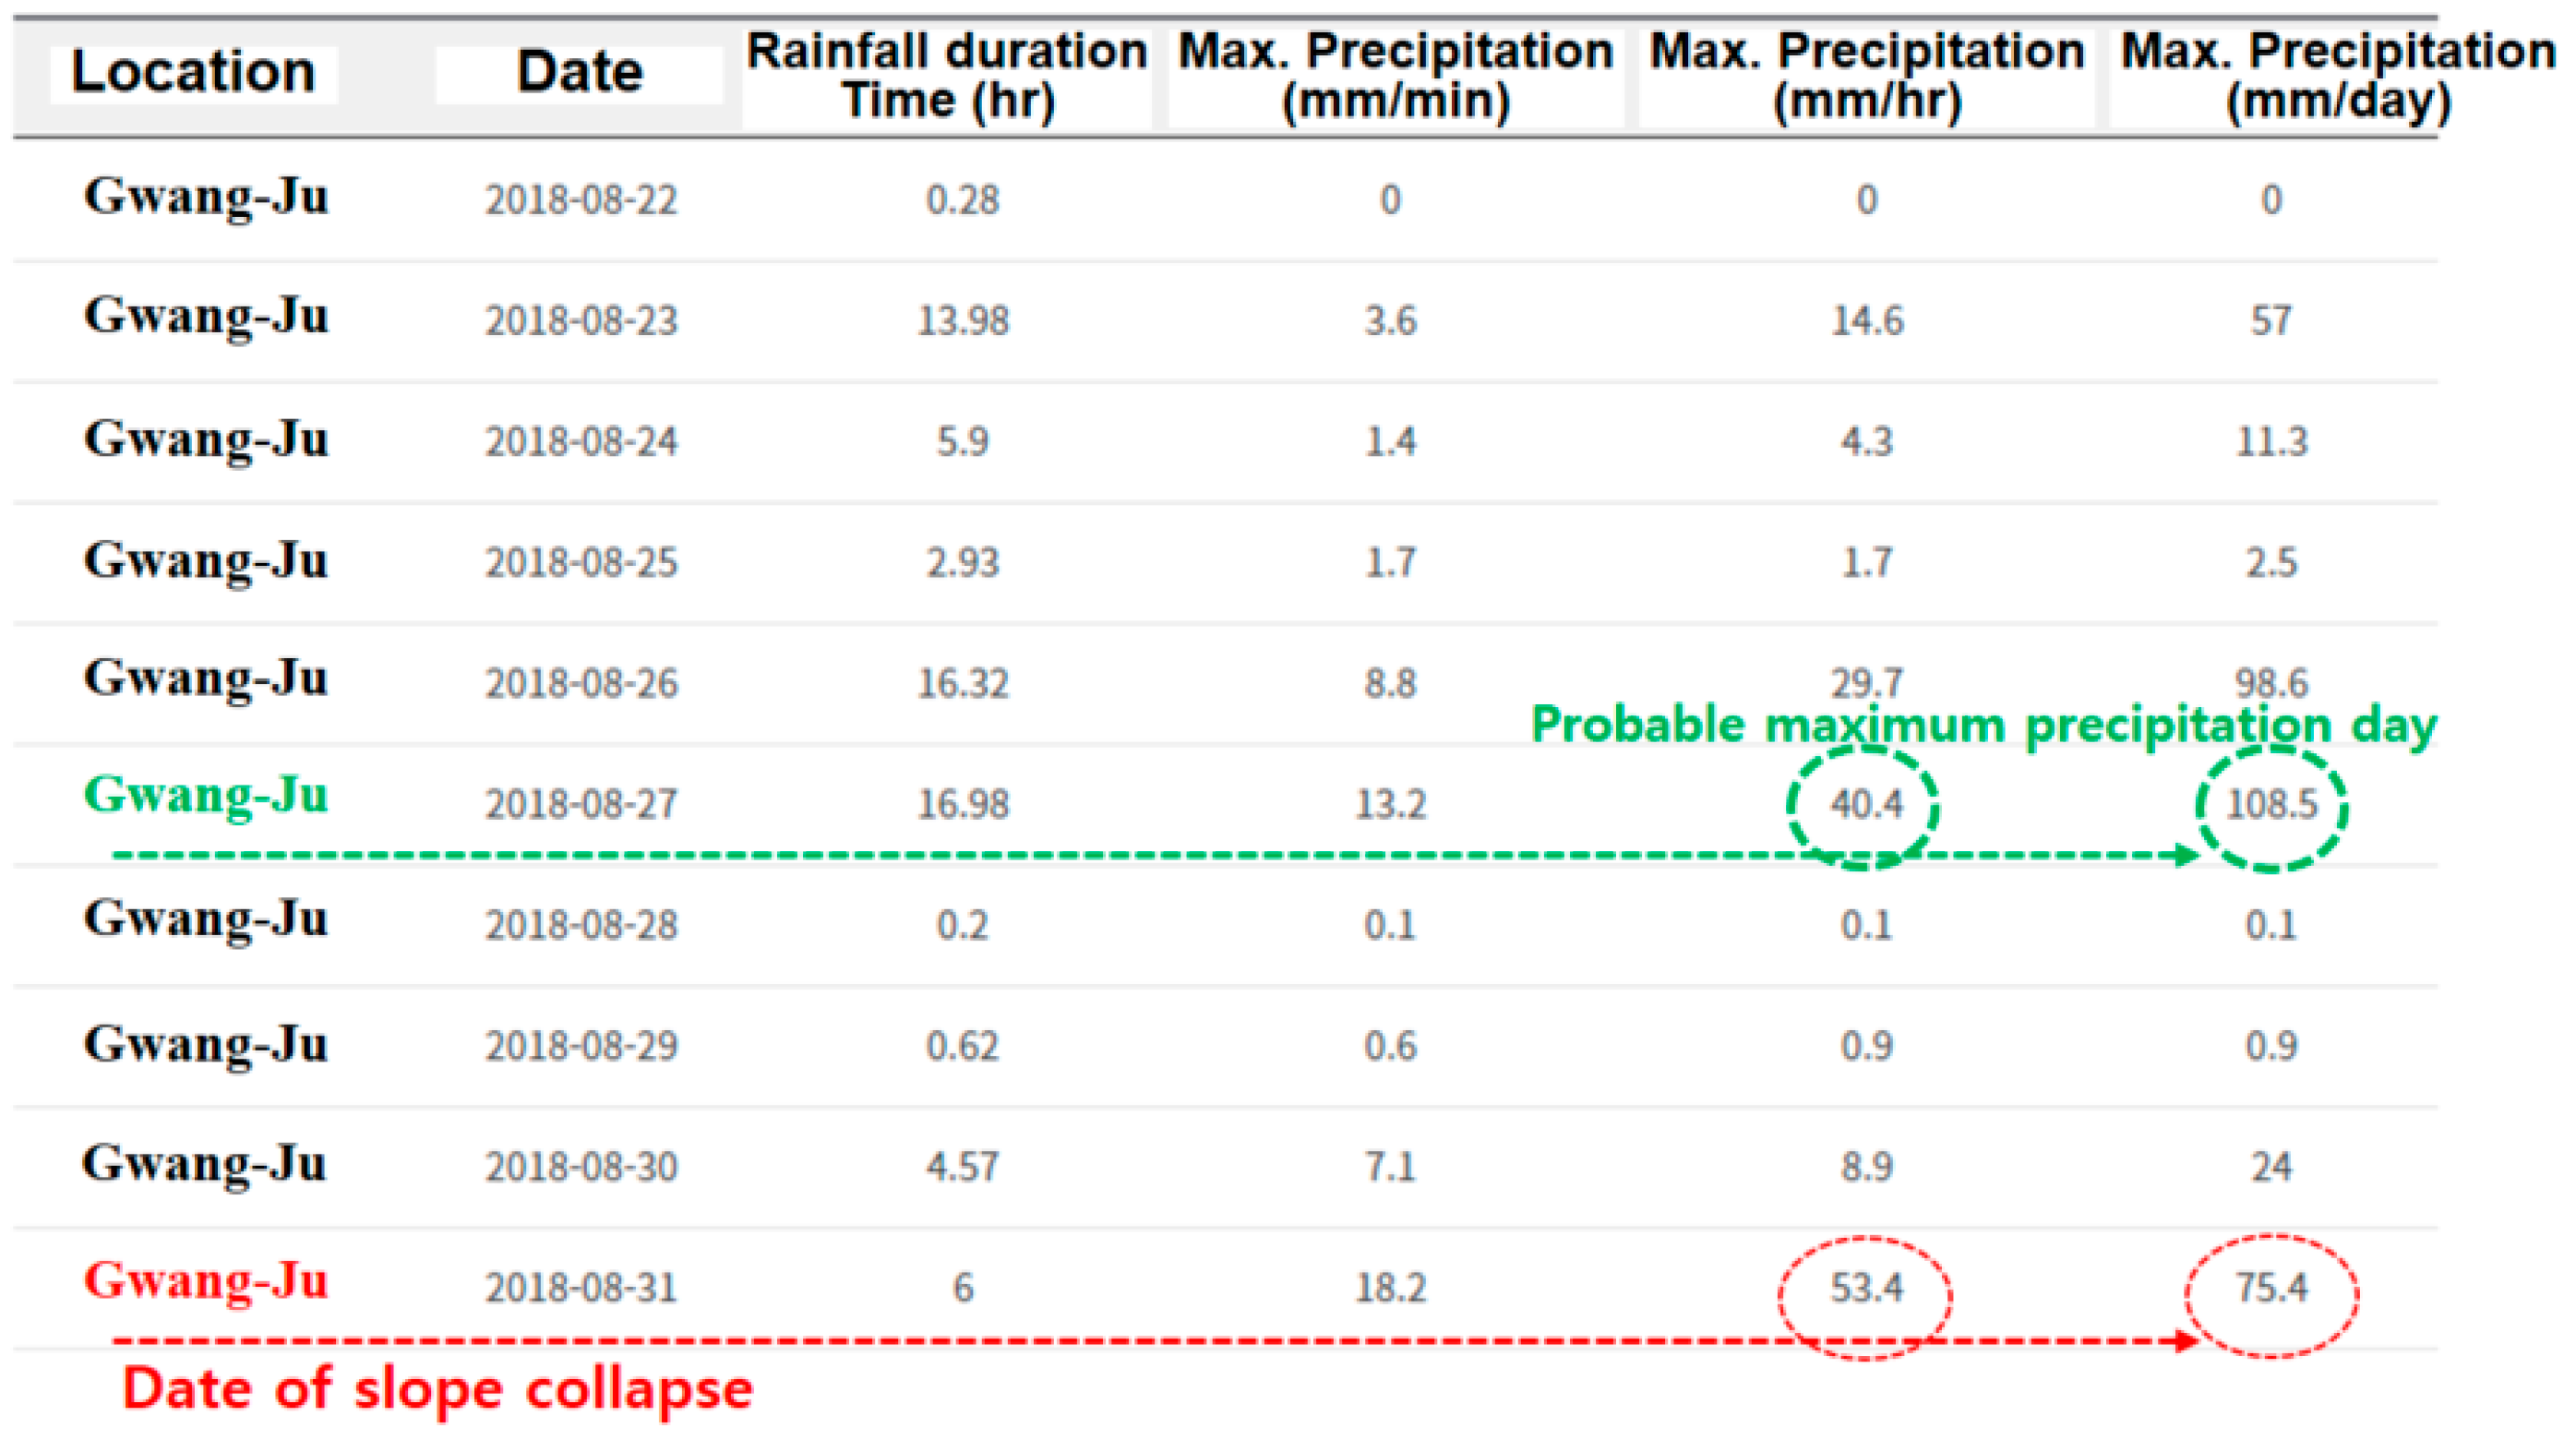
To conduct unsaturated seepage analysis for each stratum and apply the experimental constants (a, n, m) of the soil–water characteristic curve, the average of the experimental values published in previous studies was applied [2,14]. Table 7 lists the average values of the soil–water characteristic curve and saturated permeability coefficient by stratum used in the unsaturated seepage analysis. Since the slope failure occurred on 31 August 2018, the rainfall before this date is a factor causing the instability of the slope. Figure 13 shows the precipitation information from 22 August to 31 August 2018. These data can easily be obtained from the Korea Meteorological Administration (KMA) website accessed on 12 January 2024.

Figure 13.
Precipitation information for Gwangju in August 2018 (KMA 2018).
In Figure 13, the area surrounded by a red dotted line represents the rainfall on August 31st, when the slope failure occurred. We confirmed continuous rainfall during this period, with the retaining wall’s slope collapsing on the last day (31 August). Figure 13 shows the detailed daily rainfall for the ten days before the slope failure, and the maximum rainfall was recorded on the fifth day. The 10-day rainfall shown in Figure 13 was applied as the seepage analysis rainfall conditions to conduct the slope stability analysis (KMA Weather Data Service).
The boundary conditions were set according to the retaining wall’s design conditions, as shown in Figure 14 and Figure 15, and the slope stability was examined in connection with seepage analysis for ten days. Figure 15 shows the geometry mesh for comparing the safety factor by reinforcing the surface layer of the slope with a thickness of 50 cm with a soil improvement agent (orange color).
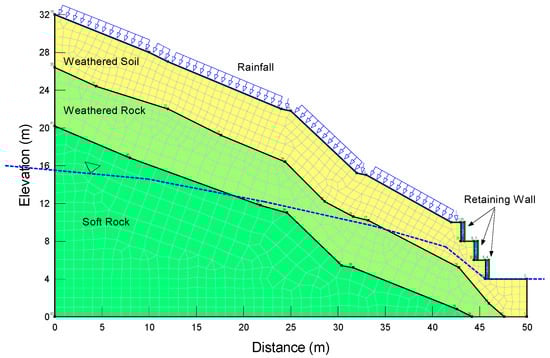
Figure 14.
Initial condition for seepage and stability analysis, in situ [15].
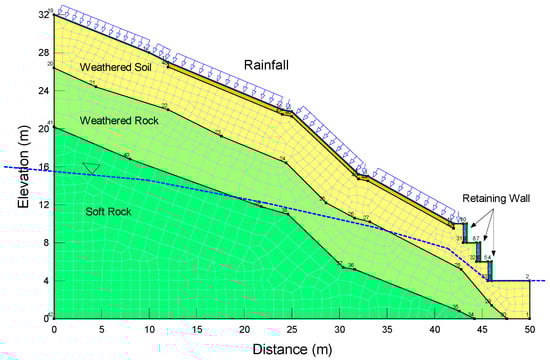
Figure 15.
Initial condition for seepage and stability analysis with soil improvement agent [15].
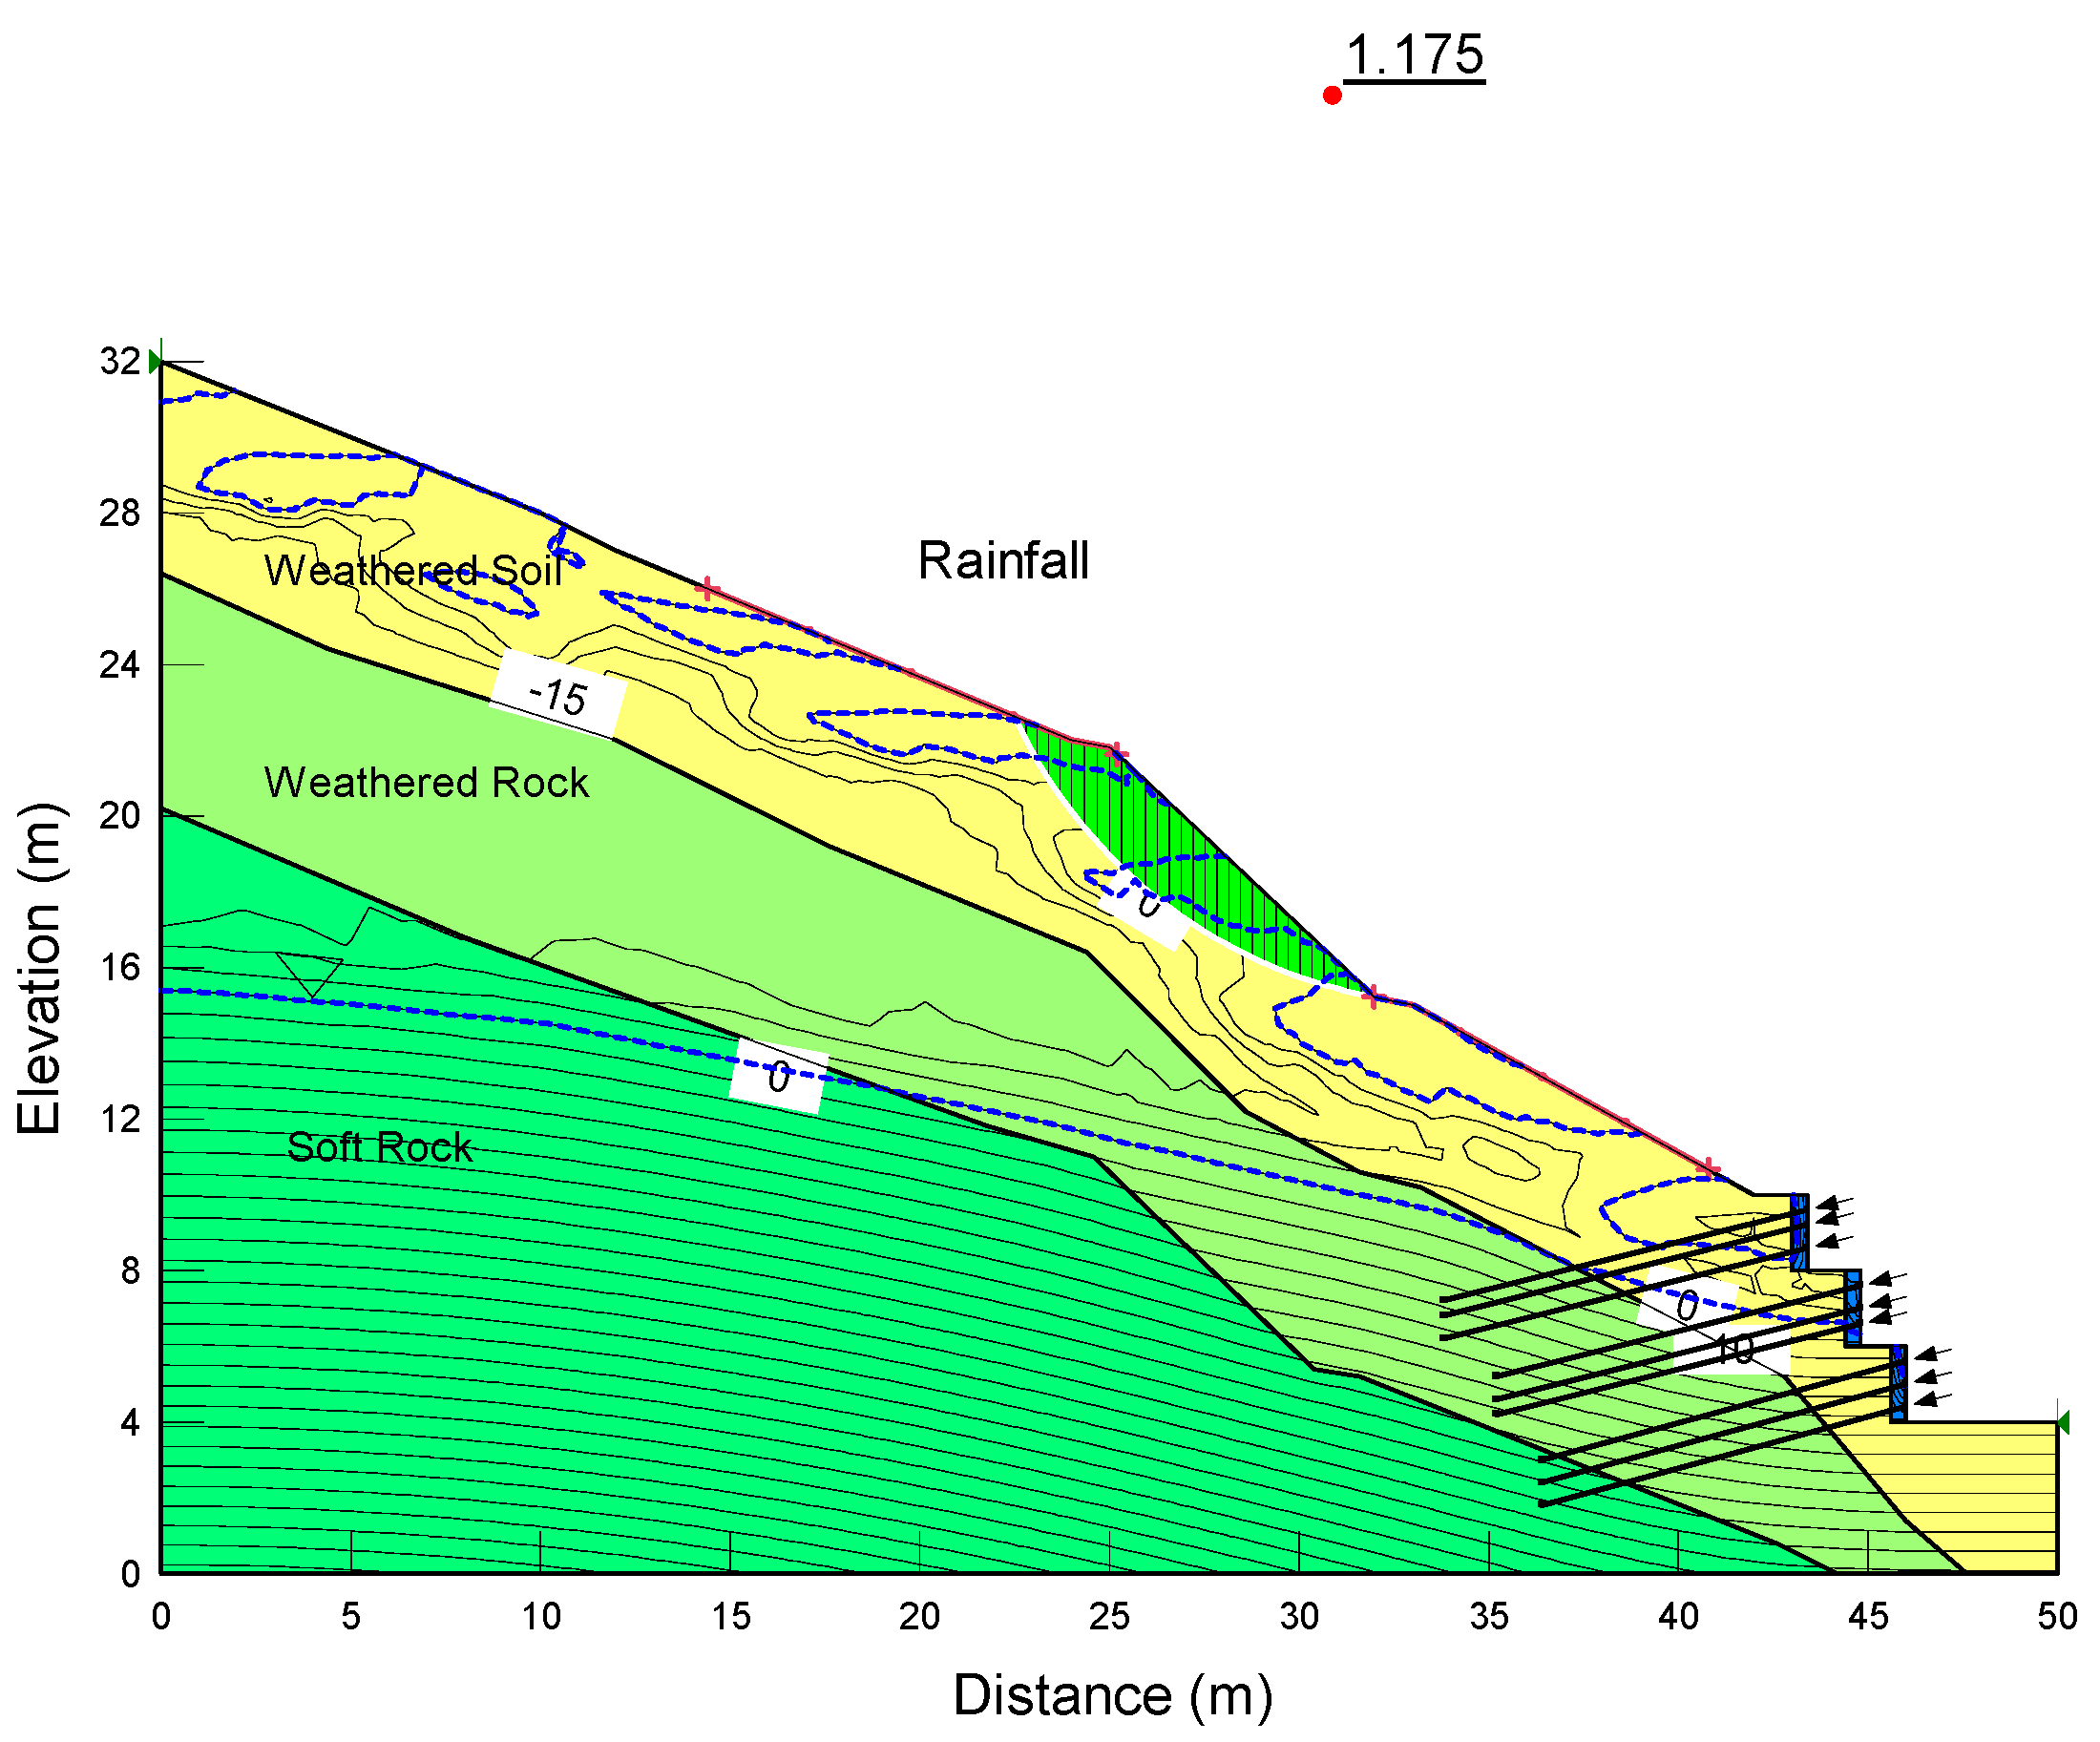
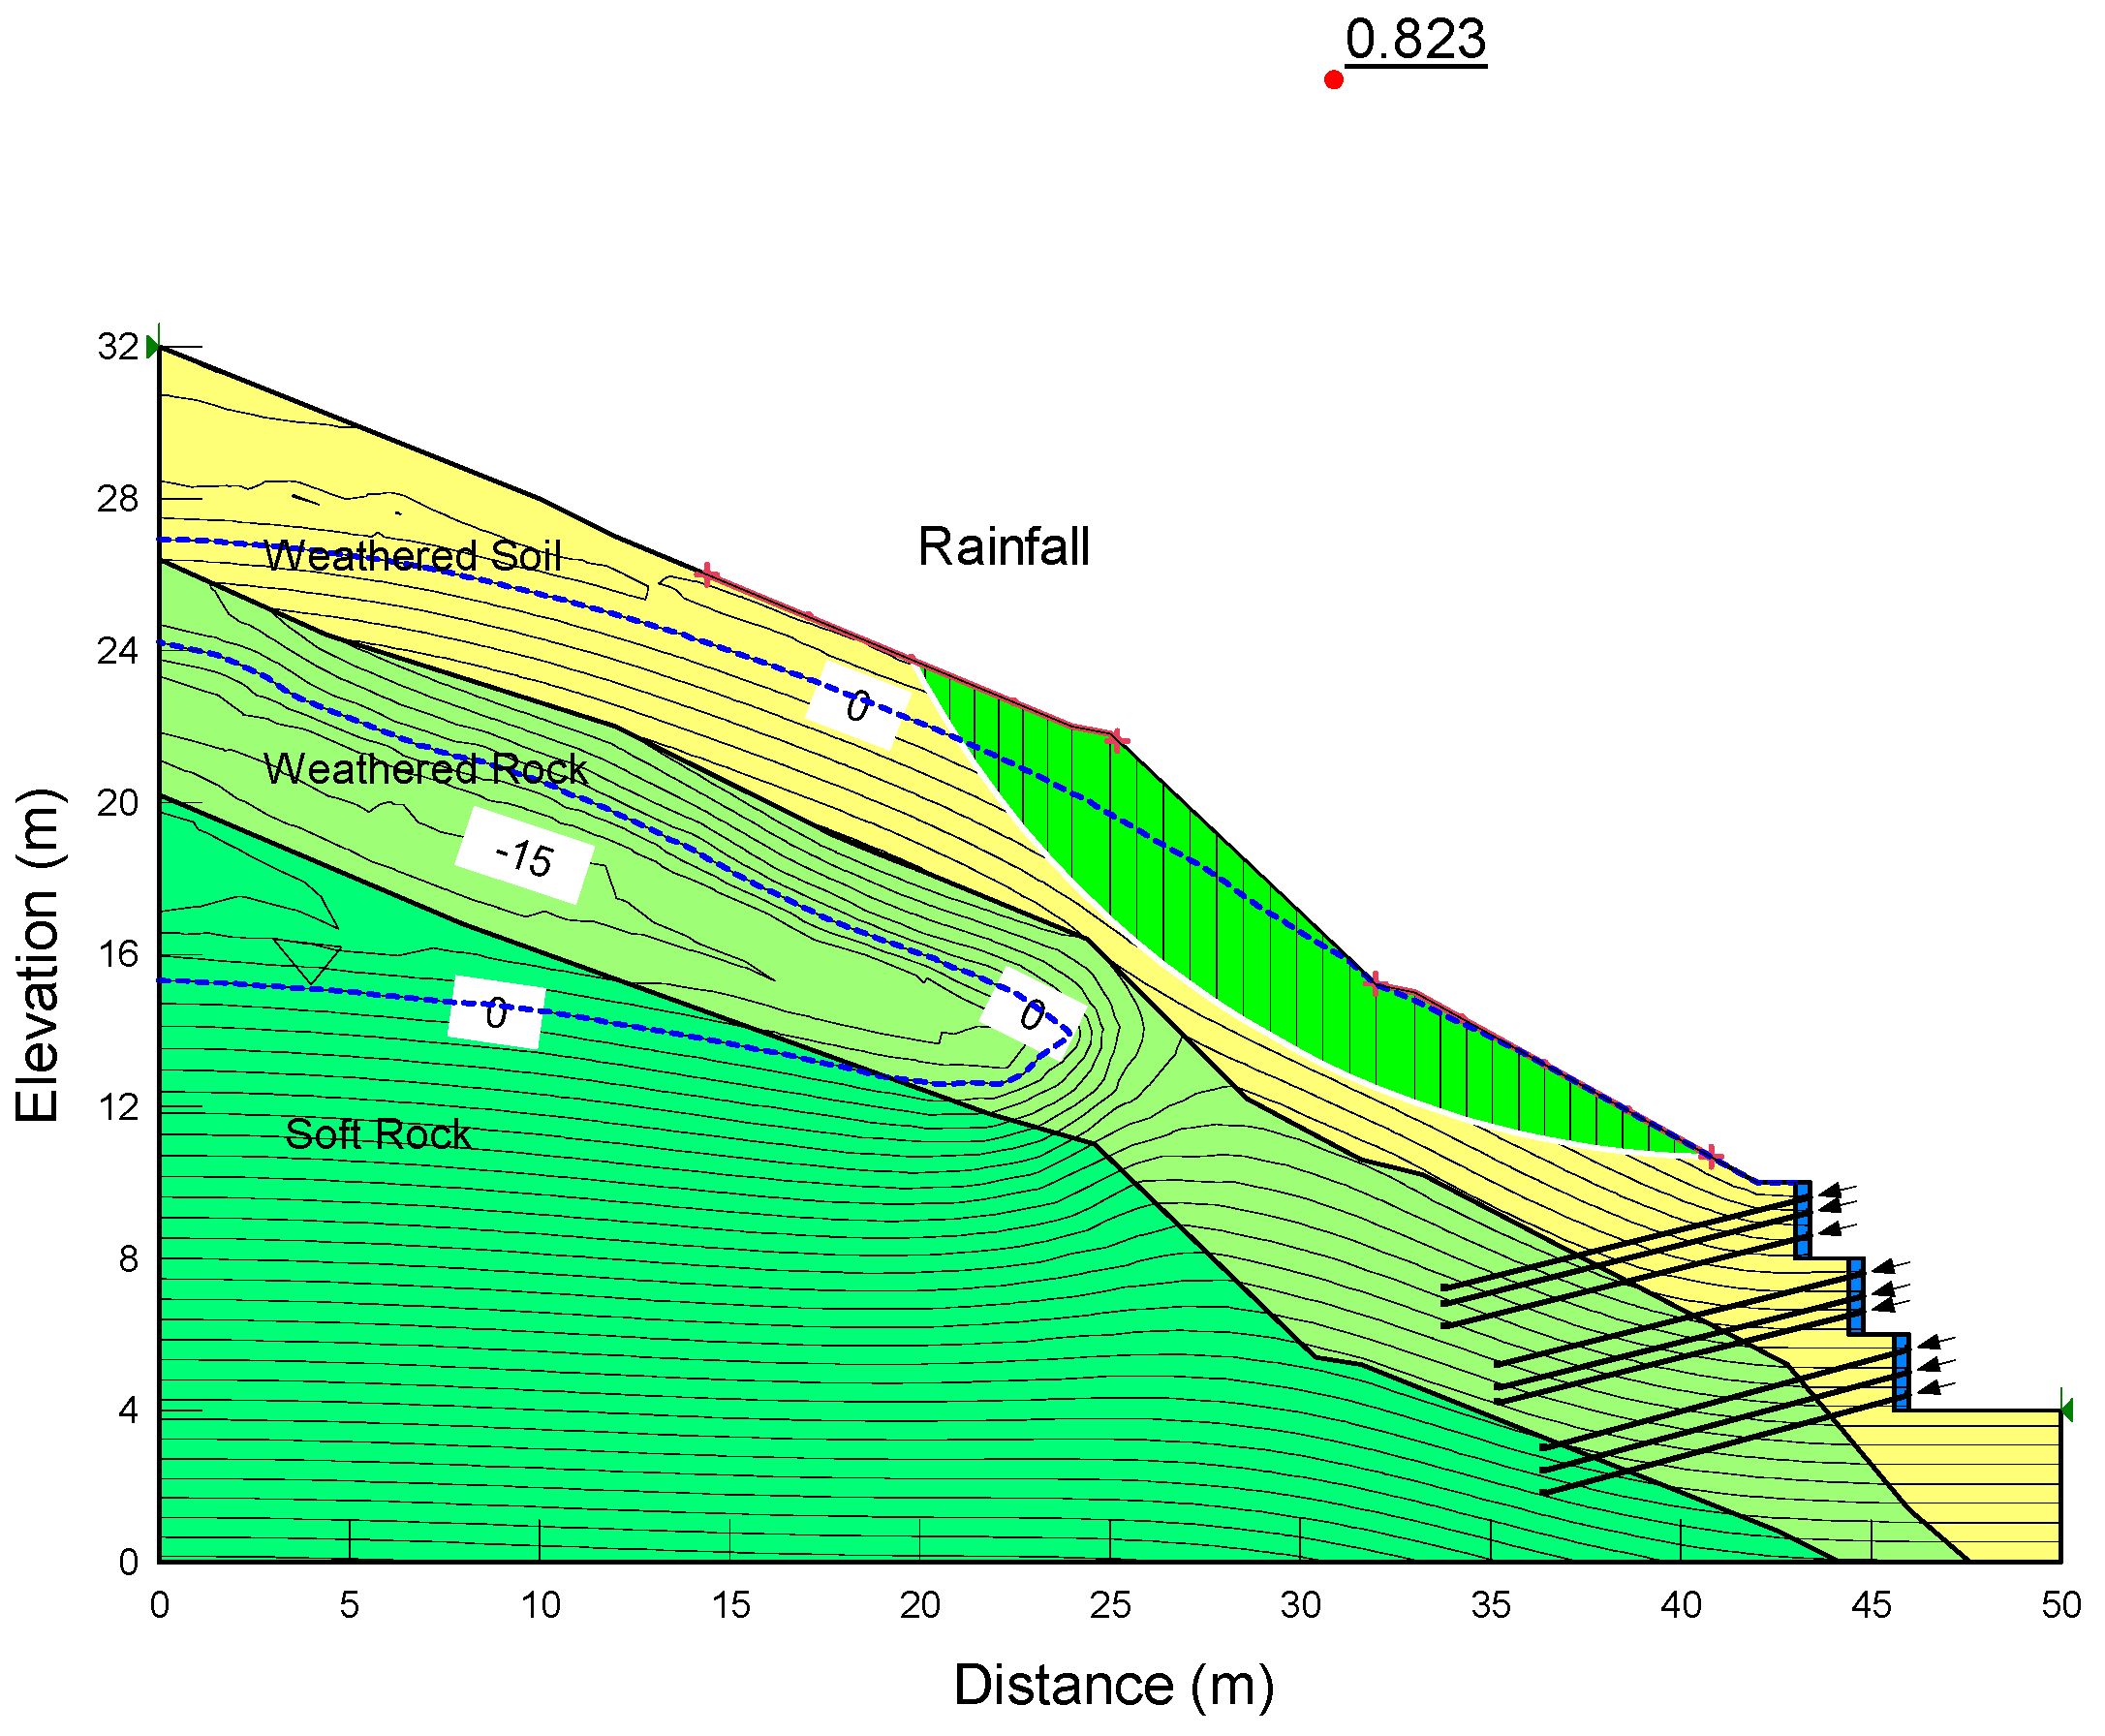
Figure 16, Figure 17, Figure 18 and Figure 19 show the results of the safety factor of slopes on the second and last 10 days after rainfall. The second day is the initial period of rain, and the safety factor of the slope rose from 1.175 to 1.352 after reinforcement with soil improvement agent. After 10 days of rainfall, the slope collapsed, but it was analyzed that soil slope by reinforcement did not cause collapse due to an increase in the safety factor. The arrows indicate that the anchor’s tensile force is acting on the retaining wall.
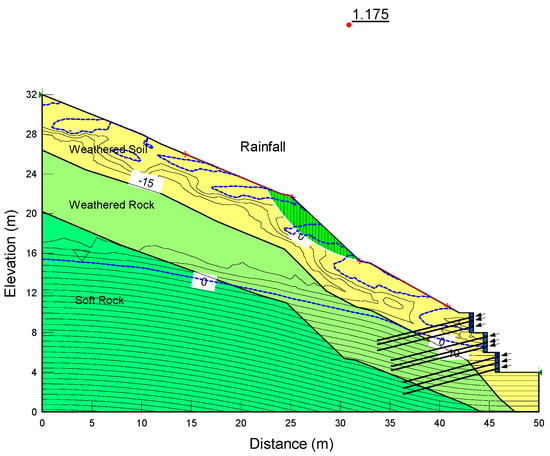
Figure 16.
Erosion and scour due to rainfall (after 2 days, Fs = 1.175).
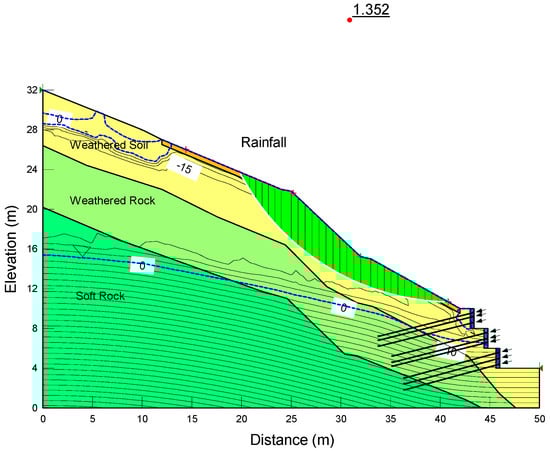
Figure 17.
Reinforcement by soil improvement agent (after 2 days, Fs = 1.352).
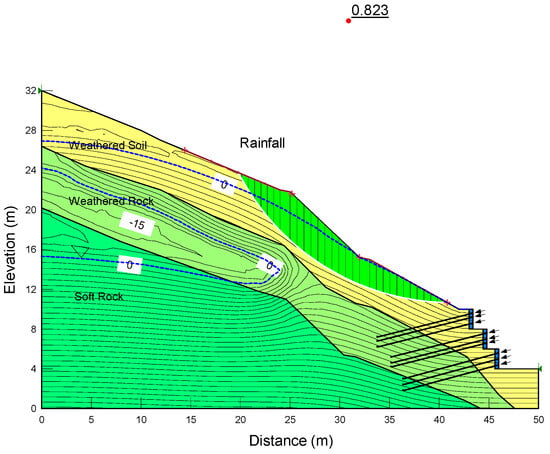
Figure 18.
Erosion and scour due to rainfall (after 10 days, Fs = 0.823).
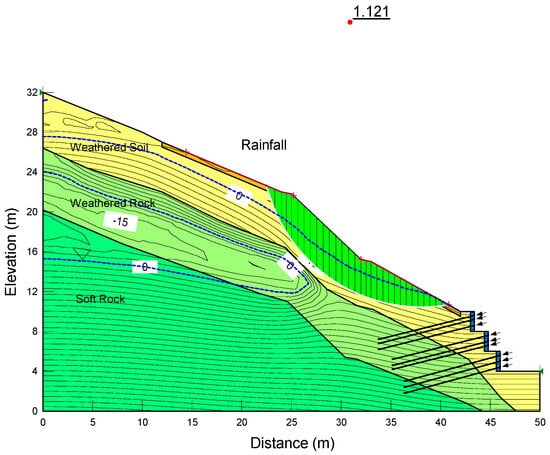
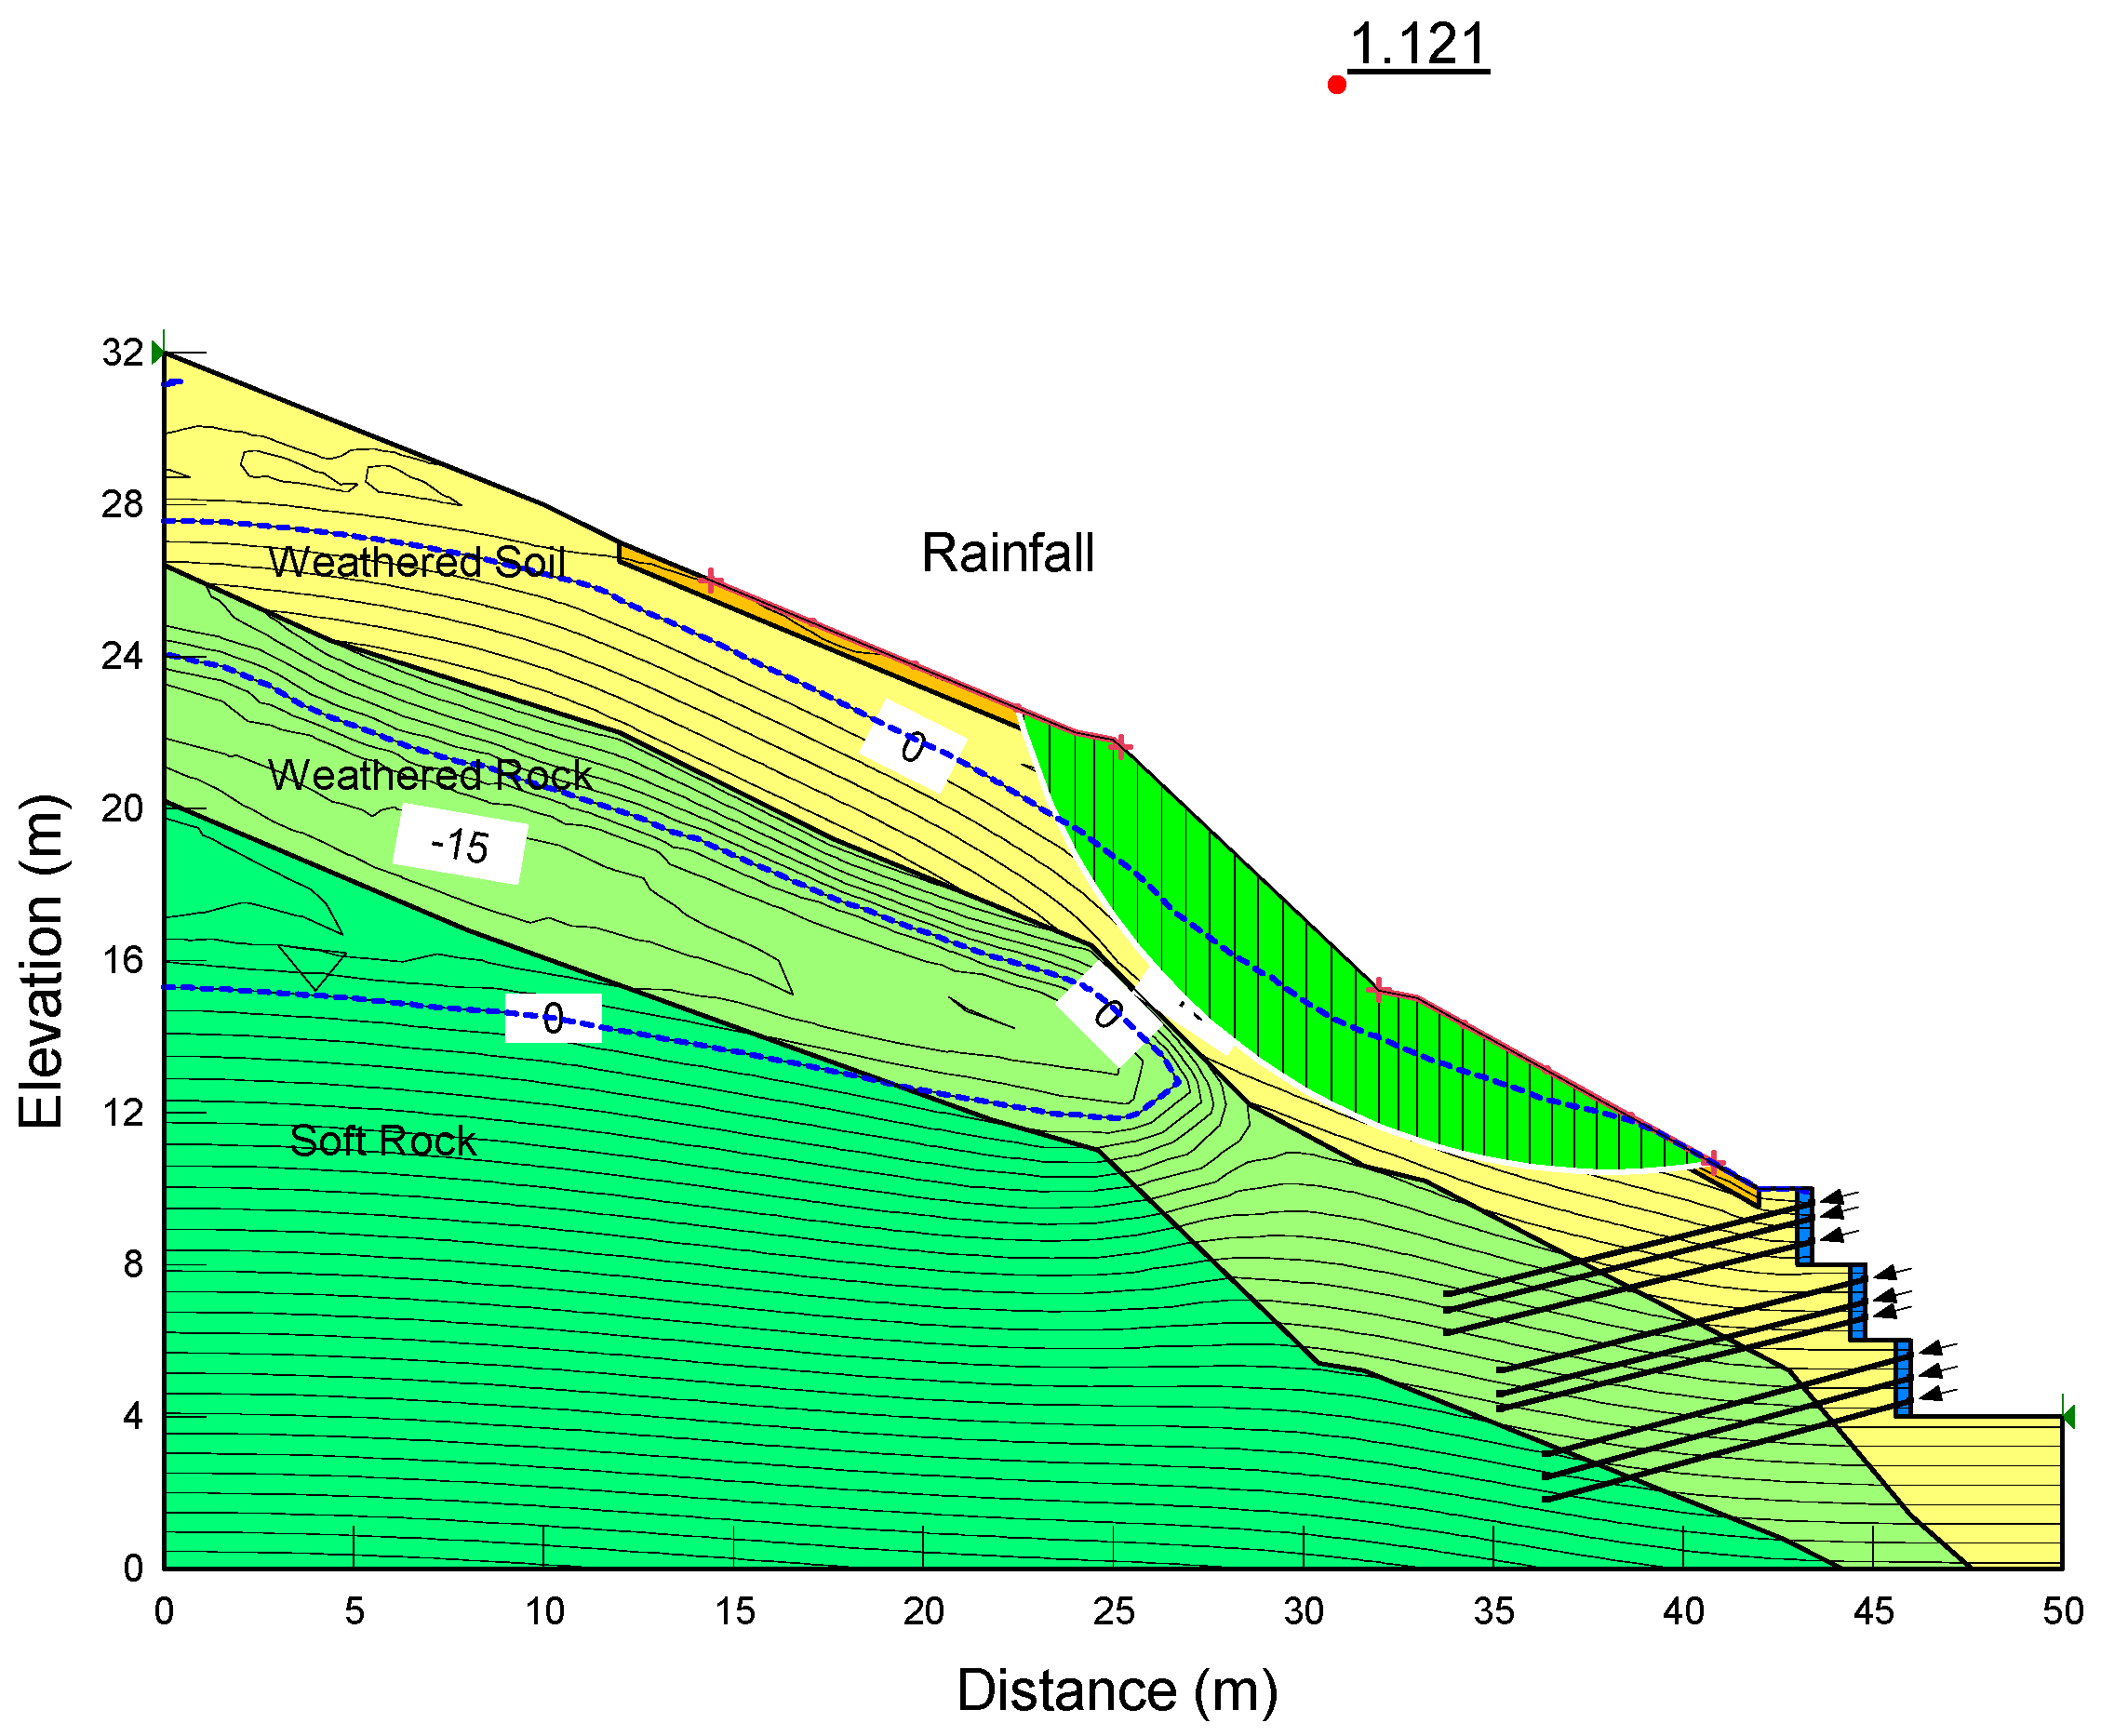
Figure 19.
Reinforcement by soil improvement agent (after 10 days, Fs = 1.121).
Figure 19 shows the change in which the safety factor of the slope increases due to the reinforcement of the soil improvement agent. In situ, rainfall continued for 10 days, causing collapse as the instability of the slope increased, but it was confirmed that the stability of the slope was maintained by the application of the soil improvement agent developed in this study.
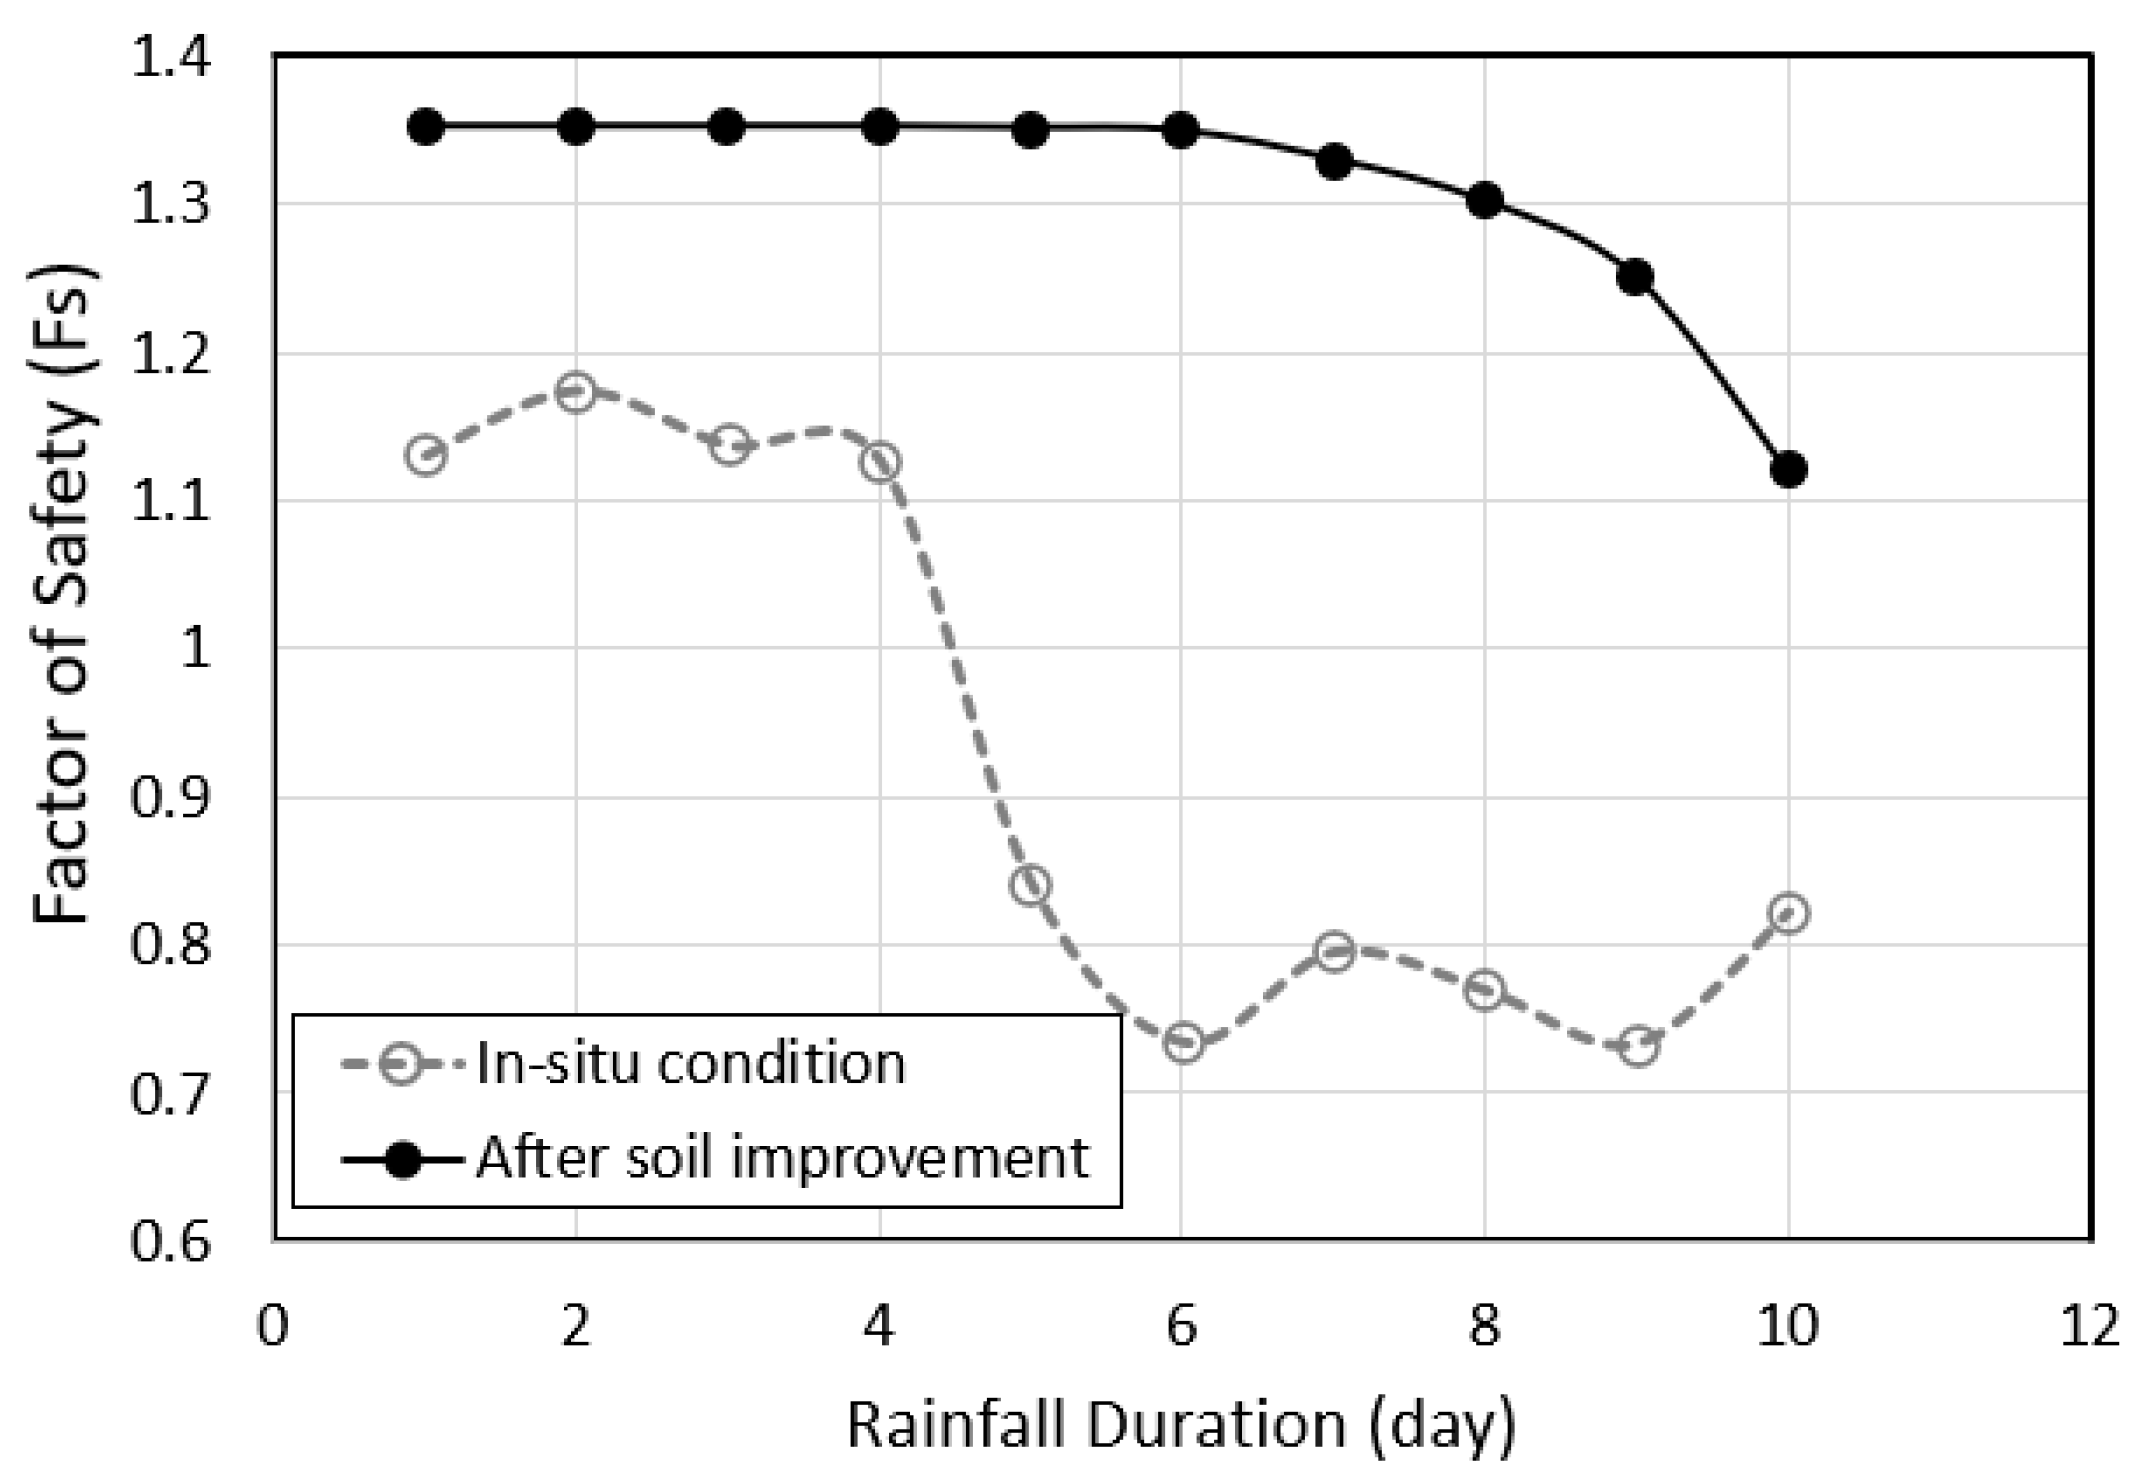
Figure 20 shows a result comparing the safety factors of the slope composed of the original soil and the slope reinforced with the soil improvement agent. As rainfall continues, the difference in safety factors increases, and it can be seen that at this site, as the rainfall duration elapses by 5 days, a risk of slope failure occurs.

Figure 20.
Change in safety factor before and after reinforcement with soil improvement agent.
5. Conclusions
This study aimed to identify an effective soil improvement agent to reinforce soil against scour and erosion and prevent shallow slope failure due to rainfall infiltration. To observe the scour and erosion of a slope caused by rainfall, a model test was conducted using a rainfall model test device. The main conclusions drawn from the study are as follows:
- (1)
- In order to improve the original soil, the main ingredients and additives were found to have a slight ratio and the difference was found, but the mix proportion of the (C-82-9-9) type showed optimal strength. The type maintained an appropriate level of initial uniaxial compressive strength and ensured the long-term stability of the soil surface layer in the intended environment, despite having the lowest initial uniaxial compressive strength among the soil improvement agents.
- (2)
- The direct shear test results showed a clear increase in the cohesion and internal friction angle for all soil improvement agents compared to the original soil (C-90-0-10). C-82-9-9 was found to be relatively suitable among various soil improvement agents because it exhibited a 78% increase in cohesion and an 82% increase in the internal friction angle compared to the original soil at 7 days of age and a 255% increase in cohesion and a 35% increase in the internal friction angle at 28 days.
- (3)
- In the rainfall model test, the weight of the original soil (C-90-0-10) sample decreased by 77% after the test. However, all soil improvement agents showed significantly low loss rates (0.40 to 0.94%) compared to the original soil, with C-82-9-9 exhibiting the lowest loss rate (0.40%). This confirms that C-82-9-9 has the highest resistance to rainfall among all tested soil improvement agents.
- (4)
- As a result of numerical analysis after reinforcing the surface of the slope collapsed by rainfall for 10 days, it was confirmed that the factor of safety rose to 1.121, reducing the instability of the surface layer of the slope due to the infiltration of rainfall.
- (5)
- Therefore, reinforcing the soil using this improvement agent not only increases resistance to erosion but it also promotes vegetation growth, which can prevent tensile cracking and the occurrence of debris flows caused by erosion.
If it is necessary to reinforce the soil slope with a more stable method according to the surrounding environment conditions rather than economic and eco-friendly advantages, it is judged that anchor or nailing reinforcement methods are necessary.
Author Contributions
Methodology, D.-H.K.; software, J.K.; Validation, D.-H.K. and J.K.; Formal analysis, D.-H.K.; Investigation, D.-H.K.; Resources, D.-H.K. and J.K.; data curation, D.-H.K.; Writing—original Draft Preparation, J.K.; Writing—review and Editing, J.K.; Visualization, D.-H.K.; Supervision, J.K.; Project administration, J.K.; Funding acquisition, D.-H.K. All authors have read and agreed to the published version of the manuscript.
Funding
This research received no external funding.
Data Availability Statement
The original contributions presented in the study are included in the article, further inquiries can be directed to the corresponding authors.
Conflicts of Interest
The authors declare no conflict of interest.
References
- Hong, M.; Jeong, S.; Kim, J. A combined method for modeling the triggering and propagation of debris flows. Landslides 2020, 17, 805–824. [Google Scholar] [CrossRef]
- Kim, Y.; Kim, J.; Bhang, I.; Seo, S. A study on rainfall-induced erosion of land surface on reinforced slope using soil improvement material. J. Korean Geotech. Soc. 2013, 29, 49–59. [Google Scholar] [CrossRef]
- Standard for Slope Stability Design, Ministry of Land, Transport and Maritime Affairs (MLTMA) 2016, Republic of Korea, No.11-1611000-001067-01. pp. 29–33. Available online: https://www.molit.go.kr/english/USR/WPGE0201/m_29471/DTL.jsp (accessed on 1 January 2024).
- Dixon, N.; Brook, E. Impact of predicted climate change on landslide reactivation: Case study of Mam Tor, UK. Landslides 2007, 4, 137–147. [Google Scholar] [CrossRef]
- Edil, T.B.; Acosta, H.A.; Benson, C.H. Stabilizing soft fine-grained soils with fly ash. J. Mater. Civ. Eng. 2006, 18, 283–294. [Google Scholar] [CrossRef]
- Fredlund, D.G.; Rahardjo, H. Soil Mechanics for Unsaturated Soils; John Wiley & Sons Inc.: New York, NY, USA, 1993; p. 605. [Google Scholar]
- Cui, Y.; Jiang, Y.; Guo, C. Investigation of the initiation of shallow failure in widely graded loose soil slopes considering interstitial flow and surface runoff. Landslides 2019, 16, 815–828. [Google Scholar] [CrossRef]
- Meier, C.; Jaboyedoff, M.; Derron, M.-H.; Gerber, C. A method to assess the probability of thickness and volume estimates of small and shallow initial landslide ruptures based on surface area. Landslides 2020, 17, 975–982. [Google Scholar] [CrossRef]
- Akbulut, Z.F.; Guler, S.; Khan, M. The effects of waste iron powder and steel fiber on the physical and mechanical properties of geopolymer mortars exposed to high temperatures. Structures 2023, 58, 105398. [Google Scholar] [CrossRef]
- Akbulut, Z.F.; Guler, S.; Osmanoğlu, F.; Kıvanç, M.R.; Khan, M. Evaluating Sustainable Colored Mortars Reinforced with Fly Ash: A Comprehensive Study on Physical and Mechanical Properties under High-Temperature Exposure. Buildings 2024, 14, 453. [Google Scholar] [CrossRef]
- Guler, S.; Akbulut, Z.F. Workability, physical & mechanical properties of the cement mortars strengthened with metakaolin and steel/basalt fibers exposed to freezing-thawing periods. Constr. Build. Mater. 2023, 394, 132100. [Google Scholar] [CrossRef]
- ASTM D698-12; Standard Test Methods for Laboratory Compaction Characteristics of Soil Using Standard Effort. ASTM International: West Conshohocken, PA, USA, 2021.
- Li, D.; Chen, X.; Tao, T.; Tan, W.; Ma, L. Quantifying the sheet-rill erosion process along a saturated soil slope. Eng. Geol. 2022, 219, 106631. [Google Scholar] [CrossRef]
- Yang, S.R.; Chen, X.R. Assessing rainfall-induced wetting band depth for stability analysis of unsaturated soil slopes. Case Stud. Constr. Mater. 2023, 18, e02180. [Google Scholar] [CrossRef]
- GeoStudio, Version 8.16.3, Manual for SLOPE/W and SEEP/W Modeling 2022; GEO-SLOPE International, Ltd.: Calgary, AB, Canada, 2022.


Disclaimer/Publisher’s Note: The statements, opinions and data contained in all publications are solely those of the individual author(s) and contributor(s) and not of MDPI and/or the editor(s). MDPI and/or the editor(s) disclaim responsibility for any injury to people or property resulting from any ideas, methods, instructions or products referred to in the content. |
© 2024 by the authors. Licensee MDPI, Basel, Switzerland. This article is an open access article distributed under the terms and conditions of the Creative Commons Attribution (CC BY) license (https://creativecommons.org/licenses/by/4.0/).