Abstract
China is striving to reach a peak in its carbon dioxide emissions by 2030 and achieve carbon neutrality by 2060. The accurate accounting of carbon emissions is important for achieving these dual carbon goals. An extensive literature review and field measurements were conducted to investigate the specific impact of population density on carbon emissions in large integrated healthcare organizations. This research uses VOSviewer to visualize the literature analysis. We determined that the flow of people is a key factor affecting carbon emissions during the operational phase of large-scale comprehensive medical institutions. Through field measurements, the relationship between the density of pedestrian flow and indoor environment measurements was derived, and the incremental equipment operating loads caused by changes in the indoor environment were analyzed. Using the carbon emission factor method advocated by the IPCC, a carbon emission accounting model based on different flow intervals was constructed, and the energy consumption of different equipment was fully considered according to its proportion. The validation results showed that the error between the calculated value and the actual values of the model was 3.07% (less than 5%), which has good validity. The model calculates the direct and indirect carbon emissions in the operational phase based on the population flow perspective, which can provide a reference for the energy-saving design and green operation of large-scale comprehensive medical institutions. The research will continue to focus on the population flow, and the accounting model will be further optimized through machine learning algorithms.
1. Introduction
Due to the good heat-preservation ability of carbon dioxide, the denser this layer of gas is, the easier it is to cause the global temperature to rise. Global warming will lead to dramatic changes in the climate, a reduction in human activities, crop yield reductions, air pollution, and other more prominent issues. Therefore, carbon neutrality is very necessary for global environmental governance. In 2020, the dual carbon strategic goals were formally proposed by China at the seventy-fifth session of the United Nations General Assembly, which strive to reach a peak in carbon emissions by 2030 and achieve carbon neutrality by 2060.
Carbon emission accounting models are the basis for the study of carbon emissions in the construction field. The accuracy of the accounting boundary directly determines the reliability and representation of the results, and is also an important basis for assessing carbon emissions in the construction field. However, the boundary definition of carbon emission accounting in China’s construction sector is not uniform, resulting in inconsistent accounting results, and thus the reliability and validity of the accounting results cannot be verified. When calculating the carbon emissions of buildings in a certain area, there are differences in the existing accounting boundaries. For example, whether the emissions generated by people in a building are included in the corresponding carbon emissions accounting, how to accurately calculate the carbon emissions of each type of building, and the boundary ranges are not clear. The current number of studies in this field is small, and further research is needed. Large-scale comprehensive medical facilities account for 45% of the total carbon emissions from public buildings. Their energy consumption intensities are 1.5–2.0 times that of general public buildings that are in a high-emission state []. Miles [] first proposed the theory that human behavior can significantly affect energy use and introduced the concept of behavioral models in 1980. In 2009, Liao [] first used the flow of people as a parameter to optimize the energy-saving control of a central air-conditioning system by calculating the cooling load of a shopping mall’s building equipment. According to existing surveys [], carbon emissions caused by biological respiration account for more than 1% of the total carbon output, and its impact on total carbon emissions exceeds 75% in nearly half of the countries in the world. Geng [] analyzed the carbon emission sources of school buildings using the carbon balance method and found that the main carbon emission sources were construction, people, and transportation. Existing studies have shown that population flow and personnel behavior are the main factors affecting building energy consumption, and their impact on the annual energy use of buildings is as high as 75–150% []. Jeong [] used a t-test and variance analysis to conduct regression research. The analysis showed that the total building area of medical facilities, the number of staff, and the number of outpatients determined the energy consumption level of hospital buildings to a certain extent. By adjusting the research variables, the total energy consumption of general hospitals can be reduced. Shi [] compared the carbon emission calculation systems of public buildings in China, the United States, and Finland and used the One-Click LCA model to calculate the carbon emissions of the buildings’ whole life cycles. Through empirical analysis, it was found that the OCL model has good accounting validity. Pan [] explained the boundary of architectural LCA from the dimensions of time, space, function, and method. Luo [] optimized the carbon emission calculation model of residential buildings, and analyzed the content of the calculation. It was found that the content of carbon emission calculations in the operational stages of a building is more complicated. Zhang [] proposed a full carbon emission calculation method, which includes carbon emissions from energy consumption, potential carbon emissions from biomass resource consumption, and potential carbon consumption from waste emissions. Based on BIM, Wang [] established a carbon emission accounting model for the construction operation stage, and analyzed the carbon emission calculation model for a school building in the operational stage based on the time dimension.
However, calculations in existing studies are based on the perspective of fixed energy consumption, and the dynamic factors affecting the calculation results of carbon emissions are not considered. In the calculation of carbon emissions during the operation of a building, if the calculation is carried out according to a fixed working time or fixed operating power of a machine, the calculation result will have a certain degree of error compared with the actual situation. Different population flows will lead to different environmental changes, and the length of time that the equipment needs to operate in order to account for these environmental changes is not uniform or fixed, so the final results of carbon emissions calculated using population flow will be more in line with the actual situation and be more accurate.
According to the statistical data, the uncertainty and variability in personnel activities are the main reasons for the difference between building performance and design expectations. When calculating the total load of relatively closed buildings, the influence of personnel factors on the total load is not considered, and only conventional superposition is used []. The existing calculation specifications are calculated with fixed parameters, which cannot fully meet the actual situation. The uncertain huge flow of people is not fully considered, resulting in a large difference between the design conditions and the actual situation. In order to better calculate the carbon emissions based on the dynamic flow of people, it is necessary to establish an accounting model with the flow of people as an independent variable to solve the problem of inaccurate calculation results. Based on the existing research, it can be seen that the flow of people is an element that cannot be ignored in the calculation of carbon emissions, but the current calculation model has not yet considered it. Therefore, this paper will intensively study this part and analyze its specific mechanism of action. The research process and method framework are shown in Figure 1.
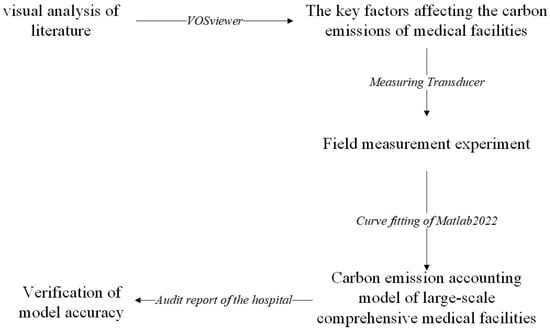
Figure 1.
Research process and method framework.
2. Analysis of Influencing Factors of Carbon Emissions in Large-Scale Comprehensive Medical Facilities
2.1. Definition of Large-Scale Comprehensive Medical Facilities
The average annual number of visits to large-scale comprehensive medical facilities is 4.6–6.7 times that of general comprehensive medical facilities, and the number of beds opened is 3.5–4.6 times that of general medical facilities. Its energy consumption area is more complex, and the difference in energy consumption per unit of building area can be 2.53 times greater compared with specialized hospitals of the same level []. The Standard for Building Carbon Emission Calculation [] states that calculating carbon emissions during the operational stage should cover the number of indoor personnel on working days and holidays and consider the impact of human heat dissipation and partial load characteristics on energy consumption. According to the Basic Standards for Medical Institutions, the per capita area of tertiary general hospitals should not be less than 4 m2; therefore, the flow density should not be greater than 0.25 person/m2. However, the actual flow density of large-scale comprehensive medical facilities can reach 1.3 person/m2, which exceeds five times the design flow threshold [,].
China stipulates that the number of beds in large-scale comprehensive medical facilities should not be less than 1000 and that the number of beds should be used as the main indicator for the classification of three levels and ten grades []. Japan and South Korea stipulate that the number of beds in large-scale comprehensive medical facilities should not be less than 800, whereas the United States stipulates that it should not be less than 500 []. Through the statistics of the number of visitors to medical facilities in different regions of China in the past 10 years, as shown in Figure 2, this study defines public medical buildings with an average annual population flow of not less than 50% of the total population of the region and a bed number of not less than 1000 as large-scale comprehensive medical facilities.
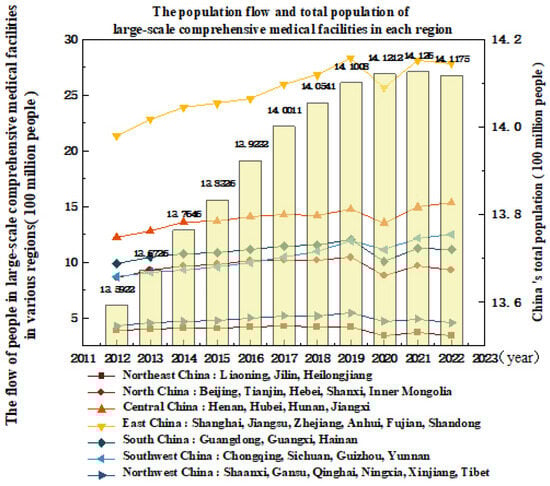
Figure 2.
Annual footfall data for medical facilities by region in China [].
Obviously, the number of visits in the economically developed eastern region are significantly higher than that in the western region, and the flow of people in hospital buildings is greater. Therefore, the carbon emission accounting model of medical facilities in the eastern region should fully consider the flow of people, thereby reducing the error between the calculated value and the actual value. However, the influence of dynamic human flow factors has not been mentioned in existing building carbon emission accounting models []. The estimation of static load carbon emissions based on fixed parameters will cause inconsistency between the estimated running time of the equipment and the actual running time, which will lead to the extensive accounting results []. Based on the Standard for Building Carbon Emission Calculation and research, this study clarifies that the carbon emission sources during the operational period of buildings are various facilities, systems, and the flow of people. This study analyzed the carbon emission behavioral characteristics of large-scale comprehensive medical facilities, distinguished the direct and indirect emissions caused by the flow of people, and constructed a carbon emission accounting model for large-scale comprehensive medical facilities based on changes in the flow of people.
2.2. Grounded Theory Analysis
Grounded theory is a qualitative research method based on quantitative means. It constructs a theoretical model after coding the data step-by-step and draws a universal conclusion. However, China‘s comprehensive survey of the energy conservation and emission reduction performance of large-scale comprehensive medical facilities is insufficient, and there is a lack of comprehensive energy survey data relating to hospitals at different levels across the climate zone. By sorting out the existing energy audit reports and the database of energy resource conservation demonstration cases of public institutions, the influencing factors of carbon emissions of medical facilities are studied. A total of 117 phenomenon abstracts (a+ codes) were extracted, and 81 concept sentences (aa+ codes) were further summarized according to the extracted phenomenon abstracts. In order to avoid the repeated intersection of concept sentences, the repeated concept sentences were re-condensed to obtain five category labels (A+ codes); that is, the main influencing factors of carbon emissions in large-scale comprehensive medical facilities. The five category labels are energy structure, system energy consumption, overall layout of medical areas, population flow, and equipment density. An example of open coding is shown in Table 1.

Table 1.
Examples of open codes.
Through the open coding shown in Table 1, the influencing factors of energy consumption and carbon emissions of large-scale comprehensive medical facilities are extracted; that is, five categories of categorical labels. According to the geographical boundary division in the medical facilities area, the main category is divided into two parts: external factors and internal factors. External factors directly or indirectly affect the carbon emissions of medical facilities through internal factors. Internal factors influence each other and then affect carbon emissions, forming a theoretical framework for the influencing factors of carbon emissions in large-scale comprehensive medical facilities, as shown in Figure 3.
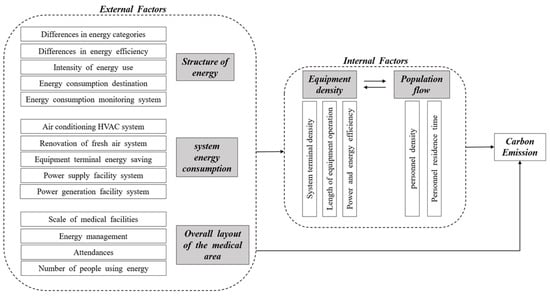
Figure 3.
Theoretical model of carbon emission influencing factors for large-scale integrated medical facilities.
From Figure 3, it can be seen that the main categories of carbon emission influencing factors of large-scale medical facilities include energy structure, system energy consumption, overall layout of medical areas, flow of people, and equipment density. Among them, the energy structure, overall layout, and equipment density belong to the static influencing factors, which are determined in the design and construction stage, while the system energy consumption and human flow belong to the dynamic influencing factors in the operation stage. The system energy consumption increases the operating load due to the change in human flow, and the human flow itself will lead to the direct emission of CO2. In order to study the factors related to the flow of people, the bibliometric visualization analysis is carried out through the correlation degree and hot spot distribution.
2.3. Visualization Analysis of Literature Based on VOSviewer
Keywords such as “energy consumption of medical facilities” and “influencing factors of carbon emissions from building operation” were searched through the Web of Science platform. As shown in Figure 4a,b, VOSviewer was used to analyze the existing research basis of the clustering view and density view analysis by studying 528 studies in the literature. The frequency of connections between the modules of each influencing factor was counted, and the corresponding relationship between the flow of people and other influencing modules was analyzed. The degree of correlation between different clusters and carbon emission modules in the literature visualization analysis is shown in Table 2.
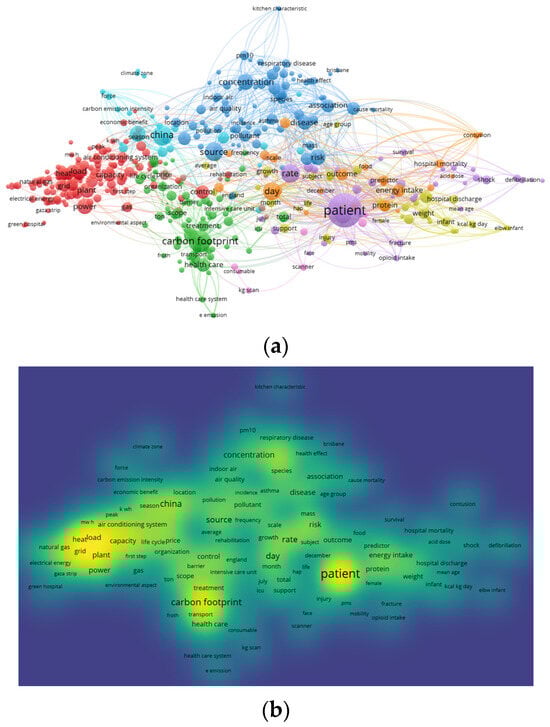
Figure 4.
(a). Network visualization; (b). density visualization.
Table 2.
The degree of correlation between different clusters and carbon emissions.
The correlation analysis (Figure 4a) showed that carbon emissions (recurrence frequency: 52.33%) had the highest correlation with the number of patients (56.78%) and had a direct correlation with indoor air quality (3.6%), indoor temperature (15.68%), and carbon footprint (24.36%). Cluster 1 (purple) reflects the research hotspots of the impact of patient numbers and staff turnover rate on hospital building carbon emissions using “patient”, “mobility”, and “rate” as the main keywords; cluster 2 (green) focuses on the research hotspots of medical energy consumption and group carbon footprint behavior through the keywords of carbon footprint, scope, health care, and practice; cluster 3 (blue) focuses on the research hotspots of the influence of air quality inside public medical facilities on carbon emissions from building operations through keywords such as concentration, source, exposure, and indoor air; and cluster 4 (red) discusses the research hotspots of equipment energy structure optimization from the aspects of power and heat capacity and the air-conditioning system.
Cluster analysis (Figure 4b) showed that the number of people, indoor environmental parameters, medical energy consumption, and equipment energy structure were the influencing factors affecting the carbon emissions of medical facilities. Medical energy consumption is a special function of medical facilities which belongs in the fixed energy consumption category. Changes in human flow, indoor environmental parameters, and equipment energy structure belong to the energy floating consumption category. This population produces a certain amount of CO2. Different population bases affect the changes in the indoor environment because of the strict constraints of the indoor environmental indicators of medical facilities, increasing the operating load of equipment and additional carbon emissions.
The classification module test was designed according to the research correlation between the flow of people and the indoor gas concentration, indoor temperature, and humidity. The number of patients was expanded to the total number of people in and out of the hospital, and an indoor environment measurement was used as an intermediate variable to establish the relationship between the flow of people, indoor environment measurement, and operating load of facilities and equipment.
3. Experimental Analysis
3.1. Purpose of the Experiment
The changing indoor environment measurement and the total amount of carbon dioxide emitted under different personnel densities were calculated using the sensing test under different environmental conditions. Furthermore, the energy consumption changes in the corresponding equipment were analyzed, and the carbon emission measurement model obtained from the measurement test was established.
3.2. Experimental Organization Design
3.2.1. Experimental Theoretical Basis
Existing research can predict the cooling load and change the operating frequency of air conditioners using the human flow and temperature prediction models []. Through the experiment of 1~5 people‘s airtight measurement, it is found that the indoor air quality of office buildings becomes worse with the different number of people []. According to the statistical data on electric energy consumption and natural gas consumption of existing medical facilities, the energy consumption of large-scale comprehensive medical facilities in different regions is audited annually, and the correlation between population density and different types of energy consumption was analyzed, as shown in Table 3.
Table 3.
Correlation analysis table of density of people and consumption of power natural gas [].
Table 3 shows that the power and natural gas consumption were significantly positively correlated with population density. According to statistics, electricity consumption accounts for 60% of the total energy consumption of medical facilities []. By analyzing existing research data [] and the energy consumption limit specification of comprehensive medical institutions in various regions [,,], the annual per capita power consumption limit was used as the evaluation index to compare the design reference and the actual consumption values [], as shown in Table 4.
Table 4.
Hospital flow density, electric energy reference value, and actual value [,,].
Through the data in Table 4, it can be seen that the H16-H18 and H20-H22 hospitals have built energy intelligent management platforms to adjust the energy consumption of different types in real time, and their actual energy consumption values have obvious advantages compared with other hospitals. The actual power consumption value of each comprehensive medical facility was fitted based on the population density variable according to the data in Table 4, and the benchmark and advanced values under different population densities were compared. The cftool command stream in MATLAB was used to fit the actual values of power energy consumption in different hospitals, and the curve in Figure 5 was obtained. The concavity and convexity of the curve were analyzed using the quadratic derivative method.
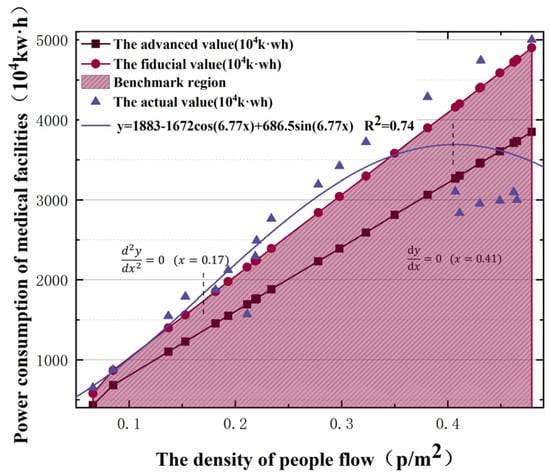
Figure 5.
Relationship between population density and power consumption of medical facilities.
Figure 5 compares the benchmark and advanced values of power consumption, and the shaded area is the benchmark power consumption under different flow densities. Nearly 70% of large-scale comprehensive medical facilities do not meet the benchmark per capita power consumption requirements. The power consumption values under different flow densities were fitted, as shown by the curve in Figure 5. With an increase in population density, the growth rate of power consumption first accelerated, slowed, and then changed irregularly. In order to better analyze the change law of the curve, the relationship obtained by fitting is subjected to continuous second-order derivation to further analyze its convexity. The power consumption has an inflection point when the flow density is 0.17 p/m2. The growth is irregular when the flow density exceeds 0.41 p/m2. In order to study the law clearly, the analysis is focused on the (0, 0.4).
The thermal effect of the human flow in a room is divided into two parts: latent and sensible heat []. Heat exchange with the indoor air occurs through moisture dissipation, heat dissipation, and convective radiation []. To study the effects of human flow on energy consumption in large-scale comprehensive medical facilities, the relationship between human flow and indoor environmental changes must be determined. A field measurement test for temperature, humidity, and CO2 concentration was designed. The corresponding relationships were deduced according to the measured data, which provided the basic data for model construction.
3.2.2. Experimental Scheme
The experiment was conducted in indoor areas of 20 and 25 m2, covering six different human flow densities between 0 and 0.4 people/m2. We designed five groups of equal numbers of people and four groups of equal numbers of people, i.e., a 1, 2, 3, 4, and 5 people array and a 1, 2, 4, and 8 people array. In order to avoid the test error caused by outdoor temperature, humidity, enclosure structure, and other factors, a 240 min continuous test was carried out at different time periods to compare the operation cycle of the medical facilities. The arithmetic array was measured from 8:00 to 12:00, and the geometric array was measured from 13:30 to 17:30. To avoid extreme error values, each group was repeated three times, and a mean value analysis was performed.
Different functional measurement probes were connected to the sensor to upload real-time data to an IoT cloud platform. To prevent temperature changes affecting the concentration measurement value, a temperature compensation setting of the CO2 sensor was performed, as shown in Figure 6. The upload time interval was 10 min, and the indoor CO2 concentration overrun benchmark was set to 1000 ppm.

Figure 6.
Environmental monitoring terminal IoT cloud platform.
3.3. Experimental Process
According to the area of various indoor areas in the medical facilities, two areas of 20 m2 and 25 m2 were selected for 4 h of continuous control test. In order to prevent thermal disturbance caused by outdoor temperature differences, according to the requirements of the Technical Specifications for Monitoring of Indoor Air Quality [], the sensor probes of each module were placed at 50 cm away from the outer wall side and uniformly installed, as shown in Figure 7a,b. In the three repeated tests, the sensor probes of each module were exchanged, and the indoor wind speed measuring device was placed at the ventilation position.
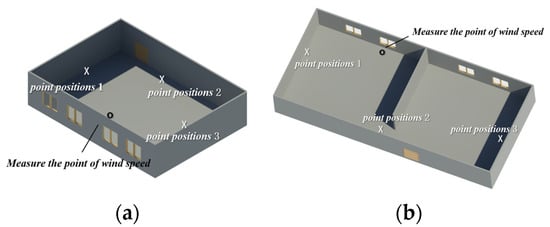
Figure 7.
(a). Test point location1 (20 m2); (b). test point location2 (25 m2).
The temperature analog signal was transmitted to the numerical control table through an electrical wire, and the control signal was then transmitted to the IoT platform. The flow temperature was calculated by measuring the infrared radiation intensities emitted by different groups of people, as shown in Figure 8a. The humidity sensor fixed the external probe of the humidity transmitter and connected it to the monitoring host. The converter was connected to a 10-30VDC power supply for data reading, as shown in Figure 8b. The CO2 sensor has a built-in probe, which was connected to the 12 V power supply interface through the adapter, and the power supply and communication terminals were connected to 10 A and 250 V wiring, as shown in Figure 8c. After adjusting the secondary parameters of the digital display meter of the wind speed measurement terminal, the indoor ventilation volume was measured, as shown in Figure 8d.
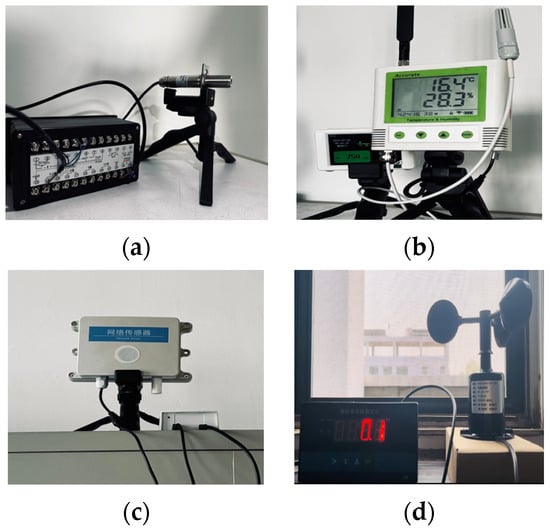
Figure 8.
(a). Temperature sensor; (b). humidity sensor; (c). CO2 sensor; (d). wind speed sensor.
3.4. Experimental Analysis
The data measured by the sensor were recorded using a cloud platform at a recording time interval of 10 min. The measured data for each module test are shown in Figure 9a–c.
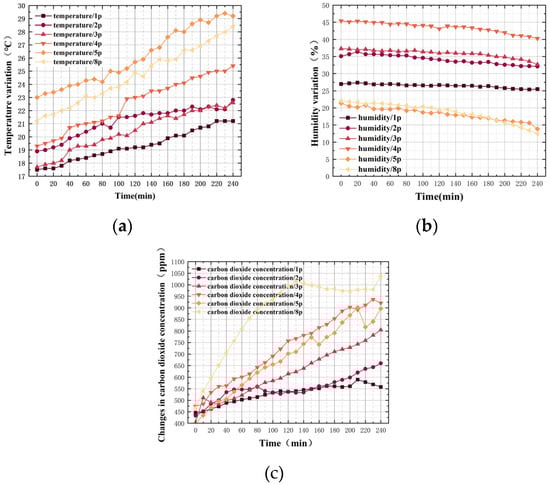
Figure 9.
(a). Temperature variations for different groups of people; (b). humidity variations for different groups of people; (c). the change in CO2 concentration in different groups of people.
According to the horizontal and vertical axes of each map, the number of people and their residence time were positively correlated with temperature and CO2 concentration and negatively correlated with humidity. A quantitative analysis of human flow density and environmental measurement increments was conducted every 30 min to analyze further the mechanism of human flow in indoor environment measurements.
3.4.1. Temperature Increment Analysis Based on People Flow Density
The incremental calculations for the temperature test every 30 min are presented in Table 5. The difference between the measured and initial values at different time points was defined as the increment. The relationship between the test time and temperature increment for different person arrays is shown in Figure 10a. The relationship between the flow density and the temperature increment at different time periods is shown in Figure 10b.
Table 5.
The calculated value of temperature increment (°C).
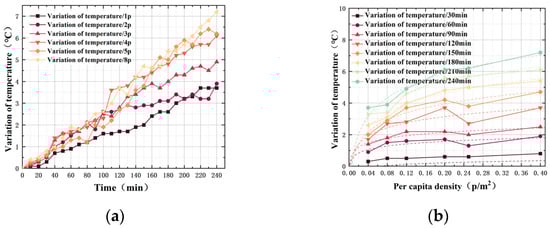
Figure 10.
(a). Variation in temperature increments for different groups of people; (b). temperature increments of different flow density.
According to Figure 10a, there was a clear proportional relationship between the number of personnel and the temperature increment in the same period. The number of people was converted into the density of people, and a total of eight equal time points of 30, 60, 90, 120, 150, 180, 210, and 240 min was taken for the quantitative analysis of the density of people and the increment in temperature, as shown in Figure 10b. There was a consistent trend between the temperature increment change and the flow density in different time periods. The scatter points were fitted using MATLAB, and the different coefficients were determined using the weighted coefficient method, as shown in Equation (1):
where aj is the coefficient of the x term of class j; is the goodness of fit of the relationship in i period; ai,j is the j-coefficient of x in i-period i. Using Equation (1), the relationship between the flow density and indoor temperature increment was calculated, as shown in Equation (2):
where Tv is the temperature increment (°C) and x is the population flow density (people/m2).
3.4.2. Humidity Increment Analysis Based on Population Flow Density
The humidity increment was analyzed every 30 min. The humidity increment values for different groups of people are listed in Table 6. The relationship between the test time and humidity increment for different groups of people is shown in Figure 11a. The relationship between stream density and humidity increment in different time periods is shown in Figure 11b.
Table 6.
The calculated value of humidity increment (%).
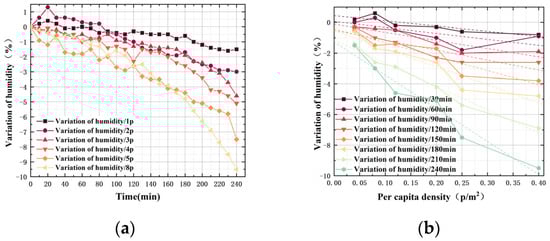
Figure 11.
(a). Variation in humidity increments for different groups of people; (b). humidity increments of different flow density.
During the same period, there was a significant negative correlation between the number of personnel and the absolute value of the humidity increment. According to the quantitative analysis of human flow density and humidity increment at eight equal time points, as shown in Figure 11b, there was a consistent trend between humidity increment and human flow density in different periods. However, the degree of negative correlation was different. The weighted mean of the coefficients for the different goodness of fit values was obtained, and the relationship between the two is expressed in Equation (3):
where Hv is the humidity increment (%) and x is the population flow density (people/m2).
3.4.3. Incremental Analysis of CO2 Concentration Based on Population Flow Density
The CO2 concentration increment was analyzed every 30 min, as shown in Table 7. The trend of the relationship between the test time and the increment in the CO2 concentration under different person arrays is shown in Figure 12a, and the trend of the relationship between the flow density and the increment in the CO2 concentration under different time periods is shown in Figure 12b.
Table 7.
The calculated value of CO2 concentration increment (ppm).
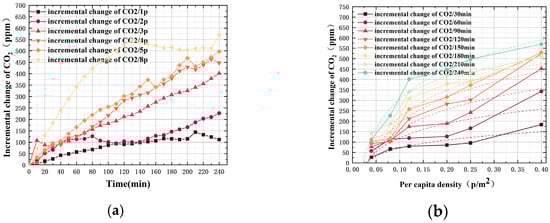
Figure 12.
(a). The incremental change in CO2 concentration in different arrays of people; (b). CO2 concentration increment in different human flow densities.
There was a clear proportional relationship between the increase in CO2 concentration and the number of personnel during the same period. Quantitative analysis of the flow density and increment in CO2 concentration was performed at eight equidistant time points. Figure 12b displays a consistent trend between the increase in CO2 concentration and flow density at different time periods. Curve fitting of the CO2 concentration increment and human flow density was performed, the coefficient was weighted, and the relationship between the two was obtained, as shown in Equation (4):
where Cc is the CO2 concentration increment (ppm) and x is the population flow density (people/m2). The population produced a certain amount of CO2 emissions, as measured by the test. The increase in CO2 concentration was related to the volume of indoor space, i.e., 1 ppm = (M ÷ 22.4) mg/m3, and M is the molecular weight of CO2. For every 1 ppm increase in CO2 concentration measured in the test, 37.63 × 10⁻³ kg CO2 increased correspondingly. The direct emission of CO2 measured during the tests is presented in Figure 13.
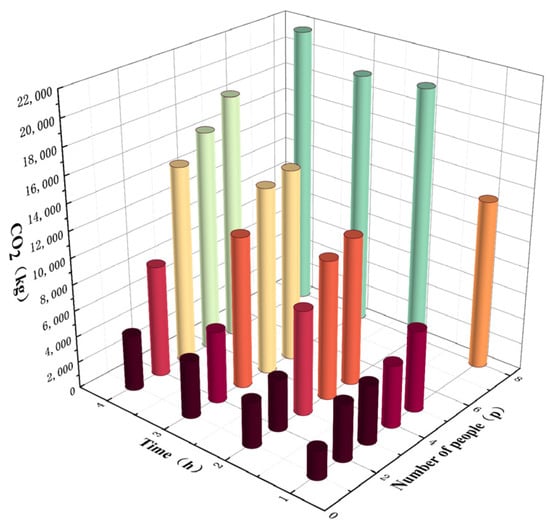
Figure 13.
Direct emissions of CO2 under different numbers of people and time.
Based on the analysis of the average value of CO2 emissions in different test groups, the direct emission of indoor CO2 was 0.301 kgCO2/(p·h). The relationship between the density of people and the direct emission of CO2 is shown in Equation (5):
where Cw is the CO2 direct emission increment (kgCO2); S is the area of population flow (m2); A is the personnel residence time (h); and x is the population flow density (people/m2).
Therefore, Equation (5) can be used to obtain the CO2 directly emitted by the flow of people and the CO2 indirectly emitted by the flow of people affecting the operating load of the equipment which together constituted the carbon emissions caused by a change in the flow of people.
4. Accounting Model Construction and Verification
Accurate carbon emission accounting is an important basis for achieving dual-carbon goals, and countries have made corresponding provisions in accounting standards. China issued an Implementation Plan on Accelerating the Establishment of a Unified and Standardized Carbon Emission Statistical Accounting System to formulate a unified accounting method. The United Kingdom promulgated the PAS2050 specification to regulate the carbon emissions of facilities during their life cycle, while the United States proposed the ASTMD 6866 standard as a reference index for calculating carbon emissions from various facilities []. Medical facilities are crowded high-density crowded buildings. The flow of people is concentrated and releases large amounts of heat and CO2 into the surroundings, causing the actual performance of the building to deviate significantly from the design conditions. To ensure the control effect of various systems and realize energy-saving operations, the carbon emission boundary must be clarified based on the existing carbon emission measurement framework and construct a carbon emission accounting model for large-scale comprehensive medical facilities based on changes in population flow [].
4.1. Framework of Accounting Model
4.1.1. Accounting Basis
The Standard for Building Carbon Emission Calculation stipulates that the carbon emission model of the building operation stage is as shown in Equation (6) []. System energy consumption is further divided into two parts: a floating and a fixed system. The floating system constructs a dynamic carbon emissions accounting model based on changes in the flow of people. Compared to the static input calculation of fixed equipment parameters, it is more suitable for actual working conditions and simpler than annual hourly statistics.
In Equation (6), CM is the carbon emission per unit building area in the building operation stage; A is the building area; Ei,j is the i-th energy consumption of the j-class system; ERi,j is the class j system’s consumption of the class i energy provided by the renewable energy system; EFi is the carbon emission factor of class i energy; Cp is the annual carbon reduction in the building’s green space carbon sink system; y is the design life of the building; i is the building’s energy consumption terminal type, including electricity, gas, oil, and municipal heating; and j is the type of building energy system, including heating, air conditioning, lighting, domestic hot water, and other systems. Because the floating energy system in this study is an air-conditioning HVAC system and fresh air system, the parameter m in Equation (6) is analyzed by 2.
4.1.2. Environmental Constraints
Owing to the strict requirements of large-scale comprehensive medical facilities on indoor environmental indicators, the indoor environmental requirements of public medical facilities were compared with existing norms, as shown in Table 8.
Table 8.
Code requirement indoor environmental standard values.
By comprehensively comparing the requirements of various indicators, the indoor environmental parameters of medical facilities are limited to a concentration of CO2 ≤ 1000 ppm; according to the different functional areas of the hospital, the temperature should be between 18 and 22 °C or 22 and 24 °C; the temperature constraint condition is set according to the area proportion of different regions; humidity should be in the range of 50–60% [].
4.2. Construction of Accounting Model
Ji R [] investigated and found that the consumption of electrical power was the highest proportion of the total energy consumption in Chinese hospitals, accounting for 64%. Air conditioning accounted for the largest share in the terminal energy of power consumption, which was 50%. Out-patient and emergency areas accounted for 40%, while in-patient areas accounted for 63%. The direct carbon emissions and indirect carbon emissions of medical institutions are distinguished, which are composed of carbon dioxide directly emitted by the flow of people themselves and indirect carbon emissions that affect the indoor environment and affect the operating load of the equipment. According to the experimental calculations, the changes in the indoor temperature, humidity, and CO2 concentration were caused by the flow of people, as shown in Equations (2)–(4). Equation (5) expressed the direct emission of CO2 caused by a crowd.
The energy consumption of the system included the energy consumption of the floating and fixed systems. The energy consumption of the HVAC system and the central fresh air system floated because of the flow of people; therefore, it was included in the floating system accounting []. The energy consumption of domestic hot water systems, elevator systems, office equipment, medical gas systems, auxiliary power systems, and other departments had a weak correlation with the number of people, which belonged to the scope of fixed-system energy consumption accounting and was calculated according to the proportion of the corresponding facilities.
The carbon sequestration capacity of different types of plants is different, and the carbon sequestration capacity of different density vegetation systems is also different. According to this experiment, the annual average carbon sink of the green space carbon sink system is estimated to be (0.41, 1.24) gCO2/m2 according to the existing research [], so the carbon neutral value of the carbon sink system within the geographical boundary of the building can be estimated according to the green area. The amount of carbon sequestration per unit of green area needs to be measured according to different types of vegetation, and this study does not make uniform provisions.
4.2.1. Carbon Emission Model of Air-Conditioning System Based on People Flow
According to the Standard for Building Carbon Emission Calculation, the carbon emissions generated by the equipment caused by the temperature change were substituted into the seasonal outdoor average temperature Ta in different regions, and the heat transfer coefficient φ of different envelope structures was taken to obtain the temperature starting value φTa. According to the variation law of temperature increment Tv obtained from the test and the temperature constraint value Tf in the medical facility, the temperature overrun part was obtained, i.e., . Equation (7) is obtained by substituting the personnel density into the equation:
where ∆T is the over-limit part of the indoor temperature; φ is the heat transfer coefficient of envelope structure; Ta is the seasonal outdoor average temperature (°C); Tf is the upper limit of indoor temperature constraint (°C); and x is the population flow density (people/m2).
According to ∆T and the rated cooling capacity of the air-conditioning system, the operating time t required for the air-conditioning system to reach the temperature limit was calculated. Furthermore, the carbon emission increment in the air-conditioning system due to the change in the indoor environment was obtained, as shown in Equation (9):
In Equations (8) and (9), t is the running time of the air-conditioning HVAC system (h); V is the interior space (m3); Ct is the carbon emissions of air-conditioning temperature control system (kgCO2); ρ is the average density of air (kg/m3); rt is the cooling capacity of air-conditioning equipment (W); the air specific heat is 1008 J/kg⋅°C; Pi is the power of equipment using category i energy; and EFi is the carbon emission factor of the i-th energy.
The starting humidity value Ha was determined by referring to the average humidity in different regions. The humidity increment change Hv obtained from the experiment and the corresponding humidity constraint value Hf were used to obtain the required dehumidification amount in the environment and the personnel density was substituted to obtain Equation (10):
where ∆H is the overrun part of indoor humidity; Ha is the seasonal outdoor relative humidity (%); Hf is the restricted upper limit of indoor relative humidity (%); x is the population flow density (people/m2).
According to the dehumidification capacity per input power in the specified dehumidifiers [], the relationship between the humidity changes and the operating load increment in the air-conditioned wet system was calculated, as shown in Equation (11). And the energy form of unit input power takes the form of electric energy because the dehumidification equipment in medical facilities is dominated by electric energy consumption.
where Ch is the carbon emission of the air-conditioning wet system (kgCO2); V is the interior space (m3); 1.2 is the assurance coefficient; ρ is the average density of air (kg/m3); EFi is the carbon emission factor of the i-th energy; and Pw is the amount of dehumidification per unit input power (kg/kW∙h).
4.2.2. Carbon Emission Model of Fresh Air System Based on People Flow
The concentration of CO2 in the atmosphere was 400 ppm. According to the CO2 concentration increment change Cc and the corresponding concentration constraint value Cf obtained from the experiment, the transfinite part of the concentration can be obtained, and the calculation in Equation (12) can be combined as follows:
where ∆C is the transfinite part of indoor CO2 concentration; Cf is the upper limit of indoor CO2 concentration constraint; and x is the people flow density (people/m2).
According to the Design Standard for Energy Efficiency of Public Buildings [], the fresh air demand corresponding to the CO2 concentration exceeding the limit is calculated. The power consumption per unit air volume is given by Equation (13):
where Ws is the power consumption per unit air volume (kW∙h/m3); P is the fan wind pressure of the fresh air system (Pa); ηCD is the motor and transmission efficiency (take 0.855); and ηF is the fan efficiency (%).
According to the requirements of the gas environment in medical facilities, the calculation method for the carbon emission increment caused by the change in the indoor CO2 concentration environment in a central fresh air system is shown in Equation (14):
where F is the carbon emissions of the central fresh air system caused by the flow of people (kgCO2); V is the interior space (m3); EFi is the carbon emission factor of the i-th energy; and the gaseous density of CO2 is 19.77 mg/L.
4.2.3. Carbon Emission Model Based on People Flow
The increase in the operating load of the equipment aimed to achieve and maintain indoor environmental parameters that meet the requirements, and the environmental indicators in medical facilities are strictly constrained. In Equation (12), x was in the range of (0.218, +∞) ∆C ≥ 0, which means when the crowd density exceeded 0.218 people/m2, the indoor CO2 concentration exceeded the upper limit threshold, and the energy consumption of the fresh air system was generated during the start-up operation. The survey showed that the inflection point of hospital energy consumption increment (Figure 5, x = 0.17) was near x = 0.2, the model was constructed in the interval of (0, 0.2), (0.4, +∞).
The relationship between the carbon emissions of various equipment systems and the indoor environment measurement changes caused by the flow of people were simplified and merged to obtain Equation (15):
where Ci is the increment in carbon emission of type i equipment system caused by the flow of people (kgCO2); Ct is the carbon emissions of the air-conditioning temperature control system (kgCO2); Ch is the carbon emission of the air-conditioning wet system (kgCO2); F is the carbon emissions of the central fresh air system caused by the flow of people (kgCO2); V is the interior space (m3); and EFi is the carbon emission factor of the i-th energy
Δ, ξ, Δ*, ξ*—the corresponding vector matrix, where ∆ = , ξ = , ∆* = , ξ* = , α = 0.336Pi/rt, β = 0.00144/Pw, γ = P × 10−3/60852ηF.
The indirect increment in carbon emissions was the increment in the equipment operating load caused by the change in human flow, as shown in Equation (15). The direct increase in carbon emissions was caused by the CO2 produced by the population itself, which was obtained from Equation (5). The direct and indirect increments were substituted into the accounting framework to obtain the carbon emissions accounting model caused by the flow of people, as shown in Equation (16):
where Z is the carbon emissions of large-scale comprehensive medical facilities based on population flow (kgCO2); Ci is the increment in carbon emissions of type I equipment system caused by the flow of people (kgCO2); θi,j is the type i equipment using the correction coefficient of type j energy (determined by the energy consumption category and energy consumption ratio of equipment operation); Cw is the CO2 direct emission increment (kgCO2); and y is the design life of the building.
According to the energy-consuming structure of medical facilities and the density of energy-consuming equipment in different functional zones, Equation (16) was simplified and merged to determine θ1,e ϵ (0.36, 0.46), θ2,e ϵ (0.03, 0.04) [], as shown in Equation (17):
where Z is the carbon emissions of large-scale comprehensive medical facilities based on population flow (kgCO2); x is the population flow density (people/m2); y is the design life of the building; a is the coefficient, take (10V∙EFi, 70V∙EFi); b is the coefficient, take (0.16V∙EFi, 0.5V∙EFi); c is the coefficient, take (0.3S–0.001V∙EFi, 0.6S–0.002V∙EFi); d is the coefficient, take (0.001V∙EFi, 0.002V∙EFi); e is the coefficient, take (0.002V∙EFi, 0.003V∙EFi).
4.3. Verification of Accounting Model
The model was verified according to the energy-saving report data of a hospital in Sichuan Province, as listed in Table 9. The air-conditioning heating and ventilation system in medical facilities adopted electric multi-connected units with a rated power of 260 kW, an average annual flow of 250.77 million passers-by, and an average annual power consumption of 3883.72 × 104 kW∙h. The carbon emission factor of the Sichuan power grid is 0.5257 kgCO2/kW∙h [], and the actual total carbon emission caused by the average annual power consumption is 2.042 × 10 tCO2.
Table 9.
Energy audit table of a hospital in Sichuan province.
The HVAC system accounted for 40% of the total power consumption, the fan efficiency was 50%, and the unit input dehumidification power was 30 kg/(kW∙h) []. The central air-conditioning design reference specification and standard stipulated that the cooling capacity of the public area of the hospital should be 95 w/m2. Therefore, the flow density in the medical facility was calculated to be 0.237 people/m2 because the out-patient and emergency flow area accounted for 6–20% of the total area (approximately 30,000 m2) []. The average annual temperature in Sichuan Province is 16.8 °C, and the average humidity is 74% []. After being substituted into the model, the floating carbon emissions accounting value based on human flow was 2.106 × 10⁴ tCO2, and the error with the actual value was 3.07%, less than 5%. Therefore, the accounting value of the model interacts well with the actual value. The CO2 emissions directly generated by the flow of people were not proposed in the statistical report. According to the model calculation, the annual carbon emission statistics of the hospital had an error of 646.703 tCO2. Therefore, this model is based on the flow of people. The error in the accounting results is low, and the dynamic accounting model is optimized by integrating the indirect effects of the flow of people and equipment.
5. Conclusions
Starting with the flow of people, this study examined the related influencing factors, indoor environment changes, and the construction of an accounting model for carbon emissions in large-scale comprehensive medical facilities. The following conclusions are drawn:
(1) The flow of people is a key factor affecting carbon emissions from medical facilities. The flow of people discharges carbon emissions that increase the operating load of equipment by affecting the indoor environment, which in turn constitute the carbon emissions from large-scale comprehensive medical facilities.
(2) The changes in the indoor environment under different personnel densities are analyzed, and the environmental changes in high-density personnel areas are predicted by MATLAB simulation. The over-limit part of environmental parameters caused by the change in population flow in large-scale comprehensive medical facilities was determined.
(3) The model constructed in this study is compared with the energy audit report of the actual large-scale comprehensive medical facilities. The calculation error is only 3.07%, which has good accuracy and considers the carbon emission sources not included in the actual statistics. This shows that the accounting model has good interactivity with the actual project, and the calculation accuracy is more accurate than the calculation method of fixed parameters, which provides a theoretical basis for the promotion of a green medical building evaluation system.
(4) The calculation model derived from the experimental data eliminates the problem of the inaccurate calculation results of the existing model to a certain extent. Under the dynamic operating conditions of the hospital building, the carbon emission accounting value can be directly output after the model operation by inputting the ‘people flow’ parameter. The calculation results can not only make the calculated value more in line with the actual situation, but also predict the future carbon emission trend and provide a better strategy for the hospital’s energy management.
This research only tests the actual human flow conditions, and the extreme conditions of greater load have not been discussed. In the follow-up study, the calculation data and algorithm software will be used to simulate and predict different extreme working conditions, and the calculation accuracy of the model will be further optimized.
Author Contributions
Methodology, X.Y.; software, Q.L. and P.C.; verification, Q.L., Z.C. and Y.Y.; formal analysis, X.Y.; survey, Q.L. and T.Q.; resources, Z.C.; data monitoring, Q.L.; writing—original preparation, Q.L.; writing—review and editing, Q.L. and Y.Y.; supervision, X.Y. All authors have read and agreed to the published version of the manuscript.
Funding
This research was funded by Research on Social Science Development in Hebei province, grant number 20210101021.
Data Availability Statement
The data used to support the findings of this paper are included within the article.
Acknowledgments
We sincerely thank Lida Wang for helping us modify our English expressions.
Conflicts of Interest
The authors declare no conflicts of interest.
References
- Shan, Y.; Liu, J.; Liu, Z.; Xu, X.; Shao, S.; Wang, P.; Guan, D. New provincial CO2 emission inventories in China based on apparent energy consumption data and updated emission factors. Appl. Energy 2016, 184, 742–750. [Google Scholar] [CrossRef]
- Miles, H.J. Information Role and Attitudes within Universities towards Energy Conservation. Doctoral Dissertation, University of Surrey, Guildford, UK, 1980. [Google Scholar]
- Liao, J.; Liu, P.; Sun, S.; Li, Q. Global optimization model for energy-saving control of central air-conditioning system. Pract. Aware. Math. 2009, 39, 219–225. (In Chinese) [Google Scholar]
- Cai, Q.X.; Yan, X.D.; Li, Y.F.; Wang, L. Global patterns of human and livestock respiration. Sci. Rep. 2018, 8, 9278. [Google Scholar] [CrossRef]
- Geng, S. A Preliminary Study on Low-carbon Campus Planning: A Case Study of Shenyang Jianzhu University. Environ. Prot. Circ. Econ. 2015, 35, 43–47. (In Chinese) [Google Scholar]
- Clevenger, C.M.; Haymaker, J.R.; Jalili, M. Demonstrating the Impact of the Occupant on Building Performance. J. Comput. Civ. Eng. 2014, 28, 99–102. [Google Scholar] [CrossRef]
- Jeong, D.; Kim, S.; Kim, H.; Kwon, S. Study on the elements affecting energy consumption of general hospitals in Korea. J. Korea Inst. Healthc. Archit. 2020, 26, 63–71. [Google Scholar]
- Shi, L.; Qi, X.; Yang, Z.; Tao, L.; Li, Y.; Qiu, J.; Jiang, X. Comparative study of greenhouse gas emission calculations and the environmental impact in the life cycle assessment of buildings in China, Finland, and the United States. J. Build. Eng. 2023, 70, 106396. [Google Scholar] [CrossRef]
- Pan, W.; Li, K.; Teng, Y. Rethinking system boundaries of the life cycle carbon emissions of buildings. Renew. Sustain. Energy Rev. 2018, 90, 379–390. [Google Scholar] [CrossRef]
- Luo, Z.; Cao, Y.; Tian, H.; Hu, X.; Lu, M.; Xie, J. Study on Calculation Method of Architectural Landscape Engineering Life Cycle Carbon Emissions Case of a Residential Community in Xi’an. Build. Sci. 2023, 39, 9–18. [Google Scholar]
- Zhang, X.; Li, X.; Ye, W.; Baoan, Z. Calculation of Full Carbon Emission and Evaluation of Carbon Emission Performance. Acta Sci. Nat. Univ. Pekin. 2015, 51, 639–646. [Google Scholar]
- Wang, H.; Zhao, Y. Calculation of Carbon Emissions in Public Construction Phase Based on BIM Technology. In Proceedings of the 2020 3rd International Conference of Green Buildings and Environmental Management, Qingdao, China, 5–7 June 2020; Volume 531. [Google Scholar]
- Gu, X.; Xie, J.; Huang, C.; Liu, J. A spatiotemporal passenger distribution model for airport terminal energy simulation. Indoor Built Environ. 2022, 31, 1834–1857. [Google Scholar] [CrossRef]
- National Bureau of Statistics of China. China Statistical Yearbook; China Statistics Press: Beijing, China, 2022. [Google Scholar]
- Ministry of Housing and Urban Rural Development of the People’s Republic of China. Standard for Building Carbon Emission Calculation; China Architecture and Building Press: Beijing, China, 2019.
- Li, Y.; Chen, K.; Zheng, J.; Li, X. Energy-saving transformation and effect evaluation of air conditioning system in a large hospital in southern China. Build. Energy Effic. 2022, 50, 123–128. [Google Scholar]
- Malik, A.; Padget, M.; Carter, S.; Wakiyama, T.; Maitland-Scott, I.; Vyas, A.; Boylan, S.; Mulcahy, G.; Li, M.; Lenzen, M. Environmental impacts of Australia’s largest health system. Resour. Conserv. Recycl. 2021, 169, 105556. [Google Scholar] [CrossRef]
- National Health Commission of the People’s Republic of China. Construction Standard of General Hospital; China Planning Press: Beijing, China, 2021.
- Pichler, P.; Jaccard, I.; Weisz, U.; Weisz, H. International comparison of health care carbon footprints. Environ. Res. Lett. 2019, 14, 064004. [Google Scholar] [CrossRef]
- Ji, R.; Qu, S. Investigation and Evaluation of Energy Consumption Performance for Hospital Buildings in China. Sustainability 2019, 11, 1724. [Google Scholar] [CrossRef]
- Shou, Q. A New Central Air-Conditioning System Control Strategy Based on Prediction Model; ICCSIT: Chengdu, China, 2010. [Google Scholar]
- Ovando-Chacon, G.E.; Ovando-Chacon, S.L.; Rodríguez-León, A.; Díaz-González, M. Numerical Study of Indoor Air Quality in a University Professor’s Office. Sustainability 2023, 15, 4221. [Google Scholar] [CrossRef]
- Yu, X.; Yan, D.; Sun, K.; Hong, T.; Zhu, D. Comparative study of the cooling energy performance of variable refrigerant flow systems and variable air volume systems in office buildings. Appl. Energy 2016, 183, 725–736. [Google Scholar] [CrossRef]
- Hunan Institute of Quality and Standardization. The Quota & Calculation Method of Energy Consumption for Hospital; Administration for Market Regulation of Hunan Province: Changsha, China, 2015.
- Shandong Constuction Development Research Institute. Standard for Energy Consumption Quota of Hospital Buildings; Housing and Urban-Rural Development Department of Shandong Province: Jinan, China, 2016. [Google Scholar]
- Zhejiang Provincial Development and Perform Commission. The Quota & Calculation Method of Energy Consumption for Medical Institutions; Zhejiang Provincial Administration for Market Regulation: Hangzhou, China, 2021. [Google Scholar]
- Li, L.; Duan, M.; Guo, X.; Wang, Y. The Stimulation and Coordination Mechanisms of the Carbon Emission Trading Market of Public Buildings in China. Front. Energy Res. 2021, 9, 715504. [Google Scholar] [CrossRef]
- Jia, M.; Srinivasan, R.; Ries, R.J.; Bharathy, G.; Weyer, N. Investigating the Impact of Actual and Modeled Occupant Behavior Information Input to Building Performance Simulation. Buildings 2021, 11, 32. [Google Scholar] [CrossRef]
- Wang, W. Energy Consumption Characteristic Analysis and Optimization Research of Large General Hospital. Marster’s Thesis, Southeast University, Nanjing, China, 2021. (In Chinese). [Google Scholar]
- Zhu, J.Y.; Zhang, X.; Huang, C.H.; Wang, L.; Chen, R.; Ding, X.L. Evaluation of thermal environment and human thermal comfort in 8 types of public places from 2019 to 2021. J. Ind. Hyg. Occup. Dis. 2023, 41, 189–197. [Google Scholar]
- Ministry of Ecology and Enviroment of the People’s Republic of China. Technical Specifications for Monitoring of Indoor Air Quality; China Environmental Press: Beijing, China, 2004.
- Xie, J. Discussion on Peak Carbon Emissions and Energy Saving-Emission Reduction of Public Building in Chongqing Based on LEAP Model. Marster’s Thesis, Chongqing University, Chongqing, China, 2019. (In Chinese). [Google Scholar]
- Yu, L.; Chen, S.; Jia, J.; Ding, R.; Wang, S. A Maternity Hospital in Shenyang Indoor Environment Performance Influence Factor Analysis. Procedia Eng. 2016, 146, 190–195. (In Chinese) [Google Scholar] [CrossRef][Green Version]
- General Administration of Quality Supervision, Inspection and Quarantine of the People’s Republic of China. Dehumidifiers; China Machinery Industry Federation: Beijing, China, 2003.
- Ministry of Housing and Urban-Rural Development of the People’s Republic of China. Design Standard for Energy Efficiency of Public Buildings; China Academy of Building Research: Beijing, China, 2015.
- Lycke, J. Energy Use in Hospital Wards. In An Analysis Based on Activity Related Key Performance Indicators; Chalmers University of Technology: Guteborg, Sweden, 2012. [Google Scholar]
- Xie, L.; Yang, Y.; Du, X.; Zhang, D.; Huang, S.; Liu, J.; Tan, X.; Zhang, W. How Does West China Hospital Use Fine-Tuned Management in Energy Conservation; West China Hospital of Sichuan University Infrastructure Operation Department: Chengdu, China, 2016; Available online: https://news.zhuyitai.com/16/1123/aa243fd9b97c456a8e330c7d385bda04.html (accessed on 22 January 2024). (In Chinese)
- Statistics Bureau of the People’s Republic of China. China Statistical Yearbook; Statistics Bureau of the People’s Republic of China: Beijing, China, 2023. Available online: http://www.stats.gov.cn/ (accessed on 22 January 2024). (In Chinese)
Disclaimer/Publisher’s Note: The statements, opinions and data contained in all publications are solely those of the individual author(s) and contributor(s) and not of MDPI and/or the editor(s). MDPI and/or the editor(s) disclaim responsibility for any injury to people or property resulting from any ideas, methods, instructions or products referred to in the content. |
© 2024 by the authors. Licensee MDPI, Basel, Switzerland. This article is an open access article distributed under the terms and conditions of the Creative Commons Attribution (CC BY) license (https://creativecommons.org/licenses/by/4.0/).