Abstract
The abandonment of inland areas has become a major demographical challenge, causing a condition of local fragility in terms of spatial marginalization. To deal with this issue in Italy, a number of policy actions have been implemented over the time, namely the National Strategy for Inland Areas, established a decade ago, and more recently the Next Generation EU (NGEU) to foster local economic recovery and employment. In this context, RI.P.R.O.VA.RE., a project funded by the former Italian Ministry of the Environment and Protection of Land and Sea (MATTM), was aimed at strengthening the resilience features of communities and territories, focusing on areas within the Matese and Ufita in the Campania region and the Medio Agri in the Basilicata region (southern Italy). Besides the ability to respond to different pressure factors (e.g., of demographic and economic origin), the project also addressed issues concerning seismic and flood risks. This paper synthesizes the methods and tools provided for their analysis and mitigation as a prerequisite for regenerating inland areas. After presenting the developed methods and tools, the results obtained for the Matese study area are presented and discussed. While, on the one hand, the retrieved risk zoning maps allow individuating those municipalities requiring priority structural interventions, on the other hand, the latter are properly individuated based on the peculiar characteristics of urban fabrics.
1. Introduction
In recent years, the depopulation and marginality of inland areas in Europe has become a focus point both in the scientific international debate [1,2,3,4,5] as well as in the political agenda of the European Union [5,6]. Behind these phenomena is a combination of socio-economic and environmental causes: few job opportunities, inefficient services and infrastructure and the occurrence of natural and man-made disasters. These factors contribute to aggravating the fragility of areas already characterized by reduced accessibility and lack of services. The result is consistent migration dynamics, which see residents moving towards large and medium-sized cities [7].
Originally central hubs for the territories’ development, the small towns of inland areas, even before being key nodes for trade, were defence sites during the medieval period. It was from the Industrial Revolution onwards that a change took place: the advent of new machinery and the systematic reclamation of swamps and peat bogs favoured the migration of a large part of the population. The inhabitants of inland or mountain areas preferred to move to the new lowland settlements, which were easier to reach and better connected to the main cities.
To date, the state of affairs has remained largely unchanged. According to the latest Eurostat data, “over the period 2015–2020, the [European] population of predominantly rural regions fell, on average, 0.1% each year, while almost no change was recorded in the population of intermediate regions. On the other hand, the population of predominantly urban regions rose, on average, 0.4% each year” [8]. These percentages become even more significant when compared to the considerable extension of inland areas, which occupy about 80% of the European territory, with 45% of the regions being predominantly rural. Sixty percent of the population lives in these areas, divided between those inhabiting rural territories (21%) and those living in “intermediate” territories (39%) [9]. A common feature of all these territories, besides the significant demographic contraction, is the tendency to “underutilise or partially utilise their territorial capital [and potential]” [10] (p. 6). Precisely because of this vast capital, natural and cultural, tangible and intangible, which is in danger of being lost due to depopulation, the European Commission is promoting actions and programmes aimed at valorizing inland areas. This is especially significant as the current environmental crisis deepens. Indeed, this crisis sees the increasing depletion of natural resources, progressive desertification, the occurrence of extreme events, the loss of biodiversity and the alteration of natural ecosystems. In response to this condition, it appears necessary to implement local policies that look at the protection and development of the residual natural capital, mainly concentrated in inland areas. Therefore, these areas could represent potential elements of “re-sewing” between natural and anthropic systems, generating new and effective territorial development settings. Along these lines, the European Commission’s Long-term Vision for the EU’s rural areas (2021) aims to make inland rural areas stronger, more prosperous, connected and resilient [11]. In particular, to make inland areas stronger, the Vision suggests acting on local community awareness, strengthening services and fostering social innovation. With regard to increasing prosperity, the aim is to stimulate the diversification of economic activities and sustainable production. Connection refers to strengthening of digital networks and new forms of mobility. Resilience includes the need to face and deal with climate, social and environmental changes. For this reason, the Vision proposes the establishment of a Rural Pact between several EU actors and a Rural Action Plan with pilot initiatives. An important role is also played by the European Network for Rural Development (ENRD), which not only provides continuously updated data on the state of the art of inland areas, but also supports the implementation of Rural Development Programmes. These programmes promote the exchange of information and cooperation between several EU countries, as well as projects and best practices. Among the valorization models proposed by ENRD, of particular interest is that of Smart Villages, in which new digital technologies and residents’ active and conscious participation are the basis of development guidelines [12]. Further strategies adopted in many European nations involve the use of renewable energy for self-production and energy self-sufficiency [13], as well as the adoption of principles related to bio-architecture and ecology. In the first group are the Renewable Energy Communities (RECs) that find their greatest exemplification in the German Bioenergy Villages. In the second group are the Ecovillages, based on criteria of ecological, spiritual, socio-cultural and economic sustainability. Added to these is the Italian model of the Albergo Diffuso, a scattered model designed to outline a new form of hospitality, recovering and reusing existing buildings in small towns. The intention is to connect guests with “the local people, their stories, their cuisine, their handicrafts” [14] (p. 30).
There are also strategies and programmes carried out by individual EU countries. Among these, an interesting example of its innovative approach is the Strategia Nazionale Aree Interne (SNAI, National Strategy for Inland Areas). Starting from the formulation of a univocal definition of an ‘inland area’, the strategy maps priority areas for intervention according to a special dataset of indicators.
In the first 72 priority areas, projects are currently underway aimed at “territorial protection, enhancement of natural and cultural resources and sustainable tourism, [the promotion of] agri-food systems and local development, energy saving and local renewable energy chains, and know-how and crafts” [15] (pp. 6–7). These have been recently joined by 43 new areas.
Following the results achieved so far by SNAI and according to the principles of the 2030 Agenda and of the National Strategy for Sustainable Development (SNSVs), the research Project RI.P.R.O.VA.RE. (Riabitare I Paesi. stRategie Operative per la VAlorizzazione e la REsilienza delle aree interne) outlines an innovative methodology for the mapping of inland areas. This mapping is useful for developing strategies focused on sustainability and resilience criteria.
The adopted methodology takes into account not only social aspects (work, services and infrastructure) but focuses mainly on the assessment and mitigation of natural hazards (e.g., earthquakes, floods and landslides) [16].
In many cases, hazardous events have contributed to the acceleration of demographic decline; therefore, it is of paramount importance that any proposal aimed at counterbalancing inland areas’ depopulation is preceded by an in-depth risk analysis and, if required, mitigation. Only in this way will it be possible to ensure a safer future for inland areas, preventing huge investments, aimed at improving access to basic services and/or boosting weak local economies, from proving ineffective in facing future hazardous events.
A number of research contributions have dealt with the effects of natural hazards on depopulation of inland areas, as well as of social and structure vulnerability, see, e.g., [17,18]. However, there is no clear indication of specific methodologies to quantify natural risks in inland areas, an issue being tackled in the remainder of the paper.
In light of the above, this paper is aimed at supporting current policies in mainstreaming risk analysis and mitigation as a prerequisite for triggering sustainable and resilient development strategies in inland areas. With this aim, methods and tools are developed and tested on selected case studies to prioritize the inland areas that show highest levels of seismic and flood risks and support the identification and selection of the most adequate structural interventions for risk mitigation.
With this aim, the contribution is structured into the following sections: Section 2 presents a brief description of the main goals of the RI.P.RO.VA.RE. project; Section 3 describes the methods adopted for seismic and flood risk analysis and the definition of the related mitigation strategies; in Section 4, the presented methodology is applied to the Matese case study, an area located in the Campania region (southern Italy); finally, concluding remarks are drawn in Section 5.
2. The RI.P.R.O.VA.RE. Project: Goals, Methodology and Results
The RI.P.R.O.VA.RE project, which started in 2019 and ended in 2022, involved researchers from three southern Italian universities.
The three involved universities are the following:
- The University of Campania “Luigi Vanvitelli”, Department of Architecture and Industrial Design (DADI);
- The University of Salerno, Department of Civil Engineering (DICIV);
- The University of Basilicata, Department of European and Mediterranean Cultures (DICEM).
The experts’ provenance to different disciplinary fields (architecture, city planning, engineering and anthropology, among others) has ensured a multidisciplinary approach to the study of inland areas’ regeneration.
The project tackled a crucial aspect of the National Strategy for Sustainable Development: to create resilient communities and territories and preserving landscapes and cultural heritage. This issue has been addressed with reference to inland areas: this choice stems both from their heterogeneous fragilities, due to the risk features as well as to social and economic dynamics, and by the presence of a significant potential in terms of natural and cultural heritage.
From this consideration, the main goal of the RI.P.R.O.VA.RE. project was outlined: to provide integrated strategies for the sustainable and resilient development of inland areas through a multi-scalar, multi-disciplinary and replicable approach. To this end, taking the work of the SNAI as a reference, it was deemed necessary to supplement the delimitation criteria with additional factors relating to demo-ethno-anthropological, historical-cultural and environmental issues. These elements are essential in prefiguring effective growth scenarios, inevitably impacting the resilience of territories [19]. To reach the above-mentioned goal, the research work was structured into several sub-goals, to which the three methodological steps were associated. More specifically, the methodological steps and sub-goals are the following (Figure 1):
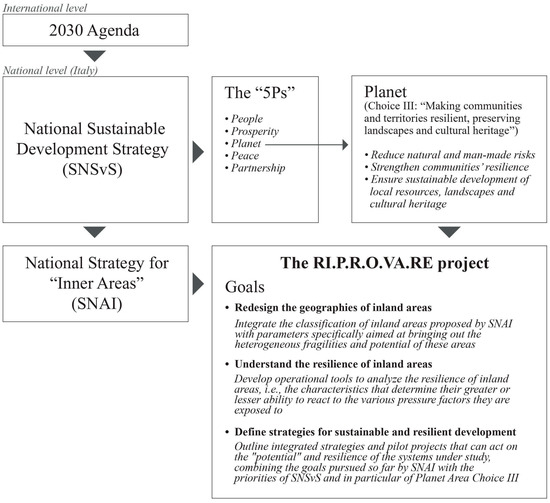
Figure 1.
References and goals of the RI.P.R.O.VA.RE. research project.
- Step 1: Redesign the geographies of inland areas;
- Step 2: Understand the resilience of inland areas;
- Step 3: Define strategies for sustainable and resilient development.
The first sub-goal required the study of the sector’s literature for the collection of new criteria useful for the redefinition of inland areas. This was conducted by considering the “negative” and “positive” factors describing these realities, which are their criticalities and potential, with the aim of grasping their different peculiarities. These factors were subsequently divided into “geographies”. While the first group factors have been clustered into ‘Geography of Contraction’, ‘Geography of Marginality’ and ‘Geography of Fragility’, the second one has been described through the ‘Geography of Quality’, ‘Geography of Innovation’, ‘Geography of Migration’ and ‘Geography of Relationships’ [20,21]. Each of these ‘geographies’ was then described by one or more criteria:
- The ‘Geography of Contraction’ includes the components relating to demographic dynamics and the economic-productive fabric, which are closely linked to each other. In fact, the demographic shrinkage trend inevitably influences the productive and economic activities located in the ‘most marginal places’.
- The ‘Geography of Marginality’, like the previous one, considers criticalities concerning accessibility (physical and digital), morphological characteristics and the supply of infrastructures and services that, in turn, affect both the economic activities and the quality of life in inner areas.
- The ‘Geography of Fragility’ investigates the social fabric, focusing in particular on population ageing, NEET (not [engaged] in education, employment or training) people, employment and risk dynamics. The last ones, in particular, are decisive in imagining a possible return to inland areas.
- The “Geography of Quality” investigates the qualities of both natural environments, according to the ecological value of the territory, and built heritage, the presence of certified food products (e.g., D.O.P. and D.O.C.G.) and the efficiency in the use of resources, assessed with reference to the use of water, separate waste collection and the number of plants for energy production from renewable source, seen as key elements for developing sustainable area strategies.
- The “Geography of Innovation” refers to the virtuous examples in the economic-productive fabric, based on the use of new technologies and the application of advanced production methods.
- The “Geography of migrations” includes demographic dynamics and the social fabric with reference to new families, including foreign ones, who choose to settle in inland areas.
- The “Geography of Relationships” considers the institutional and relational context of a given inland area, the development of which is also possible thanks to the networking capacity of both institutions and citizens.
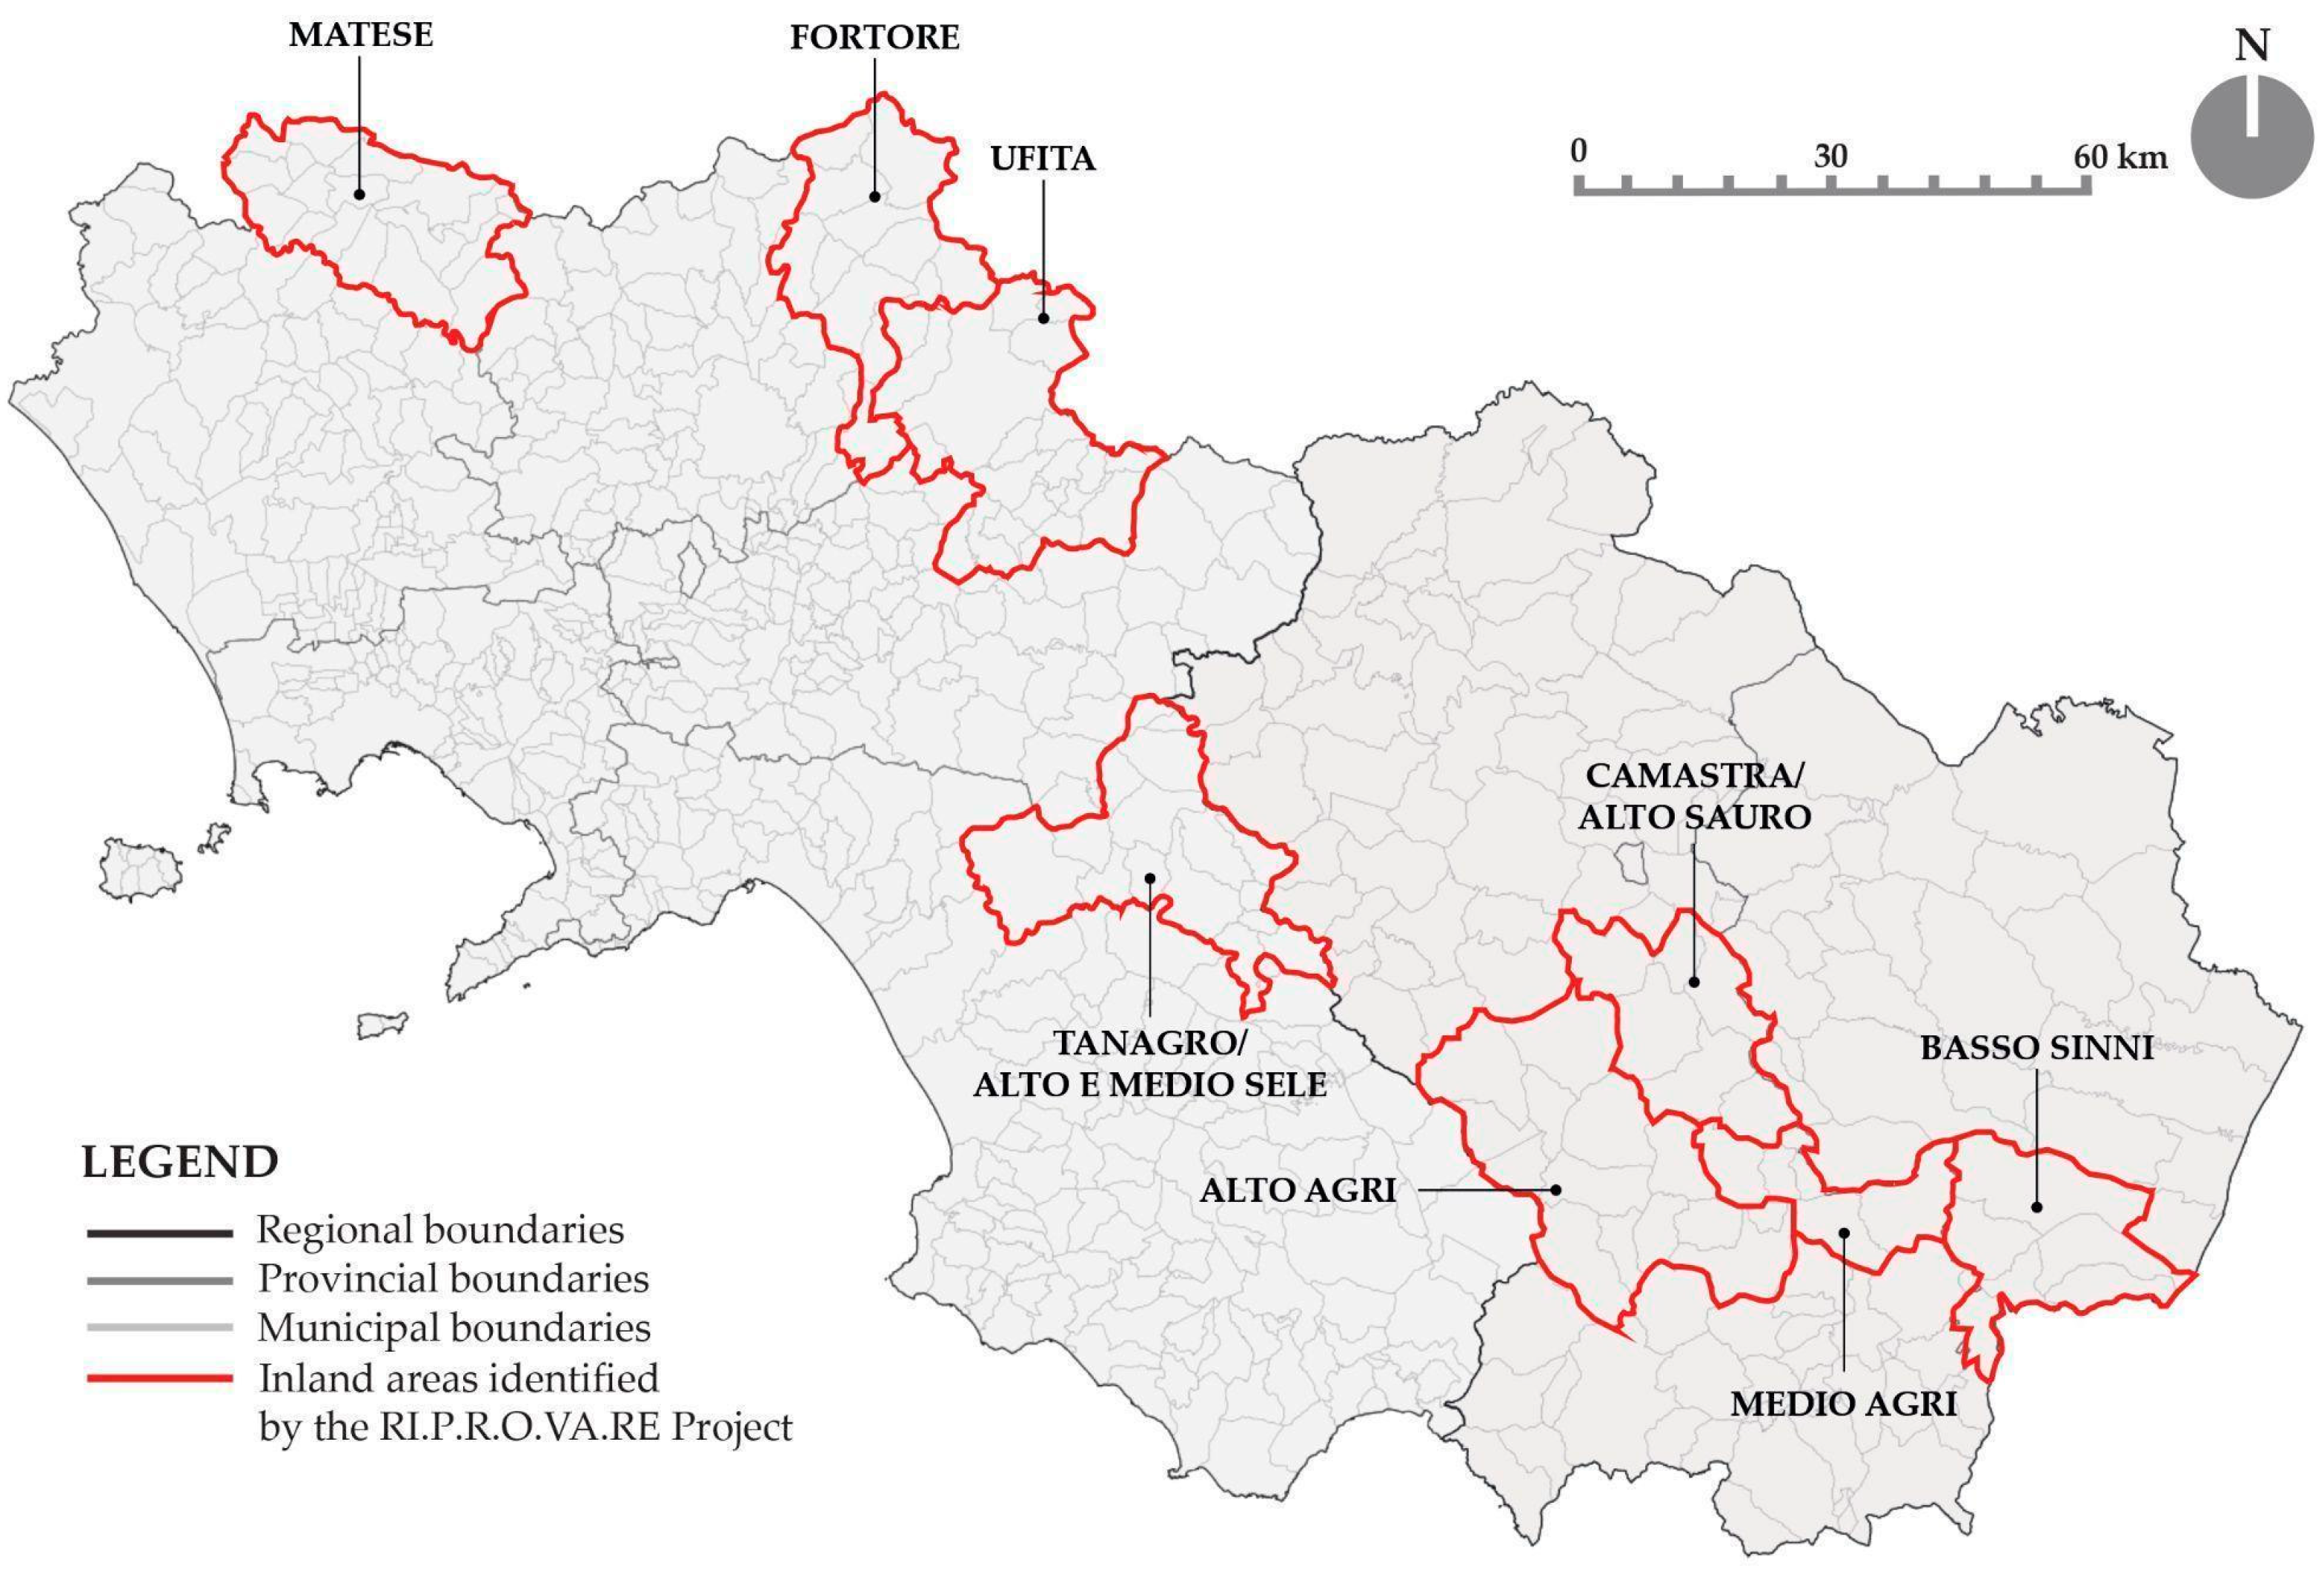
The next step involved the definition of evaluation indicators to quantitatively describe each of the mentioned issues. This required the analysis of already-available datasets (e.g., data provided by the Italian Institute of Statistics (ISTAT)) and the building up of new datasets, based on the elaboration of data provided by existing databases or cartographies (e.g., the Real Estate Market Observatory and the Nature Charter drawn up by the Higher Institute for Environmental Protection and Research). Then, summary indicators describing each “geography” in a unified manner have been outlined. With the attribution of a score to each index and the restitution in a GIS environment of the sum of each value, synthesis maps were generated for each “geography”. These maps show a percentage interval for all the municipalities of Campania and Basilicata. Thanks to this analysis, the territories characterized by both a high degree of criticalities and a high level of potential emerged. Among these “emerging territories”, the areas already included in the pilot areas identified by the 2014–2020 NSIA have been excluded, since they already had an approved local development strategy. Hence, for the Campania region, the Fortore, Ufita, Matese, Tanagro/Alto and Medio Sele areas were distinguished; for the Basilicata region, the Alto Agro, Camastra/Alto Sauro, Medio Agri and Basso Sinni areas were differentiated (Figure 2 and Figure 3).
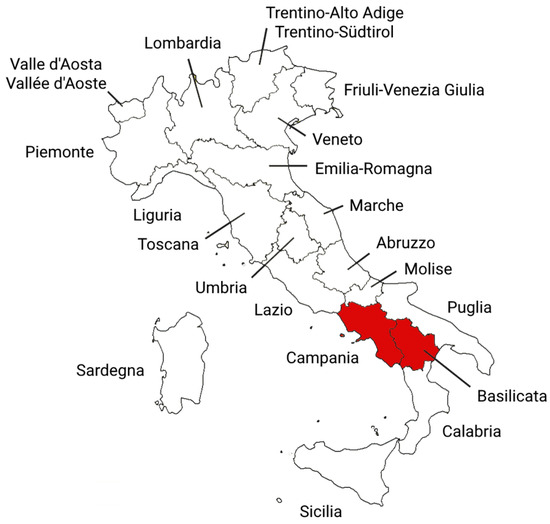
Figure 2.
Campania and Basilicata regions (in red colour) in the south of Italy.
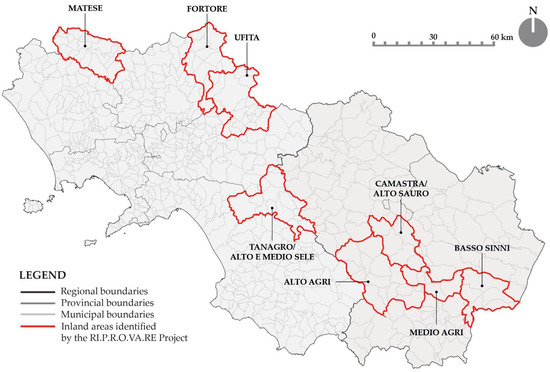
Figure 3.
The selected inland areas in the Campania and Basilicata regions.
Among the selected territories, the research team decided to focus on three out of eight selected areas due both to the limited time horizon of the project (two years) and to previous studies and already-in-place relationships with local administrations of the project partners. Hence, the three selected focus areas were Matese, Ufita, Alto and Medio Agri. Moreover, it is worth reiterating that the main aim of the RI.P.R.O.VA.RE. project was to outline a methodological path, to be tested on a limited number of case studies to verify its applicability and guarantee its replicability in similar contexts.
Regarding the other two methodological steps (“Understand the resilience of inland areas”; “Define strategies for sustainable and resilient development”), these were applied to each focus area, producing different outcomes in terms of resilience features and different “place-based” strategies. In particular, the focus on resilience has been addressed to analyse the different threatening factors affecting inland areas, ranging from acute shocks (e.g., frequent earthquakes, floods and landslides) to chronic stresses (e.g., depopulation, economic marginality and climate change impacts) and the related capacities that communities and territories should develop to better deal with them.
In light of the above, the following paragraphs address some key issues to improve the resilience of inland areas, specifically seismic and flood risk analysis and mitigation. The adopted methodologies, the application to a pilot area (the Matese territory, Campania region, southern Italy) and the achieved results will be presented and discussed.
3. The Proposed Procedure
As mentioned in the previous paragraph, one of the goals of the RI.P.R.O.VA.RE. project is to provide methodologies for the analysis and mitigation of the different risks mostly affecting inland areas. In particular, the aim is to provide an expeditious method that can be replicated in any reference area, through the application of the criteria outlined in this paper.
The need for specific yet expeditious procedures for risk analysis arises from the fact that either the available hazard maps are lacking for some inland areas or the scale of investigation is too large (scale ratio smaller than 1:10,000). For example, in respect to secondary basins of high-order tributaries (following the Hack’s stream order [22]), flooding maps are sometimes not available from the regulating authorities.
3.1. Seismic Risk Analysis and Mitigation
The designed procedure aims to provide a simplified approach and a set of practical solutions to reduce seismic risk in “inland areas”. The novelty of the proposed approach consists of a fruitful combination of relevant Italian experiences to assess seismic risk in complex areas and easily explore solutions to mitigate the risk. The approach can be summarized in four distinct phases: (1) analysis of the seismic hazard [23,24] of the considered areas, (2) evaluation of the seismic exposure [23,24] of the zone of interest, (3) estimation of the seismic vulnerability [23,24] of each part of the focus area and (4) intervention planning by considering the guidelines annexed to Italian Ministry of the Environment and Protection of Land and Sea Decree n. 65 7 March 2017 to reduce the overall seismic risk.
A seismic risk mitigation policy requires the identification and knowledge of the main factors that can describe the hazard, vulnerabilities and exposure affecting the areas; however, the identification and knowledge may have different meanings as the scale of the survey changes, since the need to arrive at risk scenarios in an acceptable time in a context of often limited resources and knowledge focuses on the need for flexible, modular and scalable analytical methodologies and procedures.
In this context, so-called expeditive methodologies for analysis at different scales have been developed, starting from the seismic event of Irpinia (Italy). In the national context, as regards the analysis of the seismic risk to the ordinary building, it is possible to refer to the guidelines adopted by the Tuscany region (L.R. 65/2014) [23,24], which are based on a multi-scale (multi-level) methodology that can be considered very useful for quickly classifying risks in large areas. The Tuscan approach [23,24] considers three levels of analysis (regional, municipal and urban), each of which uses data generally already available; the methodology returns to each scale comparable risk indices.
The regional scale analysis (Level 0–L0) assumes the municipalities as a reference field and considers the following factors:
- Seismic hazard: basic hazard of each town [25];
- Exposure: weighted averages of population and building factors obtained from ISTAT data [26];
- Vulnerability: evolution of the building development in relation to the history of the seismic classification of the considered municipality and the data available from the Civil Protection Department updated to 31 January 2020 [27].
At the municipal scale (Level 1–L1), the analysis is conducted with reference to the scope of the census area, using the same methodology as Level 0. Finally, the analysis of risk scenarios at the urban scale (Level 2–L2) focuses on the study of detailed aspects in consideration of the built-up fabric intrinsic characteristics. It has to be noticed that the Level 2 assessment require the knowledge of seismic microzoning, not always available in real cases.
3.1.1. Seismic Hazard
Seismic hazard is defined as the probability that an earthquake equal to or greater than a certain threshold of intensity, magnitude or peak ground acceleration (PGA) will occur in a certain area and time interval.
At Level 0 (L0), the Hazard Class is described by the basic hazard of each municipality in terms of peak ground horizontal acceleration (Ag), with a return period of 475 years (part 3.2 of the NTC 2018 [28]). The aforementioned accelerations (Hazard Values—VP), evaluated in the centroid of each Town, allow the definition of the Hazard Index (IP) [23].
At Level 1 (L1), the Hazard Class is evaluated in each census section considering the peak ground acceleration (PGA) in the centroid of the considered section [24], as described in Table 1.

Table 1.
Hazard Classes, Values and Indices at Level 0 [23] and Level 2 [24].
At Level 2 (L2), the Hazard Class is evaluated considering also the effects induced by local site conditions through a Local Hazard Index (Iploc) [24].
This index can be evaluated based on the information reported in the Seismic Microzonation Maps elaborated by the municipalities. In summary, the Local Hazard Index refers to the following effects:
- Very-high local seismic hazard (S.4) →Iploc = 4
- High local seismic hazard (S.3) → Iploc = 3
- Medium local seismic hazard (S.2) → Iploc = 2
- Low local seismic hazard (S.1) → Iploc = 1
The Seismic Hazard Class (P2) is thus obtained, for Level L2, from the combination of the Base Hazard Class (P) and the Local Hazard Index [24] as described in Table 2:
Table 2.
Hazard Classes, Values and Indices at Level 2 [24].
IP = P + Iploc
3.1.2. Seismic Vulnerability
The vulnerability describes the propensity of the building to damage for seismic events defined by predetermined intensity thresholds.
At the regional scale (L0) buildings are divided into three classes:
- Historic buildings;
- Contemporary buildings;
- Modern buildings.
Based on this classification, the Vulnerability Values index (VV) is computed as the ratio between the number of the most vulnerable buildings (MV) and the total of those built between 1946 and 2005.
The most vulnerable buildings (MV) are those that have potential deficiencies because they were built before the seismic classification of the territory or in the absence of seismic technical standards. In any case, the highest class is assigned to the buildings built before 1962.
Based on the Vulnerability Values, a Vulnerability Class and Vulnerability Index (IV), as described in Table 3, are assigned as follows:
Table 3.
Vulnerability Classes, Values and Indices at Level 0 [23].
At the municipal scale (L1), the Vulnerability Index is evaluated by explicitly considering the construction period, the structural typology and the height of the building:
- Period of construction: for each census section, an average period value is calculated [24]:where Nbuiding is the number of buildings for each construction period in the homogeneous area, Ke is the period coefficient taken from Table 5 in [24] and Nbuiding,tot the total number of buildings in the homogeneous area [23]; finally, an index of epoch (Iperiod) is associated to each value of epoch (Vperiod), following Table 6 in [24].Vperiod = (∑Nbuiding × Ke)/Nbuiding,tot
- Structural typology: the ratio of buildings in reinforced concrete to the total of buildings for each census section, setting the threshold of 75% and defined in Table 7 of [23].
- Height of buildings:where this time, Nbuiding is the number of buildings with the same number of floors, Kp the floor coefficient taken from Table 8 of [24] and Nbuiding,tot the total number of buildings of the census section [24]. The height index will be 1 for Vheight > 0.500 or 0 for Vheight ≤ 0.500 (Table 9 in [24]).Vheight = (∑Nbuiding × Kp)/Nbuiding,tot
- Interaction between buildings: an urban density indicator (Id) is defined based on the geographical location of buildings [23,24].
- Intended use: a large light construction type index (Iu) is defined based on the macro-intended use (Table 10 in [24]).
- Seismic classification: a classification index (Ic) is defined in Table 11 of [24].
The Vulnerability Class (V) for each census section is therefore defined with the determination of the Vulnerability Index (Iv), given by the sum of the computed indices [24]:
Iv = Ie + (It + Ia + Iu + Id + Ic)
Thus, the seismic Vulnerability Class (V), reported in Table 4, is defined as follows:
Table 4.
Vulnerability Classes, Values and Indices at Level 1 [24].
Regarding the seismic vulnerability of urban centres (Level 2), aimed at the implementation or updating of urban planning tools, in addition to the assessments of Level 1, it is possible to refer also to the results of any analysis and detailed studies on homogeneous areas, identified as municipal or sub-municipal areas (compartments). These evaluations are aimed at both the validation of the statistical and synthetic results of Level 1, as well as at the description with greater accuracy and detail of the building or urban vulnerability.
3.1.3. Seismic Exposure
The seismic exposure describes the quality and quantity of the goods exposed that could suffer damage during an earthquake and may involve in economic losses and/or victims.
On a regional scale (L0), seismic exposure is assessed based on the Exposure Value (VE) obtained from the combination of the population (Npop) and the number of buildings (Nbuilding) present in each municipality [24]:
VE = 2/3 Npop + 1/3 Nbuilding
Based on the calculated values, the Exposure Index (IE), reported in Table 5, is defined [24]:
Table 5.
Exposure Classes, Values and Indices at Level 0 [23].
At the municipal level (L1), exposure is assessed on the basis of population, buildings and intended use, as follows:
- Exposed population: it is assessed by the density index (Idensity), considering the average of the resident population and the number of total buildings in relation to the area expressed in weighted hectares:where Npop is total resident population by homogeneous area, and Nbuilding is the total number of buildings [24].Idensity = (2/3 Npop + 1/3 Nbuilding)/Area
- Intended use: it is evaluated considering the location of the construction and assigning a relative coefficient (Idestination) [24].
The Exposure Class (E) is then defined using an Exposure Indicator (IEs), computed as follow [24] and summarized in Table 6:
IEs = Idensity + Idestination
Table 6.
Exposure Classes, Values and Indices at Level 1 (Table 16 of [24]).
At the urban level (L2), seismic exposure is assessed for each census area using the same approach as for the municipal level (L1) unless detailed studies are available.
3.1.4. Seismic Risk Analysis
The seismic risk represents an estimate of the expected losses in a certain period of time and is a function of the hazard, vulnerability and exposure.
At the regional level (L0), the Risk Class (Table 7) is defined considering the Risk Index (IR), evaluated as the contribution of the Hazard, Vulnerability and Exposure Indices:
where IP, IE and IV are the danger, Exposure and Vulnerability Index respectively [23,24].
IR = IP + IE + IV
Table 7.
Seismic Risk Classes and Risk Indices Level 0 [23].
At the municipal level (L1), the seismic Risk Class (Table 8) is assessed considering a Risk Index (IR), computed as a function of hazard (P), vulnerability (V) and exposure (E) [24]:
IR = P + V + E
Table 8.
Seismic risk, Risk Indices and seismic Risk Classes at Level 1 [24].
Finally, the assessment of the seismic risk at the urban scale (L2) is conducted, considering the same factors evaluated with a Level 2 deepening.
3.1.5. Strategies to Support Seismic Risk Reduction Policies
The guidelines annexed to Ministerial Decree n.65 7 March 2017 [29] introduce a new method of classification that is based on eight classes of risk, with increasing risk from letter A+ to letter G. The determination of this class can be carried out according to two alternative methods: the conventional method and the simplified method.
In the case of the assessment of the Risk Class for masonry constructions with the simplified method, the above guidelines refer substantially to the Vulnerability Class defined by the European Macroseismic Scale (EMS), with increasing vulnerability from V1 to V6.
In detail, they are classified as follows (Figure 4 of [29]):
- Stone masonry without binder (dry stone walls) → V6;
- Rammed earth brick masonry (adobe) → V6;
- Rough-hewn stone masonry → V5;
- Massive stone masonry for monumental buildings → V4;
- Bricks and worked stone masonry → V5;
- Brick masonry and floors of high stiffness → V4;
- Reinforced and/or confined masonry → V3.
This approach can be complemented by the Level L1 analyses described above; in this regard, it is necessary to normalize the description of the Risk Classes (Table 9) and vulnerabilities (Table 10), respectively, as follows:
Table 9.
Seismic Risk Class conversion.
Table 10.
Vulnerability Risk Class conversion.
The considered simplified procedure leads to the assessment of the Vulnerability Class for each building typology without numerical evaluations.
The assessment of the Vulnerability Class, which is fundamental for the identification of the Risk Class, is therefore based on the following factors (Table 4 of [29]):
- The structural typology of the buildings under consideration;
- Negative characteristics which may cause deviation from the typical average class of the structural typology [29].
For the assignment of the Risk Class, the guidelines consider the seismic classification of the territory, in accordance with the provisions of the O.P.C.M. 3274 of 20 March 2003 and subsequent amendments and additions [30], as described in Table 11.
Table 11.
PAM (Perdita Attesa Media, i.e., expected average annual loss) class assigned according to the Vulnerability Class of the building and the seismic zone in which it is located [29].
In order to implement a seismic risk mitigation strategy in large areas, it is possible to refer to widespread local strengthening interventions, such as those described in [29]. As for the structural interventions to be adopted, the guidelines attached to DM 65/2017 [29] propose interventions that ensure a transition to the lower Vulnerability Class for both masonry and concrete buildings.
In the case of masonry structures (hewn-stone buildings, solid stones for monumental buildings, brick or worked-stone buildings, bricks and slabs with high stiffness in their floor, armed and/or confined masonry buildings), the possible interventions (i.e., Table 6 of [29]) can be summarized as follow:
- Damage repair and/or restoration;
- Reinforce thrusting structures by absorbing horizontal thrust;
- Control the external facades overturning mechanism by connecting the wall panels to the horizontal diaphragms;
- Secure non-structural elements.
For reinforced-concrete buildings it is possible to consider the following retrofit activities:
- Perimeter beam-column node confining;
- Prevent the overturning of the cladding in the case of external facades;
- Restoration of damaged and/or degraded concrete surfaces and/or elements.
In a broad context, therefore, it is possible to foresee the necessary interventions and economic resources to limit the seismic risk to defined target values.
3.2. Flood Risk Analysis and Mitigation
The procedure here presented consists of a set of practical tools/approaches to strengthen the resilience of the “inland areas” under flood risk. The proposed method comprises three distinct phases: (1) evaluating the state of knowledge concerning hydraulic critical issues in the inland areas by way of the systematization and analysis of open information gathered from the official hazard/risk zoning maps, (2) flood hazard zoning in inland areas through a validated GIS-based methodology based on easily available open information and (3) optimizing the choice of the most suitable structural risk mitigation measures by way of multi-criterial matrices.
Flood inundation maps are at the base of flood risk management (Flood Directive 2007/60/CE, Italian Legislative Decree n. 49/2010), but nevertheless, flood hazard zoning maps are still lacking in some inland areas. In these contexts (data-scarce environments), several recent studies have demonstrated the validity/effectiveness of simplified tools to delineate flood-prone areas based on easily available information [31,32,33,34]. Among these, procedures involving the Geomorphic Flood Index (GFI) have turned out to have an extraordinary potential [35,36,37,38] as it allows the identification of flood-vulnerable areas that are data-deficient. In data-scarce environments, the decision-making appears to be very difficult, and the choice of the most appropriate mitigation measures is challenging. In order to ease the decision process, some recent projects/studies—in the field of landslides—have proposed rational and flexible approaches to assist decision making in the choice of the measures [39,40,41].
3.2.1. Input Data
A GIS-based analysis has been developed to evaluate the state of knowledge concerning hydraulic critical issues in the inland areas (Phase n.1). The analysis requires the following georeferenced layers/shapefile data: (1) administrative limits (municipality, province/sub-prefecture, region); (2) official flood hazard, see Table 12; (3) risk zoning maps (Basin District Authority of the Meridional Apennine); and (4) regional topographic map (Campania region).
Table 12.
Adopted data, source, type and resolution.
The Geomorphic Flood Area (GFA) plugin in QGIS 3.14 software, used to map inland flooding unknown areas (Phase n. 2), requires two main sets of input data: (1) a digital terrain model (DTM) and (2) official flood hazard zoning maps. A high-quality DTM (~1 × 1 m) is preferred to have a good reliability of the results; for the same reasons, it is advisable to use (official) hazard zoning maps derived from 2D hydraulic modelling analysis.
3.2.2. Data Processing
The data can be processed in a GIS environment to obtain a single ESRI format shapefile containing flood hazard and risk information at the scale of the municipalities in the study macro-areas. The database (.dbf) can be rearranged (e.g., in Excel) in order to get initial—possible—spatial “pressure/criticalities” assessments, improving it with also topographic, geological and land cover data.
To identify possible “not mapped” flood-prone areas, an open-source QGIS plugin named the Geomorphic Flood Area tool (GFA 2.0 tool) has been applied. The GFA tool combines geomorphological information extracted by DTM along with flood hazard information from official inundation maps (usually available only for principal rivers). The GFA tool is basically based on the calculation of the geomorphological descriptor named Geomorphic Flood Index (GFI). The index has been defined as:
ln(hr/H)
It compares in each point of the basin the water level hr in the nearest element of the river network identified following the hydrological paths (‘r’ stands for ‘river’), with the elevation difference (H) between these two points. hr is estimated as a function of the contributing area using [34,42]:
where hr is the water depth [m], Ar [km2] is the contributing area and n is the exponent (dimensionless). The Geomorphic Flood Index (GFI) is iteratively calculated to perform an optimal fitting to the official inundation maps (at different return times) [37].
hr = Arn
The first two phases of the proposed methodology (1 evaluation in GIS environment of the state of knowledge by means of systematization and analysis available data; 2 flood hazard zoning through a GIS-tool based on easily available information) allowed us to characterize the flood hazard of inland “data-scarce” areas not previously extensively studied. The outcome of these preliminary applications facilitates the identification of critical local issues and consequently to define the most suitable countermeasures.
The latter can be identified by using a multi-criteria method conceived to optimize the process of choosing the alternatives within the broader framework of the criteria with which usually public financing resources are assigned (D.P.C.M. 27 September 2021).
This method is based on the application of the following three “tools” specifically produced: (1) database of structural risk countermeasures, (2) general measures sheet and (3) site-specified measures sheet.
- The database is inspired by the recent innovative methodologies developed within the framework of the LaRiMiT project [40] and by the “classification tables” represented in the Appendix 2 of the ReNDiS 2020 Report (ISPRA, 2020). Active and passive structural measures are listed without distinction in relation to context, possible use and flooding phenomena.
- For each measure of the database, a “general measure sheet” is produced. The aim is to provide a synthetic/aspecific indication of the degree of adequacy, applicability and sustainability of the measure. A predefined and unchangeable weight assignment system (from 1 to 10) defines the adequacy, applicability and sustainability of the measure with respect to general aspects. A weight from 1 to 10 is assigned to each measure to represent its degree of “applicability” in relation to the type of flooding phenomenon expected, type of stream, magnitude of sediment transport and flow velocity. Similarly, weights are given to the degree of “reliability”, defined basing on the good/poor past outcome of its application and its ability to maintain unchanged performance over time. “Low maintainability” is to be evaluated as a function of the frequency of maintenance activity generally required by the measure to ensure performance and effectiveness over time (the more frequently intervention is required, the lower the score). Landscape and environmental insertion is assessed on the basis of the ease of the measure to be easily masked/inserted and on its potential impacts on the different environmental compartments (e.g., atmosphere, water, soil and sediment), during both construction and operation. Instead, the cost-effectiveness of the measure is evaluated according to parametric values of realization cost and time.
- The “site-specified measure sheet” guides the user to evaluate the most suitable solution in terms of performance and sustainability for the specific site. The sheet guides the identification process by means of a weight assignment system (which can also assist users in the planning/acquisition of useful data for design). The sheet is compiled after inspection and acquisition of all available useful data. It is possible to indicate one or more measures in relation to the number and type of flooding phenomena found and/or expected. With the help of the general measure-sheet, it is possible to assign—on the basis of the site-specific conditions found during the inspection and the available data preliminarily acquired—a weight/grade of applicability of the measure for the specific case. The level of site-specific reliability of the measure is given by the product between the weight given to intrinsic/decontextualized reliability (indicated in the general measure-sheet) and the weight given to the degree of knowledge of the areas and issues. Caution: by an improved knowledge of the areas and issues, the selected measure may result no more suitable regardless of the level of reliability obtained. The level of maintainability is amplified in proportion to the ease/convenience of access to the intervention areas. On the other hand, the score for environmental and landscape insertion is given by the product of the respective aspecific scores and the weight given to the degree of landscape/environmental official constraints/imperative of the area. Finally, the cost-effectiveness of the measure is evaluated in relation to the time and cost of implementation, not only those of construction but also of design and therefore of initiation and completion of the necessary procedures for overcoming interferences and obtaining all opinions/clearances/authorizations for the project approval; the “cost-effectiveness” score is given by the product between the weight attributed to the measure in the general measure-sheet and the weight attributed in the site-specific measure-sheet to represent number and degree of complexity of the authorization procedures to which the project will have to undergo. The site-specific measure-sheet provides the tool with which, based on the characteristics of the expected specific phenomena and contextual information, it is possible to contextualize the “first attempt” measures and measure their effectiveness.
4. Demonstrative Application and Results
4.1. The Matese Focus Area
The above-presented methodology allows the definition of seismic and hydraulic risks in inland areas, often featuring either a scarcity of available data or the absence of local hazard maps. In this regard, its application can fill this gap for related equivalent conditions.
The Matese focus area entirely falls within the province of Caserta in the Campania region. The selected area includes 17 municipalities and hosts a population of about 38,500 inhabitants. Most of the municipalities count a population of less than 2000 inhabitants, apart from Piedimonte Matese, which represents the main pole of the area. The Matese area, which is part of the Matese Regional Park, hosts numerous protected areas, which are part of the Natura 2000 network, and an extensive network of natural, historical and religious paths, such as a section of the Via Francigena. The area is also characterized by numerous historic villages, cultural assets and archaeological sites and hosts numerous events connected to local history. Nevertheless, this area also has several significant weaknesses, such as the reduced accessibility, the scarcity of local public transport, the increasing contraction of production activities and a widespread abandonment of the building stock. Furthermore, most of the municipalities are characterized by high levels of seismic hazard, while some municipalities crossed by the Volturno River or by its tributaries are potentially also affected by floods. Hence, the choice of the Matese area as a paradigmatic test case for the proposed methodologies also depends on the fact that it is one of the most seismically hazardous regions of Europe, since it is the epicentral area of some strong Italian earthquakes (Mw ≥ 6.6), and it can be subjected to fault reactivation [16].
4.2. Seismic Risk
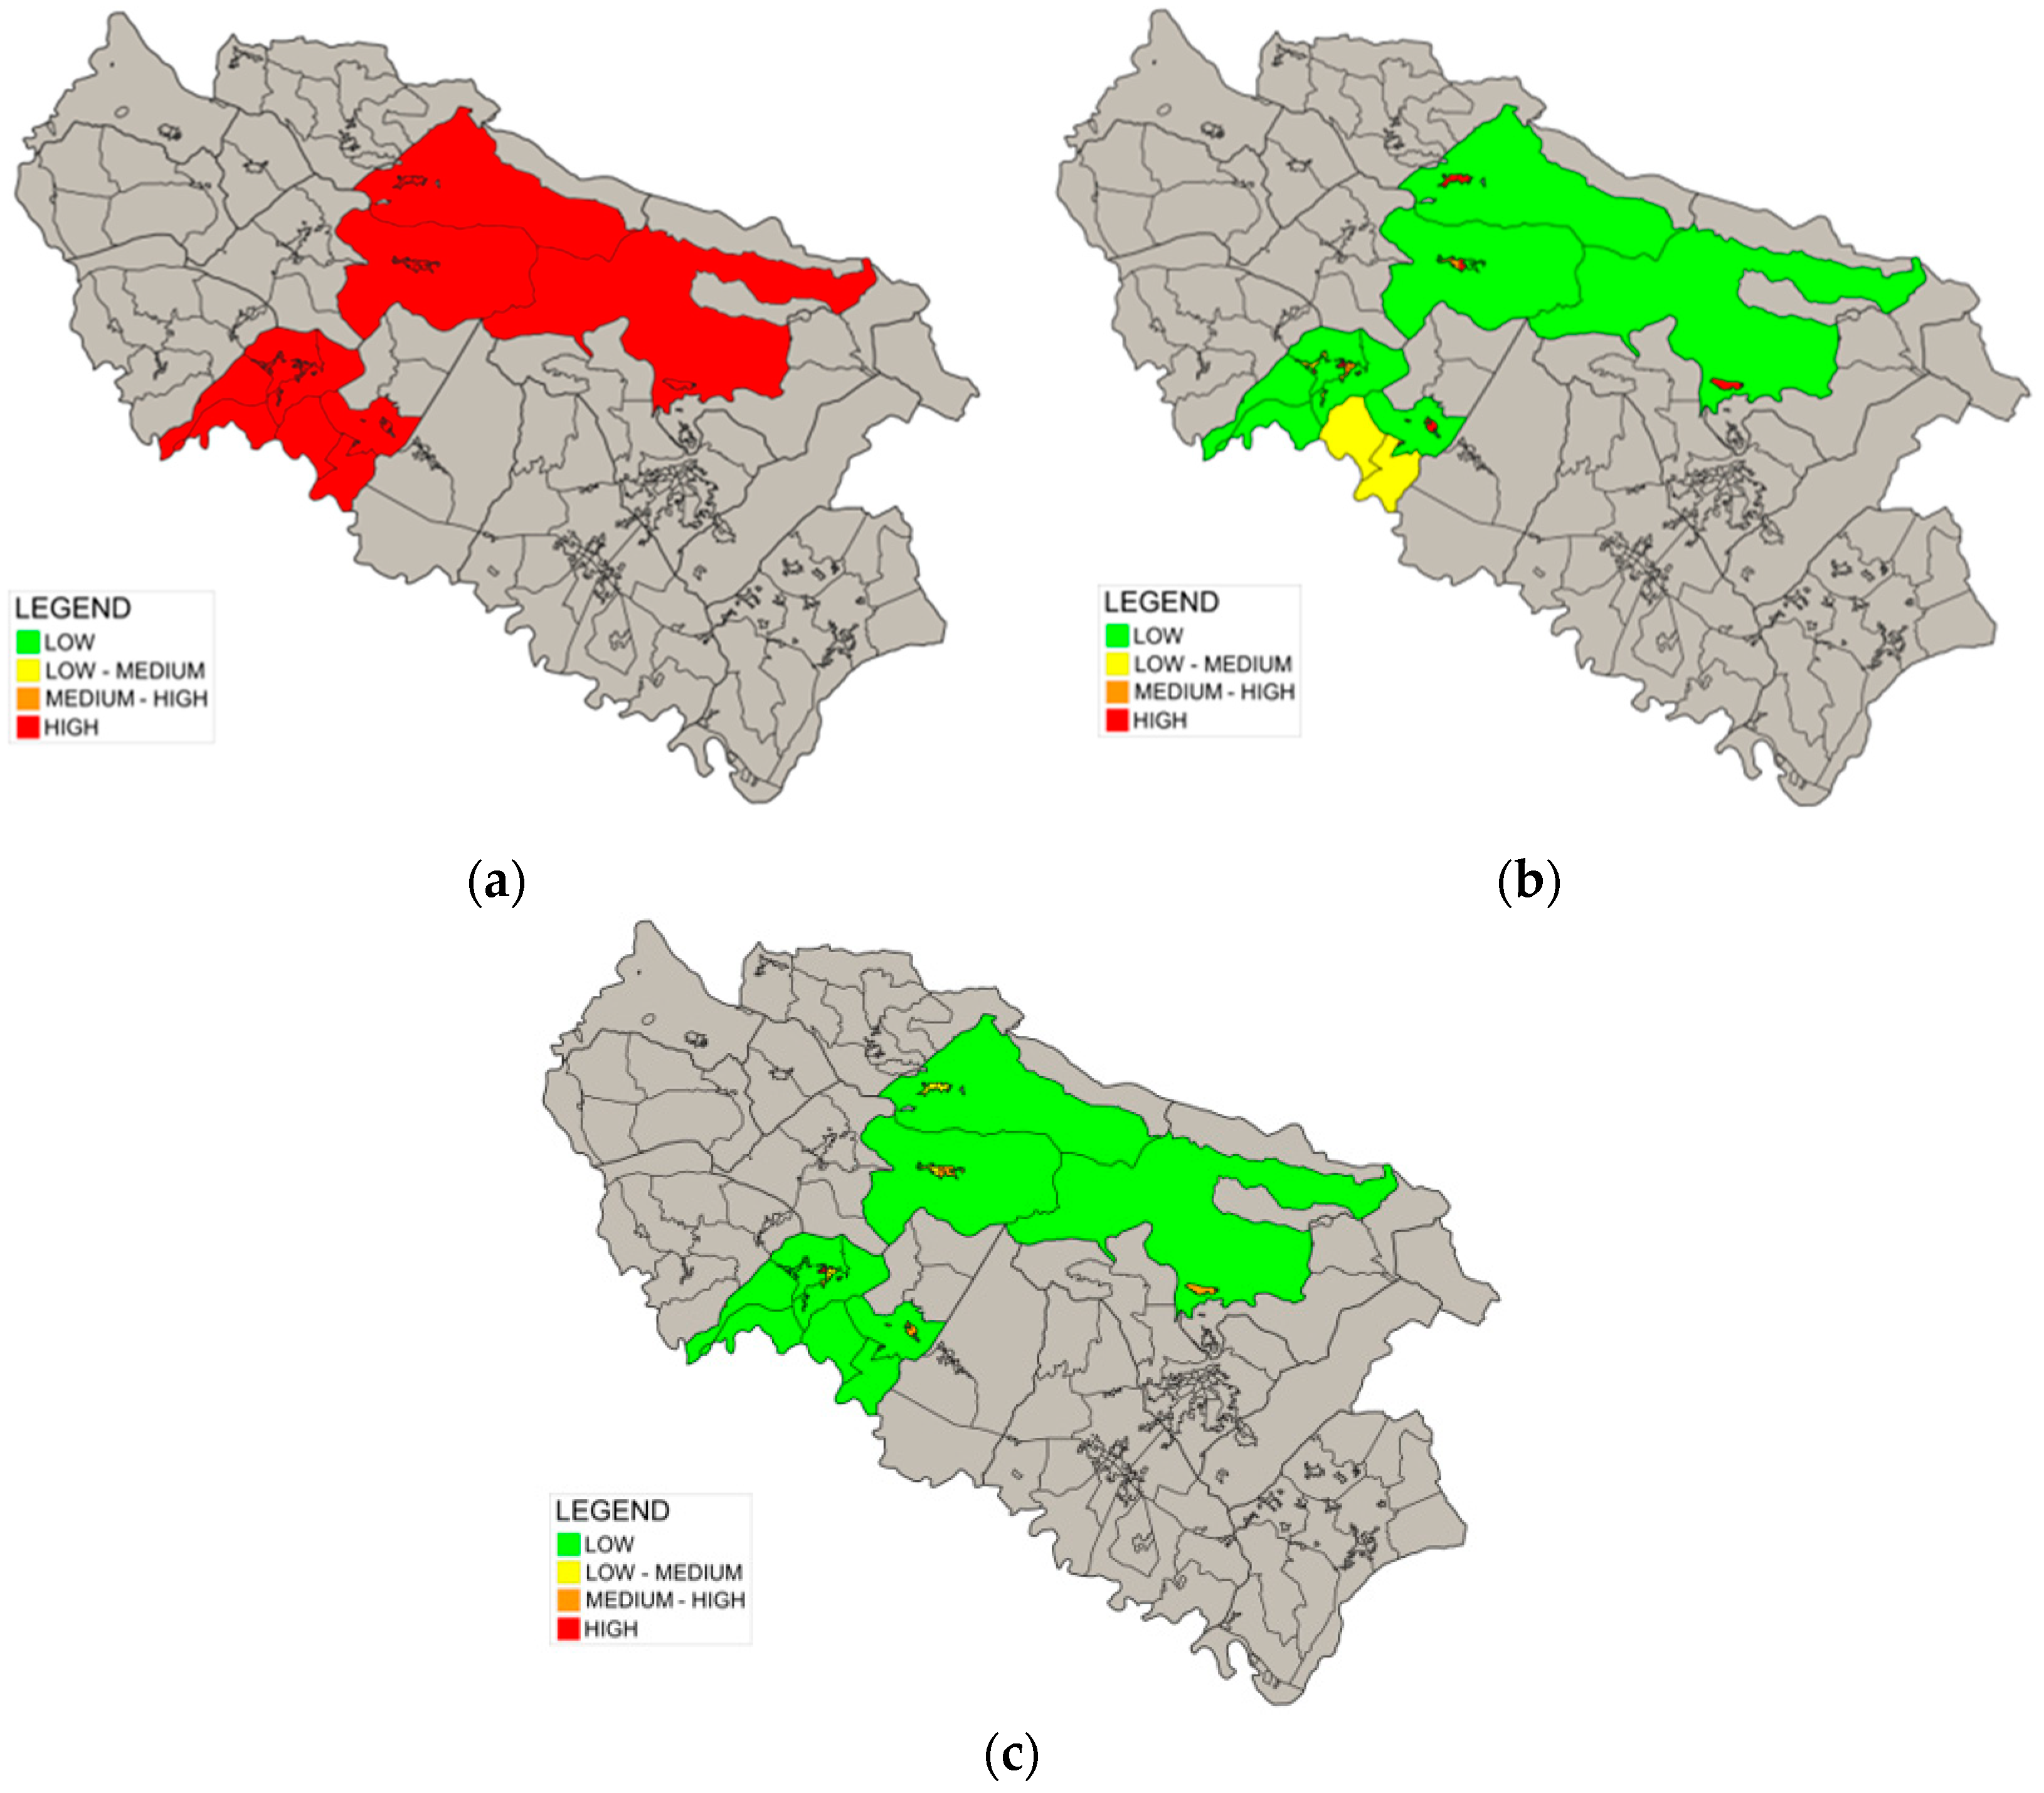
The developed approach to characterize an interested area and to choose the appropriate interventions to be carried out was implemented in QGIS® software to be able to graphically observe the possible enhancements that would be obtained using the proposed risk mitigation strategy. A comparison between the current conditions and post-intervention improvements at Level 1 is reported in Figure 4 and Figure 5, and an example of seismic risk mitigation at Level 2, made on the municipality of Valle Agricola, is shown in Figure 6 and Figure 7.

Figure 4.
L1 hazard map (a), vulnerability map (b) and exposure map (c) of the area.
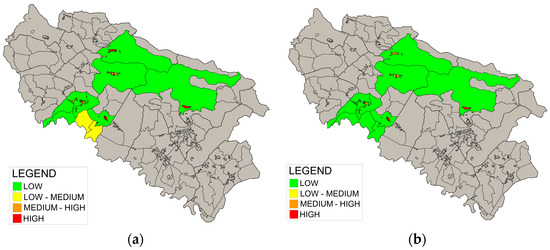
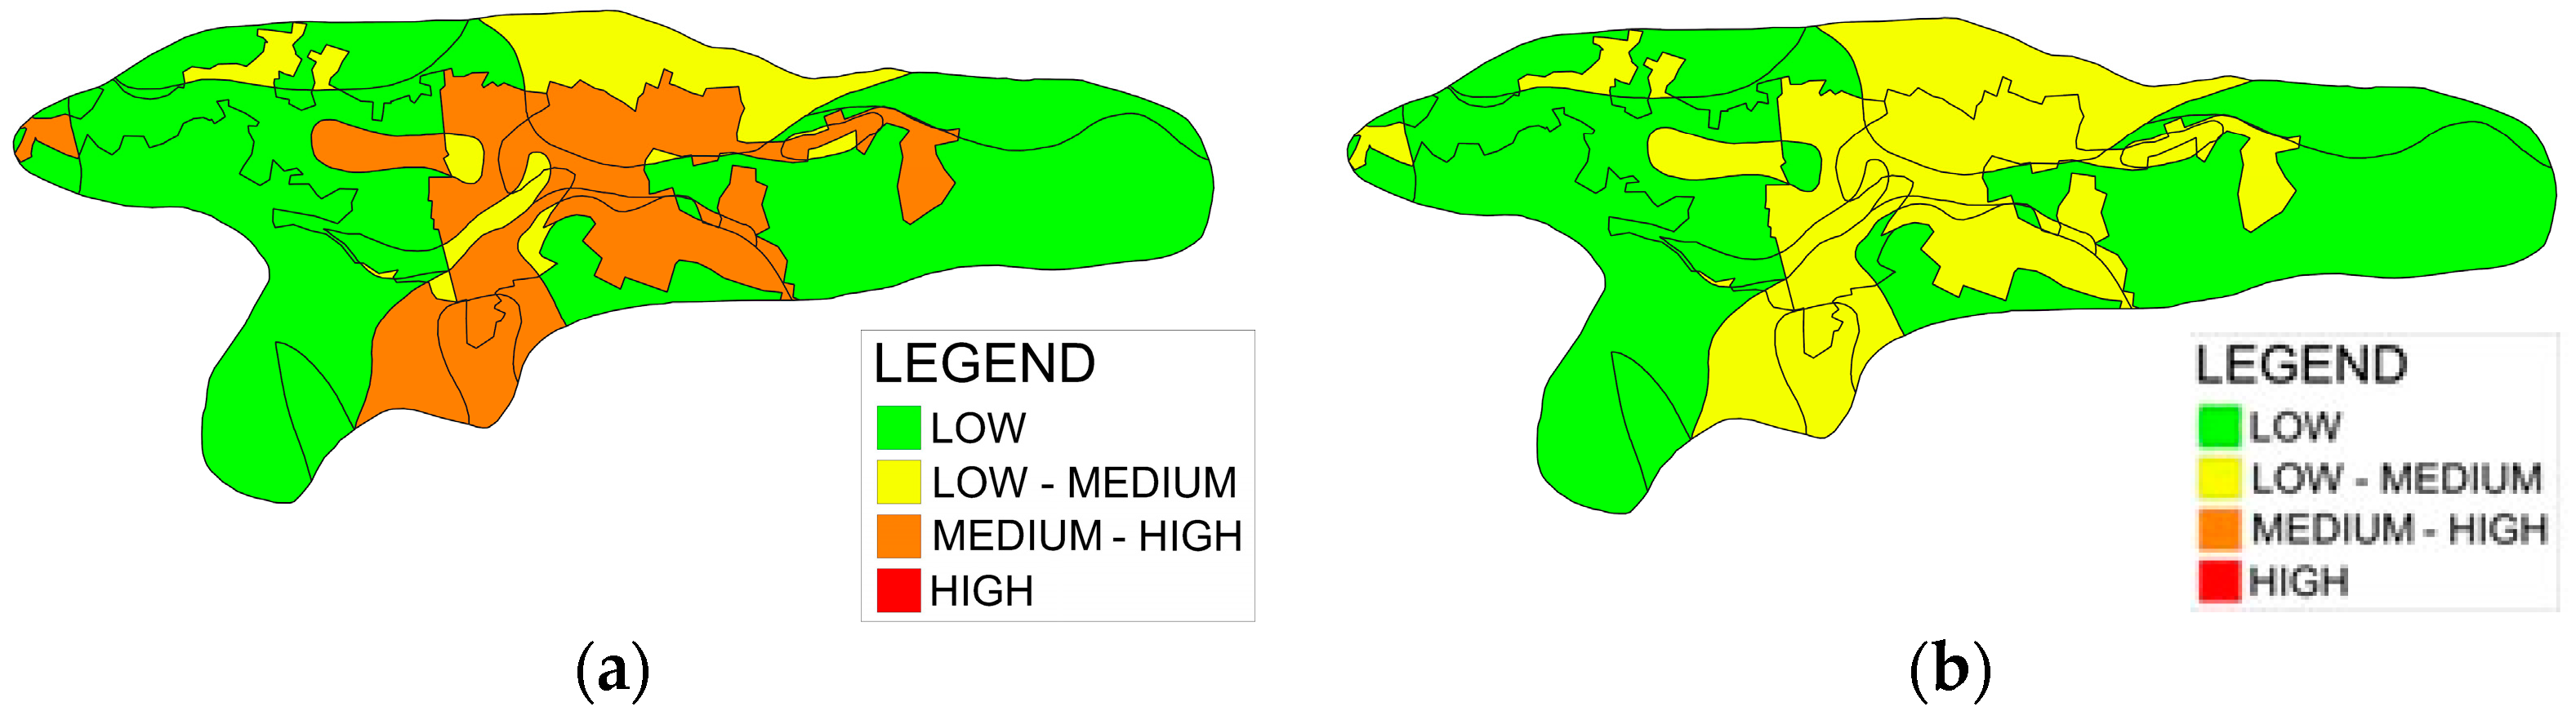
Figure 5.
(a) L1 risk map of the Matese inland area under current conditions; (b) L1 risk map of the Matese inland area after the application of the proposed risk mitigation strategy.
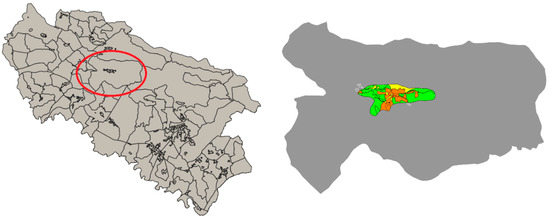
Figure 6.
Identification of the municipality of Valle Agricola in the Matese Macro-Area for L2 investigations.

Figure 7.
(a) Municipality of Valle Agricola L2 risk map under current conditions; (b) municipality of Valle Agricola L2 risk map after the application of the proposed risk mitigation strategy.
4.3. Flood Risk Definition
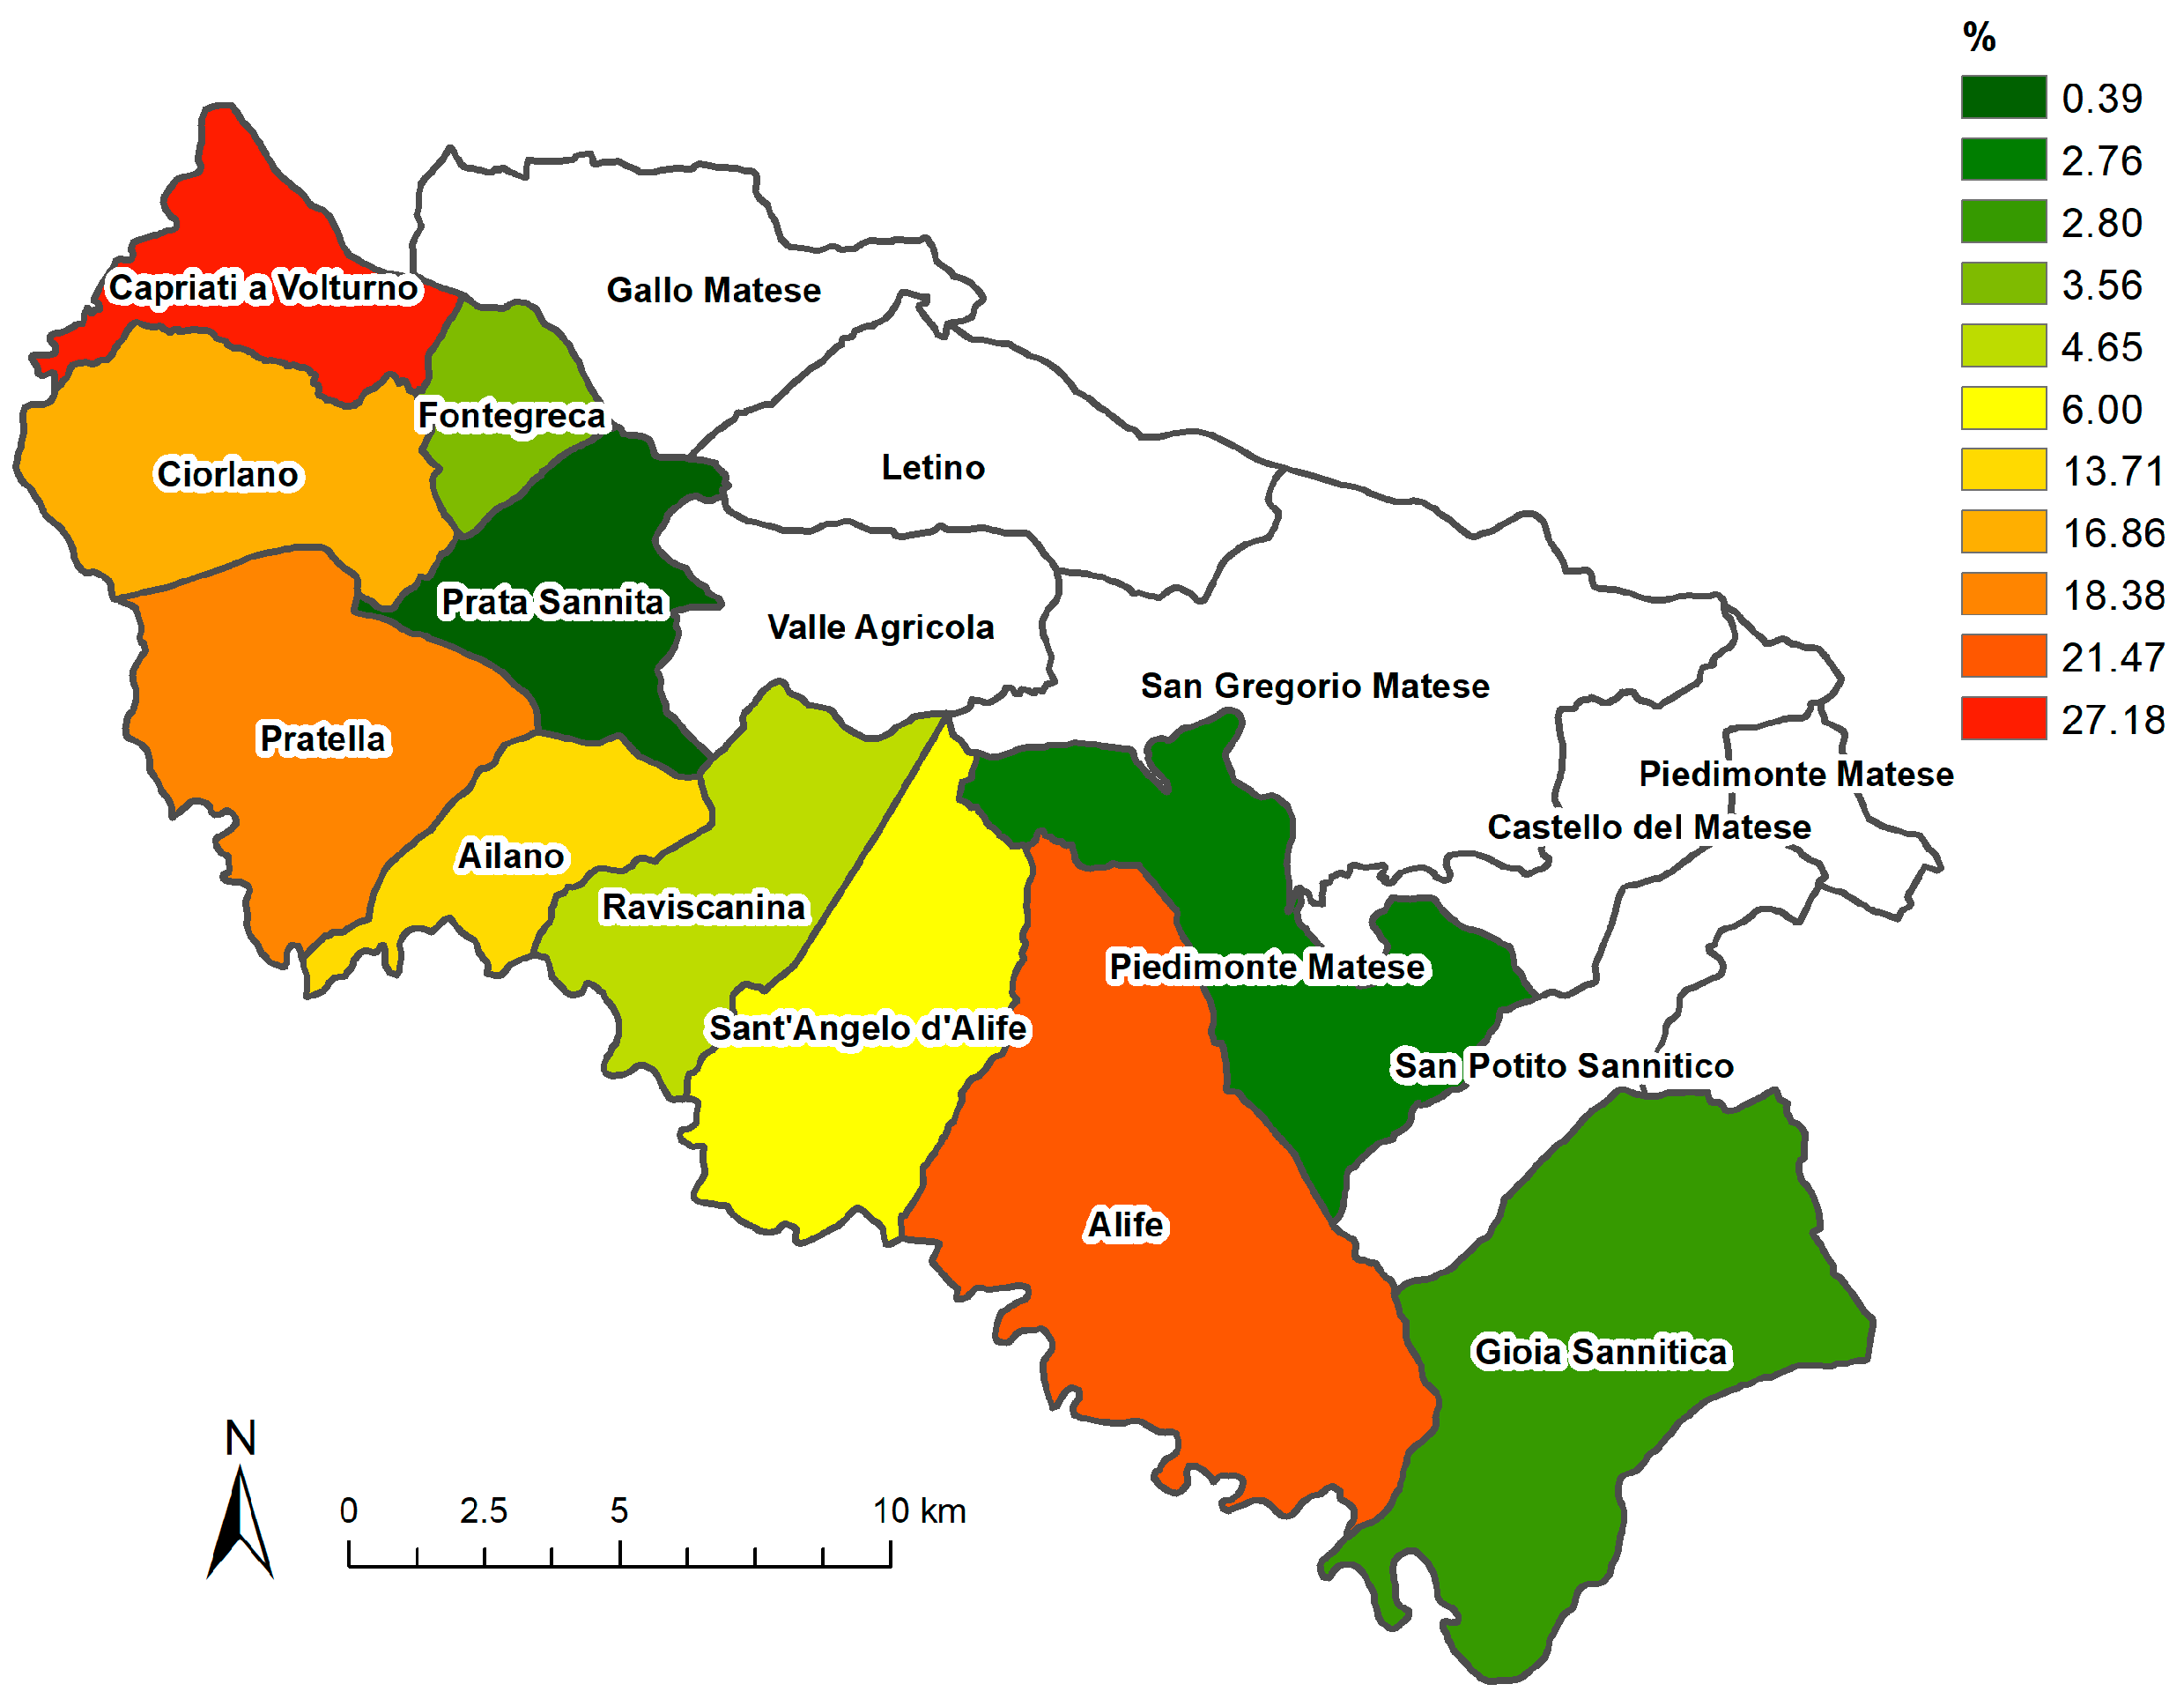
Based on the available official data, the first phase of the methodology (GIS-based analysis to evaluate the state of knowledge concerning hydraulic critical issues in the inland areas) allowed us to identify the municipalities with a higher level of flood hazard (hazardous area as a percentage of administrative area, Figure 8). Through this phase defined at a municipal level of detail, a priority scale of attention can be defined to perform the next steps of the application, according to a top-down criterion.

Figure 8.
Percentage of areas prone to high flood hazard levels in each municipality of the Matese area.
Thus, the next phase of the methodology has been applied, which is the mapping of hazardous areas using the Geomorphic Flood Area tool. The results of the applications conducted on the Matese area showed no appreciable deviations from what is already officially represented by the cartographies of the official risk maps; the limits of the flood-prone areas obtained by the model faithfully retrace those already existing in the official maps. The results can be interpreted as proving the good exhaustiveness of the official cartographies and the highly likely absence of risks outside the areas already classified.
Therefore, similarly with what would have been done for the new non-official hazardous areas, critical points within the areas officially classified as “hazardous” have been identified in order to apply the last step of the methodology and thus to define the most appropriate structural measures to resolve it.
Among the most critical municipalities of the Matese area, Ailano is chosen to apply the last phase of the methodology (Figure 9). A bridge on the Lete River, a tributary of the Volturno River, is one of the possible points of hydraulic crisis in the area. After inspection and consultation of the available data for the area, the “site-specified measure sheet” is compiled providing information with reference to (1) typological characteristics of the phenomena encountered or expected and (2) general data context as for the “level of knowledge of the issue” (availability of previous studies and/or projects, reports, topographical/geometrical and geognostics surveys), level of accessibility of the areas, interferences with other infrastructures (electricity, sewer and gas pipelines), landscape/environmental official constraints and number and type of authorities involved in the approval process of the measure.
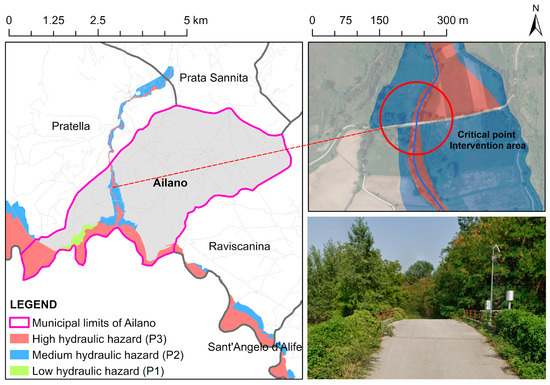
Figure 9.
Excerpt from the official flood hazard zoning map (PSAI) with the indication (red circle) of the critical point/intervention area (over the bridge indicated in the lower right photo).
- The criticality of the bridge is mainly related to a hydraulic ineffectiveness of the section of the bridge against floods with higher probability of occurrence (Tr 20 and 50 years). The river is characterized by low/medium slope values. Non-high sediment transport has been observed and the flow velocities are basically not high. During the flood, the narrowing of river section at the bridge location causes the water level to rise; thus, the flood affects nearby areas and roads, making it not drivable. Possible deep bank erosion near the bridge abutments may occur due to the increase in current velocity and the consequent turbulence phenomena at the bridge section. The removal of material from the base of the abutments can create stability problems for the foundation/structure.
- A very poor level of knowledge about the critical point is found (weight 1). The level of accessibility of the areas for means and equipment is very high (weight 10), highlighting no particular difficulties/presence of obstacles for the implementation of any kind of measure. The same exact weight (10) is possible to assign to the field-sheet “operational interference”: no power lines, aqueducts and pipelines in general that could complicate/slow the process/work are found. Regarding the environmental, landscape and archaeological aspects, the area appears to be moderately constrained (weight 4), whereas the number of authorities involved in the approval process is quite high (weight 6). It should be underlined that some inconsistency in the initial attribution of weights could arise.
Therefore, the measures—at first—deemed most suitable for the case were chosen, selecting them from the database list. The measures chosen are (1) enhancement of the channel section at the bridge location and (2) vegetated riprap.
The first solution consists of an adjustment of the height section to make it sufficient for the transit of more severe floods, to reduce the frequency with which the bridge deck interferes with the flows, to improve the safety of the road infrastructure. Riprap consists of blocky, angular rocks of different sizes and shapes. In a streambank stabilization job, the riprap is placed on the bank in such a way that the rocks are not segregated by size. Smaller rocks should chink in the void spaces between the larger rocks. When properly placed, each rock will be locked into place by the surrounding rocks, creating a virtually solid, immovable object. To add further stability, the riprap should be keyed in both the bank and bed. Vegetated riprap incorporates a combination of rock and native vegetation in the form of live cuttings. The establishment of native vegetation will improve fish habitat by creating shade, cover and input of small organic debris to the stream. It will also provide added bank protection through the development of root mass.
Finally, weights are applied according to the description in Section 3.2.2, point 3. By comparing the scores obtained with different solutions, it is possible to define a suitability scale that helps the user in choosing the measure/measures.
4.4. Remarks
The proposed approaches and methods have been developed in order to ensure their replicability in contexts different from those on which they have been tested. Indeed, the provided methods for risk knowledge are based on few and widely available and easily accessible data and on the use of open-source GIS tools. Moreover, the identification of the most appropriate measures for risk mitigation is based on the use of extensive databases of different structural measures suitable to a wide range of contexts. The proposed databases provide a broad spectrum of possible alternatives, allowing the identification of the most adequate measures for the mitigation of risks associated with the main and most frequent seismic and flood hazards affecting inland areas.
The proposed methodologies represent a combination of approaches and procedures already tested and regulated by guidelines or regulatory indications and new procedures aimed at integrating existing knowledge. The applications and experiences carried out can be easily extended to other areas, characterized by similar features as regards construction typologies.
To the authors’ knowledge, the obtained outcomes represent a first attempt to prioritize the inland areas in Italy requiring structural interventions for the mitigation of either the seismic or the flood risk and, therefore, for their regeneration.
5. Conclusions
This contribution focused on the analysis and mitigation of the risk posed by natural hazards to exposed elements (people, properties, environment and economic assets) in inland areas. The aim was to propose a risk analysis procedure that can easily support decision-makers in prioritizing the inland areas requiring the implementation of risk mitigation measures (based on the risk analysis outcomes, especially in case of budget constraints) and the identification of the most suitable ones, which might include the relocation of households still living there if structural and/or non-structural (i.e., early warning) measures cannot be envisaged.
The proposed methodology has been developed within the general framework of the RI.P.R.O.VA.RE. project, funded by the former Italian Ministry of the Environment and Protection of Land and Sea (MATTM). The whole project has been addressed to support national and regional policies aimed at reducing territorial imbalances by providing a methodological path to outline visions and strategies for a resilient and sustainable development of inland areas. The methodology presented here is specifically addressed to promote a better mainstreaming of risk analysis and mitigation into strategies and policies aimed at regenerating inner areas that, in Italy, are largely exposed to several natural hazards. In detail, the research outcomes might be relevant to inform the second programming season of the SNAI (2021-27) that includes, among the new pilot areas, two of the three focus areas of the RI.P.RO.VA.RE. project, Matese and Medio Agri, allowing future strategies to better cope with risk mitigation issues, largely neglected in the previous season of the SNAI, despite being crucial to ensure a sustainable and resilient development of inland areas.
Main findings and recommendation can be summarized next:
- Seismic and flood risk analyses have been performed with reference to a case study area falling in the Matese area, Campania region, southern Italy. Seismic hazard, exposure and vulnerability allowed the assessment of the seismic risk at a local scale.
- A set of likely strategies for seismic risk reduction, depending on the structural typology of the buildings and on the hazard features, has been provided. Seismic risk assessment can be defined with the proposed procedure no matter of the seismic microzoning availability.
- The flood risk mitigation relied upon the definition of the Geomorphic Flood Area (GFA) to map inland flooding local areas. The assignment of weights allowed identifying the most suitable mitigation measures. The procedure is proven to be particularly useful with reference to poor data contexts, such as the inland areas. Limitations are mostly related to the expeditious nature of the Geomorphic Flood Index (GFI). Additionally, especially in the start-up implantation phase of the methodology, some inconsistency in the attribution/comparison of weights could be found. Looking forward, improvements in the methodology are expected in conjunction with the developments of the GFI model, which has recently gained great research interest.
Author Contributions
Conceptualization, A.G., P.F., S.F., L.P. and G.V.; methodology, A.G., P.F., S.F., L.P. and G.V.; software, E.D., F.P. and F.C.; validation, E.D., F.P. and F.C.; formal analysis, A.G., P.F., S.F., L.P. and G.V.; investigation, A.G., P.F., S.F., L.P. and G.V.; resources, A.G., P.F., S.F., L.P. and G.V.; data curation, A.G., P.F., S.F., L.P., E.D., F.P., F.C. and G.V.; writing—original draft preparation, E.D., F.P. and F.C.; writing—review and editing, A.G., P.F., S.F., L.P., E.D., F.P., F.C. and G.V.; visualization, E.D., F.P. and F.C.; supervision, A.G., P.F., S.F., L.P. and G.V.; project administration, A.G. and P.F.; funding acquisition, A.G. and P.F. All authors have read and agreed to the published version of the manuscript.
Funding
This research was funded by the Italian Ministry of the Environment and Protection of Land and Sea, “Call Snsvs 2”, by Executive Decree no. 138/2020, for EUR 150,000.00 on the basis of the competitive call for “The promotion of research projects to support the implementation of the National Sustainable Development Strategy”.
Data Availability Statement
The data presented in this study are available in the article.
Conflicts of Interest
The authors declare no conflicts of interest.
References
- Copus, A.; Mantino, F.; Noguera, J. Inner Peripheries: An oxymoron or a real challenge for territorial cohesion? Ital. J. Plan. Pract. 2017, 7, 24–49. [Google Scholar]
- Kluza, K. When rural boroughs turn into inner peripheries: A link between their socioeconomic characteristics and distance to large cities. Reg. Stud. Reg. Sci. 2020, 7, 75–91. [Google Scholar] [CrossRef]
- De Toni, A.; Vizzarri, M.; Di Febbraro, M.; Lasserre, B.; Noguera, J.; Di Martino, P. Aligning Inner Peripheries with rural development in Italy: Territorial evidence to support policy contextualization. Land Use Policy 2021, 100, 104899. [Google Scholar] [CrossRef]
- Micelli, E.; Ostanel, E.; Lazzarini, L. The who, the what, and the how of social innovation in inner peripheries: A systematic literature review. Cities 2023, 140, 104454. [Google Scholar] [CrossRef]
- Servillo, L.; Russo, A.P.; Barbera, F.; Carrosio, G. Inner Peripheries: Towards an EU place-based agenda on territorial peripherality. Ital. J. Plan. Pract. 2016, 6, 42–75. [Google Scholar]
- ESPON. Shrinking Rural Regions in Europe. Towards Smart and Innovative Approaches to Regional Development Challenges in Depopulating Rural Regions. Policy Brief, 1st ed.; European Union: Luxemburg, 2017. [Google Scholar]
- Rizzo, A. Disaster Management in the Inner Areas: A Window of Opportunity for National Strategy (SNAI). In New Metropolitan Perspectives. ISHT 2018. Smart Innovation, Systems and Technologies; Calabrò, F., Della Spina, L., Bevilacqua, C., Eds.; Springer: Cham, Switzerland, 2019; Volume 101. [Google Scholar] [CrossRef]
- Eurostat. Available online: https://ec.europa.eu/eurostat/ (accessed on 3 July 2023).
- European Commission. Report from the Commission to the European Parliament, the Council, the European Economic and Social Committee and the Committee of the Regions on the Impact of Demographic Change, 1st ed.; European Commission: Brussels, Belgium, 2020. [Google Scholar]
- Calafati, A. Aree interne: Lo sviluppo necessario. In Proceedings of the Forum Aree Interne: Nuove Strategie per la Programmazione 2014–2020 della Politica di Coesione Territoriale, Rieti, Italy, 11–12 March 2013. [Google Scholar]
- ENRD. Long Term Vision for Rural Areas, 1st ed.; Publications Office of the European Union: Luxembourg, 2021. [Google Scholar]
- Martinez Juan, A.; McEldowney, J. Smart Villages. Concept, Issues and Prospects for EU Rural Areas, 1st ed.; EPRS-European Parliamentary Research Service: Brussels, Belgium, 2021.
- Viccione, G.; Nesticò, A.; Vernieri, F.; Cimmino, M. A Pilot Plant for Energy Harvesting from Falling Water in Drainpipes. Technical and Economic Analysis. In Lecture Notes in Computer Science; Springer: Cham, Switzerland, 2019; pp. 233–242. [Google Scholar] [CrossRef]
- Berizzi, C.; Rocchelli, L. Borghi Rinati. Paesaggi Abbandonati e Interventi di Rigenerazione, 1st ed.; Il Poligrafo: Padova, Italy, 2019. [Google Scholar]
- MIUR. Accordo di Partenariato 2014–2020. Strategia Nazionale per le Aree Interne: Definizione, Obiettivi, Strumenti e Governance, 1st ed.; MIUR: Rome, Italy, 2013.
- Galderisi, A.; Galli, P.; Mazzoli, S.; Peronace, E. Kinematic constraints of the active northern Matese Fault System (southern Italy). Bollettino di Geofisica Teorica ed Applicata 2017, 58, 285–302. [Google Scholar] [CrossRef]
- Dottori, D. The effect of the earthquake in Central Italy on the depopulation of the affected territories. Reg. Sci. Urban Econ. 2024, 105, 103985. [Google Scholar] [CrossRef]
- Grignoli, D.; D’Ambrosio, M.; Boriati, D. Vulnerability and Inner Areas in Italy—“Should Young Stay or Should Young Go”? A Survey in the Molise Region. Sustainability 2024, 16, 359. [Google Scholar] [CrossRef]
- Amodio, T. Territories at risk of abandonment in Italy and hypothesis of repopulation. BELGEO Revue Belge de Géographie 2022, 4, 1–22. [Google Scholar] [CrossRef]
- Galderisi, A.; Gaudio, S.; Bello, G. Le aree interne tra dinamiche di declino e potenzialità emergenti: Criteri e metodi per future politiche di sviluppo. Arch. Studi Urbani Reg. 2022, 133, 5–28. [Google Scholar] [CrossRef]
- Galderisi, A.; Bello, G.; Limongi, G. Per uno sviluppo resiliente dei territori interni: Uno strumento operativo. BDCL Bollettino Del Centro Calza Bini 2021, 21, 231–251. [Google Scholar]
- Hack, J. Studies of Longitudinal Stream Profiles in Virginia and Maryland; U.S. Geological Survey Professional Paper; US Government Printing Office: Washington, DC, USA, 1957; pp. 45–94.
- Bacci, M.; Di Marco, M. Il Rischio Sismico in Toscana: Valutazione del Rischio Sismico in Toscana. Modello Speditivo a Scala Regionale Livello 0; SETTORE SISMICA—Prevenzione Sismica Regione Toscana: Tuscany, Italy, 2018. [Google Scholar]
- Bacci, M.; Di Marco, M. Il Rischio Sismico in Toscana: Valutazione del Rischio Sismico in Toscana. Modello Sintetico a Scala Comunale e Urbana Livello 1–2; SETTORE SISMICA—Prevenzione Sismica Regione Toscana: Tuscany, Italy, 2019. [Google Scholar]
- Istituto Nazionale di Geofisica e Vulcanologia. Available online: www.ingv.it (accessed on 3 July 2023).
- Istituto Nazionale di Statistica. Available online: www.istat.it (accessed on 3 July 2023).
- Dipartimento della Protezione Civile. Available online: https://rischi.protezionecivile.gov.it/it/sismico/attivita/classificazione-sismica (accessed on 3 July 2023).
- D.M. 17/01/2018. Nuove Norme Tecniche per le Costruzioni, Italy. 2018. Available online: https://www.gazzettaufficiale.it/eli/gu/2018/02/20/42/so/8/sg/pdf (accessed on 3 July 2023).
- D.M. 65 07/03/2017. Allegato A—Linee Guida per la Classificazione del Rischio Sismico delle Costruzioni, Italy. 2017. Available online: https://www.mit.gov.it/nfsmitgov/files/media/normativa/2017-03/DM%2065%20del%2007-03-2017%20All%20A.pdf (accessed on 3 July 2023).
- O.P.C.M. 3274 20/03/2003. Primi Elementi in Materia di Criteri Generali per la Classificazione Sismica del Territorio Nazionale e di Normative Tecniche per le Costruzioni in Zona Sismica, Italy. 2003. Available online: https://www.bosettiegatti.eu/info/circolari/statali/2003_ord3274_sismica.htm (accessed on 3 July 2023).
- Clubb, F.J.; Mudd, S.M.; Milodowski, D.T.; Valters, D.A.; Slater, L.J.; Hurst, M.D.; Limaye, A.B. Geomorphometric delineation of floodplains and terraces from objectively defined topographic thresholds. Earth Surf. Dyn. 2017, 5, 369–385. [Google Scholar] [CrossRef]
- De Risi, R.; Jalayer, F.; De Paola, F. Meso-scale hazard zoning of potentially flood prone areas. J. Hydrol. 2015, 527, 316–325. [Google Scholar] [CrossRef]
- Jafarzadegan, K.; Merwade, V. A DEM-based approach for large-scale floodplain mapping in ungauged watersheds. J. Hydrol. 2017, 550, 650–662. [Google Scholar] [CrossRef]
- Nardi, F.; Vivoni, E.R.; Grimaldi, S. Investigating a floodplain scaling relation using a hydrogeomorphic delineation method. Water Resour. Res. 2006, 42, 1–15. [Google Scholar] [CrossRef]
- Albertini, C.; Miglino, D.; Iacobellis, V.; De Paola, F.; Manfreda, S. Flood-prone areas delineation in coastal regions using the Geomorphic Flood Index. J. Flood Risk Manag. 2021, e12766. [Google Scholar] [CrossRef]
- Manfreda, S.; Samela, C. A DEM-based method for a rapid estimation of flood inundation depth. J. Flood Risk Manag. 2019, 12 (Suppl. S1), e12541. [Google Scholar] [CrossRef]
- Samela, C.; Albano, R.; Sole, A.; Manfreda, S. A GIS tool for cost-effective delineation of flood-prone areas. Comput. Environ. Urban Syst. 2018, 70, 43–52. [Google Scholar] [CrossRef]
- Samela, C.; Troy, T.J.; Manfreda, S. Geomorphic classifiers for flood-prone areas delineation for data-scarce environments. Adv. Water Resour. 2017, 102, 13–28. [Google Scholar] [CrossRef]
- Hysa, A.; Spalevic, V.; Dudic, B.; Roșca, S.; Kuriqi, A.; Bilașco, Ș.; Sestras, P. Utilizing the Available Open-Source Remotely Sensed Data in Assessing the Wildfire Ignition and Spread Capacities of Vegetated Surfaces in Romania. Remote Sens. 2021, 13, 2737. [Google Scholar] [CrossRef]
- Capobianco, V.; Uzielli, M.; Kalsnes, B.; Choi, J.C.; Strout, J.M.; von der Tann, L.; Steinholt, I.H.; Solheim, A.; Nadim, F.; Lacasse, S. Recent innovations in the LaRiMiT risk mitigation tool: Implementing a novel methodology for expert scoring and extending the database to include nature-based solutions. Landslides 2022, 19, 1563–1583. [Google Scholar] [CrossRef]
- Vaciago, G. The SafeLand compendium of landslide risk mitigation measures. In Landslide Science and Practice: Risk Assessment, Management and Mitigation, 1st ed.; Margottini, C., Canuti, P., Sassa, K., Eds.; Springer: Berlin/Heidelberg, Germany, 2013; Volume 6, pp. 683–689. [Google Scholar]
- Leopold, L.B.; Maddock, T.J. The Hydraulic Geometry of Stream Channels and Some Physiographic Implications; Geological Survey Professional Paper; US Government Printing Office: Washington, DC, USA, 1953; Volume 252.


Disclaimer/Publisher’s Note: The statements, opinions and data contained in all publications are solely those of the individual author(s) and contributor(s) and not of MDPI and/or the editor(s). MDPI and/or the editor(s) disclaim responsibility for any injury to people or property resulting from any ideas, methods, instructions or products referred to in the content. |
© 2024 by the authors. Licensee MDPI, Basel, Switzerland. This article is an open access article distributed under the terms and conditions of the Creative Commons Attribution (CC BY) license (https://creativecommons.org/licenses/by/4.0/).