Abstract
Ambient particles contribute to occupant exposure as they infiltrate indoor environments through building envelope cracks, impacting indoor air quality. This study investigates the impact of indoor air humidity on the infiltration of ambient particles, highlighting humidity’s crucial role in influencing particle dynamics in indoor environments. Employing a controlled chamber system, we conducted experiments to quantify the infiltration of size-resolved particles under varying relative humidity (RH) conditions. Both the total number and the mass concentration of particles increased with RH in the experimental chamber. The smallest particles (0.3–0.4 μm) experienced reduced infiltration at higher RH levels due to hygroscopic growth, while intermediate-sized particles showed increased infiltration, resulted from coagulation effects. Large particles (>1.0 μm) demonstrated reduced infiltration factors, caused by lower penetration and higher deposition rates, with minimal impact from RH changes. Our findings reveal that RH influences particle hygroscopic growth, deposition rate, and coagulation process, thereby affecting indoor particle size distribution and concentration.
1. Introduction
Ambient fine particulate matter (PM2.5) poses a well-documented risk to human health [1,2,3]. Considering that individuals now spend over 90% of their time indoors, a trend amplified by the COVID-19 pandemic [4,5], the infiltration of particles into indoor spaces through building envelopes is a critical concern [6,7,8]. Understanding and quantifying this infiltration process is essential to assessing indoor particulate loads and devising effective control measures.
The infiltration factor (Finf), which denotes the proportion of ambient particles that penetrate indoor environments and remain suspended [9], serves as a critical estimator in this domain. Research indicates that Finf values vary across different buildings and particle sizes [10,11], influenced by factors such as meteorological conditions (including air pressure, temperature, and humidity), building characteristics (e.g., envelope tightness, volume), and aerosol dynamics behavior (e.g., penetration, deposition, coagulation) [12,13,14].
Field studies have extensively explored these variables. For instance, Wallace and Williams [15] monitored 37 residents across four seasons to study personal, indoor, and outdoor exposure to PM2.5. They calculated Finf values based on indoor/outdoor sulfur ratios, concluding that the infiltration factor was the lowest in summer when air conditioners were in use. MacNeill et al. [16] collected continuous data for two years to estimate daily infiltration factors, finding that the daily Finf of PM2.5 was higher in summer than in winter. They also linked daily infiltration to window-opening behaviors, air conditioning, meteorological variables, and home age. Huang et al. [17] measured indoor and outdoor PM2.5 mass concentrations in 41 urban residences and examined the connections between Finf and 78 environmental factors, showing that Finf was influenced by building characteristics, traffic, wall and floor coverings, and human behavior.
The literature reveals significant variability in Finf, pointing to the need for further investigation into the physical mechanisms dictating the behavior of indoor particles originating from outdoor sources. This variability is also evident in studies on the effects of relative humidity (RH) on particle behavior, including hygroscopic growth, coagulation, and deposition rate, suggesting an interaction between indoor RH and particulate dynamics. Hänel [18,19] computed the dependency of gravitational settling and Brownian diffusion on relative humidity for particles of different sizes. The results confirmed that RH significantly affects the deposition of aerosol particles. Dockery and Spengler [20] were the first to develop a steady-state mass balance equation for indoor and outdoor concentrations, assuming that the air exchange rate (a), penetration efficiency (P), and deposition rate (k) remained constant over the study period. They estimated Finf values for respirable particles (PM10) to be 0.70, using indoor and outdoor concentrations of PM10. However, their assumptions may not correspond to real conditions, where the values of a, P, and k can vary. Li et al. [21] showed both theoretically and experimentally that RH, rather than temperature, plays the dominant role in determining the hygroscopic growth of aerosol particles. Jamriska and Morawska [22] continuously measured the evolution of particle volume and number concentration in an experimental chamber, concluding that approximately 64–84% of the total particle number loss was caused by coagulation mechanisms in their experiments, while surface deposition dominated the mass reduction of particles. Faulkner et al. [23] built a reduced-scale chamber with a ventilation system to measure particle concentration, showing that increasing air change rates reduced the particulate penetration factor for small particles but had little effect on large particles. Wang et al. [24] investigated the effect of RH on the deposition and coagulation of particles in an environmental test chamber, revealing that lower and higher RH conditions tended to enhance the deposition rate of nanoparticles; the coagulation coefficient of the nanoparticles increased with increased humidity due to strong inter-particle adherence.
Building on these findings, our study focuses on the impact of indoor air humidity on the infiltration of size-resolved particles. Utilizing an experimental chamber system, we conducted a series of experiments under varying RH conditions to examine the dynamic behavior of polydisperse aerosols. Through a mass balance model accounting for penetration, hygroscopicity, coagulation, deposition, and ventilation, we aimed to provide a nuanced quantitative assessment of Finf in relation to air humidity. This assessment is anticipated to contribute to the broader discussion on indoor air quality, offering insights that could inform future modeling approaches, indoor particulate load calculations, and building energy consumption estimations.
2. Experimental Setup and Methods
Experiments were performed in room-sized chambers to determine the infiltration of fine particles under different humidity conditions. The mass concentration of total particles (i.e., PM2.5) and the number concentration of size-resolved particles were monitored simultaneously and continuously. Based on the collected data, a mass balance model was used to analyze the infiltration process.
2.1. Experimental Chambers
An experimental chamber system was designed to study the impact of indoor air humidity on the infiltration of size-resolved particles (Figure 1). It was a room measuring 3.9 m in length, 2.9 m in width, and 2.6 m in height, divided by a wall into two sections to simulate an outdoor environment, named Chamber A, and an indoor environment, named Chamber B. The mass concentration of particles, particle size distribution, air relative humidity, air temperature, and pressure difference in the experimental chambers were controlled and measured.
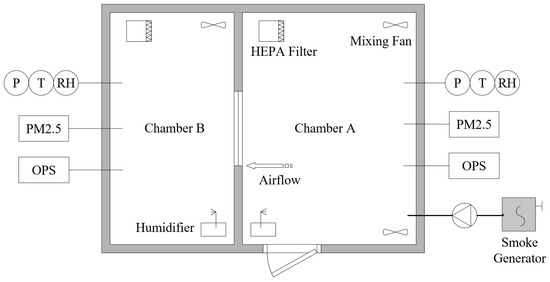
Figure 1.
Experimental chamber system. PM2.5—PM2.5 monitoring system; OPS—optical particle sizer; RH—relative humidity probe; T—temperature probe; P—differential pressure transducer.
The partition wall between Chambers A and B featured a polyurethane foam core, enclosed by gypsum boards with a polyurethane coating, providing insulation against heat and moisture. A stainless-steel window was installed in the partition wall. The specialized window, rectangular in shape (0.9 m in width and 0.6 m in height), had a windowsill at a height of 0.9 m. Its crack sizes were accurately measured and adjusted. The cracks between the window and its frame were straight, consisting of two horizontal cracks and two vertical cracks. Figure 2 provides a schematic representation of the crack’s architecture. The length of the crack along the airflow, denoted by the symbol z, was set at 90 mm. The height of the crack was small, only 1 mm, represented symbolically by d, and the width of the crack was denoted by w. It was assumed that the inner face of the crack was smooth, as a study [14] showed that the penetration factor is not sensitive to crack roughness.
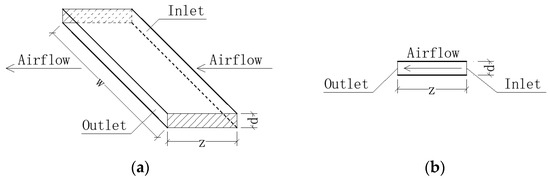
Figure 2.
Straight crack between window and frame: (a) three-dimensional view; (b) sectional view.
2.2. Instrumentations and Test Conditions
The mass concentrations of particles (PM2.5) in the chambers were continuously monitored by a PM2.5 monitoring system (QD-X1-A, Green Built Environment Technology Co., Ltd., Beijing, China), which had six measuring probes with an accuracy of ±10% in the range of 10 to 500 μg/m3. The number concentration and size distribution of particles were measured with two optical particle sizers (OPSs, Model 3330, TSI Incorporated, Shoreview, MN, USA), offering a size resolution of 5% at 0.5 μm. Before each test, zero checks and flow rate verifications were performed on both OPS units to ensure measurement accuracy. The OPS operated to count particles in 9 size categories: 0.3–0.35 μm, 0.35–0.4 μm, 0.4–0.5 μm, 0.5–0.7 μm, 0.7–1.0 μm, 1.0–1.3 μm, 1.3–1.6 μm, 1.6–2.0 μm, and 2.0–2.5 μm in diameter. The sampling ports were positioned in the center of chambers at a height of 1.2 m. A sample holder for the field-emission scanning electron microscope (FE-SEM, Gemini SEM 500, Zeiss Group, Oberkochen, Germany) was placed in the center of Chamber B to collect the deposited particles.
Before each test, Chambers A and B were cleaned by an air cleaner with a high-efficiency particulate aerosol (HEPA) filter for 60 min. The particle source in this study was the combustion of incense, ignited in a smoke generator, with the smoke pumped into Chamber A. The concentration of particles in Chamber A was controlled by four paralleled pumps (JQ-12V, Jinqi Technology Co., Ltd., Shenzhen, China) and maintained at a steady level of 400 ± 40 μg/m3. The incense-burning-derived particles from Chamber A infiltrated Chamber B through the window cracks, with the airflow. The infiltration process lasted 480 min in each test, with no other particle sources in either chamber.
The air exchange rate between Chambers A and B was determined by the tracer gas concentration decay method [25]. Carbon dioxide (CO2) was injected as the tracer gas into Chamber B, and its concentration decay was monitored continuously by a CO2 sensor (TES-1370, TES Electrical Electronic Corp., Taiwan, China) with an accuracy of ±3% or ±50 ppm (whichever was greater), ranging from 0 to 6000 ppm. One sensor was placed in the center of Chamber B, and another was positioned outside the experimental system to record the background concentration. The tracer gas concentration decay method is based on the following mass conservation equation:
where Ct is the tracer gas concentration at time t, Cbg is the background tracer gas concentration, C0 is the tracer gas concentration at the initial moment, and a is the air exchange rate. The tightness of Chamber B was verified when the window cracks were sealed. With the cracks unsealed, the air exchange rate between Chambers A and B was calculated using Equation (1), resulting to be 0.144 h−1.
To assess the impact of indoor air humidity on particle infiltration, seven target RH levels were maintained in Chamber B across different tests: 30%, 40%, 50%, 60%, 70%, 80%, and 85%. The air relative humidity in Chamber A was kept at 35 ± 5% in each test. Humidity was regulated by a wet-membrane humidifier (XH-805, OPV Electric Co., Ltd., Ji’nan, China), and RH probes (WSZY-1, Tianjian Huayi Technology Development Co., Ltd., Beijing, China) with an accuracy of ±2% were positioned in the center of the chambers at a height of 1.2 m. RH data were recorded every two minutes. Each humidity level test was repeated three times to ensure reliability.
The air temperature in the chamber was maintained at approximately 25 °C by the insulated walls and an external air-conditioning system. The accuracy of the temperature probe (AT4320, Applent Instruments Ltd., Changzhou, China) was ±0.3 °C in the range from 0 to 50 °C.
The pressure difference between Chambers A and B was monitored by a low differential pressure transducer (Model 264, Setra, Boxborough, MA, USA) with an accuracy of ±0.4 Pa over the range from 0 to 100 Pa. It was positioned in a corner of Chamber A, with its openings fixed in the center of each chamber. The air pressure in Chamber A was slightly higher, resulting in pressure differences between Chambers A and B of 1.86 ± 0.40 Pa.
2.3. Analytical Model
The infiltration factor (Finf) represents the proportion of outdoor particles that penetrate indoors and remain suspended. In our experiments, particles from incense burning penetrated through the cracks, along with the airflow, between Chamber A and Chamber B, without any human activity or other sources present in the experimental chambers. Thus, the general expression of the infiltration factor can be written as:
where Cin and Cout represent the indoor and outdoor particle concentrations, respectively.
To measure the impact of indoor air humidity on particle infiltration, we analyzed the particle dynamic behavior using a mass balance model. Within an indoor environment, ventilation, penetration, and deposition primarily drive particle decay. Additionally, considering the role of indoor humidity, we must also account for hygroscopicity and coagulation mechanisms, as these can significantly influence particle number concentration fluctuations.
The size distribution of particles from incense burning and other common indoor aerosol particles can be fitted with a lognormal distribution [26]. The distribution function for the number density can be expressed as:
where dp is the particle diameter, σg is the geometric standard deviation based on particle diameter, and dg is the geometric mean particle diameter.
In a humid indoor environment, water-soluble compounds in incense-burning-derived particles will absorb water vapor, potentially forming a liquid shell [27]. The ratio between the humidified and the dry particle diameters is known as the hygroscopic diameter growth factor (Gf). Gf is measured and parameterized as a function of RH (in %) [28], expressed as:
where dw is the humidified particle diameter, dd is the dry particle diameter, and A is a fitted parameter.
We introduce the hygroscopic number change ratio (β) to quantify changes in particle number concentrations due to hygroscopicity. This ratio compares particle concentrations at a specific relative humidity to those in a dry state, illustrating the impact of water vapor absorption and subsequent hygroscopic growth on particle number concentrations. For each particle size category, this ratio is denoted as βi. In this study, βi is proposed and was formulated based on the following assumptions: (1) the water vapor–particle equilibrium in the hygroscopic process is achieved in seconds [29]; (2) the total number and geometric standard deviation (GSD) of particles remain constant during hygroscopicity [30]; (3) particles from incense burning are “nearly hydrophobic”, with the hygroscopic diameter growth factor (Gf) being independent of particle size [31]. Thus, the formula for βi can be derived using Equations (3) and (4):
where Niw is the number concentration of humidified particles in the ith size category, Nid is the number concentration of dry particles in the ith size category, fw is the distribution function of humidified particles, and di is the average diameter of the ith size category.
In our experiments, particles from incense burning penetrated the indoor environment through the cracks, along with the airflow, between Chambers A and B, without any human activity or other sources in the chambers. Considering the relative humidity of indoor air, the mass balance equation for particles indoors (i.e., Chamber B) is:
where Ni(t) is the number concentration (cm−3) of particles in an indoor environment at time t (min), the subscript i denotes the particle size range, a is the air exchange rate (min−1), Pi is the particle penetration factor, Ni,out is the particle number concentration (cm−3) outdoors (i.e., Chamber A), ki is the particle deposition rate (min−1), and γi is the coagulation rate (cm3 min−1).
The first term on the right-hand side of Equation (6) reflects the process of outdoor particles penetrating with the airflow and absorbing water vapor from indoor air. The penetration factor can be approximated considering the mechanisms of gravitational settling and Brownian diffusion [15]. The second and third terms account for the particle loss due to ventilation and deposition onto surfaces in Chamber B, respectively. The last term represents the number change for particles in the ith size category caused by coagulation, in which pairs of particles collide and stick together.
The steady-state condition of indoor particle concentration is achieved when the dynamic balance between particle penetration, deposition, and coagulation is established:
From this state, the size-resolved infiltration factor (Finf,i) can be deduced, providing a means to analyze the impact of indoor air humidity on infiltration efficiency:
The experimental data, including particle concentrations in the chambers over time, were analyzed using the above approaches to understand the dynamics of particle infiltration and behavior in humid indoor environments.
3. Results and Discussion
3.1. Particle Characteristics Measured in the Experimental Chamber
In this study, we continuously measured the size-resolved number concentrations of the test particles in the experimental chambers, Chamber A and Chamber B. Chamber A simulated an outdoor environment, maintaining a relative humidity of 35 ± 5% and a steady particle concentration of 400 ± 40 μg/m3 throughout the various tests. Meantime, seven sets of tests were conducted under different RH conditions in Chamber B, simulating the indoor environment. The detailed RH conditions and particle characteristics of each test in Chambers A and B are provided in Table 1.

Table 1.
Test conditions and characteristics of test aerosols in Chambers A and B.
The total number concentration (Ntotal) and the total mass concentration (Mtotal) in both chambers are average values, calculated over the last 20 min of the infiltration process. Overall, the concentrations of particles in Chamber B were positively correlated with the increase in RH, which may be attributed to increased particle hygroscopicity and growth due to water uptake. Additionally, the infiltration factor (Finf), which represents the extent of particle penetration from Chamber A to Chamber B, also escalated with increasing RH.
The particle size distributions in both chambers followed a unimodal and lognormal pattern. The geometric mean diameter (GMD) and the geometric standard deviation (GSD) of the particles were derived using the lognormal distribution function (Equation (3)). The R-square values were relatively high (>0.9), indicating a good fit of the function to the experimental data. An analysis of the GMD values revealed an upward trend with increasing RH, from 0.22 μm at 30% RH to 0.29 μm at 85% RH. In comparison, the GMD of the source particles in Chamber A remained consistent at an average value of 0.24 μm. Interestingly, when RH in Chamber B was lower than 60%, the GMD of the particles in Chamber B was smaller than in Chamber A, while in high RH conditions (RH > 60%), the GMD in Chamber B increased as RH rose. This observation indicates that the penetration process dominated the particle size change in low RH conditions, and the hygroscopic mechanism took over when the particles absorbed water vapor and grew larger under high RH conditions. The GSD values displayed a minor declining trend with increasing RH, from 1.65 at 30% RH to 1.63 at 85% RH. Based on the self-preserving size distribution theory of Friedlander [32], we treated the GSD as constant in our analytical approach.
The time-varying experimental data for particle concentrations at the lowest and highest RH levels were selected for further analysis. In Figure 3, each point represents an average value of the size-resolved number concentrations of particles over a twenty-minute period. To analyze the influence of air humidity on infiltration, we fitted the data using the solution of the humidity model proposed in Equation (6). The data for the driest condition (RH = 30 ± 4%) are shown in Figure 3a. The number of particles in each size range increased over time, while the growth rate dropped to near zero after 480 min of infiltration. As the particle size range increased, the number concentration of the particles generally decreased. At the end of the measurement period, the concentration scales decreased with the increasing particle diameter. Finally, the concentration of PM1 was about 2490 cm−3, while for the 1.0–2.5 μm size range, it was only 10 cm−3. This suggests that particles larger than 1 μm were less prevalent in the chamber. For comparison, Figure 3b presents the evolution of particle concentrations at 85% RH. The general trend of increasing particle concentration over time was similar in the two cases. However, notable differences in particle number concentrations between the two RH conditions were observed. For particles within the size ranges of 0.3–0.35 μm and 0.35–0.4 μm, their number concentration and growth rate were higher at RH = 85% than at RH = 30% in the first half of the infiltration experiment. However, in the final stage of the experiment, when the particle concentrations were high, the particle numbers were lower at RH = 85% than at RH = 30%, and their concentrations even showed negative growth in the last hour. Meanwhile, for particles in the 0.4–0.5 μm and larger-size ranges, concentrations were higher at RH = 85% than at RH = 30%. It is evident that under high humidity conditions, the increased availability of water vapor led to the hygroscopic growth of particles across all size ranges. Furthermore, it can be deduced that higher humidity conditions and/or higher particle concentrations may facilitate the coagulation of small particles.
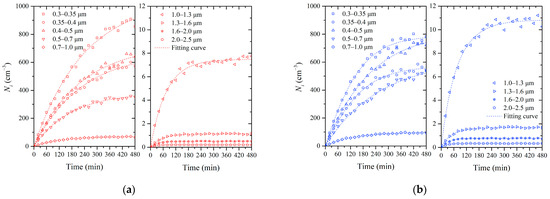
Figure 3.
The evolution in the number concentration of size-resolved particles in Chamber B: (a) RH = 30 ± 4%; (b) RH = 85 ± 3%.
3.2. Infiltration Factor
The experimental data presented in Figure 3 indicate that particle infiltration varied significantly with both indoor RH conditions and particle size. We calculated the infiltration factor for particles in different size ranges separately using Equation (2) and present the results in Figure 4.
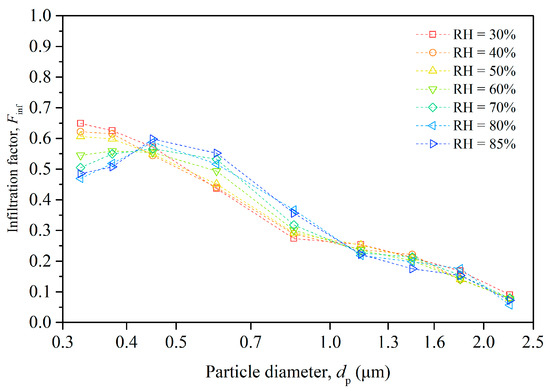
Figure 4.
Size-resolved infiltration factor of particles under different humidity conditions.
The infiltration factor generally decreased as the particle size increased, except for particles in the smallest-size range (0.3–0.35 μm). This is because larger particles have lower penetration factors and higher deposition rates than smaller particles, which reduces their infiltration efficiency.
The relationship between Finf and RH is complex, exhibiting size-dependent variations. For smaller particles (0.3–0.4 μm), increased RH correlates with a diminished Finf, due to enhanced hygroscopic growth which elevates the effective particle size. In contrast, the Finf of intermediate-sized particles (0.4–1.0 μm) increases with RH, suggesting coagulation processes that increase particle size and collision efficiency. Larger particles (>1.0 μm) show minimal sensitivity to RH shifts, indicating relative stability in their infiltration behavior. Moreover, at very high humidity levels, particles may become stickier and adhere more to the building envelope, which can increase their penetration factor. The overall effect of humidity depends on the balance of these factors.
The figure highlights the importance of considering both particle size and indoor RH when assessing infiltration factors, with significant implications for managing indoor air quality and formulating mitigation strategies. Additionally, it brings to light the need for a nuanced understanding of the chemical composition of ambient aerosols. The hygroscopic properties of aerosol particles, dictated by their chemical makeup, significantly govern their growth dynamics in response to variations in RH. This growth, in turn, influences particle deposition and coagulation processes, ultimately affecting particle infiltration efficiency.
To assess the detailed effect of indoor air humidity on particle infiltration, we analyzed the dynamics of particles using the mass balance model in Equation (6). We fitted the solution of Equation (6) to the time-varying and size-resolved particle concentrations under seven different humidity conditions and obtained the deposition rate (ki), hygroscopic number change ratio (βi), and coagulation rate (γi) of the particles. These coefficients are quantitatively analyzed in the following sections.
3.3. Deposition Rate of the Particles
Based on the changes in measured particle concentrations, we obtained the size-resolved deposition rates of the particles in Chamber B, which are plotted in a logarithmic coordinate system in Figure 5. The points in the figure, represented by different colors, correspond to seven datasets under different humidity levels, and the dashed line illustrates the regression of these seven datasets of particle deposition rate. It is apparent that the deposition rate increased with the increasing particle size for particles ranging from 0.3 to 2.5 μm, regardless of the relative humidity level. For smaller particles, specifically within the 0.3–0.4 μm range, the deposition rate experienced a slight increase with a rise in relative humidity. However, the correlation between deposition rate and relative humidity was neither significant nor uniform across different particle sizes.
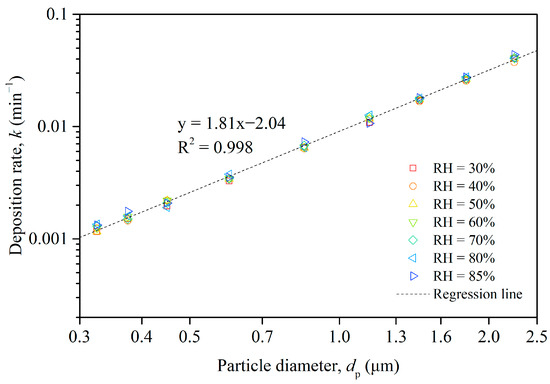
Figure 5.
Size-resolved deposition rate of particles in Chamber B and regression of 7 different humidity datasets.
As a result, our investigation concentrated on the relationship between deposition rate and particle size, combining the data from all humidity levels and performing a regression analysis to establish a mathematical connection. As demonstrated in Figure 5, the liner regression equation implied a strong power law relationship between the deposition rate and the particle diameter across the seven humidity levels. The deposition rate increased with an increasing particle diameter, and the regression fitted the data very well, as evidenced by the high R-squared value.
3.4. Hygroscopicity of the Particles
The hygroscopic number change ratio (β) quantifies the potential variation in particle number concentration resulting from the hygroscopic growth of particles, a process driven by water vapor absorption. Figure 6 illustrates the β values corresponding to various particle sizes under different humidity conditions, with individual colors representing the humidity levels. The value of β showed a notable increase with the rising RH across all particle sizes. This trend reflects the fundamental concept of hygroscopic growth, whereby particles absorb more water vapor at higher humidity levels. Interestingly, higher values of β were observed for larger particles compared to smaller ones at equivalent relative humidity. This phenomenon might be attributed to the transformation of smaller particles into larger ones as they absorbed water, subsequently shifting to the larger-size categories, thereby escalating the corresponding number concentrations and β values. Moreover, the rate of increase in the β values appeared to grow with the rising relative humidity, suggesting that the effects of hygroscopic growth became more pronounced at higher humidity levels. This underscores the profound influence of relative humidity on particle number concentrations and the overall dynamics of aerosol populations.
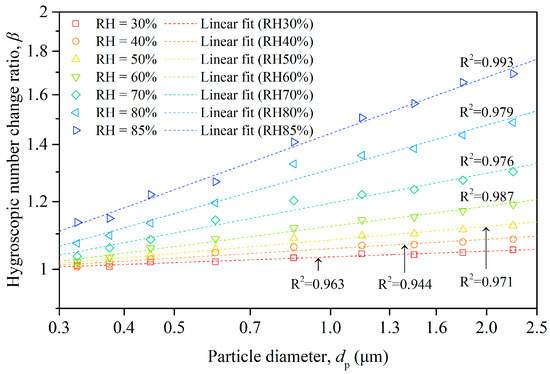
Figure 6.
Size-resolved hygroscopic number change ratio of particles and fitting lines under different humidity conditions.
In addition to the data points, Figure 6 also portrays the linear regression for each dataset within a logarithmic coordinate system. The regression analysis revealed a linear association between the natural logarithm of β and that of the particle diameter (dp) under constant humidity. This power law relationship between β and dp aligns with the model introduced in Equation (5), suggesting potential inherent mechanisms that operated proportionally.
3.5. Coagulation of the Particles
In the experimental chamber, most particles were smaller than 1 μm, with coagulation events primarily occurring among these particles. Figure 7 illustrates the varying trends of the coagulation rate for different particle size ranges and humidity conditions. The coagulation rate for the ith size category (γi) measures the extent to which particles collide and stick together. A positive γi value indicates that the number of particles in that size category decreases due to coagulation, while a negative γi value signifies an increase in the number of particles in that size category due to coagulation.
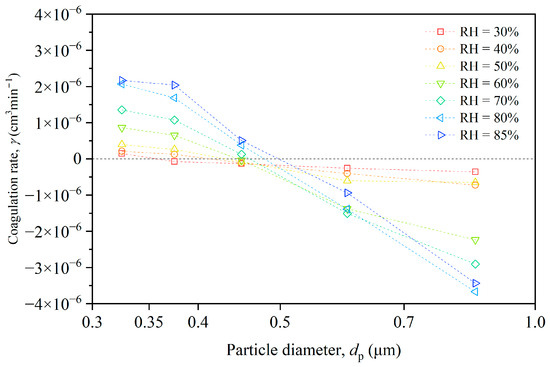
Figure 7.
Size-resolved coagulation rate of particles under different humidity conditions.
For the smallest particles (0.3–0.4 μm), the coagulation rate increased with the rising humidity, reaching a maximum at RH = 85%. This suggests that these particles were more prone to coagulate as humidity increased, possibly because water molecules on the particle surfaces enhanced the attractive forces between them. For intermediate particles (0.4–0.5 μm), the coagulation rate was negative under low humidity conditions (RH < 50%), indicating that these particles were less likely to coagulate than smaller particles. However, as humidity increased, the coagulation rate became positive, suggesting these particles became more prone to coagulation with rising humidity. For the largest particles (0.5–1.0 μm), the coagulation rate was negative across all humidity conditions, indicating that the particles in smaller-size ranges coagulated and then were counted in the larger-size ranges.
We derived the values of the coagulation rate from Equation (6), using the time-varying and size-resolved particle concentrations. This approach accounted for enhanced collision rates between particles caused by factors such as turbulence or charge, as well as the polydispersity of the particle size distribution.
4. Conclusions
Our experimental setup, employing a controlled chamber system, allowed for the precise quantification of particle infiltration under varying RH conditions. Through experimentation and analysis, we established that variations in indoor RH levels distinctly influenced the behavior of infiltrating particles, affecting their hygroscopic growth, deposition rates, and coagulation processes. Notably, our findings underscore the critical role of RH in modulating the size distribution and concentration of indoor particles, thereby altering indoor air quality and potentially impacting human health. The main conclusions are as follows:
- (1)
- In Chamber B, simulating indoor conditions at different RH levels, both the total number and the mass concentrations of particles increased with RH, indicating a clear correlation between RH and the particle hygroscopic growth. This growth led to an increase in the infiltration factor (Finf) as RH rose. The particle size distributions suggest that hygroscopic growth and coagulation processes dominated under different RH conditions, affecting particle size and concentration dynamics.
- (2)
- Particle infiltration was significantly influenced by indoor relative humidity (RH) and particle size, showing distinct behaviors across different size ranges. Larger particles exhibited decreased infiltration factors due to lower penetration and higher deposition rates. In the size range of 0.3–0.4 μm, the particles experience reduced infiltration at higher RH levels due to hygroscopic growth, while intermediate-sized particles showed increased infiltration, resulted from coagulation effects. Large particles (>1.0 μm) were less affected by RH changes.
- (3)
- There was a clear power law relationship between particle size and deposition rate across various humidity levels, showing an increase in the deposition rate with the particle size. While humidity impacted the deposition rate for smaller particles (0.3–0.4 μm), this effect was not uniformly observed across all particle sizes. A comprehensive regression analysis underscored a strong correlation between deposition rate and particle diameter, validated by a high R-squared value.
- (4)
- The hygroscopic number change ratio (β) increased with relative humidity (RH) across all particle sizes, indicating enhanced water vapor absorption by particles at higher RH levels. Larger particles exhibited higher β values than smaller ones at the same RH, suggesting a size transformation due to hygroscopic growth. The linear regression within the logarithmic coordinate system showed a power law relationship between β and particle diameter, supporting the model that describes proportional mechanisms of hygroscopic growth.
- (5)
- Particle coagulation varied with size and humidity, showing an increased possibility of coagulation among smaller particles (<1 μm) as humidity rose. This was attributed to enhanced attractive forces from water molecules on particle surfaces. The coagulation rate transitioned from negative to positive for intermediate-sized particles with increasing humidity. Larger particles exhibited consistently negative coagulation rates across all humidity levels, suggesting a redistribution towards larger sizes due to the coagulation of smaller particles.
This investigation contributes to a deeper understanding of the environmental factors affecting indoor air quality, emphasizing the indispensability of RH in the dynamics of particle infiltration. However, because of its reliance on a controlled chamber system, it may not fully capture the complexity of actual indoor environments. Focusing solely on RH could overlook the comprehensive effects of other environmental variables and indoor particle sources.
Future research should broaden the examination scope to include the synergistic effects of multiple environmental variables, such as temperature and indoor sources. Additionally, directly analyzing the chemical composition of particles will clarify their contribution to hygroscopic growth, deposition, and coagulation.
Author Contributions
Conceptualization, J.Q. and H.Z.; methodology, J.Q.; software, J.Q. and J.L.; validation, J.Q. and H.Z.; formal analysis, J.Q.; resources, Y.L.; data curation, J.Q.; writing—original draft preparation, J.Q.; writing—review and editing, Y.L.; supervision, J.L.; funding acquisition, Y.L. All authors have read and agreed to the published version of the manuscript.
Funding
This research was funded by the National Key Research and Development Program of China under Grant No. 2018YFB0604101.
Data Availability Statement
The data used to support the findings of this study are included in the article.
Conflicts of Interest
Author Haixi Zhang was employed by the company China Northwest Architectural Design and Research Institute Co., Ltd. Author Jialu Liu was employed by the company Jiangnan Shipyard (Group) Co., Ltd. The remaining authors declare that the research was conducted in the absence of any commercial or financial relationships that could be construed as a potential conflict of interest.
References
- Pope, C.A.; Ezzati, M.; Dockery, D.W. Fine-Particulate Air Pollution and Life Expectancy in the United States. N. Engl. J. Med. 2009, 360, 376–386. [Google Scholar] [CrossRef]
- Bell, M.L.; Zanobetti, A.; Dominici, F. Evidence on Vulnerability and Susceptibility to Health Risks Associated with Short-Term Exposure to Particulate Matter: A Systematic Review and Meta-Analysis. Am. J. Epidemiol. 2013, 178, 865–876. [Google Scholar] [CrossRef] [PubMed]
- Lu, F.; Xu, D.; Cheng, Y.; Dong, S.; Guo, C.; Jiang, X.; Zheng, X. Systematic Review and Meta-Analysis of the Adverse Health Effects of Ambient PM2.5 and PM10 Pollution in the Chinese Population. Environ. Res. 2015, 136, 196–204. [Google Scholar] [CrossRef]
- Adgate, J.L.; Ramachandran, G.; Pratt, G.C.; Waller, L.A.; Sexton, K. Spatial and Temporal Variability in Outdoor, Indoor, and Personal PM2.5 Exposure. Atmos. Environ. 2002, 36, 3255–3265. [Google Scholar] [CrossRef]
- Awada, M.; Becerik-Gerber, B.; Hoque, S.; O’Neill, Z.; Pedrielli, G.; Wen, J.; Wu, T. Ten Questions Concerning Occupant Health in Buildings During Normal Operations and Extreme Events Including the COVID-19 Pandemic. Build. Environ. 2021, 188, 107480. [Google Scholar] [CrossRef]
- Wallace, L. Indoor Particles: A Review. J. Air Waste Manag. Assoc. 1996, 46, 98–126. [Google Scholar] [CrossRef]
- Chen, C.; Zhao, B. Review of Relationship Between Indoor and Outdoor Particles: I/O Ratio, Infiltration Factor and Penetration Factor. Atmos. Environ. 2011, 45, 275–288. [Google Scholar] [CrossRef]
- Meier, R.; Schindler, C.; Eeftens, M.; Aguilera, I.; Ducret-Stich, R.E.; Ineichen, A.; Davey, M.; Phuleria, H.C.; Probst-Hensch, N.; Tsai, M.-Y.; et al. Modeling Indoor Air Pollution of Outdoor Origin in Homes of Sapaldia Subjects in Switzerland. Environ. Int. 2015, 82, 85–91. [Google Scholar] [CrossRef]
- Wilson, W.E.; Mage, D.T.; Grant, L.D. Estimating Separately Personal Exposure to Ambient and Nonambient Particulate Matter for Epidemiology and Risk Assessment: Why and How. J. Air Waste Manag. Assoc. 2000, 50, 1167–1183. [Google Scholar] [CrossRef]
- Bi, J.; Wallace, L.; Sarnat, J.; Liu, Y. Characterizing Outdoor Infiltration and Indoor Contribution of PM2.5 with Citizen-Based Low-Cost Monitoring Data. Environ. Pollut. 2021, 276, 116763. [Google Scholar] [CrossRef]
- Barkjohn, K.K.; Bergin, M.H.; Norris, C.; Schauer, J.J.; Zhang, Y.; Black, M.; Hu, M.; Zhang, J. Using Low-Cost Sensors to Quantify the Effects of Air Filtration on Indoor and Personal Exposure Relevant PM2.5 Concentrations in Beijing, China. Aerosol Air Qual. Res. [CrossRef]
- Diapouli, E.; Chaloulakou, A.; Koutrakis, P. Estimating the Concentration of Indoor Particles of Outdoor Origin: A Review. J. Air Waste Manag. Assoc. 2013, 63, 1113–1129. [Google Scholar] [CrossRef] [PubMed]
- Lai, A.C.K. An Experimental Study of Indoor and Outdoor Concentrations of Fine Particles Through Nonisothermal Cracks. Aerosol Sci. Technol. 2013, 47, 1009–1016. [Google Scholar] [CrossRef][Green Version]
- Yang, T.Y.; Riskowski, G.L.; Chang, A.C.-Z. Effects of Air Relative Humidity and Ventilation Rate on Particle Concentrations Within a Reduced-Scale Room. Indoor Built Environ. 2019, 28, 335–344. [Google Scholar] [CrossRef]
- Wallace, L.; Williams, R. Use of Personal-Indoor-Outdoor Sulfur Concentrations to Estimate the Infiltration Factor and Outdoor Exposure Factor for Individual Homes and Persons. Environ. Sci. Technol. 2005, 39, 1707–1714. [Google Scholar] [CrossRef] [PubMed]
- MacNeill, M.; Wallace, L.; Kearney, J.; Allen, R.W.; Van Ryswyk, K.; Judek, S.; Xu, X.; Wheeler, A. Factors Influencing Variability in the Infiltration of PM2.5 Mass and Its Components. Atmos. Environ. 2012, 61, 518–532. [Google Scholar] [CrossRef]
- Huang, L.; Hopke, P.K.; Zhao, W.; Li, M. Determinants on Ambient PM2.5 Infiltration in Nonheating Season for Urban Residences in Beijing: Building Characteristics, Interior Surface Coverings and Human Behavior. Atmos. Pollut. Res. 2015, 6, 1046–1054. [Google Scholar] [CrossRef]
- Hänel, G. The Properties of Atmospheric Aerosol Particles as Functions of the Relative Humidity at Thermodynamic Equilibrium with the Surrounding Moist Air. Adv. Geophys. 1976, 19, 73–188. [Google Scholar] [CrossRef]
- Hänel, G. Humidity Effects on Gravitational Settling and Brownian Diffusion of Atmospheric Aerosol Particles. Pure Appl. Geophys. 1977, 115, 775–797. [Google Scholar] [CrossRef]
- Dockery, D.W.; Spengler, J.D. Indoor-Outdoor Relationships of Respirable Sulfates and Particles. Atmos. Environ. 1981, 15, 335–343. [Google Scholar] [CrossRef]
- Li, W.; Montassier, N.; Hopke, P.K. A System to Measure the Hygroscopicity of Aerosol Particles. Aerosol Sci. Technol. 1992, 17, 25–35. [Google Scholar] [CrossRef]
- Jamriska, M.; Morawska, L. Quantitative Assessment of the Effect of Surface Deposition and Coagulation on the Dynamics of Submicrometer Particles Indoors. Aerosol Sci. Technol. 2003, 37, 425–436. [Google Scholar] [CrossRef]
- Faulkner, W.B.; Memarzadeh, F.; Riskowski, G.; Kalbasi, A.; Chang, A.C.Z. Effects of Air Exchange Rate, Particle Size and Injection Place on Particle Concentrations Within a Reduced-Scale Room. Build. Environ. 2015, 92, 246–255. [Google Scholar] [CrossRef]
- Wang, Y.; Chen, L.; Chen, R.; Tian, G.; Li, D.; Chen, C.; Ge, X.; Ge, G. Effect of Relative Humidity on the Deposition and Coagulation of Aerosolized SiO2 Nanoparticles. Atmos. Res. 2017, 194, 100–108. [Google Scholar] [CrossRef]
- Cui, S.; Cohen, M.; Stabat, P.; Marchio, D. CO2 Tracer Gas Concentration Decay Method for Measuring Air Change Rate. Build. Environ. 2015, 84, 162–169. [Google Scholar] [CrossRef]
- Kumar, P.; Robins, A.; Vardoulakis, S.; Britter, R. A Review of the Characteristics of Nanoparticles in the Urban Atmosphere and the Prospects for Developing Regulatory Controls. Atmos. Environ. 2010, 44, 5035–5052. [Google Scholar] [CrossRef]
- Li, W.; Hopke, P.K. Initial Size Distributions and Hygroscopicity of Indoor Combustion Aerosol Particles. Aerosol Sci. Technol. 1993, 19, 305–316. [Google Scholar] [CrossRef]
- Rissler, J.; Vestin, A.; Swietlicki, E.; Fisch, G.; Zhou, J.; Artaxo, P. Size Distribution and Hygroscopic Properties of Aerosol Particles from Dry-Season Biomass Burning in Amazonia. Atmos. Chem. Phys. 2006, 6, 471–491. [Google Scholar] [CrossRef]
- Chan, M.N.; Chan, C.K. Mass Transfer Effects in Hygroscopic Measurements of Aerosol Particles. Atmos. Chem. Phys. 2005, 5, 2703–2712. [Google Scholar] [CrossRef]
- Swietlicki, E.; Hansson, H.-C.; Hämeri, K.; Svenningsson, B.; Massling, A.; McFiggans, G.; McMurry, P.H.; Petäjä, T.; Tunved, P.; Gysel, M.; et al. Hygroscopic Properties of Submicrometer Atmospheric Aerosol Particles Measured with H-TDMA Instruments in Various Environments—A Review. Tellus B 2008, 60, 432–469. [Google Scholar] [CrossRef]
- Vu, T.V.; Ondracek, J.; Zdímal, V. Physical Properties and Lung Deposition of Particles Emitted from Five Major Indoor Sources. Air Qual. Atmos Health 2017, 10, 1–14. [Google Scholar] [CrossRef]
- Friedlander, S.K.; Wang, C.S. The Self-Preserving Size Distribution for Coagulation by Brownian Motion. J. Colloid Interface Sci. 1966, 22, 126–132. [Google Scholar] [CrossRef]


Disclaimer/Publisher’s Note: The statements, opinions and data contained in all publications are solely those of the individual author(s) and contributor(s) and not of MDPI and/or the editor(s). MDPI and/or the editor(s) disclaim responsibility for any injury to people or property resulting from any ideas, methods, instructions or products referred to in the content. |
© 2024 by the authors. Licensee MDPI, Basel, Switzerland. This article is an open access article distributed under the terms and conditions of the Creative Commons Attribution (CC BY) license (https://creativecommons.org/licenses/by/4.0/).