Abstract
Studying the energy use behavior of occupants is crucial for accurately predicting building energy consumption. However, few studies have considered the impact of occupant behaviors on energy consumption in university dormitories. The objective of this study is to establish an agent-based model of energy consumption for university dormitories based on energy use behavior. The dormitories of a typical university in Sichuan, China, were subdivided into three clusters using a two-step cluster analysis. Subsequently, the energy use behaviors of occupants in each type of dormitory were characterized to establish a stochastic energy use behavior model. On the basis of the above, NETLOGO was used to construct an agent-based model for dormitories’ energy consumption to dynamically simulate energy use behavior. The accuracy of the model was verified by comparing the simulated values with the measured data. Finally, a building-energy-friendly retrofit scheme was proposed, and it was found that the optimized dormitory reduced energy consumption by 16.07%. Therefore, the results can provide information support for energy-saving decisions during the early design and retrofit phases of buildings. With the popularity of centralized supply, the research methodology may provide an extensive reference for energy management policies and sustainable strategies in the building sector.
1. Introduction
More than 30% of primary energy is consumed in the building sector [1]. As an important element of society, universities, with large building volumes and high staff densities, contribute to about 8% of total social energy consumption [2]. However, current studies mainly focus on residential and office buildings [3,4], and research on the energy consumption of universities is limited. Studies show that the per capita energy consumption of Chinese universities is three times higher than the national per capita energy consumption. Moreover, the energy consumption of dormitories accounts for 18 percent of the total energy consumption of school buildings. Therefore, there is a strong energy-saving potential for Chinese universities’ dormitories [5]. Occupant energy use behaviors have a significant impact on building energy consumption. Research has revealed that energy consumption per capita varies up to 14 times in the same building due to the differences in energy use behavior [6]. University dormitories in China follow the rule of “multiple occupants per room”. The interaction of students with the environment, appliances, and other students is much more complex. The study of Poirazis et al. [7] demonstrated that ignoring the difference in energy use patterns in the early stage of building energy conservation design and renovation may result in greater energy consumption. However, few studies have considered the potential impact of students’ stochastic energy use behaviors on energy consumption in university dormitories.
Energy use behavior generally refers to the usage of energy-consuming appliances in a building, and it is related to the occupant’s movement state and indoor environment [8]. Many researchers have recognized the importance of occupant behavior for building energy consumption [9,10,11]. The randomness, regularity, and spatio-temporality of the movement are described by studies such that the dynamic decision-making behavior of occupants can be represented via energy simulation. Hong et al. (2015) studied energy-related occupant behavior in buildings and proposed a framework for standardized representation of occupant behavior in buildings [12]. Fixed schedules are currently the most widely used method for locating occupant motion in building energy simulation, i.e., the position of the occupant at each moment is set according to a schedule [13]. However, this method cannot capture the randomization and individual differences between occupants. Statistical methods based on data such as the Markov-Chain technique, Monte Carlo method, Bernoulli process, and survival analysis are applied in simulations to describe the stochastic motion of the occupants [14,15,16]. However, these models are only suitable for movement descriptions of simple events and are not applicable to the applications involving multiple types of events in dormitory buildings [17,18,19].
When it comes to devices controlled by multiple types of events, air conditioners, and lighting are the main contributors to energy consumption [20,21]. The simulation is performed by the functional relationship between the environmental factors (i.e., indoor temperature [22,23] and illumination [24,25]) and energy use behaviors, mainly including the statistical regression model. The simulation model was constructed based on data statistics and probabilistic fitting. An operation model of the device was established to characterize the different behaviors, including the number of times the appliance switched on per day, and the probability distribution function for the duration [26,27,28]. Researchers developed a personalized stochastic behavioral model for air conditioners that combined measurement data, data analysis, and logistic regression [29,30]. However, stochastic models based on state descriptions are unable to examine individual energy use behavior [31]. Therefore, there is a need to accurately describe behavior-based differences in the energy use needs of individual university students.
Benefiting from the development of computer technology, agent-based modeling (ABM) has been developed to address the behavior of occupant’s complex interaction and randomness, and it can simulate the dynamic interaction of occupants in a building system. Liao et al. (2010) conducted the first study to apply the ABM to simulate the behavior of individual occupants in a building [32]. Ding et al. (2019) established an agent-based energy consumption simulation model based on student behavior and explored the energy-saving effect of four different strategy scenarios [33]. Azar et al. (2012) developed a commercial building energy model by considering the interactions of occupant energy use behavior with the indoor environment and with each other [34]. Kashif et al. (2013) proposed a four-step simulation method to assess the impact of occupant behavior on energy consumption [35]. Jia et al. developed a novel ABM to explore occupant behaviors in commercial buildings [36] and investigated the impact of occupant behavior information on building performance simulation [37]. In summary, ABM has become one of the most powerful approaches for studying the impact of occupant behaviors on building performance simulation. Therefore, ABM was selected for this simulation research.
There are two main applications of occupant behavior studies in building performance simulation. The first application is to reduce the gap between the simulated energy consumption and actual values [38,39]. The second is to provide useful information for retrofit solutions of building energy conservation to replace the original design [40,41]. These findings support the idea that the occupant’s behavioral pattern is an important factor in evaluating building design and retrofit design [20]. Therefore, the impact of occupant behavior on improving the energy performance of buildings should be fully considered in the decision-making process for the schematic design and retrofit design of buildings.
There are still some obstacles in the current study. First of all, although occupants may exhibit different energy use features with time, current energy estimation tools are predicated on behavioral constancy [34,42,43]. A study conducted by Clevenger and Haymaker [44] quantified the impact of different occupant behaviors on building energy use. Hoes et al. (2009) evaluated the impact of user behavior on building performance [45]. The researchers assumed that all occupants have similar energy consumption patterns. They did not consider different energy use behaviors. In the actual situation, occupants will adjust their behaviors to interact with their surroundings and devices. Moreover, these interactions and behaviors are dynamically autonomous for different purposes. The changes in these behaviors ultimately affect the prediction of building energy consumption. Second, existing studies have focused on the simulation of residential and office or commercial buildings [36,37]. Chen et al. (2020) developed the simulation method of residential energy use behavior [13]. Azar et al. [34] and Jia et al. [36,37] investigated the relationship between occupant behavior and building simulation performance. However, fewer studies have been conducted on the energy use behavior of university dormitories. Unlike residential buildings, the occupants of university dormitories come from different regions and exhibit different equipment usage habits. Therefore, it is necessary to study the features of students’ energy use behavior as the basic work for dormitory building simulations. Given these current problems, this paper focused on the following areas:
- (1)
- to understand the underlying patterns of students’ energy use behavior;
- (2)
- to establish an agent-based model that can simulate the energy consumption in university dormitories based on the energy use behavior occurrence rules.
2. Research Method
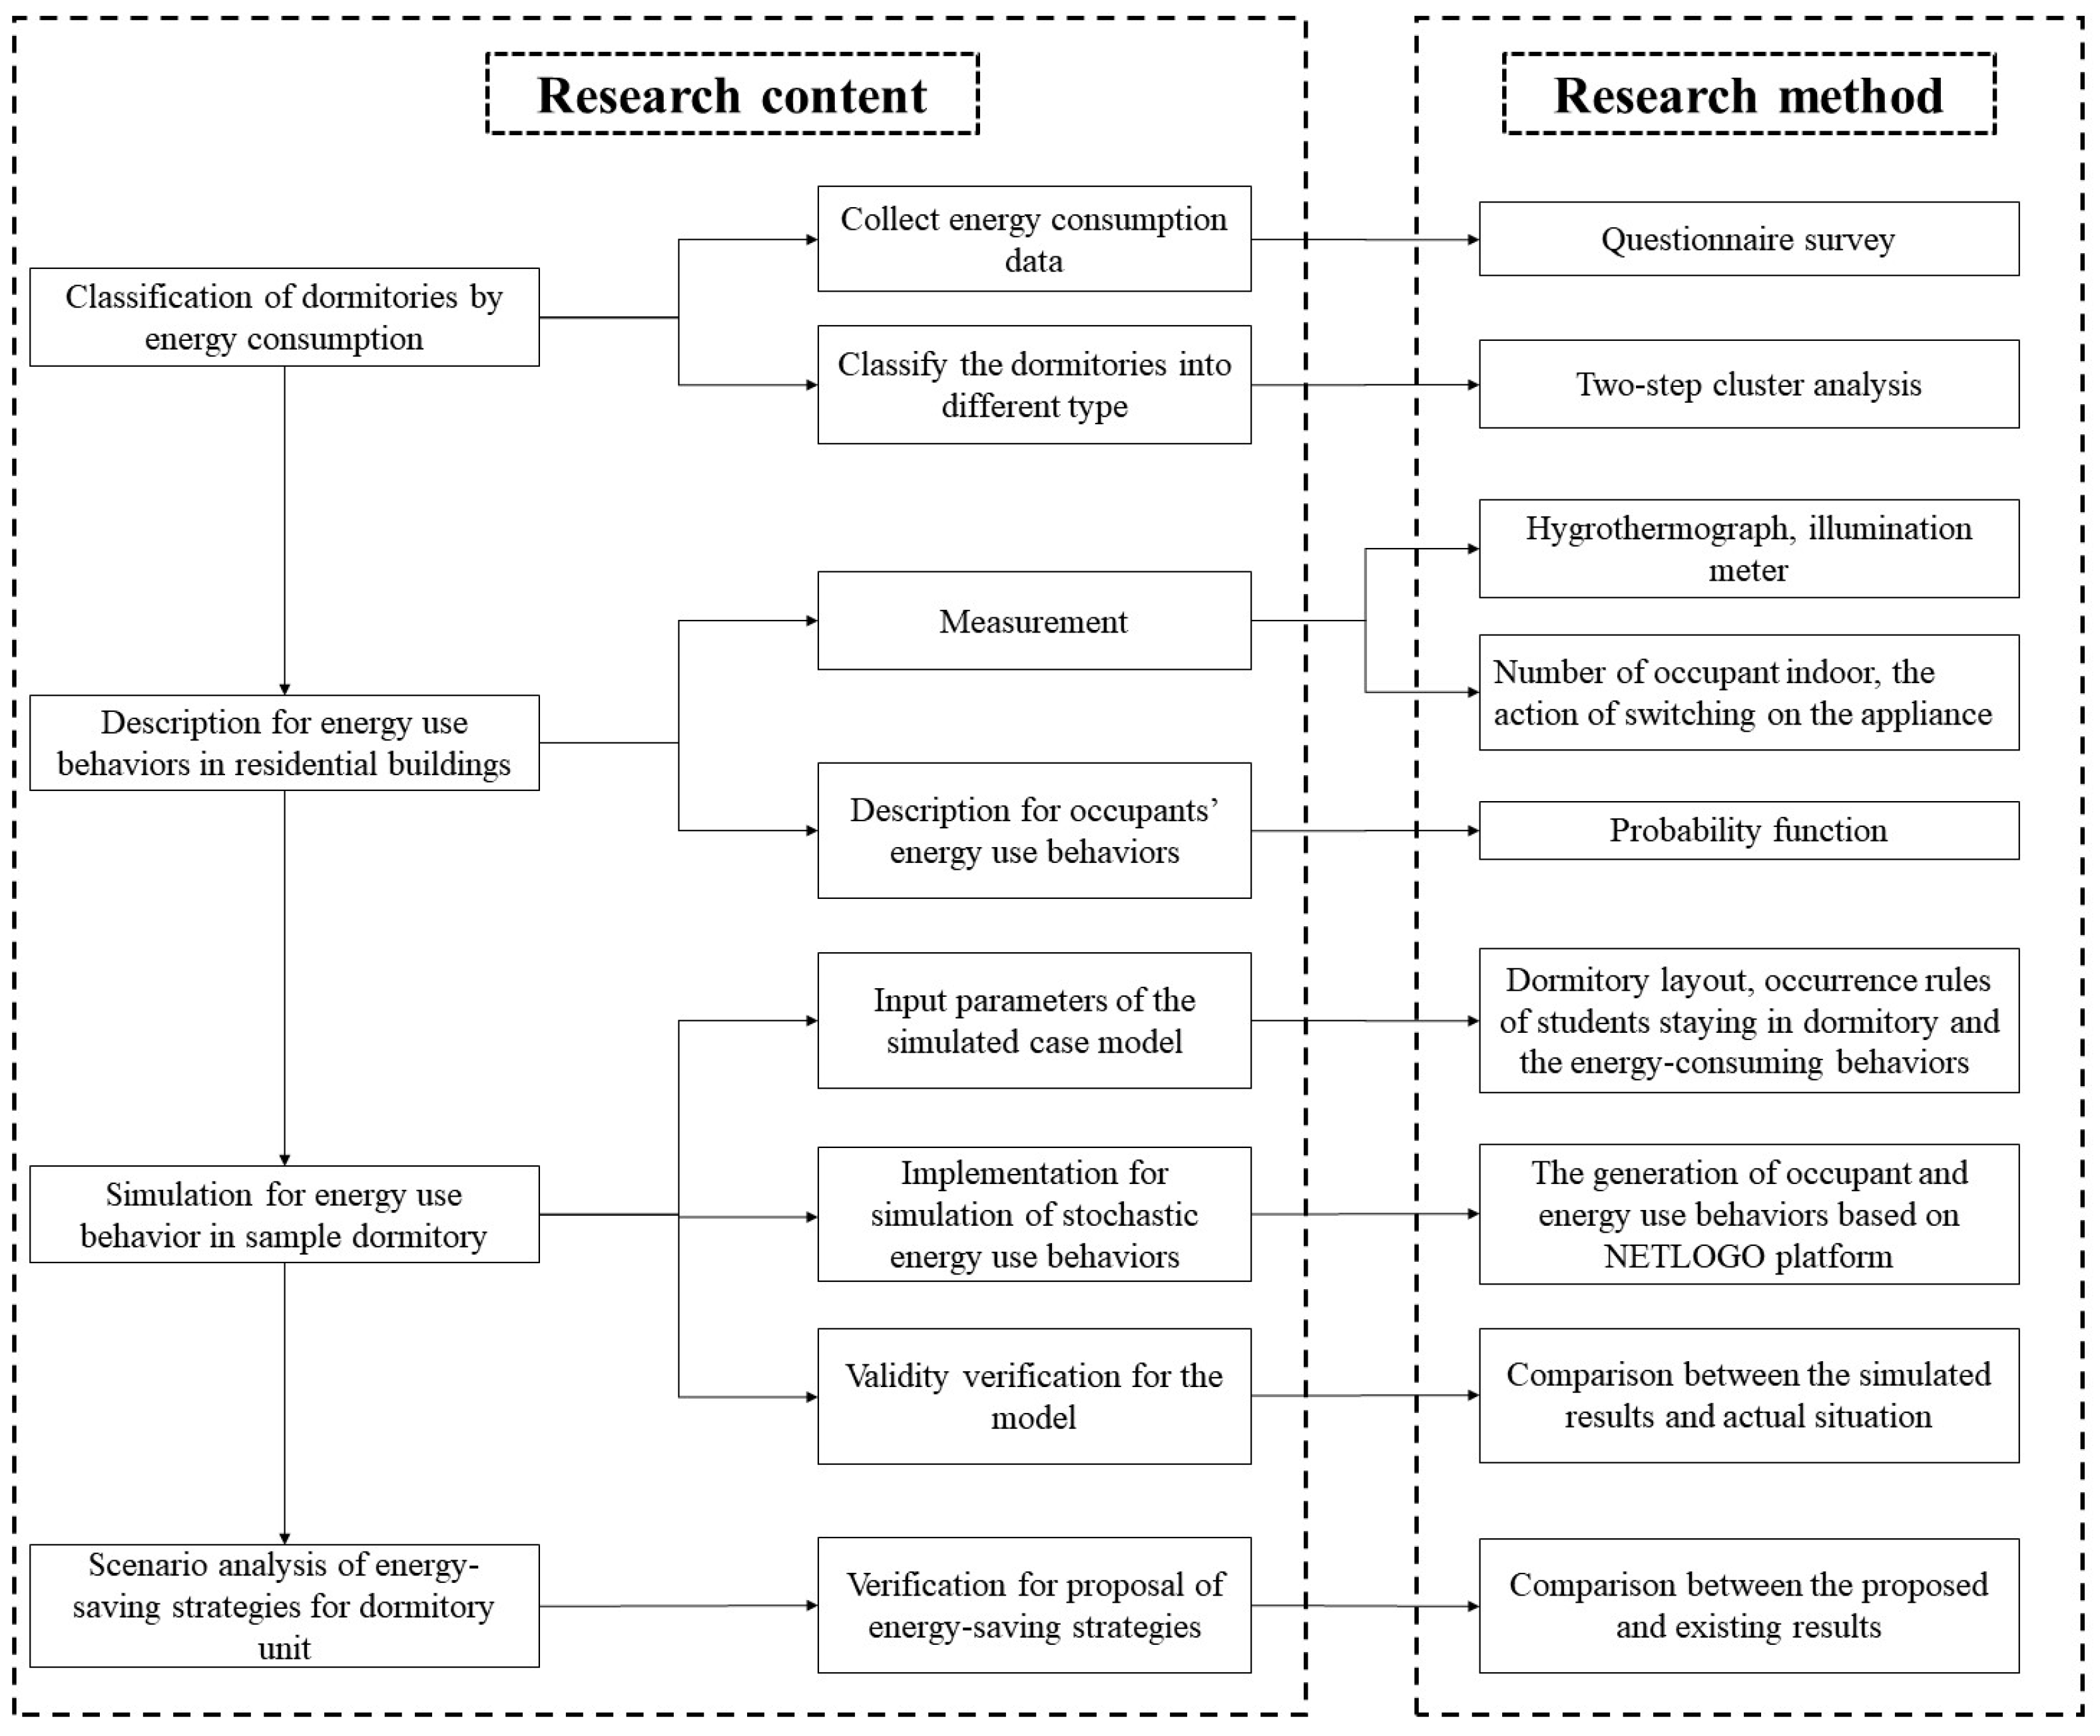
The research technical route is shown as Figure 1. First of all, we investigated the energy consumption of university dormitories via questionnaires. The dormitories were subdivided into different clusters using a two-step cluster analysis based on the duration of operation and the energy consumption of electrical appliances. Subsequently, a method of describing energy use behaviors of different types of dormitories was proposed by recording students’ energy use behaviors. The description was expressed as a probability function, including occupancy rates and the behaviors of turning on the electrical appliances in different seasons. After that, an agent-based simulation model was established to visually simulate students’ energy use behavior in NETLOGO. The accuracy of the model was verified by comparing the agent’s energy use behavior between the simulation pattern and the surveyed situation and comparing the average energy consumption between the simulation values and the surveyed results. Finally, we proposed a renovation optimization design for the student dormitory building. The reasonableness of the proposed renovation design was verified by comparing the energy consumption of the dormitory between the existing and proposed dormitory design.
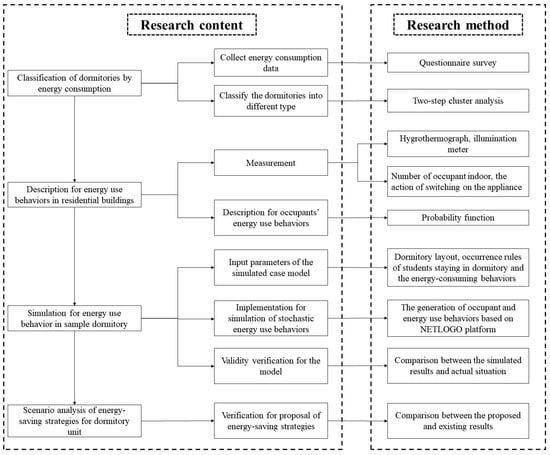
Figure 1.
The research technical route.
3. Classification of Dormitory Status via Energy Use Behavior
3.1. Questionnaire Data
Chen et al. (2015) showed that there are significant differences in the characteristics of energy-using behaviors and energy consumption among different types of dormitories [46]. Therefore, it is necessary to classify the dormitories and study the students’ behaviors in different types of dormitories separately. In this study, a random sampling questionnaire survey was conducted in 2022 at Southwest Jiaotong University in Chengdu (Chengdu, China) to collect data on energy consumption, energy use behaviors, and duration in different seasons. These data can be used for the subsequent cluster analysis of energy consumption in dormitories. The questionnaires were distributed anonymously without any communication between participants to eliminate expectation bias. Participants were randomly selected from Chengdu universities. The reliability of the questionnaire ranged from 0.7 to 0.9, which was tested by Cronbach’s alpha coefficient. A total of 422 questionnaires were distributed, and 388 effective questionnaires were collected, with an effective rate of 92%. There were 125, 131, and 132 questionnaires for summer (in June, July, and August), winter (in December, January, and February), and transition seasons (from March to May and from September to November), respectively.
3.2. Cluster Analysis of Occupants’ Energy Consumption-Related Behaviors
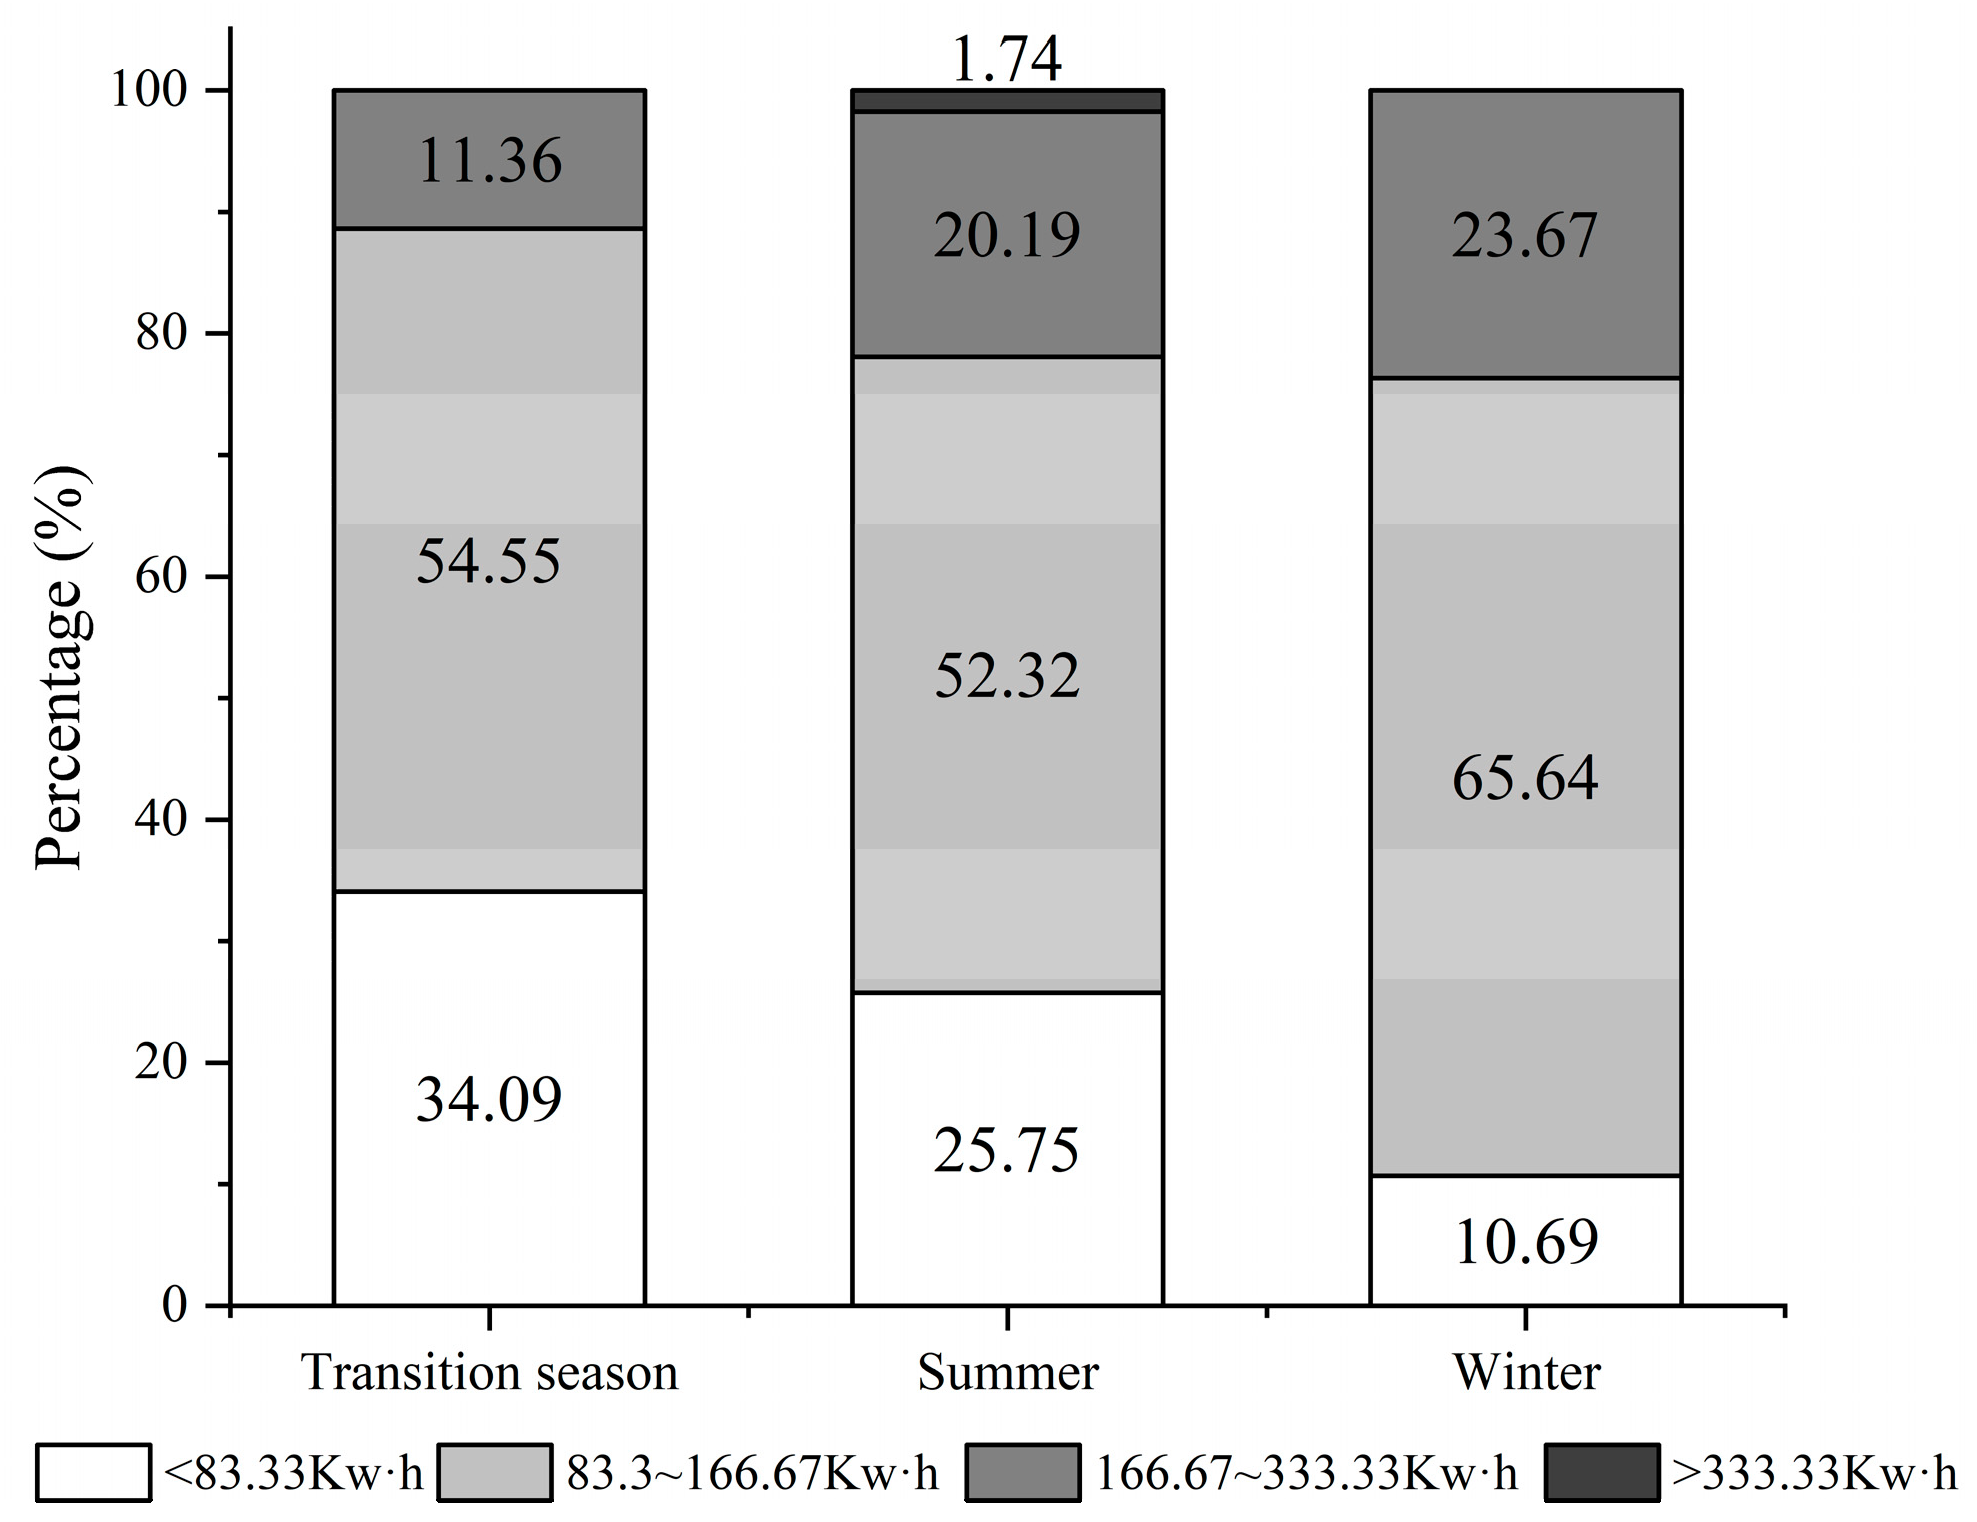
Figure 2 displays the percentage of the monthly average energy consumption of student dormitories. The percentages of monthly average energy consumption higher than 166.67 kWh are 11.36%, 21.93%, and 23.67% in the transition season, summer, and winter, respectively. This indicates that it is difficult for the indoor environment to meet the needs of daily activities in summer and winter. The building energy consumption will increase further with the use of devices. According to the questionnaire, the energy-consuming appliances in university dormitories mainly include air conditioner, lighting, and computers.
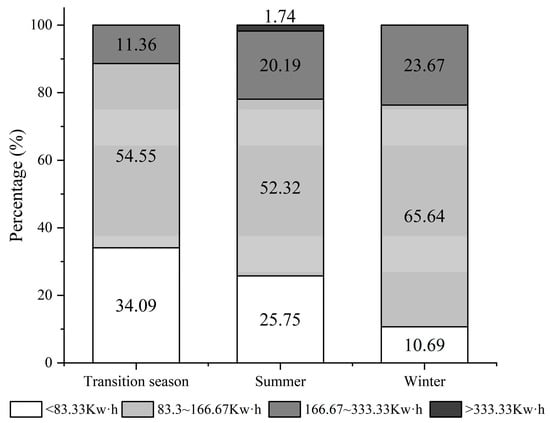
Figure 2.
The percentage of monthly mean energy consumption in different seasons.
A two-step cluster can subdivide occupant energy-consumption-related behaviors into multiple clusters to characterize energy use [47,48]. This is a commonly used method in field studies to subdivide a set of observations into subsets where identical clusters have high similarity [49]. Therefore, a two-step cluster analysis was used to cluster the dormitories in this study.
The result reveals that when the dormitories are divided into three groups, the differences in the dormitories between different clusters are apparent, and the energy use features of dormitories within the same cluster are similar. The results of the cluster analysis are shown in Table 1. The three clusters are thrifty group (Cluster A), moderate group (Cluster B), and luxury group (Cluster C). The usage time of air conditioners for Cluster A is less than 5 h a day in hot and humid summers, and air conditioners are rarely used for heating in winter. In terms of Cluster B, the air conditioner is operated in summer and winter for approximately 5–8 h per day, and the duration of light use is longer than that in Cluster A. While Cluster C relies heavily on air conditioning, the usage time of air conditioner may be up to 8 h and 12 h per day in winter and summer, respectively. The energy consumption of Cluster C is 38.67% and 88.48% higher than that of Cluster A in summer and winter, respectively. This finding is similar to the results of a study carried out in Shanghai [46], which demonstrated that the three clusters vary greatly in terms of the usage time of air conditioners. Different types of dormitories exhibit different electricity usage features in different seasons. Therefore, it is necessary to conduct a cluster analysis to establish the energy usage patterns for different clusters.

Table 1.
Results of the cluster analysis of student dormitories.
4. Case Study to Simulate Energy Use Behaviors in Student Residences
Southwest Jiaotong University (in Chengdu city), located in western China, was selected as the study object. According to the Chinese Building Thermal Design Code [50], Chengdu belongs to the hot summer and cold winter zone. An average dry bulb temperature (values read on a dry-bulb temperature gauge exposed to air without direct sunlight) of 32.4 °C and 1.3 °C are recorded for the hottest month in summer and the coldest month in winter, respectively. Therefore, the region of Southwest Jiaotong University has a strong demand for building heating and refrigeration. In this section, six typical dormitories of Southwest Jiaotong University were selected to measure the indoor environment and record the state of operation for electrical appliances. According to the results of students’ rules of movement and the occurrence pattern of energy use behavior, the energy consumption model of the dormitory was built using NETLOGO software (version 6.2.0). NETLOGO is a system engineering software for simulating complex systems that change with time. It can simulate the behavior of the agents in a chronological order and the rules of operation. The agents interact with each other and the environment, thus contributing to the progress of the whole system [51]. In this study, NETLOGO performed agents’ energy use behavior and ultimately exported the operation status of different appliances with time.
4.1. Data Collection
A data collection method of using smart devices and a paper-based survey was used to acquire actual environment parameters and behavior records [36]. We chose two dormitories of each cluster for comprehensiveness, and gender was one of the considerations in this study. Finally, six typical dormitories were selected as the objects for the preliminary survey.
To analyze the variability of energy use behavior on weekends and weekdays, we conducted a total of six experiments in July, October, and December, respectively. Smart devices (e.g., hygrothermographs and illuminance meters) were placed in dormitories to record environmental parameters, i.e., the indoor temperature (°C) and illuminance (lux). For occupant behavior information, a paper-based survey sheet was distributed to the dormitory occupants. The survey sheet included 1 h consecutively from 0:00 to 24:00 in each row and the number of students in the dormitory and the open/close statuses for air conditioners, lights, and computers. The occupants were asked to complete the survey sheet manually. Additionally, they need to make an “x” in the corresponding box whenever he/she conducts a behavior at a certain time. Based on the regression analysis, the probability functions for the occurrence of different types of behaviors for summer, transition season, and winter on weekends and weekdays were constructed. The validation of the model was conducted by comparing the energy use behavior and energy consumption between the observed data and the simulation results.
4.2. Construction of the Physical Model
The “patch” and “turtle” were created in NETLOGO representing the dormitory and the interaction agent, respectively. The interactive agents were the students and appliances in the model. The student staying in the room would generate data according to the occurrence rules and interaction with the appliances by updating the operation status in the simulation.
According to the results of the surveys and the literature, three types of basic equipment including lights, air conditioners, and computers, which account for about 85–90% of the total dormitory energy consumption, were considered in this study [52,53]. It is worth noting that air conditioners and computers, connected to the power supply without running, will also generate a certain amount of power, i.e., standby power. Lights do not consume energy when they are not running. The standby power of an air conditioner is 2.8 W, which was used in the energy consumption simulation. The dimensions of the dormitory floor plan are 3.6 m × 7.2 m, and several visualized electrical components were created based on the sample dormitory. The nameplate power demands of the air conditioner, light, and computer is 2000 W, 40 W, and 50 W, respectively. The numbers of air conditioners, lights, and computers for a typical university dorm are 1, 2, and 4, respectively.
4.3. Input in Simulation
4.3.1. The Rules for Students Staying in a Dormitory
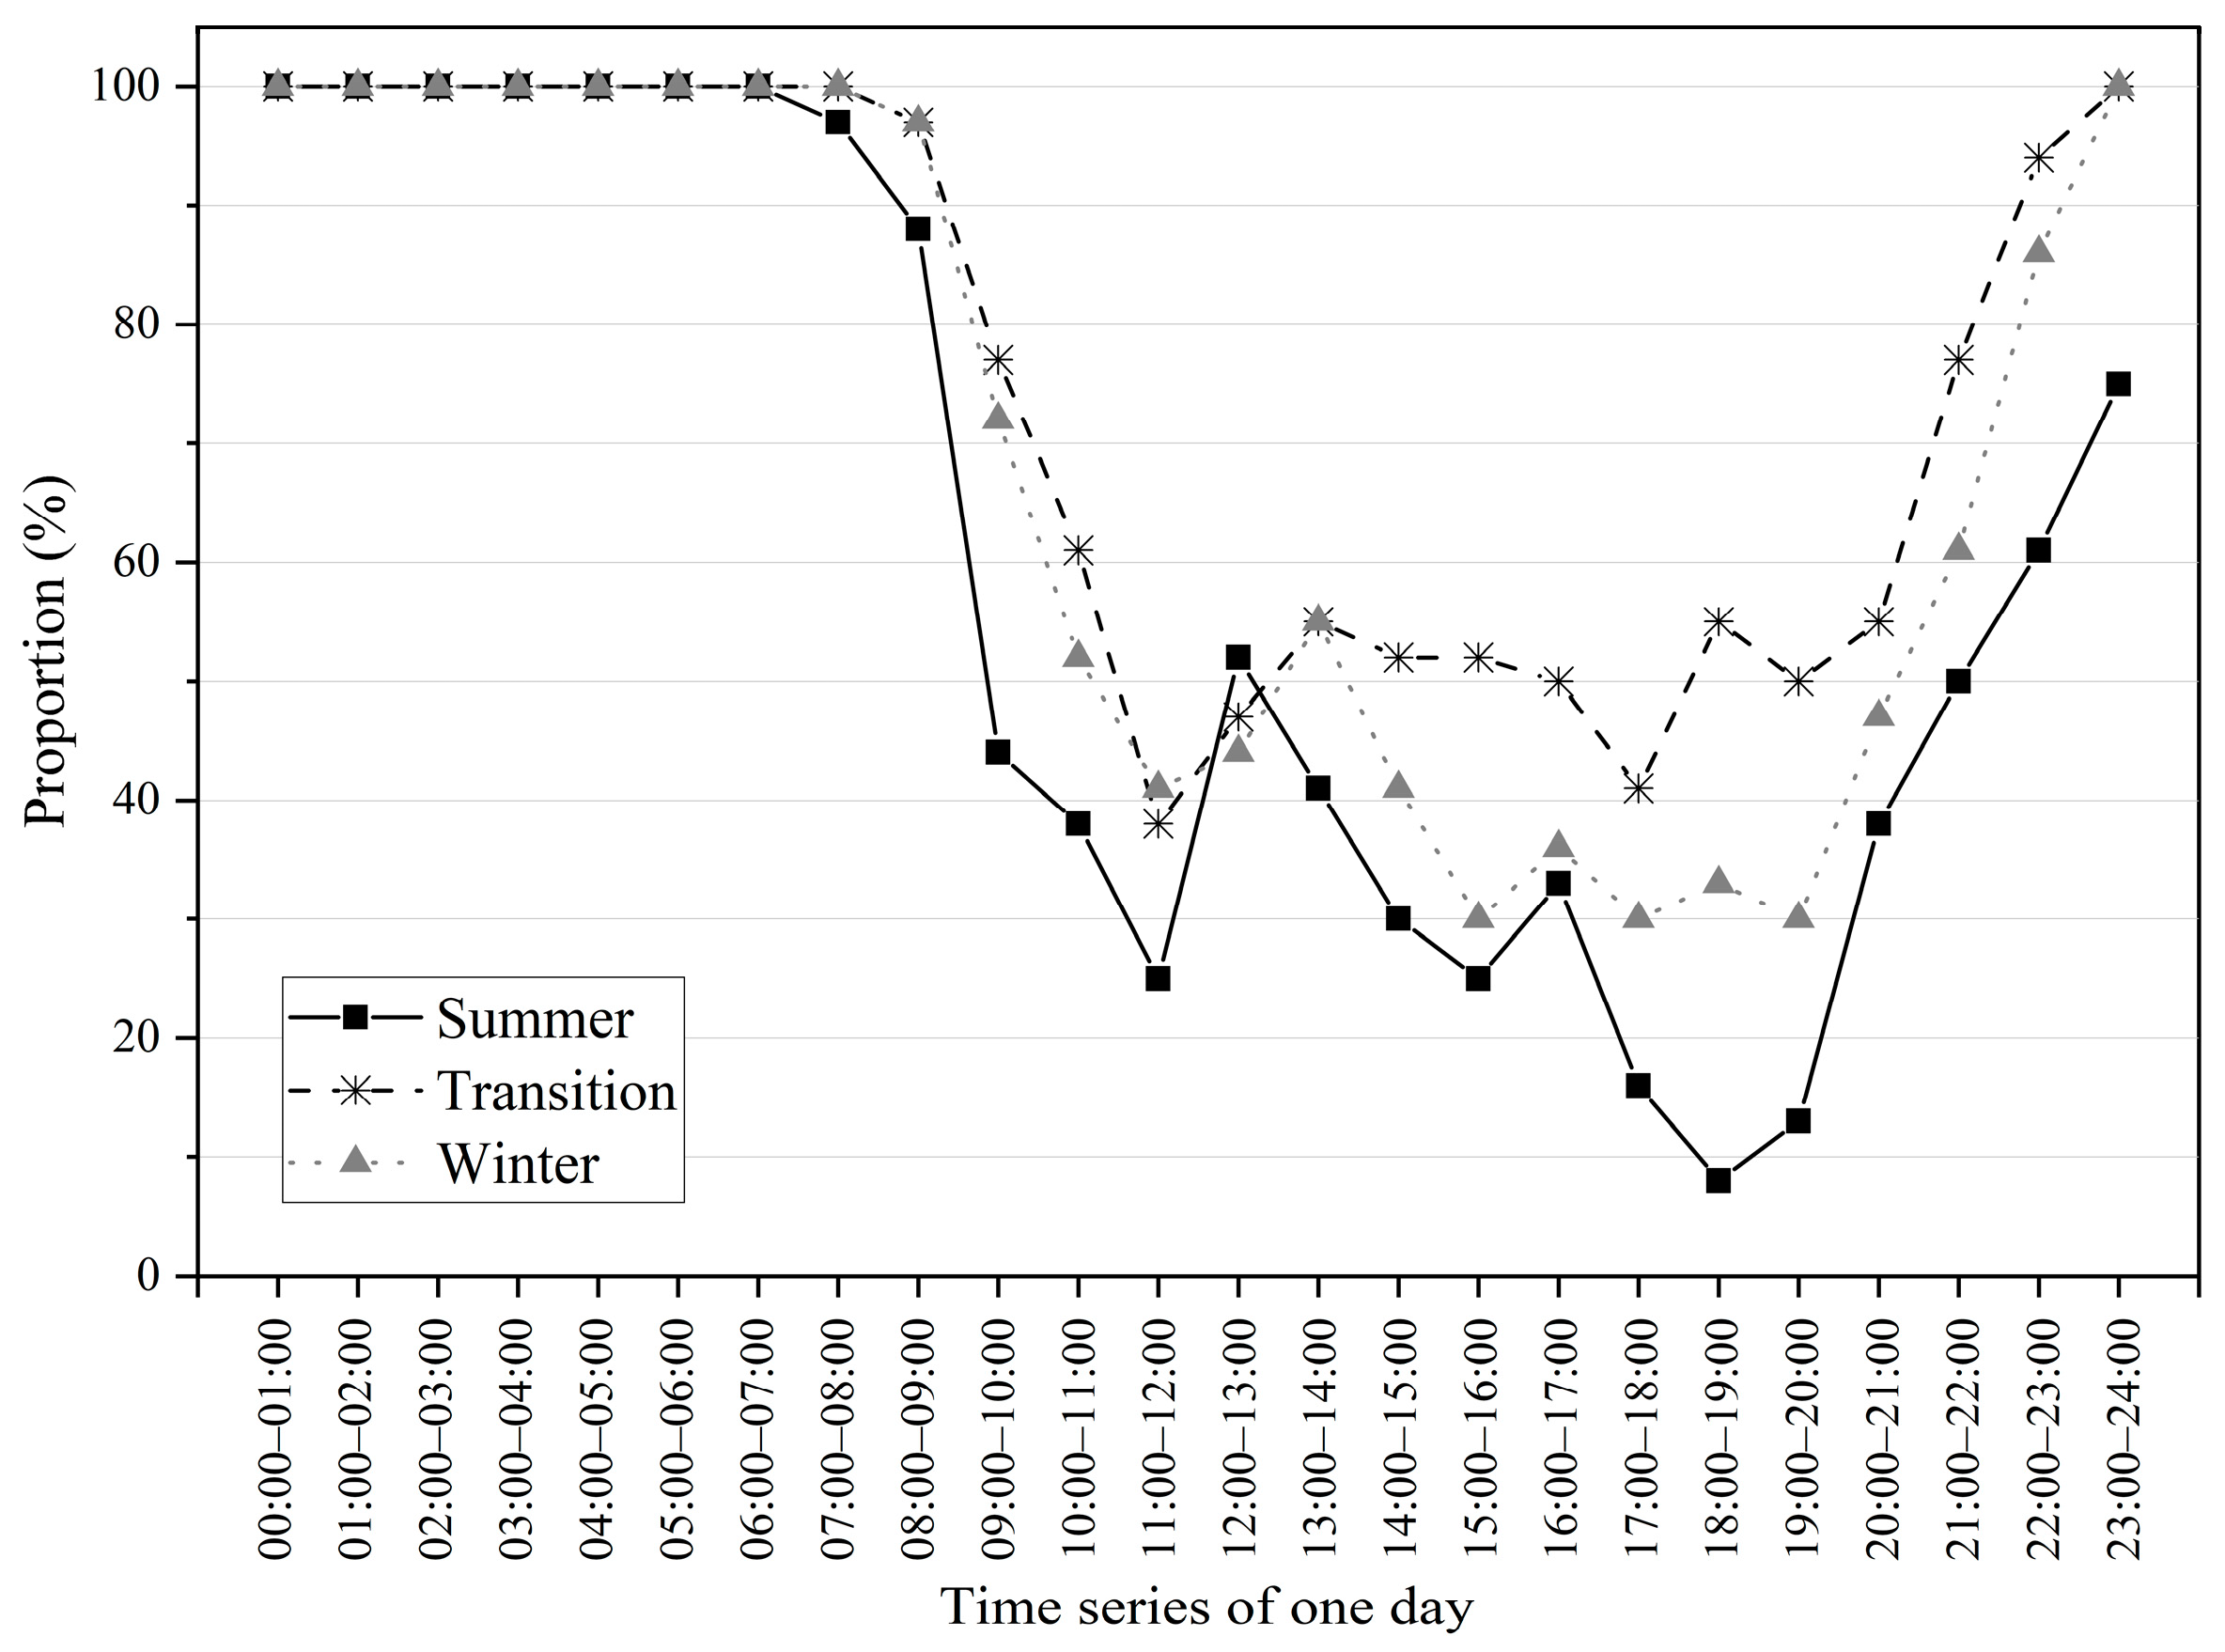
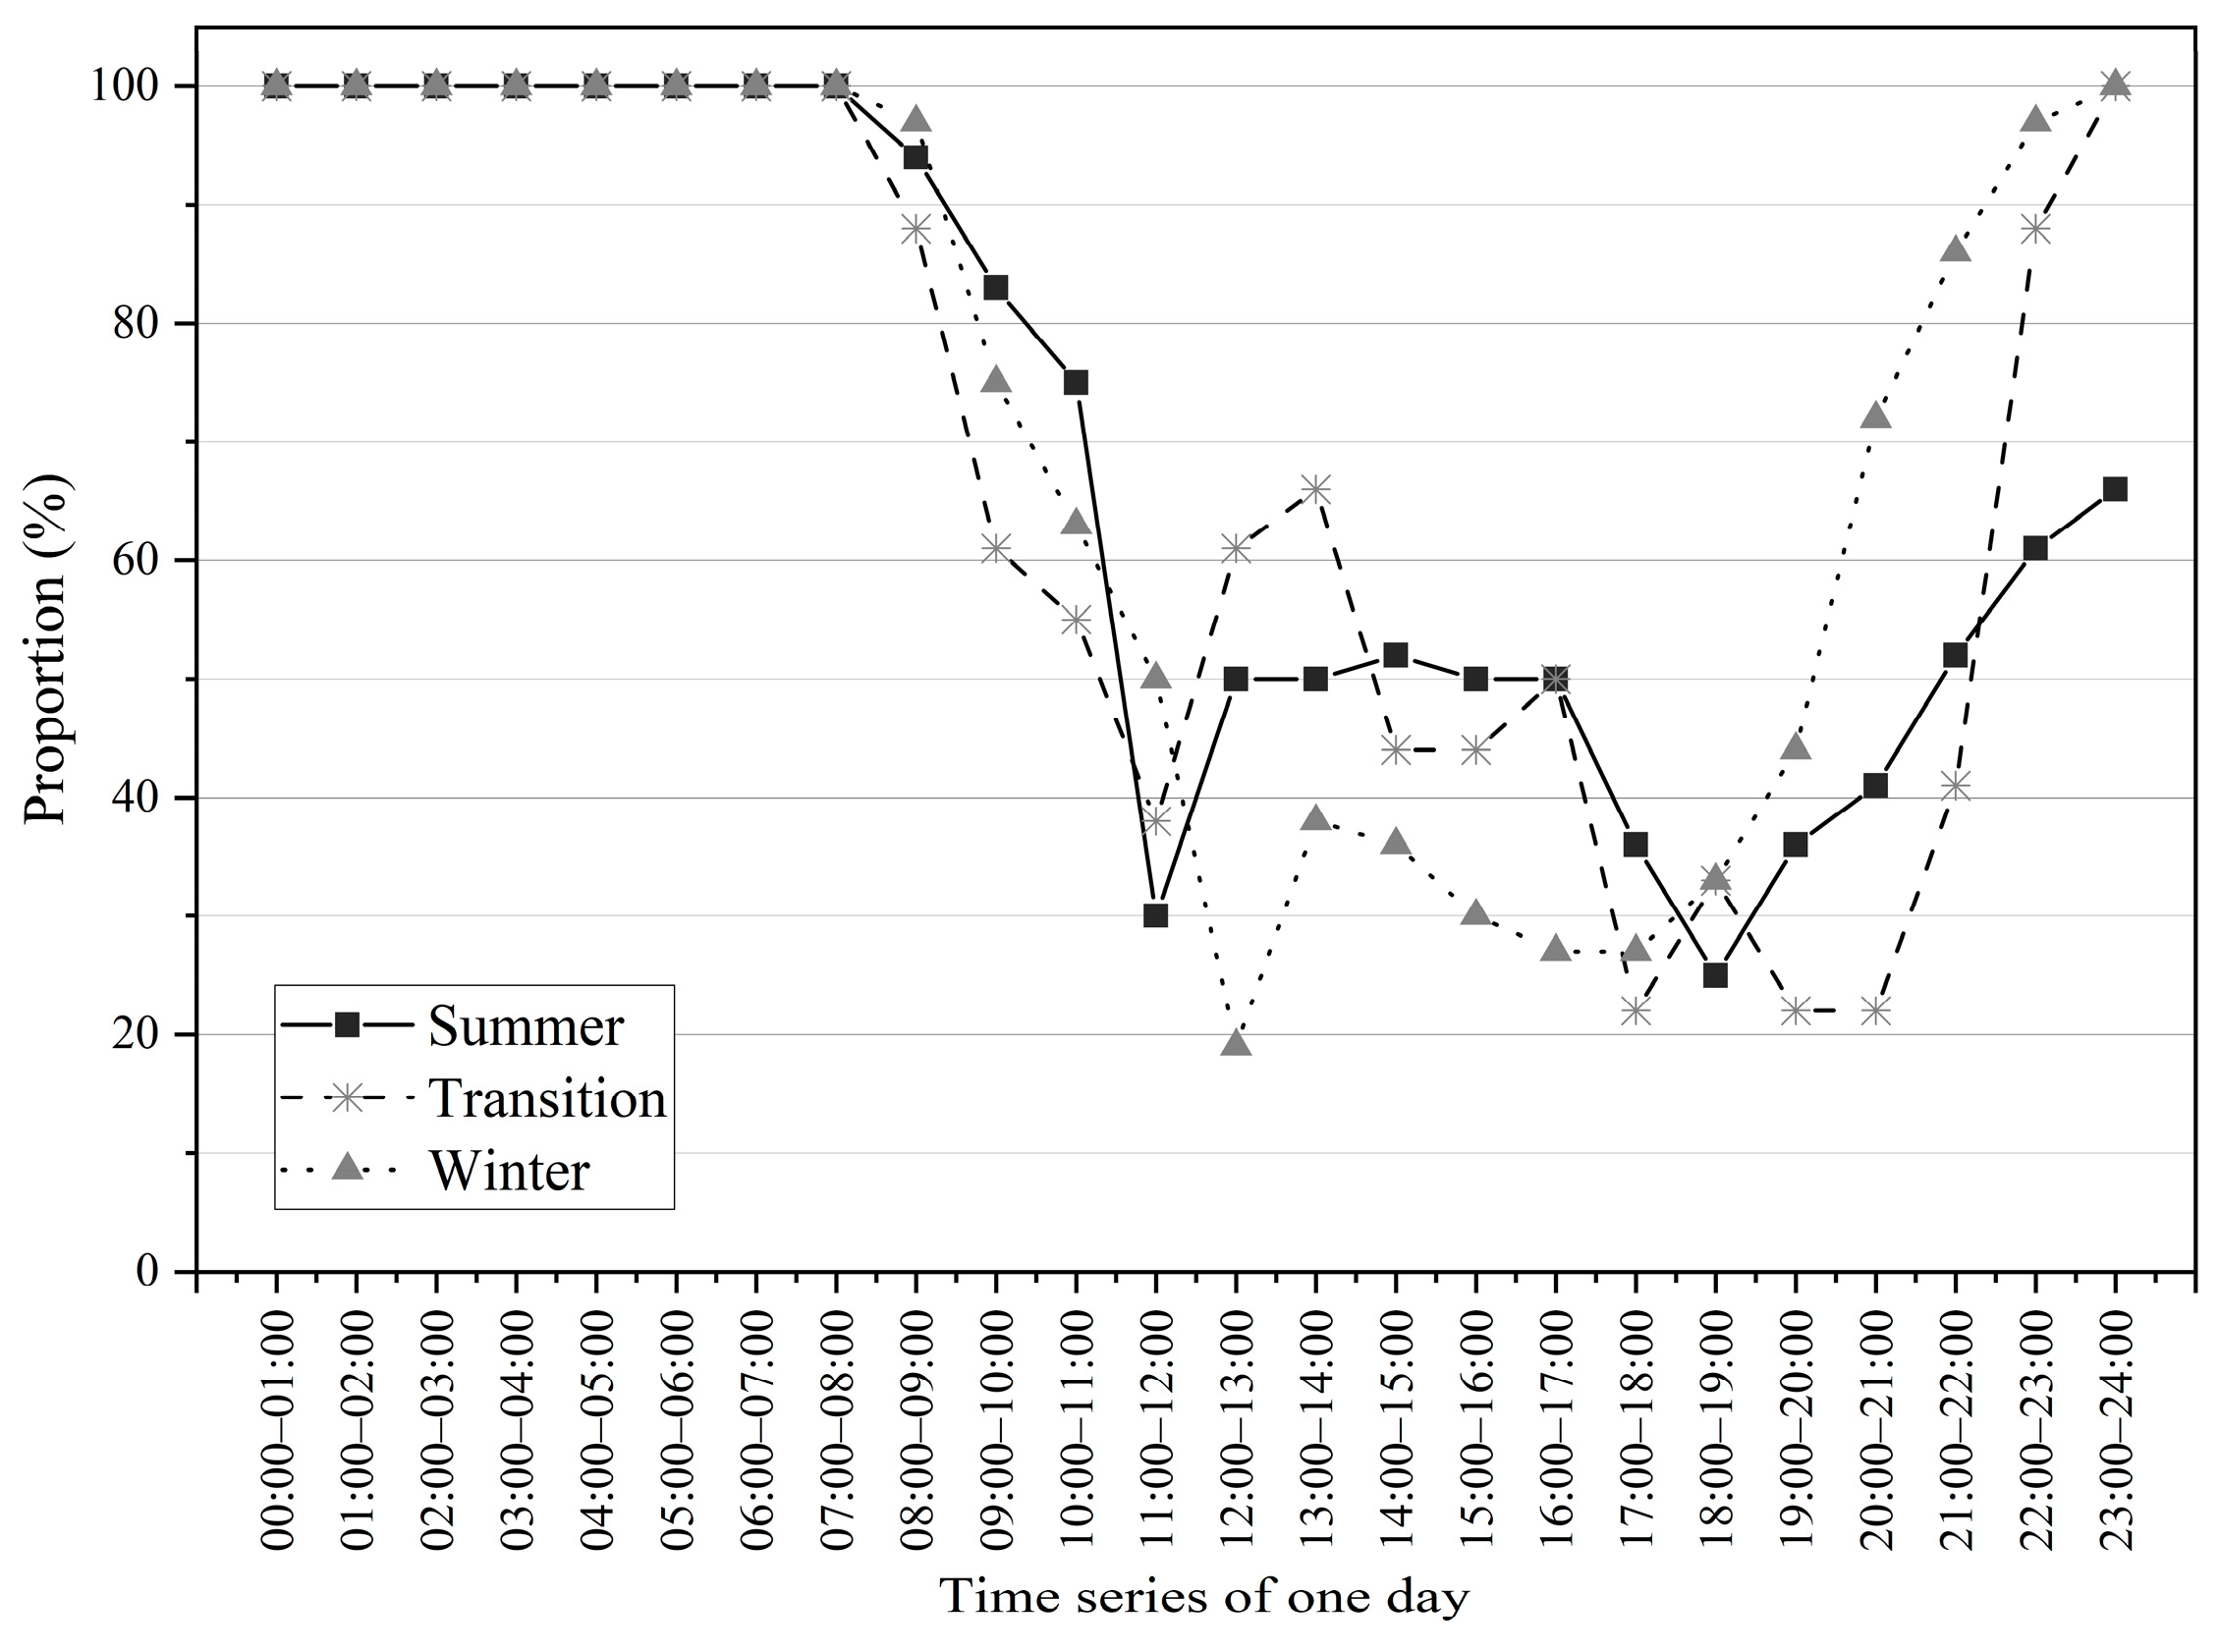
During weekdays, the probability of occupancy is affected by the curriculum. As shown in Figure 3, almost all students are in the dormitory between 0:00 and 8:00. However, there is a significant decrease in the occupancy rate due to the curriculum between 9:00 and 12:00. The students return to dormitories for breaks after lunch. The occupancy rates are the lowest from 17:00 to 19:00 as most students choose to go out for dinner. After that, the students gradually return to the dormitory. It is worth noting that students are likely to go out in the evening, especially in summer. The occupancy rate is only 50% in summer, even at 22:00. Students would spend a long period of time going out for socialization due to the cooler evening. Figure 4 shows the result of occupant rates on weekends. Students spend a significant amount of time in the dormitory on weekends studying or playing games, and the occupancy rate briefly decreases at lunch and dinner time. The probability of student activity in the room is shown in Table 2. The activity is related to the schedule. For example, the student is sleeping between 0: 00 and 7:00, the greatest probability of the student activity in this period of time is lying down. It is obvious that students are likely to sit in the daytime, and they seldom stand for communication.

Figure 3.
Proportion of students who stayed in dormitories on weekdays.

Figure 4.
Proportion of students who stayed in dormitories on weekends.
Table 2.
The probability of activity in the room.
There are four occupants in the simulated dormitory. The simulation process for occupants in the dormitory depends on Section 4.2. The hour-by-hour probabilities of students being in the room are shown in Figure 3 and Figure 4. NETLOGO stochastically simulates the state of occupants based on the proportion of students who stayed in dormitories on weekdays or weekends during the summer, transition season, and winter. The duration of simulation is one year with 1 h time step size.
4.3.2. The Occurrence Rules of Energy-Consuming Behaviors
According to the survey, the air conditioners were rarely used for Cluster A (thrifty group), even in summer or winter. Therefore, the air conditioning usage patterns of Cluster B (moderate group) and Cluster C (luxury group) are summarized in this section. In terms of Cluster A, the usage patterns in NETLOGO software were “part-time” and “part-space”.
The usage patterns of air conditioners are listed in Table 3. The control logic for turning on air conditioners was environment-related, while the logic for switching off air conditioners was event-related. The indoor temperature at which the air conditioner switched on was recorded, and the fitting was conducted to observe the relationship between the probability and indoor temperature. For the probability function, the R2 of over 0.9 was achieved. The corresponding probability functions can be used to simulate different clusters of students switching on their air conditioners in different seasons. For example, students tended to switch off the appliances when the last one leaves the room, which was a key indicator leading to switching off the air conditioners. Similarly, the lighting behavior use was monitored in sample dormitories. In terms of the illumination appliance, the probability functions of switching on the lighting were fitted (Table 4). The control logic for switching off the lighting was event-related, which was the occurrence of the last one leaving the room or sleeping.
Table 3.
The usage patterns of air conditioners.
Table 4.
The usage patterns of illumination appliances.
According to the measurements, the usage patterns of computers do not show significant differences among different seasons, but differences are seen between weekdays and weekends (as shown in Table 5). To be specific, the probability of students operating the computer is much greater on weekends than on weekdays. Students are more likely to operate the computer in the afternoon or at night due to their living habits at the university. In terms of operation duration (as shown in Table 6), the average duration of computer use on weekdays is longer than that on weekends, as they need to do homework for a long time.
Table 5.
The probability of computer switching on.
Table 6.
The probability of computer operation duration.
It should be noted that one of the prerequisites for appliance control is the presence of students in the room, so the indoor rate is one of the key indicators affecting electrical control in a dormitory. For air conditioning and lighting, the prerequisite for controlling the appliance is at least one person in the dormitory. As for computers, in addition to the number of occupants in the dormitory, it is necessary to take time into consideration before controlling the appliance. In addition to the fact that the control logic of the energy-using device is affected by the temperature and light environment, the last student would turn off the electrical switch before leaving the dormitory. Therefore, the appliances are switched off regardless of changes in the indoor environment when there is no one in the dormitory.
It is necessary to consider other people’s opinions when controlling public equipment, such as in a collection of college dormitories, which is expressed in the form of the majority rule. For the simulation, two students agree to regulate the appliances at least when the number of indoor students is three or four. One student agrees to regulate the appliances at least when the number of indoor students is two. The appliances are controlled by his/her own will when he/she is the only one in the dormitory [54]. The probability of controlling logic is shown in Table 7.
Table 7.
Probability of an action occurring with different numbers of occupants in dormitory.
The simulation process is determined by a combination of the indoor rate described in Section 4.3.1, and the energy control behavior is described in Section 4.3.2. In this study, the duration is one year with a total of 8760 h, and the time step size is one hour. The indoor environmental variables (i.e., indoor temperature and indoor illumination) should be initialized. Autodesk Ecotect Analysis v5.2 software is used for the building thermal environment analysis (e.g., time-to-time temperature analysis of buildings) and building light environment analysis [55]. The software focuses on sustainable building design and analysis and is widely used in similar studies [56]. Therefore, Autodesk Ecotect Analysis software is selected to simulate the indoor environment for one year, and the values of indoor temperature and indoor illuminance of the dormitory are obtained. During the simulation, the default indoor temperature and indoor illuminance for each time step are the output values of the ECOTECT. The indoor environment values change to the standard values set in NETLOGO as soon as the appliances are switched on and, then, revert to the output values of the ECOTECT software (version 5.2) when the devices are switched off.
4.4. Simulation Results and Model Validation
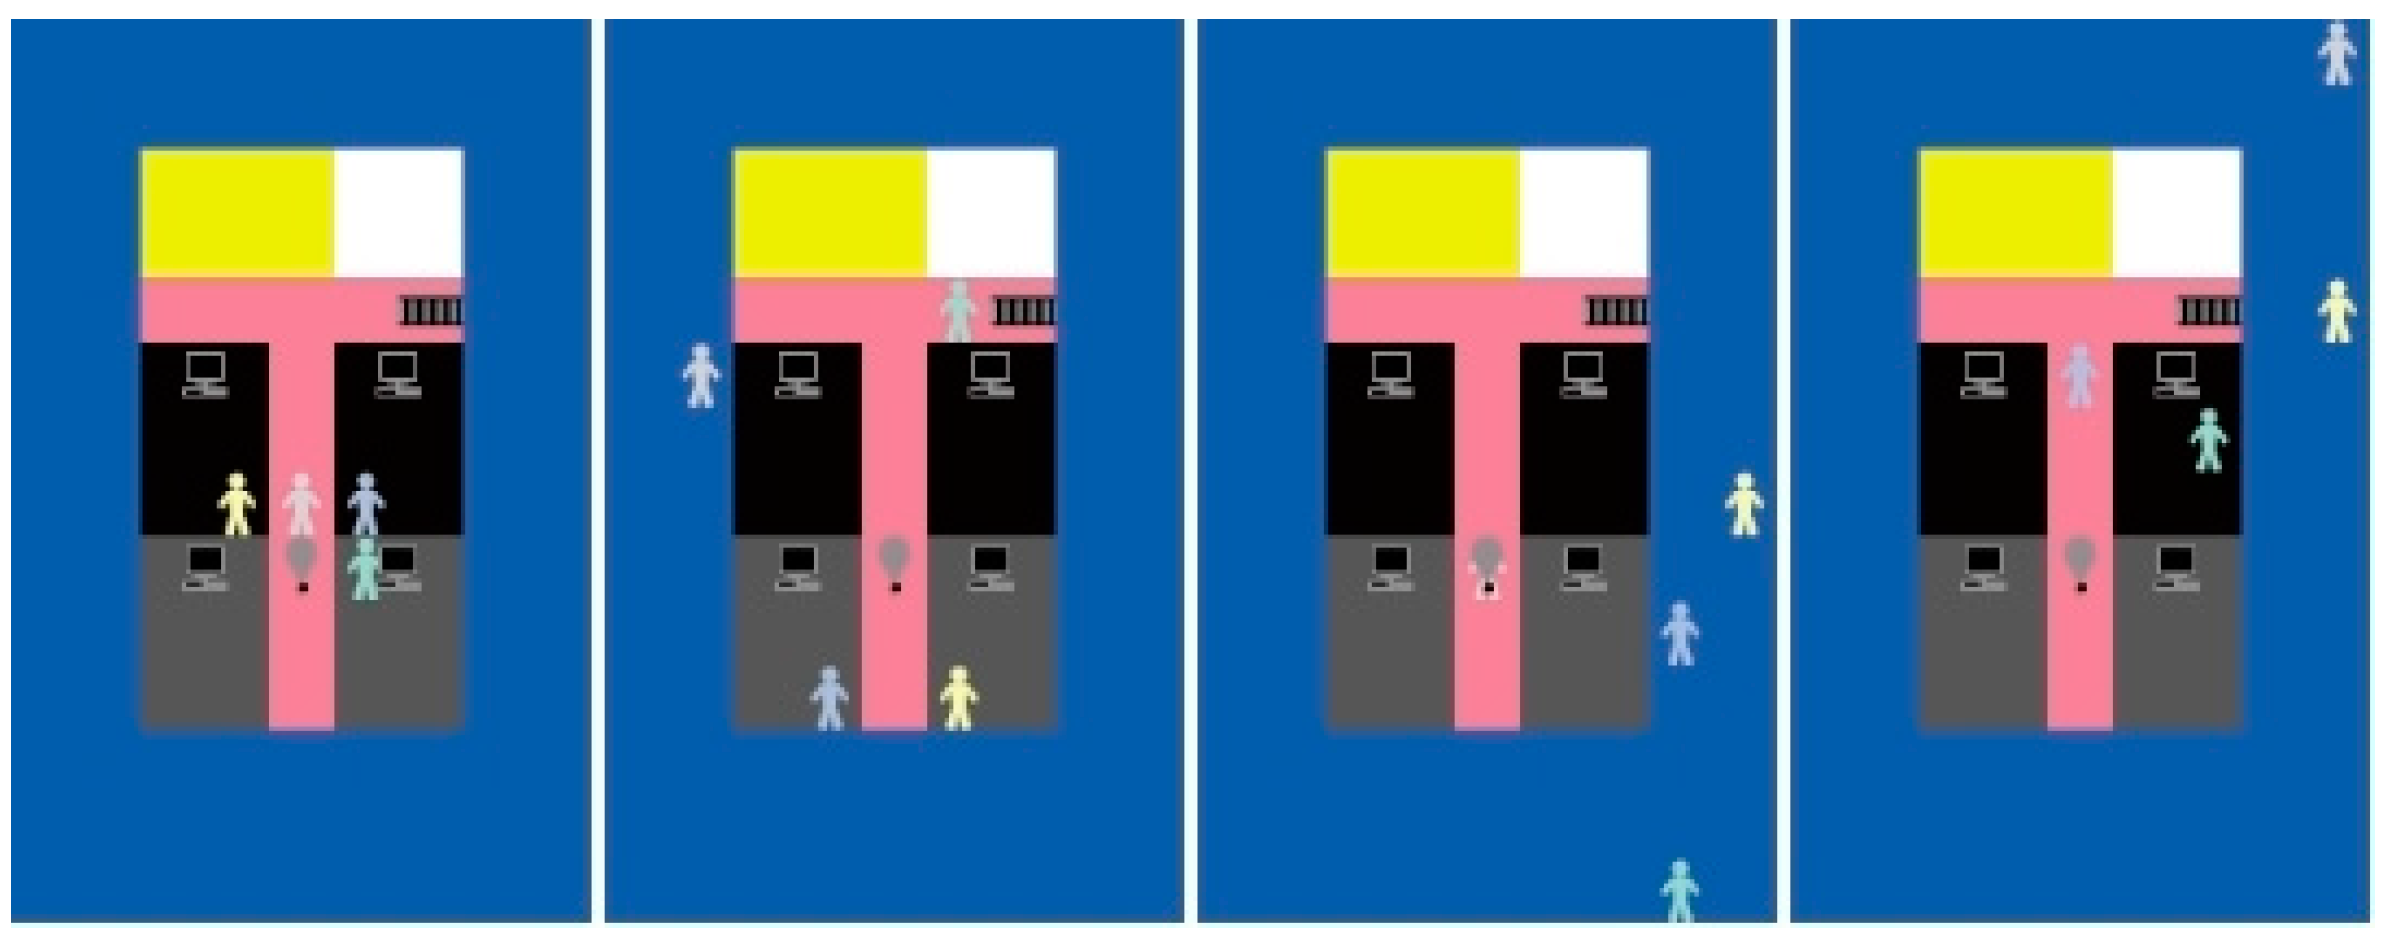
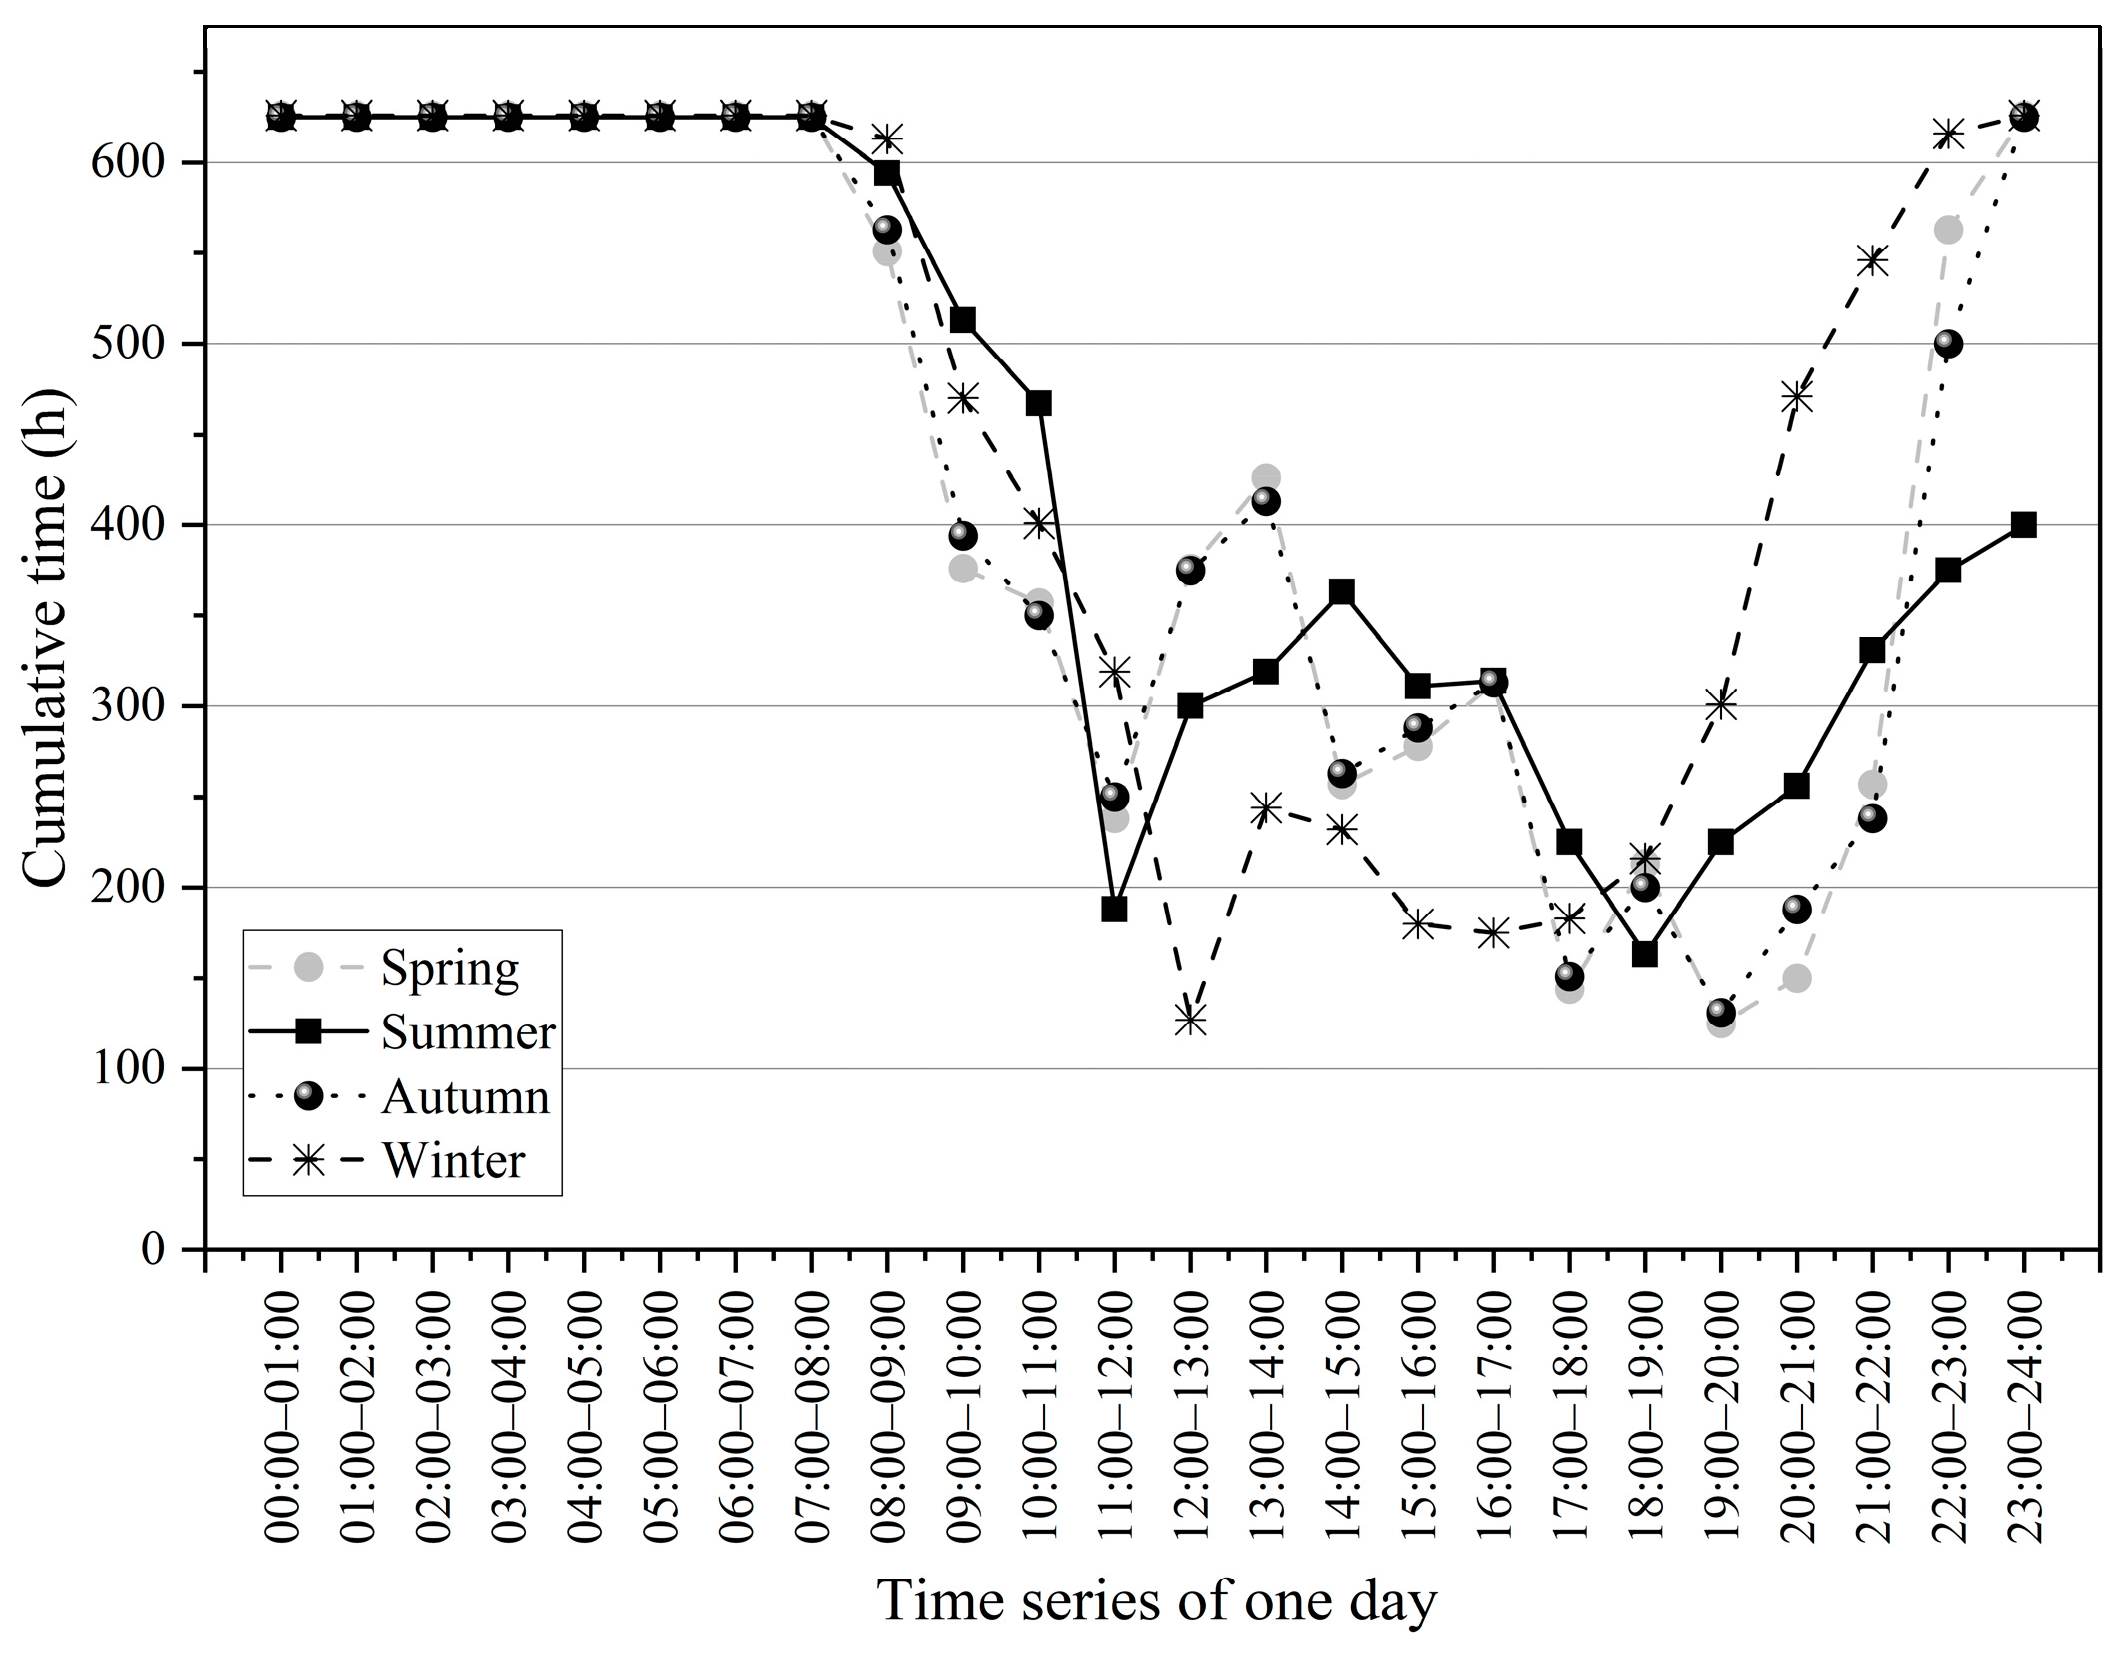
The NETLOGO software allows visual simulations to demonstrate the state of the four students in the dormitory and their energy use behavior with human icons of different colors representing each of the four students in the dormitory. As shown in Figure 5, NETLOGO can perform the presence of students in the dormitory at different periods with a certain amount of randomization. There is a total of 2190 h per season in NETLOGO, of which 1564 h are used for weekdays and 626 h are used for weekends. Figure 6 and Figure 7 show the hour-by-hour cumulative time of students in the dormitory on weekdays and weekends, respectively. The results show that the simulated situation is highly consistent with the actual situation (Figure 3 and Figure 4). It is worth noting that the cumulative time between spring and autumn also exhibits a slight difference. The difference reflects the fact that NETLOGO software can well simulate the randomness and autonomy of the person’s behavior.

Figure 5.
Visualization of behavior changes in dormitory.
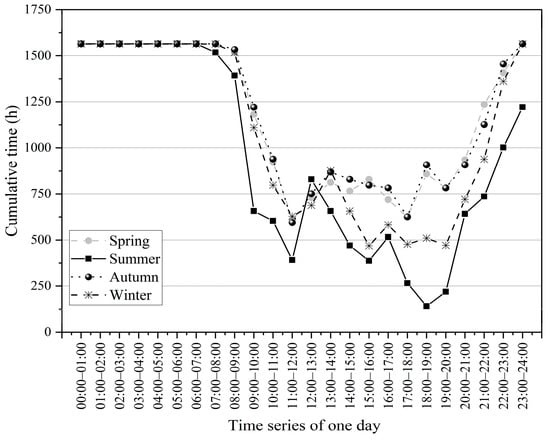
Figure 6.
Cumulative time of students who stayed in dormitories on weekdays.

Figure 7.
Cumulative time of students who stayed in dormitories on weekends.
Taking a student as an example, a sequence of behaviors in the dormitory covering the whole year is generated by NETLOGO. Figure 8 shows a sequence of behaviors within two days, where the abscissa denotes the hourly time points, and the ordinate lists the typical activities of the student, while the bars indicate the starting and ending time, which represent the duration of the activities. The simulation results show that all activities can be filled for 48 h. For the activities, the time of action and the duration are analogous to the survey results. Thus, the applicability of the method, describing and modeling the indoor behavior of students, has been further validated.
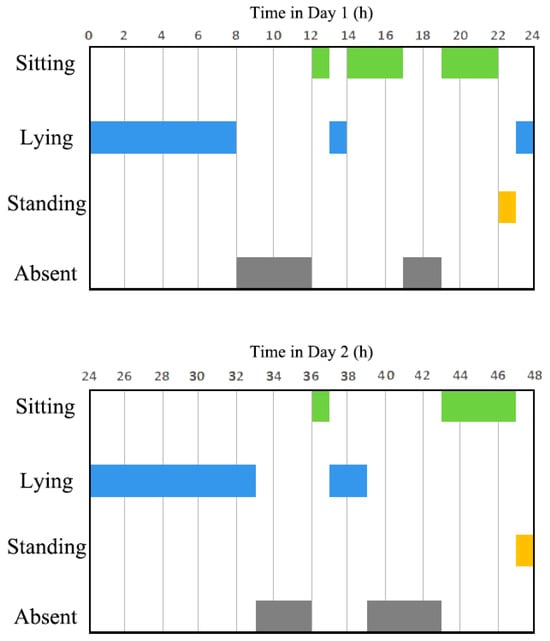
Figure 8.
A sequence of activity simulated in two days.
The accuracy between the simulation situation and the actual results should be further checked. Table 8 shows the duration of air conditioners by simulation. The difference in cumulative operation time and daily operation time for air conditioners among seasons is quite significant, while there is less variability in computers and lights. In terms of Cluster A, the cumulative operation time of air conditioners over the year is 53 h, accounting for only 0.61%. This is similar to the actual situation. The air conditioning was rarely used during the measurements, while a small amount of air conditioning operation time occurred during the simulation, due to the fact that the measurements were taken on a typical weather day, while the air conditioning was still operated under extremely cold and hot conditions. The cumulative operation time of air conditioners for Cluster B is 705.5 h, with 316 h for refrigeration and 389.5 h for heating. However, the number of days for heating is greater than that for refrigeration, resulting in the daily operation time being greater in the summer than in the winter. The result of simulation situation is in line with the measured results. The cumulative operation time of air conditioners for Cluster C is 64% greater than that for Cluster B. According to the statistics from NETLOGO output, the cumulative operation time of lights and computers is 2974 h and 968.75 h, respectively. These data will form the basis of the energy consumption of the dormitory throughout the year.
Table 8.
The duration of air conditioners by simulation.
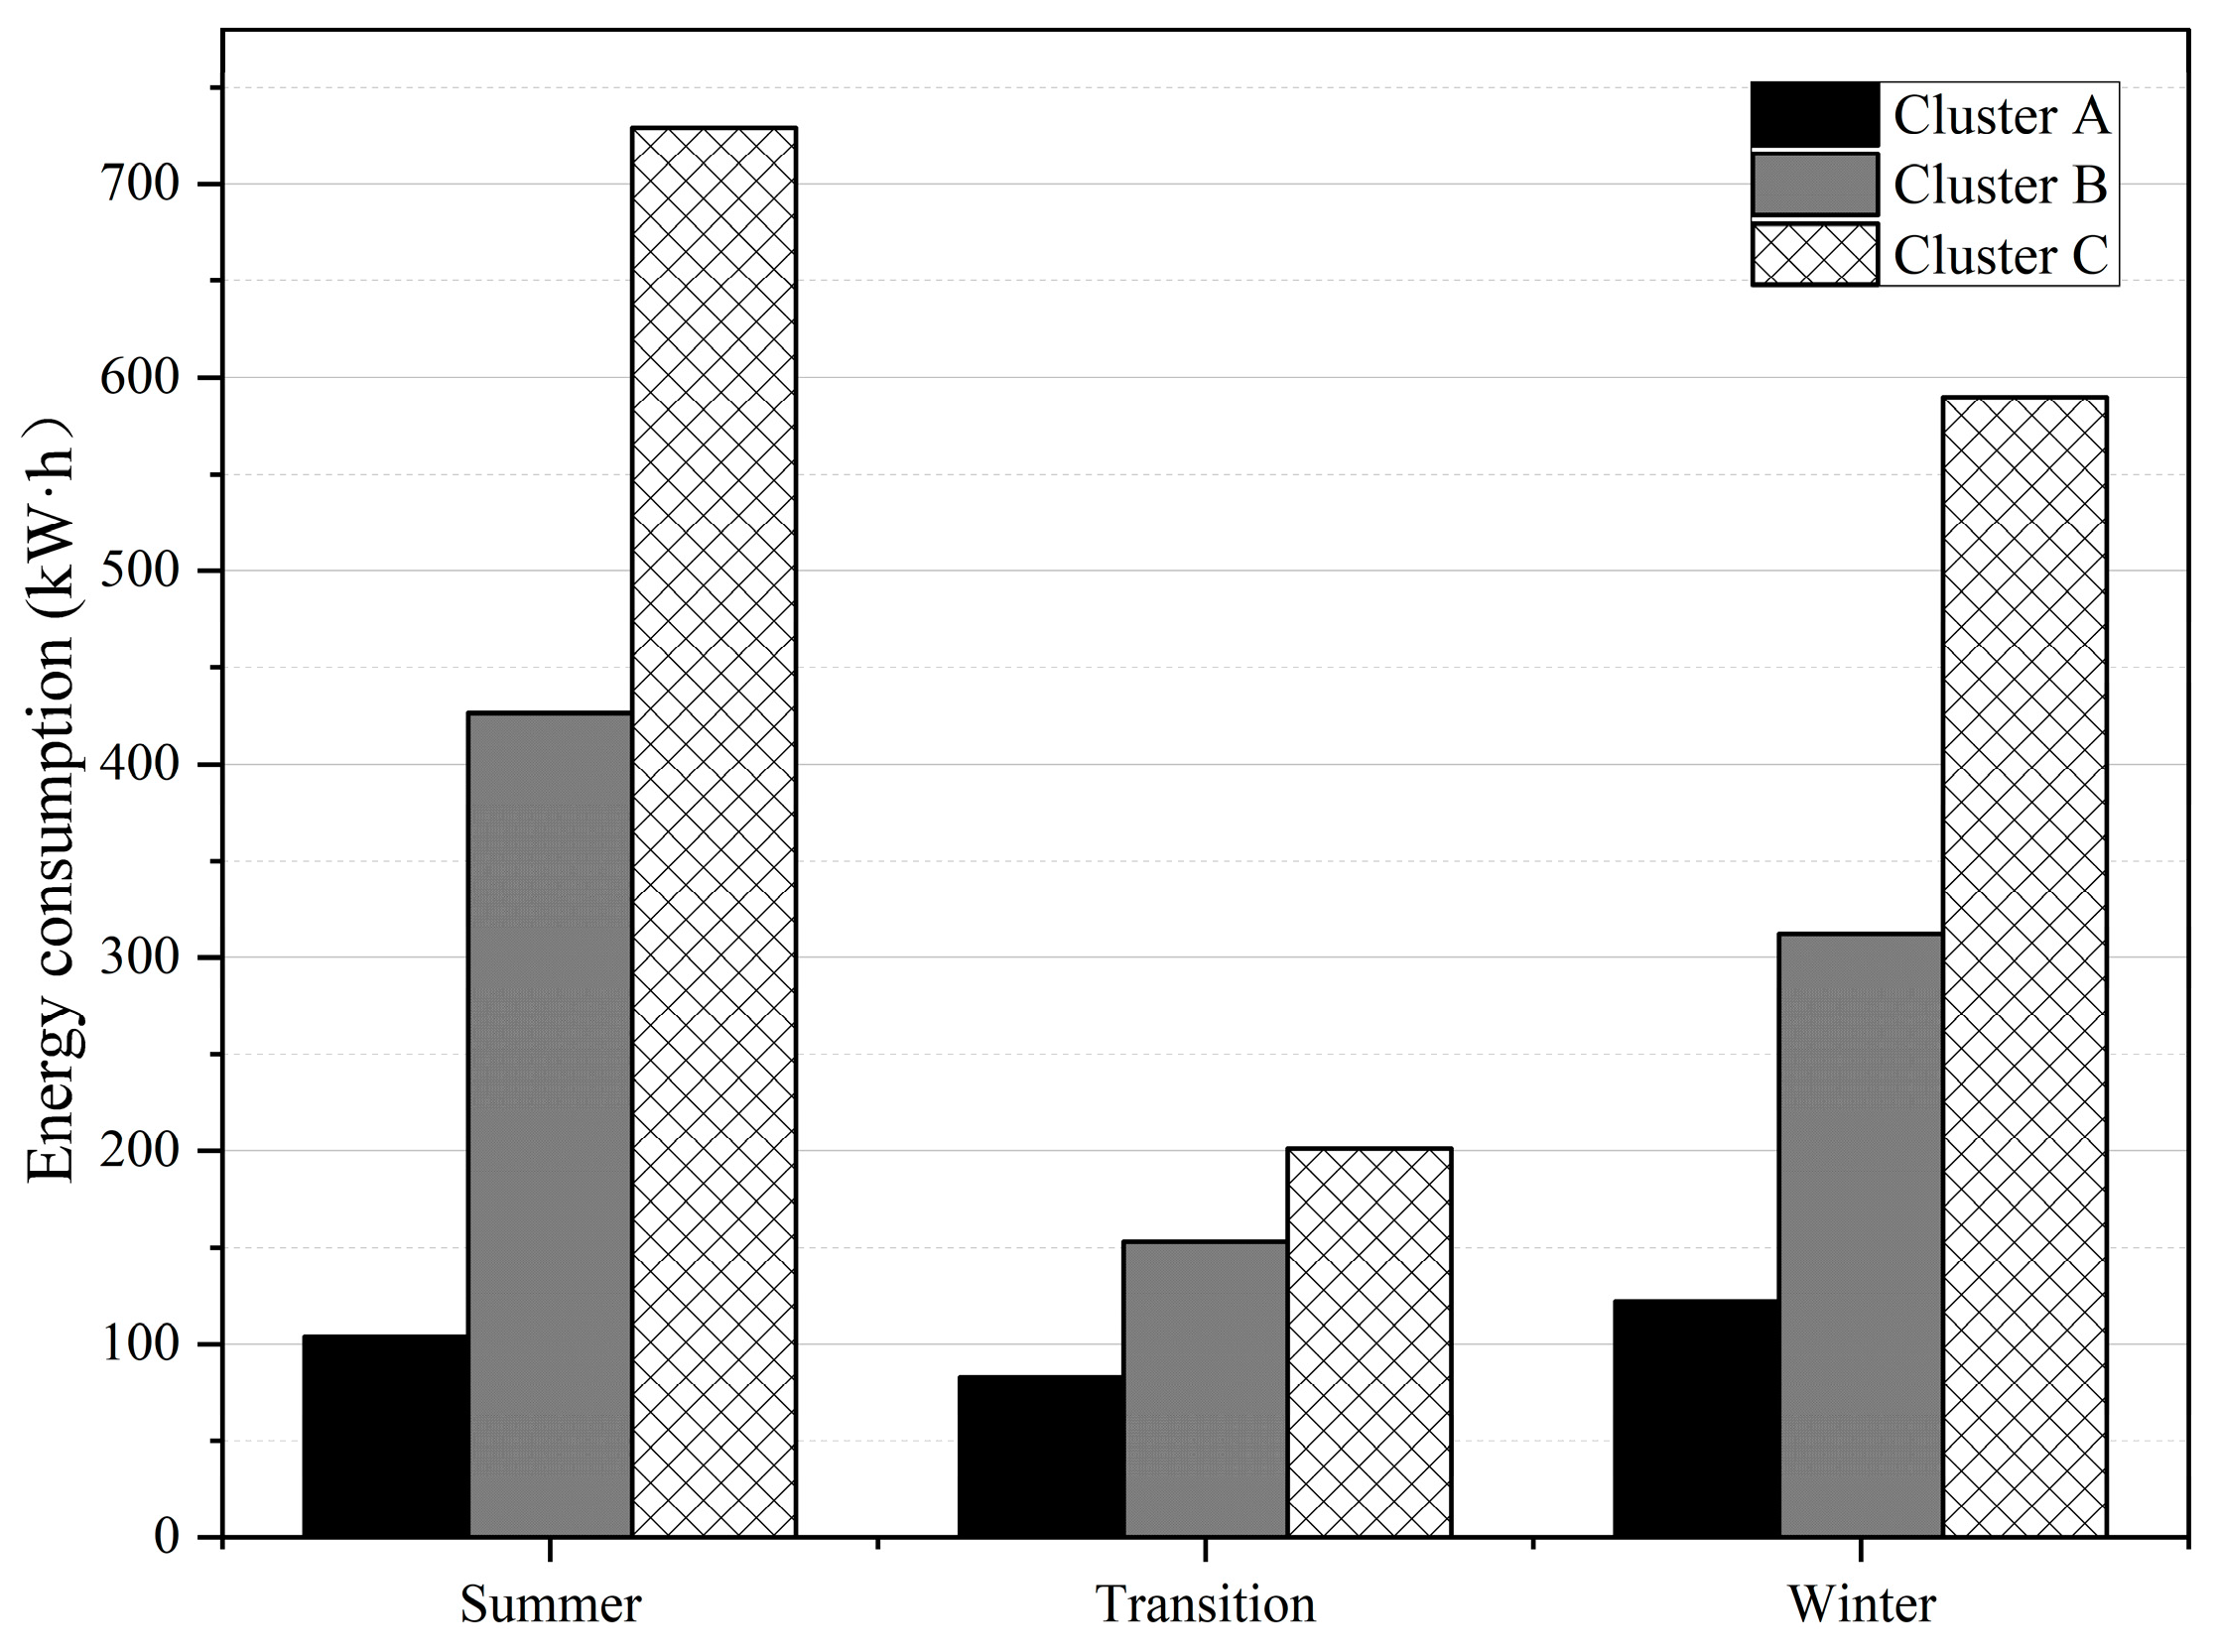
Figure 9 shows the energy consumption of different clusters in three seasons, calculated by the cumulative operation time and the rated power of the corresponding appliances. The energy consumption in summer and winter is significantly greater than that in the transition season, especially for air conditioners. It indicates that the indoor environment in Chengdu is much poorer in summer and winter. The building size of the simulated dormitory is 7.2 m × 3.6 m, with a floor area of 25.92 m2. The average annual energy consumption is 15.27, 40.67, and 66.70 kWh·m−2 for Cluster A, B, and C, respectively. The actual annual energy consumption, obtained by multiple measurements, is 16.54, 42.63, and 62.75 kWh·m−2 for Cluster A, B, and C, respectively. The difference between the simulation results and actual situation is very small, which proves the validity of model.

Figure 9.
Energy consumption of dormitory by simulation.
5. Scenario Analysis of Energy-Saving Strategies for Dormitory Units
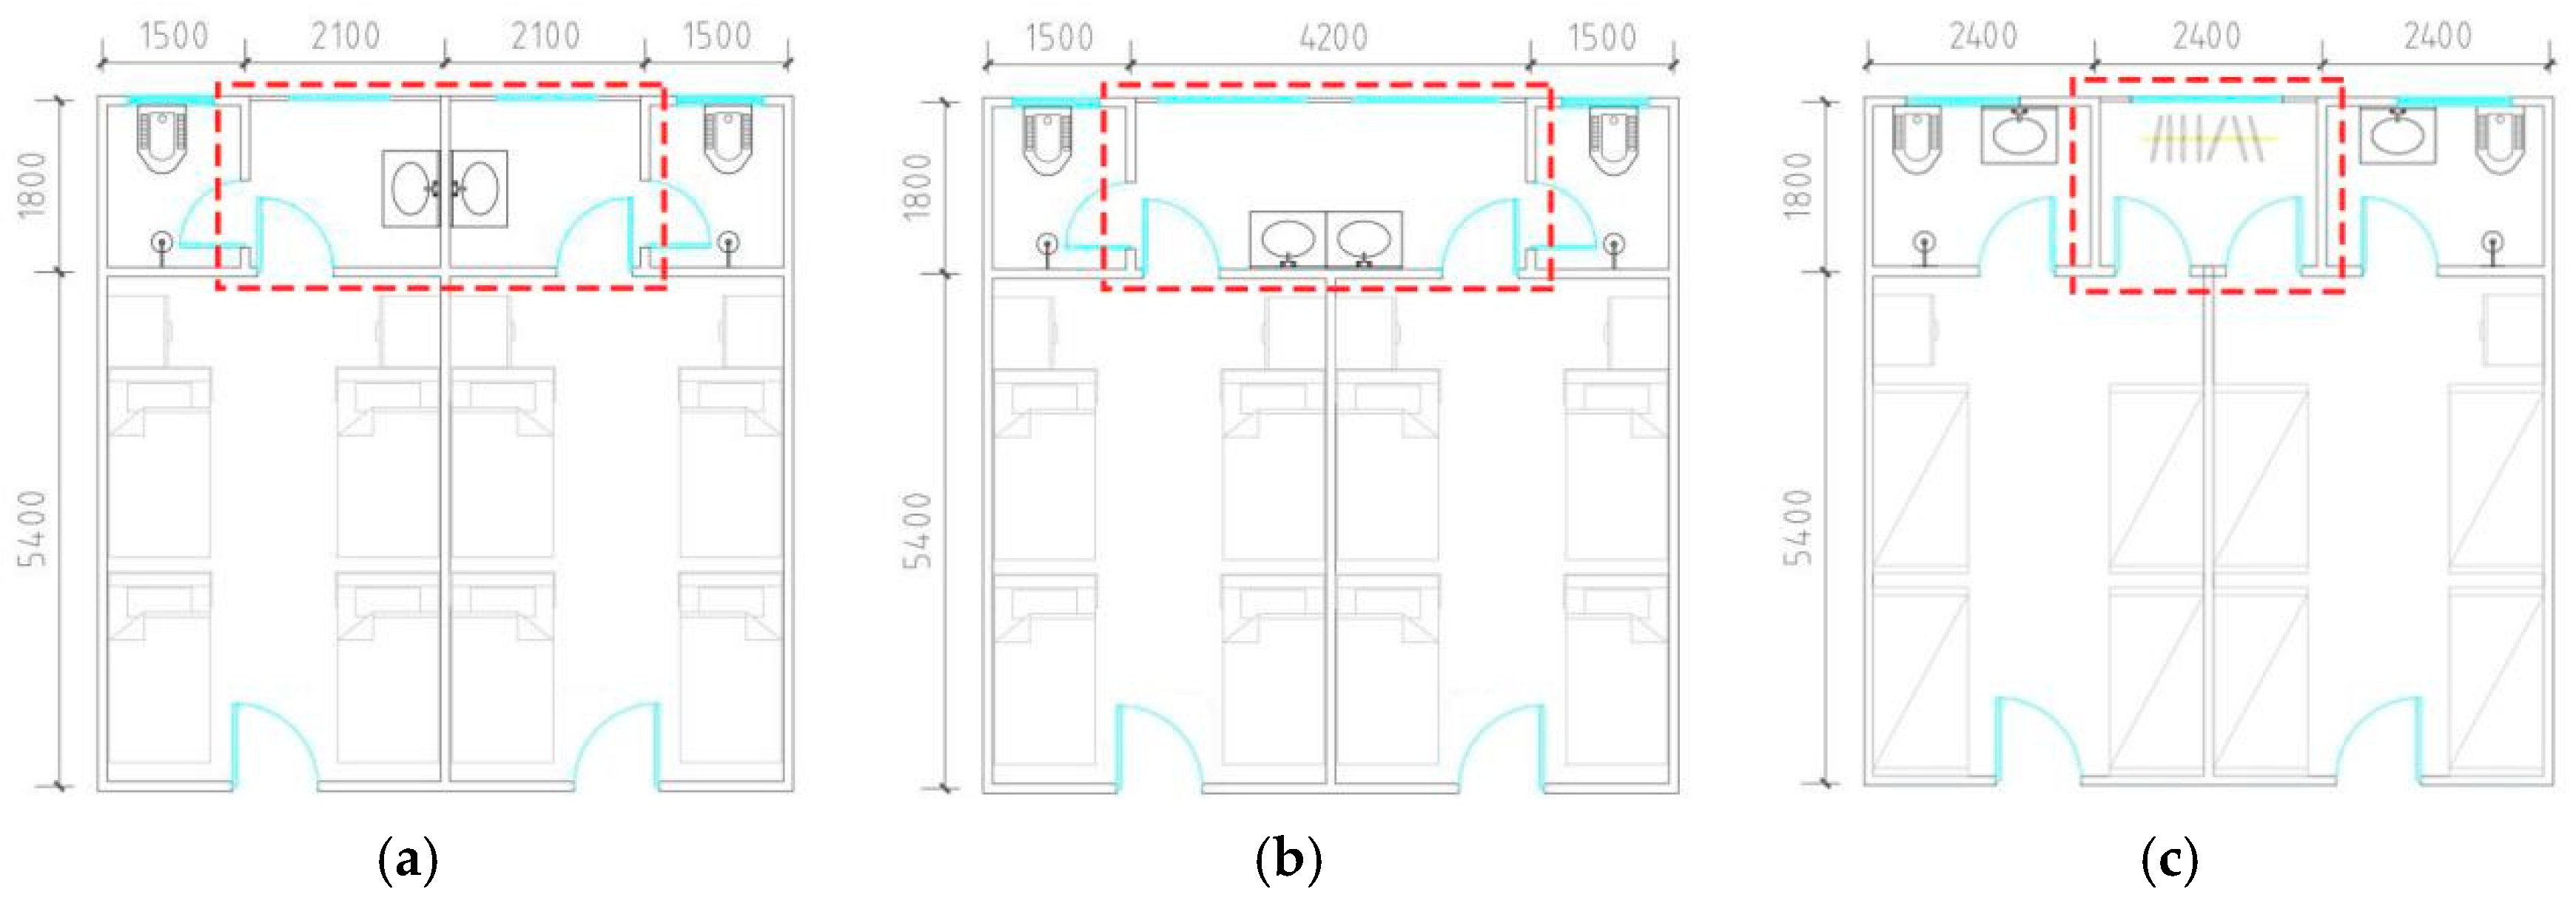
In order to demonstrate the impact of energy use behavior on energy consumption, a typical dormitory is chosen as the baseline for the comparative analysis to illustrate an energy-friendly design proposal alternative to the status quo. The existing dormitory is shown in Figure 10a. The simulation results and actual measurements demonstrate the dormitory is difficult to meet the needs of daily life and study, especially in summer and winter. Therefore, appliances are used to improve the indoor environment, which result in great energy consumption. The existing dormitories exhibit several defects: (1) poor indoor ventilation and high indoor temperature result in great energy consumption for refrigeration in summer. (2) Excessive indoor heat is lost due to oversized north-facing balconies, which leads to great energy consumption for heating. (3) The light intensity of the room is not sufficient to meet the needs of study. Effective lighting area of the dormitory is insufficient and the sunlight is not fully utilized.
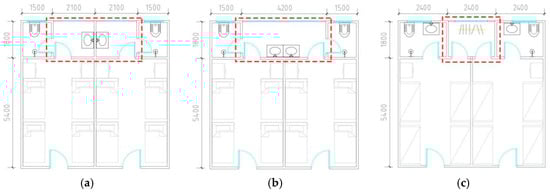
Figure 10.
Dormitory layout plan of (a) the existing dormitory; (b) the proposed south-facing dormitory; (c) the proposed north-facing dormitory.
A hypothetical new design with the same function is proposed as an alternative for this precinct. As shown in Figure 10b, the proposed south-facing dormitory connects the balconies of the neighboring dormitories to enlarge the wind-absorbing surface, which can promote the effect of lighting in winter. On the other hand, it can enhance indoor ventilation in summer, which is beneficial for removing excessive heat from the dormitory. In terms of the south-facing dormitory shown in Figure 10c, measures are taken to merge the balconies of the neighboring dormitories and appropriately reduce the area of the merged balconies to reduce indoor heat loss in winter, due to the small amount of light available for north-facing dormitories and the prevalence of cold northerly winds in Chengdu during winter.
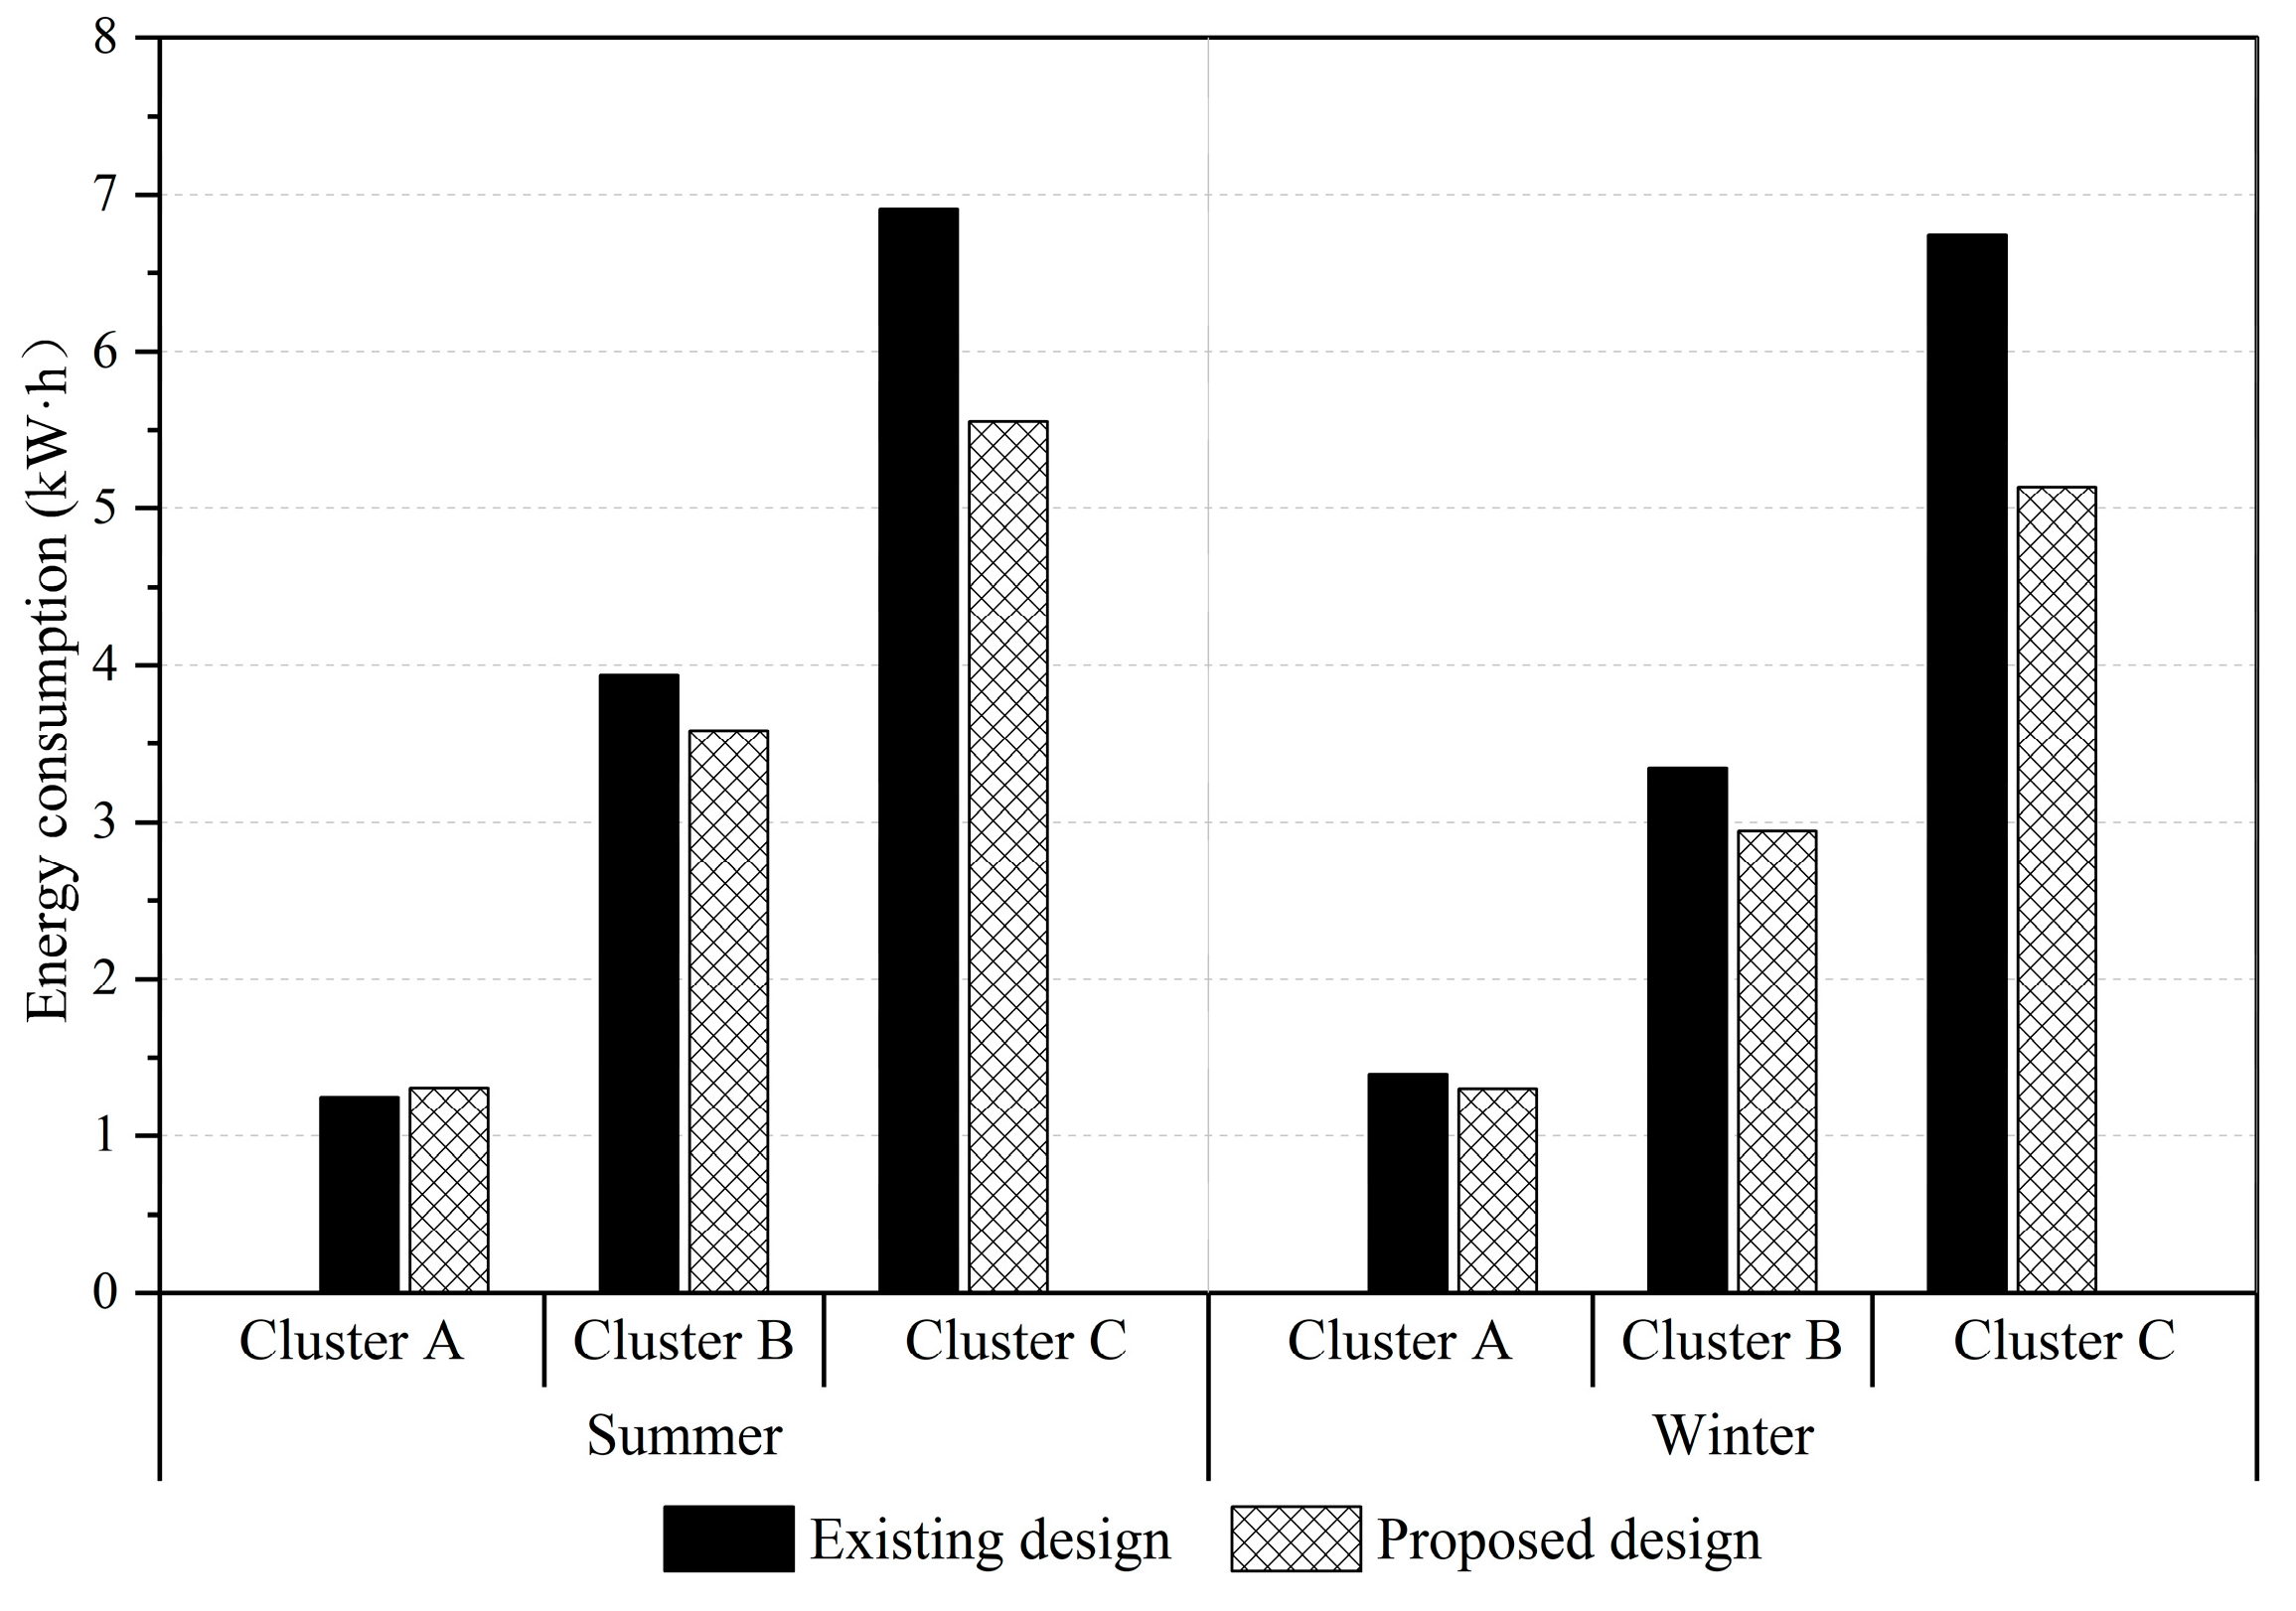
Figure 11 shows the comparison of daily average dormitory energy consumption in summer and winter for the existing and proposed dormitories. The results show that the average energy consumption of the proposed dormitory unit for Cluster C reduces 1.35 kW·h/day, realizing the cost saving by 246.38 yuan/year in summer. In winter, the energy consumption of proposed dormitory unit can save 1.61 kW·h/day and reduce costs by 293.83 yuan/year. The energy consumption for the proposed design is 16.61% and 23.83% less than that of existing dormitories in summer and winter, respectively. In terms of Cluster B, the energy consumption for the proposed design is 8.97% and 11.86% less than that of existing dormitories in summer and winter, respectively. In general, the energy consumption of the proposed design is 14.24% and 17.85% less than that of the existing dormitory in summer and winter, respectively. It demonstrates that the proposed energy-friendly design exhibits great energy-saving potential, especially for Cluster C. The cost reduction for the proposed dormitory unit is up to 310.13 yuan/year and 383.25 yuan/year in summer and winter, respectively. The energy-saving potential for winter is greater than summer. Therefore, optimizing the architectural design of university dormitories can effectively reduce energy consumption.

Figure 11.
Daily average energy consumption of dormitory for the existing and proposed design.
6. Conclusions
Occupant energy use behavior plays a significant role in predicting building energy consumption. Current building energy simulations usually assume that occupants use electrical equipment (e.g., air conditioner, light) according to the deterministic schedule or environmental values. However, occupants’ behavior is uncertain and varies with the surrounding environment and other occupants, especially for college students. Universities are characterized by high densities of occupants and students from different regions and cities, which result in complex energy use behaviors. Taking university dormitories in Sichuan, China as an example, this study established an agent-based model to explore the relationship between university occupant behaviors and dormitory energy consumption.
Firstly, the student residences are subdivided into three clusters by a two-step cluster analysis method to characterize the features of appliance use behavior. Secondly, a field survey of measuring the indoor environmental data (e.g., indoor temperature and illumination) and recording the energy use behavior is conducted on typical climate days. The control logic of energy use behavior is derived using statistical analysis and logistic regression. Then, a simulation model of energy consumption for college dormitories based on energy use behavior is established. The simulation is conducted on NETLOGO software, and the control logic is the occurrence of various energy use behaviors. The validation results show that the model can be used to simulate the university residential energy use behaviors with sufficient simulation accuracy. Finally, a hypothetical new design is proposed as an alternative for this dormitory unit. The simulation results show the energy consumption of the proposed design is 14.24% and 17.85% less than that of the existing dormitory in summer and winter, respectively. The retrofitting of university dormitories exhibits great potential for energy saving, and it is important for reducing energy consumption and promoting low-carbon sustainable development. In addition, building operators can develop more scientific and reasonable energy supply programs based on this study on student residential energy use behaviors. The method of this research is expected to provide a basis for decision-making and theoretical guidance for energy management policies.
This study has three limitations that must be noted for future studies. Firstly, the energy use behavior model proposed in this study is more representative for Chengdu. However, logistic regression coefficients and behavioral models may differ among different climate zones. Therefore, while considering behavioral models for building energy simulation, buildings in other cities should be carefully considered. The method and the logic of study can serve as a reference for readers. Secondly, the time step in this study is 1 h, which is usually used in energy consumption simulations. Although the simulation results indicate that the model had sufficient accuracy, a more accurate model is needed for other purposes, i.e., the step time of 15 min and even 1 min. Thirdly, the study does not separate the data into training and test sets for the development and validation of ABM. Assumptions on occupant energy use behavior was only based on survey data. The model may not allow generalizing to future data or data from different sources. Cross-validation or additional test sets should be used to improve the generalization performance of the model in future studies. In the next development, we will collect a wider sample size and conduct the simulation multiple times to build a more extensive and accurate occupant behavior model for energy conservation and carbon reduction.
Author Contributions
Conceptualization, Y.Z.; methodology, B.Z. and J.H.; software, B.Z. and J.H.; formal analysis, B.Z. and J.H.; investigation, Y.Z. and J.H; resources, Y.Z. and J.H.; data curation, B.Z. and J.H.; writing—original draft preparation, B.Z. and J.H.; writing—review and editing, Y.Z.; visualization, B.Z. and J.H.; supervision, Y.Z.; project administration, Y.Z.; funding acquisition, Y.Z. All authors have read and agreed to the published version of the manuscript.
Funding
This research was funded by Chengdu Science and Technology Bureau, grant number 2020-YF05-00595-SN and Key Technologies Research and Development Program, grant number 2022YFC3802702.
Data Availability Statement
Data are contained within the article.
Conflicts of Interest
The authors declare no conflicts of interest.
References
- Yan, D.; Hong, T.; Dong, B.; Mahdavi, A.; Gaetani, I.; Feng, X. IEAEBC Annex 66: Definition and simulation of occupant behavior in buildings. Energy Build. 2017, 156, 258–270. [Google Scholar] [CrossRef]
- Liu, Q.; Ren, J. Research on the building energy efficiency design strategy of Chinese universities based on green performance analysis. Energy Build. 2020, 224, 110242. [Google Scholar] [CrossRef]
- Zhang, Y.; Bai, X.; Mills, F.; Pezzey, J. Rethinking the role of occupant behavior in building energy performance: A review. Energy Build. 2018, 172, 279–294. [Google Scholar] [CrossRef]
- Salimi, S.; Liu, Z.; Hammad, A. Occupancy prediction model for open-plan offices using real-time location system and inhomogeneous Markov chain. Build. Environ. 2019, 152, 1–16. [Google Scholar] [CrossRef]
- Zhu, S.; Tan, H.; Chen, S.; Zhi, Z. Situation and analysis of green campus culture construction in China. Build. Energy Effic. 2014, 42, 95–99. [Google Scholar]
- Crawley, D.; Lawrie, L.; Winkelmann, F.; Buhl, W.; Huang, Y.; Pedersen, C.; Strand, R.; Liesen, R.; Fisher, D.; Witte, M.; et al. EnergyPlus: Creating a newgeneration building energy simulation program. Energy Build. 2001, 33, 319–331. [Google Scholar] [CrossRef]
- Poirazis, H.; Blomsterberg, A.; Wall, M. Energy Simulations for Glazed Office Buildings in Sweden. Energy Build. 2008, 40, 1161–1170. [Google Scholar] [CrossRef]
- Li, S.; Wang, Y. Summarization of present building energy consumption and corresponding strategies in China. Environ. Sci. Manag. 2008, 33, 6–9. [Google Scholar]
- Qian, J.; Qi, L.; Zhang, C.; Wang, J.; Dou, Z.; Chen, A.; Yang, Y.; Ren, H.; Zhang, L. Excavation of building energy conservation in university based on energy use behavior analysis. Energy Build. 2023, 280, 112726. [Google Scholar]
- Balvedi, B.; Ghisi, E.; Lamberts, R. A review of occupant behaviour in residential buildings. Energy Build. 2018, 174, 495–505. [Google Scholar] [CrossRef]
- Pisello, A.; Asdrubali, F. Human-based energy retrofits in residential buildings: A cost-effective alternative to traditional physical strategies. Appl. Energy 2014, 133, 224–235. [Google Scholar] [CrossRef]
- Hong, T.; D’Oca, S.; Turner, W.; Sarah, T. An ontology to represent energy-related occupant behavior in buildings. Part I: Introduction to the DNAs framework. Build. Environ. 2015, 92, 764–777. [Google Scholar] [CrossRef]
- Chen, S.; Wu, J.; Pan, Y. Simulation and case study on residential stochastic energy use behaviors based on human dynamics. Energy Build. 2020, 223, 110182. [Google Scholar] [CrossRef]
- Richardson, I.; Thomson, M.; David, I. A high-resolution domestic building occupancy model for energy demand simulations. Energy Build. 2008, 40, 1560–1566. [Google Scholar] [CrossRef]
- Macdonald, I.; Strachan, P. Practical application of uncertainty analysis. Energy Build. 2001, 33, 219–227. [Google Scholar] [CrossRef]
- Zhang, C.; Ma, L.; Han, X.; Zhao, T. Reconstituted data-driven air conditioning energy consumption prediction system employing occupant-orientated probability model as input and swarm intelligence optimization algorithms. Energy 2024, 288, 129799. [Google Scholar] [CrossRef]
- Wang, C. Simulating Research on Occupant Energy-Related Behaviors in Building. Ph.D. Thesis, Tsinghua University, Beijing China, 2014. [Google Scholar]
- Ebuy, H.T.; Bril El Haouzi, H.; Benelmir, R.; Pannequin, R. Occupant Behavior Impact on Building Sustainability Performance: A Literature Review. Sustainability 2023, 15, 2440. [Google Scholar] [CrossRef]
- Jun, L.; Zhun, Y.; Fariborz, H.; Zhang, G. Development and improvement of occupant behavior models towards realistic building performance simulation: A review. Sustain. Cities Soc. 2019, 50, 101685. [Google Scholar]
- Yan, D.; Brien, W.; Hong, T.; Feng, X.; Gunay, H.; Tahmsaebi, F.; Mahdavi, A. Occupant behavior modeling for building performance simulation: Current state and future challenges. Energy Build. 2015, 107, 264–278. [Google Scholar] [CrossRef]
- Lou, S.; Lin, Z.; Zou, Y.; Xia, D.; Huang, Y.; Li, Z.; Gu, Z. Investigation on occupant presence and appliance operation schedules for university campus in south China sub-tropical area. Build. Sim. 2024, 17, 301–318. [Google Scholar] [CrossRef]
- Liu, H.; Sun, H.; Mo, H.; Liu, J. Analysis and modeling of air conditioner usage behavior in residential buildings using monitoring data during hot and humid season. Energy Build. 2021, 250, 111297. [Google Scholar] [CrossRef]
- Xia, D.; Lou, S.; Huang, Y.; Zhao, T. A study on occupant behaviour related to airconditioning usage in residential buildings. Energy Build. 2019, 203, 109446. [Google Scholar] [CrossRef]
- Nicol, F.; Wilson, M.; Chiancarella, C. Using field measurements of desktop illuminance in European offices to investigate its dependence on outdoor conditions and its effect on occupant satisfaction, and the use of lights and blinds. Energy Build. 2006, 38, 802–813. [Google Scholar] [CrossRef]
- Richardson, I.; Thomson, M.; Infield, D.; Delahunty, A. Domestic lighting: A high-resolution energy demand model. Energy Build. 2009, 41, 781–789. [Google Scholar] [CrossRef]
- Jukka, V.; Lund, P. A model for generating household electricity load profiles. Int. J. Energy Res. 2006, 30, 273–290. [Google Scholar]
- Jin, Y.; Yan, D.; Sun, H. Household Appliance Behavior Model Based on Statistical Method. Build. Sci. 2018, 34, 91–102. [Google Scholar]
- Yamaguchi, Y.; Shimoda, Y. Validation of an Energy Demand Model of Residential Buildings. In Proceedings of the 2nd Asia Conference on International Building Performance Simulation Association, Nagoya, Japan, 28–29 November 2014. [Google Scholar]
- Jian, Y. Modelling and simulating occupant behaviour on air conditioning in residential buildings. Energy Build. 2018, 175, 1–10. [Google Scholar]
- Ren, X.; Yan, D.; Wang, C. Air-conditioning usage conditional probability model for residential buildings. Build. Environ. 2014, 81, 172–182. [Google Scholar] [CrossRef]
- Zhang, Y.; Luo, X.; Sun, Y.; Liu, X. Impact of air-conditioning usage behavior of student groups on air-conditioning load simulation in university dormitories. Energy Build. 2023, 303, 113765. [Google Scholar] [CrossRef]
- Liao, C.; Barooah, P. An integrated approach to occupancy modeling and estimation in commercial buildings. In Proceedings of the 2010 American Control Conference (ACC), Baltimore, MD, USA, 30 June–2 July 2010. [Google Scholar]
- Ding, Z.; Hu, T.; Li, M.; Xu, X.; Zou, P. Agent-based model for simulating building energy management in student residences. Energy Build. 2019, 198, 11–27. [Google Scholar] [CrossRef]
- Azar, E.; Menassa, C. Agent-based modeling of occupants and their impact on energy use in commercial buildings. J. Comput. Civ. Eng. 2012, 26, 506–518. [Google Scholar] [CrossRef]
- Kashif, A.; Dugdale, J.; Ploix, S. Simulating Occupants’ behavior For Energy Waste Reduction in Dwellings: A Multiagent Methodology. Adv. Complex Syst. 2013, 16, 1350022. [Google Scholar] [CrossRef]
- Jia, M.; Srinivasan, R.; Ries, R.; Weyer, N.; Bharathy, G. A systematic development and validation approach to a novel agent-based modeling of occupant behaviors in commercial buildings. Energy Build. 2019, 199, 352–367. [Google Scholar] [CrossRef]
- Jia, M.; Srinivasan, R.; Ries, R.J.; Bharathy, G.; Weyer, N. Investigating the Impact of Actual and Modeled Occupant Behavior Information Input to Building Performance Simulation. Buildings 2021, 11, 32. [Google Scholar] [CrossRef]
- Ouf, M.; Brien, W.; Gunay, H. Optimization of electricity use in office buildings under occupant uncertainty. J. Build. Perform. Simul. 2020, 13, 13–25. [Google Scholar] [CrossRef]
- Duarte, C.; Budwig, R.; Van, K. Energy and demand implication of using recommended practice occupancy diversity factors compared to real occupancy data in whole building energy simulation. J. Build. Perform. Simul. 2015, 8, 408–423. [Google Scholar] [CrossRef]
- Ahmed, O.; Sezer, N.; Mohamed, O.; Wang, L.; Hassan, I. State-of-the-art review of occupant behavior modeling and implementation in building performance simulation. Renew. Sustain. Energy Rev. 2023, 185, 113558. [Google Scholar] [CrossRef]
- Santangelo, A.; Yan, D.; Feng, X. Renovation strategies for the Italian public housing stock: Applying building energy simulation and occupant behaviour modelling to support decision-making process. Energy Build. 2018, 167, 269–280. [Google Scholar] [CrossRef]
- Jiang, H.; Yao, R.; Han, S.; Du, C.; Li, B. How do urban residents use energy for winter heating at home? A large-scale survey in the hot summer and cold winter climate zone in the Yangtze River region. Energy Build. 2020, 223, 110131. [Google Scholar] [CrossRef]
- Zheng, X.; Zhong, T.; Liu, M. Modeling crowd evacuation of a building based on seven methodological approaches. Build. Environ. 2009, 44, 437–445. [Google Scholar] [CrossRef]
- Clevenger, C.; Haymaker, J. The impact of the occupant on building energy simulations. In Proceedings of the Joint International Conference on Computing and Decision Making in Civil and Building Engineering, Montreal, QC, Canada, 14–16 June 2006. [Google Scholar]
- Hoes, P.; Hensen, J.; Loomans, M.; Vries, B.; Bourgeois, D. User behavior in whole building simulation. Energy Build. 2009, 4, 295–302. [Google Scholar] [CrossRef]
- Chen, S.; Du, B.; Liu, S.; Xu, F.; Lu, Y.; Xing, W. Statistical Analysis on the Characteristics of Energy Use Behavior in Students’Dormitories in Universities. Build. Sci. 2015, 31, 133–139. [Google Scholar]
- Xu, J.; Kang, X.; Chen, Z.; Yan, D.; Guo, S.; Jin, Y.; Hao, T.; Jia, R. Clustering-based probability distribution model for monthly residential building electricity consumption analysis. Build. Simul. 2021, 14, 149–164. [Google Scholar] [CrossRef]
- Yao, R.; Costanzo, V.; Li, X.; Zhang, Q.; Li, B. The effect of passive measures on thermal comfort and energy conservation. A case study of the hot summer and cold winter climate in the Yangtze River region. J. Build. Eng. 2018, 15, 298–310. [Google Scholar] [CrossRef]
- An, J.; Yan, D.; Hong, T. Clustering and statistical analyses of air-conditioning intensity and use patterns in residential buildings. Energy Build. 2018, 174, 214–227. [Google Scholar] [CrossRef]
- GB 50176-2016; Code for Thermal Design of Civil Building. China Architecture & Building Press: Beijing, China, 2016.
- NetLogo User Manual Version 6.4.0. 2023. Available online: https://ccl.northwestern.edu/netlogo/docs/ (accessed on 30 January 2024).
- Hu, B.; Yu, Z.; LI, J. Investigation and analysis of standby energy consumption and usage behavior of electrical appliances in university buildings. Build. Sci. 2017, 33, 55–61. [Google Scholar]
- Sun, W. Design and Implementation of University Energy Saving Control and Energy Consumption Monitoring and Management. Master’s Thesis, Shandong University, Jinan, China, 2012. [Google Scholar]
- Huang, C. High School Study of the Problem of Energy Conservation and Emission Reduction. Master’s Thesis, Guangxi Normal University, Guilin, China, 2015. [Google Scholar]
- Ecotect Software v.5.2 [Computer Software], Sq. One Res, PTY Ltd. 2014. Available online: http://www.squ1.com (accessed on 15 January 2014).
- Amani, N. Energy efficiency using the simulation software of atrium thermal environment in residential building: A case study. Adv. Build. Energy Res. 2019, 13, 65–79. [Google Scholar] [CrossRef]


Disclaimer/Publisher’s Note: The statements, opinions and data contained in all publications are solely those of the individual author(s) and contributor(s) and not of MDPI and/or the editor(s). MDPI and/or the editor(s) disclaim responsibility for any injury to people or property resulting from any ideas, methods, instructions or products referred to in the content. |
© 2024 by the authors. Licensee MDPI, Basel, Switzerland. This article is an open access article distributed under the terms and conditions of the Creative Commons Attribution (CC BY) license (https://creativecommons.org/licenses/by/4.0/).