Article

Analysis of Influence Characteristics of Site Conditions on Seismic Response of Utility Tunnel

1
School of Civil Engineering and Architecture, Hainan University, Haikou 570228, China
2
Architectural Engineering Department, Sanya Institute of Technology, Sanya 572000, China
3
School of Civil Engineering, Harbin Institute of Technology, Harbin 150090, China
*
Author to whom correspondence should be addressed.
Buildings 2024, 14(4), 1042; https://doi.org/10.3390/buildings14041042
Submission received: 5 March 2024 / Revised: 31 March 2024 / Accepted: 7 April 2024 / Published: 8 April 2024
(This article belongs to the Special Issue Seismic Risk Assessment and Mitigation Design of Urban Buildings)

Abstract

:
Utility tunnels are crucial infrastructure projects for cities. Earthquakes are a leading cause of damage to these tunnels. The effect of a non-homogeneous site, as a complex site, on the seismic response of utility tunnels cannot be ignored. Therefore, in this study, a non-homogeneous three-dimensional finite element model of a utility tunnel was created using the ABAQUS 2021 software. El Centro seismic waves were inputted while changing the structural depth of burial to investigate the utility tunnel’s seismic response. This research is expected to further clarify the seismic variation in the utility tunnel under complex site conditions. The results show the following: (1) The impact of structure burial depth on the utility tunnel in a non-homogeneous site should not be neglected. The peak acceleration shows a decreasing and then increasing trend with increasing depth of burial within 10 m. Under the same site conditions, the peak accelerations and amplification factors of the soil in the clay are larger than those in the sand. (2) In identical site conditions, the utility tunnel structure experiences larger peak displacements in clay compared to sand. As the structure is buried deeper, the peak displacement of the utility tunnel gradually decreases, while the rate of decrease in the peak displacement of the utility tunnel structure gradually increases. The rate of decrease in peak displacement in clay is greater than that in sand. (3) The stress distribution of the utility tunnel structure changes as the depth of the structure increases. In the clay area, the utility tunnel structure shifts from transverse bending deformation to vertical bending deformation. In the sand area, it maintains transverse bending deformation due to the non-homogeneous site. The findings from this study offer guidance for building utility tunnels on non-homogeneous sites.

1. Introduction

The swift progress of urbanization has made underground structures crucial components of urban infrastructure. The utility tunnel is an underground infrastructure that centralizes various pipelines such as electricity, gas, water supply, and drainage, and implements unified planning, design, construction, and management. Moreover, it provides enough space for maintenance personnel to maintain and install pipelines [1]. In 1833, a large-scale underground drainage pipeline network was built in Paris, followed by the development of utility tunnels. Due to this network’s effectiveness, utility tunnels have been widely promoted and adopted worldwide. Several major European cities, including London, Hamburg, and Madrid, started constructing them. The construction of utility tunnels in Japan started in 1926. In 1991, a department was established to manage the construction of these tunnels [2]. China’s utility tunnels can be traced back to the first utility tunnel laid in Tian’anmen Square, Beijing, in 1958. It had a relatively simple structure and was the prototype of the utility tunnel in China. In 1994, the first modern utility tunnel was built on Zhangyang Road, Pudong New Area, Shanghai. As of June 2022, the length of utility tunnels started in China had reached 5902 km. Utility tunnels have been widely adopted by various countries and have become an important indicator of urban advancement.
It was once generally believed that underground structures are much less affected by earthquake motion than above-ground structures [3]. However, this perspective was challenged following the 1995 Kobe earthquake in Japan. Subsequently, many scholars have examined the earthquake resistance of utility tunnels. Regarding numerical simulation studies, Shamsabadi et al. [4] conducted in-depth analysis of the soil–tunnel–structure interaction mechanism through finite element software, and they proposed corresponding transformation and reinforcement schemes. Debiasi et al. [5] conducted seismic response analysis of shallow buried rectangular structures with finite element software. The results show that the influence of nonlinear friction on the soil–structure surface of shallow buried rectangular underground structures cannot be ignored. Compared with flexible rectangular structures, rigid structures are more susceptible to soil–structure interface sliding. Guo et al. [6] created a three-dimensional finite element model of the utility tunnel system using the ABAQUS finite element software and analyzed the seismic response of the utility tunnel structure and its pipelines. Konstandakopoulou et al. [7] demonstrated that the utility tunnel experienced more deformation and failure when subjected to multiple earthquakes compared to just a single earthquake. Tsinidis [8] conducted parametric analysis on the seismic response of rectangular tunnels in soft soil under transverse ground motion conditions.
Regarding experimental studies, Baziar et al. [9] studied the influence of an underground tunnel structure on surface acceleration by designing dynamic centrifuge tests. Numerical simulation was conducted using finite difference software. The simulation results closely matched the experimental results. The study findings indicate that the impact of subterranean formations on ground shaking is significant and must be taken into account when designing seismic zoning for urban regions. Tang et al. [10] used a shaking table to study the response characteristics of the utility tunnel system under seismic action conditions in a uniform site. They found that there was a significant interaction between the utility tunnel structure and the surrounding soil. Chen et al. [11,12] investigated the seismic performance of utility tunnels under non-uniform earthquake excitation with a shaking table test and numerical simulation. The findings indicated that the simulation outcomes aligned with the experiment, and the structural reaction to a non-uniform earthquake exceeded that of a uniform earthquake. Ding et al. [13] used a shaking table to conduct experiments on the utility tunnel with and without joints. Three seismic waves with the same excitation were input horizontally. The findings indicate that a utility tunnel structure without joint connections experiences greater acceleration and horizontal earth pressure responses compared to a utility tunnel structure with joint connections. Joint connections can reduce the maximum strain and bending force. Yue et al. [14] examined the seismic behavior of a prefabricated corrugated steel utility tunnel with a shaking table model test, and they studied the seismic response and damage mechanism of the support bracket and pipeline in the utility tunnel. The results show that the acceleration response of the utility tunnel structure was consistent with the surrounding soil. The dynamic earth pressure on the tunnel sidewall was greatly influenced by the distribution of tunnel mass when subjected to intense excitation.
In practical engineering, the utility tunnel inevitably encounters complex site conditions. For example, numerous academics have researched how fault displacement affects the seismic behavior of utility tunnels [15,16,17,18]. Their findings indicate that fault displacement intensifies the damage to utility tunnels. Yue et al. [19,20] investigated how prefabricated corrugated steel public tunnels on liquefiable sites experience seismic failure and compared the results to those on non-liquefiable sites. The findings indicated that the site factors greatly influenced the structural dynamic response. The soil closer to the source liquefied more easily than the soil farther away, resulting in a noticeable damping effect. Yao et al. [21] studied the seismic response of a multi-section utility tunnel in a layered liquefied site. They found that the inhibiting influence of the surrounding soil on the structure was weakened on the liquefied site, and the deformation at the junction of the partition wall and the roof in the utility tunnel structure was the largest, which could easily cause damage. Typically, the seismic behavior of utility tunnels is studied assuming the surrounding soil is either homogeneous or multi-layered [22]. However, the utility tunnel, which is long and narrow, frequently traverses non-homogeneous sites in the longitudinal direction. Prior research has indicated that the impact of non-homogeneous locations on the seismic reaction of subterranean constructions must be taken into consideration [23,24,25]. Additionally, it is important to consider the impact of the structure’s burial depth on the seismic response of the utility tunnel. Cilingir et al. [26] found that the burial depth significantly affects both the acceleration of the tunnel and the earth pressure. Ma et al. [27] proposed the existence of a burial depth range within underground structures that is susceptible to strong seismic activity. Xu et al. [28] suggested that there is a critical depth at which underground structures become most vulnerable. They proposed that peak ground acceleration (PGA) and peak site soil relative displacement (PSSRD) are reliable measures of the strength of shallow underground structures. Currently, there is limited research on how burial depth affects the seismic behavior of utility tunnels in non-homogeneous sites. Hence, researching the seismic behavior of utility tunnels in longitudinally non-homogeneous sites is crucial, and the impact of burial depth on the seismic resilience of utility tunnels is a key focus.
The seismic behavior of utility tunnels at different depths in non-homogeneous sites is studied in this article by utilizing the ABAQUS finite element software. The study analyzes the acceleration, displacement, and stress variation of utility tunnels under earthquake action and reveals the deformation mechanism of utility tunnels at different depths in a non-homogeneous site. In Section 2, the numerical model parameters are presented. In Section 3, the analysis focuses on the acceleration, displacement, and stress response of the utility tunnel. The influence of different structural burial depths on the seismic response of the utility tunnel in non-homogeneous sites is also discussed. The conclusions are set out in Section 4.

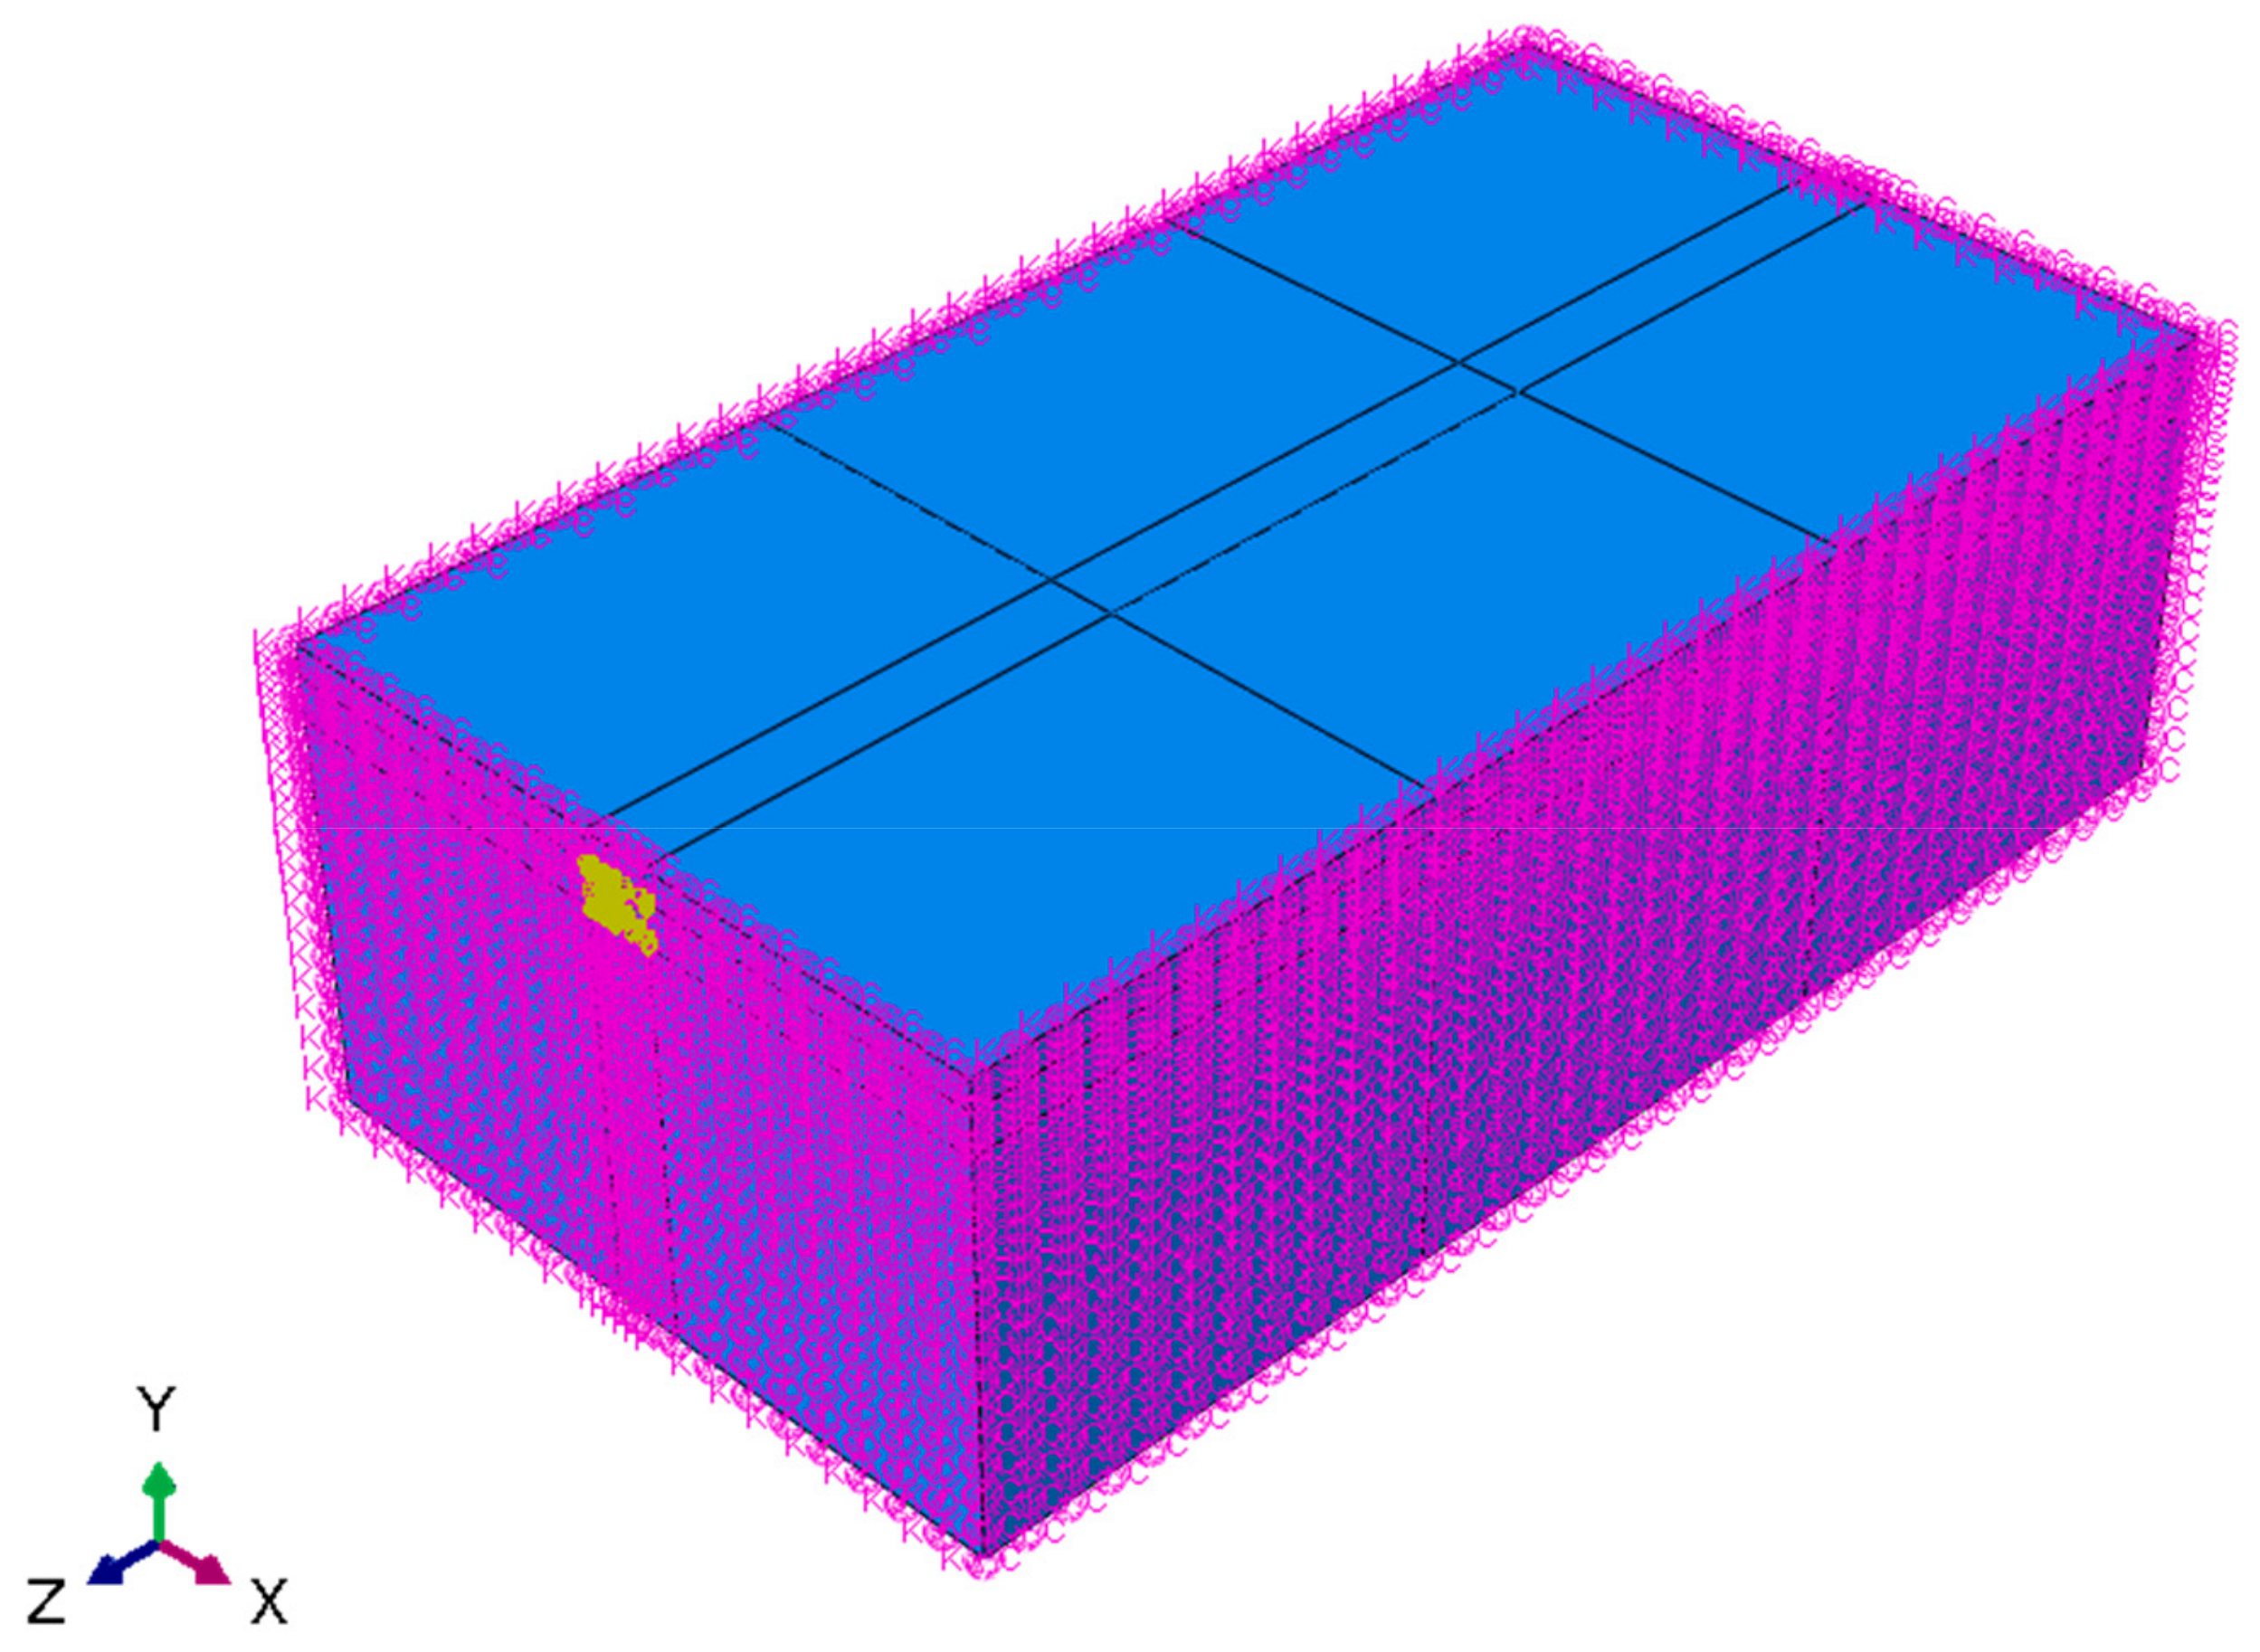
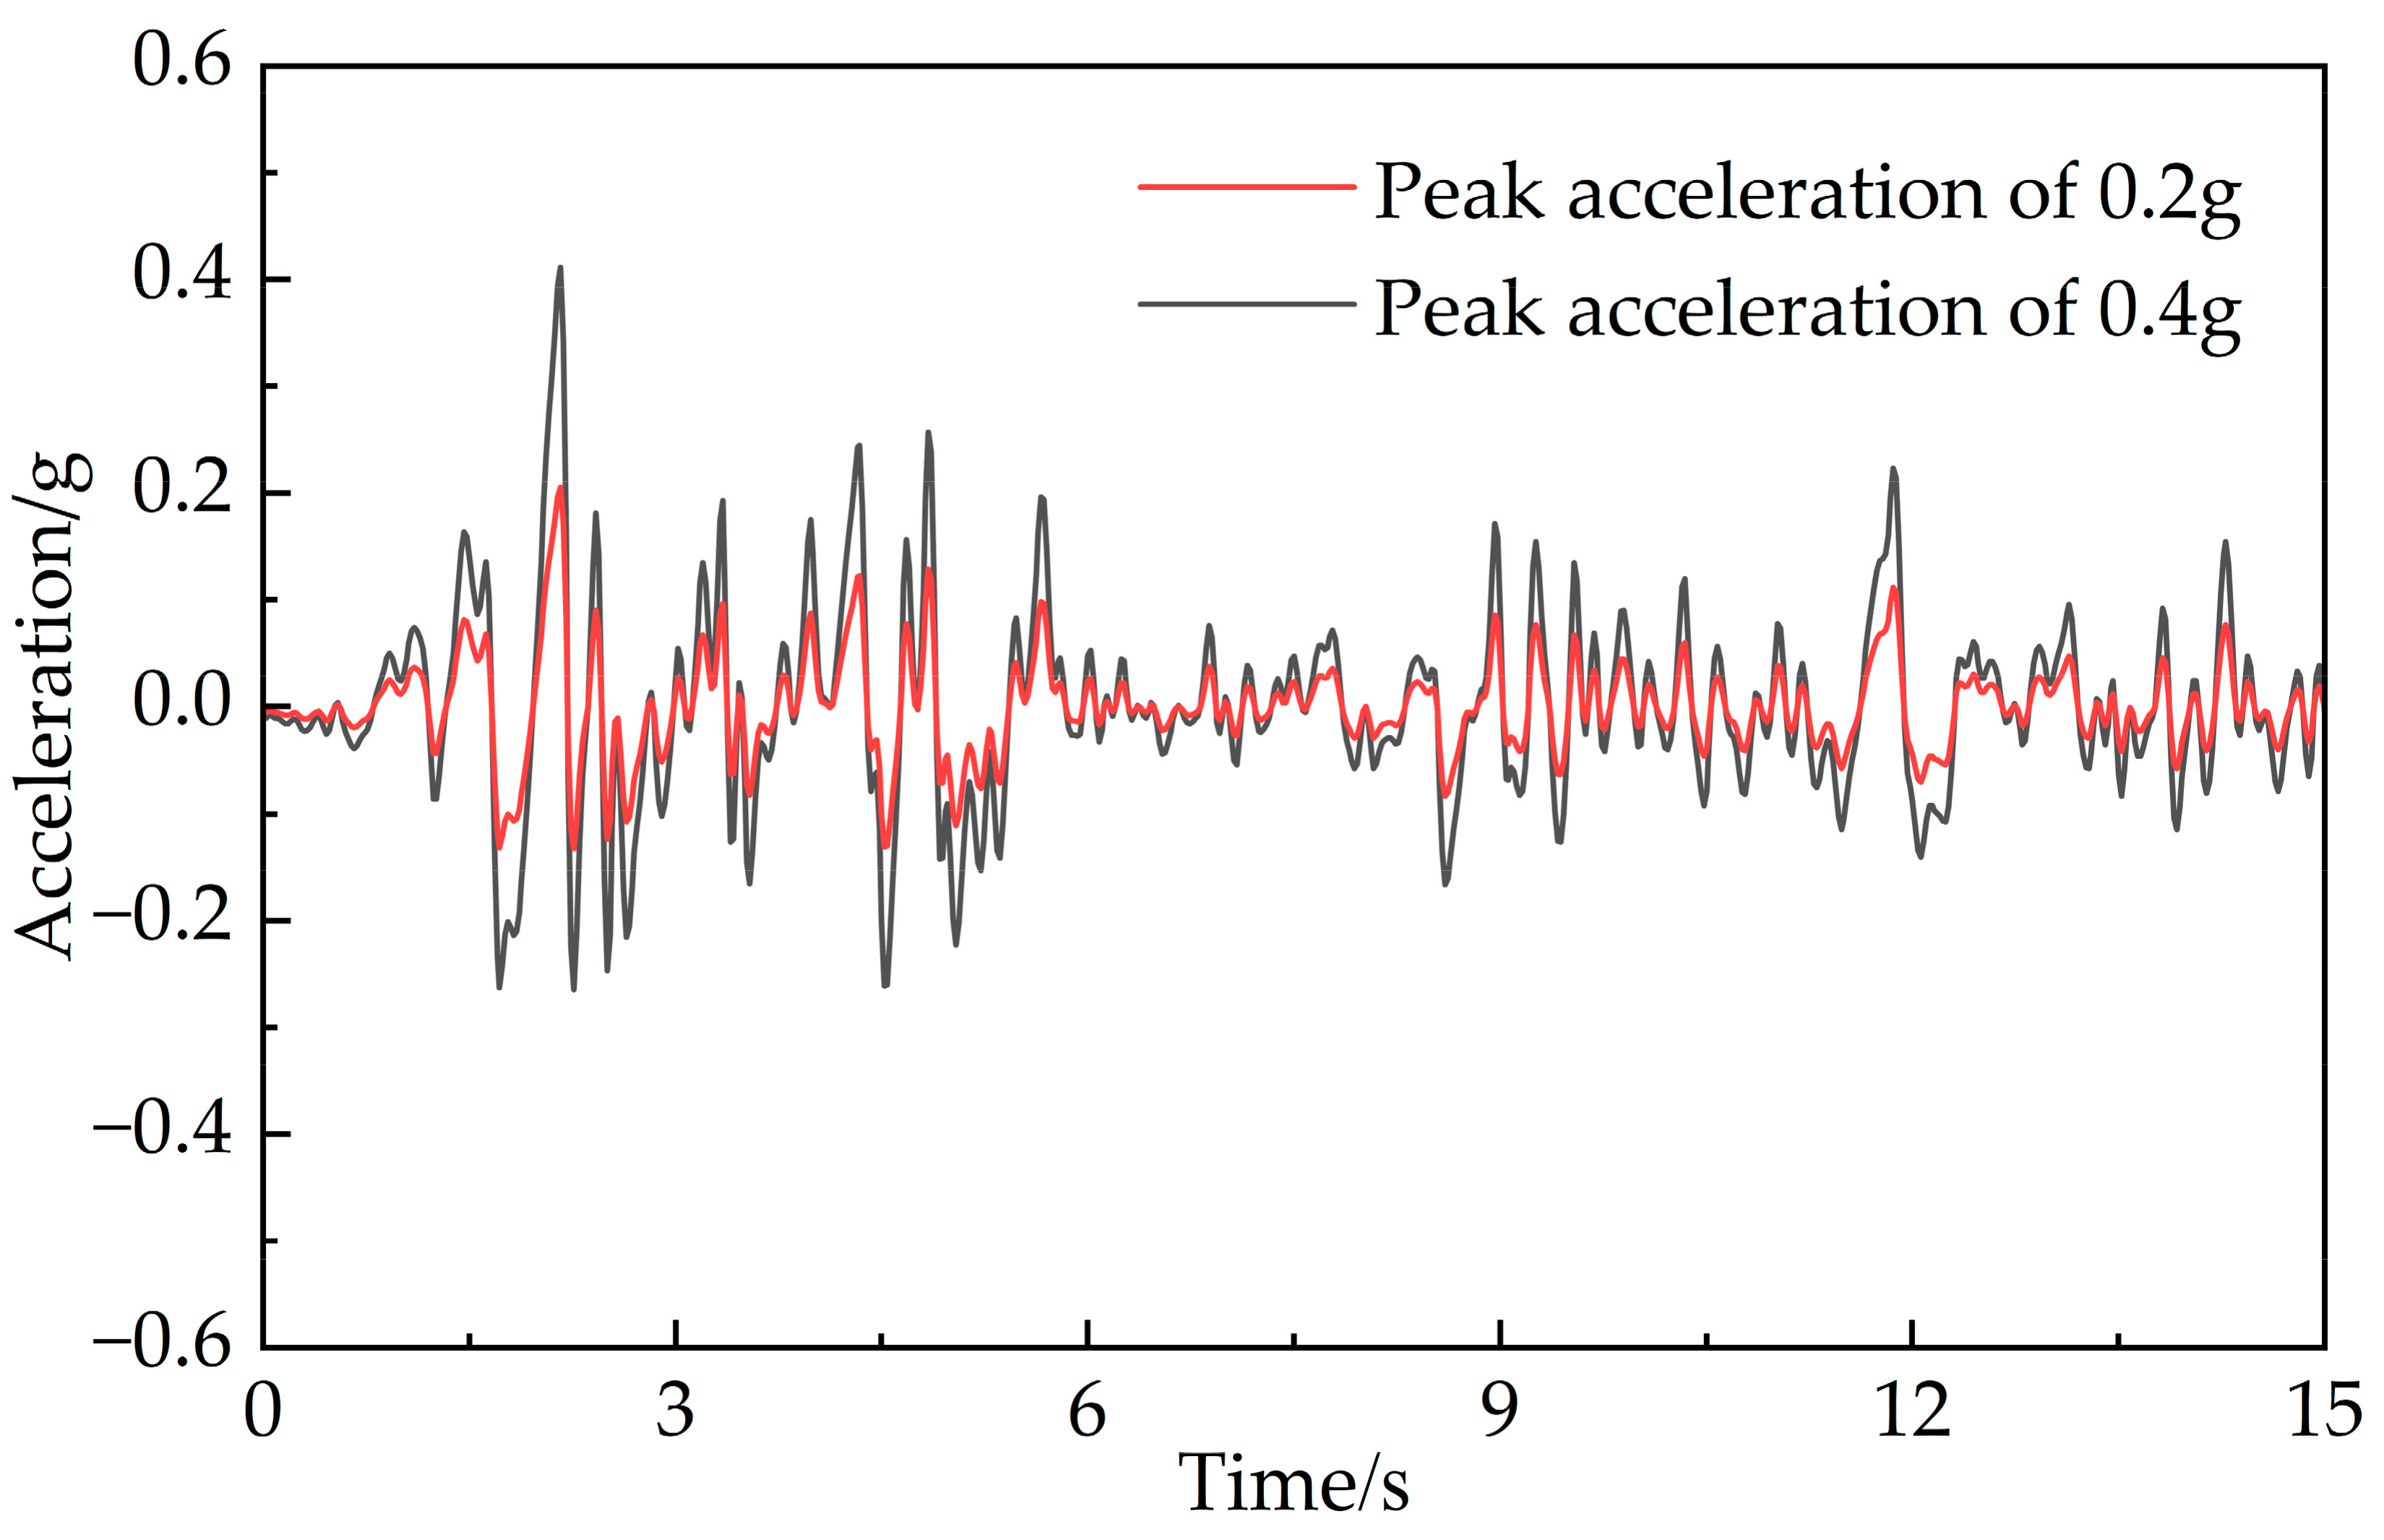
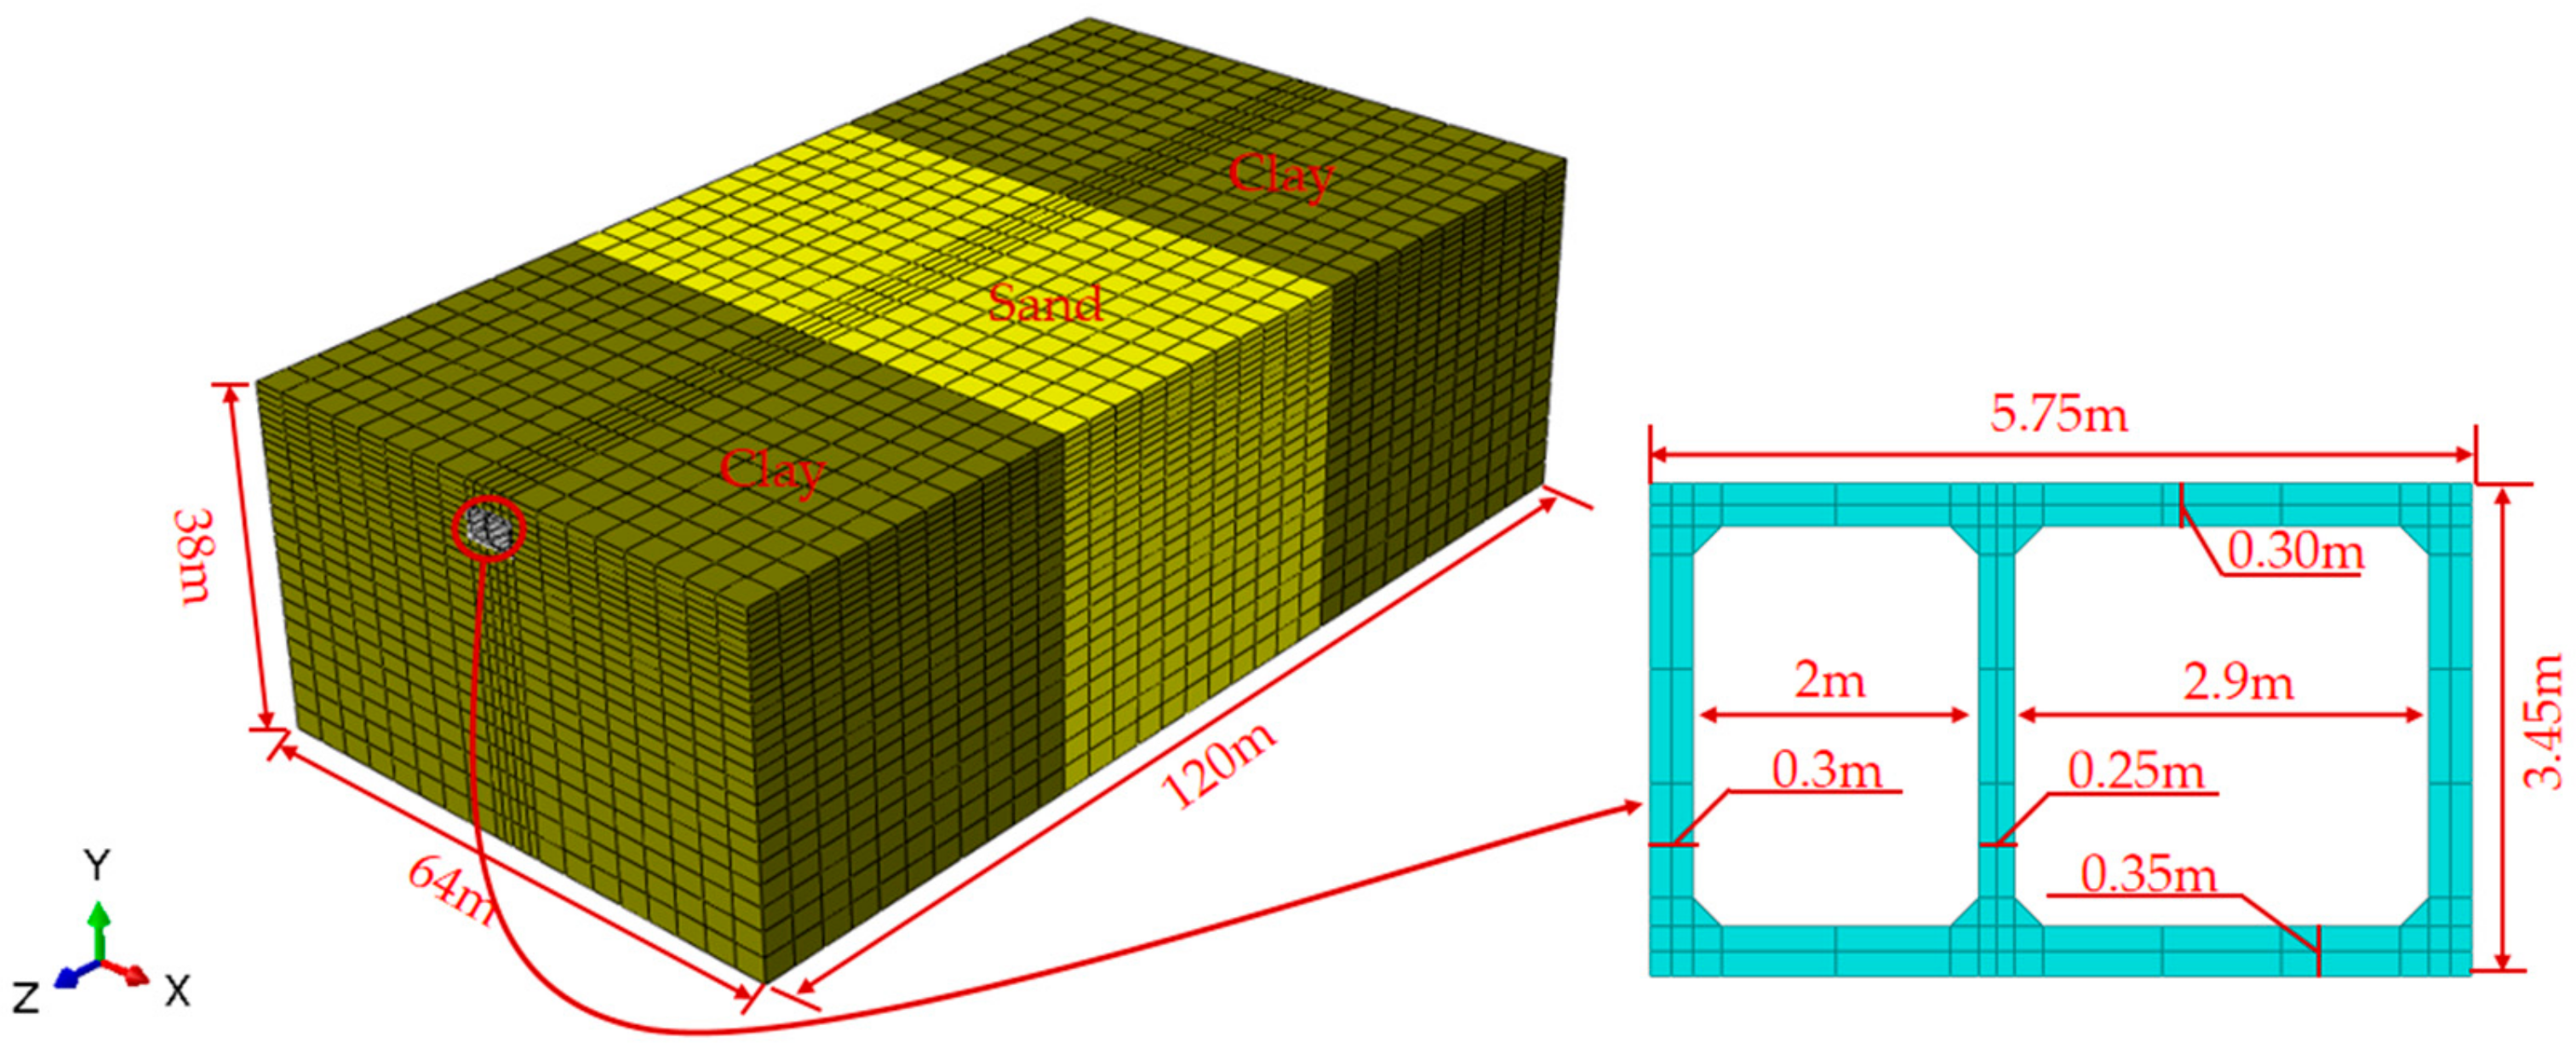
2. Numerical Simulation

The ABAQUS software was used to create a 3D numerical model based on a utility tunnel project which is 3.45 m high, 5.75 m wide, and 895 m long in Haikou, Hainan Province, China, as illustrated in Figure 1. In the seismic research of underground structures, it is necessary to determine the reasonable boundary size of the finite element model [29]: the longitudinal length of the structural model should be greater than 100 m, with the horizontal and vertical boundaries being at least three times the size of the structure. Considering the amount of calculations, the size of the three-dimensional numerical model used was 64 m × 38 m × 120 m. The numerical model was divided into three parts, each with a longitudinal length of 40 m. The middle part was sand, and the two sides were clay.
The Mohr–Coulomb constitutive model was selected as the constitutive model of the soil. A large number of studies on underground structures have used the Mohr–Coulomb constitutive model for soil materials, and ABAQUS has modified it to a certain extent and achieved good results [23,30]. Three-dimensional hexahedral eight-node solid elements (C3D8R) were used as the mesh elements. To enhance the precision and efficiency of the calculations, the soil mesh size near the utility tunnel was set to 1 m along the depth direction, while other areas were calculated with a mesh size of 3 m × 3 m × 3 m, and finally, 16,665 elements were formed. Table 1 presents the soil’s material characteristics [31,32].
The utility tunnel was modeled using the C3D8R element type, with the nonlinear behavior of the structure represented by the concrete damage plasticity model (CDP). The ideal elastic–plastic constitutive model was adopted for the steel bars, and the element type was represented by the two-node linear three-dimensional truss element (T3D2). The mesh size was 1 m, and finally, 60,000 elements were formed. Table 2 displays the concrete and steel bar’s physical and material characteristics. Table 3 displays the compressive and tensile characteristics of concrete, which were established according to the Chinese Code for Concrete Structure Design (GB 50010-2010) [33].
The interaction between the utility tunnel and the soil was treated by surface-to-surface contact. The master surface and the slave surface were assigned to the structural surface and the soil surface, respectively. The friction coefficient was selected as 0.3 for the tangential behavior, and hard contact was selected for the normal behavior [6,34]. For the constraint setting of the rebar utility tunnel structure, an embedded region was created, and the steel mesh was embedded in the utility tunnel structure.
The finite element model uses a viscoelastic boundary as its boundary condition [35]. Besides the free boundary on the top of the finite element model, the remaining surfaces of the model are designated as viscoelastic boundaries, as shown in Figure 2. The spring’s stiffness and damping coefficients are as follows:
K N = 1 1 + A λ + 2 G r ,   C N = B ρ c p
K T = 1 1 + A G r ,   C T = B ρ c s
where KN and KT are the normal and tangential stiffness coefficients of the spring, respectively; CN and CT are the damping coefficients in the normal and tangential directions, respectively; the medium Lamé constant is denoted by λ; the shear modulus is denoted as G; ρ is the density of the medium; cp and cs are the transverse and longitudinal wave velocities, respectively; and r is the distance from the geometric center of the underground structure to the boundary line or surface of the artificial boundary point. The suggested values for parameters A and B are 0.8 and 1.1 in Ref. [35].
In Haikou, the fortification intensity is rated at 8 degrees on the ground motion parameter zoning map of China, with a basic seismic acceleration of 0.3 g [36]. In the event of an earthquake, it is crucial for the utility tunnel to maintain the city’s normal operations. Therefore, when the seismic fortification intensity of the area where the utility tunnel is located is 6–8 degrees, the fortification intensity should be increased by one level [37]. In order to simulate near-field moderate-magnitude seismic action, this study used the first 15 s record of the north–south direction of the 1940 El Centro seismic wave, which had a magnitude of 7.1. Taking a time step of 0.02 s, the original seismic wave was baseline-corrected and data-filtered, and the corrected seismic wave was as shown in Figure 3. Referring to the ground vibration input method introduced by Huang [38], the seismic waves were modified to 0.2 g and 0.4 g for vertical input at the base of the soil model.
The purpose of this study is to examine how varying depths of burial impact the seismic behavior of utility tunnels. Four burial depths of 2.5 m, 5 m, 7.5 m, and 10 m were selected for analysis. The model was subjected to X-direction seismic input, and eight site conditions were established, as shown in Table 4. Due to symmetry in the longitudinal direction, only half of the finite element model was studied. Finally, the cross-sections of 60 m (in sand) and 100 m (in clay) were selected as the analysis sections.

3. Results and Discussion

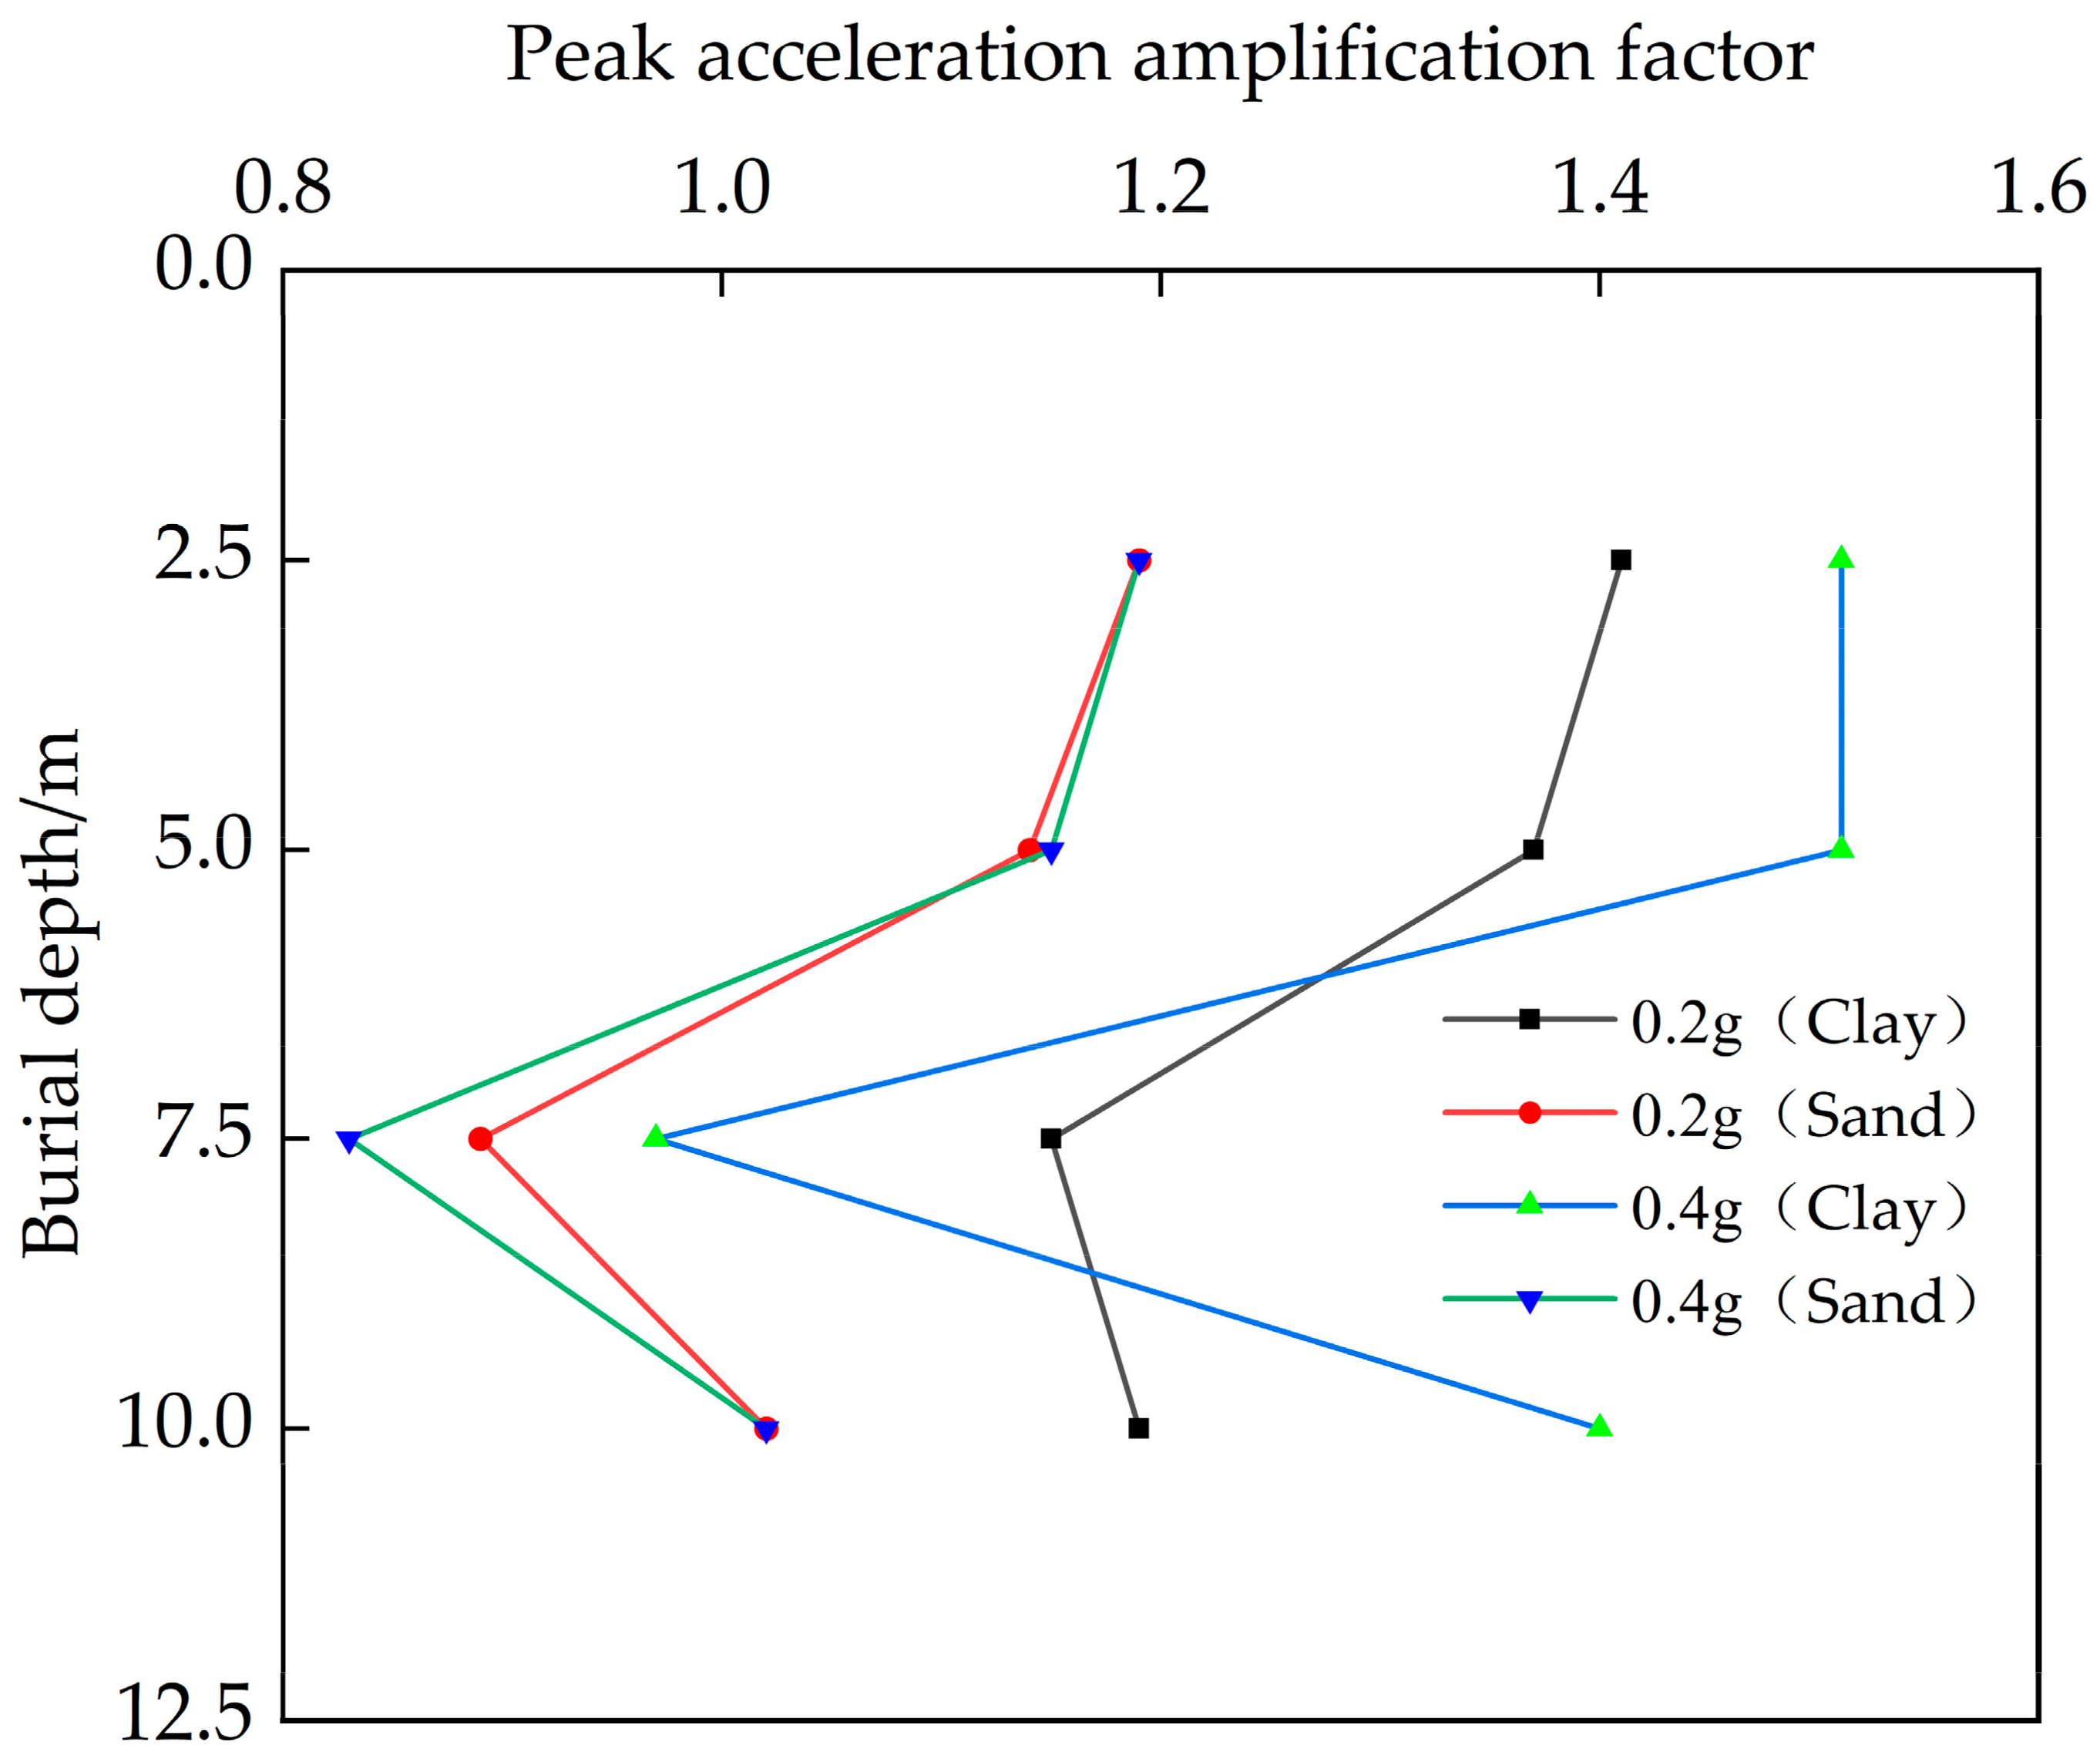
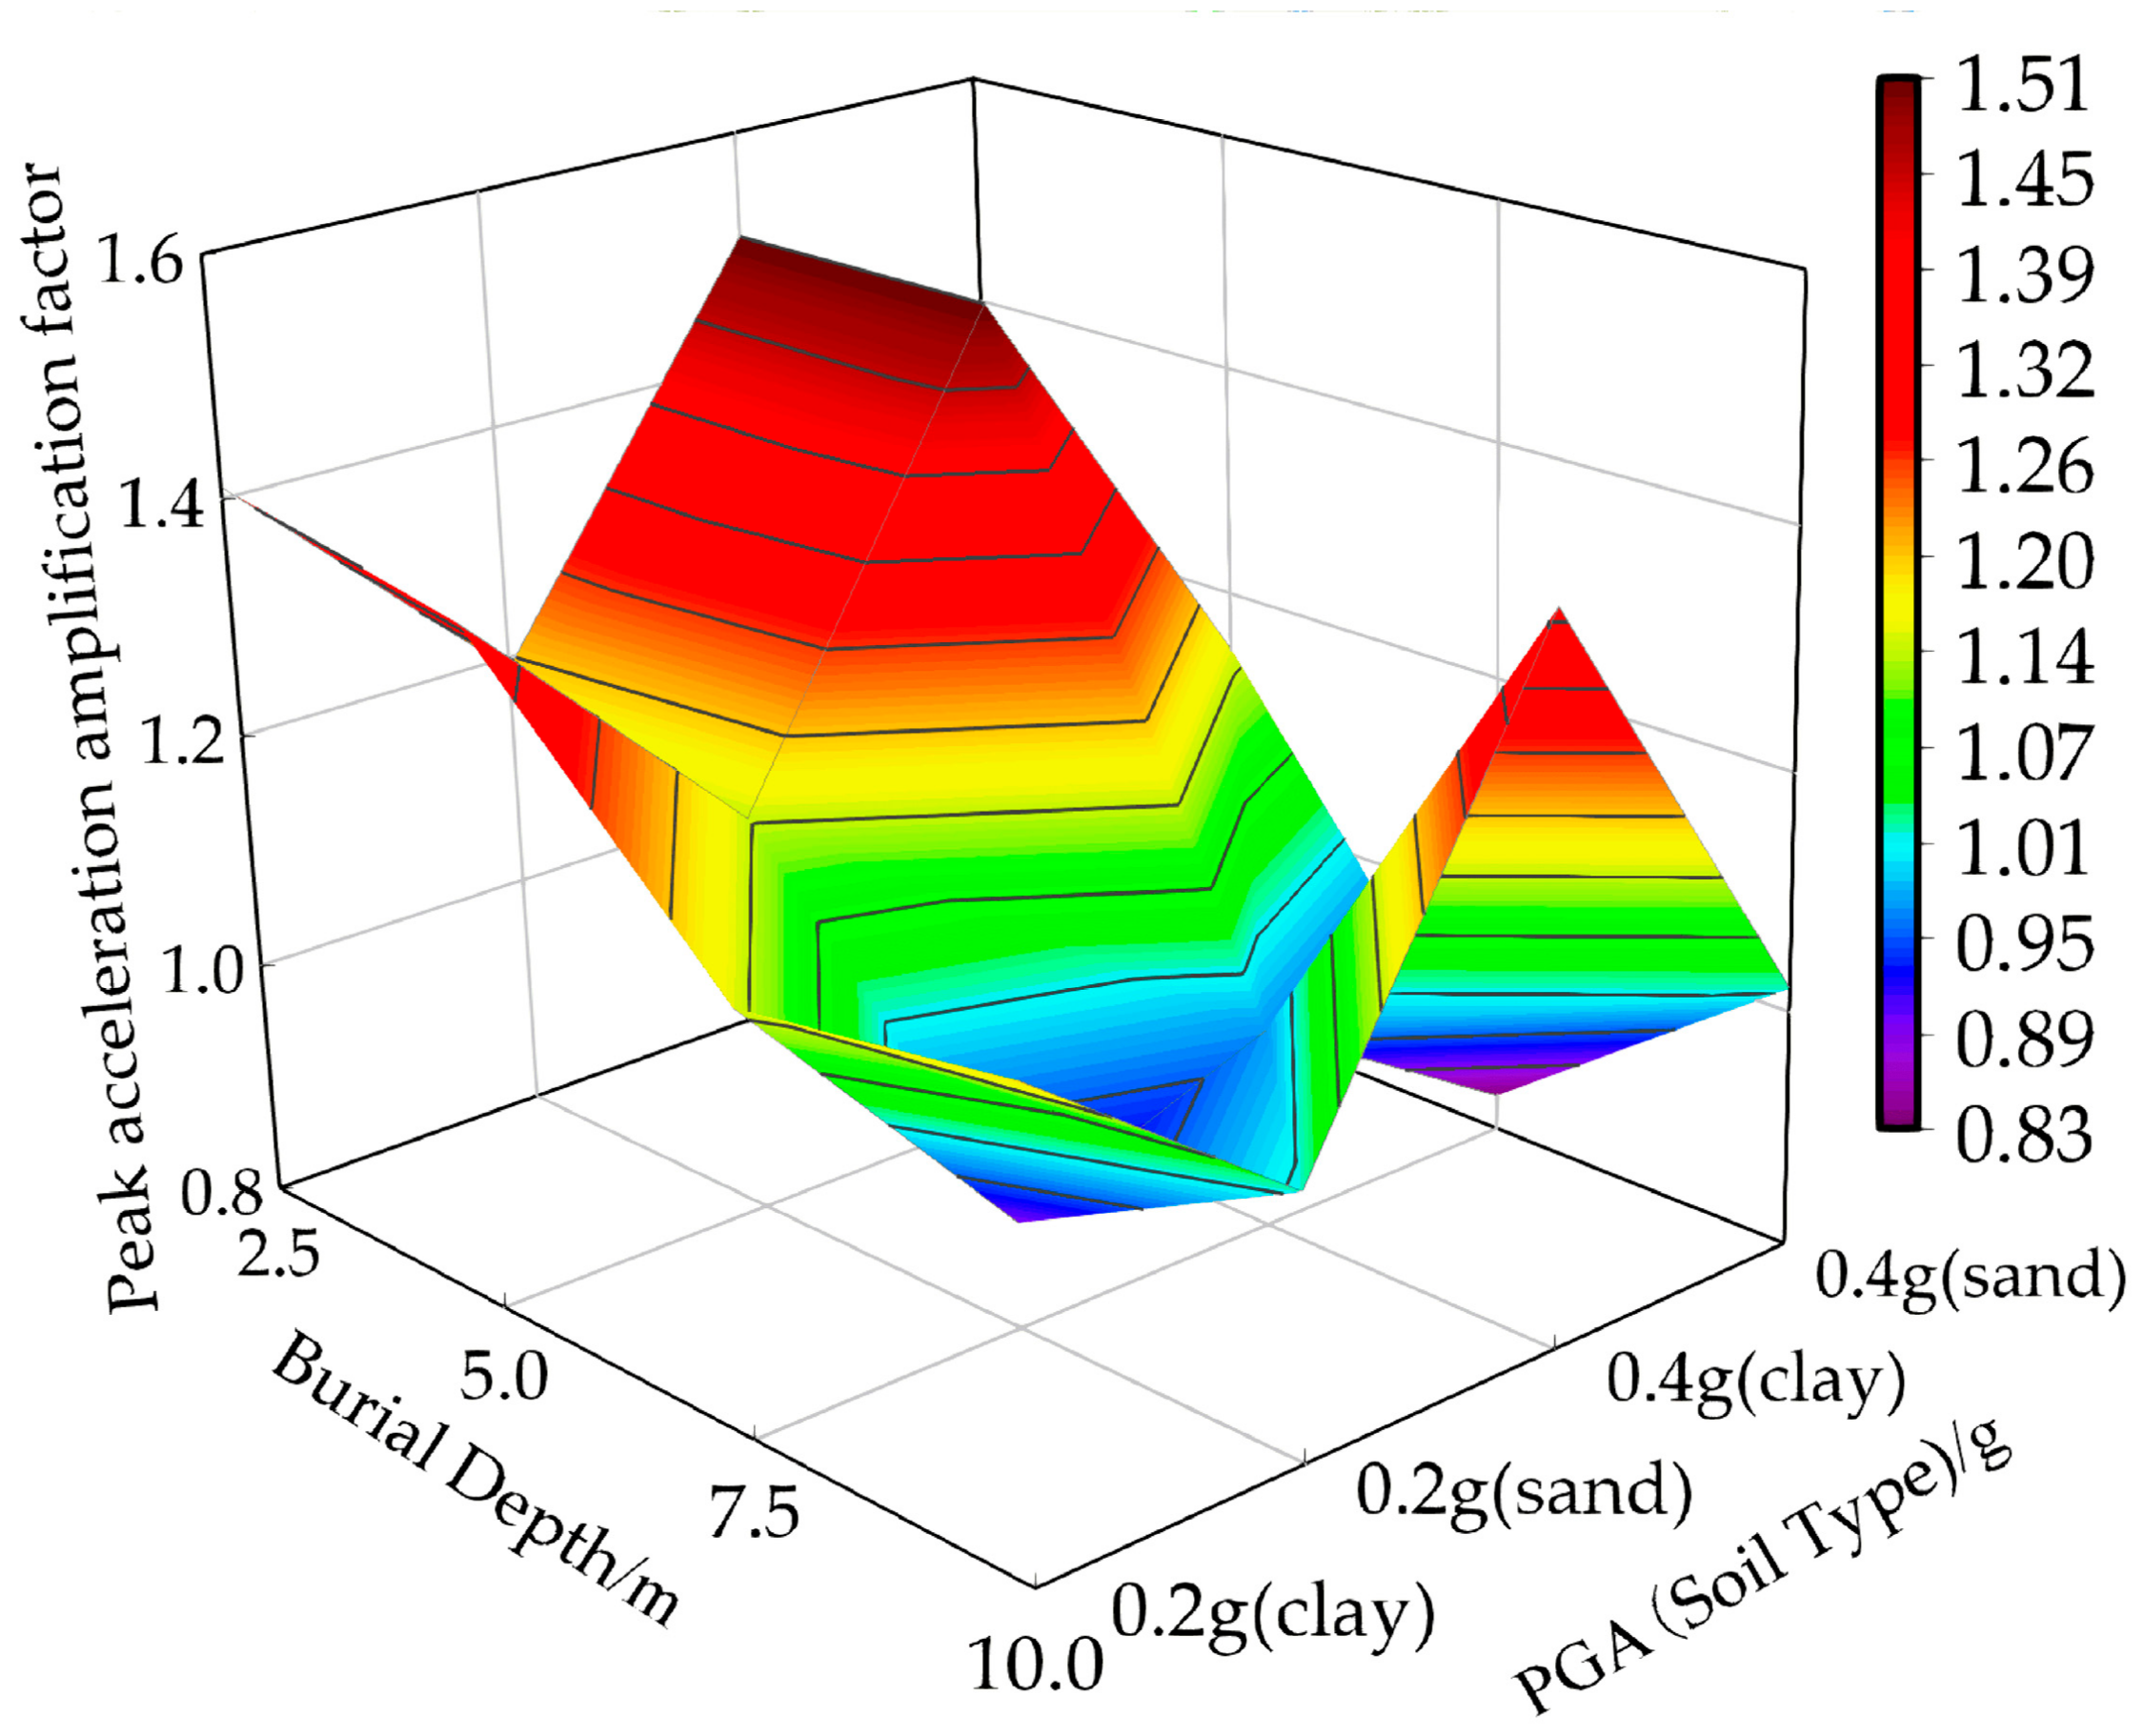
3.1. Analysis of Acceleration Response

The seismic response at different locations to the same ground shaking can vary depending on site conditions, depth of strata, and material properties of underground structures and soils [39]. As described in this section, the soil near the roof of the utility tunnel was selected as the monitoring point to study the acceleration response characteristics of the utility tunnel at various depths of burial. Table 5 displays the peak acceleration of the soil at different burial depths. As shown in the table, the soil’s peak acceleration rises with the increasing intensity of the ground motion. Under the same site conditions, the peak acceleration in the clay is greater than that in the sand; the maximum soil acceleration tends to first decrease and then increase as the utility tunnel structure’s burial depth increases.
Figure 4 shows that the soil in the clay exhibits higher acceleration amplification coefficients compared to the sand when subjected to the same intensity of ground shaking. This is because the clay has less stiffness, and its amplification effect is more obvious under the action of ground shaking. When the PGA increases from 0.2 g to 0.4 g, the acceleration amplification factor of soil in the sand increases from 0.8 to 1.2, while that in the clay increases from 0.8 to 1.6. The soil acceleration amplification coefficient distribution characteristics in the sand remain consistent at PGA levels of 0.2 g and 0.4 g. At a burial depth of 7.5 m, the minimum acceleration peak amplification coefficient appears at each monitoring point. Under this condition, the maximum amplification factor of the soil decreases as the PGA increases.
Figure 5 shows the distribution characteristics of the acceleration amplification coefficient in two soils under different ground motion intensities and burial depths of a utility tunnel structure when subjected to earthquake action. It can be found that the acceleration amplification factor may have an extremely large value when the utility tunnel has a shallow burial depth, a large PGA, and is in clay. For example, when the utility tunnel is in the clay under site condition 5, the acceleration amplification coefficient of the soil is 1.51.

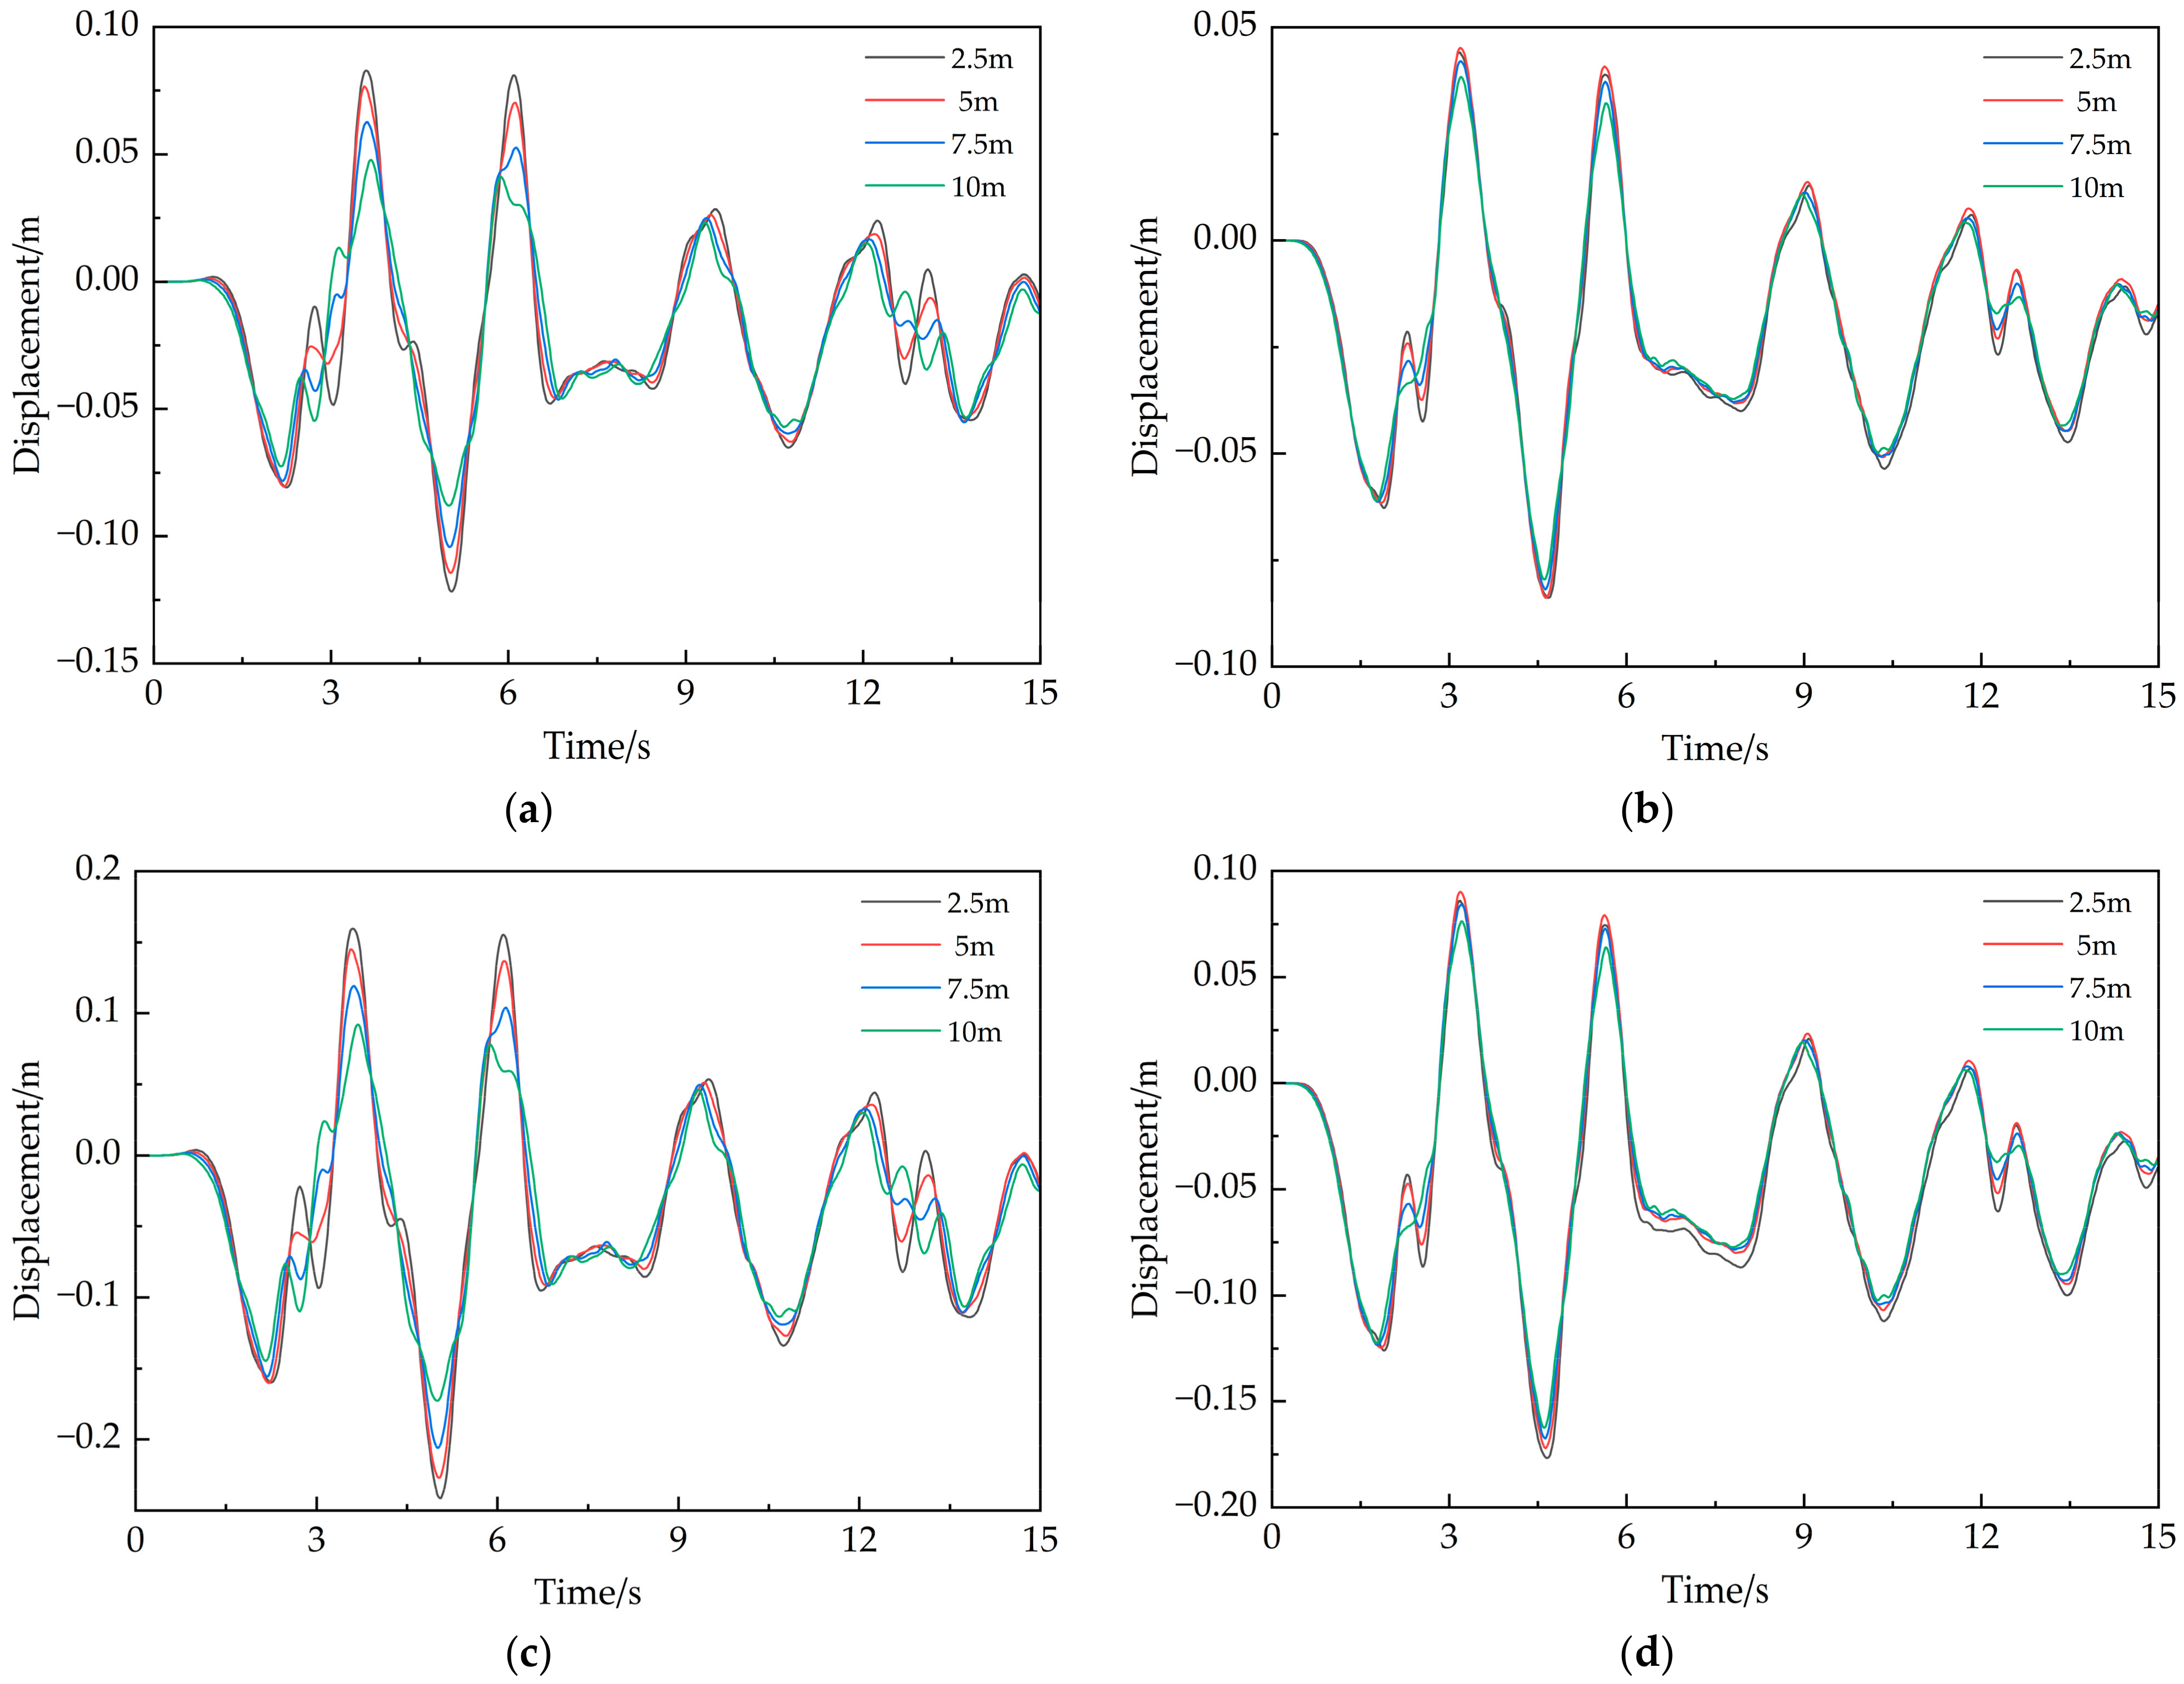
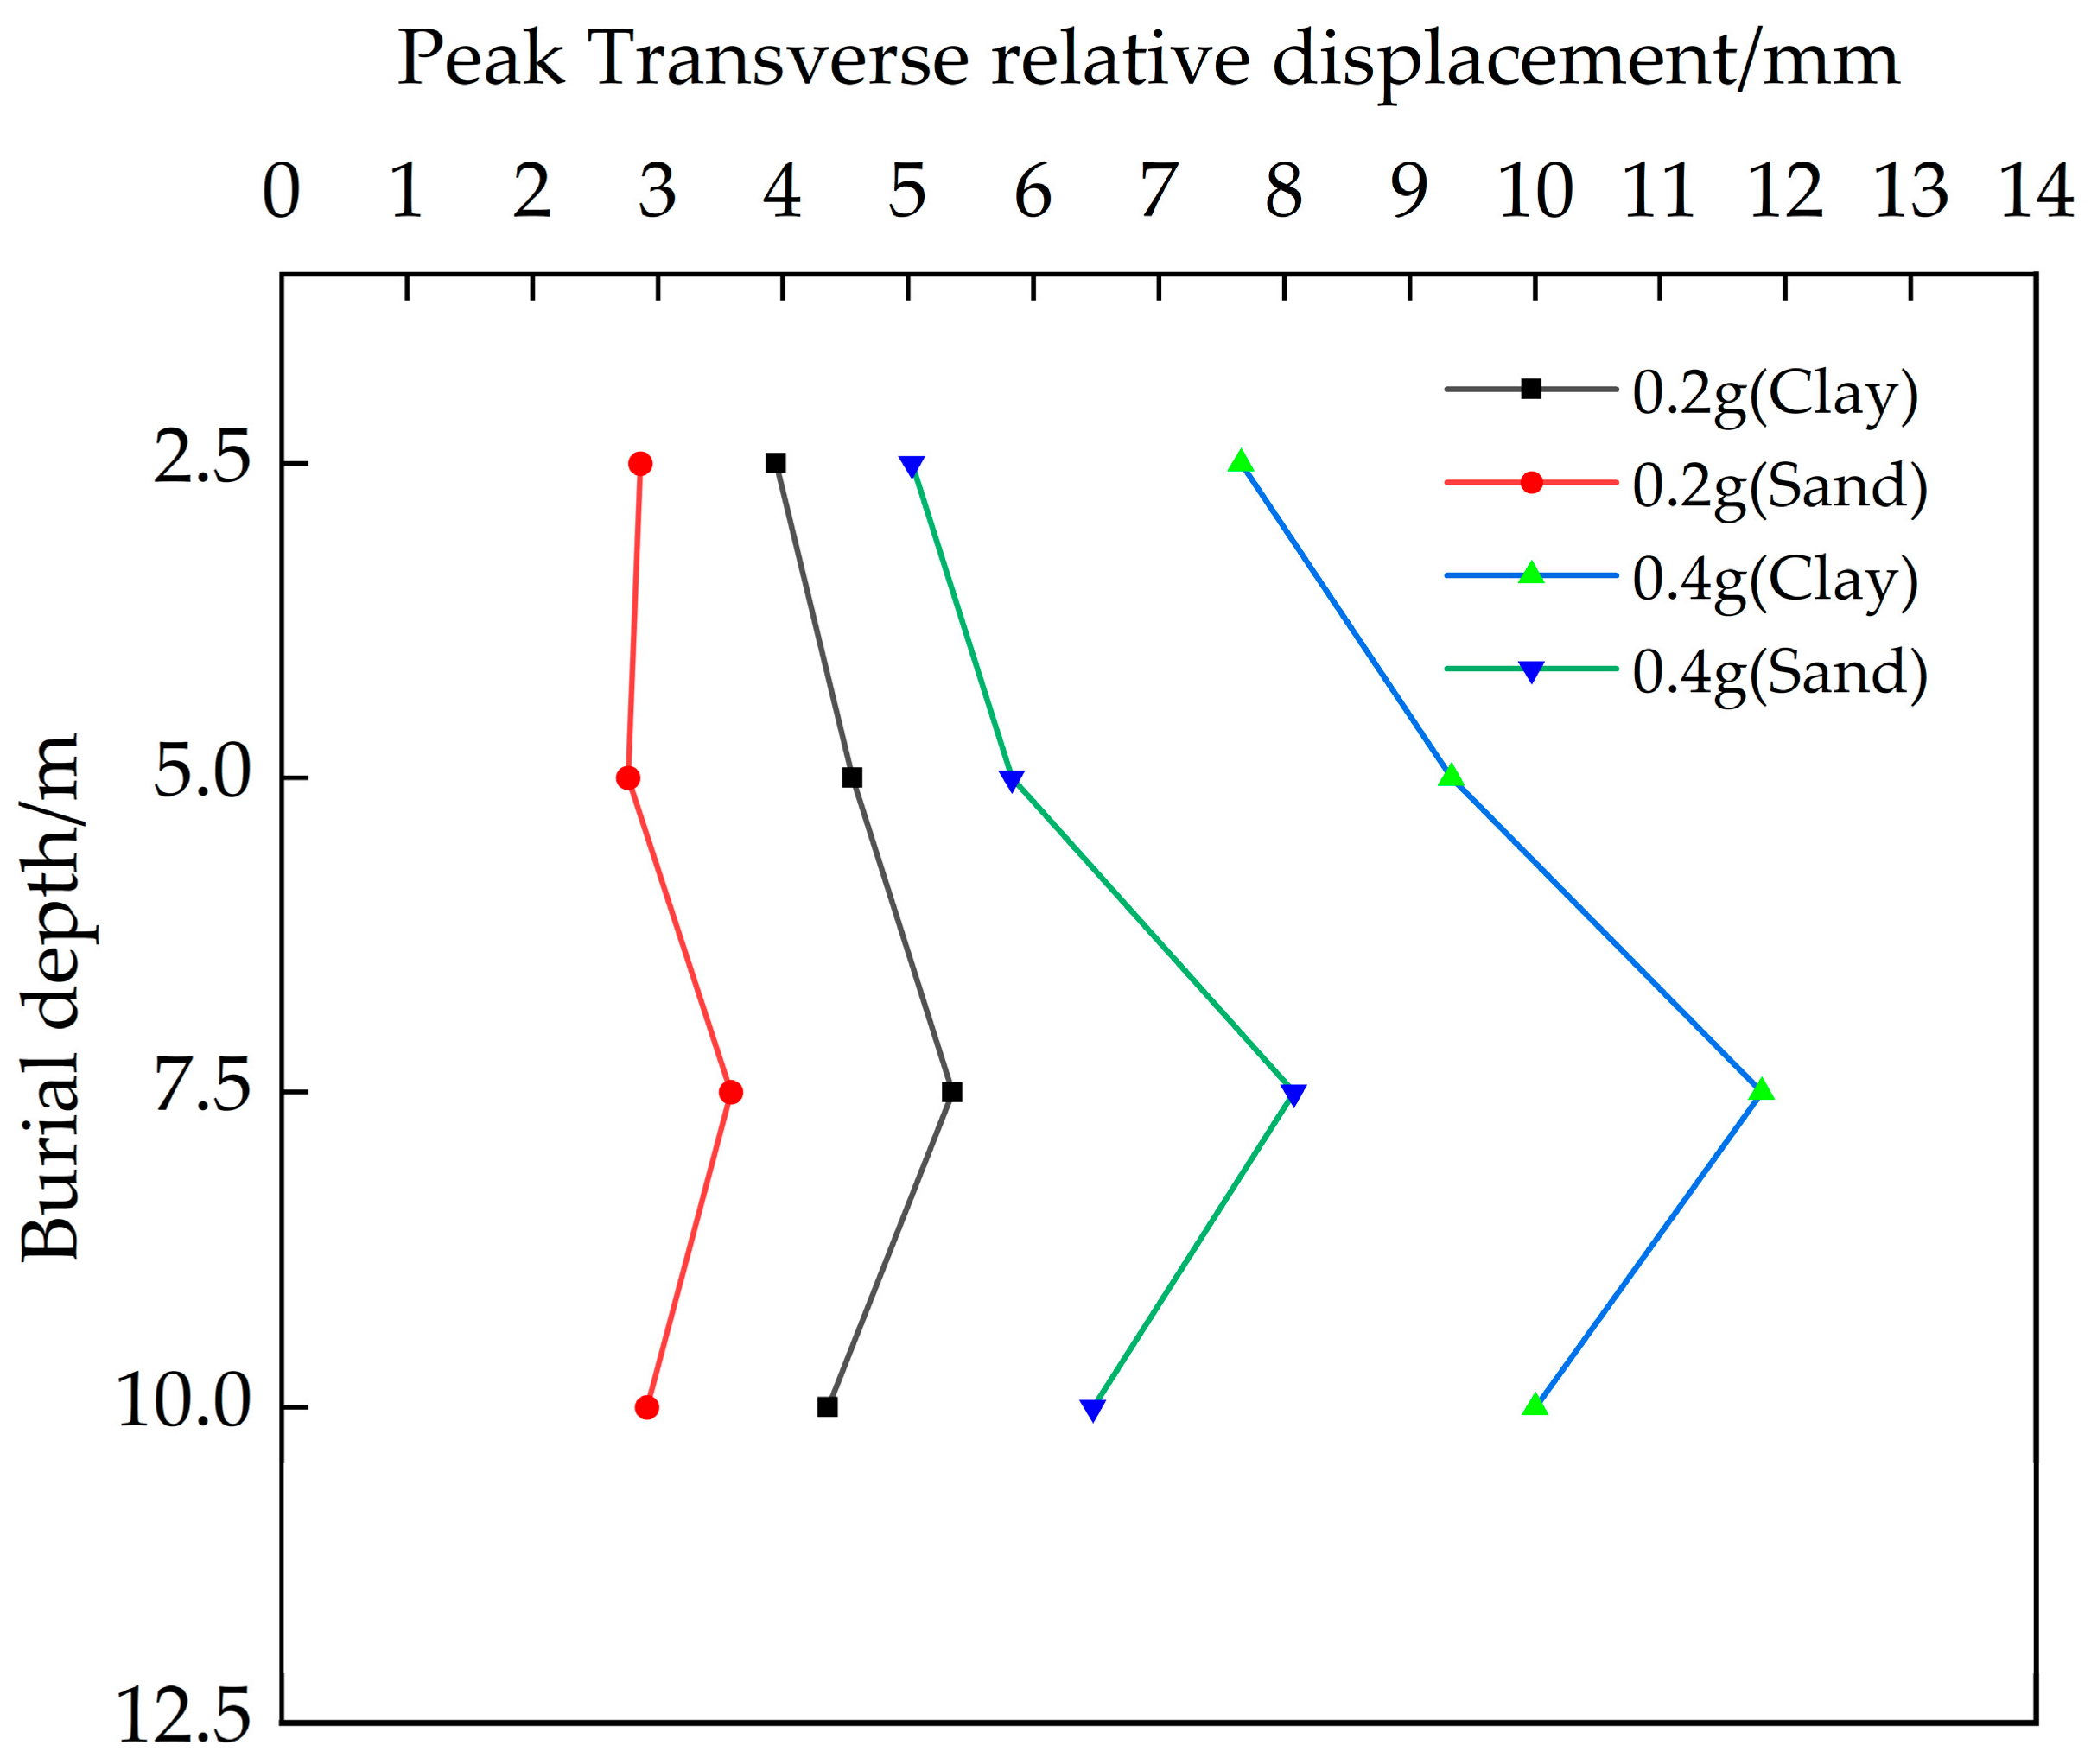
3.2. Analysis of Displacement Response

Monitoring points are placed on the roof of the utility tunnel to study the changes in displacement in the non-homogeneous field. Figure 6 displays the displacement time history graphs for the utility tunnel structure roof at various depths of burial. As shown in the figure, the utility tunnel located in the clay has a maximum peak displacement at 5 s (4.62 s in the sand). The displacement change curves of the utility tunnel structure remain consistent, with the peak displacement decreasing as the structure’s burial depth increases under the same ground vibration intensity. Table 6 shows that the utility tunnel structure undergoes greater peak displacement in clay than in sand under the same conditions. Further examination shows that at a PGA of 0.2 g, the peak displacement of the utility tunnel in clay decreases by 5.79%, 8.77%, and 15.38% as the burial depth of the structure increases. When the PGA is 0.4 g, it decreases by 5.81%, 9.25%, and 16.01%. In the sand, the peak displacement of the utility tunnel is reduced by 1.19%, 1.20%, and 2.44% when the PGA is 0.2 g, and by 2.82%, 2.91%, and 2.99% when the PGA is 0.4 g. It can be seen that increasing the structural depth leads to a higher decrease rate in the peak displacement of the utility tunnel structure, with clay experiencing a greater rate of decrease than sand.
Table 7 shows the peak lateral displacement differences for site conditions 1–8. Figure 7 shows the variation in peak values of transverse displacement difference between the roof and floor of the utility tunnel along the burial depth distribution. The transverse displacement difference indicates the extent of the shear deformation of the utility tunnel. Under the same conditions, the lateral displacement difference peak of the utility tunnel structure is greater in the clay than in the sand. This indicates that the shear deformation of the utility tunnel is greater in the clay than in the sand. The lateral displacement difference of the utility tunnel structure increases initially and then decreases as the structure is buried deeper. The maximum displacement difference occurs at a depth of 7.5 m, indicating that the utility tunnel may experience significant lateral shear deformation at this depth.

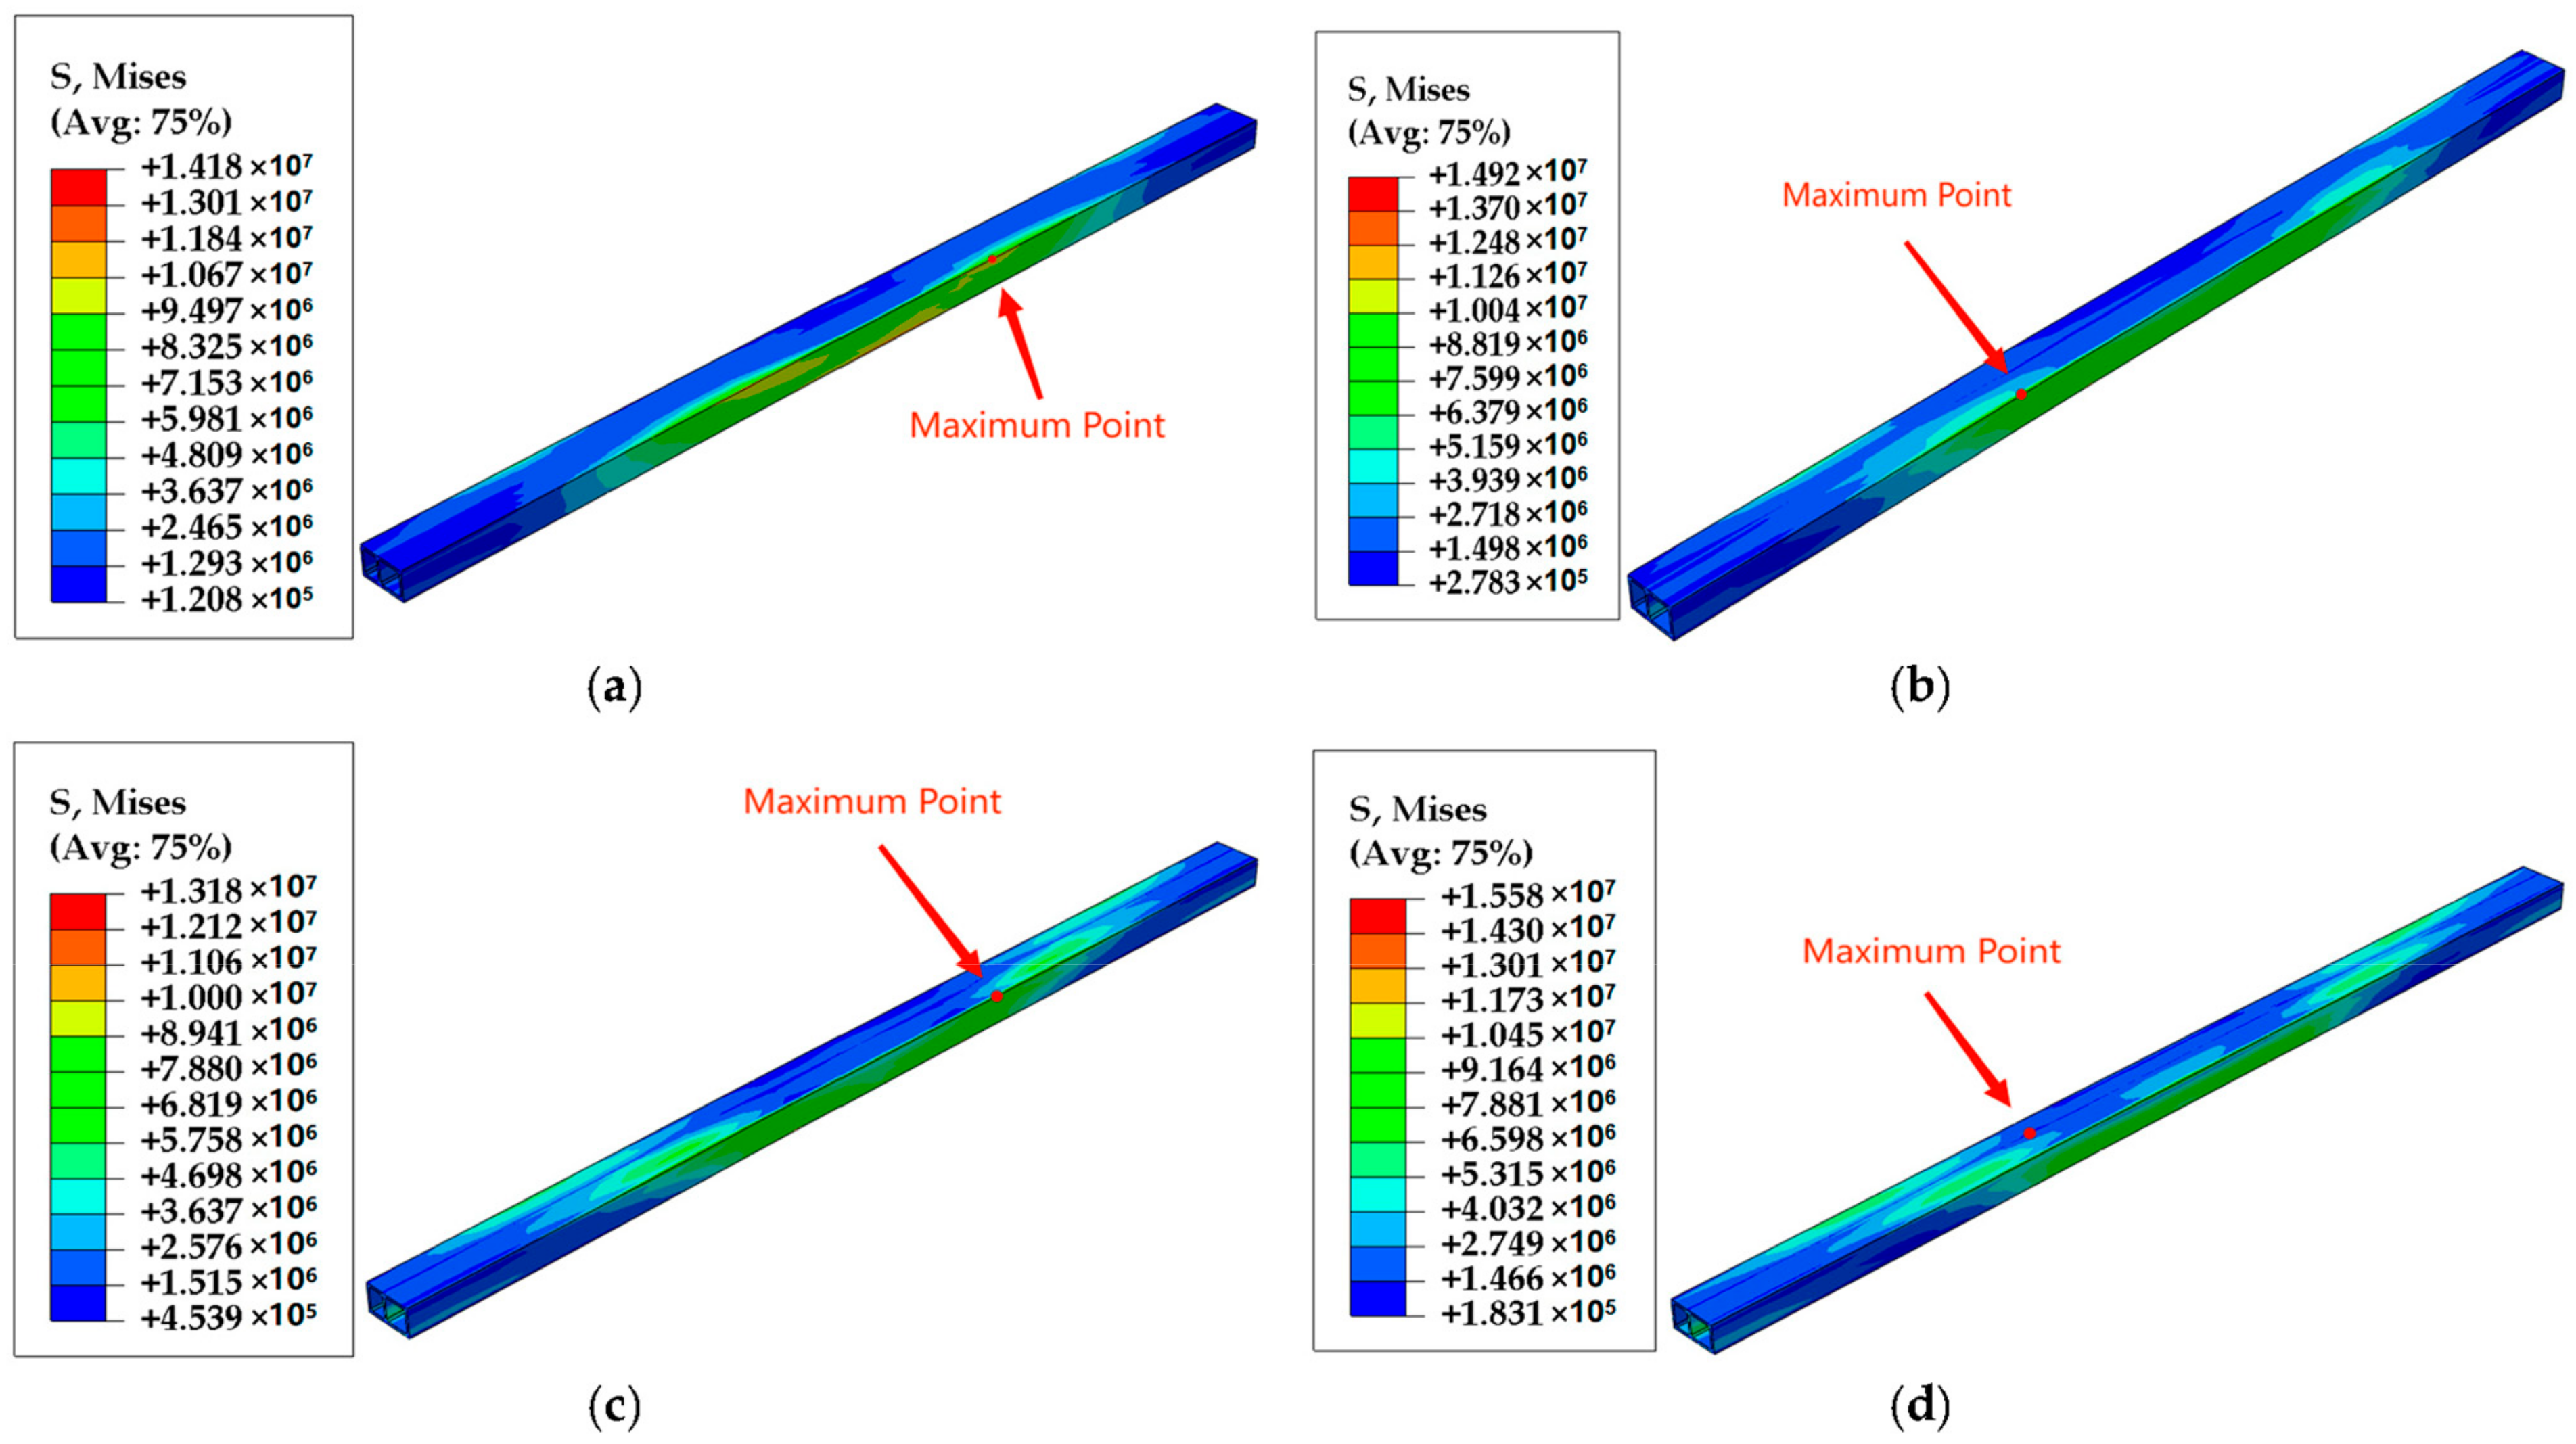
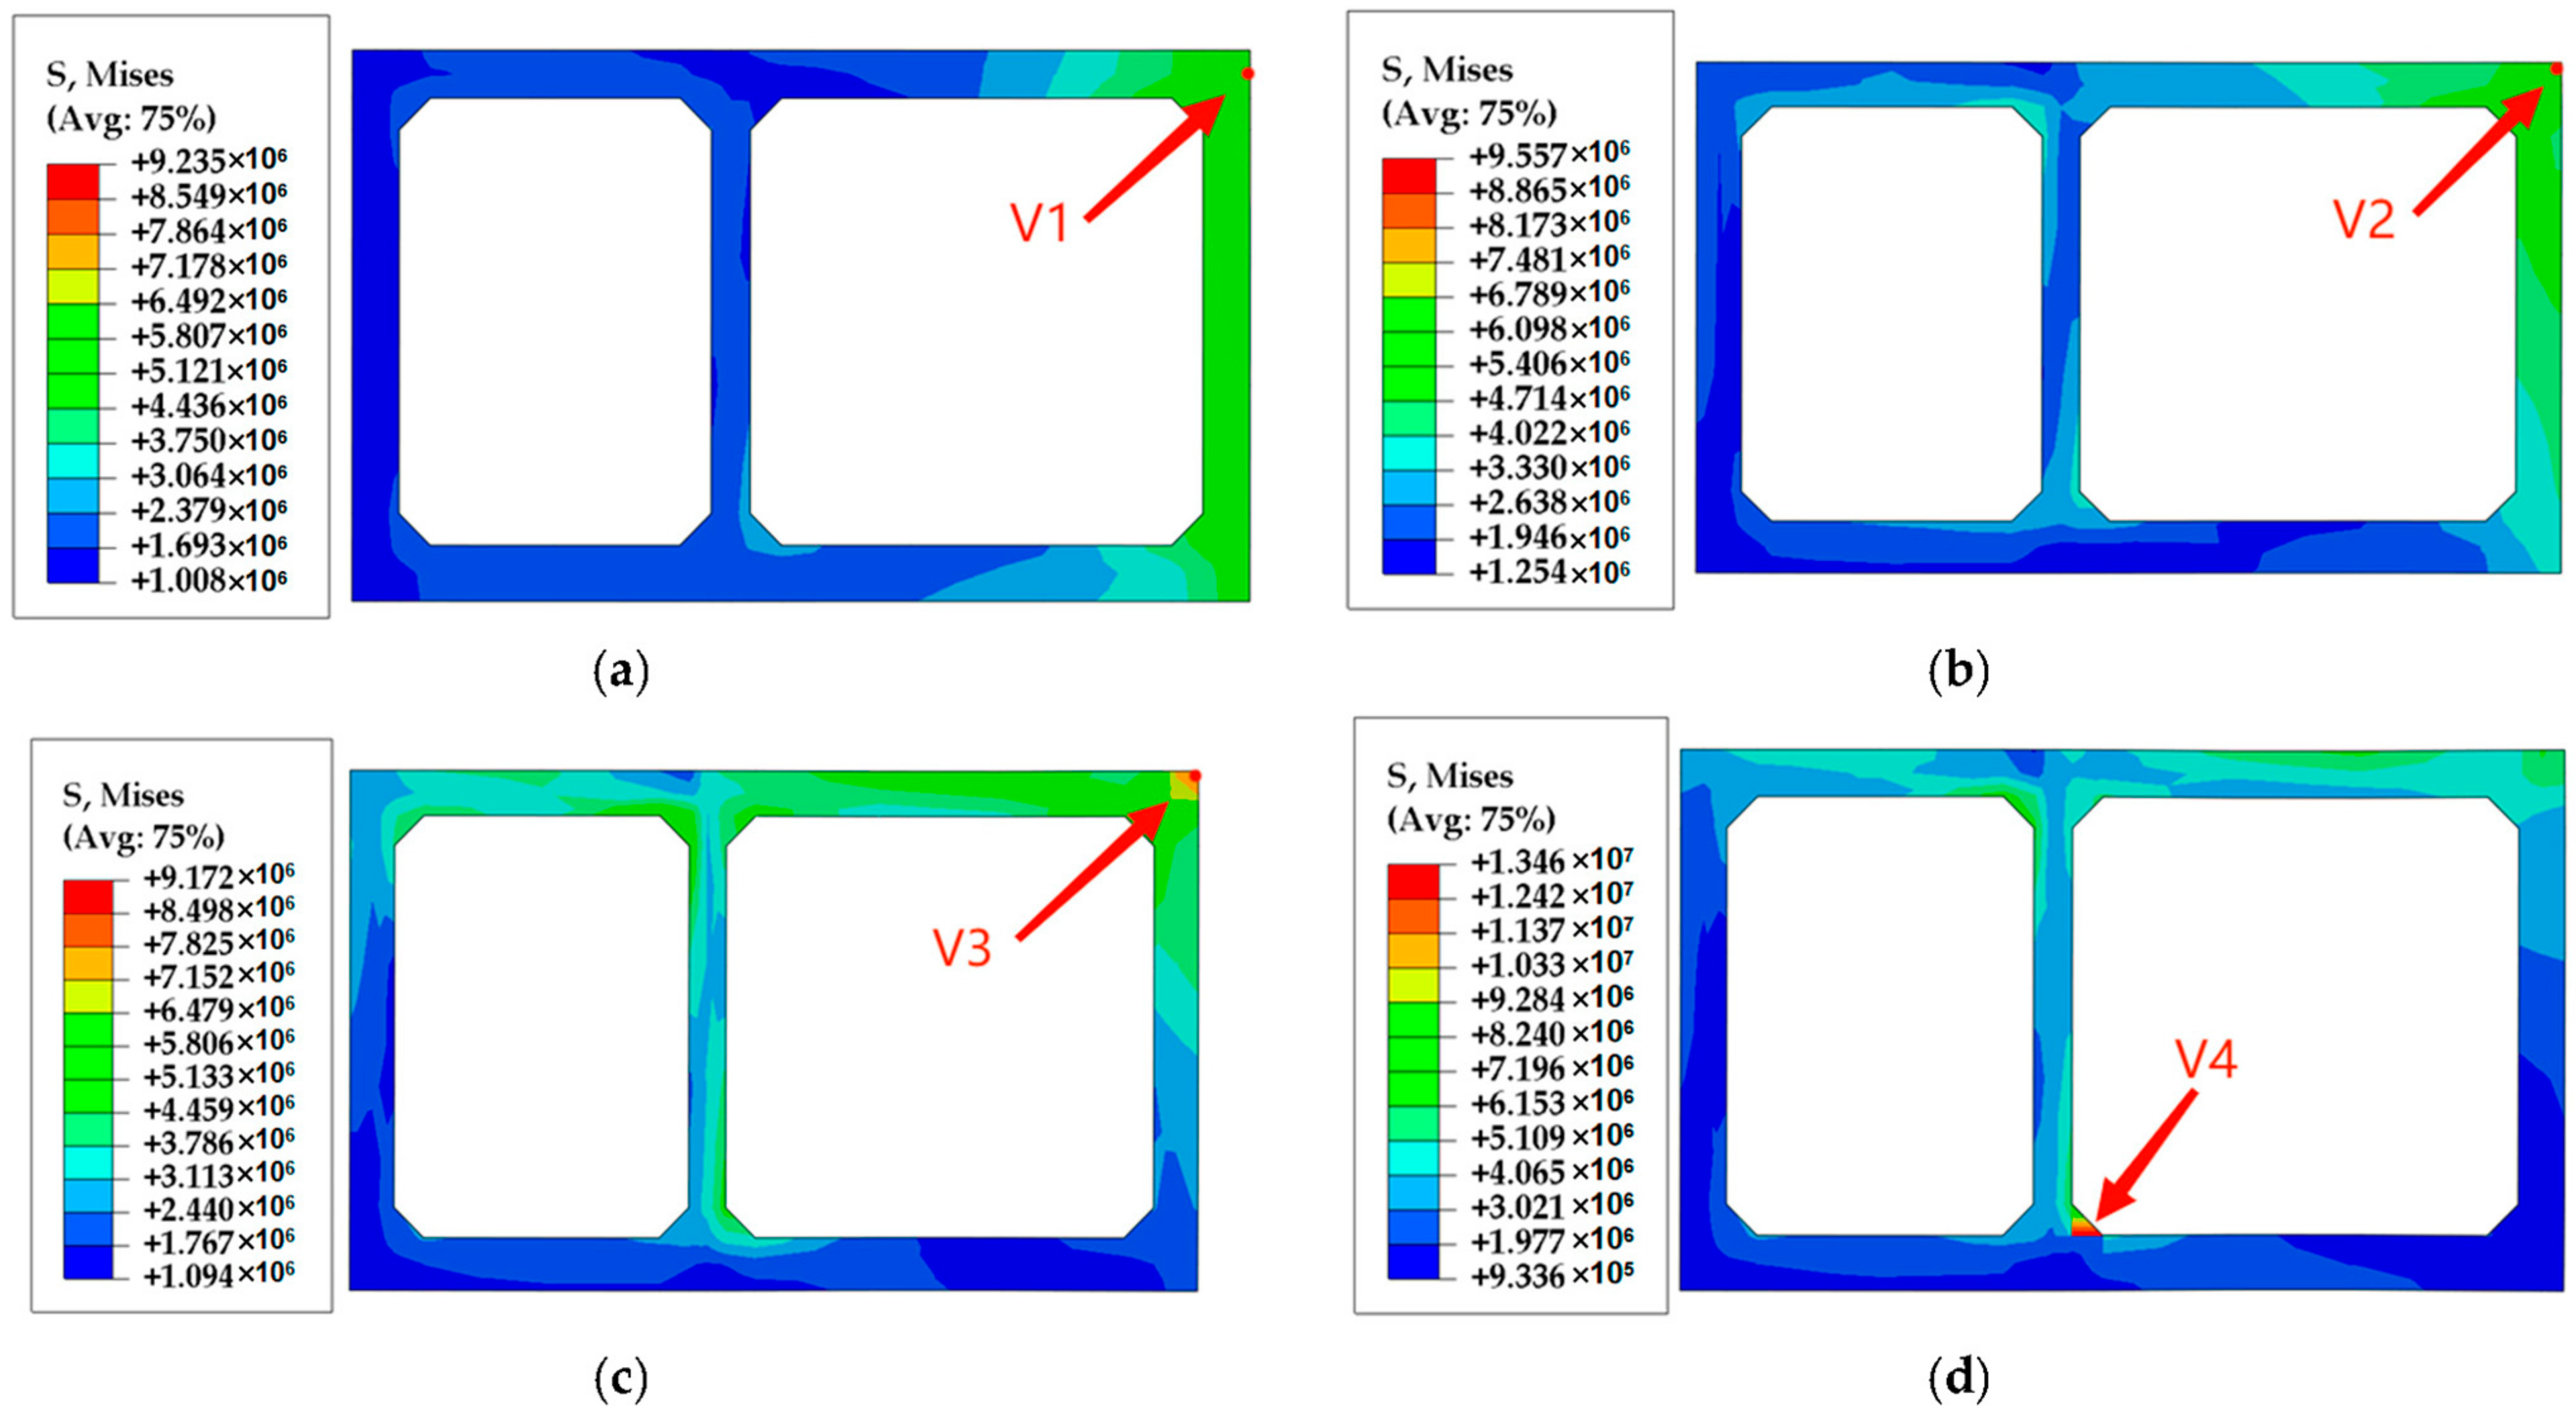
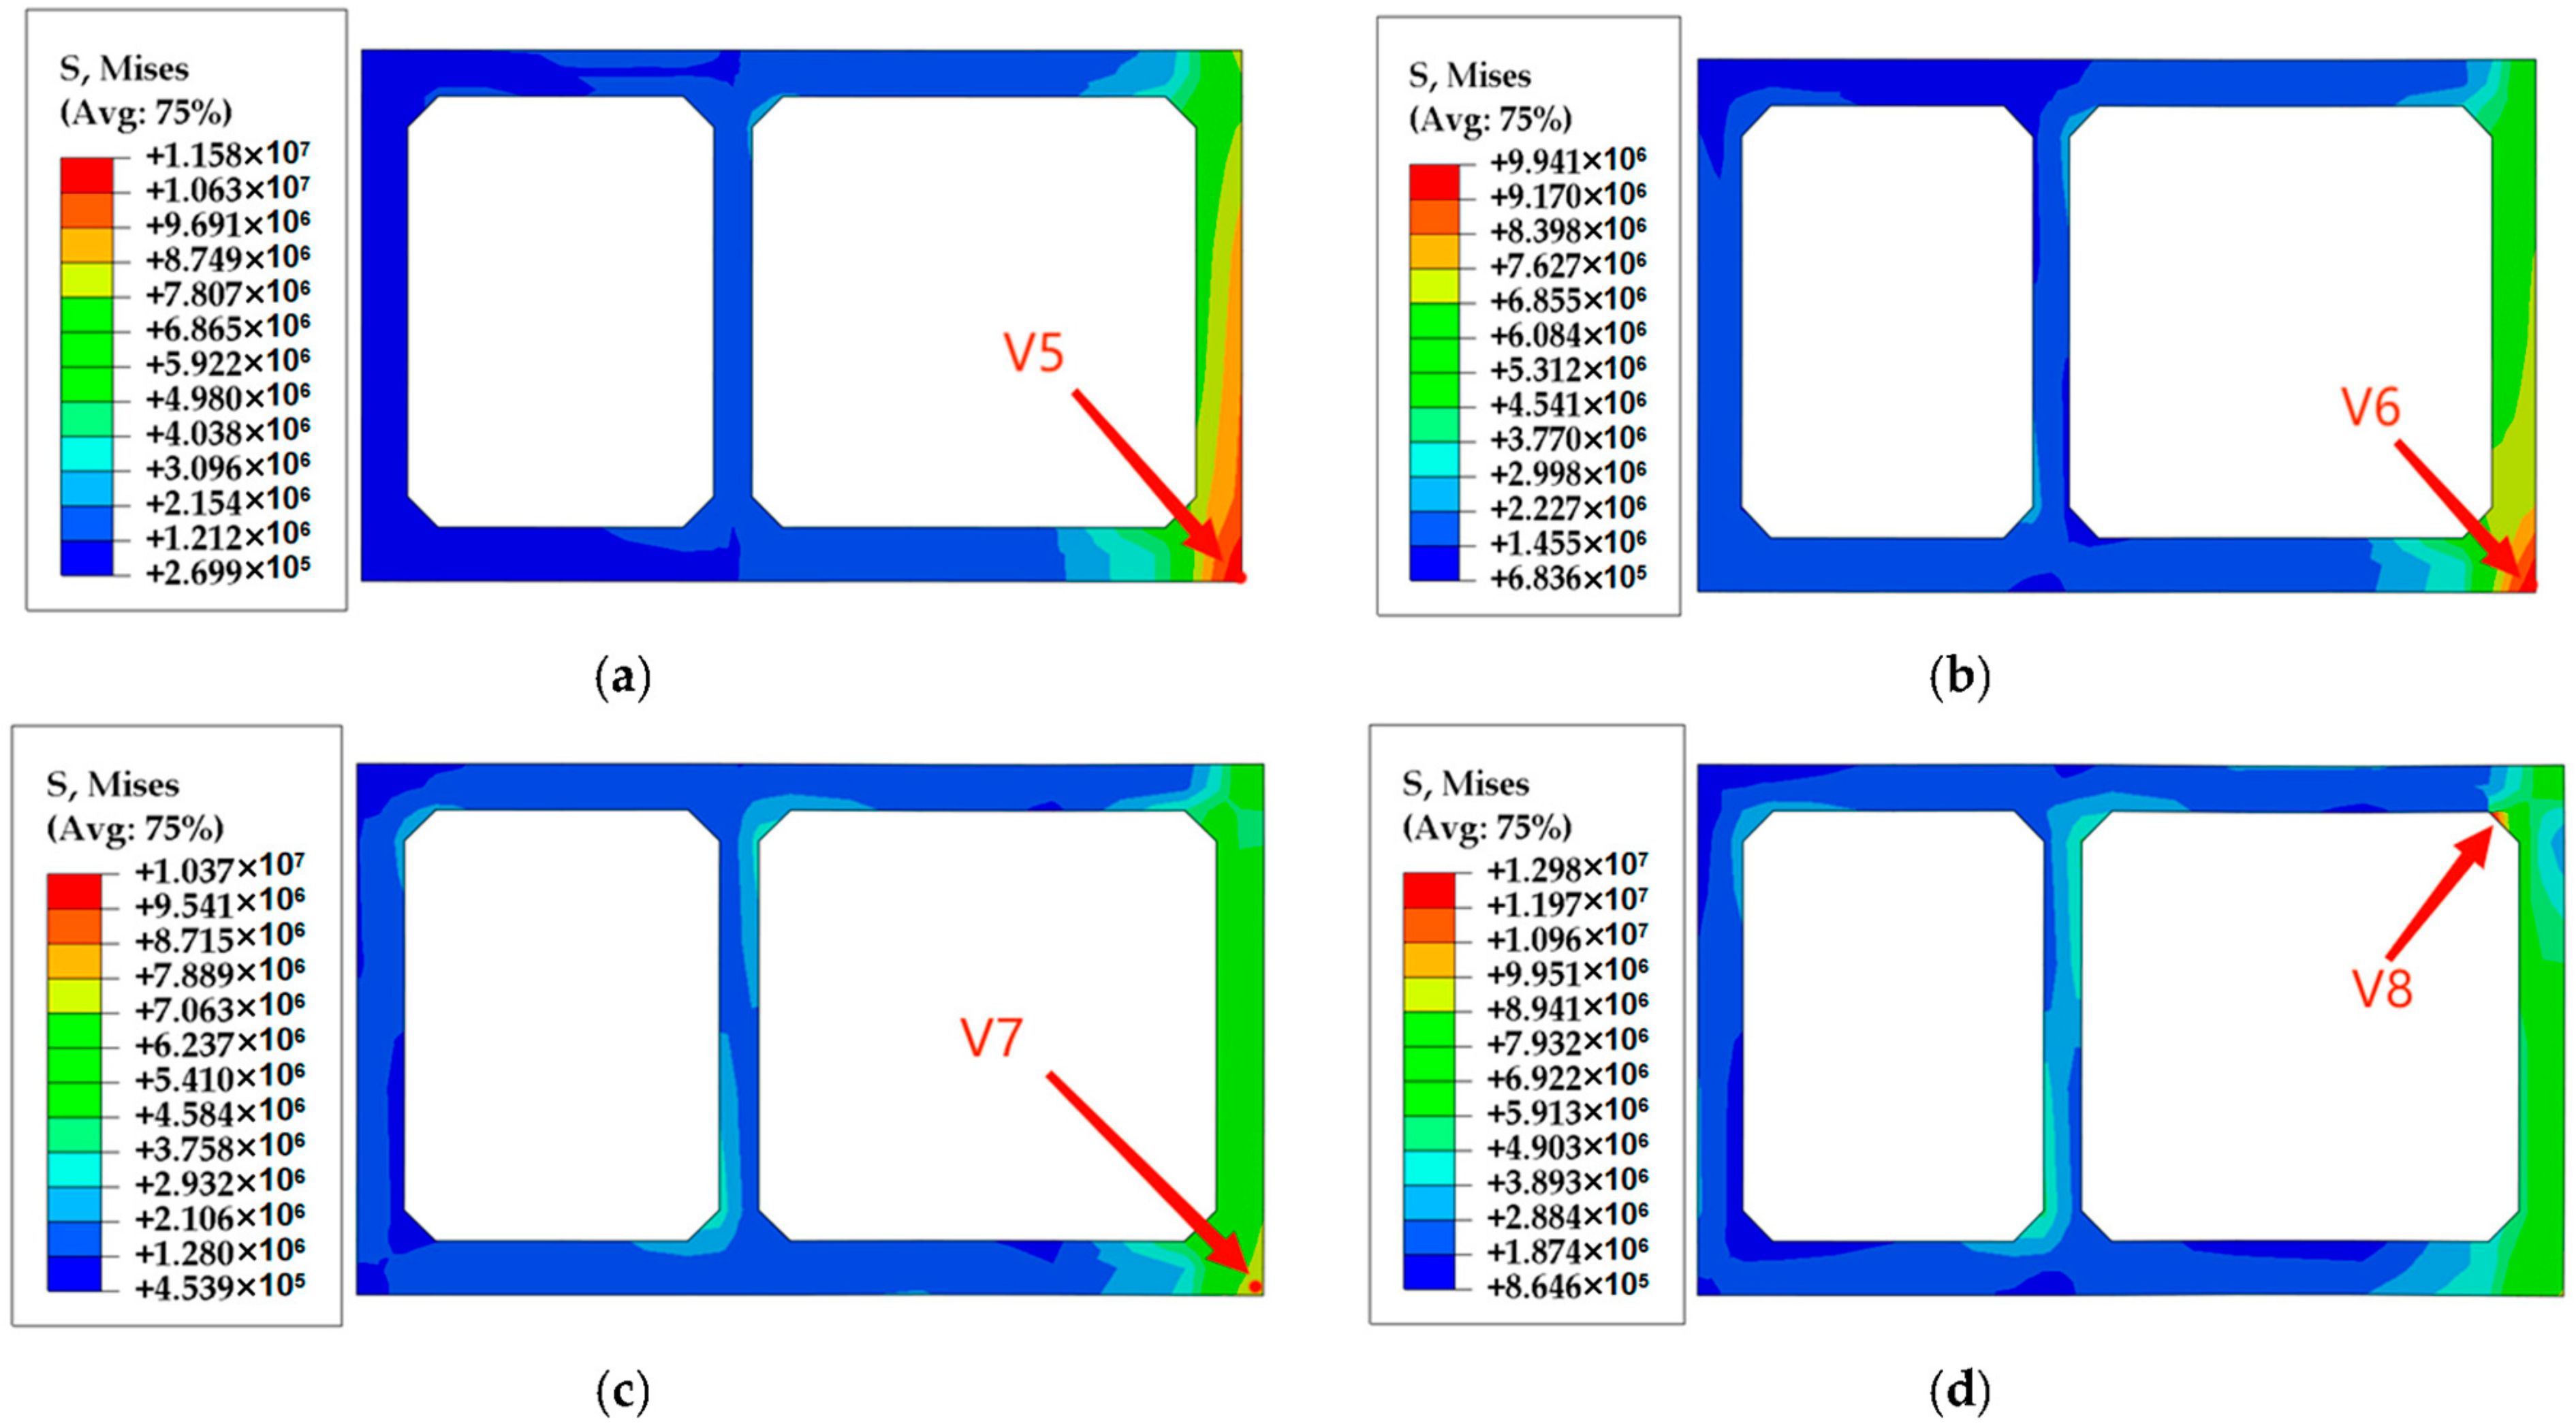
3.3. Analysis of Stress Response

The displacement of clay and sand in a non-homogeneous site under earthquake conditions will be different, and the utility tunnel will produce a relative displacement difference between the two soil types. When the peak of the relative displacement difference occurs, the utility tunnel will have a large stress response at that moment [23]. We found that the maximum relative displacement difference peak occurs at 6.16 s for site condition 5. This section examines how the stress response of the utility tunnel is affected by the depth at which the structure is buried. Figure 8 shows the von Mises stress cloud diagram at 6.16 s in work conditions 5–8. The maximum von Mises stresses of the utility tunnel structure at this time for work conditions 5–8 are 14.18 MPa, 14.92 MPa, 13.18 MPa, and 15.58 MPa with increasing burial depth, respectively, and they are all at the interface of the clay and the sand. As the burial depth increases, the variation characteristics of the peak von Mises stress and acceleration response become similar. When the burial depth is 2.5 m, the utility tunnel experiences primary bending deformation from lateral forces, and the displacement generated by clay is greater than that by sand, which will cause the right side of the middle position of the utility tunnel to be pressured (all the sand and part of the clay–sand). As the burial depth of the structure increases, the load of the overlying soil gradually increases, and the stress distribution area on the right side of the center of the utility tunnel gradually decreases. The stress distribution starts to appear on two sides of the utility tunnel (clay–sand interface) and at the middle of the top.
Figure 9 and Figure 10 show the cross-sections with relatively concentrated von Mises stress in the clay and sand at 6.16 s for further analysis. Table 8 displays the maximum von Mises stress for the corresponding section. As shown in Figure 9, at a depth of 2.5 m, the von Mises stress is evenly distributed on the right side wall of the utility tunnel. When buried 5 m deep, the von Mises stress is concentrated in the corner of the right wall, and a larger stress distribution occurs in the middle partition. At a burial depth of 7.5 m, the stress distribution extends to the right side of the top of the utility tunnel. Additionally, the stress distribution area of the middle partition expands, and there is a stress concentration at the top right corner of the utility tunnel. The maximum von Mises stress value is 7.48 MPa. At a burial depth of 10 m, the von Mises stress distribution is situated at the top plate of the utility tunnel. A stress concentration is observed at the lower left corner point of the large cabin, with a maximum von Mises stress value of 13.46 MPa.
Figure 10 shows that at a burial depth of 2.5 m for the utility tunnel structure, stress concentration occurs at the lower right corner, with a maximum von Mises value of 11.58 MPa. At a burial depth of 5 m, the maximum von Mises value of the lower right corner decreases to 9.94 MPa, and the stress value of the right side of the utility tunnel is weaker than that at a burial depth of 2.5 m. At a burial depth of 7.5 m, stress is uniformly distributed on the right wall of the utility tunnel. The maximum von Mises value in the lower right corner is 7.85 MPa. Additionally, a symmetrical stress distribution appears in the lower left and upper right of the middle partition. The stress distribution area of the central partition plate expands gradually as the burial depth reaches 10 m. The large cabin experiences stress concentration at its top right corner, reaching a peak von Mises value of 12.98 MPa.
To summarize, when the depth of the structure increases from 2.5 m to 10 m, the stress distribution of the utility tunnel in the clay at 6.16 s gradually shifts from the right wall to the roof. Similarly, the stress distribution in the sand gradually shifts from the lower right side to the upper right side. The peak stress of the utility tunnel always appears at the corner point. The results indicate that the utility tunnel structure in the clay area experiences transverse bending deformation when buried at shallow depths. As the structure is buried deeper, the utility tunnel deformation gradually shifts to vertical bending deformation under the load of the overlying soil. The utility tunnel is situated in a non-homogeneous site, with sand in the middle and clay on either side. The displacement of the utility tunnel in the clay is greater than that in the sand, which makes the utility tunnel structure in the sand continue to maintain transverse bending deformation as the burial depth of the structure increases.

3.4. Limitations and Future Work

This study does not address the impact of groundwater, which is frequently present near subterranean structures and should be taken into account in future research. The length of sand and clay in non-homogeneous sites could also be changed. Only one seismic wave was selected for this research, whereas a variety of seismic waves should be selected for comparative research in the future. Only unidirectional inputs of seismic waves were taken into account, whereas multiple combinations of inputs should be considered. An interesting research direction would be the structural health monitoring (SHM) of utility tunnels. In the future, methods such as Wiener entropy could be used to predict the effects of damage on the structure [40].

4. Conclusions

In this study, a model of a utility tunnel in a non-homogeneous location was created using three-dimensional finite elements, and an analysis of its dynamic response to a transverse earthquake was conducted. In the calculation process, the impact of varying depths of burial on the acceleration, displacement, and stress reactions of the utility tunnel was considered. This study examined the impact of site conditions on the seismic response of utility tunnels. The findings are as follows:
(1)
In identical site conditions, the clay experiences higher acceleration of the soil compared to the sand. As the utility tunnel structure is buried deeper, the peak acceleration of the soil on the roof initially decreases before rising again. The lowest acceleration peak is observed at a depth of 7.5 m, followed by a gradual increase at a depth of 10 m. Clay soil exhibits a higher acceleration amplification factor compared to sand when subjected to the same ground motion intensity.
(2)
Under the same site conditions, the utility tunnel structure experiences a higher peak displacement in clay than in sand. As the structure of the utility tunnel is buried deeper, the peak displacement of the utility tunnel decreases gradually, while the rate of decline in peak displacement of the utility tunnel structure increases. The rate of decline in the clay area is greater than that in the sand. The lateral displacement difference of the utility tunnel increases first and then decreases with the increase in the burial depth of the structure, and the maximum is reached at a burial depth of 7.5 m. The seismic response of buried structures with a depth of 7.5 m should receive greater attention.
(3)
The stress distribution in the utility tunnel structure is altered. The maximum von Mises stress occurs at the interface between two soils. The stress in the middle partition of the utility tunnel rises gradually as the depth of burial increases. The stress distribution of the utility tunnel structure changes. As burial depth increases, the deformation of the utility tunnel structure in the clay gradually changes from transverse bending deformation to vertical bending deformation due to the overburden load. The structure of the utility tunnel in the sand continues to experience transverse bending deformation as its depth increases due to the non-homogeneous site.

Author Contributions

K.W.: conceptualization, methodology, software, data curation, writing, project administration; Y.C.: methodology, formal analysis, investigation, writing; Z.H.: methodology, software, validation; A.T.: funding acquisition, supervision, project administration. All authors have read and agreed to the published version of the manuscript.

Funding

This research was funded by The Provincial Key R&D Program of Hainan, China (No. ZDYF2022SHFZ089). Hainan Province Graduate Innovation Research Project (No. Qhys2022-170).

Data Availability Statement

The data presented in this study are available on request from the corresponding author. The data are not publicly available because it constitutes a component of an ongoing study.

Conflicts of Interest

The authors declare no conflicts of interest.

References

  1. Luo, Y.; Alaghbandrad, A.; Genger, T.; Hammad, A. History and recent development of multi-purpose utility tunnels. Tunn. Undergr. Space Technol. 2020, 103, 103511. [Google Scholar] [CrossRef]
  2. Golany, G.S.; Ojima, T. Geo-Space Urban Design; John Wiley & Sons: Hoboken, NJ, USA, 1996. [Google Scholar]
  3. Hashash, Y.M.; Hook, J.J.; Schmidt, B.; John, I.; Yao, C. Seismic Design and Analysis of Underground Structures. Tunn. Undergr. Space Technol. 2001, 16, 247–293. [Google Scholar] [CrossRef]
  4. Shamsabadi, A.; Sedarat, H.; Kozak, A. Seismic Soil-Tunnel-Structure Interaction Analysis and Retrofit of the Posey-Webster Street Tunnels. In Proceedings of the 2nd US-JAPAN Soil-Structure-Interaction Workshop, Tsukuba, Japan, 6–8 March 2001; pp. 1–21. [Google Scholar]
  5. Debiasi, E.; Gajo, A.; Zonta, D. On the seismic response of shallow-buried rectangular structures. Tunn. Undergr. Space Technol. 2013, 38, 99–113. [Google Scholar] [CrossRef]
  6. Guo, E.; Wang, P.; Liu, S.; Wang, X. Seismic response analysis of typical utility tunnel system. Earthq. Eng. Eng. Dyn. 2018, 38, 124–134. [Google Scholar]
  7. Konstandakopoulou, F.; Beskou, N.; Hatzigeorgiou, G. Three-dimensional nonlinear response of utility tunnels under single and multiple earthquakes. Soil Dyn. Earthq. Eng. 2021, 143, 106607. [Google Scholar] [CrossRef]
  8. Tsinidis, G. Response characteristics of rectangular tunnels in soft soil subjected to transversal ground shaking. Tunn. Undergr. Space Technol. 2017, 62, 1–22. [Google Scholar] [CrossRef]
  9. Baziar, M.H.; Moghadam, M.R.; Kim, D.-S.; Choo, Y.W. Effect of underground tunnel on the ground surface acceleration. Tunn. Undergr. Space Technol. 2014, 44, 10–22. [Google Scholar] [CrossRef]
  10. Tang, A.; Li, Z.; Feng, R.; Zhou, X. Model Experiment and Analysis on Seismic Response of Utility Tunnel Systems Using a Shaking Table. J. Harbin Inst. Technol. 2009, 41, 1–5. [Google Scholar]
  11. Chen, J.; Shi, X.; Li, J. Shaking Table Test of Utility Tunnel under Non-Uniform Earthquake Wave Excitation. Soil Dyn. Earthq. Eng. 2010, 30, 1400–1416. [Google Scholar] [CrossRef]
  12. Chen, J.; Jiang, L.; Li, J.; Shi, X. Numerical Simulation of Shaking Table Test on Utility Tunnel under Non-Uniform Earthquake Excitation. Tunn. Undergr. Space Technol. 2012, 30, 205–216. [Google Scholar] [CrossRef]
  13. Ding, X.; Feng, L.; Wang, C.; Chen, Z.; Han, L. Shaking table tests of the seismic response of a utility tunnel with a joint connection. Soil Dyn. Earthq. Eng. 2020, 133, 106133. [Google Scholar] [CrossRef]
  14. Yue, F.; Liu, B.; Zhu, B.; Jiang, X.; Chen, S.; Jaisee, S.; Chen, L.; Lv, B. Shaking table investigations on seismic performance of prefabricated corrugated steel utility tunnels. Tunn. Undergr. Space Technol. 2020, 105, 103579. [Google Scholar] [CrossRef]
  15. Jin, Y.; Guo, E.; Wu, H.; Yan, P. Dynamic-response analysis of the branch system of a utility tunnel subjected to near-fault and far-field ground motions in different input mechanisms. CMES Comput. Model. Eng. Sci. 2022, 130, 167–186. [Google Scholar] [CrossRef]
  16. Wu, X.; Nie, C.; Li, D.; Qiu, F.; Tang, Y. Structural Response of a Prefabricated Utility Tunnel Subject to a Reverse Fault. Buildings 2022, 12, 1086. [Google Scholar] [CrossRef]
  17. Wang, Z.; Tao, L.; Shi, C.; AN, S. Study on the mechanical behavior of utility tunnel structure considering flexible joints under reverse fault dislocation. J. Railw. Sci. Eng. 2023, 20, 2256–2267. [Google Scholar]
  18. Wang, Z.; Tao, L.; Shi, C.; An, S.; Liu, J. Response and failure mechanism of utility tunnel with flexible joints under reverse fault: An experimental, numerical, and analytical investigation. Earthq. Spectra 2023, 39, 335–361. [Google Scholar] [CrossRef]
  19. Yue, F.; Liu, B.; Zhu, B.; Jiang, X.; Chen, L.; Liao, K. Shaking table test and numerical simulation on seismic performance of prefabricated corrugated steel utility tunnels on liquefiable ground. Soil Dyn. Earthq. Eng. 2021, 141, 106527. [Google Scholar] [CrossRef]
  20. Yue, F.; Liu, B.; Liao, K.; Zhu, B.; Jiang, X. Shaking Table Test Study on Prefabricated Corrugated Steel Utility Tunnels on Non-liquefiable and Liquefiable Ground. Prog. Steel Build. Struct. 2022, 24, 105–110. [Google Scholar]
  21. Yao, A.; Tian, T.; Gong, Y.; Li, H. Shaking Table Tests of Seismic Response of Multi-Segment Utility Tunnels in a Layered Liquefiable Site. Sustainability 2023, 15, 6030. [Google Scholar] [CrossRef]
  22. Pan, Q.; Dias, D. Face stability analysis for a shield-driven tunnel in anisotropic and nonhomogeneous soils by the kinematical approach. Int. J. Geomech. 2016, 16, 04015076. [Google Scholar] [CrossRef]
  23. Du, P. Seismic Response of Utility Tunnel in Inhomogeneous Field. Master’s Thesis, Harbin Institute of Technology, Harbin, China, 2017. [Google Scholar]
  24. Zhang, J.; He, C.; Geng, P.; HE, Y.; WANG, W.; MENG, L. Shaking table tests on longitudinal seismic response of shield tunnel through soft-hard stratum junction. Chin. J. Rock Mech. Eng. 2017, 36, 68–77. [Google Scholar]
  25. Darli, C.M.; Aiping, T.; Delong, H.; Jiqiang, Z. Large scale shaking table model test and analysis on seismic response of utility tunnel in non-homogeneous soil. Earthq. Eng. Eng. Vib. 2021, 20, 505–515. [Google Scholar] [CrossRef]
  26. Cilingir, U.; Madabhushi, S.G. Effect of depth on the seismic response of square tunnels. Soils Found. 2011, 51, 449–457. [Google Scholar] [CrossRef]
  27. Ma, C.; Lu, D.; Du, X.; Qi, C. Effect of buried depth on seismic response of rectangular underground structures considering the influence of ground loss. Soil Dyn. Earthq. Eng. 2018, 106, 278–297. [Google Scholar] [CrossRef]
  28. Xu, Z.; Zhuang, H.; Xia, Z.; Yang, J.; Bu, X. Study on the effect of burial depth on seismic response and seismic intensity measure of underground structures. Soil Dyn. Earthq. Eng. 2023, 166, 107782. [Google Scholar] [CrossRef]
  29. GB 50909-2014; Code for Seismic Design of Urban Rail Transit Structures. State Standard of the People’s Republic of China: Shanghai, China, 2014; p. 185.
  30. Huang, D.; Zong, Z.; Tang, A.; Huang, Z.; Liu, Q. Dynamic response and vibration isolation of pipes inside a utility tunnel passing through nonhomogeneous soil under seismic action. Soil Dyn. Earthq. Eng. 2022, 163, 107522. [Google Scholar] [CrossRef]
  31. Luo, J. Research on Dynamic Characteristics of Haikou Red Soil. Master’s Thesis, Hainan University, Haikou, China, 2014. [Google Scholar]
  32. Xue, X. Deformation Characteristics of Foundation Pit in Sandy Soil. Master’s Thesis, Hainan University, Haikou, China, 2014. [Google Scholar]
  33. GB 50010-2010; Code for Design of Concrete Structures. China Architecture & Building Press: Shanghai, China, 2010.
  34. Wang, Z. Application of ABAQUS to Civil Engineering; Zhejiang University Press: Hangzhou, China, 2006. [Google Scholar]
  35. DU, X.; ZHAO, M.; Wang, J. A Stress Artificial Boundary in Fea for Near-Fieldwave Problemi. Chin. J. Theor. Appl. Mech. 2006, 38, 49–56. [Google Scholar]
  36. GB 18306-2015; Seismic Ground Motion Parameters Zonation Map of China. Standards Press of China: Beijing, China, 2015.
  37. Jin, Y. Seismic Response Analysis of the Special Segment of an Urban Underground Utility Tunnel. Master’s Thesis, Institute of Engineering Mechanics, China Earthquake Administration, Harbin, China, 2022. [Google Scholar]
  38. Huang, J. Study on Nonlinear Seismic Response of Rock Tunnels. Ph.D. Thesis, Beijing University of Technology, Beijing, China, 2015. [Google Scholar]
  39. Wang, G.; Yuan, M.; Miao, Y. Review of seismic response of structure-soil-structure interaction system. Chin. J. Geotech. Eng. 2018, 40, 837–847. [Google Scholar]
  40. Ceravolo, R.; Civera, M.; Lenticchia, E.; Miraglia, G.; Surace, C. Detection and localization of multiple damages through entropy in information theory. Appl. Sci. 2021, 11, 5773. [Google Scholar] [CrossRef]
Figure 1. Three-dimensional finite element model.
Buildings 14 01042 g001
Figure 2. Viscoelastic boundary of finite element model.
Buildings 14 01042 g002
Figure 3. Acceleration time history curve of seismic motion.
Buildings 14 01042 g003
Figure 4. Distribution of peak acceleration amplification factors from site conditions 1 to 8.
Buildings 14 01042 g004
Figure 5. Feature of distribution of acceleration amplification.
Buildings 14 01042 g005
Figure 6. Displacement time history curve of the roof of the utility tunnel structure: (a) 0.2 g in clay; (b) 0.2 g in sand; (c) 0.4 g in clay; and (d) 0.4 g in sand.
Buildings 14 01042 g006
Figure 7. Maximum lateral displacement difference between the roof and floor of the utility tunnel for site conditions 1–8.
Buildings 14 01042 g007
Figure 8. Von Mises stress cloud diagram of utility tunnel structure at 6.16 s: (a) burial depth is 2.5 m; (b) burial depth is 5 m; (c) burial depth is 7.5 m; and (d) burial depth is 10 m.
Buildings 14 01042 g008
Figure 9. Von Mises stress cloud diagram of cross-section of the utility tunnel in clay at 6.16 s: (a) burial depth is 2.5 m; (b) burial depth is 5 m; (c) burial depth is 7.5 m; and (d) burial depth is 10 m.
Buildings 14 01042 g009
Figure 10. Von Mises stress cloud diagram of cross-section of the utility tunnel in sand at 6.16 s: (a) burial depth is 2.5 m; (b) burial depth is 5 m; (c) burial depth is 7.5 m; and (d) burial depth is 10 m.
Buildings 14 01042 g010
Table 1. Material parameters of soil.
Soil TypeDensity (kg/m3)Elastic
Modulus (MPa)
Poisson’s RatioInternal Friction
Angle (°)
Cohesion (kPa)Dilation
Angle (°)
Clay185080.3153510
Sand1900300.2301016
Table 2. Physical and material parameters of concrete and steel bar.
ConcreteSteel Bar
Density (kg/m3)24007800
Elastic modulus (GPa)
Poisson’s ratio
31.5206
0.20.3
Yield stress (MPa)-400
Dilation angle (°)30-
Eccentricity0.1-
Stress ratio1.16-
K0.0667-
Viscosity parameter0.005-
Table 3. Tensile and compressive parameters of concrete.
Stress (MPa)Inelastic
Strain
Damage
Factor
Stress (MPa)Cracking
Strain
Damage
Factor
14.07001.7600
17.610.0640.0272.090.0070.021
19.970.1410.0692.090.0470.167
22.320.2950.1391.870.0810.284
23.400.5570.2321.760.0970.335
22.220.9450.3371.650.1140.385
19.871.3760.4331.430.1500.481
16.342.0170.5511.090.2200.622
12.822.8180.6610.760.3320.760
9.284.0270.7710.430.5820.890
Table 4. Site conditions of models.
Site ConditionPGA/gBurial Depth/m
10.22.5
20.25
30.27.5
40.210
50.42.5
60.45
70.47.5
80.410
Table 5. Peak acceleration of soil near roof of utility tunnel.
Buried Depth (m)Peak Acceleration (m/s2)
PGA = 0.2 gPGA = 0.4 g
ClaySandClaySand
2.52.772.325.934.67
52.682.245.914.53
7.52.261.743.783.27
102.342.005.493.98
Table 6. Peak displacement of utility tunnel roof.
Buried Depth/mPeak Displacement/m
PGA = 0.2 gPGA = 0.4 g
ClaySandClaySand
2.50.1210.0840.2410.177
50.1140.0830.2270.172
7.50.1040.0820.2060.167
100.0880.0800.1730.162
Table 7. Maximum lateral displacement difference between the roof and floor of the utility tunnel for site conditions 1–8.
Buried Depth/mPeak Displacement/m
PGA = 0.2 gPGA = 0.4 g
ClaySandClaySand
2.53.9442.8647.6585.028
54.5532.7619.3315.828
7.55.3493.57911.8098.079
104.3562.91110.0036.471
Table 8. Von Mises stress peaks (V1–V8).
In ClayPeak Von Mises Stress/MPaIn SandPeak Von Mises Stress/MPa
V16.19V511.58
V26.82V69.94
V37.48V77.85
V413.46V812.98
Disclaimer/Publisher’s Note: The statements, opinions and data contained in all publications are solely those of the individual author(s) and contributor(s) and not of MDPI and/or the editor(s). MDPI and/or the editor(s) disclaim responsibility for any injury to people or property resulting from any ideas, methods, instructions or products referred to in the content.

