1. Introduction
The current practice of real estate developers is to employ industry-accepted heuristics as target rates of return based on benchmarks commonly expressed as hurdle rates of return [
1]. ‘Hurdle rates’ are a minimum financial metric and include the developer’s cost of capital and a premium corresponding to a significant subjective assessment of unsystematic project risk used to measure the viability of potential projects. This is achieved by conducting feasibility analyses to inform decision makers during the early stages of development projects [
2]. For projects and/or site acquisitions to proceed, the forecasted profitability determined through feasibility analyses must meet or exceed the minimum requirements of firms.
Developers engaged in real estate investment, development, redevelopment, rehabilitation and advisory activities use a series of generic hurdle rates based on industry and/or company-specific ‘rules of thumb’ and industry-wide benchmarks commonly expressed as ‘hurdle rates of return’ [
3]. Company and/or project-defined hurdle rates are then used to measure project viability and inform decision making during the pre-commitment stages of the development process. The various methods of determining feasibility and project performance currently in use have been emerging since the 1970s and commonly include static residual valuation, residual (accumulation) cash flow analysis and ‘discounted cash flow’ (DCF) analysis used to determine the ‘net present value’ (NPV) of projects [
4]. This study is important as it addresses a significant gap in understanding real estate development practices from an Antipodean perspective, offering insights that enable a more generalized application internationally, particularly at a time when the boundaries between traditional development and investment strategies are increasingly blurring.
Common hurdle rates incorporated into static development appraisals include such cash-based metrics as ‘margin on development cost’ (MDC), also known as ‘profit-on-cost’ or ‘return on cost’ (ROC); ‘profit on value’ or ‘return on sales’ (ROS); ‘return on equity’ (ROE); and such return-based metrics as a positive NPV and ‘internal rate of return’ (IRR). This is a similar finding to that of UK studies [
3]. From an Australian perspective, Costello and Preller [
5] surveyed Queensland developers and found development yield (another term for MDC or ROC) as the second most common financial metric used to determine feasibility (>90%) after all respondents indicated using IRR. MDC is an estimate of a development profit margin based on less revenue costs, including interest for a development project. There is a large body of financial and academic literature discussing the use and growth of the above methods of assessing projects including significant criticisms of their use. However, there has been little research and literature concerning the specific aspect of the selection and application of hurdle rates for development projects [
3]. Recent studies have demonstrated that the use of common financial metrics from the wider investment financial literature are being used by developers in the inverse of methods that would be expected [
6].
More recent advances in the literature have recommended the use of real option theory as a model for valuing projects and the inclusion of Monte Carlo simulations as a prescriptive model for assessing scenarios and possible outcomes, but the level of uptake of these methods across the real estate development industry is not known as it is not recorded [
7].
The present study aims to examine the heuristic ‘go’ or ‘no-go’ hurdle rate indicators that practitioners incorporate within the decision-making process, as well as gain an understanding of how they define, measure and/or predict uncertainty and risk, and how that measurement feeds back into the decision-making process. The study aims to answer the following research questions: Do firms employ specific go/no-go hurdle rates in early development stages, and what are the common benchmarks? (RQ1) How do feasibility practices and hurdle rate selections differ between organizations using proprietary software, Microsoft Excel (version 2016), or custom programs? (RQ2) Which valuation methods (residual land value, discounted cash flow, residual cash flow, market comparison) are firms using in early development stages? (RQ3) Is there a standard process for adjusting hurdle rates and benchmarks in response to risk and uncertainty? (RQ4) Are firms’ decision-making processes influenced by bounded rationality? (RQ5).
Additionally, through the process of this analysis, we intend to gain insights into property developers’ practices across different sectors of the industry, as well as to differentiate methods of decision making after allowing for various purposes of undertaking projects. Furthermore, an analysis is undertaken to assess the adoption of non-conventional methods of assessment including Monte Carlo simulations and probability analysis, real option theory, and Bayesian models of predictability, as well as such strategies that do not fit within the normal bell curve (such as that presented in fractal geometry) [
8].
The current study, which particularly seeks to identify the key performance areas that contribute to the integrated process, conducts a critical literature review (
Section 2) as well as an empirical assessment of the decision process or processes engaged within the feasibility stage of the development process in
Section 3. This foundation of theory supports a platform for the addition of empirical evidence for specific decision-making processes that are currently being adopted within the industry through an empirical analysis (in
Section 4) from a survey of leading industry practitioners. In
Section 5, we compile, document and discuss the key methodologies used as well as the weight practitioners place upon them before concluding with an identification of the study’s limitations and also the further lines of aligned research indicated.
2. Literature Review
In the dynamic and multifaceted field of property development, understanding the intricacies of the development process is crucial for both academic research and practical application. This comprehensive literature review delves into the various stages of the real estate development process, examining key studies that have shaped our understanding of this complex field. From the initial conceptualization to the final stages of a project, this review explores the sequence of steps crucial for successful property development, highlighting the interdependencies and challenges at each stage. Focusing on the pre-commitment phases, it emphasizes the criticality of decisions made before formal commitment, where the viability and feasibility of projects are rigorously analyzed. This review also sheds light on the behavioral aspects influencing decision making in project selection, including the concepts of bounded rationality and heuristic bias. These insights are pivotal for understanding the nuances of decision making in the face of uncertainty and risk, which are inherent in property development projects. Additionally, the review navigates through various appraisal methods and decision metrics, providing a deep dive into the tools and techniques employed in assessing project viability. This includes an exploration of different financial appraisal methods such as the residual land value (RLV) and discounted cash flow (DCF), along with the evaluation of crucial decision metrics like net present value (NPV) and internal rate of return (IRR). Furthermore, the review identifies gaps in existing research, particularly in the adaptation of hurdle rate metrics in response to changing project risks and the influence of proprietary software on decision-making processes. This literature review not only contributes to the academic discourse but also serves as a valuable resource for practitioners in the real estate development sector.
2.1. The Development Process
Property development can be defined as a sequence of steps that take a property development project from inception through to construction and completion, including the management of the asset over its lifecycle in order to derive value and achieve the objectives of the project [
2]. The development process is the sequence of steps which take the project from inception through to completion. A large body of research outlines the various stages of the real estate development process, as well as their key linkages [
5,
9,
10,
11,
12,
13]. Though the various models differ in terminology and emphasis on specific stages, there exist a common set of steps. The development process, as given by [
12], is as follows: initiation, investigation and analysis of viability, acquisition, design and costing, consent and permission, commitment, implementation, and leasing/managing/disposal.
This research is concerned with the pre-commitment stages of the development process and particularly with the decision to acquire a property development site. As Reed [
12] (p. 16) describes, formal commitment is a point in time when modifications can no longer be made without significant financial consequences and/or time delays. Prior to a formal commitment, an investigation is conducted to assess a potential project’s viability in the form of a feasibility analysis or development appraisal. As mentioned in
Section 1, this is used to measure the viability of a potential project to inform decision makers during the early stages of development and needs to be made before final commitment [
2]. It determines if the development objectives are likely to be met and if the minimum hurdle benchmarks have been satisfied (and, if yes, whether they will result in a ‘go’ decision and ‘when to go’) [
14]. It is at this point in the development process that a ‘go/no-go’ decision has to be made to proceed with, abandon, or significantly modify a potential project.
2.1.1. Bounded Rationality and Behavioral Aspects
A number of studies have focused on the behavioral aspects of decision makers and particularly on bounded rationality and heuristic bias in the valuation of real estate assets and development projects, including that of Gallimore et al. [
15]. This study is among those aiming to examine the overall impact of the behaviorists’ approach to decision making in feasibility analysis and to provide a valuable contribution to earlier, more normative proposed models. The behaviorists’ view is that decision makers in organizations are human and, as such, are guided by human behavior. Research shows that development managers have a high level of autonomy in development companies when deciding whether to proceed with development and are not bound by purely normative models [
6].
2.1.2. The Decision to Proceed with Development Projects and Feasibility Analysis
The decision to proceed with developments is traditionally subjective in large part and subject to the current risk appetite of decision makers and their desire to maximize utility at the time of site acquisition [
16]; property developers have historically relied upon static single-point appraisal models, as opposed to such cash flow approaches as DCF, to ascertain their projects’ expected NPV [
17]. Static point development appraisals in practice can therefore be considered rational normative models, as the outcome generates a ‘go/no-go’ signal of what decision makers should do [
18].
However, uncertainty, risk, and instability are common development characteristics [
19], the main difference being that risk is the potential occurrence of a future event that may produce an outcome different from that anticipated and that the outcome can be measured, whereas uncertainty deals with an outcome that is either unknown or cannot be measured [
20]. This makes the usual single deterministic value in feasibility appraisal a questionable outcome when the revenue and cost variables that form inputs are constituted with some uncertainty [
21]. As Loizou and French [
18] observe, real estate developers need “to question the assumptions that underpin the analyses which form the key indicators of uncertainty pertaining to a given project … [and to know] which variables give rise to the largest effect on a change of outcome, [and] thus where the risk is the highest” [
18] (p. 198). Moreover, as Atherton et al. [
17] and Loizou and French [
18], for example, point out, developers can easily move away from fixed-point analysis to do this by modifying traditional models to allow them to quantify the risks they are modelling—usually by incorporating a distribution or range of outcomes [
22]. As these allow the inclusion of probability generation and Monte Carlo simulations of cash flow feasibility models, analysts can use elicitation procedures, sensitivity analyses, and remodeling to obtain a range of outcomes in an intuitively understandable way to allow decision makers to generate amendments to the input assumptions [
23]. If analysts believe in the accuracy of the input assumptions, they can decide to commence a project based on predetermined benchmarks of acceptability [
17], in which case the inputs should be the basis for the time and effort spent thinking about decisions [
24]. This helps gain a better understanding of the inputs and uncertainty present in each variable [
25], as well as creating the opportunity for developers to decrease risks that are considered too high.
2.1.3. Hurdle Rate Selection
One of the key elements in determining whether to proceed with potential projects is the choice of hurdle rate that projects must exceed to be considered feasible or viable. The term hurdle rate implies there is a minimum accepted profit or return that projects must meet or exceed, given the level of anticipated project risk [
26]. Hurdle rates can also represent the minimum expected rate of return that investments must generate to compensate for risk-adjusted undertakings, or the return must clear the cost of capital and other financial benchmarks set for projects [
27]. For the choice of hurdle rate, the Royal Institution of Chartered Surveyors (RICS) [
28] suggests that the nature of the development, and the prevailing practice in the market for the sector, helps to determine the selection of the profit margin or rate of return and the percentage to be adopted varies for each case.
Similarly, Hutchison et al. [
6] describes a hurdle rate as “A required rate of return or an economic profit that a potential project would need to generate for the real estate developer to be willing to proceed. From a real estate investment decision, ‘hurdle rates’ are linked to capitalization rates and investment yields in capital budgeting decisions, or a required return less than the forecasted long-term growth in income after allowing for depreciation” (p. 3).
Hutchinson et al. [
6] also found that of the investment managers, large-scale real estate investors, and developers surveyed, 95% used specific hurdle rates in decision making processes either explicitly (85%) or implicitly (10%).
2.1.4. Elements of Feasibility Analysis in a Development Appraisal
Feasibility analysis determines if the minimum hurdle benchmarks have been satisfied and, if so, whether they have resulted in a ‘go’ decision; if yes, it helps to guide the decision maker regarding ‘when to go’ [
14]. It includes a financial analysis but contains such additional elements as an executive summary, market study, preliminary drivers, cost estimates, photographs and map information for the site, information about financing, planning permissions, an estimate of value, and an analysis of project risk [
29]. Additionally, analytical sections include a sensitivity analysis with an evaluation of each component and variation of the plan, in order to move from feasible to optimal; a review of risks in the optimal configuration, with appropriate risk management techniques; and confirmation of the project’s feasibility for each participant [
10].
A range of critical and analytical issues have been identified in previous studies that also need to be considered, including the conceptual idea and market for projects, down to specific absorption schedules; the particular market niche under current conditions in terms of national, regional and local market outlooks; the demographic attributes of the target market, sales, and rental comparables; market segmentation, including the identification of key marketability traits and evaluation of existing supply; and compilation and analysis incorporating assumptions into a DCF model, sensitivity and/or scenario analysis, reviewing risks and optimal configuration, and confirming the project’s feasibility [
13]. In addition, the completion of conceptual market information early in the life of development projects an the completion of a thorough financial feasibility analysis are also considered essential for informed management decision making in the pre-commitment stages of the development process.
In practice, it is necessary to delineate the objectives within projects as a basis for determining the hurdle rates and informing the ‘go/no-go’ decision output of the financial analysis [
30]. To do this, the objectives must be measurable, and a judgement made on whether they can or will be achievable [
31]. Moreover, as all projects are unique, the reasons for undertaking a particular project often differ, requiring specific objectives to be set for each one. The differences in primary development objectives, therefore, determine which hurdle rates and financial performance metrics are utilized in the feasibility analysis and, ultimately, which sites and projects will proceed past the ‘go/no-go’ decision point.
Feasibility analysis plays a crucial role for both developers and investors, serving as the backbone for evaluating the potential viability of a project. This comprehensive assessment touches on several critical dimensions, including physical, legal, and financial aspects, to ensure that a project is not just viable but also poised for success [
11,
30,
32]. The essence of this process lies in its ability to value properties accurately and forecast project profitability, which in turn, aids in making informed decisions. The ultimate goal of conducting such an analysis is to fine-tune and optimize development schemes, thereby ensuring that they not only meet but exceed expected outcomes, aligning with the broader objective of delivering superior project performance [
33].
From the perspective of those immersed in the world of development, the appraisal process is not merely a procedural step; it is a fundamental practice aimed at validating the financial viability of projects for all stakeholders involved. It involves a meticulous evaluation to ascertain the maximum bid price for development sites, thereby safeguarding the financial interests of the developer. Furthermore, it encompasses a detailed examination of potential development schemes to forecast the anticipated profit or loss. This step is crucial for determining the overall viability of the project. Additionally, appraisals facilitate a comprehensive analysis of the impact of various project variations, enabling developers to test the assumptions underpinning their projects. Such analyses serve as critical tools for measuring project risk and are indispensable for securing financing, be it through debt or equity channels [
31,
32].
The process of market analysis within development appraisals is pivotal, culminating in the projection of a property’s net operating income (NOI) over a specified timeframe. This stage demands that developers commit additional capital to their projects, necessitating a thorough examination of the specific timing associated with project expenditures and revenues, alongside considerations of key debt and equity contributions. It is at this juncture that developers encounter what is commonly referred to as ‘hurt money’, which represents the initial capital outlay for a project that is irrecoverable unless the project moves forward. This concept highlights the financial risks associated with the early stages of development, where preliminary expenditures on design and consultant reports are relatively minor, thus allowing for the abandonment of projects with minimal financial fallout [
34,
35]. The methodologies employed to determine feasibility in development appraisals are deeply rooted in Ricardo’s law of rent. They are predicated on the idea that the value of projects or sites is essentially the residual figure remaining after all costs and the requisite profit have been accounted for within the development equation. This equation is utilized in two primary ways during the pre-commitment stages of development: first, through the residual land value method, and second, by inserting a known land price to calculate the residual profit. Despite the diversity in development equation models, they all share common foundational principles. These include calculating the gross realizable value of the completed project and subtracting all associated cost inputs such as design, permissions, consultancy fees, construction costs (both civil and structural), sales and marketing expenses, government fees, and taxes. After deducting the required project profit, which reflects the project risk as quantified by the hurdle rate or target return, one arrives at the residual land value. This represents the maximum amount that can be paid for a site or the highest bid that can be placed at auction after taking acquisition costs into account. Conversely, when assessing an asking price for a potential development site, this formula can be reconfigured to determine whether the anticipated project profitability will meet the required hurdle rates [
9,
36].
Completing a feasibility analysis involves determining input costs, project duration, the impact of financing charges over time, and calculating the residual value and profit’s present value (PV) [
37]. Despite the complexity of quantitative analyses in feasibility software, the objective remains to gauge if forecasted profits are adequate when compared with identified risks, guiding the go/no-go decision [
31,
38].
2.2. Appraisal Methods
The four main methods for property appraisal nominated by the respondents are the residual land value, discounted cash flow, residual cash flow, and market comparison method of determining land value.
2.2.1. Residual Land Value (RLV)
Potential projects have no inherent intrinsic value at this stage, so the latent value of a development site or vacant land can be determined by examining its potential uses. Known as the ‘residual land value’ (RLV) [
32], referring to the portion of project value that remains after deducting all cost inputs and a predetermined profit figure from the forecasted net revenue, this can then be discounted back to the PV to allow for landholding costs across the development period (see [
38] (p. 67) and [
32] (p. 63) for the specific calculations involved in demonstrating that the residual amount of the equation is a future value of the land that should then be discounted back to its PV). The traditional use of the RLV is a static calculation that considers the time value of money [
31]. Each specific development scheme or option has a unique RLV, and developers frequently evaluate many potential schemes to compare RLVs. The theory of site value necessitates two pre-conditions before a project can commence, based on the given assumptions that the motive for undertaking real estate development is to derive an economic profit: (1) that the expected value of the completed development must exceed the cost of the site and all development costs, including a sufficient amount of developer profit, and (2) that the value of the site for development purposes must at least match its value for an existing use [
39] (p. 230).
2.2.2. Discounted Cash Flow (DCF)
The DCF method is the process of determining the PV of cash inflows and outflows by incorporating the time value of money of future value (FV) inputs [
40]. With the DCF method of feasibility analysis, each net cash flow of a project’s inputs and outputs during a given cash flow period (e.g., months or quarters) is discounted from an FV to a PV, usually using the project WACC or TIRR [
32]. The PV for each cash flow period is then summed over the project’s development term to determine the NPV [
41]. Revenue and expenditure are divided into even time events (usually monthly or quarterly) and finance charges are calculated on the cumulative cash flow at that point. The net cash flow in each time period is then discounted by the appropriate discount factor. Cash flow methods differ from the static RLV method in being dynamic instead of static.
2.2.3. Residual Cash Flow (RCFM)
The ‘residual cash flow method’ (RCFM) is similar to the DCF method but differs in when and how discounting occurs and the calculation of interest [
32] (p. 75). Finance charges are calculated on the cumulative cash flow for each period based on expected WACC and the expected loan–value ratio, or in the case of real estate development projects, the loan–development cost ratio [
9]. The FV residual value at the end of the cash flow is then discounted back to a PV using an appropriate discount factor. An advantage of the RCFM method is that it provides a more accurate estimate of project cash flows in specific cash flow periods and an estimate of project capital requirements [
32] (p. 75); the DCF method allows for the determination of a project’1s NPV, while the RCFM allows for inflows and outflows for each specific cash flow period to be forecasted. Both the DCF and RCFM can be calculated in a single Microsoft Excel worksheet.
2.2.4. Market Comparison Method of Determining Land Value
The market comparison method is defined as “selecting comparable properties on the basis of their elements of comparison which includes key transaction information such as date, price paid, market rent, and yield” and provides an additional way of determining the value of proposed sites (or land) for potential real estate development projects by relying on the substitution effect inherent as an economic process of knowledgeable individual choice [
42].
2.3. Existing Evidence of Decision Metrics
2.3.1. Margin on Development Cost (MDC)
The hurdle rate most widely referenced in studies of real estate development decision making is the cash-based metric of MDC or ROC [
1]. A linear relationship exists between perceived risk and the rate of required MDC, with a higher anticipated project risk prompting a corresponding increase in MDC percentage that must be achieved to warrant proceeding beyond the pre-commitment stages of the development process [
12]. It is relatively easy to use and calculate and can be used for the comparison or ranking of different projects, but tends not to adequately account for a more complex pattern of income and expenditure over longer time horizons or for the time value of money [
9]. With the advent of more complex calculations using spreadsheets and proprietary feasibility programs, such return-based metrics as DCF, NPV, IRR, and Equity IRR have become increasingly used in project decision making [
9].
2.3.2. Net Present Value (NPV)
The NPV of a project, which estimates the present value (PV) of future cash flows minus the investment’s PV, is crucial for real estate investment decisions, involving the PV of expected future net cash flows minus the real estate purchase cost’s PV [
27]. NPV and IRR, while not hurdle rates themselves, can be compared against target returns to assess against required hurdle rates, becoming more complex with construction timelines, loans, and phased risks [
26,
31]. Real estate investments and developments involve significant initial capital outlays, with development projects facing varied economic costs due to different development phases [
26]. Brealey et al. found NPV to be a preferable hurdle rate over IRR for real estate investment decisions [
43], whereas Hutchinson et al. highlighted IRR as the most commonly selected hurdle rate by European firms, with NPV ranking fourth [
6]. In Australia, NPV was the third most popular financial indicator among Queensland developers [
5], emphasizing that feasibility is often assessed on a project-by-project basis, differing from the portfolio theory approach used by fund managers.
2.3.3. Internal Rate of Return (IRR) and Target IRR
The IRR measures potential investment profitability by setting the NPV of all cash flows from a project to zero. It becomes a hurdle rate when a target IRR (TIRR) is established, reflecting the project’s forecasted minimum return [
5]. In Australia, MDC (or return on cost) and IRR are preferred for speculative development, echoing findings from Crosby et al., where UK developers favored profit on costs, with IRR metrics following [
3]. Surveys by Hutchison et al. and Coleman et al. revealed a preference for a risk-free rate plus a risk premium over traditional finance theory for determining IRR [
6,
41]. This approach aligns with findings that IRR for UK development projects often inversely reflects expected financial returns from the literature, with longer-term projects yielding lower IRRs [
1]. This contradiction is attributed to the methods of residual land value calculation and timing of expenditures. An IPD study noted an average IRR of 7% across UK developments from 1983–2008, a return comparable to less risky, passive investments [
44].
Crosby et al. [
1] also offer the view that developers may be using IRR and other time value of money measures in ways that are not addressed in the wider financial literature. Within this risk premium, there have been several approaches from “‘rules of thumb’ to complex, layered models and pro-forma approaches with an absence of textbook models” [
6] (p. 11). It is anticipated that when Australian real estate development firms are surveyed, the result will be similar to that found by Crosby et al. [
1]. An interesting outcome of the Hutchinson et al. [
6] was the finding that 80% of respondents applied a specific hurdle to each project or investment.
2.3.4. Minimum Financial Metrics
Developers are usually given a minimum financial metric as a hurdle rate, such as a minimum profit that must be achieved, minimum profit/unit or m
2, or a minimum project size or revenue. Surveys of real estate developers [
5,
6] found that many utilize other simple financial metrics.
2.3.5. Identification of Research Gaps
After undertaking a comprehensive review of the literature relating to the selection, use and adaption of hurdle rate metrics for the decision-making processes of property developers, a number of gaps were identified and described, as follows. In terms of speculatively based property development projects, it is important to report which hurdle rate metrics are used in key decision-making processes from the perspective of the Australian and New Zealand industries. Furthermore, the literature does not report the manner in which specific hurdle rates are adapted in response to a change in perceived project risks, nor does it provide clarity on the use of proprietary feasibility software/models versus in-house models (or how the use of these programs influences the preference for the selection and use of hurdle rates). To respond to the lack of coverage of these aspects, they were used as the nexus of enquiry for the empirical survey.
3. Research Method
The research design employed in this study focused on investigating the decision-making practices of real estate developers in Australia and New Zealand, particularly in the context of selecting hurdle rates for feasibility analyses of development projects. To this end, a comprehensive survey was designed and disseminated among a targeted population of real estate developers, leading to a robust sample size of 225 responses, representing a 51.5% response rate. The survey instrument was designed to include both quantitative and qualitative elements, featuring rating scales, rankings, and open-ended questions to elicit detailed insights. The data collection process was multifaceted and strategic. It involved collaboration with industry organizations. Additionally, purposive sampling techniques were employed, leveraging the researchers’ networks, using LinkedIn Premium for targeted outreach, and participating in real estate industry events. This selective sampling was both rigorous and labor-intensive, contributing to a comprehensive data collection period spanning nine months across 2016 and 2017.
Data analysis was approached with a blend of statistical and thematic methods. Statistical tests, such as factor analysis, decision trees were employed to decipher patterns and relationships within the data. The analysis was further enriched by qualitative interpretations, especially in understanding the nuances of developers’ decision-making processes and their reliance on various financial metrics and qualitative assessments. This layered approach to research design, data collection, and analysis ensured a thorough exploration of the developers’ decision-making practices, shedding light on their reliance on traditional financial metrics, the influence of qualitative methods, and the dynamics of risk management in project evaluation. Specific elements of the research design and methodology are discussed in the following sections.
3.1. Sample Selection
The study utilized a survey of 225 decision makers in real estate development in Australia and New Zealand, focusing on the pre-commitment go/no-go decision making stage. The survey, featuring both quantitative and qualitative questions, aimed to explore the feasibility analysis decision-making practices. It shed light on the application and selection of hurdle rates across different industry sectors, a topic scarcely covered in existing research. The survey also differentiated responses based on property and company types (public vs. private), development company size, and ownership structures, including speculative developers and property investors/developers. Purposeful sampling was therefore adopted through the eligibility questions, with the requirement for respondents to be having and using predetermined financial metrics for project selection and the ‘go/no-go’ decision. Non-random probability sampling methods adopting quota and homogenous sampling methods were also used. As both the sample size and population are small, stratified sampling further improved the analysis of the data collected. This involved stratifying by geographic area and real estate typologies.
3.2. Population
The population consisted of decision makers that conduct appraisal and feasibility analyses in real estate development organizations to determine the viability of potential projects at the pre-acquisition stages of projects. Although there was significant emphasis in this study on the Australia/New Zealand real estate development industry, other geographical areas were also included as developers are becoming increasingly international [
45]. The population of decision makers is unknown, and we made an estimate by evaluating the client sizes of leading proprietary feasibility software companies and allowing for at least 50% industry use of bespoke models, giving a population of approximately 3000 development companies within Australia, with an unknown number of decision makers.
A sample size of 225 responses was achieved, representing a respectable 51.5% response rate. The assistance of such industry organizations as Estate Master, now owned by the Altus Group, with the distribution of the questionnaire to developers at training sessions resulted in the collection of 38 (approximately 16%) of the 225 total responses. Additionally, participants were purposefully sampled by utilizing the researchers’ contacts, searching via LinkedIn Premium, and through attending real estate industry events. The purposeful sampling was both highly selective and labor-intensive, contributing to the nine-month period of data collection in 2016 and 2017. The utilization of LinkedIn for purposive sampling is well documented in the literature, particularly in studies related to the construction industry, as evidenced by Li et al. [
46]. Each of the potential participants received either a covering letter or a landing page outlining the purpose of the research and the aims sought from the research project, who was conducting the research and how to get in contact with the researcher, an explanation of the ethics approval and how to contact the university if they had any questions or complaints, a statement on participant confidentiality and the right to withdrawal without jeopardy, an estimate of the amount of time required to complete the survey instrument, instructions for completing the instrument, and a consent form for participating in the research.
3.3. Instrumentation
The design of the survey instrument included questions with rating scales and rankings, and open-ended questions for subjective interpretations. The initial questions were used to determine not only consent to participate in the survey, but also to determine the respondents’ involvement in the selection and acquisition of development projects.
The questionnaire was distributed in two different formats—an online format and a hard copy version distributed at training sessions for the use of the Estate Master computer program. First, the survey instrument included demographic questions designed to measure the characteristics of the respondent decision makers, including their experience, educational level, position, and real estate project types developed. Second, respondents were questioned on their project selection process, including the specific hurdle rates utilized, the choice of financial metrics for project evaluation, and the methods of changing project hurdle rates. Third, participants were asked about their practices regarding the mechanics of feasibility analysis, including the tools used to determine project viability and identifying the variables forecasted. Fourth, respondents were asked questions regarding the most common risk analysis methods used in the industry, along with their attributes and risk tolerance/aversion perception.
The questions in the questionnaire are focused on the aims of the research as summarized in
Table 1. A full copy of the questionnaire is available from the author on request. It should be noted there are several additional potentially significant questions other than economic profit that are not addressed, such as the project’s impact on environmental, social, and macroeconomic aspects; public benefit; and longevity (particularly the relationship between development and the business and real estate cycles) [
47]. However, while these are important in their own right and may affect the decision to proceed, and they answer ethical questions regarding the project’s potential to benefit society, they are beyond the scope of the present study, which in principle is focused on analyzing at how uncertainty is addressed by businesses in the pre-commitment appraisal stage of the overall development process.
3.4. Data Analysis
The research questions were addressed using statistical tests including Pearson Chi-square tests, factor analysis, decision trees, and artificial neural networks. The Pearson Chi-square test of independence is used when one wishes to explore the relationship between two categorical variables [
48]. Chi-square tests are useful in determining if there is a statistically significant association between two variables, but this technique cannot be used as a predictor of a variable. The primary use of Chi-square tests in this research was as a preliminary search for statistically significant associations between variables that were then further investigated with the other techniques described in this section. Following Norman [
49], non-parametric tests were applied for Likert-scaled and categorical data, with the Mann–Whitney U test used extensively to analyze developers’ hurdle rate selection and use [
48]. Artificial neural networks (ANNs) were introduced by Mculloch and Pitts [
50]. ANNs were later shown to have been a useful technique for testing the relationship between independent variables [
51,
52]. ANNs have also been shown to be a valuable technique for predicting variables when there are many groups [
50,
53]. Furthermore, ANN analysis was used within this research to determine key differences in respondent attributes and identify hurdle rate selection predictors which are then assessed using the appropriate statistical techniques for each data type.
The survey sought to categorize participants based on their organization’s type of business activity within the real estate sector, offering options such as Trader Developer, Investor Developer, Development Management, and Valuation Firm, among others. The findings, as illustrated in
Table 2, reveal a predominant inclination towards speculative development activities for economic profit, with 32% of respondents identifying as ‘Trader Developers’ and 26% involved in Development Management. Together, these groups constitute 58% of responses, highlighting a significant focus on speculative property development. Additionally, 18% of participants identified as ‘Investor Developers’, emphasizing economic profit through rental income and capital gains over time. Valuation Firms, making up 8% of the responses, play a critical role in facilitating development finance by providing independent feasibility analyses and influencing project commitments. The other category consists of fund managers, childcare facility developers and government and charity social housing developers.
The survey results show that most respondents’ firms primarily operate in Australia (76%), with a smaller proportion in New Zealand (9%) or across multiple countries (15%). Furthermore, the majority of these organizations are private companies (61%), followed by public companies (33%), and a small segment are represented by government organizations or others (7%). This distribution highlights the geographic and organizational diversity of the survey participants, offering insights into the real estate development practices within these contexts.
4. Results and Analysis
As
Table 1 shows, the following five themes were identified in the research questions.
4.1. Variables Respondent Organisations Use in a Feasibility Analysis
The variables used as inputs in conducting feasibility analysis are important in ascertaining the viability of projects.
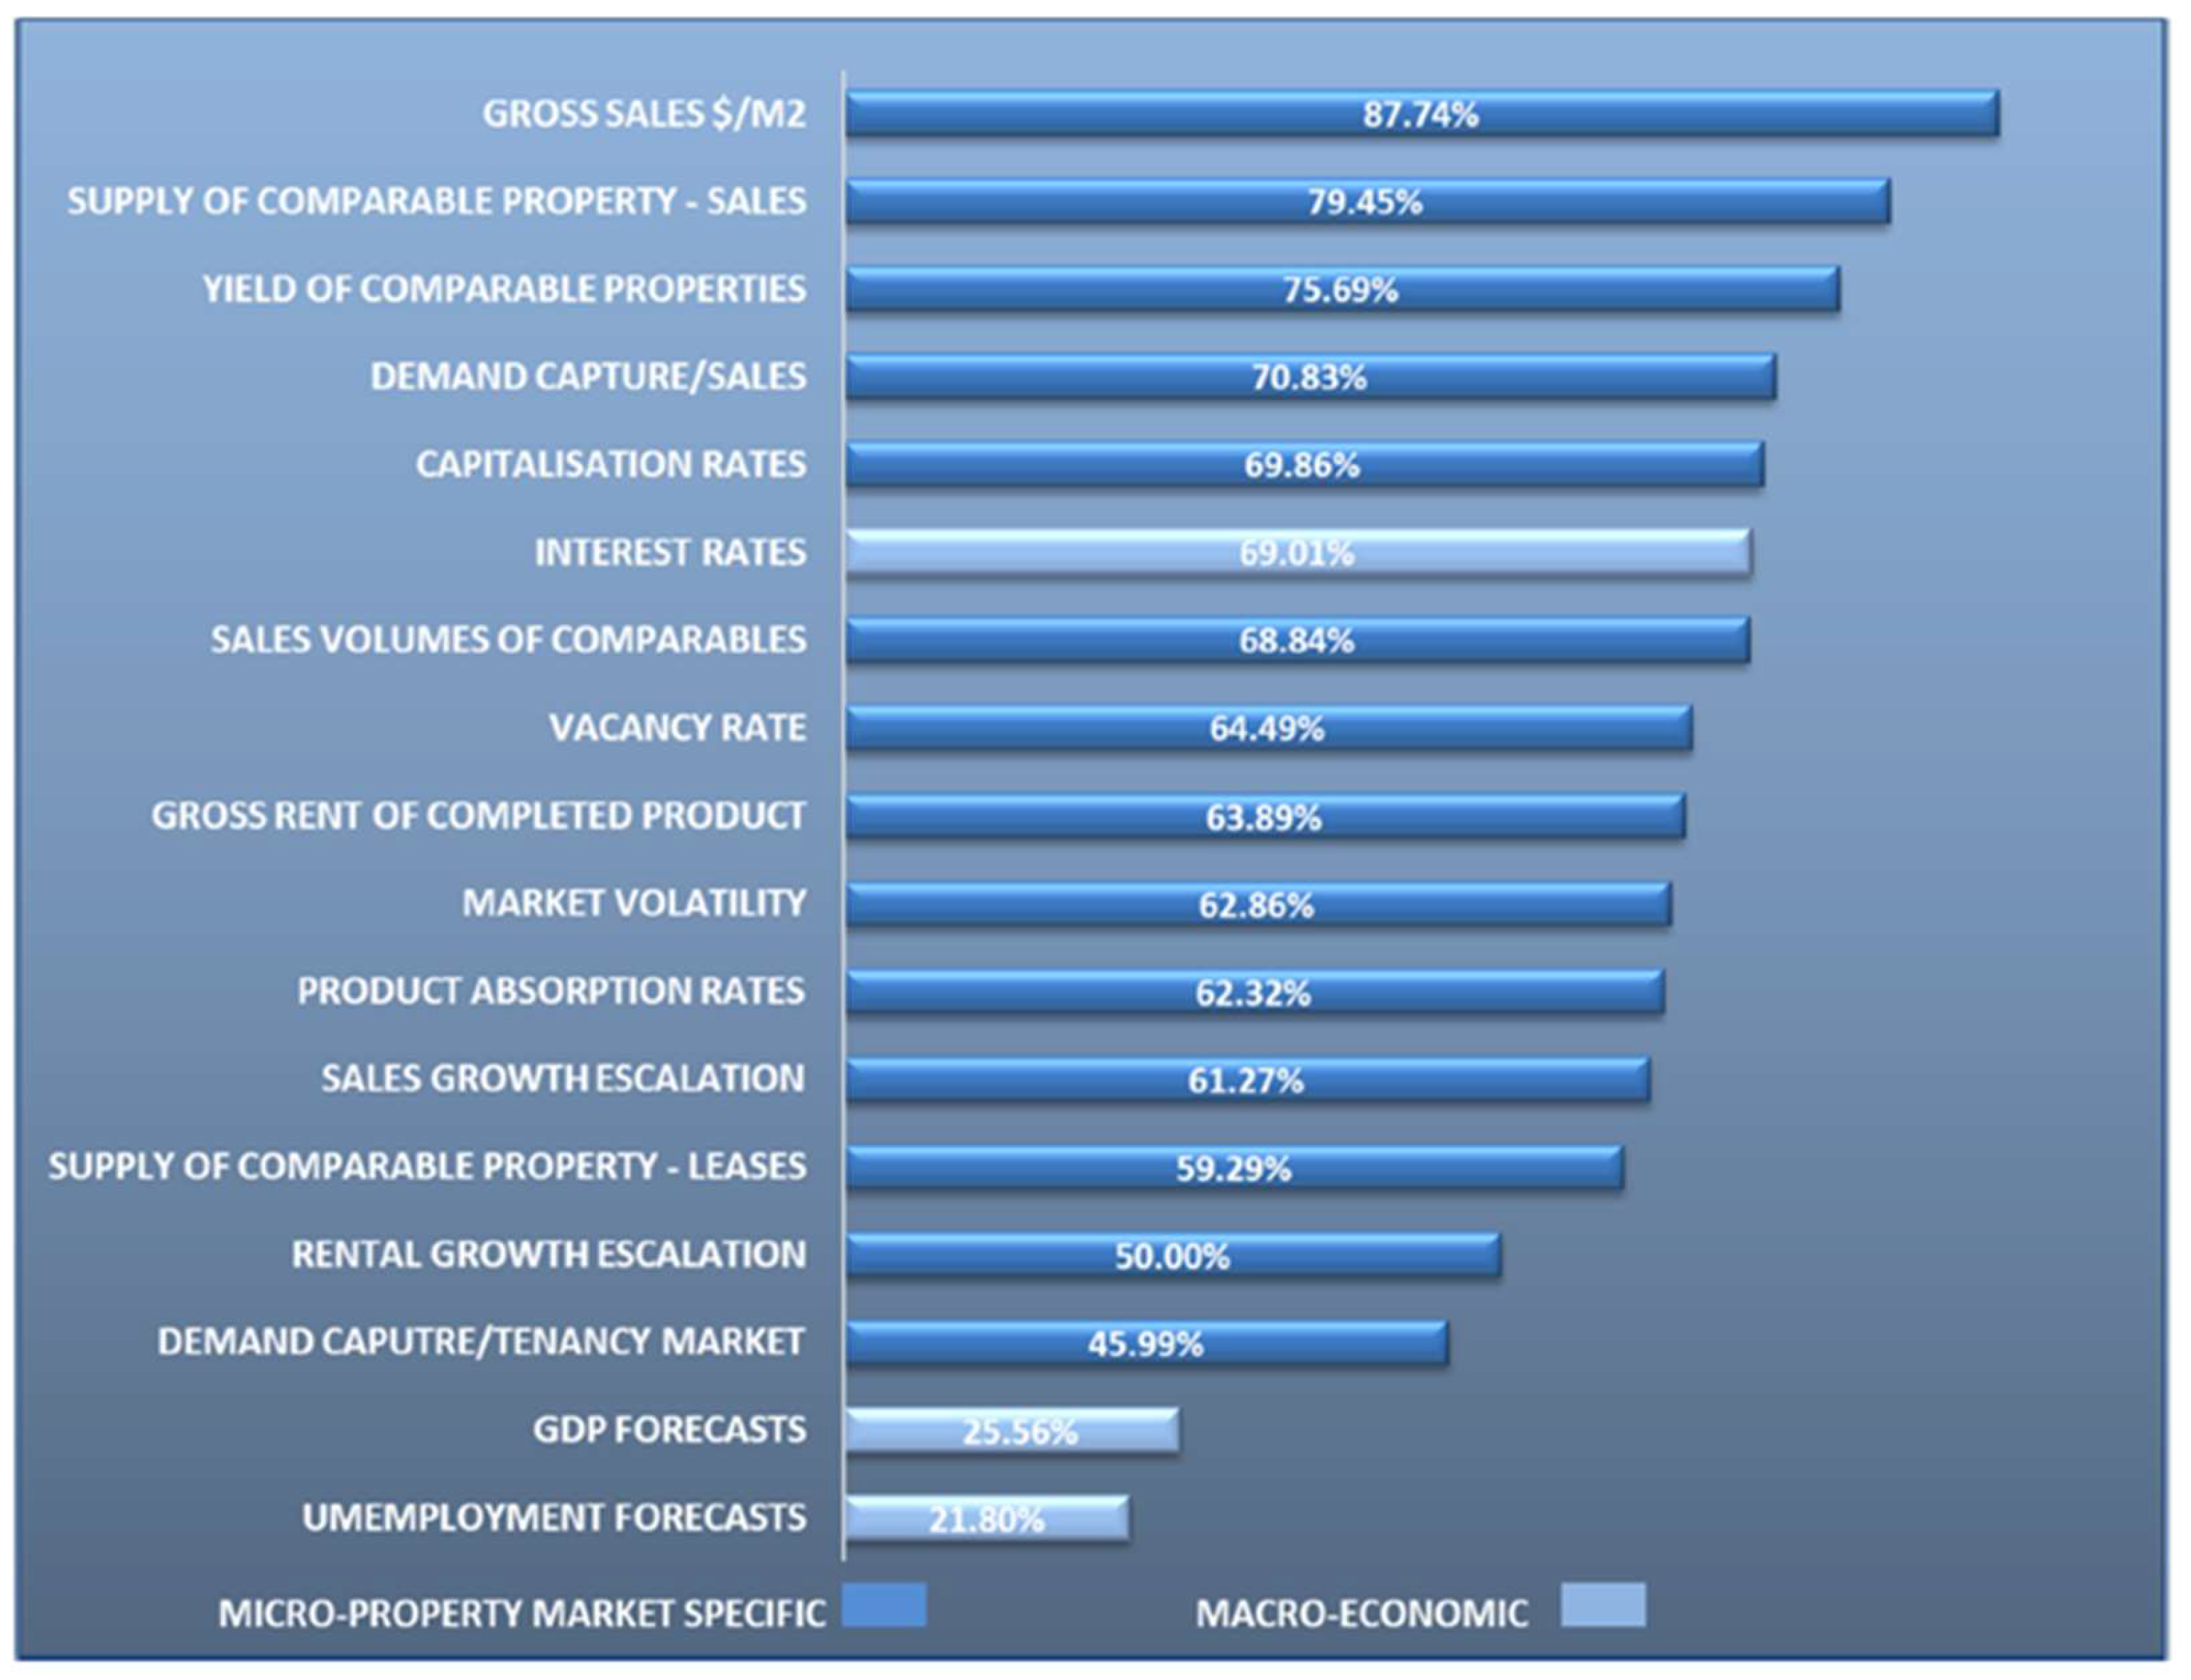
Figure 1 shows the key variables (including frequency of use) that the respondents’ organizations commonly utilized in determining a ‘go/no-go’ decision, as ranked by their frequency of use in the decision-making process. Variables that are ‘always’ or ‘very often’ indicate their priority in the projection of project revenue, followed by variables for comparable properties and rental yields that are often used as a basis for determining project value on completion. As can be seen, the most frequent variables are gross sales, supply of comparable property (sales value), yield of comparable properties, percentage market capture of sales (demand), capitalization rates, and interest rates, followed by other indicators concerning the rental and sales characteristics in the micro-real estate market within which potential projects are competing. The frequency of use also indicates information that is either from the past, such as comparable sales or leasing data, or variables that reflect the current state of the market.
4.2. Determination of Research Question RQ1
RQ1: Do Firms Employ Specific Go/No-Go Hurdle Rates in Early Development Stages, and What Are their Common Benchmarks?
A decision tree analysis was conducted as a preliminary investigation to find strong predicters regarding the decision-making methodology of survey respondents. This analysis revealed a strong association with the use of the MDC hurdle rate with a consistent decision-making methodology, and the CHAID model was also able to predict 77.5% of cases, as demonstrated in
Table 3. The majority (72%) of Australian and New Zealand development firms use specific hurdle rates directly in choosing whether to proceed with a project beyond the pre-commitment stages of the development process. Decision tree analyses found that of the developers who do use specific go/no-go hurdle rates, approximately half (52%) use MDC as a decision making hurdle rate. The Chi-square test of independence was conducted and demonstrated a significant association between those who use hurdle rates and those who use MDC as a decision tool, (
χ21,188 = 13.20,
p < 0.01) (statistical significance is taken to be at the 5% level).
The second most frequently used metric for ‘go/no-go’ hurdle rates is the IRR (40%), which also has a significant association with the use of IRR (
χ21,188 = 6.23,
p < 0.013).
Table 4 gives the percentage usage of the additional hurdle rate metrics used in feasibility analysis, which are consistent with other studies in both Australia and in the UK [
3,
5].
4.3. Determination of Research Question RQ2 and the Use of Proprietary Feasibility Analysis Software Programs
RQ2: How do Feasibility Practices and Hurdle Rate Selections Differ between Organizations Using Proprietary Software, Microsoft Excel, or Custom Programs?
Another objective of this study was to ascertain the practice and frequency of use of proprietary feasibility analysis software programs that are commonly used within the industry. Participants were asked to provide details of their use of proprietary feasibility programs to aid in the decision-making process in the organization where they are employed (“
Does your company use a proprietary development feasibility program for decision making in choosing whether to proceed with real estate development projects?”). In response, 53% (n = 188) indicate they use proprietary feasibility analysis software. As
Table 5 shows, of these 53%, the two main programs used are Microsoft Excel (46%) and Argus Estate Master DF (development feasibility) (37%). The remaining 47%, indicating their organization does not use proprietary software, specified “
how feasibility analysis is completed. (Example, Microsoft Excel)?” in the form of open-ended answers, from which three clear categories can be identified: (1) Microsoft Excel, (2) their organization having created a custom model, and (3) reliance on outside consultants to complete a feasibility analysis for their organization.
The feasibility practices of survey respondents were analyzed to test if there was a significant difference between those who use proprietary feasibility programs and respondents who use Microsoft Excel, have their own bespoke program, or use another method of conducting a feasibility analysis. This involved a series of independent-samples t-tests conducted to compare the mean score of respondents who use or do not use proprietary feasibility software for the number of specific hurdle rates used; the specific percentage of MDC, IRR and ROE adopted; the number of variables forecasted; the number of levels of approval required to proceed with a project; and the years of experience of survey respondents. There was significant difference in the mean numbers of specific hurdle rates between those who use proprietary feasibility analysis software (M = 1.78, SD = 1.41) and those who do not (M = 1.22, SD = 1.35; t (186) = −2.789, p = 0.006, two-tailed). There was also a significant difference in the mean levels of the specific IRR percentage adopted (M = 19.22, SD = 4.96 and M = 16.80, SD = 4.32, respectively; t (64) = −2.065, p = 0.043, two-tailed). The other variables tested included the specific percentage of MDC and ROE adopted as a minimum financial metric, the number of input variables used in forecasting a potential project’s cash flow, the number of approval levels within the organization that are required to proceed, and the mean years of experience of decision makers; all of these were not significant.
Several Chi-square tests of independence were conducted to assess the association between the use of proprietary feasibility programs and the use of specific hurdle rate metrics including MDC, IRR and ROE. There is a significant association between the use of a proprietary feasibility program and Q19 regarding the use of specific hurdle rates as part of a decision-making process (χ2(1, n=187 = 8.359, p < 0.004), with the use of MDC as a hurdle rate (χ21, n=188 = 6.105, p < 0.013), and between those who use a proprietary feasibility program and adapting or altering hurdle rates based on a change in uncertainty or risk (χ21, n=181 = 4.39, p < 0.036).
4.4. Retrospective Analysis of Forecasts
In addition to the formal research questions, respondents were asked if they have changed the variables forecasted for feasibility analysis (listed in
Figure 1) over the past five to seven years or if they have remained constant (Have the variables forecasted in feasibility analyses always remained constant over the past five to seven years?), the rationale being to determine the level of change that has been created in feasibility analysis and viability appraisal practices post the global financial crisis (GFC). The time of this survey (2016–2017) puts boundaries around the industry emerging from the effects of the GFC.
Table 6 shows the results, indicating a modest amount of change post the GFC in the variables forecasted. With just under a third of respondents indicting that they have kept forecasted variables constant and almost two thirds of respondents only making infrequent changes. Respondents were also asked if they retrospectively check the forecasts, of which 55% do this “most of the time/always”, 27% “sometimes”, and 18% “rarely”.
4.5. Determination of Research Question RQ3
RQ3: Which Valuation Methods (Residual Land Value, Discounted Cash Flow, Residual Cash Flow, Market Comparison) Are Firms Using in Early Development Stages?
Survey respondents were asked to specify which of four commonly used land valuation methods were used in their feasibility analysis decision making. The results show the most commonly used is the residual land value method with a 74% usage, followed by the DCF method (49%), residual cash flow (7%), and market comparison (7%). This result is consistent with Coleman et al. [
41] and Crosby et al. [
3], who found the residual method to be common on appraising development projects.
However, the Mann–Whitney U Test showed significant differences between use of the residual land value methods by survey respondents with more experience and by those not using this method (Mdn=132 = 3.00 and Mdn=64 = 2.00, respectively, U = 2224, z = −2.599, p = 0.009). The results for the DCF method, RCFM, and the market comparison methods of site valuation were not significant.
To summarise, the developers primarily use the residual land value method and the DCF method to value a site in the pre-commitment stages, with the RCFM and the market comparison method not widely used. Additionally, the respondents with more than ten years’ experience are more likely than those with less experience to use the residual land value method. Experience does not play a significant role in whether the users use the DCF method, the RCFM or the market comparison method, and multiple responses are possible.
4.6. Determination of Research Question RQ4
RQ4: Is There a Standard Process for Adjusting Hurdle Rates and Benchmarks in Response to Risk and Uncertainty?
Research questions RQ4 and 5 are concerned with the relationship between the choice and selection of hurdle rates and the methods used to alter these rates as well as exploring the notion of heuristic bias and bounded rationality in decision practices. The majority (61%) of respondents do not have a pre-determined process and method for altering or adapting the chosen hurdle rates and benchmarks, even in the presence of an expected change in project risk. For those who do alter their hurdle rates, the primary basis for that change can be categorized by three main themes: (1) altering hurdle rates on the basis of risk analysis and forecasted market conditions; (2) altering hurdle rates based on qualitative frameworks or intuition; and (3) altering hurdle rates based on the project’s planning approval status. The most important variable in predicting whether developers alter their hurdle rates given a perceived change in risk is the developer’s experience and education level and whether the decision maker uses MDC or IRR as a hurdle rate.
4.7. Determination of Research Question RQ5
RQ5: Are Firms’ Decision-Making Processes Influenced by Bounded Rationality?
The results indicate a heavy reliance on industry-accepted rules of thumb for both selecting and setting the specific level of hurdle rate metrics. Bounded rationality is further evidenced by the rationale for the choosing and setting of minimum hurdle rate metrics, as it is based largely on experience, intuition, and the minimum accepted benchmarks set by the providers of capital finance. Developers are more likely to rely on a narrow range of MDC (median 20% and standard deviation of 1.41%) and IRR (median 18% and standard deviation 4.85%) percentages. Bounded rationality is also demonstrated in that the selection and usage of specific hurdle rates does not change even when there is a perceived change in the risk or uncertainty of a potential project.
5. Discussion
Referring to the key variables used as inputs in conducting feasibility analysis in ascertaining the viability of projects (
Figure 1), as mentioned earlier, development projects often occur over a lengthy timeframe, forcing analysts to decide whether to proceed with a potential project that may enter the market several years in the future. However, such longer-term measures as rental escalation and sales growth escalation are less frequently used. Similarly, it is also significant that, except for interest rates, macroeconomic indicators are rarely employed. This empirical result resonates with Crosby et al. [
3], for instance, in that the most frequent indicators used by European developers are short-term supply and demand information. That the present study’s results indicate the use of DCF and capital budgeting measures as a primary means of decision making also points to the prevalence of short-term thinking in what is often a long-term time horizon. The generally accepted notion within the real estate development industry that a feasibility study is conducted with the aid of Microsoft Excel, proprietary feasibility analysis software, or occasionally manual calculation is supported in our findings, with the addition of Argus Estate Master DF. However, the finding that approximately one half of the respondents use proprietary development feasibility programs is new. On the other hand, it is not surprising to find that proprietary feasibility software will usually have several key industry-accepted hurdle rate metrics that are automatically calculated, as decision makers would normally have these metrics readily available and therefore not need to specifically calculate their results.
The significant association of the use of proprietary feasibility programs with the use of specific hurdle rates as part of a decision-making process (with the use of MDC as a hurdle rate) and between those who use a proprietary feasibility program and adapting or altering hurdle rates based on a change in uncertainty or risk is of interest. The advent of proprietary feasibility analysis software makes it easier and less time-consuming to adapt and alter hurdle rates than with Microsoft Excel [
32] (p. 107). This may influence the frequency of hurdle rate adaption as a response to a change in the perceived uncertainty and risk in a project and is worthy of further research.
Developers utilizing proprietary feasibility analysis programs exhibit several distinctive practices compared to their counterparts not using such software. First, they favor specific hurdle rate metrics for assessing project viability and are more inclined to modify these rates in response to changes in project uncertainty or risk. Second, the use of MDC as a hurdle rate is prevalent among these developers, with the mean specified MDC hurdle rate being 19.3%—closely aligning with the industry heuristic of 20%—indicating a nuanced approach to adopting percentage levels. Third, these developers also prefer a higher percentage of IRR as a hurdle rate, though their likelihood of employing ROE or MOR remains unchanged. Fourth, their preference for bespoke programs is often dictated by the size of the project they are undertaking, showcasing a tailored approach to project analysis and evaluation.
Additionally, differences in the number of variables used in forecasting, the number of approval levels required to proceed, and the mean years of experience of decision makers were not found to be significant. That over 50% consistently change the variables used for feasibility analysis in recent years is helpful for improving an organization’s reaction to the dynamics of the real estate market. Retrospective checking of forecasted variables within a feasibility analysis is an important process for decision makers; in doing so, they can learn from their past forecasting activities by understanding which variables they tend to find most difficult to forecast and therefore gain insights into which variables have the highest degree of uncertainty.
In terms of RQ3, the low-level usage of the RCFM and market comparison methods is unexpected, as the market comparison method is well known to be commonly used by real estate valuers in assessing site value, and the RCFM yields a result that is helpful to developers in assessing future cash flow needs for each period. It should also be noted that multiple responses were possible for this question.
This study indicates that most Australia/New Zealand developers do utilize specific ‘go/no-go’ hurdle rate mechanisms as a basis for deciding to proceed beyond the pre-commitment stages of the development process. In particular, MDC and IRR as specific hurdle rate metrics are incorporated into the decision to proceed with potential projects. Additionally, a large majority (72%) of the developers surveyed use either one or two specific hurdle rate metrics as the basis of decision making. Developers who do not use specific hurdle rates are more likely to use a qualitative framework as a basis for decision making.
Analyzing differences across project sizes revealed that smaller projects often use a higher ROE percentage as a hurdle rate, possibly due to greater access to debt capital, which increases ROE requirements compared to MDC and IRR, which are less affected by gearing. Additionally, a strong association was found between the use of ROE as a hurdle rate and using multiple hurdle rates in decision making, indicating this was a secondary hurdle rate metric in addition to the use of MDC or IRR. The results found only a small incidence of NPV as a hurdle rate, despite its academic significance, with project size impacting IRR usage but not its percentage level or significant association with project size and ownership structure. Additionally, there was no association found between preferred project size and ownership structure and the use of a specific percentage level of MDC adopted as a hurdle rate.
6. Conclusions
This paper investigates the prevailing practices of real estate developers in determining target rates of return for development projects, emphasizing the use of industry-accepted heuristics such as hurdle rates. These rates, encompassing the developer’s cost of capital and a premium reflecting subjective assessments of unsystematic project risk, are essential in gauging project viability during feasibility analyses. Developers commonly employ generic hurdle rates based on industry benchmarks, company-specific rules, and financial metrics like internal rate of return and net present value. The study aims to examine how practitioners define, measure, and predict uncertainty and risk in decision-making processes, exploring diverse methods across different sectors of the real estate industry. Additionally, it evaluates the adoption of non-conventional assessment methods, including Monte Carlo simulations and real option theory, offering insights into decision-making practices during the feasibility stage of development projects. The research combines a critical literature review with empirical assessments, incorporating survey data from industry practitioners to document key methodologies and their significance in the decision-making process.
The results also indicate that the structure of many development projects is complex and the boundaries between traditional speculative development and real estate investment using securitization methods have become more difficult to distinguish. Additionally, most developers in this survey did not rely purely on quantitative metrics of project viability to make decisions, but also used qualitative methods and organization-specific structural checks and balances as a method of managing the organization’s risk. Even though most responses indicate that developers rely on a single level of organizational approval, the nature of that approval is at the corporate board or executive level rather than at the project manager level.
The feasibility analysis practices of developers encompass a range of areas, including forecasting variables, retrospective evaluation of these forecasts, utilization of Microsoft Excel and proprietary or bespoke software for project viability, and methodologies for both feasibility analysis and pre-commencement site valuation. Key variables frequently forecasted are gross sales in dollars per square meter, supply and sales value of comparable real estate, yield of comparable properties, market capture percentage for sales (demand), capitalization rates, and interest rates. Interest rates stand out as the sole macro-economic indicator, while the other indicators focus on the micro-economic dimensions of the real estate market, drawing on historical sales or leasing data and current market conditions.
A significant portion of developers review their forecasted variables retrospectively, aiming to refine their forecasting methods based on past outcomes. When it comes to software tools for feasibility analysis, Microsoft Excel leads with 46% usage among developers, followed by Argus Estate Master DF at 37% and other proprietary software tools being used by no more than 5% of the respondents. This distribution highlights the reliance on widely accessible and specialized software for conducting thorough feasibility analyses in the real estate sector.
Distinguishing between real estate developers using proprietary feasibility analysis programs beyond Microsoft Excel and those who do not, six notable differences emerged. First, users of proprietary programs are more inclined to employ specific hurdle rate metrics for advancing projects beyond initial stages. Second, they prefer particular metrics for assessing project viability and are adept at adjusting hurdle rates in response to shifts in project risk or uncertainty. Third, there is a tendency among respondents to favor MDC as a hurdle rate, though the adopted percentage level remains consistent. Fourth, a higher reliance on IRR as a hurdle rate was observed among proprietary software users, without a corresponding increase in the use of ROE or MOR. Fifth, no significant differences were noted in the number of forecasting variables, approval layers required for progression, or the decision makers’ years of experience. Finally, preferences in project size and the distinction between publicly listed and private organizations mark the differences between users of bespoke development programs and those who do not use them.
It was found that in the pre-commitment stages of the development process, the primary methods used to value a site included the residual land value method and the DCF method. The residual cash flow method and the market comparison method were not widely used.
Most developers involved do not have a predetermined process and method for altering or adapting the chosen hurdle rates and benchmarks, even in the presence of an expected change in uncertainty and risk to a potential project. For developers who do alter their hurdle rates, the primary basis for that change can be categorized by three themes: altering hurdle rates based on risk analysis and forecasted market conditions; altering hurdle rates based on qualitative frameworks or intuition; and altering hurdle rates based on the status of planning approval. The most important variables in predicting whether developers alter their hurdle rates include the type of real estate involved, education level, and whether the decision maker uses MDC or IRR as a hurdle rate.
The results demonstrate the existence of developers’ bounded rationality due to a heavy reliance on industry-accepted rules of thumb for both selecting and setting the specific level of hurdle rate metrics used to decide whether to proceed with a project beyond the pre-commitment stages of the development process. Additionally, it is interesting to note that the selection and usage of specific hurdle rates did not change even when there was a perceived change in the risk or the uncertainty of a project.
The rationale for the choosing and setting of minimum hurdle rate metrics is based largely on experience, intuition, and the minimum accepted benchmarks set by providers of capital finance for the real estate development industry.
6.1. Recommendations
In the evolving landscape of real estate development, a set of key recommendations have emerged, offering guidance on project decision making and strategic planning. These recommendations emphasize the need for a distinct approach in real estate research, the importance of establishing independent hurdle rates for projects, and the adoption of a systematic process for adjusting these rates based on various risk factors.
Real estate development research should emphasize the importance of not merely emulating the broader financial investment field, which typically prioritizes regular, recurrent income. Instead, it is crucial for research in this field to integrate specific indicators that are relevant to short-term speculative projects. This approach ensures a more tailored understanding of decision practices in development projects. Furthermore, we noted that despite capital providers for development projects in the Antipodean region insisting on a minimum 20% return on cost, developers should independently establish their project hurdle rates. These rates should be informed by the organization’s opportunity cost, WACC, and an additional risk premium. This premium must reflect the forecasted risk and uncertainty associated with the key variable inputs of a potential project.
In addition to setting these hurdle rates, developers are advised to adopt a pre-determined process for modifying or adapting these rates and benchmarks. This adaptation should consider several factors: the level of risk and uncertainty related to input variables, which must be forecasted; the type of planning approval obtained or needed for the project; the perceived level of risk and uncertainty from analyzing a potential project’s key variable inputs; and the perceived level of risk and uncertainty in the general economy and broader real estate market. Such a comprehensive and nuanced approach will enable developers to make more informed and strategic decisions in their projects.
6.2. Limitations and Further Research
While the present study contributes to a greater understanding of the evolving decision-making processes of developers, it is limited by the respondents being primarily Australian and New Zealand real estate developers, although surveys of developers in other parts of the world do indicate a common approach to decision making and hurdle rate selection; thus, its generalizations still require additional study to demonstrate broader applicability. Such further investigation can lead to a universal model or a recommendation of the best method for project evaluation; it may also lead to choosing the optimal rate, with further work into the nature of uncertainty and forecasting in decision making processes in complex development and investment projects involving many intricate dependent and independent variables.


