Article

Seismic Damage Probability Assessment of Existing Reinforced Concrete School Buildings in Afghanistan

by
Sayed Qudratullah Sharafi
and
Taiki Saito
*
Department of Architecture and Civil Engineering, Toyohashi University of Technology, Toyohashi 441-8580, Japan
*
Author to whom correspondence should be addressed.
Buildings 2024, 14(4), 1054; https://doi.org/10.3390/buildings14041054
Submission received: 12 February 2024 / Revised: 28 March 2024 / Accepted: 4 April 2024 / Published: 10 April 2024
(This article belongs to the Special Issue Research on the Seismic Performance of Reinforced Concrete Structures)

Abstract

:
Existing Reinforced Concrete School buildings with low earthquake resistance may suffer structural failure or severe damage in a catastrophic seismic event. Ascertaining earthquake resistance in existing school buildings is vital to confirming the safety of students, teachers, and all school members. Reinforced concrete (RC) has been used significantly for numerous years as the primary material due to its easy access and low cost-effectiveness in construction. The current research focused on analyzing the existing RC school buildings designed and constructed in various regions of Afghanistan over the last three decades. Seismic fragility curves, which are generated from incremental dynamic analysis (IDA), have been used to evaluate the damage probability of RC school buildings against earthquake ground motions. In this investigation, 34 RC school buildings were selected from an extensive database and subsequently classified as either A-type or B-type based on specific criteria, including design details and construction year. Following this classification, an assessment of the seismic damage probability for these buildings was conducted using probabilistic models based on IDA curves. The results indicate that A-type school buildings with newer construction are less prone to damage compared to B-type school buildings, showing improved resilience. Especially the B-type buildings in seismic Zone-I are found to be highly vulnerable under the maximum considered earthquake scenarios.

1. Introduction

School buildings in Afghanistan have been significantly constructed across all provinces, particularly in major cities, over the last three decades. These school buildings vary in height from one-story to four-story structures. Various construction materials have been utilized for school buildings in different regions due to climate conditions and the availability of materials at construction sites, such as clay brick masonry, stone masonry, and reinforced concrete. Especially, reinforced concrete (RC) has been used significantly for several years as the common material due to easy access, fire resistance, energy savings, and low cost-effectiveness of construction, providing structural strength and durability in different locations. Lack of design standards and nonengineered construction of RC buildings have led to structural collapse, financial losses, injuries, and deaths under severe earthquakes such as the 2015 Hindu Kush earthquake, which had a moment magnitude (Mw) of 7.5 [1].
The seismic vulnerability of existing RC buildings has been widely discussed in the literature [2,3,4,5,6]. In recent years, Carlos Gonzalez et al. [7] conducted a research methodology aimed at reducing risk and enhancing the resilience of school buildings.
Incremental dynamic analysis (IDA) is commonly used to determine the fragility curves of earthquakes. The IDA can evaluate a structure’s seismic behavior, ranging from elastic to plastic deformation and potential collapse [8,9,10]. Behrouz Asgarian et al. [11] utilized the IDA to observe the Tehran communications tower using different Damage Measures (DMs) and Intensity Measures (IMs). Their study concluded that the spectral acceleration at the fundamental period, Sa ( T 1 ), outperforms the peak ground acceleration (PGA) as IMs in terms of efficiency. The IDA involves several critical steps, including choosing suitable IMs and DMs, selecting appropriate and sufficient earthquake ground motion records (GMRs), and effectively adjusting GMRs for higher intensities using scaling factors.
Based on the research by Yu Cheng et al. [12], the spectral acceleration Sa ( T 1 ) is recognized for its strong correlation with seismic damage measures, particularly in structures dominated by the first vibration. Therefore, the spectral acceleration Sa ( T 1 ) is adopted as the IM for this study. Iunio Iervolino and Gaetano Manfredi [13] considered the maximum inter-story drift ratio as the DM of a structural model. Consequently, this study also adopts the maximum inter-story drift ratio as the DM for RC school buildings in the IDA analysis.
Andrea Miano et al. [14] conducted research to assess the vulnerability of RC structures. They focused on the impact of geometrical features, such as the number of floors and span length. The purpose was to define the probability of reaching a given limit state under a certain hazard intensity, considering factors like maximum differential settlement and deflection ratio. Fernando Gomez-Martinez et al. [15] focused on the potential relevance of differential settlements in assessing earthquake-induced liquefaction damage. Nicoletta Nappo et al. [16] researched to develop fragility curves for existing RC buildings. This work considered the empirical correlation between subsidence, monitored with satellite data regarding differential settlements, and damage to the RC buildings. Caglar Goksu et al. [17] investigated research by compiling the data of RC columns incorporating recycled concrete aggregate to generate fragility functions. Maria Zucconi et al. [18] conducted a detailed study to develop fragility curves specifically for RC-frame buildings.
Sergio Ruggieri et al. [19] researched existing low-rise RC school buildings in the Province of Foggia, Southern Italy. They developed a simplified method for assessing existing RC school buildings and generated fragility curves for life safety and near-collapse limit states. Gianrocco Mucedero et al. [20] studied the seismic risk in masonry-infilled RC school buildings, emphasizing uncertainties in infill panel definitions and their impact on seismic loss predictions. Raffaele Pucinotti et al. [21] performed a case study on the Frangipane school in Reggio Calabria, Italy, which experienced significant retrofitting to increase its resistance to the high seismic risk. Wilson Wladimir Carofilis Gallo et al. [22] proposed a framework for a combined seismic and energy retrofitting strategy for existing buildings.
The non-linear frame analysis program, STERA 3D, developed by one of the authors [23], has been used to perform the IDA for various earthquake ground motions to assess the damage probability of 34 school buildings. A database containing 220 recorded ground motions was used to select the input ground motions for the IDA. The probability of damage to RC school buildings is divided into five damage states (no damage, minor damage, significant damage, severe damage, and collapse). These probabilities are then compared for two types of school buildings (Type A and Type B) constructed in different years and located in different regions. Sharafi et al. [24] evaluated the damage probability of six school buildings constructed in six different cities in Afghanistan. They examined the effect of brick masonry walls on the seismic performance of RC school buildings [25]. They also proposed a new method to calculate the effect of infill masonry walls containing openings to reinforce concrete structures [26].
The main objective of the current research is to investigate the damage probability of RC school buildings that have been designed and constructed in different locations with different architectural types. Despite some researchers investigating the seismic vulnerability of various structural typologies, such as steel moment frame edifices and reinforced concrete (RC) constructions [27,28,29,30], there is still a significant lack of fragility curves for RC school buildings. Consequently, the principal aims of this investigation are delineated as follows:
  • Damage probability states of RC school buildings constructed in various locations and ground motion intensities.
  • Evaluation of the seismic risk for RC school buildings in various seismic zones and locations.
  • Consider factors such as the seismic zone location and the number of stories.
  • Proposal of fragility curves for RC school buildings in different seismic zones.

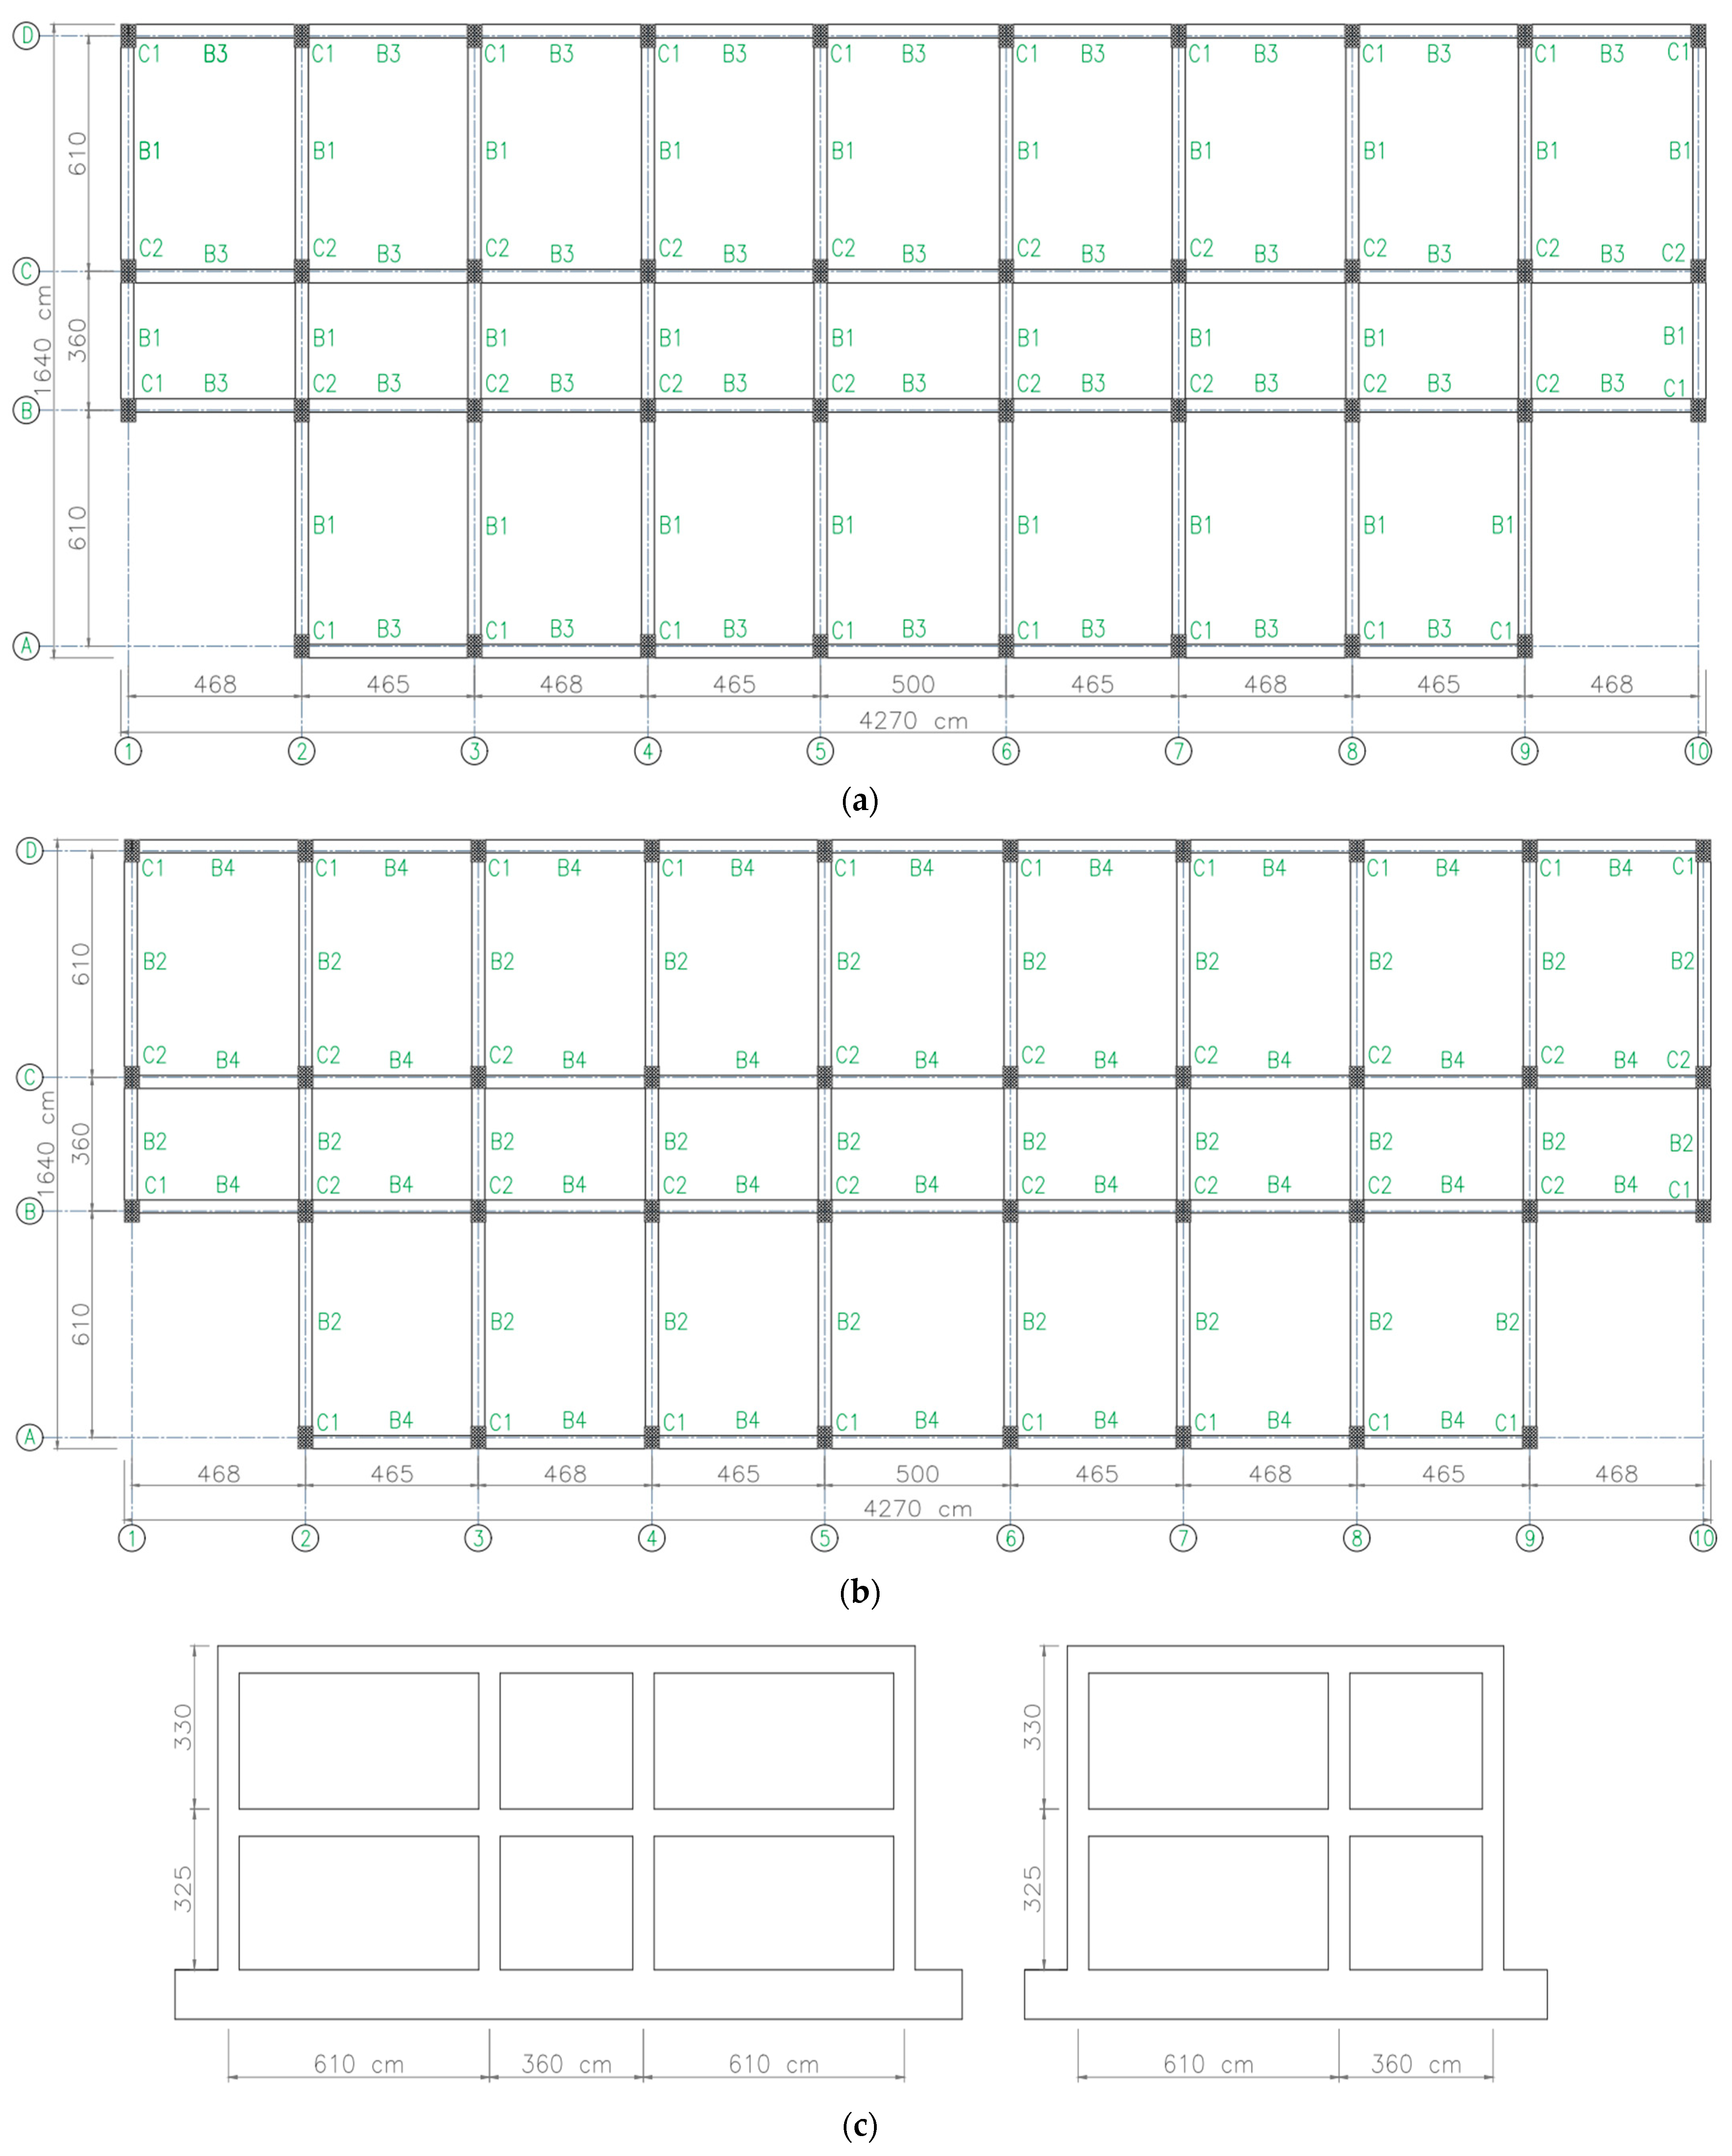
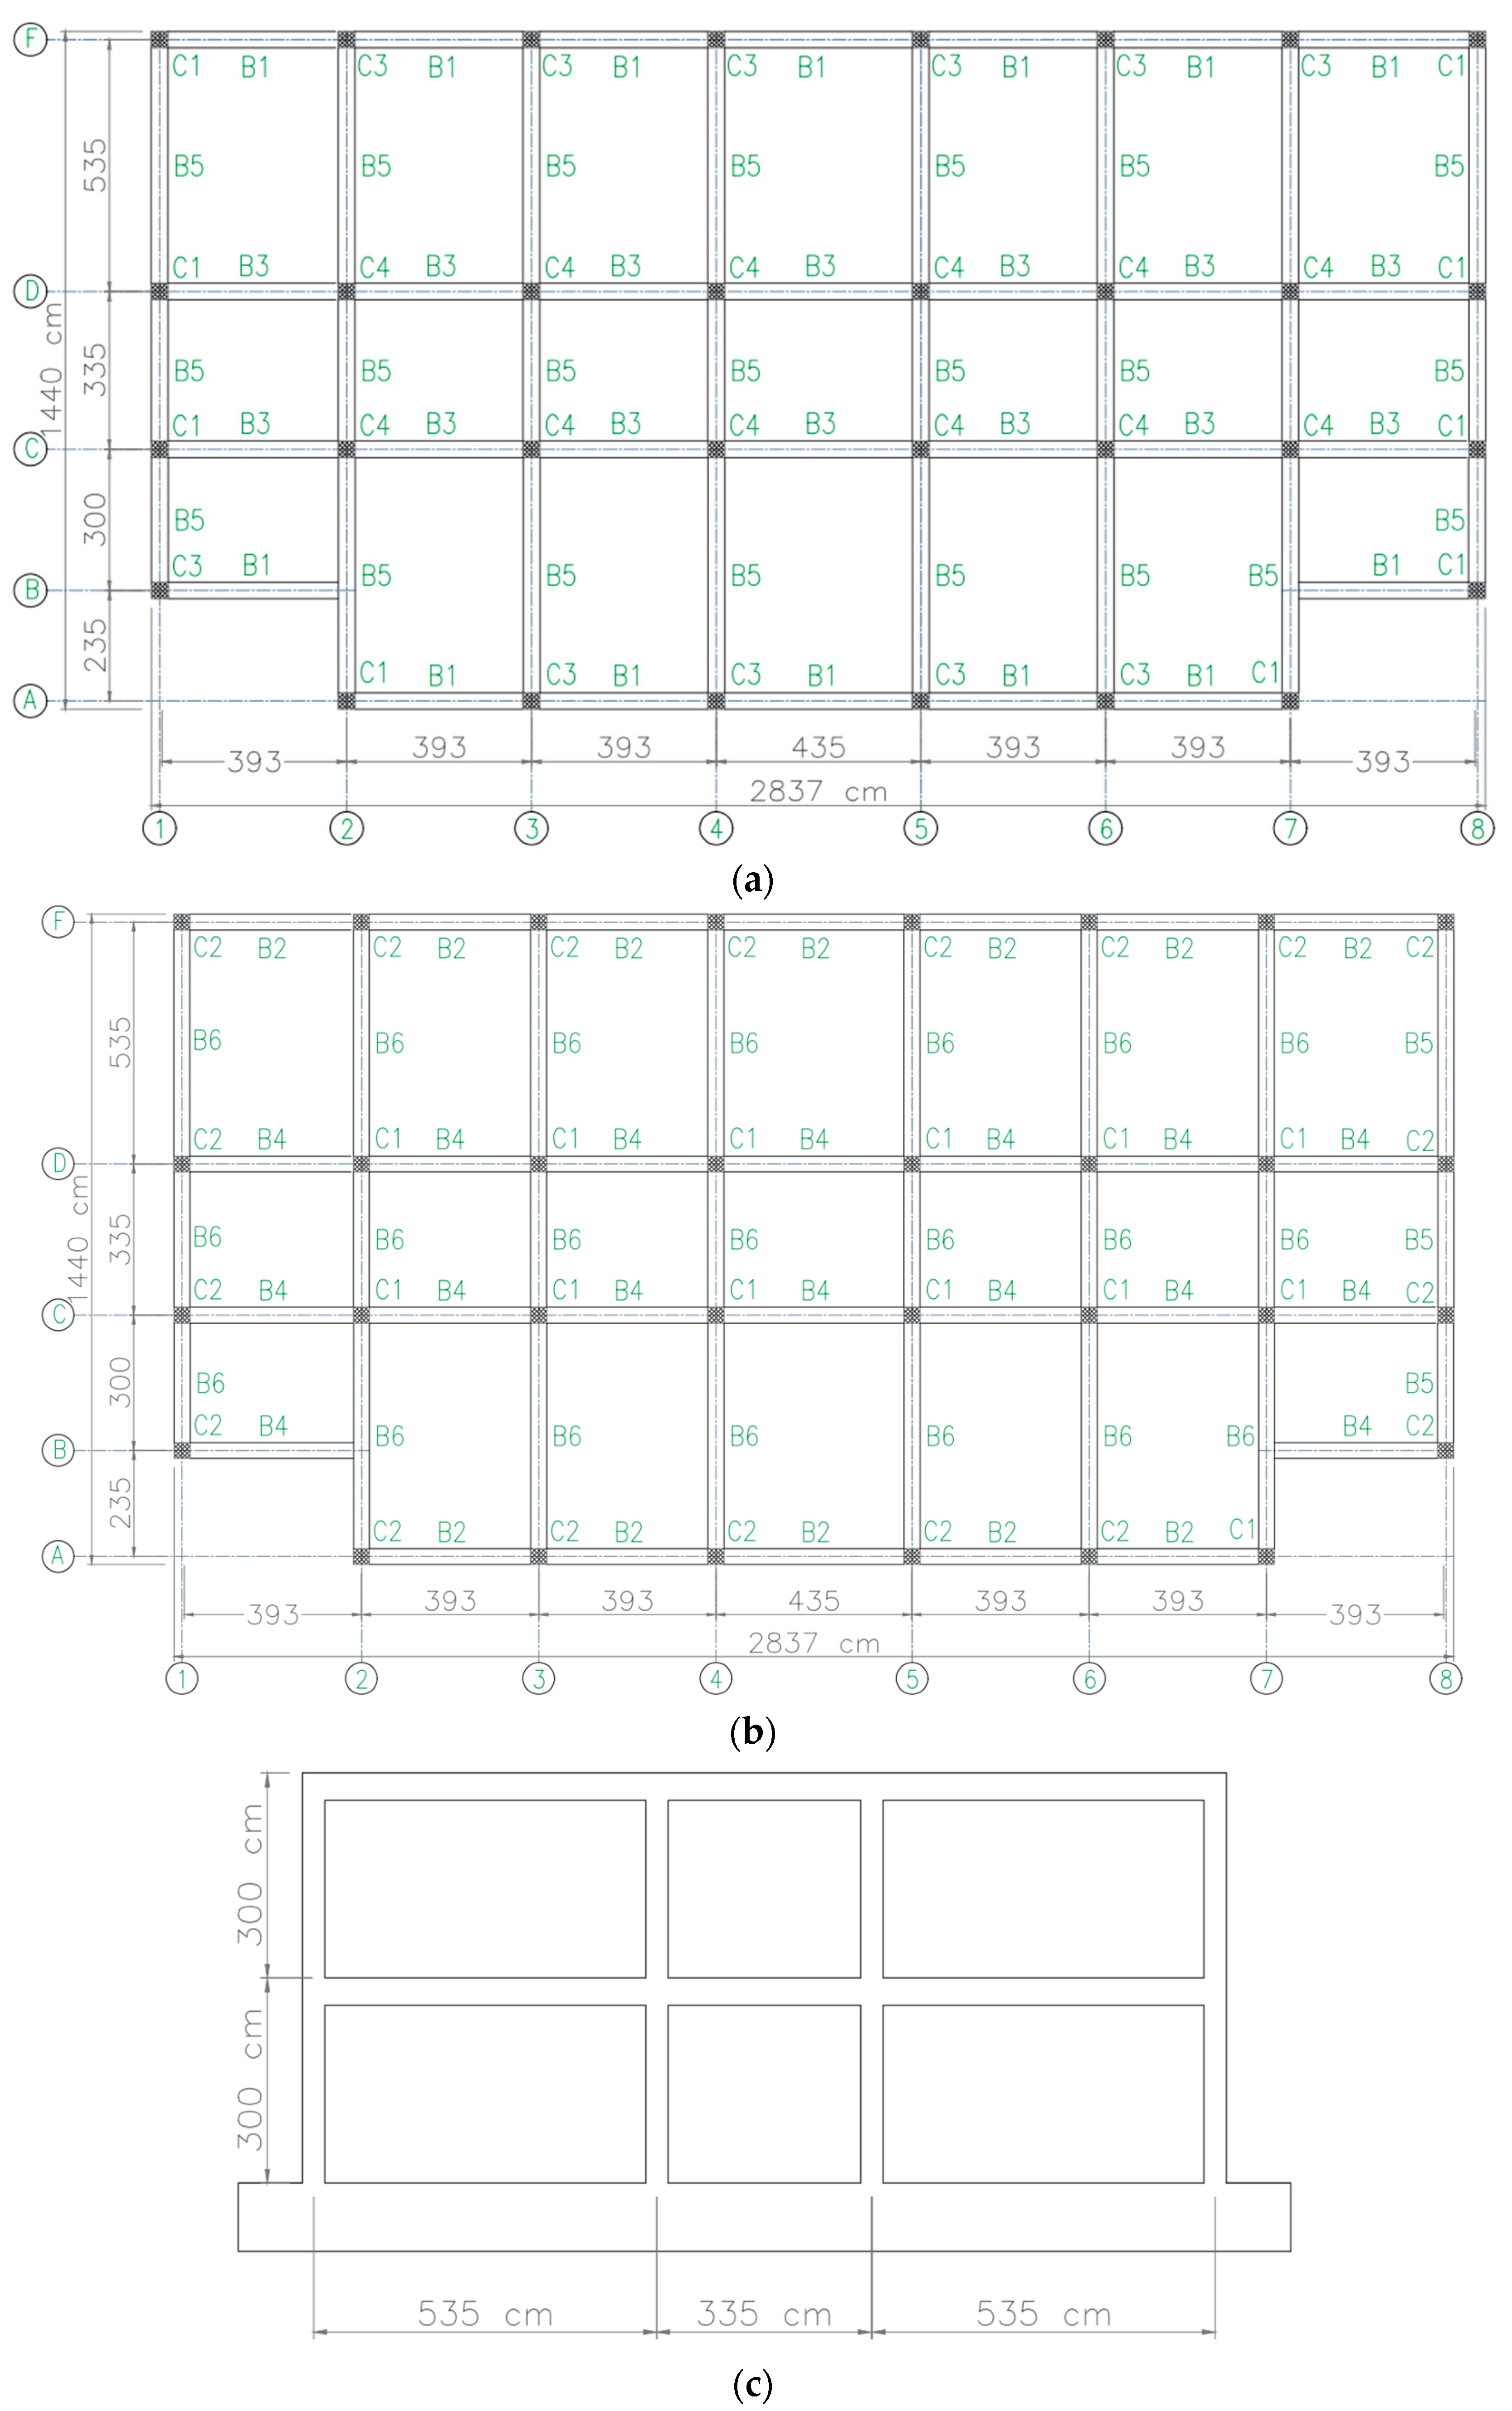
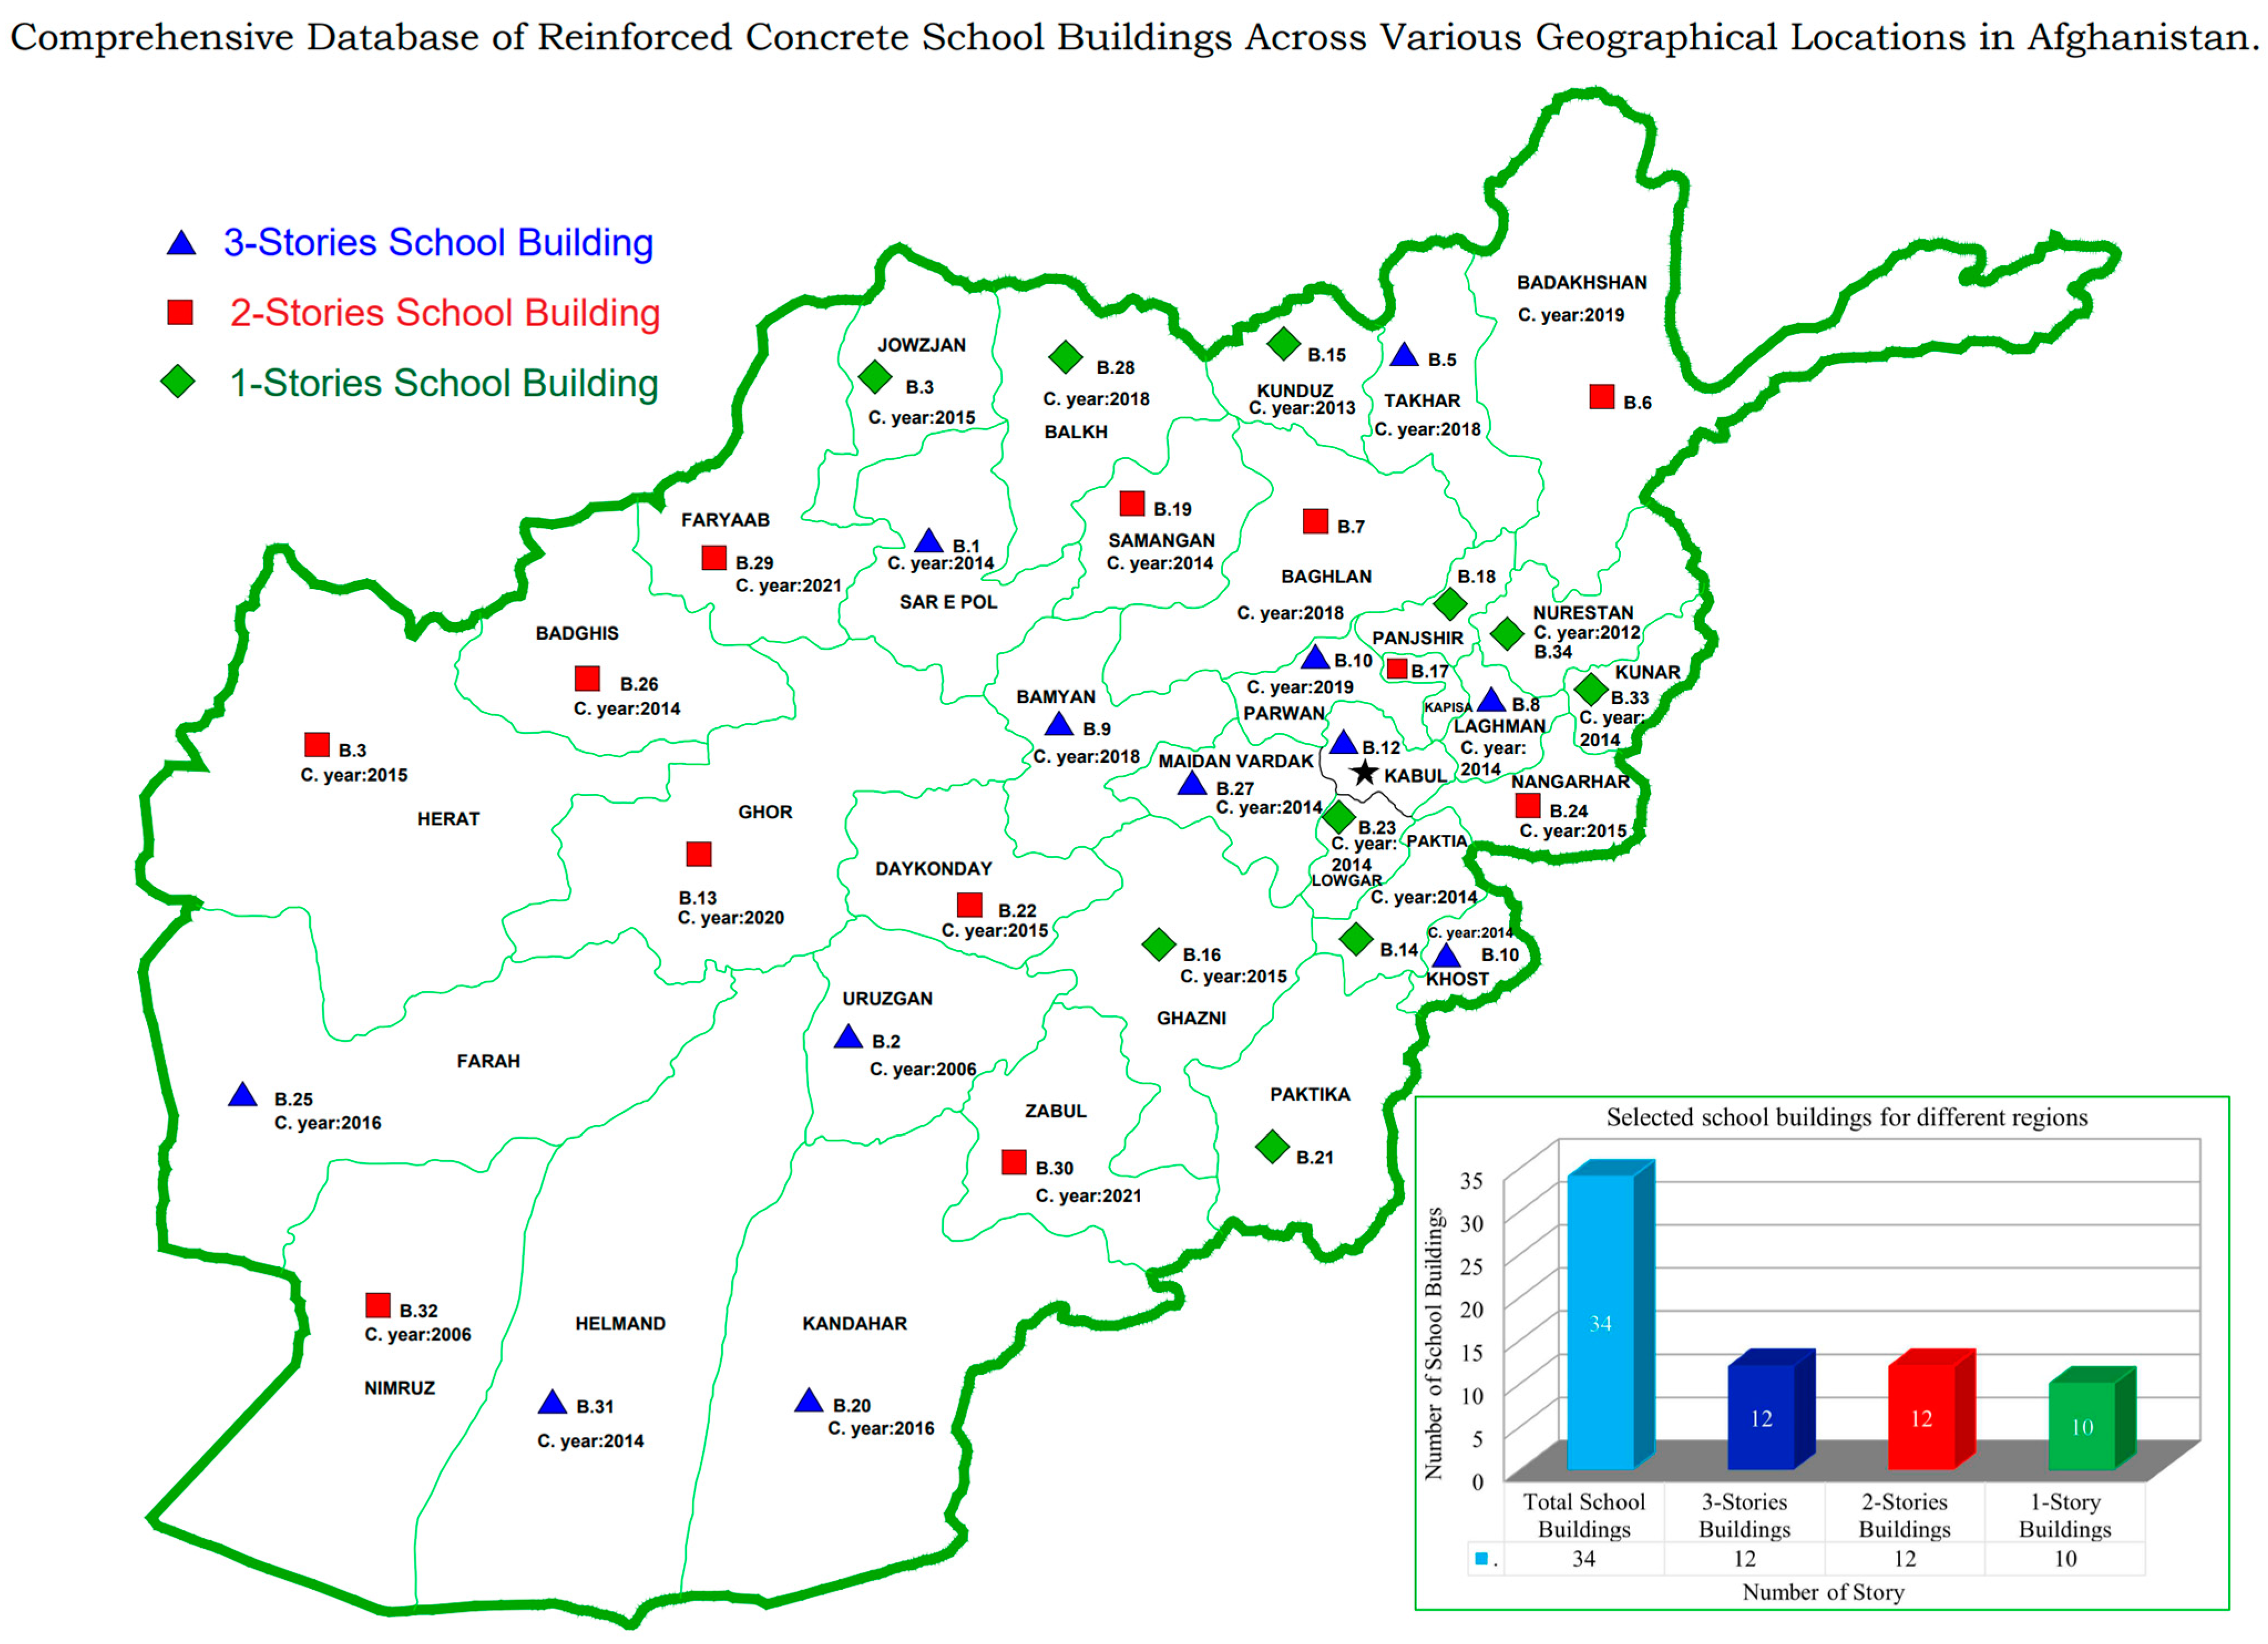
2. RC School Building Database under Investigation

According to the annual report of the Ministry of Education (MOE) of Afghanistan [31], 14415 public school buildings and 2584 private school buildings have been built in different regions. Various construction materials, including stone masonry, brick masonry, concrete masonry units, hollow block masonry, and aerated concrete blocks, have been used for internal and external walls in these school buildings. However, the main structural elements are the RC elements, such as beams, columns, and slabs, reflecting significant consideration for ensuring the safety and stability of school buildings.
A total of 34 school buildings, each designed as a moment-resisting frame system and constructed in different provinces of Afghanistan, have been selected for this study. The architecture of these school buildings varies due to the number of stories, plan irregularity, dimensions of columns and beams, story height, and the number of spans in the x and y directions. They are classified as low-rise buildings. These school buildings were constructed by the Ministry of Education (MOE) and the Ministry of Urban Development and Housing (MUDH) between 2001 and 2022. In this study, A-type school buildings refer to those designed and constructed by the Ministry of Urban Development and Housing (MUDH) after 2018. Conversely, B-type school buildings are those designed and constructed by the Ministry of Education (MOE) before 2018. The A-type school buildings have larger column and beam dimensions, higher concrete compressive strength, and a higher steel percentage than the B-type school buildings.
As examples, one A-type school building and one B-type school building are shown in Figure 1 and Figure 2, respectively. The A-type school building in Figure 1 has a plan with a dimension of 42.7 m × 16.4 m consisting of nine and three spans in longitudinal and transverse directions, and an elevation with the first and second story heights of 3.25 m and 3.3 m. The B-type school building in Figure 2 has a plan with a dimension of 28.37 m × 14.4 m consisting of seven and four spans in longitudinal and transverse directions, and an elevation of 3 m for the first and second story heights. For both buildings, the floor weight is calculated as the sum of the dead load and the live load, equal to 11.8 kN /m2. The section details of load-bearing elements (beams and columns) are summarized in Table 1 and Table 2 for the A-type school building and Table 3 and Table 4 for the B-type school building. The compressive strength of concrete ranges from 20 MPa to 28 MPa, whereas the rebar strength of structural elements ranges from 280 MPa to 420 MPa.
Figure 3 represents the geographical distribution of RC school buildings in the various provinces of Afghanistan. As illustrated in the bar chart, 34 school buildings are cataloged: 12 are three stories (represented in blue), an equal number are two stories (in red), and the remaining 10 are one story (in green).

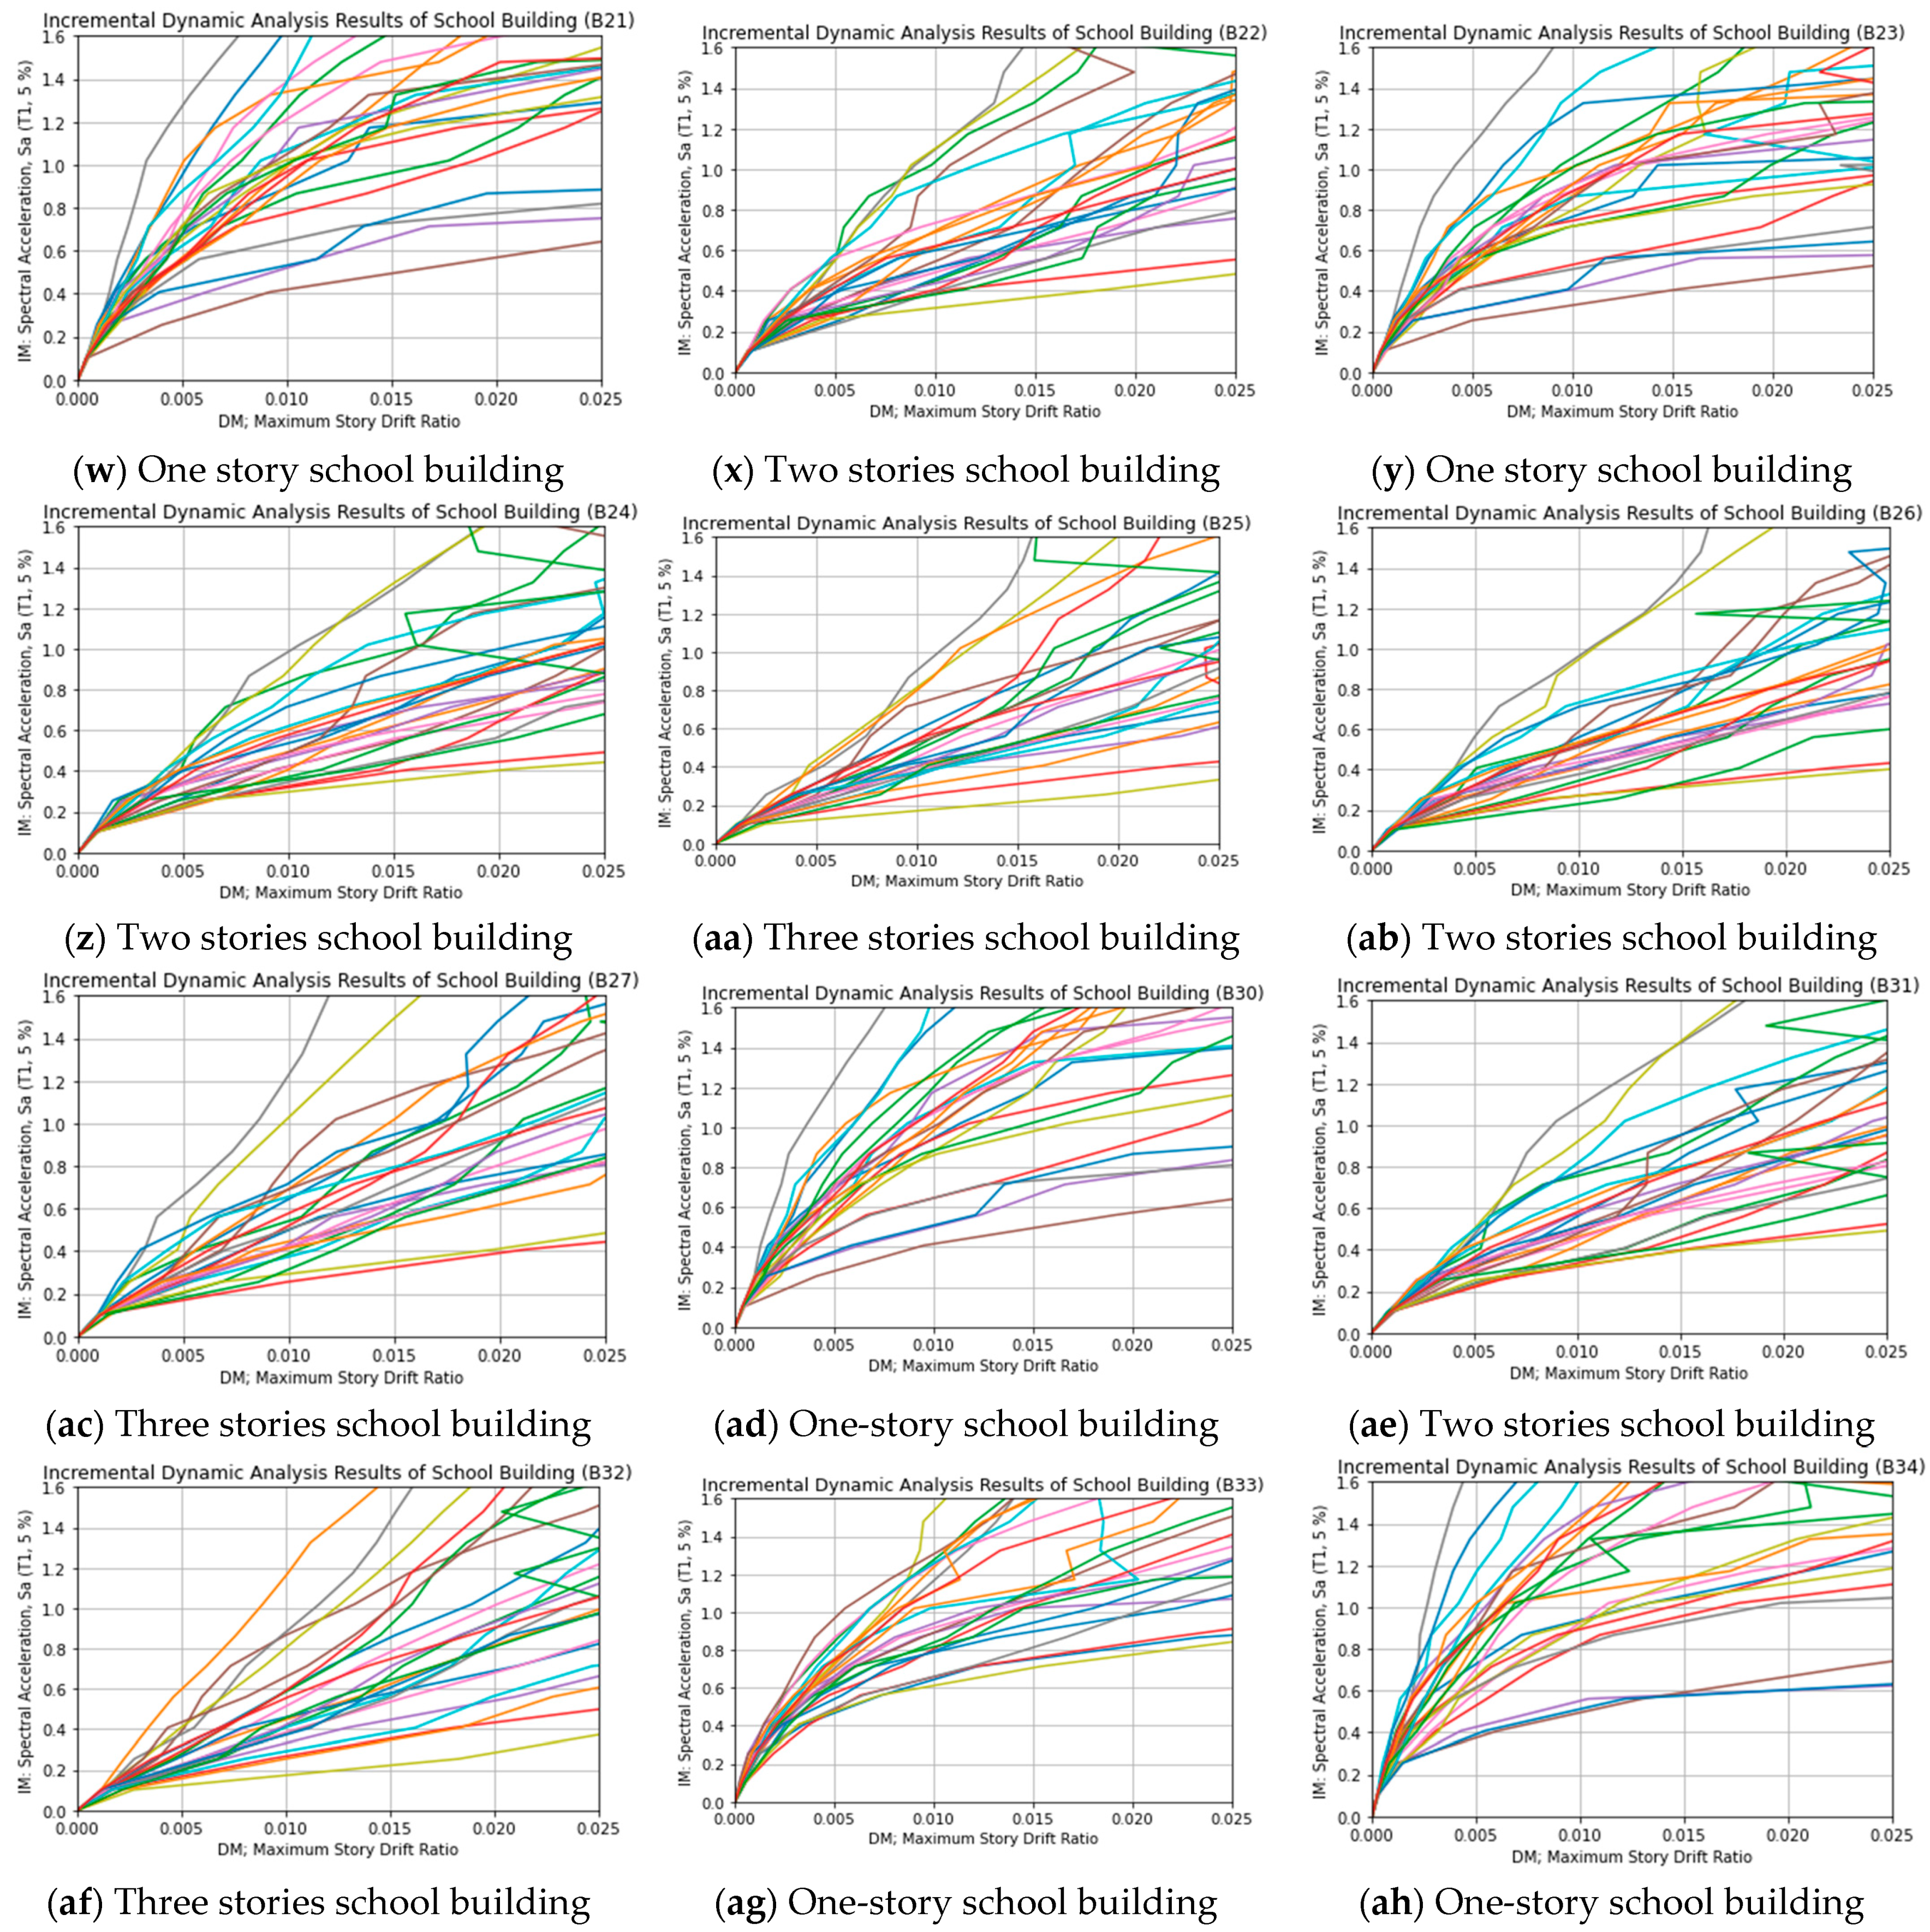
3. Incremental Dynamic Analysis (IDA)

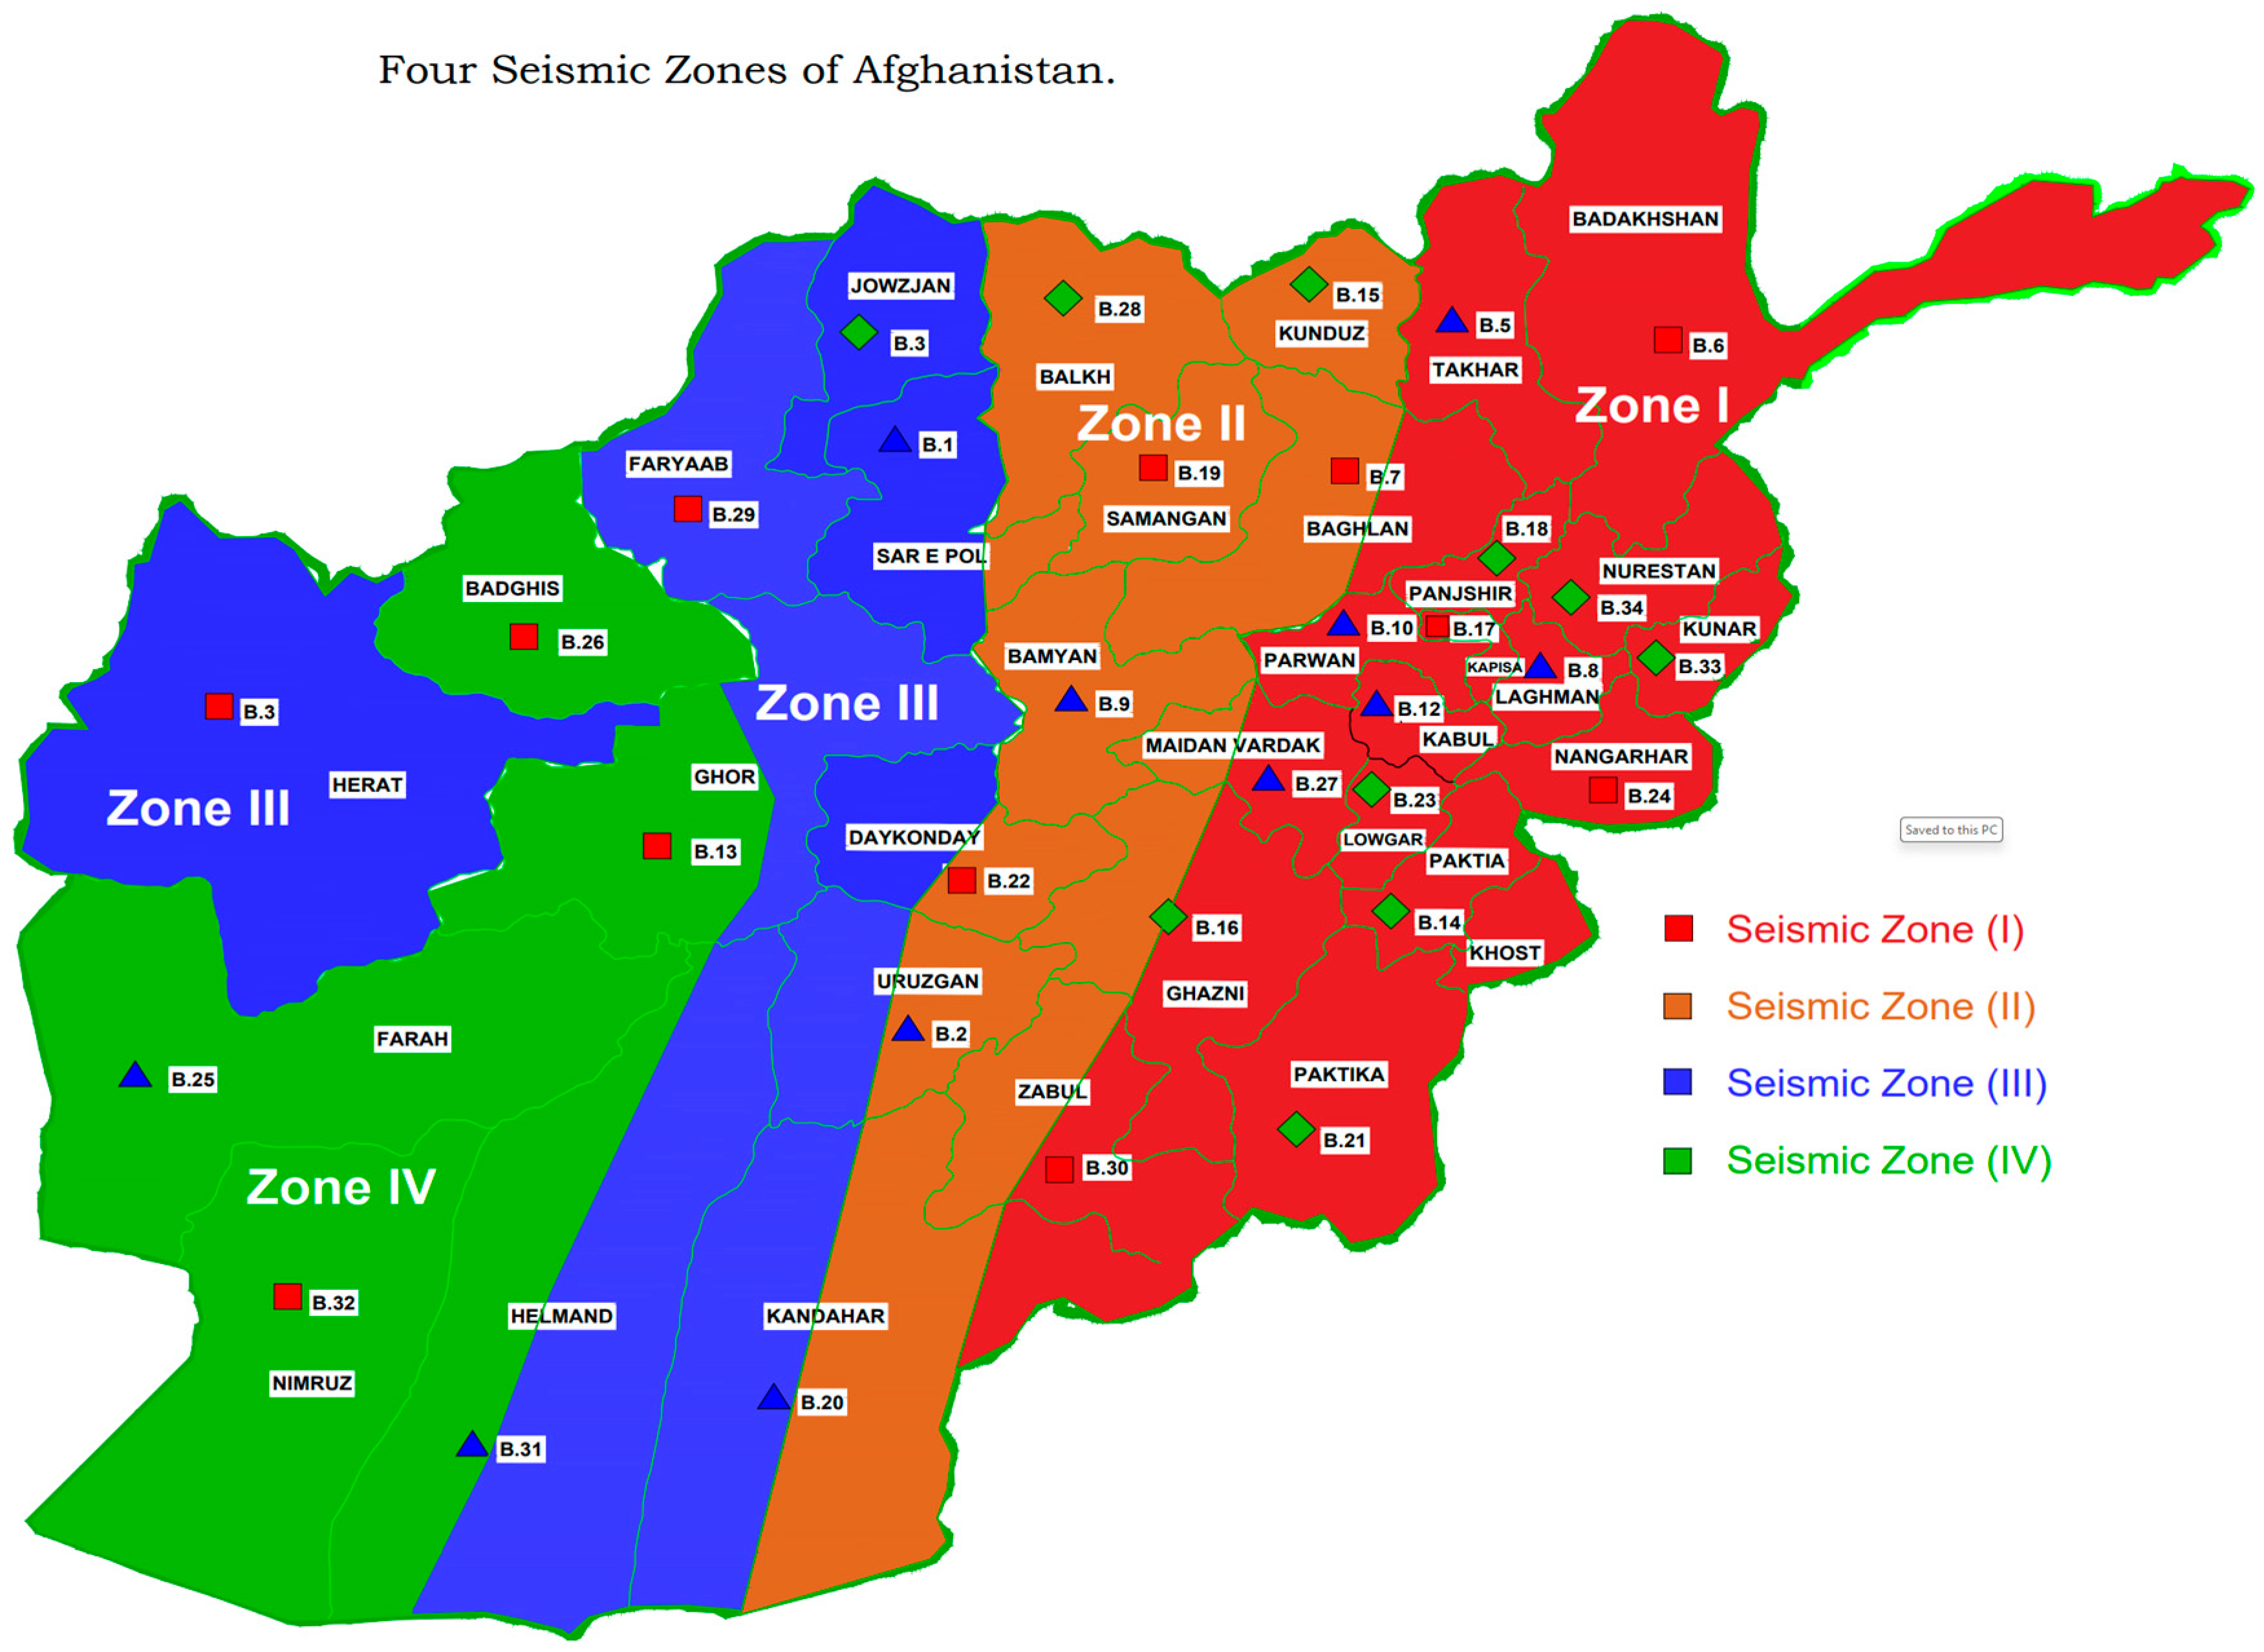
3.1. Characterizing Seismic Hazards

Over the last decades, Afghanistan has experienced destructive earthquakes that have resulted in human fatalities and notable economic losses. The 1998 Takhar earthquake with a magnitude of 6.9, the 2002 Hindu Kush earthquake with a magnitude of 5.9, and the 2015 Hindukush earthquakes are mentionable. The 2015 Hindukush earthquake that killed 117 people and injured 544 others is a typical distractive earthquake that should be considered for future building design.
Afghanistan is located in the Alpine–Himalayan belt, formed due to collisions among the Indian, Eurasian, and Arabian tectonic plates. The research conducted by Zakaria Shinzai [32] revealed 22 active faults spread across Afghanistan. Among these, the Chaman Fault is of significant concern. A study performed by Muhammad Shahid Riaz et al. [33] shows that this fault extends approximately 650 km within Afghanistan and traverses the Kabul region, exhibiting a northward movement of 3 cm per year, which indicates that the Chaman Fault possesses the capacity to create powerful ground motions with the potential to cause considerable destruction of buildings.

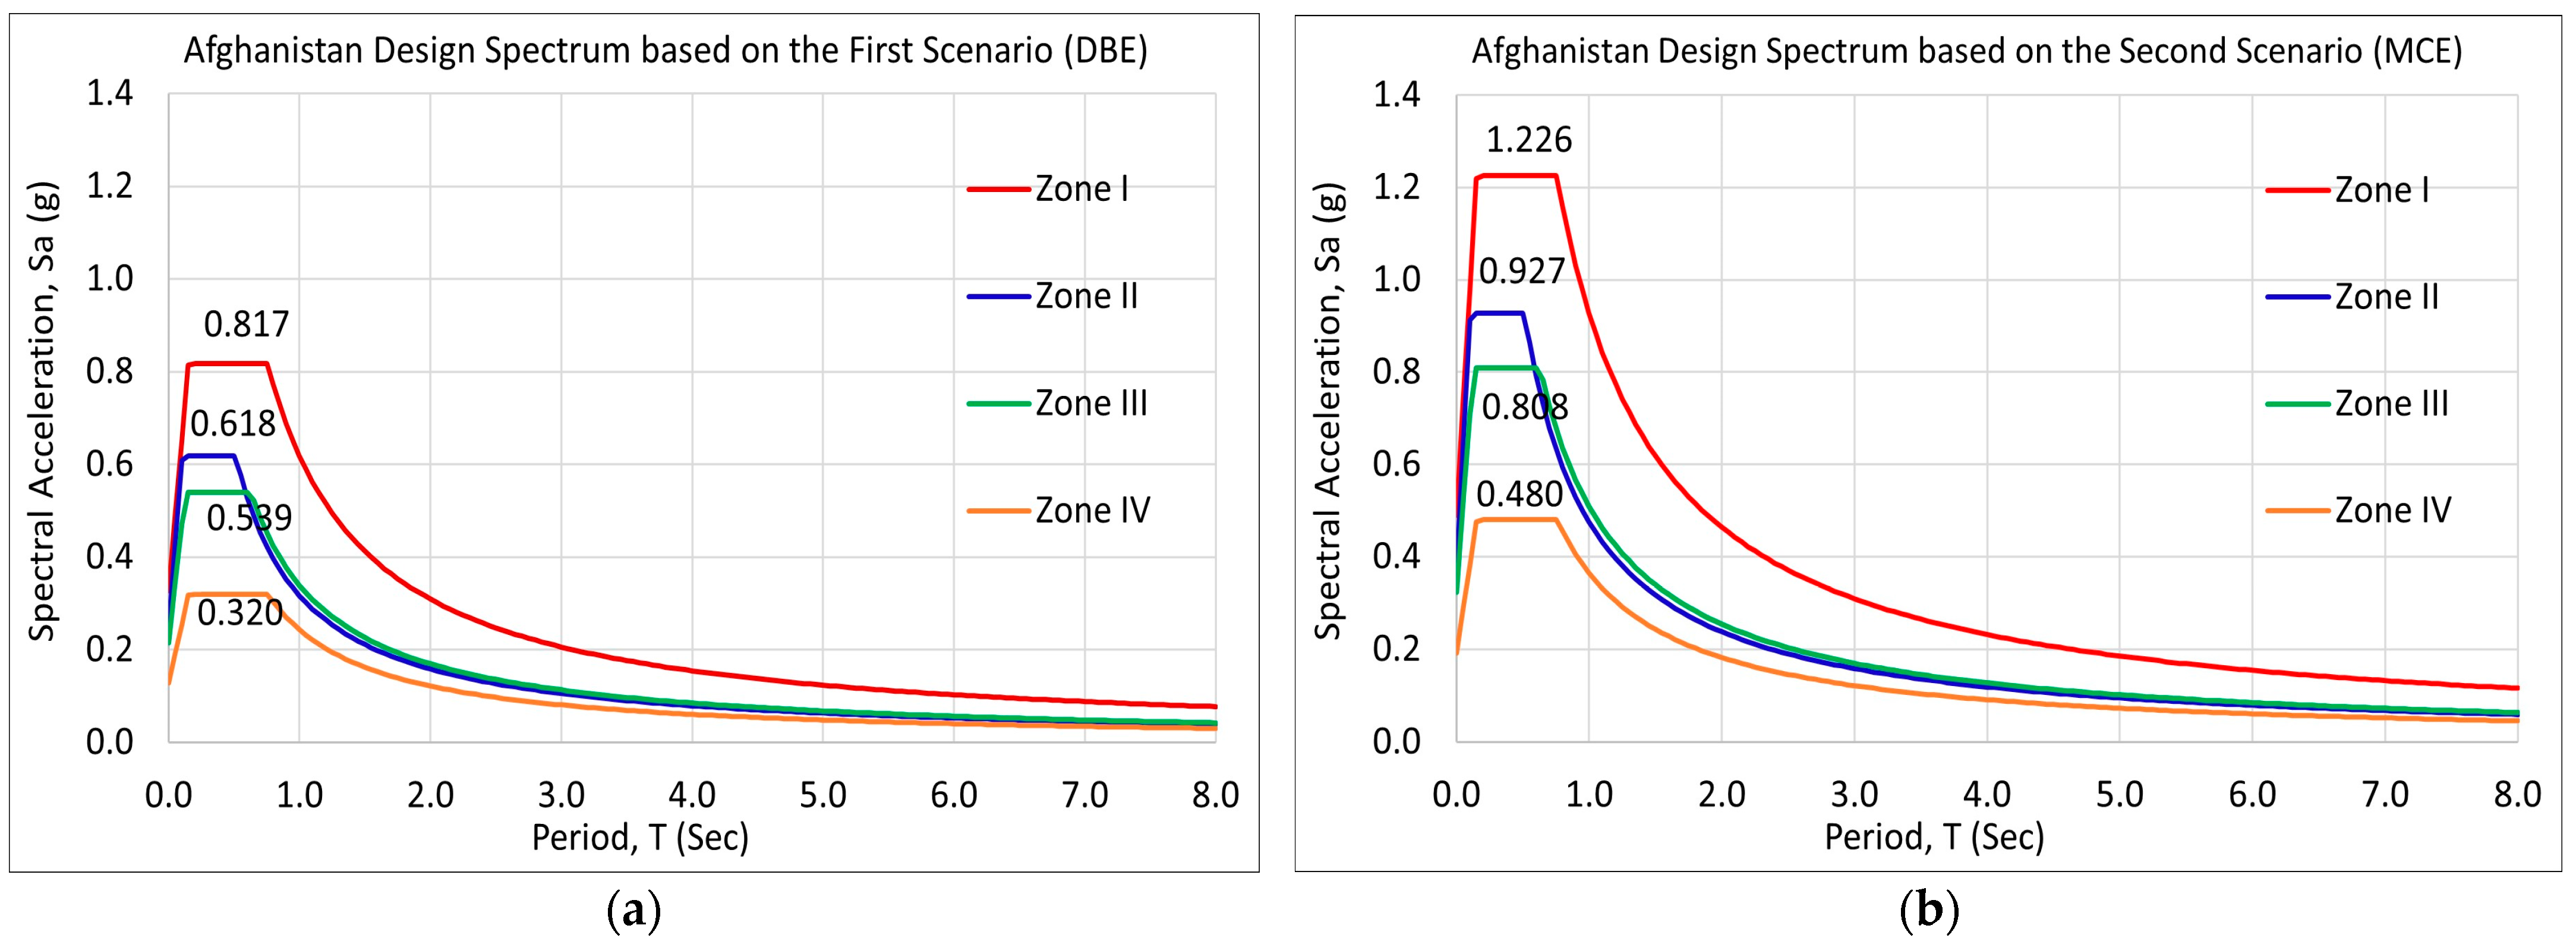
3.2. Design Response Spectra of Afghanistan

Based on the Afghan Building Code (ABC) and the USGS report for Afghanistan [34,35], Afghanistan has been divided into four zones (Zone-I, Zone-II, Zone-III, and Zone-IV) to characterize seismic hazards. Based on the ABC code, the school buildings shall be designed for the Design-Based Earthquake (DBE), which is associated with a return period of 475 years (representing a 10% probability of exceedance in 50 years). Also, this study considers the Maximum Considered Earthquake (MCE), which is associated with a return period of 2,475 years (representing a 2% probability of exceedance in 50 years). The DBE and MCE spectrum scaling factors often depend on the code or regulations. The MCE spectral value is assumed to be 1.5 times greater than the DBE values in this study. According to the procedure outlined in the ABC, the Afghanistan Design Response Spectrum (ADRS) for DBE and MCE has been calculated as illustrated by the four thick-line colors shown in Figure 4. Each of the 34 school buildings constructed over the past three decades is located in a distinct seismic zone, as illustrated in Figure 5.

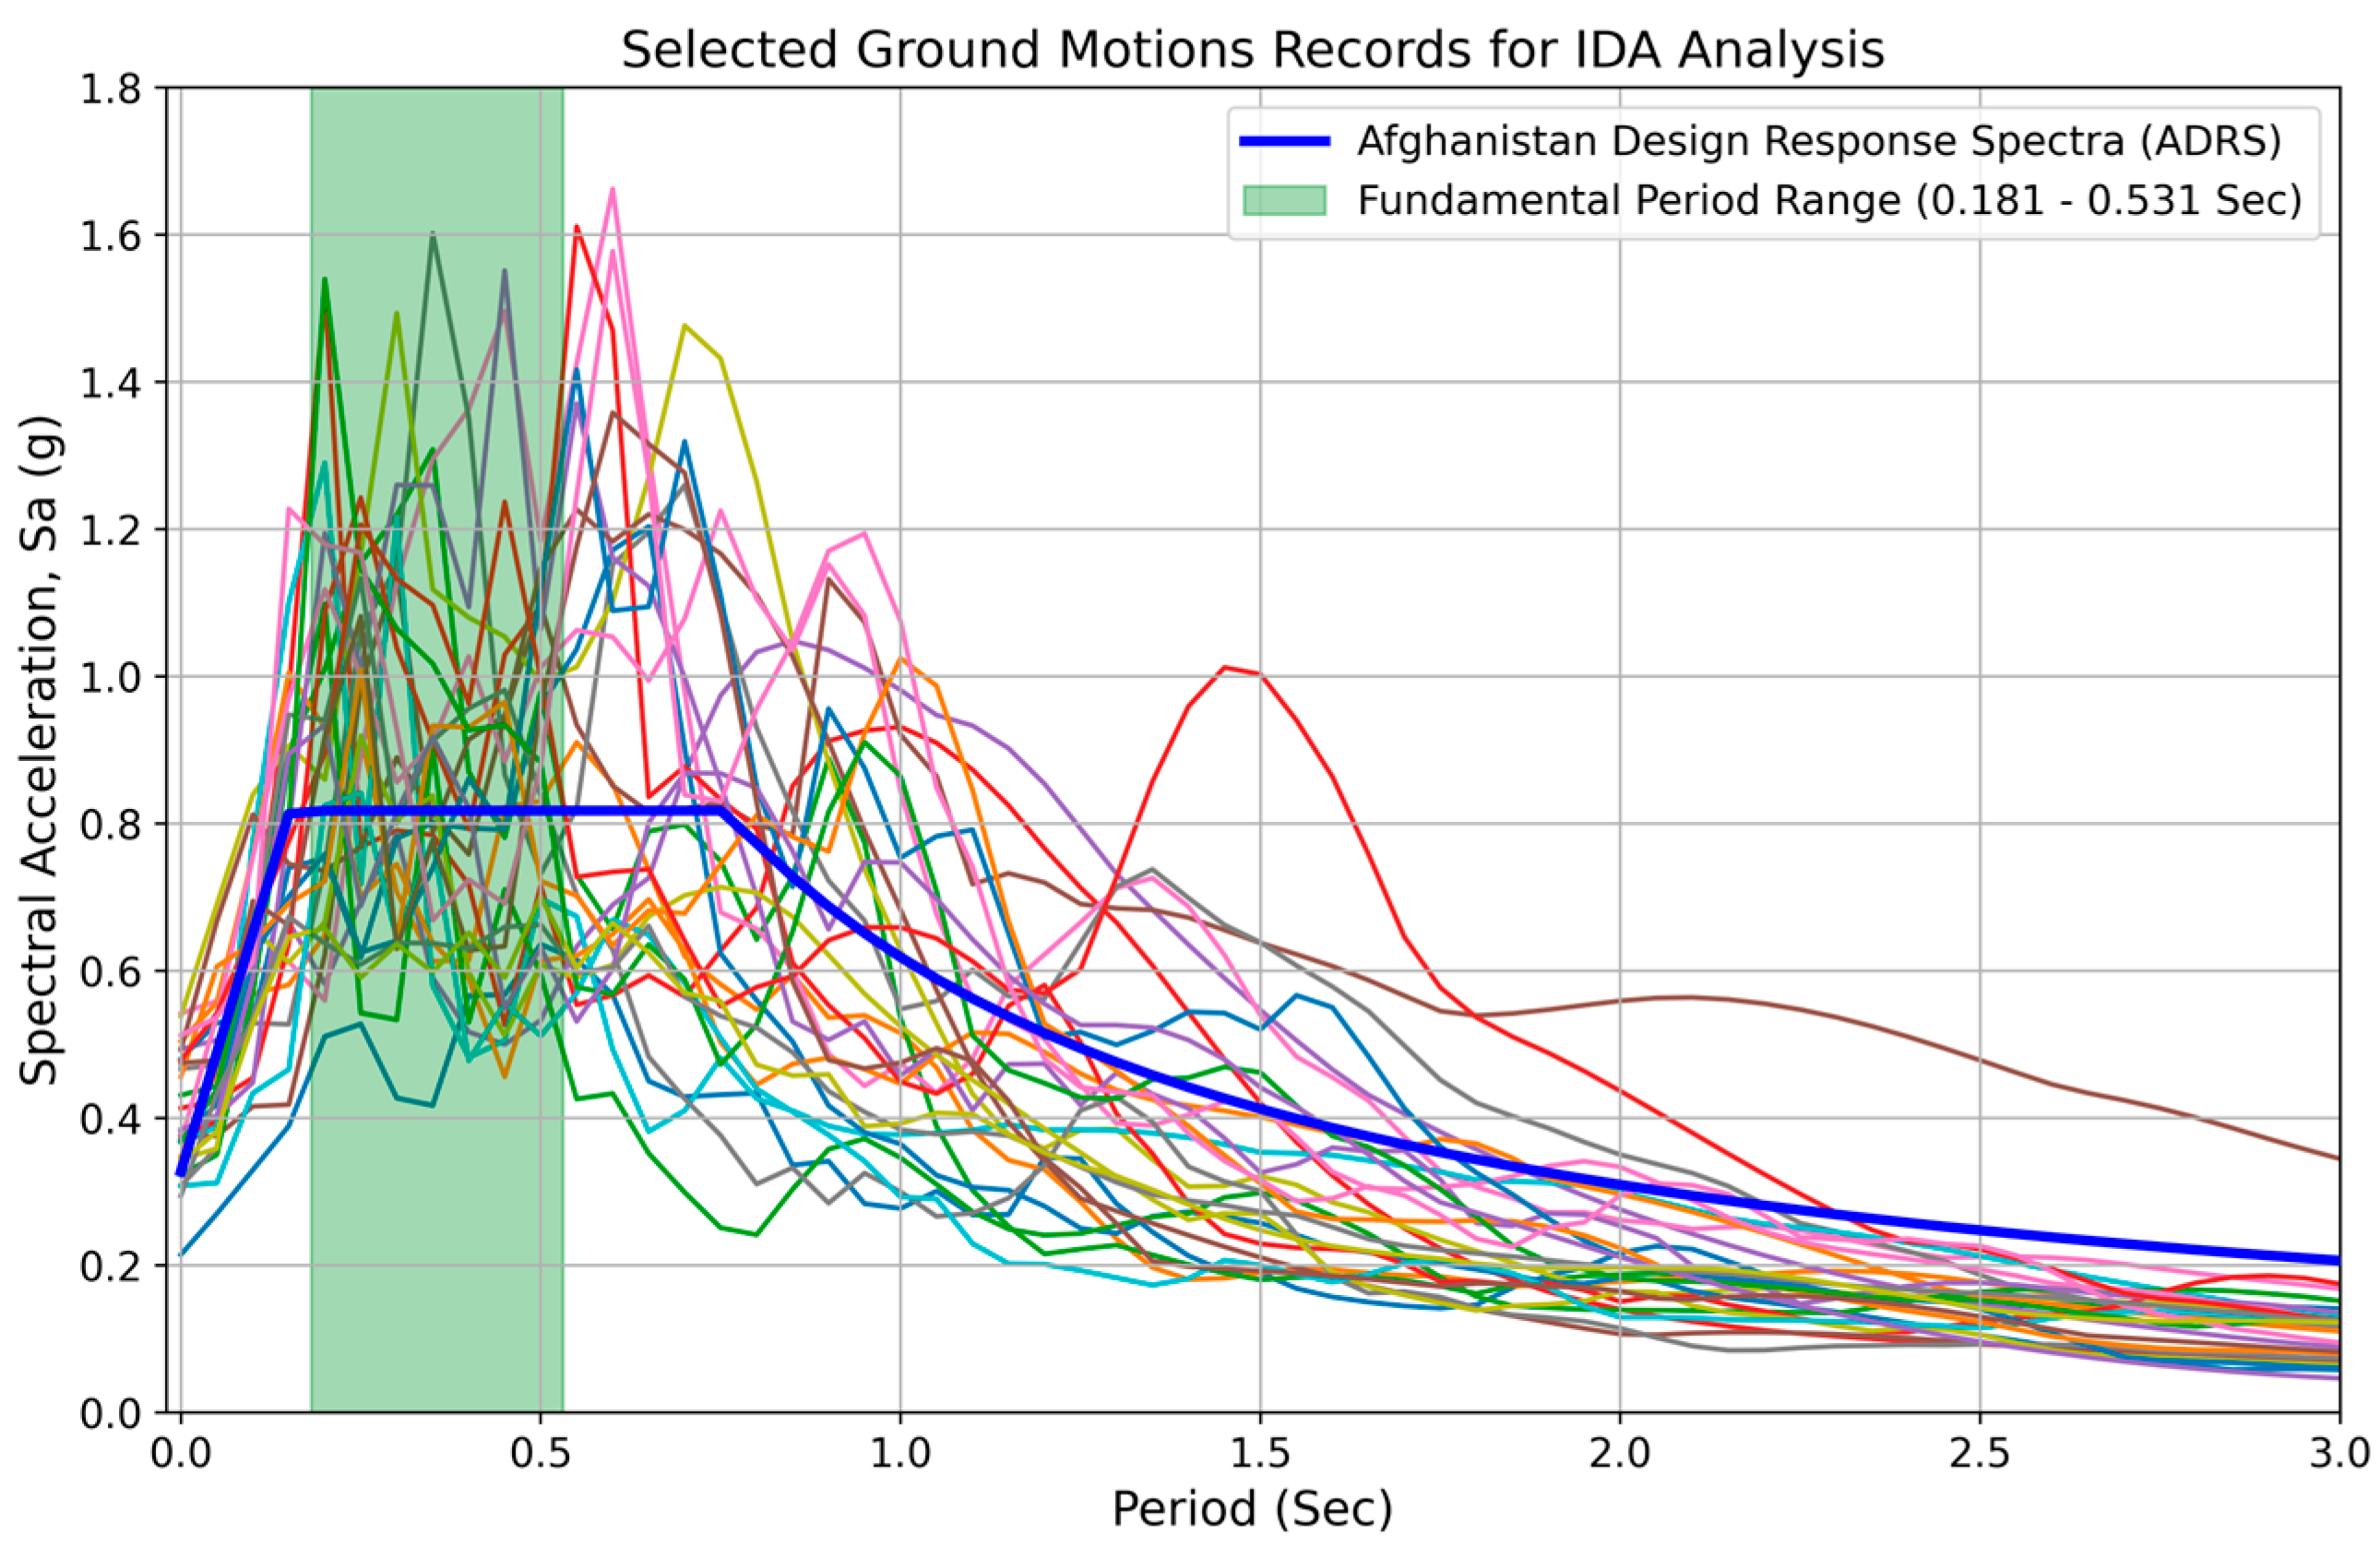
3.3. Input Ground Motions

IDA is a method used to assess the seismic performance of structures by applying ground motion records to a structural model and incrementally increasing the intensity of the motion until the structure reaches its failure point. The minimum number of ground motions that should be considered to obtain the mean non-linear response of the RC structure is seven based on codes Eurocode 8—Part 3, 2004, FEMA-356, ASCE_7_16, 2017 [36,37,38].
In this study, 220 recorded ground motions were downloaded from the Center for Engineering Strong Motion Data by the USGS and the California Geological Survey [39], satisfying the following criteria: a maximum acceleration ranging from 0.3 g to 0.617 g, an earthquake magnitude between 5.8 and 8-moment magnitude (Mw), and a depth ranging from 10.5 to 142 km. Then, 24 ground motions were selected based on the criteria described below.
  • Spectral Match: the Mean Squared Error (MSE) has been employed to ensure a precise spectral match between the selected earthquake ground motions and the Afghanistan Design Response Spectra (ADRS) criteria. The MSE is calculated using the following formula:
    M S E = 1 N i = 1 N ( S F 1 S a r e c S a t a r g e t ) 2
    where S F 1 is the scaling factor in obtaining the minimum MSE for the evaluated record, S a r e c is the unscaled response spectrum of the evaluated record, and S a t a r g e t is the target response spectrum.
  • Variability in Records: Embracing the inherent variability in seismic events, the collection of ground motions comprises records from various earthquakes, including different magnitudes, fault mechanisms, and distances from the source. This diversity ensures that the dataset reflects the unpredictability and range of forces that could impact structures.
  • Depth: The epicentral depth affects the ground motion’s characteristics, including its frequency content and attenuation properties. Choosing ground motions from earthquakes with a range of depths allows for a more comprehensive assessment of potential seismic impacts. The highest earthquake depth recorded in Afghanistan was approximately 210 km below the Hindu Kush in Northeastern Afghanistan, on 26 October 2015 [39].
  • Moment Magnitude: The magnitude of an earthquake is directly related to the energy released by the event and influences the seismic waves’ amplitude, frequency content, and duration. The 2015 Hindu Kush earthquake in Afghanistan had a moment magnitude (Mw) of 7.5 [1].
  • Adequate Suite of ground motions: A total of 24 distinct records were chosen. This number of records is considered sufficient to provide an accurate assessment of the seismic performance of the RC school structure.
Figure 6 shows the acceleration response spectrum of the selected ground motions with a damping factor (h) of 0.05. The green highlighted color shows the range of fundamental periods for RC school buildings, from 0.181 s to 0.531 s. Table 5 shows the list of 24 selected earthquake ground motions.

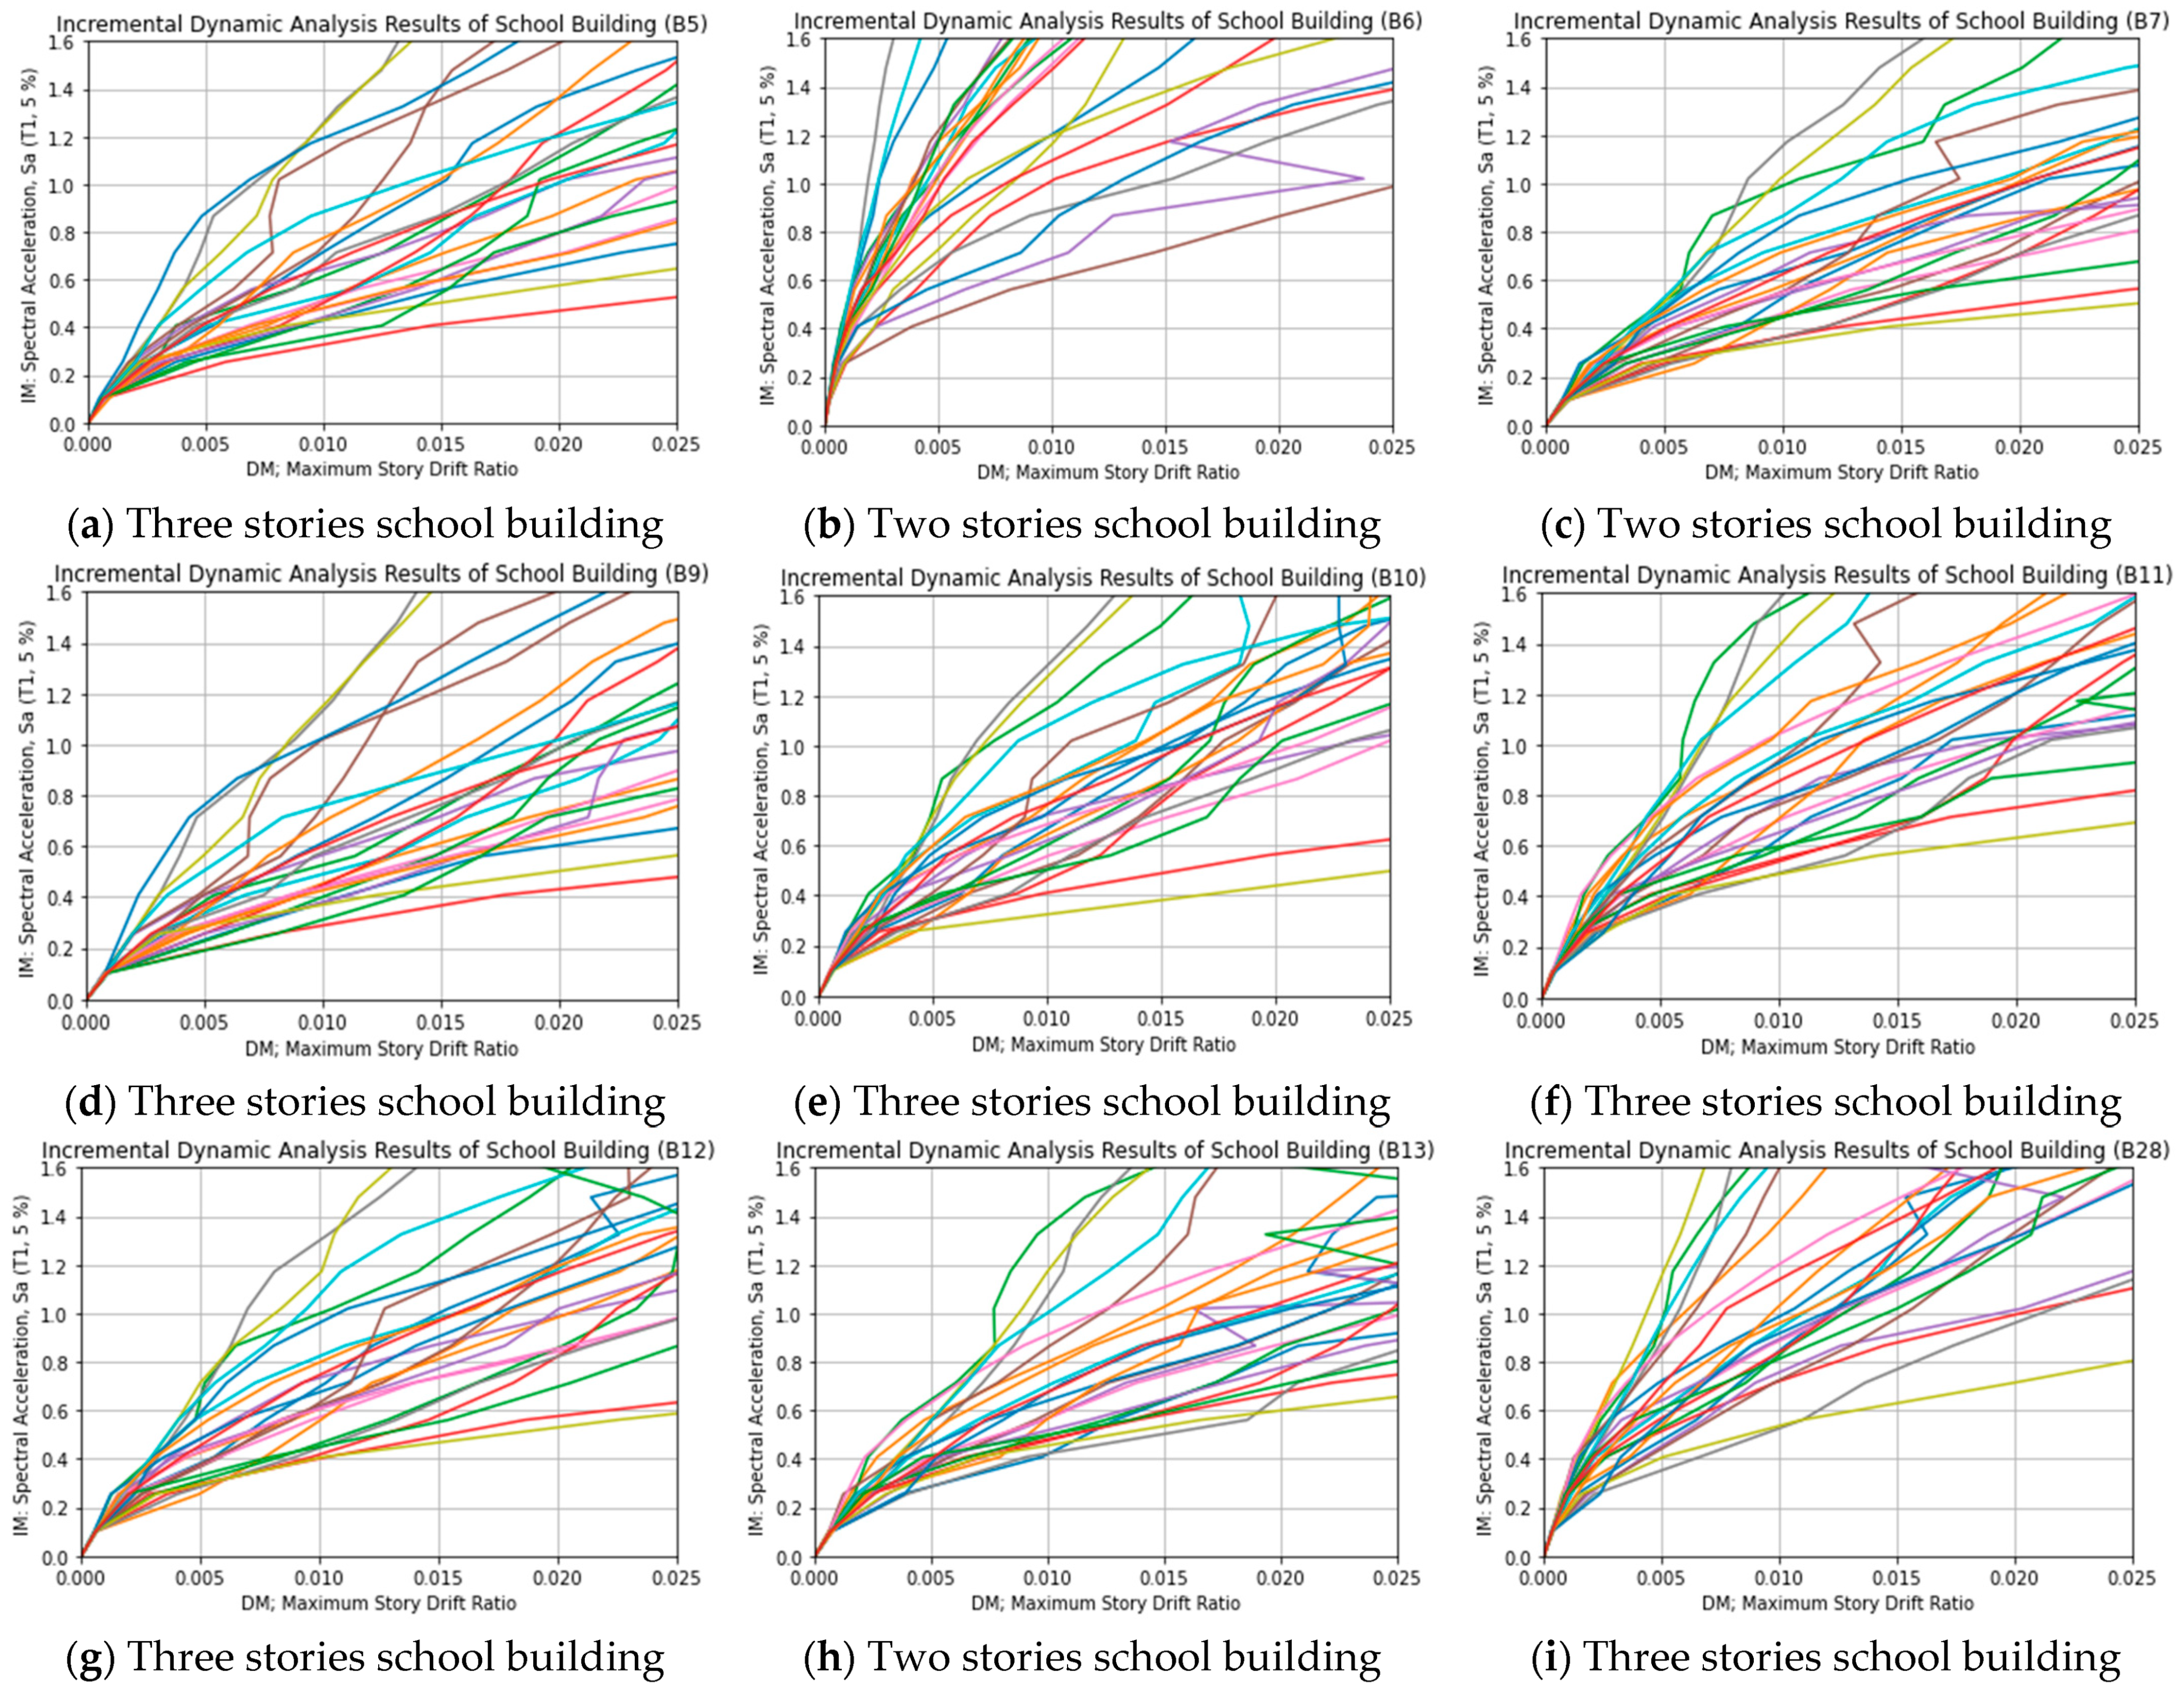
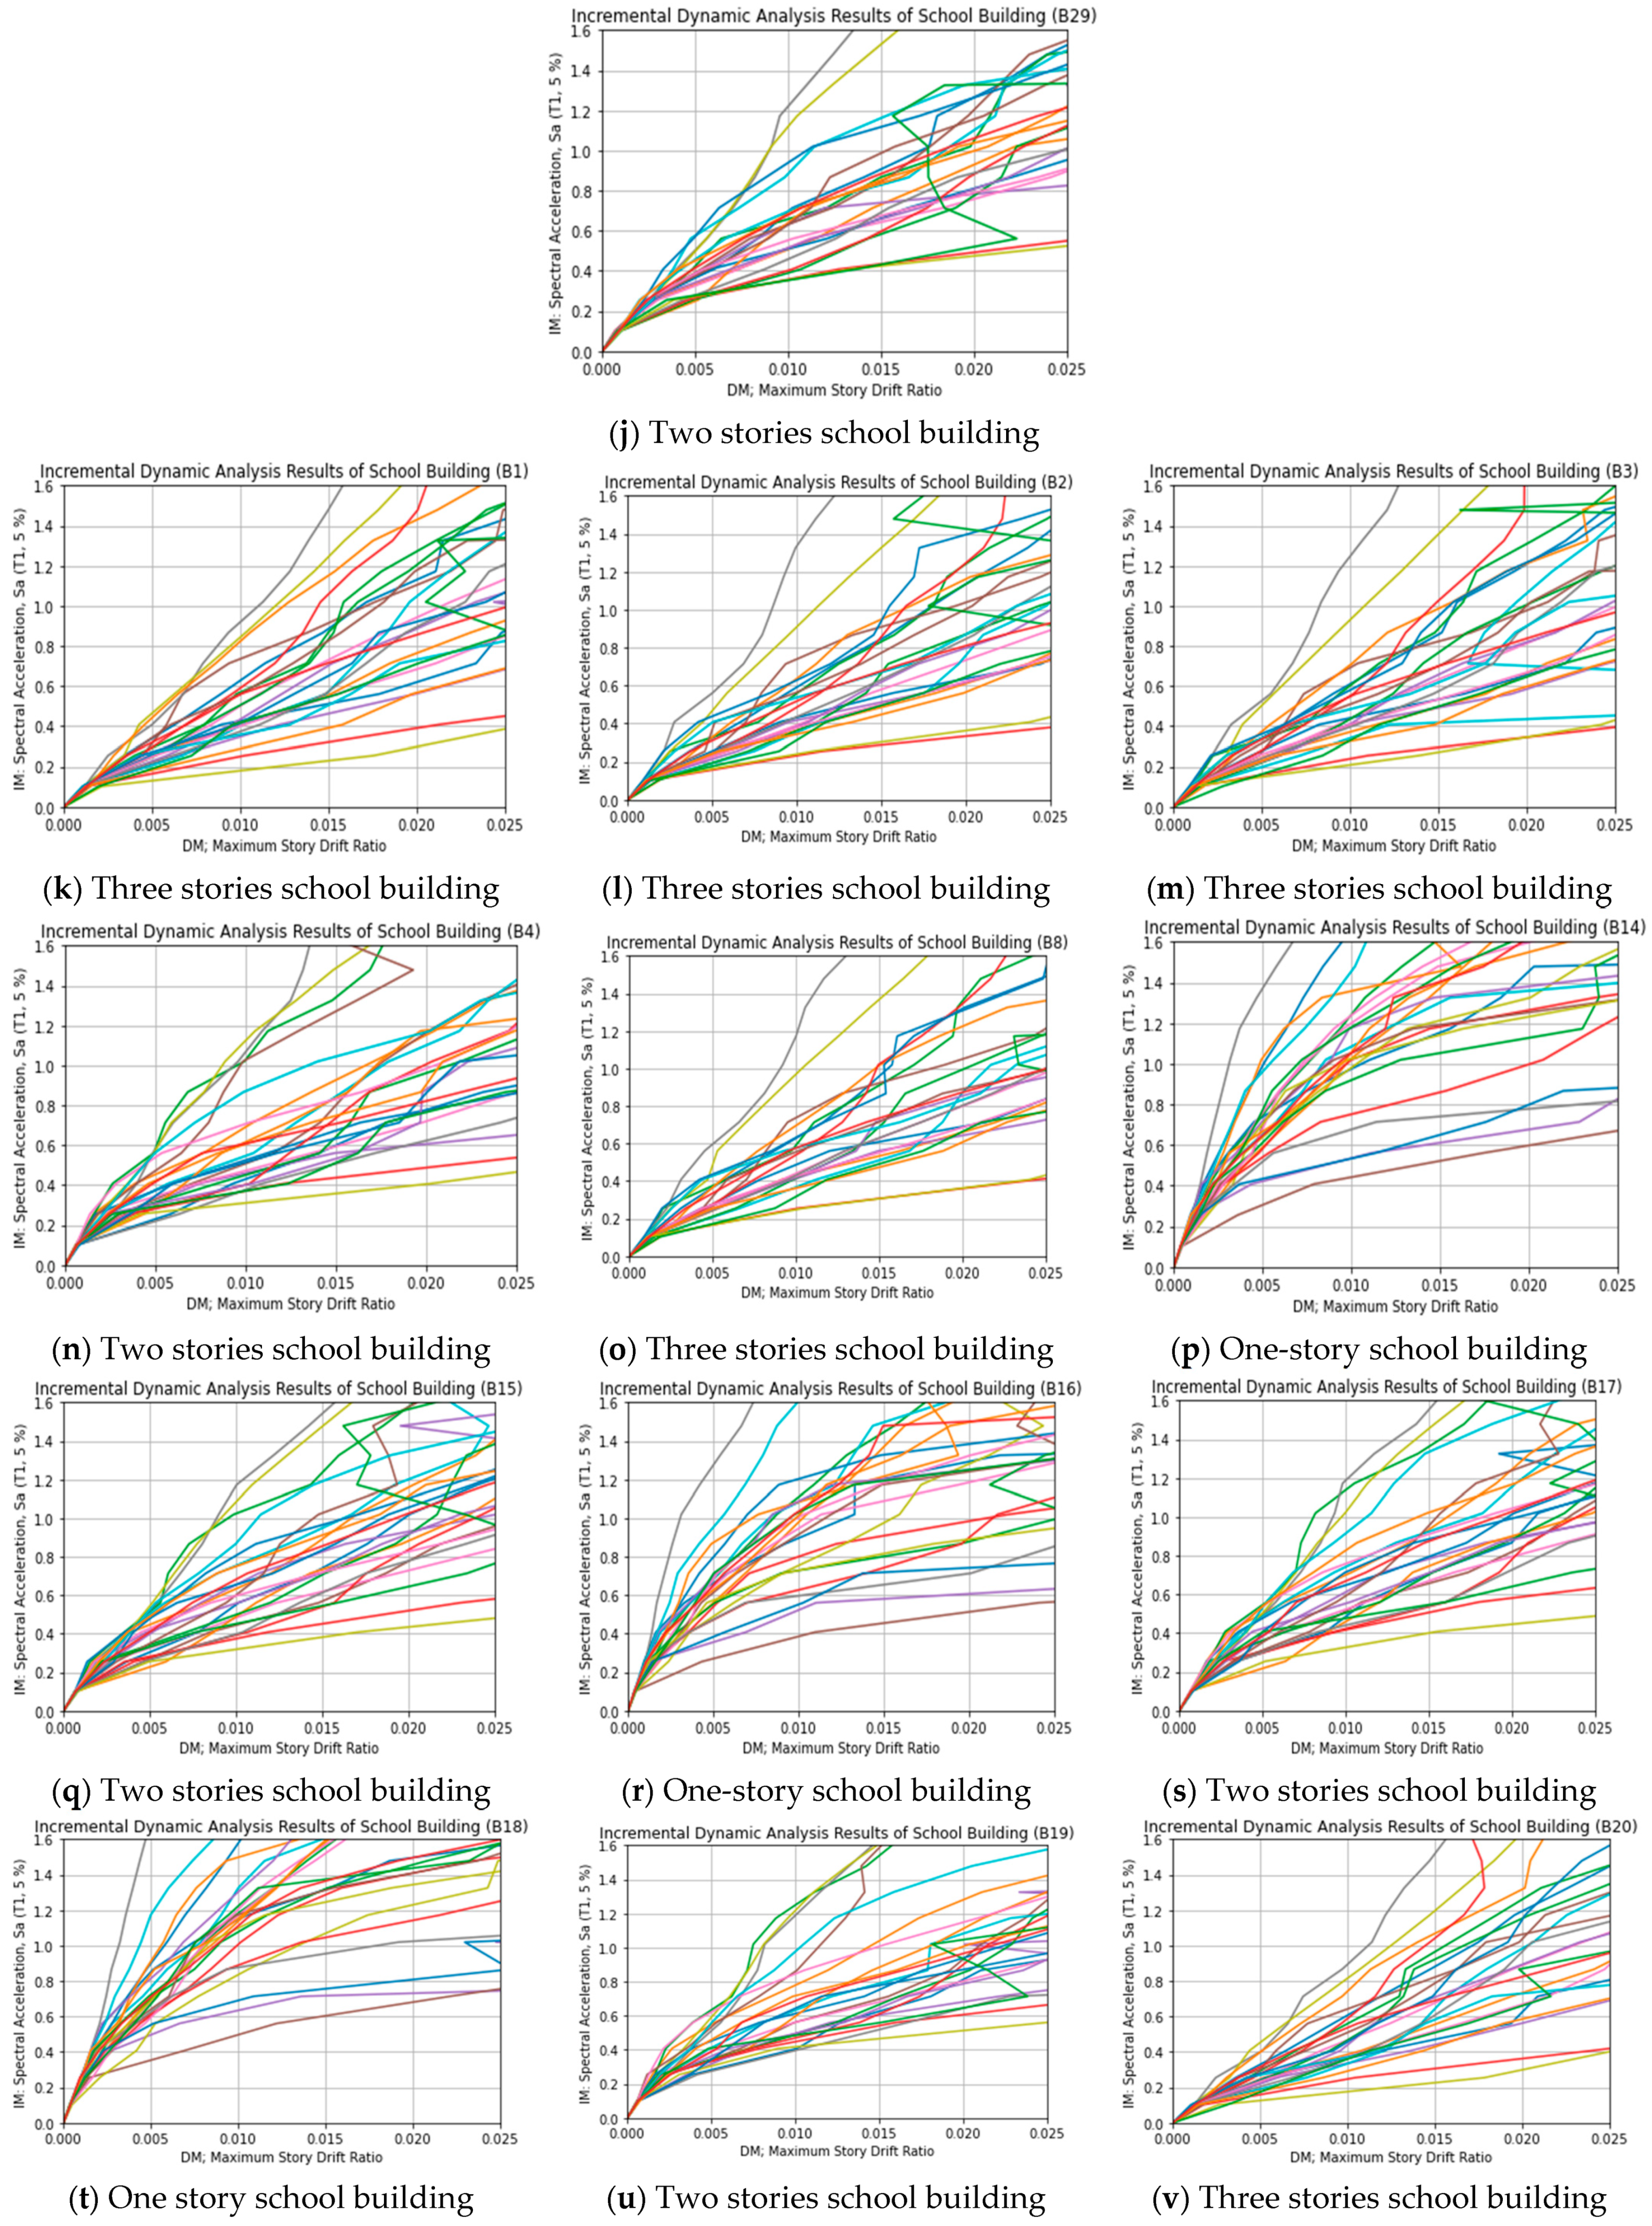
3.4. Incremental Dynamic Analysis

The IDA was conducted to evaluate the seismic performance of 34 RC school buildings in various regions of Afghanistan. This analysis involves subjecting a numerical model of the building to a suite of ground motion records, each scaled to a series of increasing intensity levels. The spectral acceleration at the building’s first natural period, denoted as Sa ( T 1 ), is selected as the IM. The intensity of the ground motion records, Sa ( T 1 ), was incrementally increased from a base level of 0.4 g to an upper threshold of 4.0 g, with (g) representing the acceleration due to gravity (9.8 m/s2). The maximum inter-story drift ratio was selected as the DM of RC buildings. The DMs of 34 school buildings are calculated for 24 ground motion records by incrementing the IM with steps of 0.05g. In total, 192,00 analyses were carried out.
The non-linear frame analysis program STERA 3D [23] was used to perform IDA. The analysis was performed using STEERA 3D, specifically version 11.2, which is an advanced non-linear three-dimensional frame analysis software suitable for various structural types including steel, reinforced concrete, and structures requiring seismic isolation. Structural elements, such as beams and columns, are modeled as line elements with non-linear bending springs at both ends and shear springs in the middle.
Figure 7a–j shows the IDA curves of the A-type (newly constructed) RC school buildings, and Figure 7k–ah shows the IDA curves of the B-type (old) RC school buildings. These curves graphically illustrate the vulnerability of the A-type and B-type RC school buildings when subjected to various levels of earthquakes in different geographical locations.

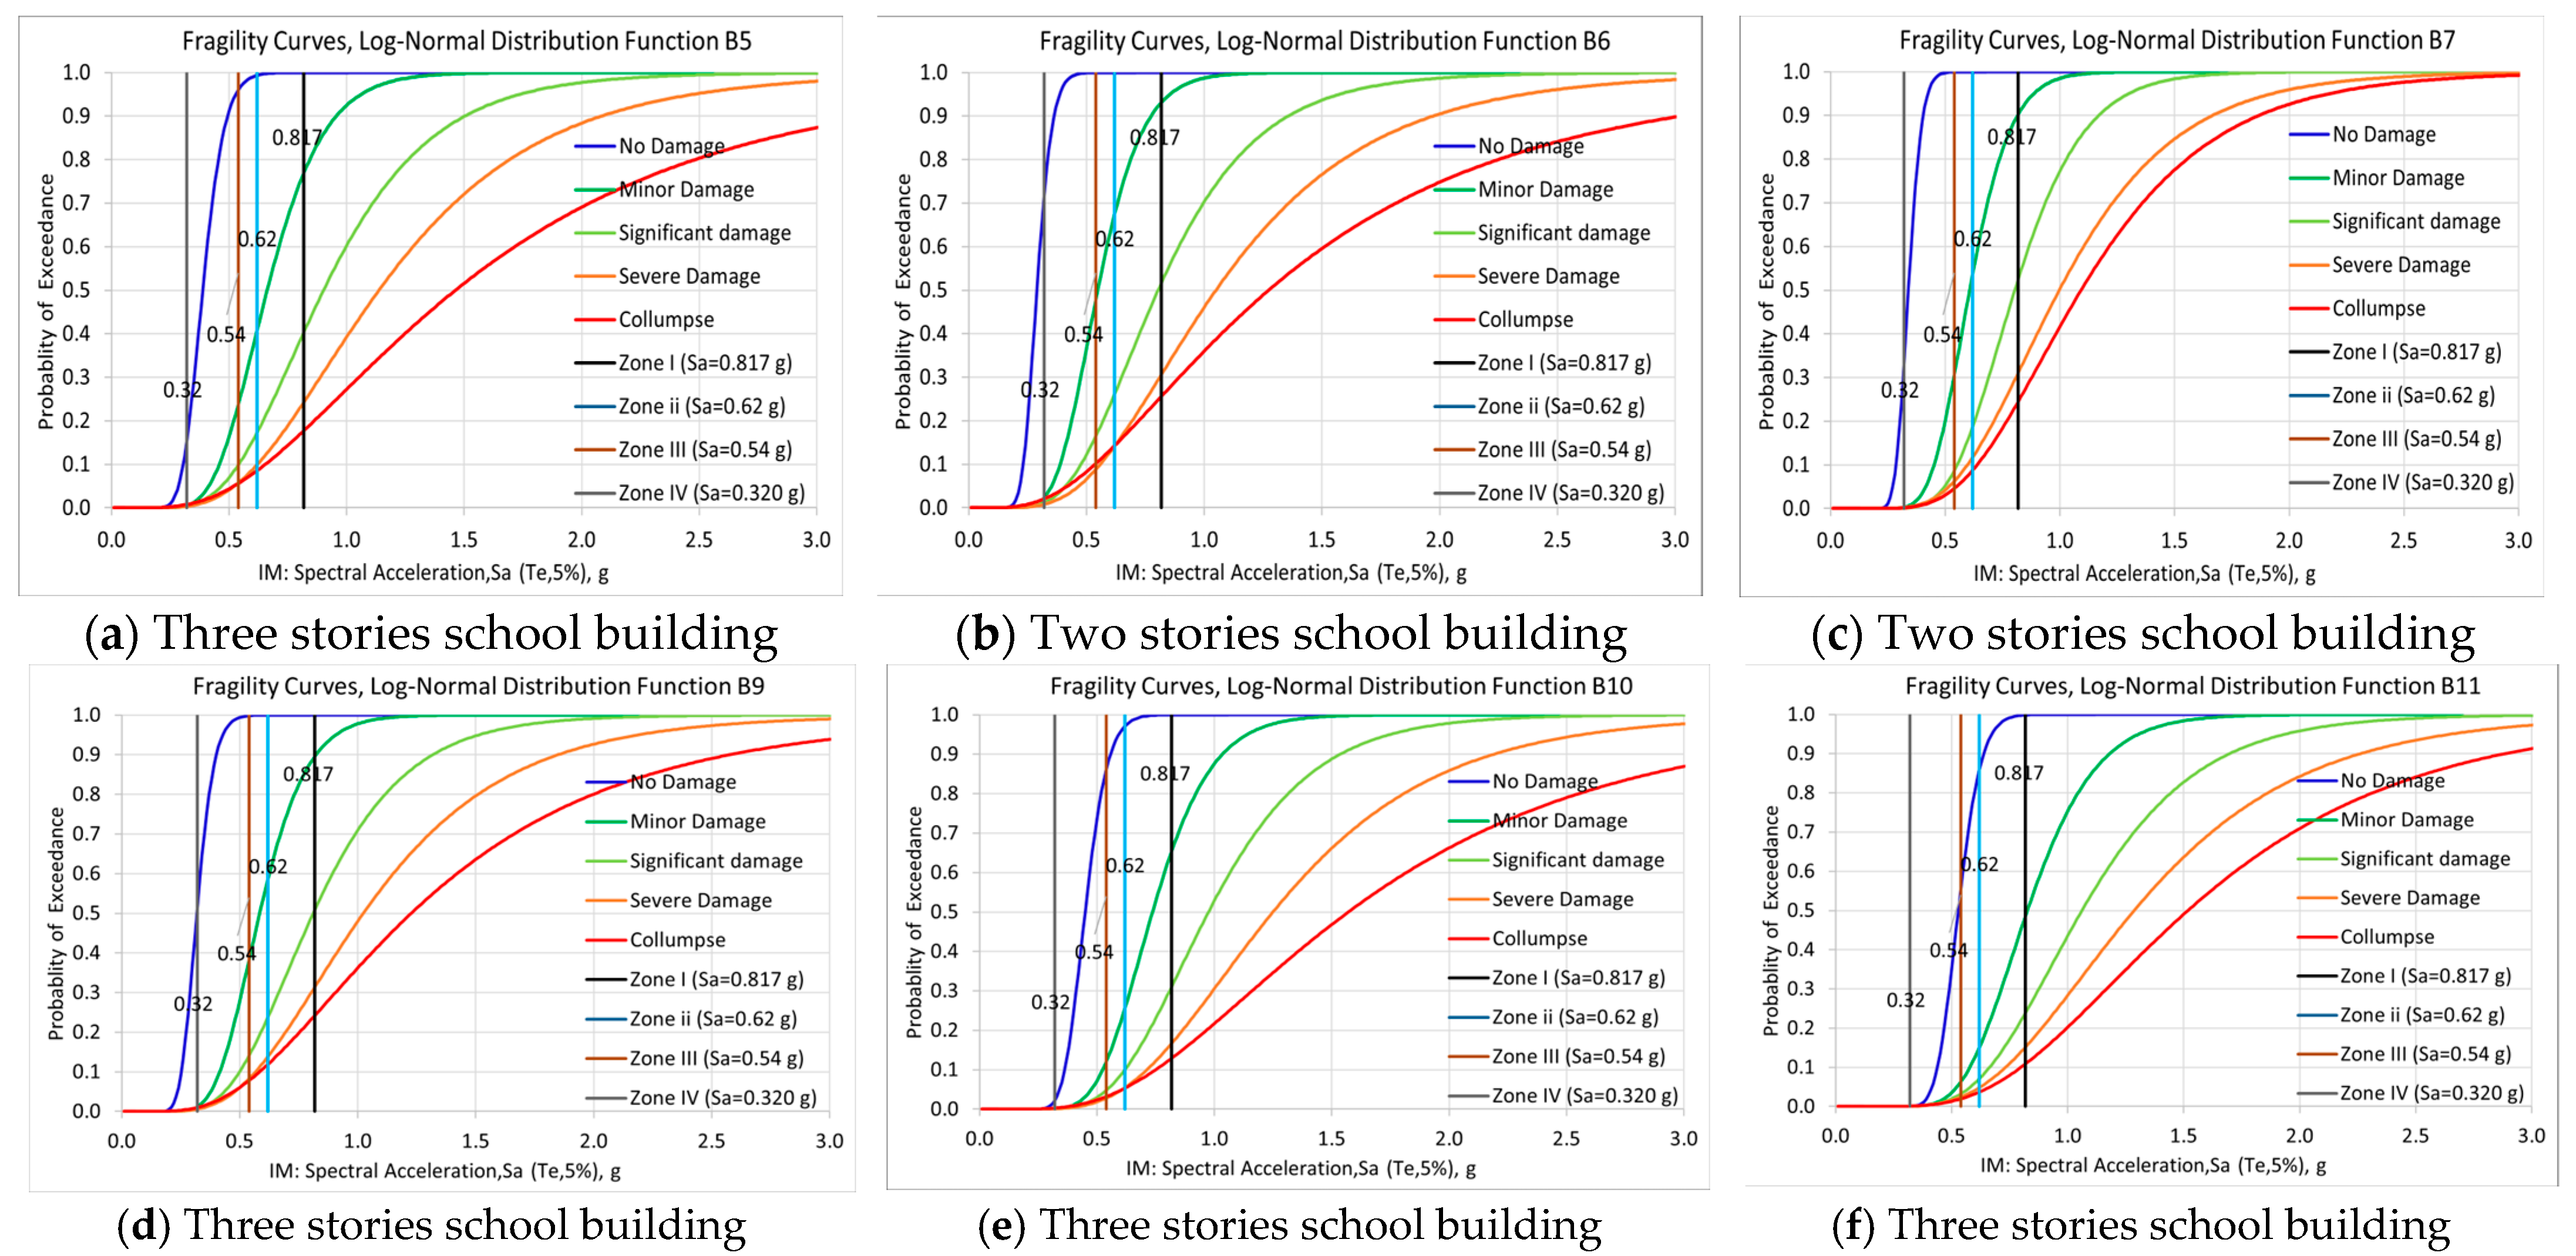
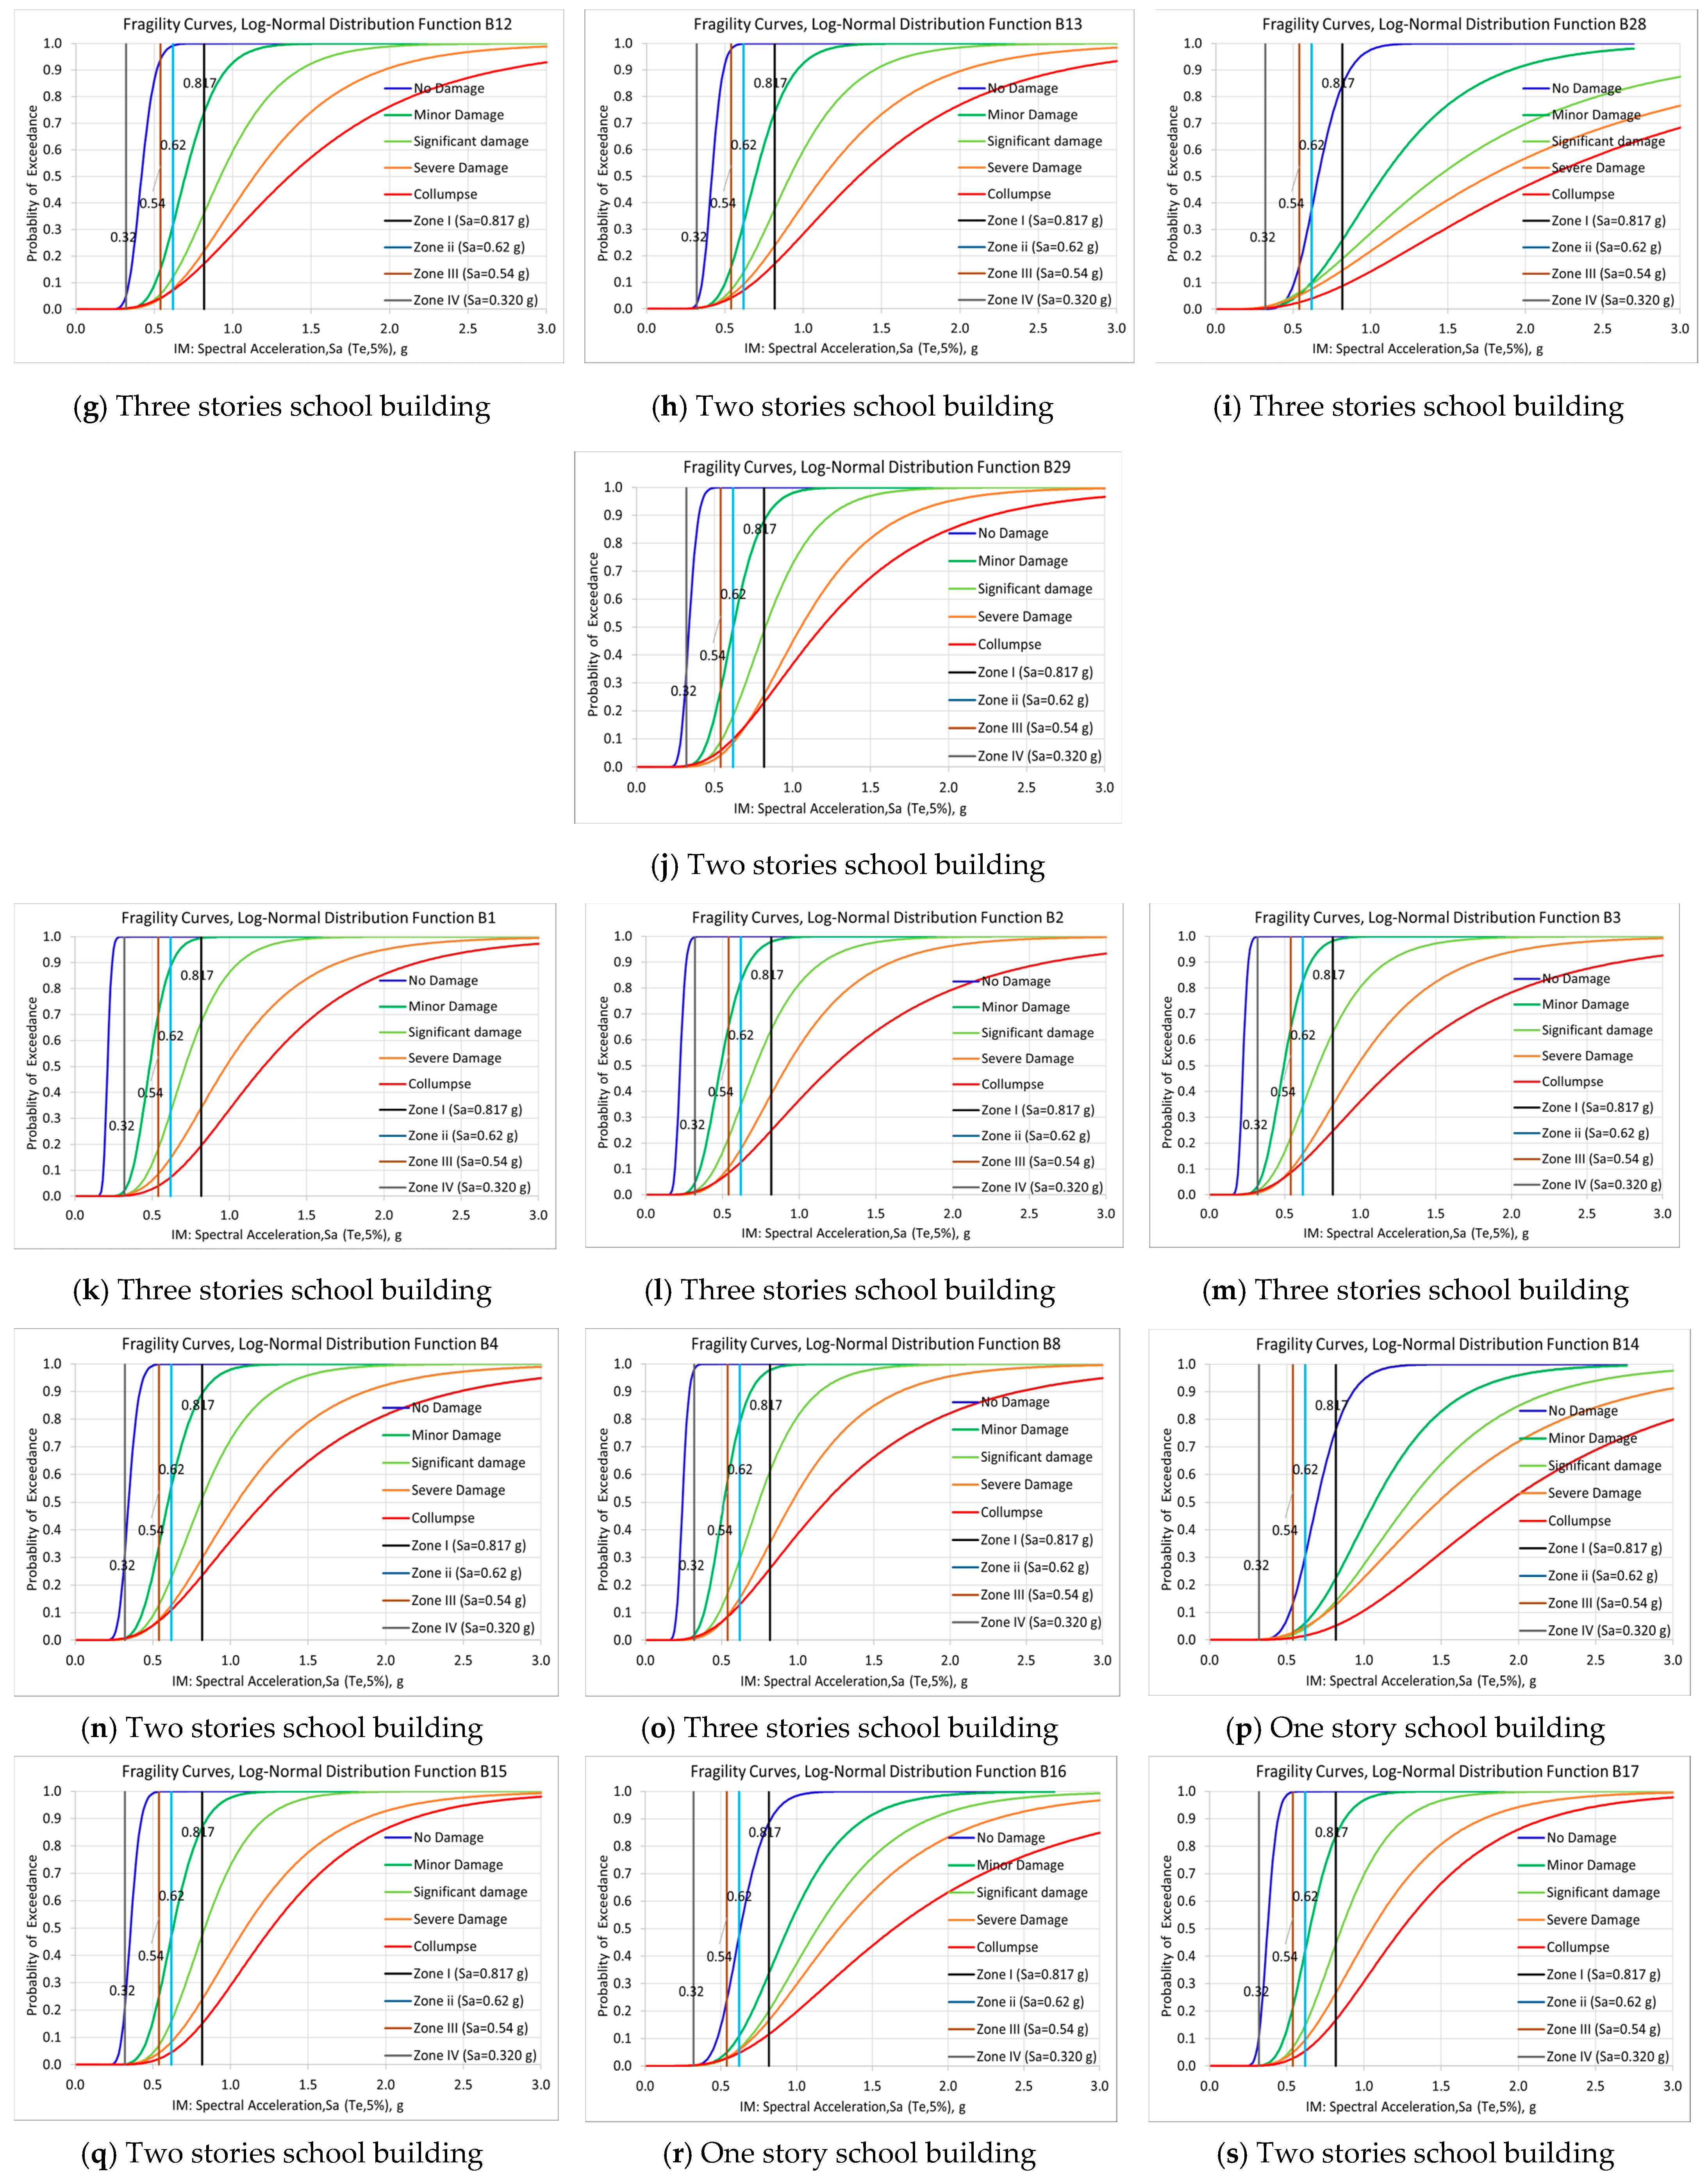
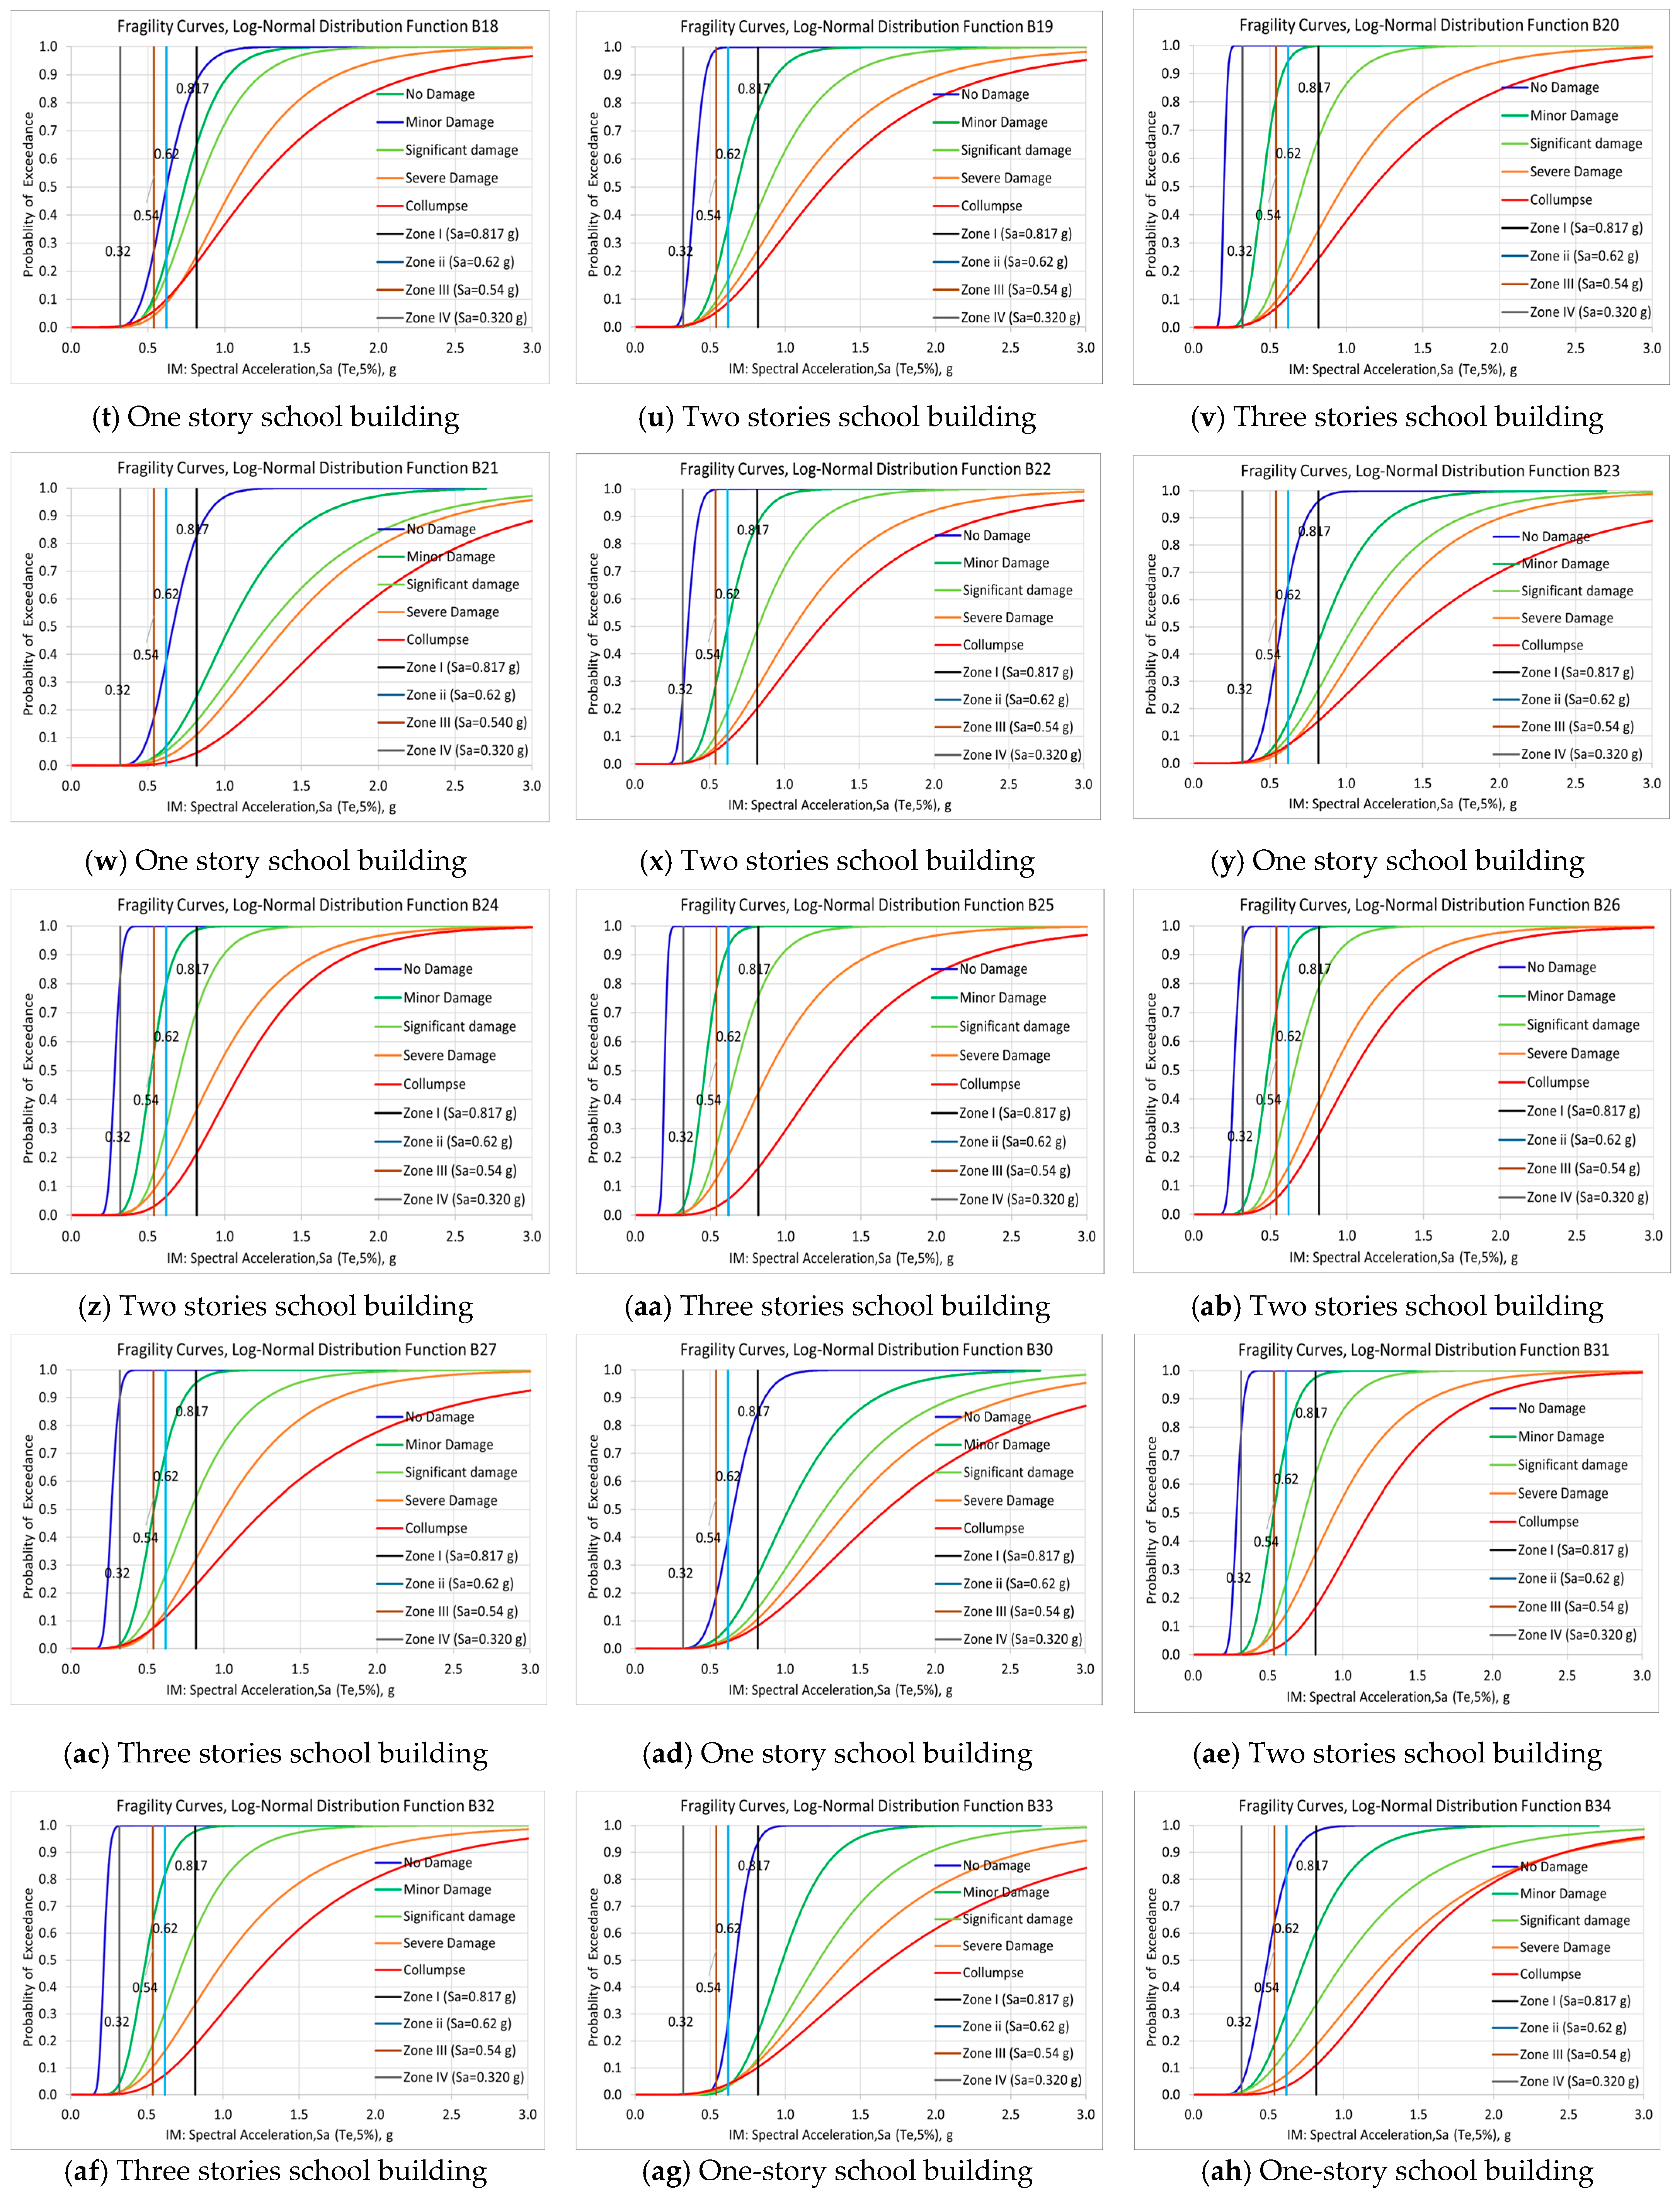
4. Fragility Curve and Damage Probability

4.1. Structural Damage Levels Based on DM

According to the performance-based guidelines provided by the Japan Structural Consultants Association (JSCA) [40], the damage state of RC buildings is categorized into five levels, as shown in Table 6, based on the maximum story drift angle, which is the DM in this study. These selected damage levels serve as critical benchmarks for assessing the structural resilience and capacity of the studied RC school buildings under seismic loading conditions.

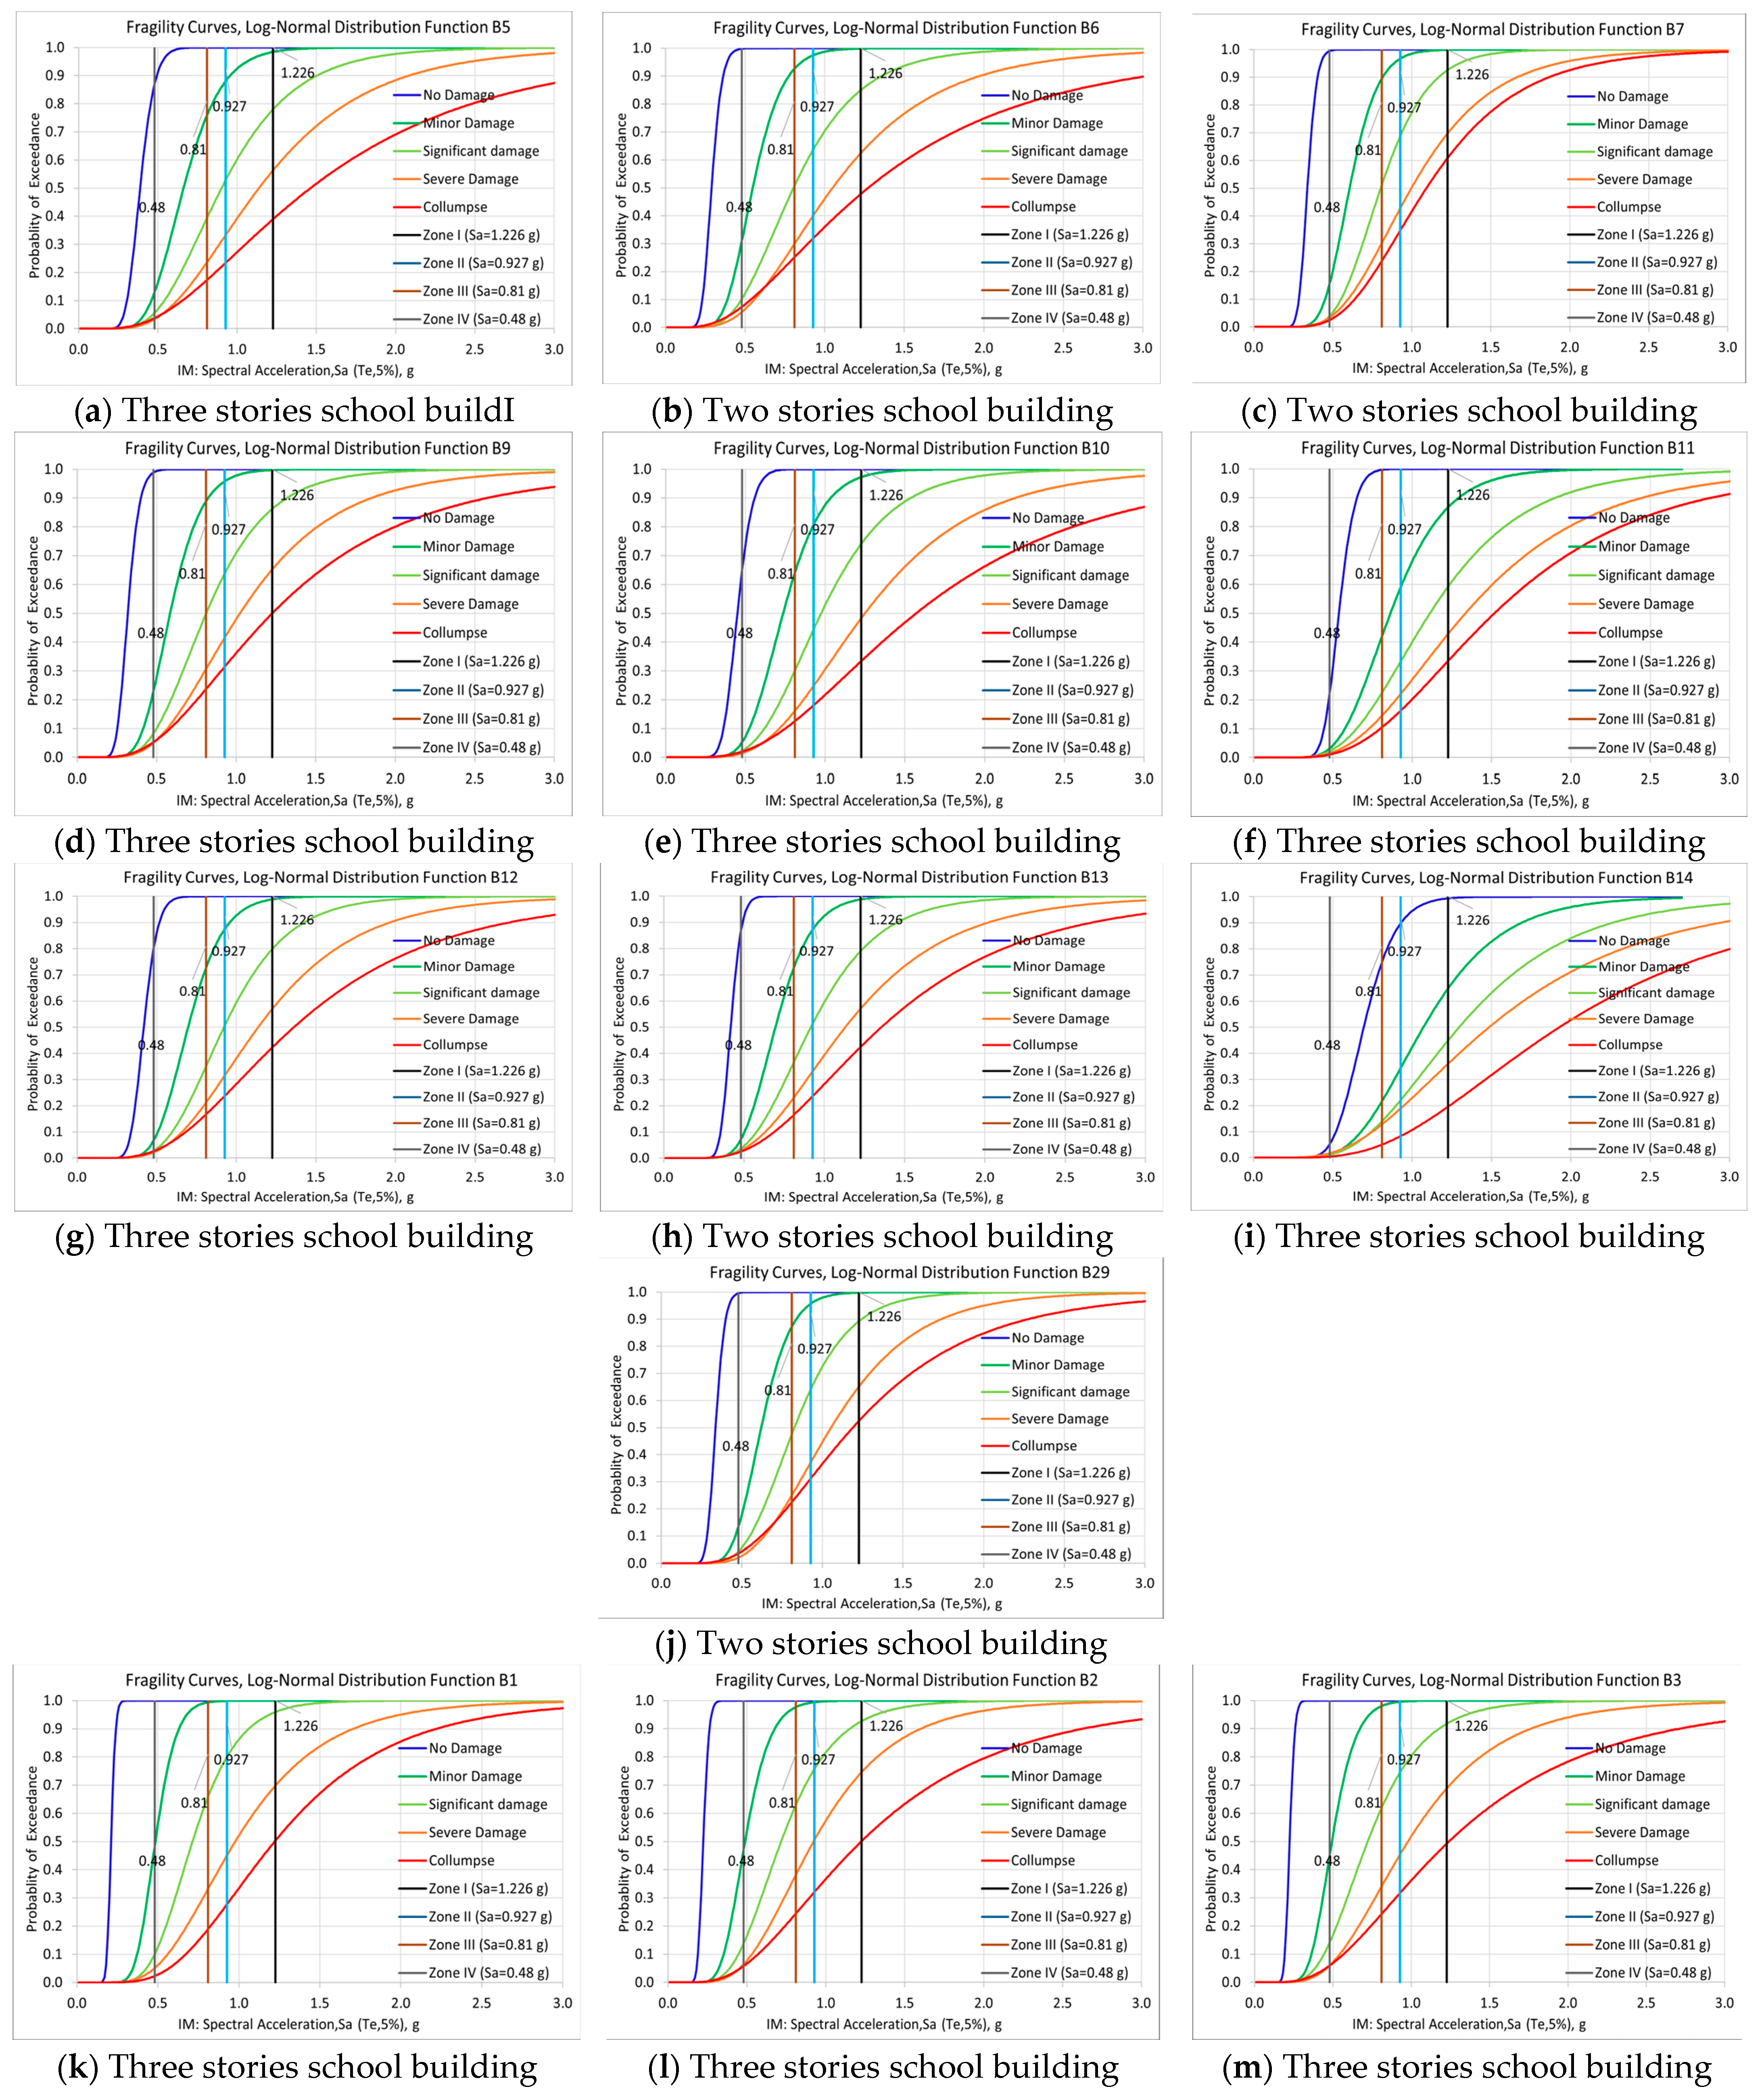
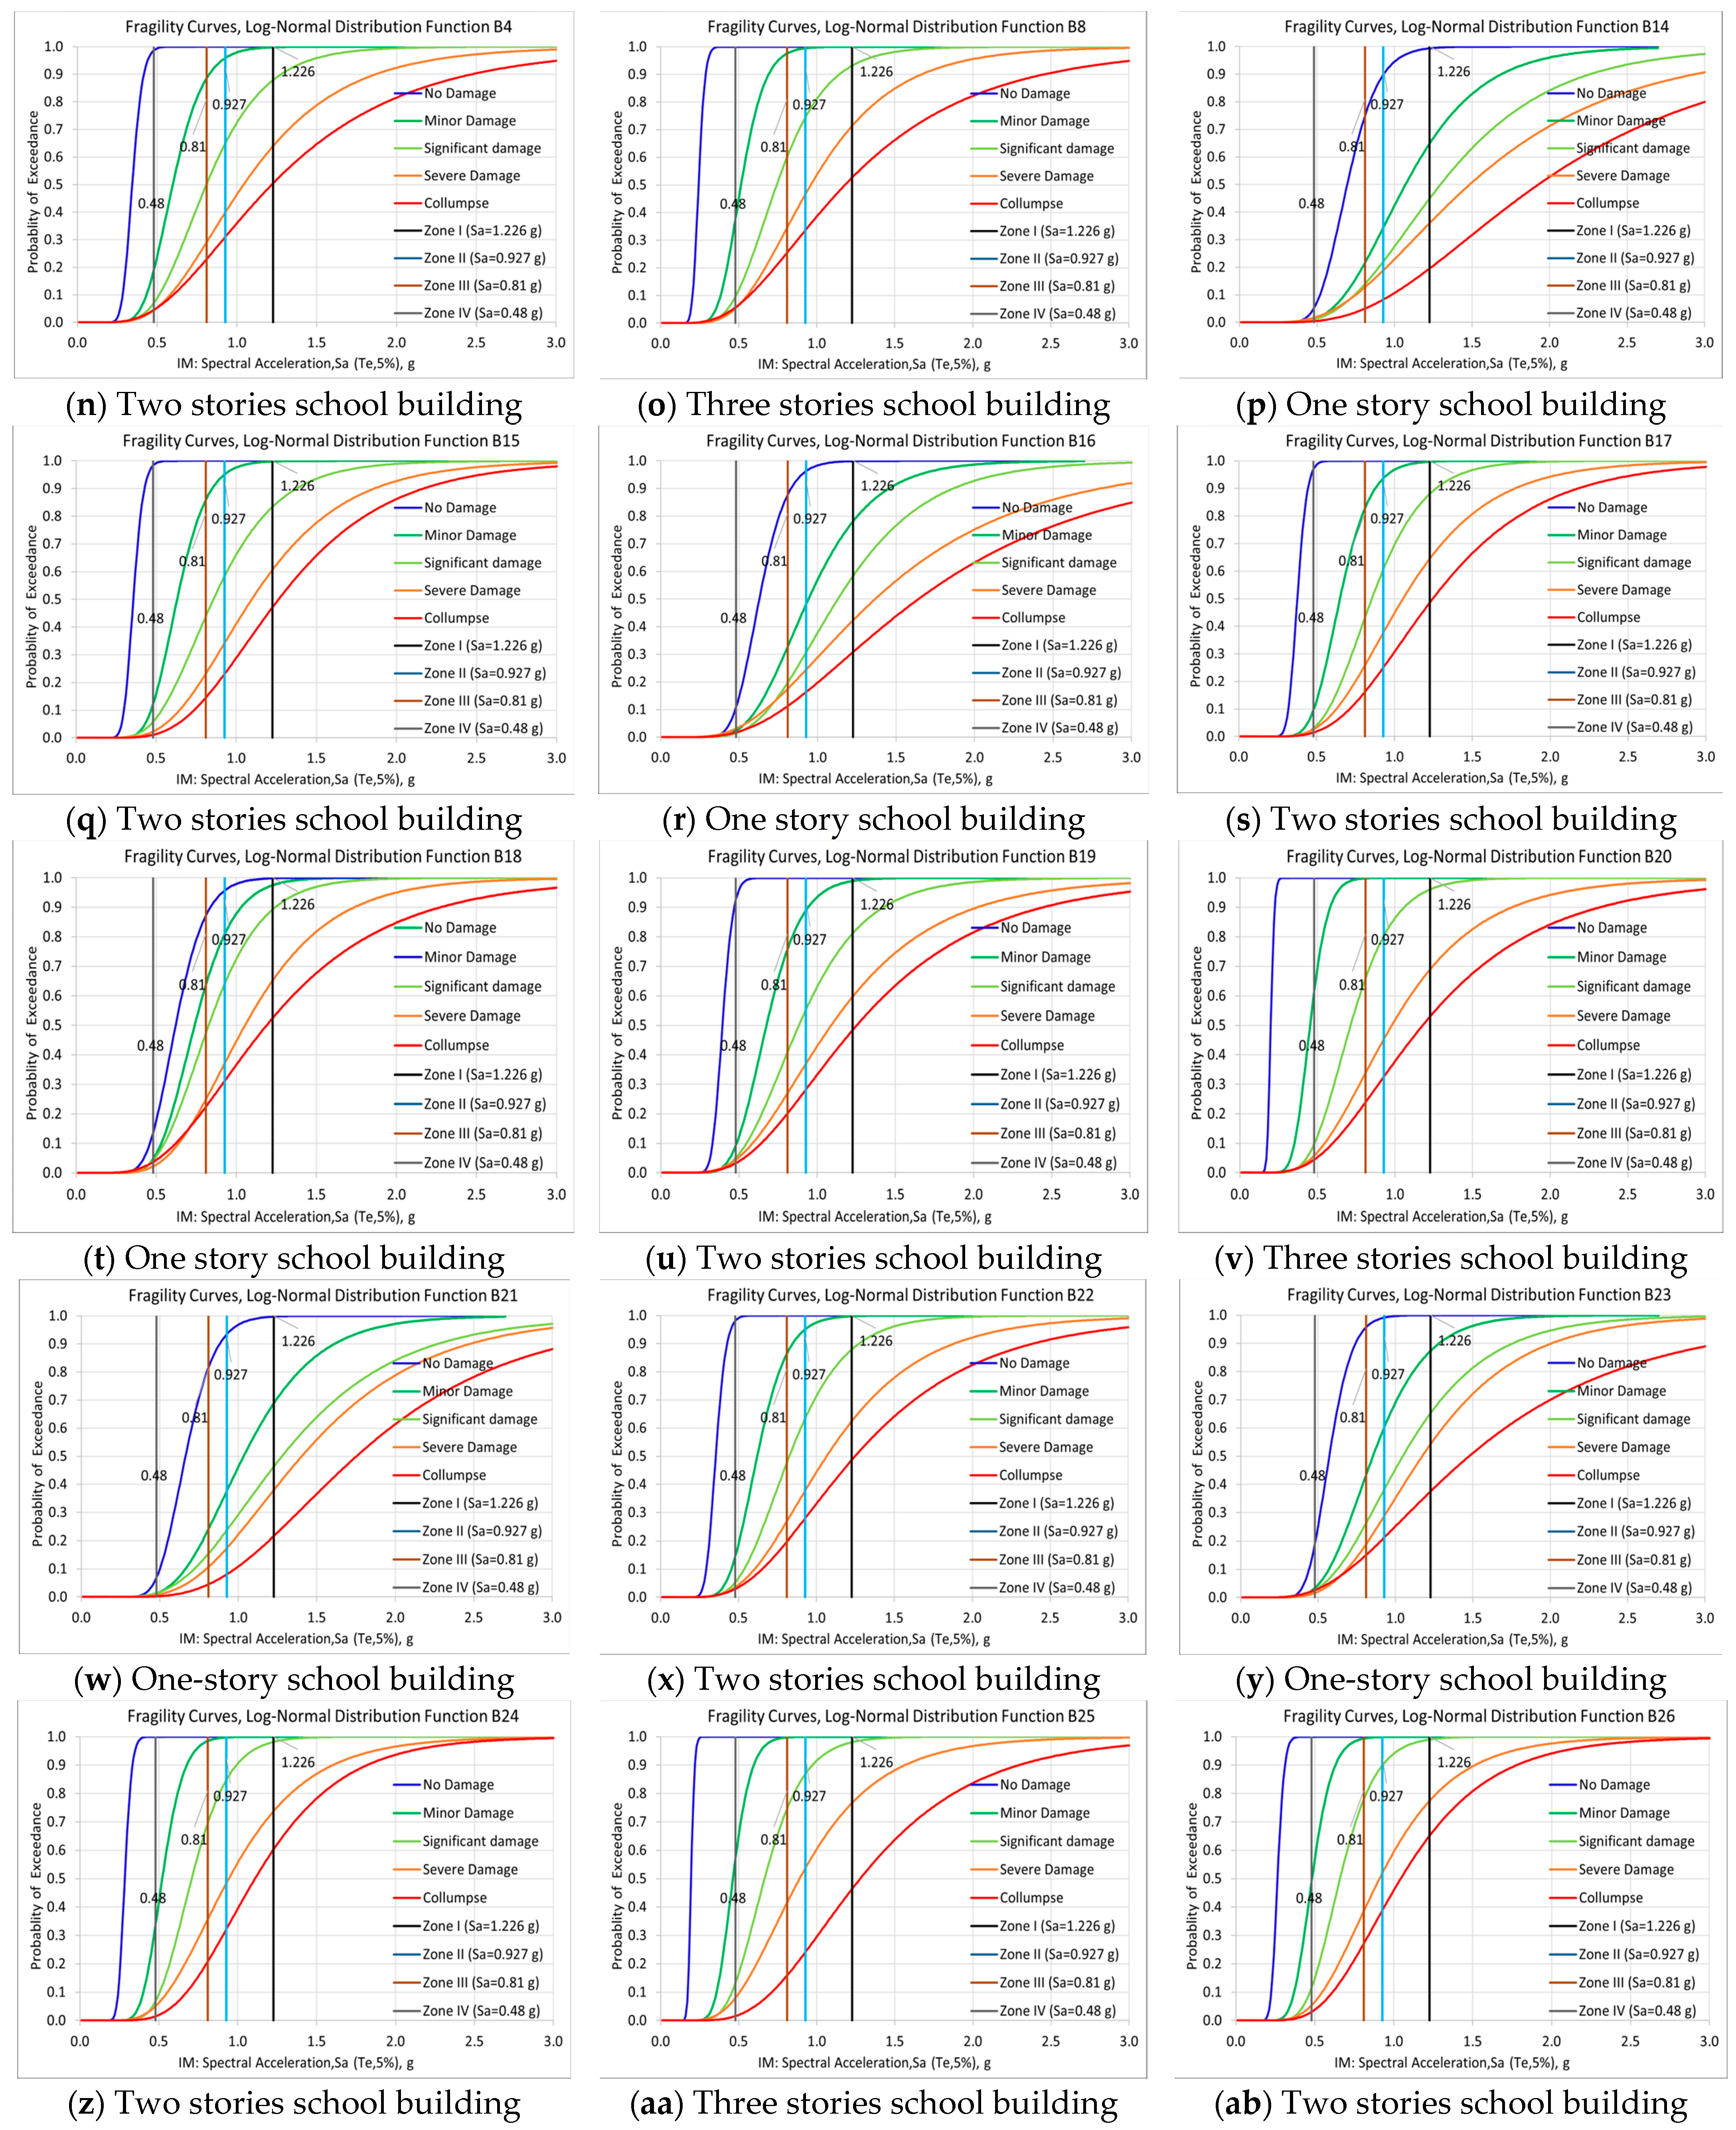
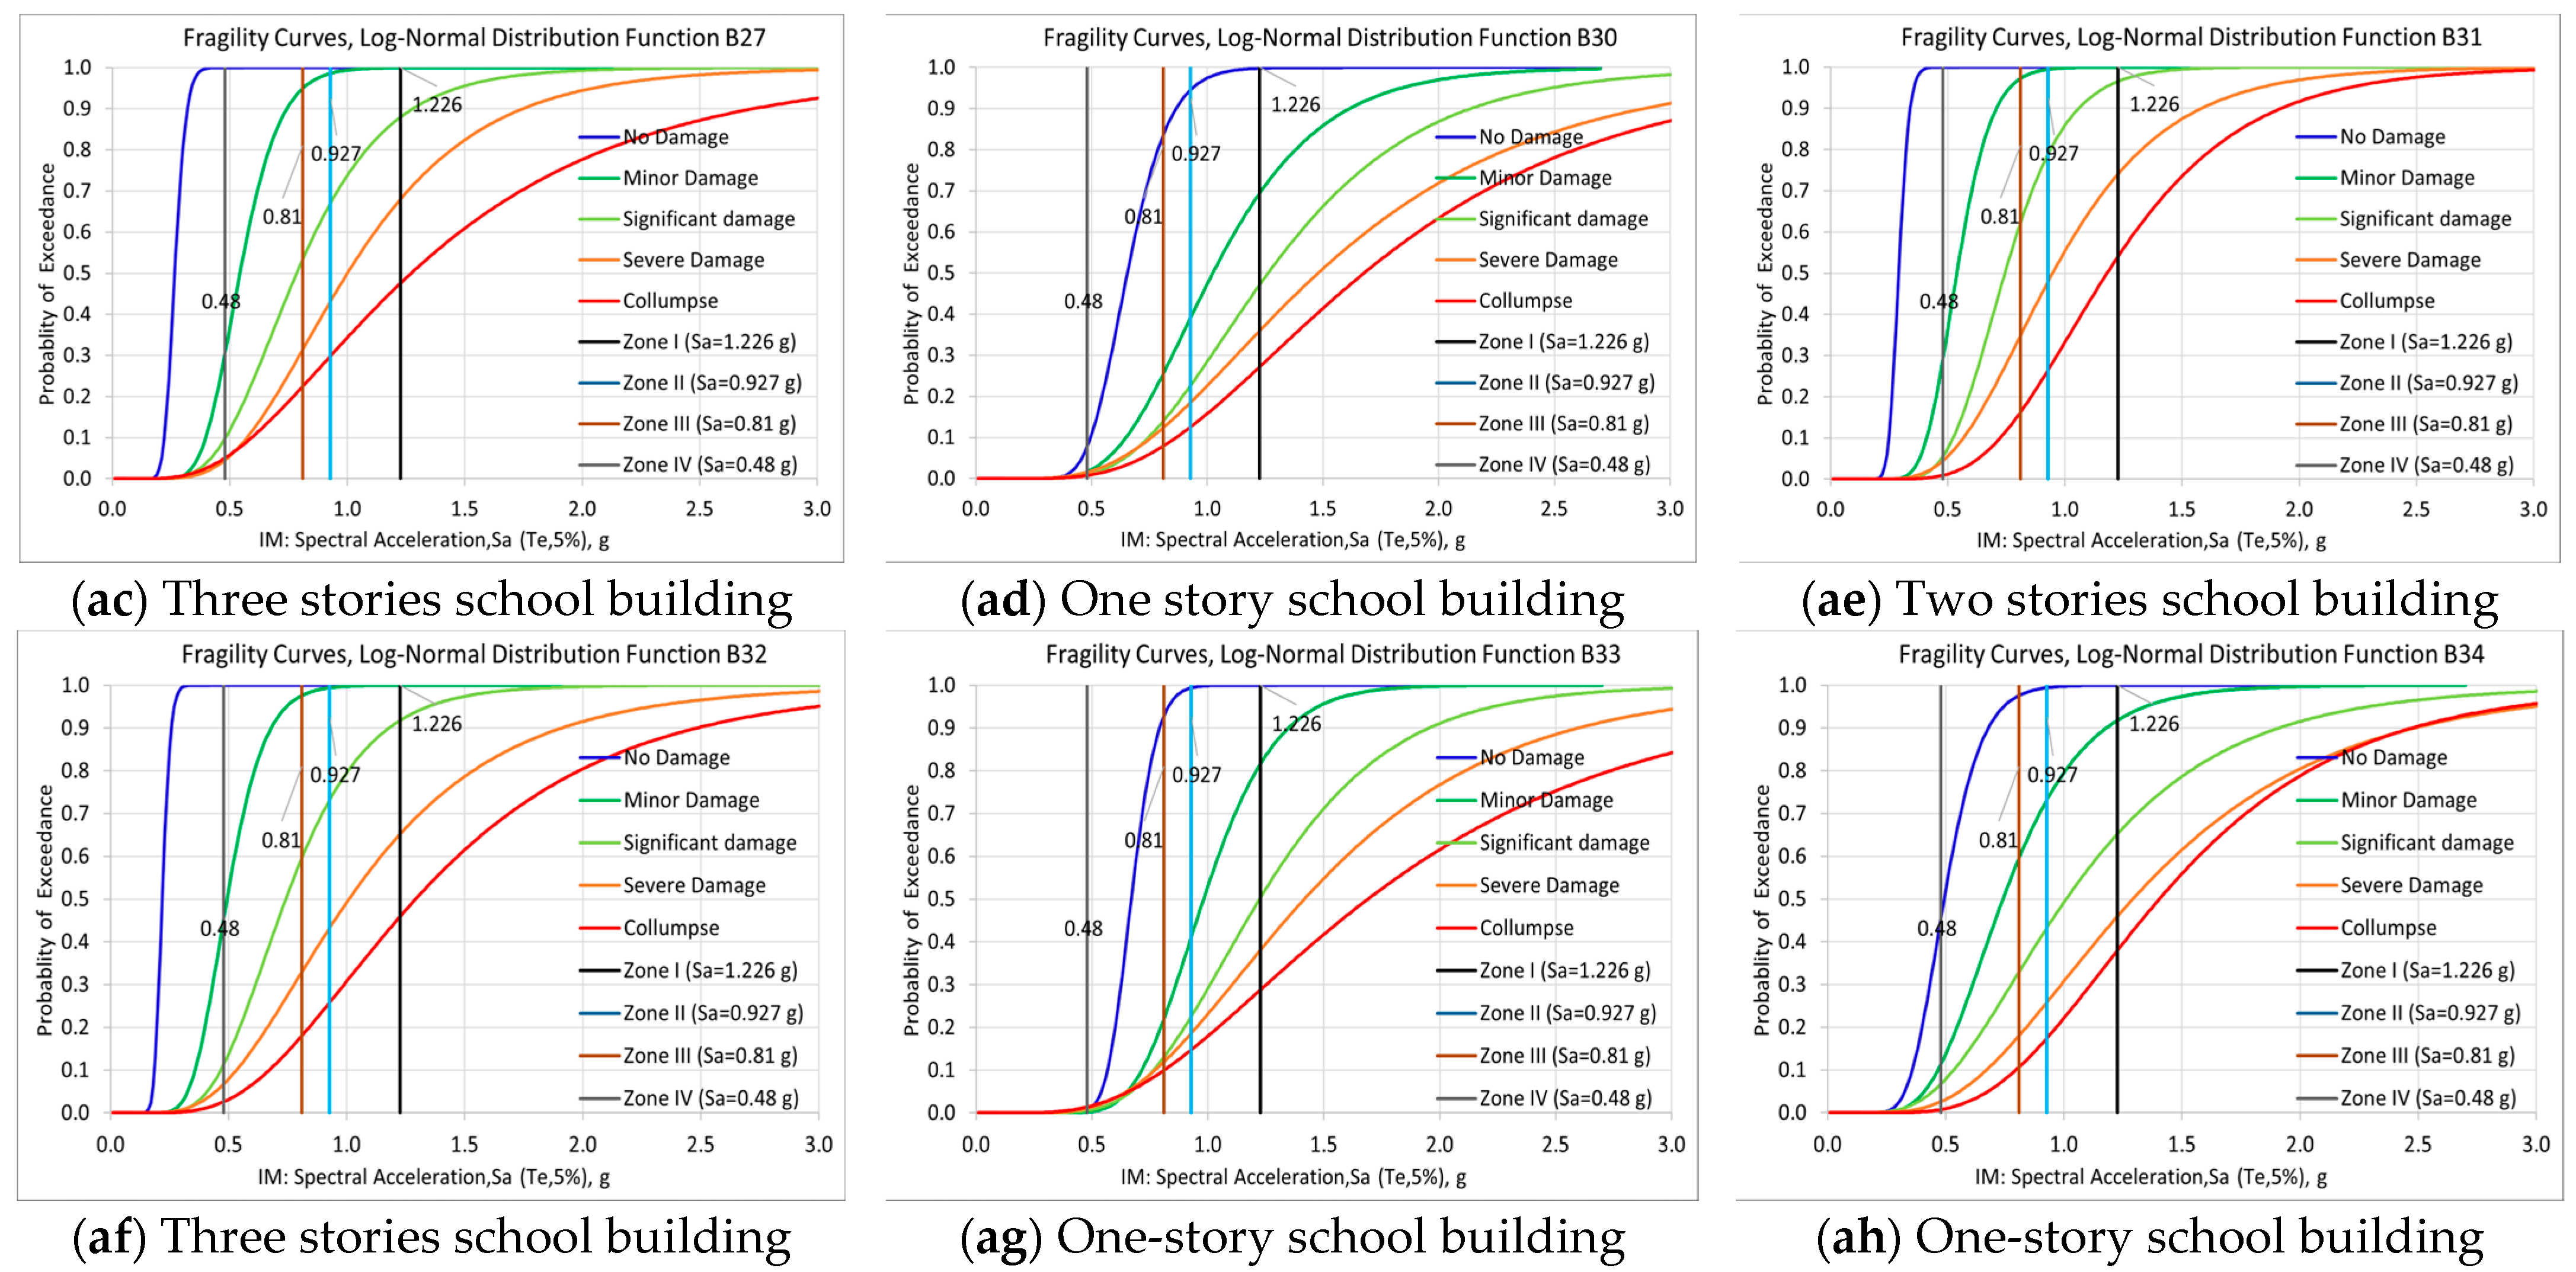
4.2. Fragility Curves

From the IDA curves obtained in the previous section, the fragility curves assessing the vulnerability of RC school buildings under various levels of ground motion intensity are calculated. Firstly, IM values corresponding to 0.5%, 1.0%, and 2.0% story drift levels were determined by interpolating the IDA curves. Utilizing the mean and standard deviation of IM values, the fragility curve was derived. This fragility curve forms a cumulative distribution function for a lognormal distribution, expressed by Equation (2).
P ( D M D M c o ) = ( l n X μ l n X σ l n X )
In which is the standard cumulative distribution function, l n X is the natural logarithm of the variable X (Sa ( T 1 )), and μ l n X and σ l n X are the mean and the standard deviation of the natural logarithm of X, respectively.
This study considered two scenarios for designing earthquakes. The first scenario’s analysis was based on the DBE, which is associated with a return period of 475 years. The second scenario was based on the MCE, which is associated with a return period of 2475 years.
Figure 8 and Figure 9 illustrate the fragility curves of various RC school buildings constructed in different regions of Afghanistan. These curves indicate the damage probability of RC school buildings for the first and second scenarios. The damage conditions of school buildings are evaluated at five different levels (no damage, minor damage, significant damage, severe damage, and collapse).

4.3. Damage Evaluation of RC School Buildings in the First Scenario

The average probability of each damage level in the first scenario among 34 school buildings is summarized in Table 7.
The key findings in the first scenario are summarized as follows:
  • A-type school buildings designed and constructed in the last six years are less likely to be damaged than B-type school buildings. Similarly, the collapse probabilities of one-story school buildings are less than those of two- to three-story school buildings.
  • As illustrated in Table 7, the collapse probability of A-type buildings in Zones I to IV is 19.6%, 9.0%, 6.1%, and 1%. In contrast, for B-type school buildings, these values change to 22.8%, 11.1%, 7.5%, and 2.1%.
  • In seismic Zone-I to Zone-IV, the A-type indicates a maximum likelihood of experiencing severe damage of 25.5%, 10.7%, 6.9%, and 1.3%. Meanwhile, B-type indicates a maximum likelihood of experiencing severe damage of 27.0%, 12%, 7.3%, and 3.5%.
  • In seismic Zone-I to Zone-IV, A-type school buildings indicate a maximum likelihood of experiencing significant damage of 38.5%, 16.8%, 8.9%, and 1.2%. Meanwhile, B-type school buildings show a maximum likelihood of experiencing severe damage of 44.8%, 19.5%, 11.5%, and 2.3%.

4.4. Damage Evaluation of RC School Buildings in the Second Scenario

The average probability of each damage level in the second scenario among 34 school buildings is summarized in Table 8.
The Key findings in the second scenario are summarized as follows:
  • A-type school buildings have less damage possibility compared to B-type school buildings and the collapse probabilities of one-story school buildings, are less than those of two- or three-story school buildings.
  • According to the analyzed results, seismic Zone I has the highest probability of damage, particularly in terms of collapse, with an average of 42.6% for A-type school buildings and 48.4% for B-type school buildings.
  • The damage possibility of school buildings in seismic Zone IV was significantly less than all other seismic zones in the first and second scenarios.
  • Buildings labeled as A-type show a maximum likelihood of experiencing severe damage of 55%, 33.1%, 24%, and 4.5% in seismic Zone-I to Zone-IV. In contrast, B-type school buildings indicate a maximum likelihood of experiencing collapse of 59.5%, 37.2%, 27%, and 5.1%.
  • In seismic Zone-I to Zone-IV, A-type school buildings indicate a maximum likelihood of experiencing significant damage of 75.1%, 51.8%, 38.5%, and 5.6%. Meanwhile, B-type school buildings indicate a maximum likelihood of experiencing severe damage of 79.5%, 60.5%, 46.1%, and 7.3%.

5. Conclusions

The seismic vulnerability of 34 RC school buildings in four seismic zones (Zone-I, Zone-II, Zone-III, and Zone-IV) in Afghanistan has been evaluated. The IDA was conducted to obtain the fragility curves under two different scenarios: the DBE and the MCE. Twenty-four input earthquake ground motions were carefully selected for IDA based on the MSE to match the ADRS. The IDA curves were then calculated using the non-linear frame analysis program STERA 3D by incrementing the IM of input ground motions.
The main findings of this study can be summarized as follows:
  • In the first scenario, A-type school buildings show a maximum average likelihood of collapse probability ranging from 19.6% in Seismic Zone-I to 1% in Zone-IV. Conversely, B-type school buildings indicate a maximum likelihood of collapse probability ranging from 22.8% in Zone I to 2.1% in Zone IV. In contrast, in the second scenario, these probabilities notably change. A-type buildings show average collapse probabilities of 42.6%, 26.2%, 20%, and 3.9% from Zone-I to Zone-IV in A-type, while B-type buildings show probabilities of 48.4%, 29.2%, 22.2%, and 5.2%.
  • A-type school buildings are less vulnerable to destructive earthquakes than B-type school buildings. Correspondingly, the collapse probabilities of one-story school buildings are less than those of two-story and three-story school buildings.
  • Zone-I exhibits the highest probability of damage for both A-type and B-type school buildings, particularly in the case of collapse.
This study contributes to understanding the seismic vulnerability of existing RC school buildings in Afghanistan. B-type RC school buildings show a significant damage probability in seismic Zone-I under the second scenario earthquake, and immediate strengthening measures are highly advised. The current investigation strongly recommends designing and constructing RC school buildings tailored to specific seismic zones to ensure safety and cost-effectiveness.

Author Contributions

Conceptualization, T.S. and S.Q.S.; methodology, S.Q.S.; software, T.S. and S.Q.S.; formal analysis, S.Q.S.; investigation, S.Q.S.; resources, S.Q.S.; writing—original draft preparation, S.Q.S.; writing—review and editing, T.S.; supervision, T.S. All authors have read and agreed to the published version of the manuscript.

Funding

This research received no external funding.

Data Availability Statement

The data presented in this study are available on request to the authors.

Conflicts of Interest

The authors declare no conflict of interest.

References

  1. Poli, P.; Prieto, G.; Rivera, E.; Ruiz, S. Earthquakes Initiation and Thermal Shear Instability in the Hindu Kush Intermediate Depth Nest; Blackwell Publishing Ltd.: Hoboken, NJ, USA, 2016; Volume 43. [Google Scholar]
  2. El Janous, S.; Ghoulbzouri, A. El Seismic Vulnerability of Irregular Reinforced Concrete Buildings Considering the Soil-Structure Interaction. Int. J. Eng. Trans. A Basics 2024, 37, 104–114. [Google Scholar] [CrossRef]
  3. Ma, W. Incremental Dynamic Analysis Method Application in the Seismic Vulnerability of Infilled Wall Frame Structures. J. Vibrio Eng. 2024, 26, 343–358. [Google Scholar] [CrossRef]
  4. El-Betar, S.A. Seismic Vulnerability Evaluation of Existing R.C. Buildings. HBRC J. 2018, 14, 189–197. [Google Scholar] [CrossRef]
  5. Applied Technology Council FEMA. Guidelines for Performance-Based Seismic Design of Buildings; Applied Technology Council FEMA: Redwood City, CA, USA, 2018. [Google Scholar]
  6. American Society of Civil Engineers. Seismic Evaluation and Retrofit of Existing Buildings; American Society of Civil Engineers: Reston, VA, USA, 2017. [Google Scholar]
  7. González, C.; Niño, M.; Jaimes, M.A. Event-Based Assessment of Seismic Resilience in Mexican School Buildings. Bull. Earthq. Eng. 2020, 18, 6313–6336. [Google Scholar] [CrossRef]
  8. Vamvatsikos, D.; Cornell, C.A. The Incremental Dynamic Analysis and Its Application to Performance-Based Earthquake Engineering. In Proceedings of the 12th European Conference on Earthquake Engineering, London, UK, 9–13 September 2002; pp. 1375–1392. [Google Scholar]
  9. Vamvatsikos, D.; Allin Cornell, C. Incremental Dynamic Analysis. Earthq. Eng. Struct. Dyn. 2002, 31, 491–514. [Google Scholar] [CrossRef]
  10. Vamvatsikos, D. Incremental Dynamic Analysis. In Encyclopedia of Earthquake Engineering; Springer: Berlin/Heidelberg, Germany, 2014; pp. 1–8. [Google Scholar]
  11. Asgarian, B.; Yahyai, M.; Mirtaheri, M.; Samani, H.R.; Alanjari, P. Incremental Dynamic Analysis of High-Rise Towers. Struct. Des. Tall Spec. Build. 2010, 19, 922–934. [Google Scholar] [CrossRef]
  12. Cheng, Y.; Dong, Y.R.; Bai, G.L.; Wang, Y.Y. IDA-Based Seismic Fragility of High-Rise Frame-Core Tube Structure Subjected to Multi-Dimensional Long-Period Ground Motions. J. Build. Eng. 2021, 43, 102917. [Google Scholar] [CrossRef]
  13. Iervolino, I.; Manfredi, G. A Review of Ground Motion Record Selection Strategies for Dynamic Structural Analysis; Springer: Berlin/Heidelberg, Germany, 2008. [Google Scholar]
  14. Miano, A.; Mele, A.; Prota, A. Fragility Curves for Different Classes of Existing RC Buildings under Ground Differential Settlements. Eng. Struct. 2022, 257, 114077. [Google Scholar] [CrossRef]
  15. Gómez-Martínez, F.; Millen, M.D.L.; Alves Costa, P.; Romão, X. Estimation of the Potential Relevance of Differential Settlements in Earthquake-Induced Liquefaction Damage Assessment. Eng. Struct. 2020, 211, 110232. [Google Scholar] [CrossRef]
  16. Nappo, N.; Peduto, D.; Polcari, M.; Livio, F.; Ferrario, M.F.; Comerci, V.; Stramondo, S.; Michetti, A.M. Subsidence in Como Historic Centre (Northern Italy): Assessment of Building Vulnerability Combining Hydrogeological and Stratigraphic Features, Cosmo-SkyMed InSAR and Damage Data. Int. J. Disaster Risk Reduct. 2021, 56, 102115. [Google Scholar] [CrossRef]
  17. Goksu, C. Fragility Functions for Reinforced Concrete Columns Incorporating Recycled Aggregates. Eng. Struct. 2021, 233, 111908. [Google Scholar] [CrossRef]
  18. Zucconi, M.; Romano, F.; Ferracuti, B. Typological Fragility Curves for RC Buildings: Influence of Damage Index and Building Sample Selection. Eng. Struct. 2022, 266, 114627. [Google Scholar] [CrossRef]
  19. Ruggieri, S.; Porco, F.; Uva, G.; Vamvatsikos, D. Two Frugal Options to Assess Class Fragility and Seismic Safety for Low-Rise Reinforced Concrete School Buildings in Southern Italy. Bull. Earthq. Eng. 2021, 19, 1415–1439. [Google Scholar] [CrossRef]
  20. Mucedero, G.; Perrone, D.; Monteiro, R. Infill Variability and Modelling Uncertainty Implications on the Seismic Loss Assessment of an Existing RC Italian School Building. Appl. Sci. 2022, 12, 12002. [Google Scholar] [CrossRef]
  21. Pucinotti, R.; De Lorenzo, R.A.; Bedon, C. Seismic Isolation Devices for Protecting RC Buildings: The Frangipane School in Reggio Calabria. Appl. Sci. 2022, 12, 12894. [Google Scholar] [CrossRef]
  22. Carofilis Gallo, W.W.; Clemett, N.; Gabbianelli, G.; O’reilly, G.; Monteiro, R. Seismic Resilience Assessment in Optimally Integrated Retrofitting of Existing School Buildings in Italy. Buildings 2022, 12, 845. [Google Scholar] [CrossRef]
  23. Saito, T. Structural Earthquake Response Analysis, STERA_3D Version 11.2; Earthquake Disaster Engineering Research Laboratory. Available online: http://www.rc.ace.tut.ac.jp/saito/index.html (accessed on 22 December 2022).
  24. Sayed Qudratullah, S.; Alcantara, A.M.; Saito, T. Assessment of Seismic Fragility Curves for Existing RC School Buildings in Afghanistan. In Proceedings of the 16 Japan Earthquake Engineering Symposium (JEES), Yokohama, Japan, 23–25 November 2023. [Google Scholar]
  25. Sharafi, Q.; Naqi, A.; Taiki, S. Effect of Brick Masonry Infill Walls on Seismic Performance of Reinforced Concrete Frame Structures in Afghanistan. In Proceedings of the 1st Croatian Conference on Earthquake Engineering (1CroCEE), Zagreb, Croatia, 22–24 March 2021; pp. 921–930. [Google Scholar] [CrossRef]
  26. Qudratullah Sharafi, S.; Saito, T. Effect of Infill Masonry Wall with Central Opening on Seismic Behavior of Reinforced Concrete Structure. Int. J. Mason. Res. Innov. (IJMRI) 2023, 8, 531–548. [Google Scholar] [CrossRef]
  27. Karapetrou, S.; Manakou, M.; Bindi, D.; Petrovic, B.; Pitilakis, K. “Time-Building Specific” Seismic Vulnerability Assessment of a Hospital RC Building Using Field Monitoring Data. Eng. Struct. 2016, 112, 114–132. [Google Scholar] [CrossRef]
  28. Elnashai, A.S. Assessment of Seismic Vulnerability of Structures. J. Constr. Steel Res. 2006, 62, 1134–1147. [Google Scholar] [CrossRef]
  29. Domaneschi, M.; Zamani Noori, A.; Pietropinto, M.V.; Cimellaro, G.P. Seismic Vulnerability Assessment of Existing School Buildings. Comput. Struct. 2021, 248, 106522. [Google Scholar] [CrossRef]
  30. Martins, L.; Silva, V. Development of a Fragility and Vulnerability Model for Global Seismic Risk Analyses. Bull. Earthq. Eng. 2021, 19, 6719–6745. [Google Scholar] [CrossRef]
  31. Annual Report. Ministry of Education (MOE) of Afghanistan. Available online: https://moe.gov.af/sites/default/files/202305/MoE%20First%20and%20Second%20Quarter%201401%20Report.pdf (accessed on 22 December 2022).
  32. Shnizai, Z. Mapping of Active and Presumed Active Faults in Afghanistan by Interpretation of 1-Arcsecond SRTM Anaglyph Images. J. Seismol. 2020, 24, 1131–1157. [Google Scholar] [CrossRef]
  33. Riaz, M.S.; Bin, S.; Naeem, S.; Kai, W.; Xie, Z.; Gilani, S.M.M.; Ashraf, U. Over 100 Years of Faults Interaction, Stress Accumulation, and Creeping Implications, on Chaman Fault System, Pakistan. Int. J. Earth Sci. 2019, 108, 1351–1359. [Google Scholar] [CrossRef]
  34. Afghan Building Code (ABC); Afghanistan National Standard Agency (ANSA): Kabul, Afghanistan, 2012.
  35. Boyd, O.S.; Mueller, C.S.; Rukstales, K.S. Preliminary Earthquake Hazard Map of Afghanistan; USGS: Reston, VA, USA, 2007. [Google Scholar]
  36. EN 1998-1; Eurocode 8: Design of Structures for Earthquake Resistance—Part 1: General Rules, Seismic Actions and Rules for Buildings. European Committee for Standardization: Brussels, Belgium, 2004.
  37. FEMA. Federal Emergency Management Agency FEMA 356/November 2000 Prestandard and Commentary for the Seismic Rehabilitation of Buildings; FEMA: Reston, VA, USA, 2000. [Google Scholar]
  38. American Society of Civil Engineers. Minimum Design Loads and Associated Criteria for Buildings and Other Structures; American Society of Civil Engineers (ASCE): Reston, VA, USA, 2017; ISBN 9780784479964. [Google Scholar]
  39. USGS. Geological Survey and California Geological Survey, Center for Engineering Strong Motion Data (CESMD). Available online: https://www.strongmotioncenter.org/ (accessed on 1 March 2021).
  40. JSCA. The Guide to Safe Buildings. In Performance-Based Seismic Design; JSCA: Tokyo, Japan, 2000; Available online: https://www.jaso.jp/ (accessed on 22 December 2022). (In Japanese)
Figure 1. A-type two-story RC school building, showcasing (a) first-floor plan details, (b) second-floor plan, and (c) RC frame (transverse direction).
Buildings 14 01054 g001
Figure 2. B-type two-story RC school building, including (a) the first-floor plan, (b) the second-floor plan, and (c) the RC frame (transverse direction).
Buildings 14 01054 g002
Figure 3. RC school building locations (A-type and B-type).
Buildings 14 01054 g003
Figure 4. Afghanistan-Designed Response Spectra with 5% damping: (a) First scenario (Design Based Earthquake); (b) Second scenario (Maximum Considered Earthquake).
Buildings 14 01054 g004
Figure 5. Seismic zones for RC school buildings in Afghanistan.
Buildings 14 01054 g005
Figure 6. Recorded earthquake ground motions for the IDA (h = 0.05).
Buildings 14 01054 g006
Figure 7. (aj) IDA curves of RC school building (A-type). (kah) IDA curves of RC school building (B-type).
Buildings 14 01054 g007aBuildings 14 01054 g007bBuildings 14 01054 g007c
Figure 8. (aj) Fragility curves of RC school building for the first scenario (A-type). (kah) Fragility curves of RC school building for the first scenario (B-type).
Buildings 14 01054 g008aBuildings 14 01054 g008bBuildings 14 01054 g008c
Figure 9. (aj) Fragility curves of RC school buildings for the second scenario (A-type). (kah) Fragility curves of RC school buildings for the second scenario (B-type).
Buildings 14 01054 g009aBuildings 14 01054 g009bBuildings 14 01054 g009c
Table 1. Summary of column dimensions and reinforcement (A-type school building).
No.ColumnStory LevelDepth (cm)Width (cm)Main Rein.
Bars
Shear Rein.
Bars
Rebar Strength,
f y (MPa)
Concrete
f c (MPa)
1C11st and 2nd Floors604014 Ø D-18Ø 10 @ 10cm42028
2C21st and 2nd Floors604014 Ø D-20Ø 10 @ 10cm 42028
Table 2. Summary of beam dimensions and reinforcement (A-type school building).
No.BeamsStory LevelDepth (cm)Width (cm)Beams Reinforcement DetailsRebar Strength, f y (MPa)Concrete f c (MPa)
1B11st Floor60405 Ø18 on Top and 5 Ø16 on Bot.42028
2B22nd Floor50405 Ø16 on Top and 5 Ø16 on Bot. 42028
3B31st Floor60405 Ø16 on Top and 4 Ø16 on Bot.42028
4B42nd Floor50405 Ø16 on Top and 4 Ø16 on Bot.42028
Table 3. Summary of column dimensions and reinforcement (B-type school building).
No.ColumnStory LevelDepth (cm)Width (cm)Main Rein.
Bars
Shear Rein.
Bars
Rebar Strength,
f y (MPa)
Concrete
f c (MPa)
1C11st and 2nd Floors353510 Ø D-20Ø 8 @ 15cm26520
2C22nd Floor353510 Ø D-18Ø 8 @ 15cm26520
3C31st Floor35356 Ø D-204 Ø D-22Ø 8 @ 15cm26520
4C41st Floor353510 Ø D-22Ø8 @ 10cm 26520
Table 4. Summary of beam dimensions and reinforcement (B-type school building).
No.BeamsStory LevelDepth (cm)Width (cm)Beams Reinforcement Details Rebar Strength,
f y (MPa)
Concrete
f c (MPa)
1B11st Floor35355 Ø16 on Top and 4 Ø16 on Bot.26520
2B22nd Floor35355 Ø14 on Top and 4 Ø14 on Bot.26520
3B31st Floor35355 Ø18 on Top and 4 Ø18 on Bot.26520
4B42nd Floor35355 Ø16 on Top and 4 Ø16 on Bot.26520
5B51st Floor40355 Ø18 on Top and 4 Ø18 on Bot.26520
6B62nd Floor40355 Ø18 on Top and 4 Ø18 on Bot.26520
Table 5. Summary of 24 input earthquake ground motions.
No.Record DetailsLocationsStationsDepth (km)Magnitude
(Mw)
Duration
(S)
PGA (g)
1El-Centro 1940USA-10.56.9517.70.3
2JP_2003_HokkaidoJapan114283000.412
3TW_1999 Chi-ChiTaiwan0787.61500.274
4JP_2007 NotoJapan02116.93000.596
5JP_2016 KumamotoJapan06127.33000.409
6JP_2011 MiyagiJapan051427.11930.428
7US_1981 WestmorlandUSA-85.864.980.474
8JP_2011 TohokuJapan042493000.571
9IR_Bam_2003Iran4040106.6200.67
10Gazli_1976Uzbekistan-22.36.80000.31
11JP_2018 HokkaidoJapan02376.73000.429
12JP_2011_FukushimaJapan023971940.415
13JP_2003 HokkaidoJapan034283000.411
14JP_2003 HokkaidoJapan044283000.439
15JP_2016 KumamotoJapan07127.33000.617
16US_189_LomaPrietaUSA03187.139.980.369
17US_1989_LomaPrietaUSA04187.139.980.478
18US_1989_LomaPrietaUSA05187.139.980.428
19US_1989_LomaPrietaUSA06187.1400.322
20US_1992_PetroliaUSA01197.059.980.661
21US_1992_PetroliaUSA02197.059.980.385
22TW_1999 Chi-ChiTaiwan0687.61500.281
23TW_1999 Chi-ChiTaiwan0887.61500.308
24US_1994_NorthridgeUSA0219.46.759.980.343
Table 6. Category of damage state.
Damage
Measure (DM)
No DamageMinor DamageSignificant DamageSevere DamageCollapse
Story drift ( θ m a x ) θ m a x   ≤ 1/3001/300 < θ m a x   ≤ 1/1501/150 <   θ m a x   ≤ 1/1001/100 <   θ m a x ≤ 1/75 θ m a x   > 1/75
Table 7. Average probability in the first scenario.
Building TypeSeismic ZoneNo Damage
(%)
Minor Damage
(%)
Significant
Damage (%)
Severe
Damage (%)
Collapse (%)
A-typeZone-I56.351.538.525.519.6
A-typeZone-II41.240.216.810.79.0
A-typeZone-III33.722.18.96.96.1
A-typeZone-IV10.110.41.21.31.0
B-typeZone-I64.362.844.827.022.8
B-typeZone-II45.150.419.512.011.1
B-typeZone-III39.839.311.57.37.5
B-typeZone-IV20.423.22.33.52.1
Table 8. Average probability in the second scenario.
Building TypeSeismic ZoneNo Damage
(%)
Minor Damage
(%)
Significant
Damage (%)
Severe
Damage (%)
Collapse (%)
A-typeZone-I76.383.675.155.042.6
A-typeZone-II49.282.551.833.126.2
A-typeZone-III63.771.238.524.220.0
A-typeZone-IV54.114.55.64.53.9
B-typeZone-I84.359.879.559.548.4
B-typeZone-II55.160.160.537.229.2
B-typeZone-III69.762.946.127.022.2
B-typeZone-IV85.477.27.35.15.2
Disclaimer/Publisher’s Note: The statements, opinions and data contained in all publications are solely those of the individual author(s) and contributor(s) and not of MDPI and/or the editor(s). MDPI and/or the editor(s) disclaim responsibility for any injury to people or property resulting from any ideas, methods, instructions or products referred to in the content.

