Abstract
Transit-oriented development (TOD) has been promoted and implemented worldwide through the efficient integration of rail transit stations and land use. However, the interactions between stations and the surrounding catchment areas (CAs) are characterized by different features of the built environment and regional development. Therefore, it is necessary to develop a quantitative classification method for rail transit stations based on the built environment within a CA and to identify the passenger flow characteristics of different types of stations to develop targeted planning and design policies. In this study, Line 1 and Line 2 within the third ring road of Xi’an City were taken as the objects, and a station classification system was constructed by taking station traffic levels and different building functions within the CA as the classification factors. Secondly, indicators of the built environment, such as six different types of functions, were calculated through refined vector modeling, and 30 typical stations were typologically analyzed. Furthermore, 10 typical types—totaling 11 stations—were selected for passenger flow monitoring, and the passenger flow characteristics of the different types of stations were summarized in terms of the dimensions of stations and exits. Finally, the correlations between the indicators of the built environment and passenger traffic for different functions were quantified. This study provides a basis for the future optimization of stations and the built environment, as well as station design and management.
1. Introduction
In 2050, 68% of the total global population of 9.7 billion is expected to live in cities [1]. A massive population concentration leads to conflicts related to urban land use and transportation, resulting in severe traffic congestion [2]. In this regard, countries have developed rail transit on a large scale to alleviate urban transportation problems. By the end of 2022, 545 cities in 78 countries and regions operated urban rail transit systems, with a total mileage of more than 41,386 km [3]. In order to better promote the integration of rail transit and urban development, rail transit combined with a transit-oriented development (TOD) strategy has been recognized and advocated worldwide in recent decades [4]. TOD refers to the high-density mixed-use development of urban land within a certain range of the area surrounding a rail transit station, thus compactly and efficiently utilizing the surrounding land resources [5]. One important purpose of TOD is the study of the heterogeneity of stations’ traffic characteristics and the development patterns of the surrounding land, as well as the formulation of strategies for integrating stations and the surrounding land based on different types of TOD. This includes strategies such as planning the site layout, optimizing the site design, and optimizing the surrounding land use and the built environment. Despite the simplicity of the basic principles of TOD, there are significant differences in the implementation of TOD in different countries and cities in North America, Europe, South America, and Asia due to the differences in population densities and the built environments of cities [6].
Typical TOD includes two features, i.e., providing efficient transportation services and diversified multifunctional services, such as work and recreation for the residents around the station [7]. However, in rapid TOD, there are problems with incompatibility between stations and the surrounding urban functions. Certain stations are unable to fully meet the transportation demand generated by the surrounding land, and the functional modes around the stations are unable to meet the diversified needs of the population. Previous studies have shown that different land-use functions and built environments around a station reflect heterogeneity in station traffic characteristics [8,9]. Therefore, determining station classifications based on different built environments is important for stations themselves and the surrounding areas [10]. For the transportation function of a station, it helps to explain and predict the heterogeneity of the station’s passenger flow characteristics [8]. For the station’s area function, it is helpful to formulate different strategies for different types of TOD that can be conducive to achieving the integrated development of the station and the surrounding land use [11,12]. Therefore, developing station classification methods and clarifying the passenger flow patterns of different types of stations can help in the understanding of stations’ traffic demand, guide the integrated development of stations and land use, and, at the same time, provide data support and a basis for station TOD planning.
1.1. Literature Review
To establish quantitative classification methods for stations in built environments with different characteristics, academics have developed different methods based on the node–place model theory [13], and they have done so around different classification factors using clustering methods such as time-series or K-means clustering. Meanwhile, based on different types of station classifications, the spatiotemporal characteristics of passenger flow were further explored. According to the different classification factors, the classification of stations in established studies can mainly be categorized into the following three types.
- (1)
- Classification by station passenger flow characteristics: A related study in Beijing classified 195 stations into eight different types through the time-series clustering of metro stations’ passenger flow data [14]. A study in Shanghai classified the time series of stations based on card operation data from 288 stations, combining passenger flow and shopping district integration [15]. A related study in Chongqing utilized operational data to classify 25 stations into five classes using passenger traffic, station operations, and other transportation characteristics as classification factors [16].
- (2)
- Classification by land use and building function around the station: Related studies determined the station type by analyzing the dominant urban functional types within a certain catchment area (CA) around a station. In Shanghai, for example, a study took 23 stations in new towns as an example, used a 600 m radius as the CA, characterized the functions of the land around the stations through point-of-interest (POI) data, and classified the stations into five types [17]. In Hong Kong, POI data within the 500 m CAs around stations were extracted to categorize stations according to seven indicators of the built environment, including the land-use diversity, commercial intensity, and population. The results found that commercial, residential, tourist, and industrial land uses had the most significant influence on the station type [7].
- (3)
- Classification based on multiple indicators, such as passenger flow characteristics, surrounding urban functions, and accessibility: a study in Lisbon evaluated 50 stations based on their transportation accessibility, land use, and urban design [18]. Another study in Shanghai used POIs to classify 347 stations into five categories based on three factors: traffic characteristics, pedestrian accessibility, and comprehensive urban development [19]. A study in Ningbo combined traffic volume and land use to evaluate urban stations using metro operation data and cell phone signaling data after developing a grading system [20]. A study in Xi’an used cell phone signaling and station traffic data to classify 66 stations into six categories based on traffic characteristics and the job–housing balance, and the traffic characteristics of different types of stations were analyzed [21].
Previous studies have achieved rich results related to station classification methods, but the following gaps still exist: 1. In studies that used a classification based on stations’ land-use functions, POI and urban planning data were most commonly used. POI data cannot reflect the impacts of land and building areas on passenger flow [22], and land-use planning data are different from the actual built environment. 2. In studies that used a classification based on passenger flow characteristics, the passenger data were usually obtained using station operation data and cell phone signaling data. When using such methods, only the vertical passenger flow in the station can be analyzed, but not enough consideration is given to the more refined passenger flow at different exits. Therefore, it is necessary to explore station classification methods based on a refined view of the built environment and to analyze and validate the passenger flow characteristics of different types in station and exit dimensions.
Based on the above results of theoretical research, guidelines related to station classification have also been issued at the governmental level in various countries. In Japan, cities such as Tokyo and Tsukuba classify stations into three categories based on the station location, traffic intensity, and interchange coefficients based on traffic characteristics [23]. In Singapore, stations are classified into four classes based on their land structure and the layout characteristics around each station; the classifications are center stations, regional center stations, town center stations, and neighborhood center stations [24].
China is the country with the greatest increase in urbanization in recent decades, and it is currently building rail transit on a large scale. By the end of 2022, a cumulative total of 61 cities in China had opened and operated rail transit, with an operating mileage of 10,857 km [3]. In China, governmental departments have issued two guidelines to instruct the classification of rail transit stations in recent years. China’s Ministry of Housing and Urban–Rural Development issued the Guidelines for the Planning and Design of Areas Along Urban Railways in 2015, in which stations were classified into six types, namely, hub stations, center stations, cluster stations, special control stations, end stations, and general stations, using traffic positioning as a classification factor [25]. This guideline only considered the transportation characteristics of the stations and did not consider the surrounding urban functions. In addition, the Urban Planning Society of China issued the Guidelines for the Spatial Planning and Design of Facilities in the Area Surrounding Urban Rail Transit Stations in 2021. The guideline divided stations into three simpler types based on stations’ traffic characteristics. Meanwhile, stations were divided into six categories, namely, residential, commercial, industrial, transportation, special, and integrated stations, based on the land-use characteristics around them [26]. However, this specification does not clearly define the specific scope of the surrounding CAs, and the simple division of the three transportation types cannot reflect the complex situation of megacities. These guidelines provide instructions for the pre-construction phase of rail transit. However, these simple and fixed guidelines cannot meet the needs of developing countries and regions in which urbanization is rapidly advancing and the built environment is drastically changing because they do not specify a comprehensive quantitative method. More importantly, these classification criteria are only used as a reference for the preliminary stage, and the passenger flow characteristics of different types of stations after their completion have not been analyzed and verified in depth.
1.2. Motivation and Objective
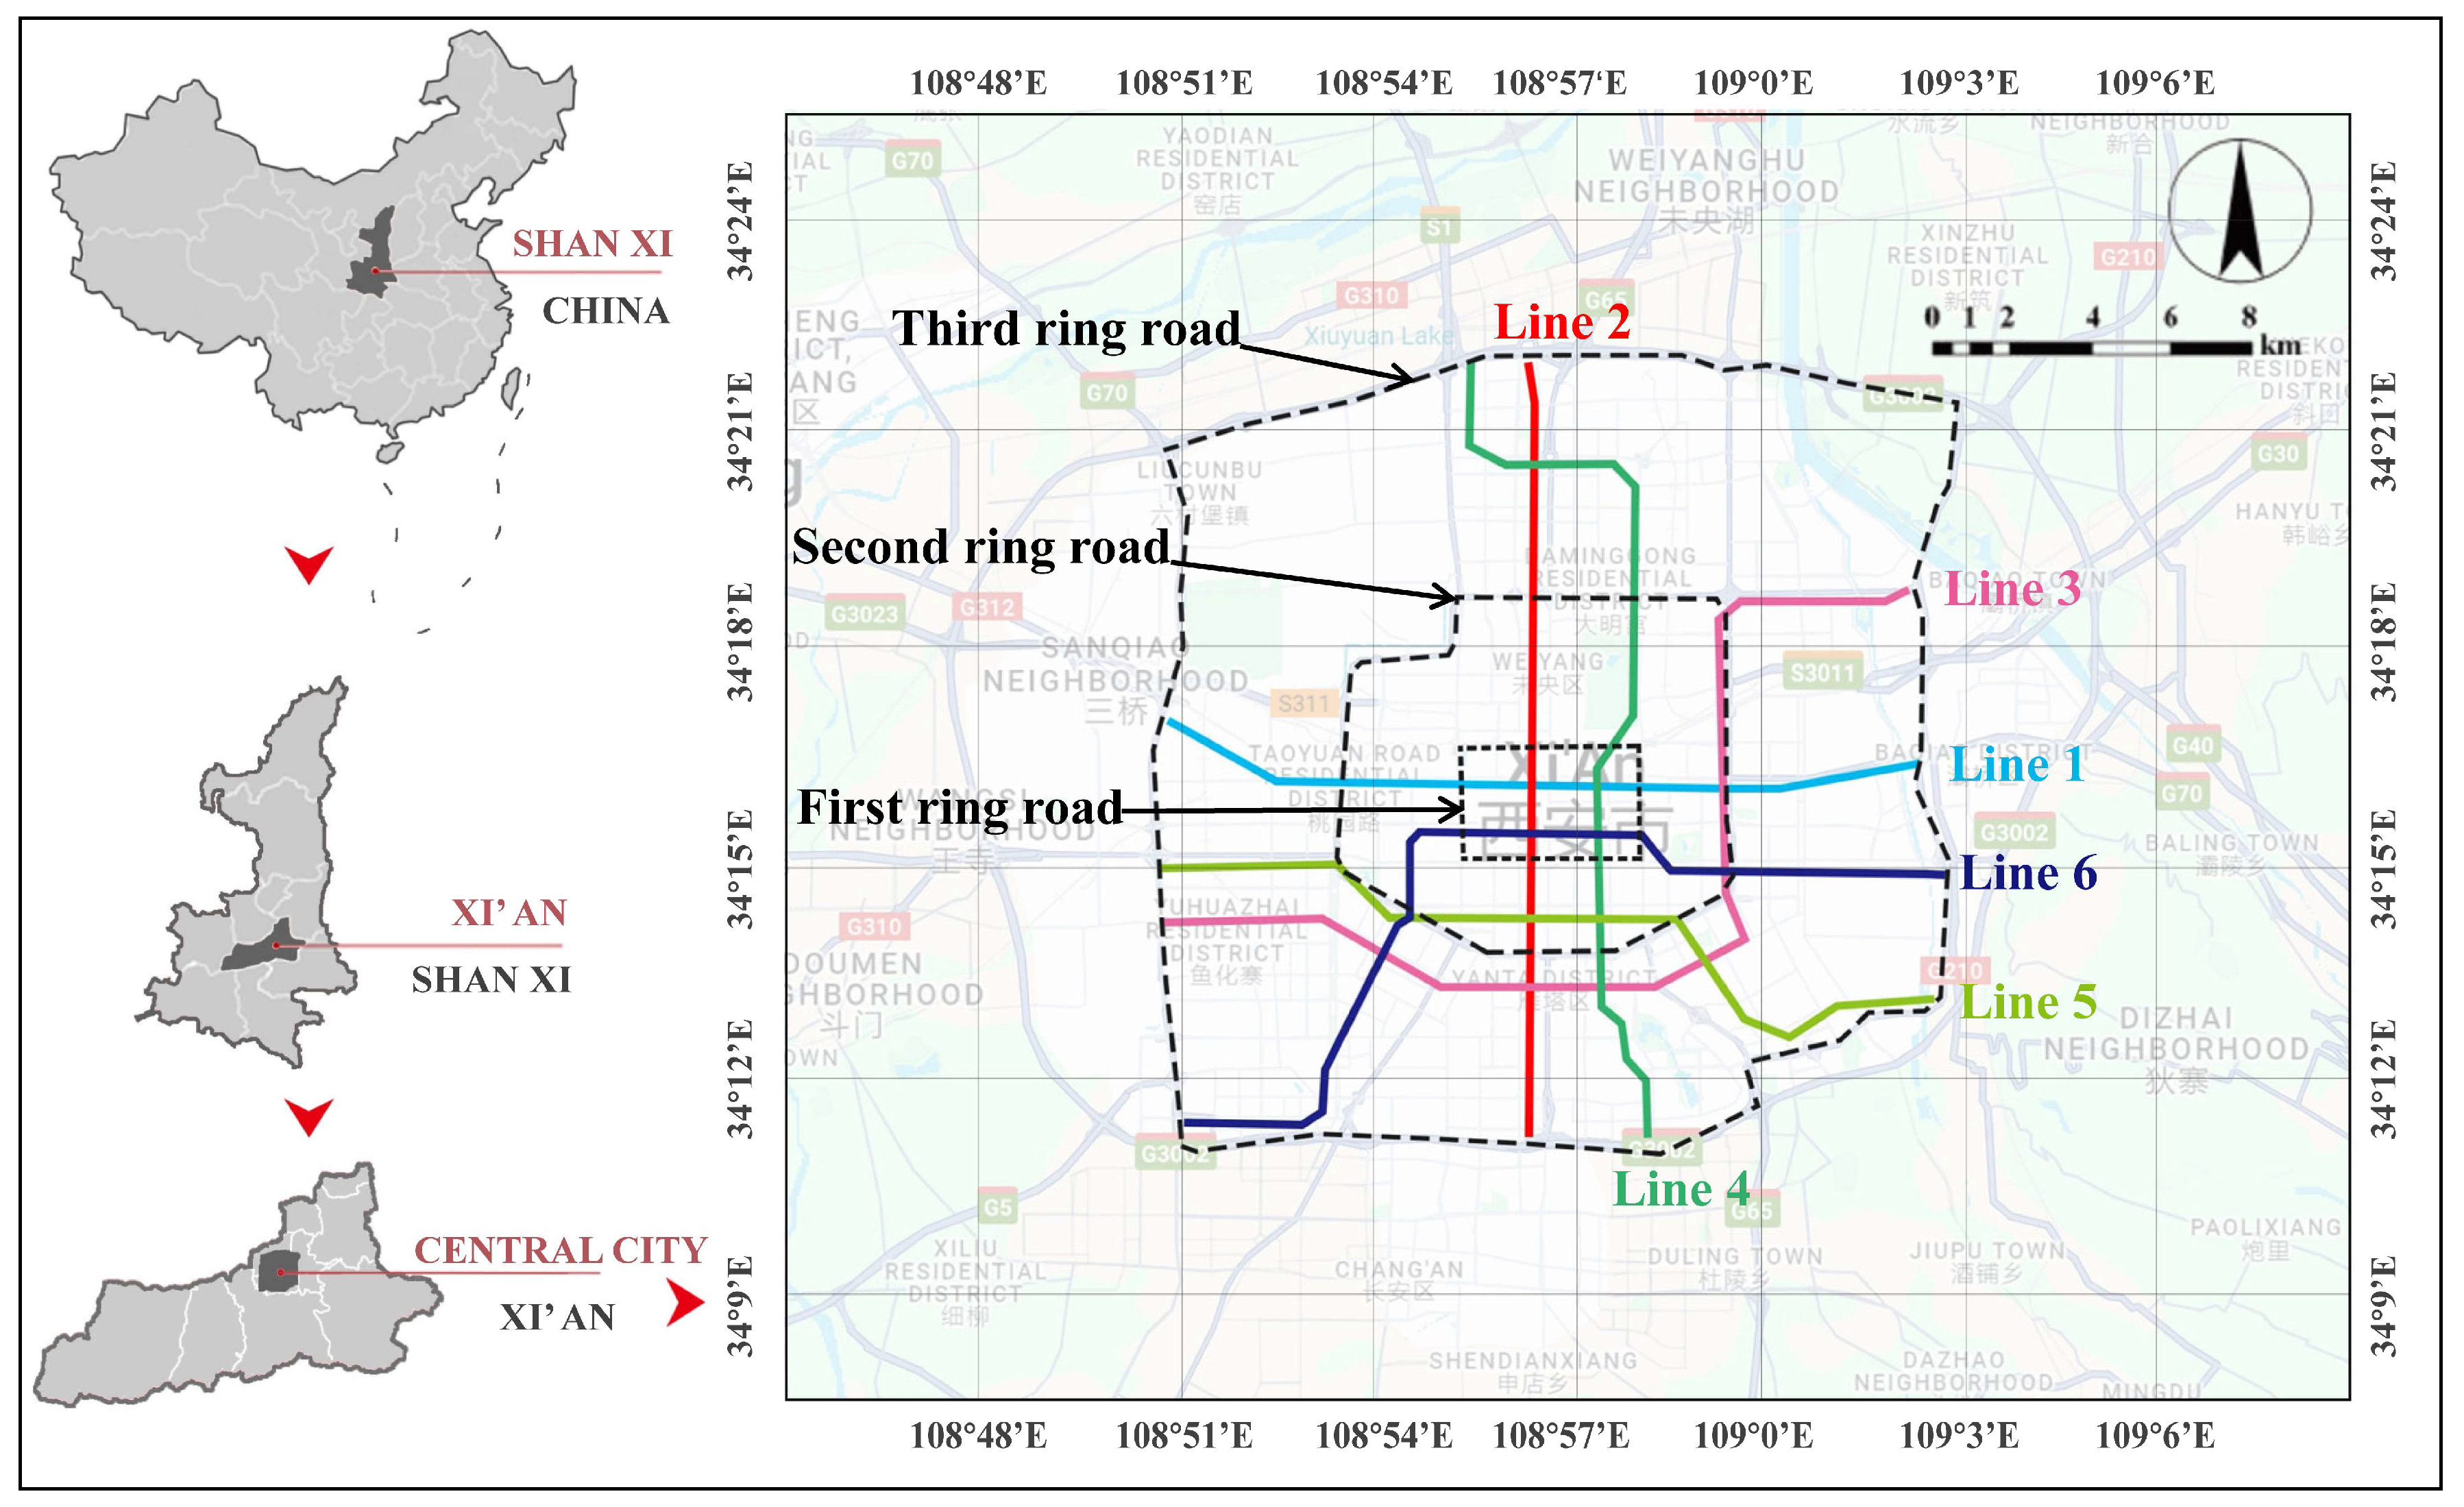
This study attempted to address the above research gaps by taking Xi’an, a plains-type megacity in China, as an example. As shown in Figure 1, Xi’an takes the form of a checkerboard and ring road network. It had a population of nearly 13 million in 2022, a built-up area of 806 km2, and an urbanization level of nearly 80% [27]. As of January 2024, the length of rail transit operation was 312 km, with a total of 214 stations on 10 lines [28], of which 6 lines operated within the city’s third ring road. In 2023, the average daily passenger flow intensity was able to reach 3.64 million passengers/day. It is expected that by 2029, nearly 200 km of new lines will be added on top of this [29].
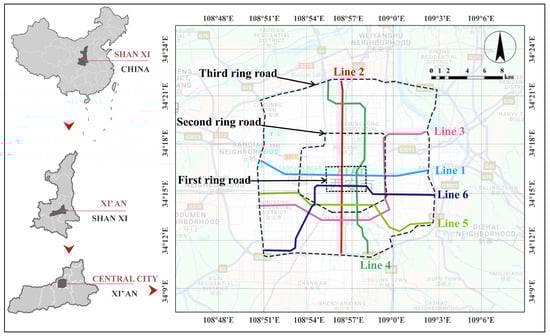
Figure 1.
Location of the study area.
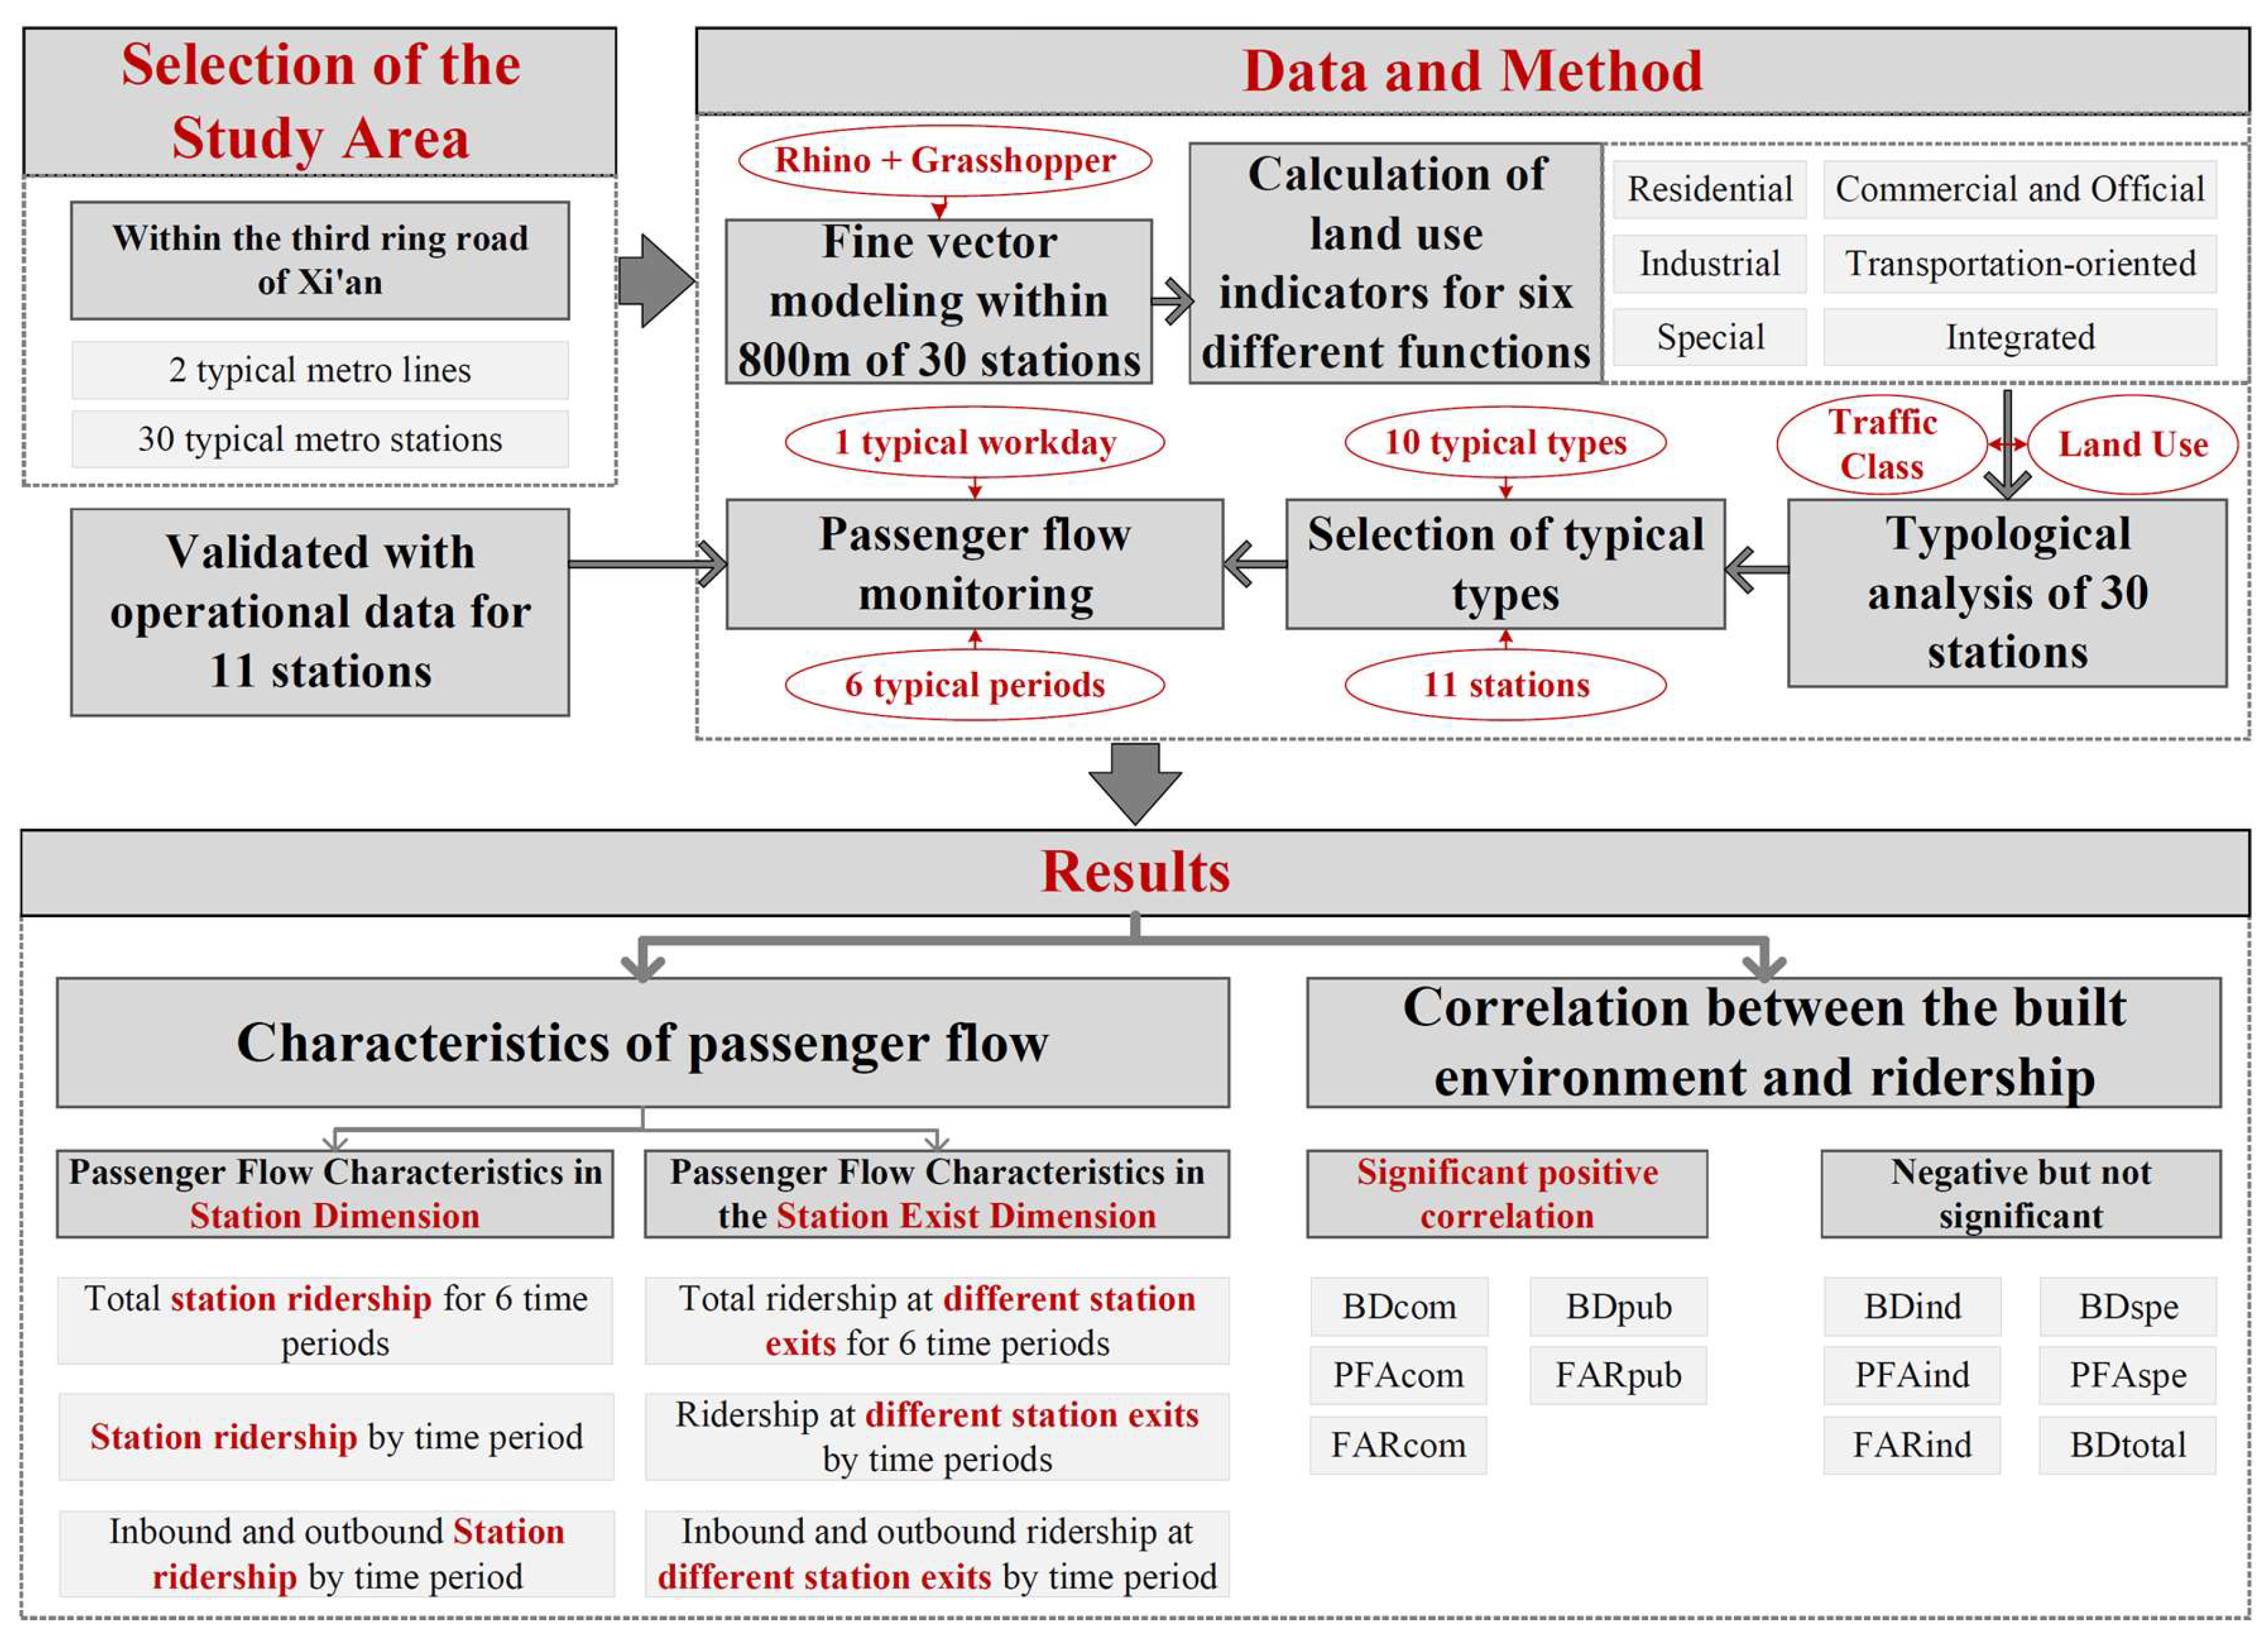
This study took 30 typical stations of Line 1 and Line 2 within the third ring road as specific research objects. Figure 2 shows the analytic flow of the study. Firstly, it was considered that the guidelines and standards issued by the government are mandatory in actual construction [30]. Based on the two relevant guidelines in China, this study extracted the four traffic levels and six types of building functions to form a new classification system. At the same time, a built environment dataset was constructed through fine vector modeling of the stations and the surrounding built environment, and 10 typical stations were typologically analyzed based on this classification system. Secondly, 11 typical stations of different types were selected, field monitoring was carried out, and the passenger flow characteristics of different types of stations were analyzed. Finally, the correlation of different factors of the built environment with passenger flow was verified. This study provides guidance and reference for similar megacities with ancient city centers in terms of the optimization of the urban spatial structure, the renewal of stations and the surrounding built environment, and the management of station operation.
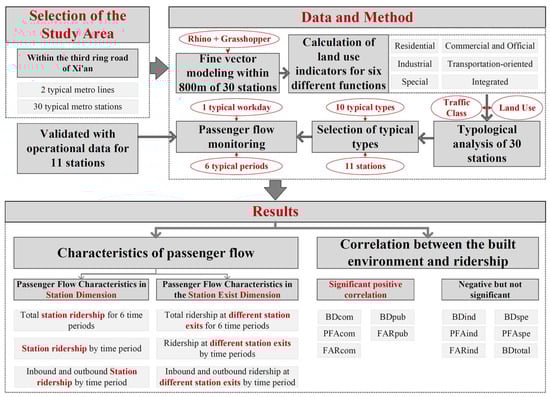
Figure 2.
The analytic flow of this study.
2. Data and Methodology
2.1. Selection of the Study Area and Typical Metro Lines
In this study, the core urban area within the third ring road of Xi’an was selected as the study area, as it has the highest population density and development intensity [31]. At the same time, this area includes the old city within the first ring road, which is controlled through planning protection, as well as the new city outside the first ring road; thus, the different types of built environments in Xi’an are represented.
As typical lines, we selected Line 2 (opened in 2011) and Line 1 (opened in 2013), which were the first to be built in Xi’an. As shown in Figure 1, Line 1 and Line 2 are the north–south express lines in the Xi’an rail transit network. Among all lines, Line 2 has the highest passenger volume and the second highest traffic intensity, while Line 1 has the highest traffic intensity and the third-highest passenger volume [32]. Therefore, we took the 30 stations of these two lines within the third ring road as the study objects.
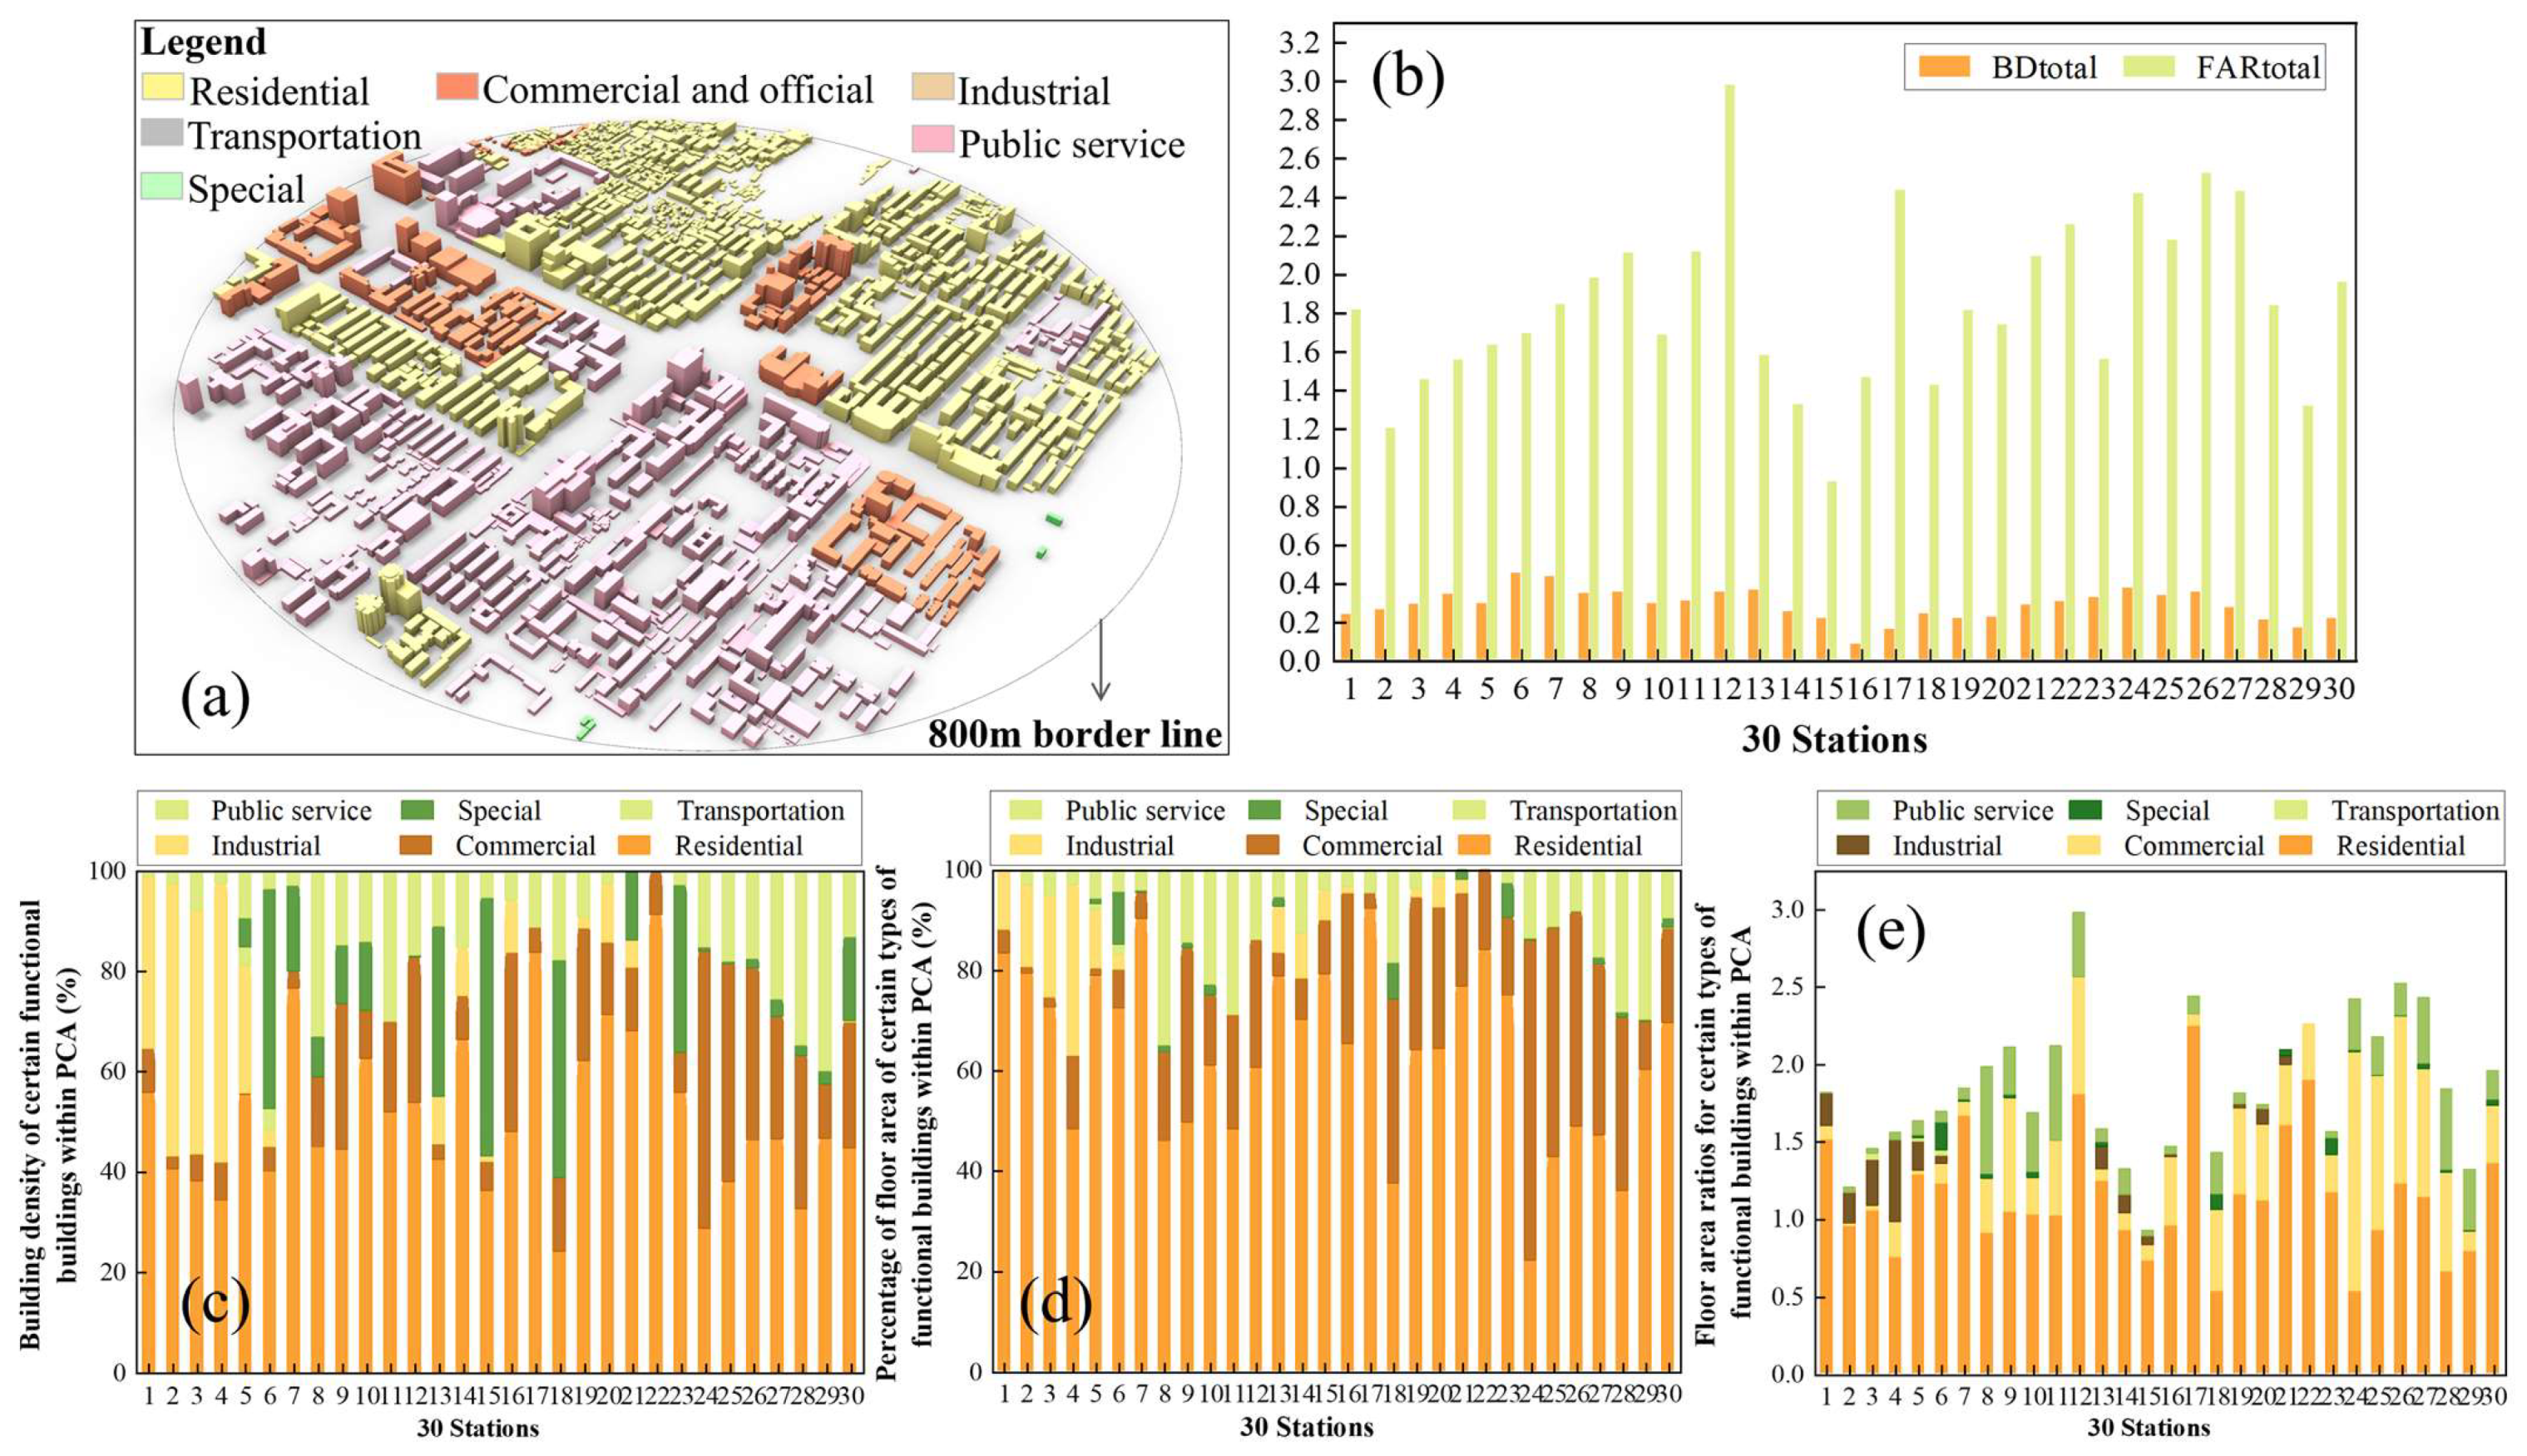
Previous studies have shown that people within the 500–800 m (i.e., those with a life circle accessible within 15 min of walking) CA around a metro station are the main targets of station services [10]. Considering the large scale of neighborhoods in China’s first-tier cities, this study takes an 800 m radius as the CA. Figure 3a shows a vector model of the built environment of a station area, taking the North Street station as an example.

Figure 3.
(a) Fine-scale vector modeling of the built environment in a station’s CA using North Street as an example; indicators of the built environment within the CAs of 30 stations: (b) total building density and total floor area ratio; (c) building densities of certain types of functional buildings; (d) percentage of floor area of certain types of functional buildings; and (e) floor area ratios for certain types of functional buildings.
2.2. Urban Rail Transit Station Classification System
The traffic level and the surrounding urban functional characteristics are the core factors for station classification. In China, the classification methods issued by different government departments focus on a single factor and lack the integrated combination and quantification of these two factors. Therefore, in this study, the two core factors from two government guidelines were extracted to form a new classification system. As shown in Table 1, the station traffic level was based on the Guidelines for the Planning and Design of Areas Along Urban Railways, and according to the built environment of Xi’an, the classifications of special control stations and end stations were removed. The classification based on surrounding urban functions referred to the Guidelines for the Space Planning and Design of Facilities around Urban Rail Transit Stations and was based on the six types of functions in the guidelines; the types of public services were added, and the specific proportions were also determined with reference to the guidelines. Then, the combination of the two factors allowed a division into 28 different types of stations to finally obtain a new classification system for rail transit stations. Traffic levels and building function types have been widely used in existing station classification studies and are suitable for the actual built environments of quickly developing countries.

Table 1.
Urban rail transit station classification system.
2.3. Calculation of Building Functional Indices within Station CAs
Refined vector modeling of the built environment contained in the 800 m CAs of the stations was conducted using Rhino 7 with reference to Google Maps and Street View maps, and the Grasshopper plug-in was used to parameterize the calculation of six different indicators of building functions. The definition and calculation methodology for each indicator are shown in Table 2. Figure 3b–e show the results of calculating the built environment indicators for the 30 stations.
Table 2.
Descriptions and calculations of the indicators for six different building functions.
2.4. Analysis of the Station Typology
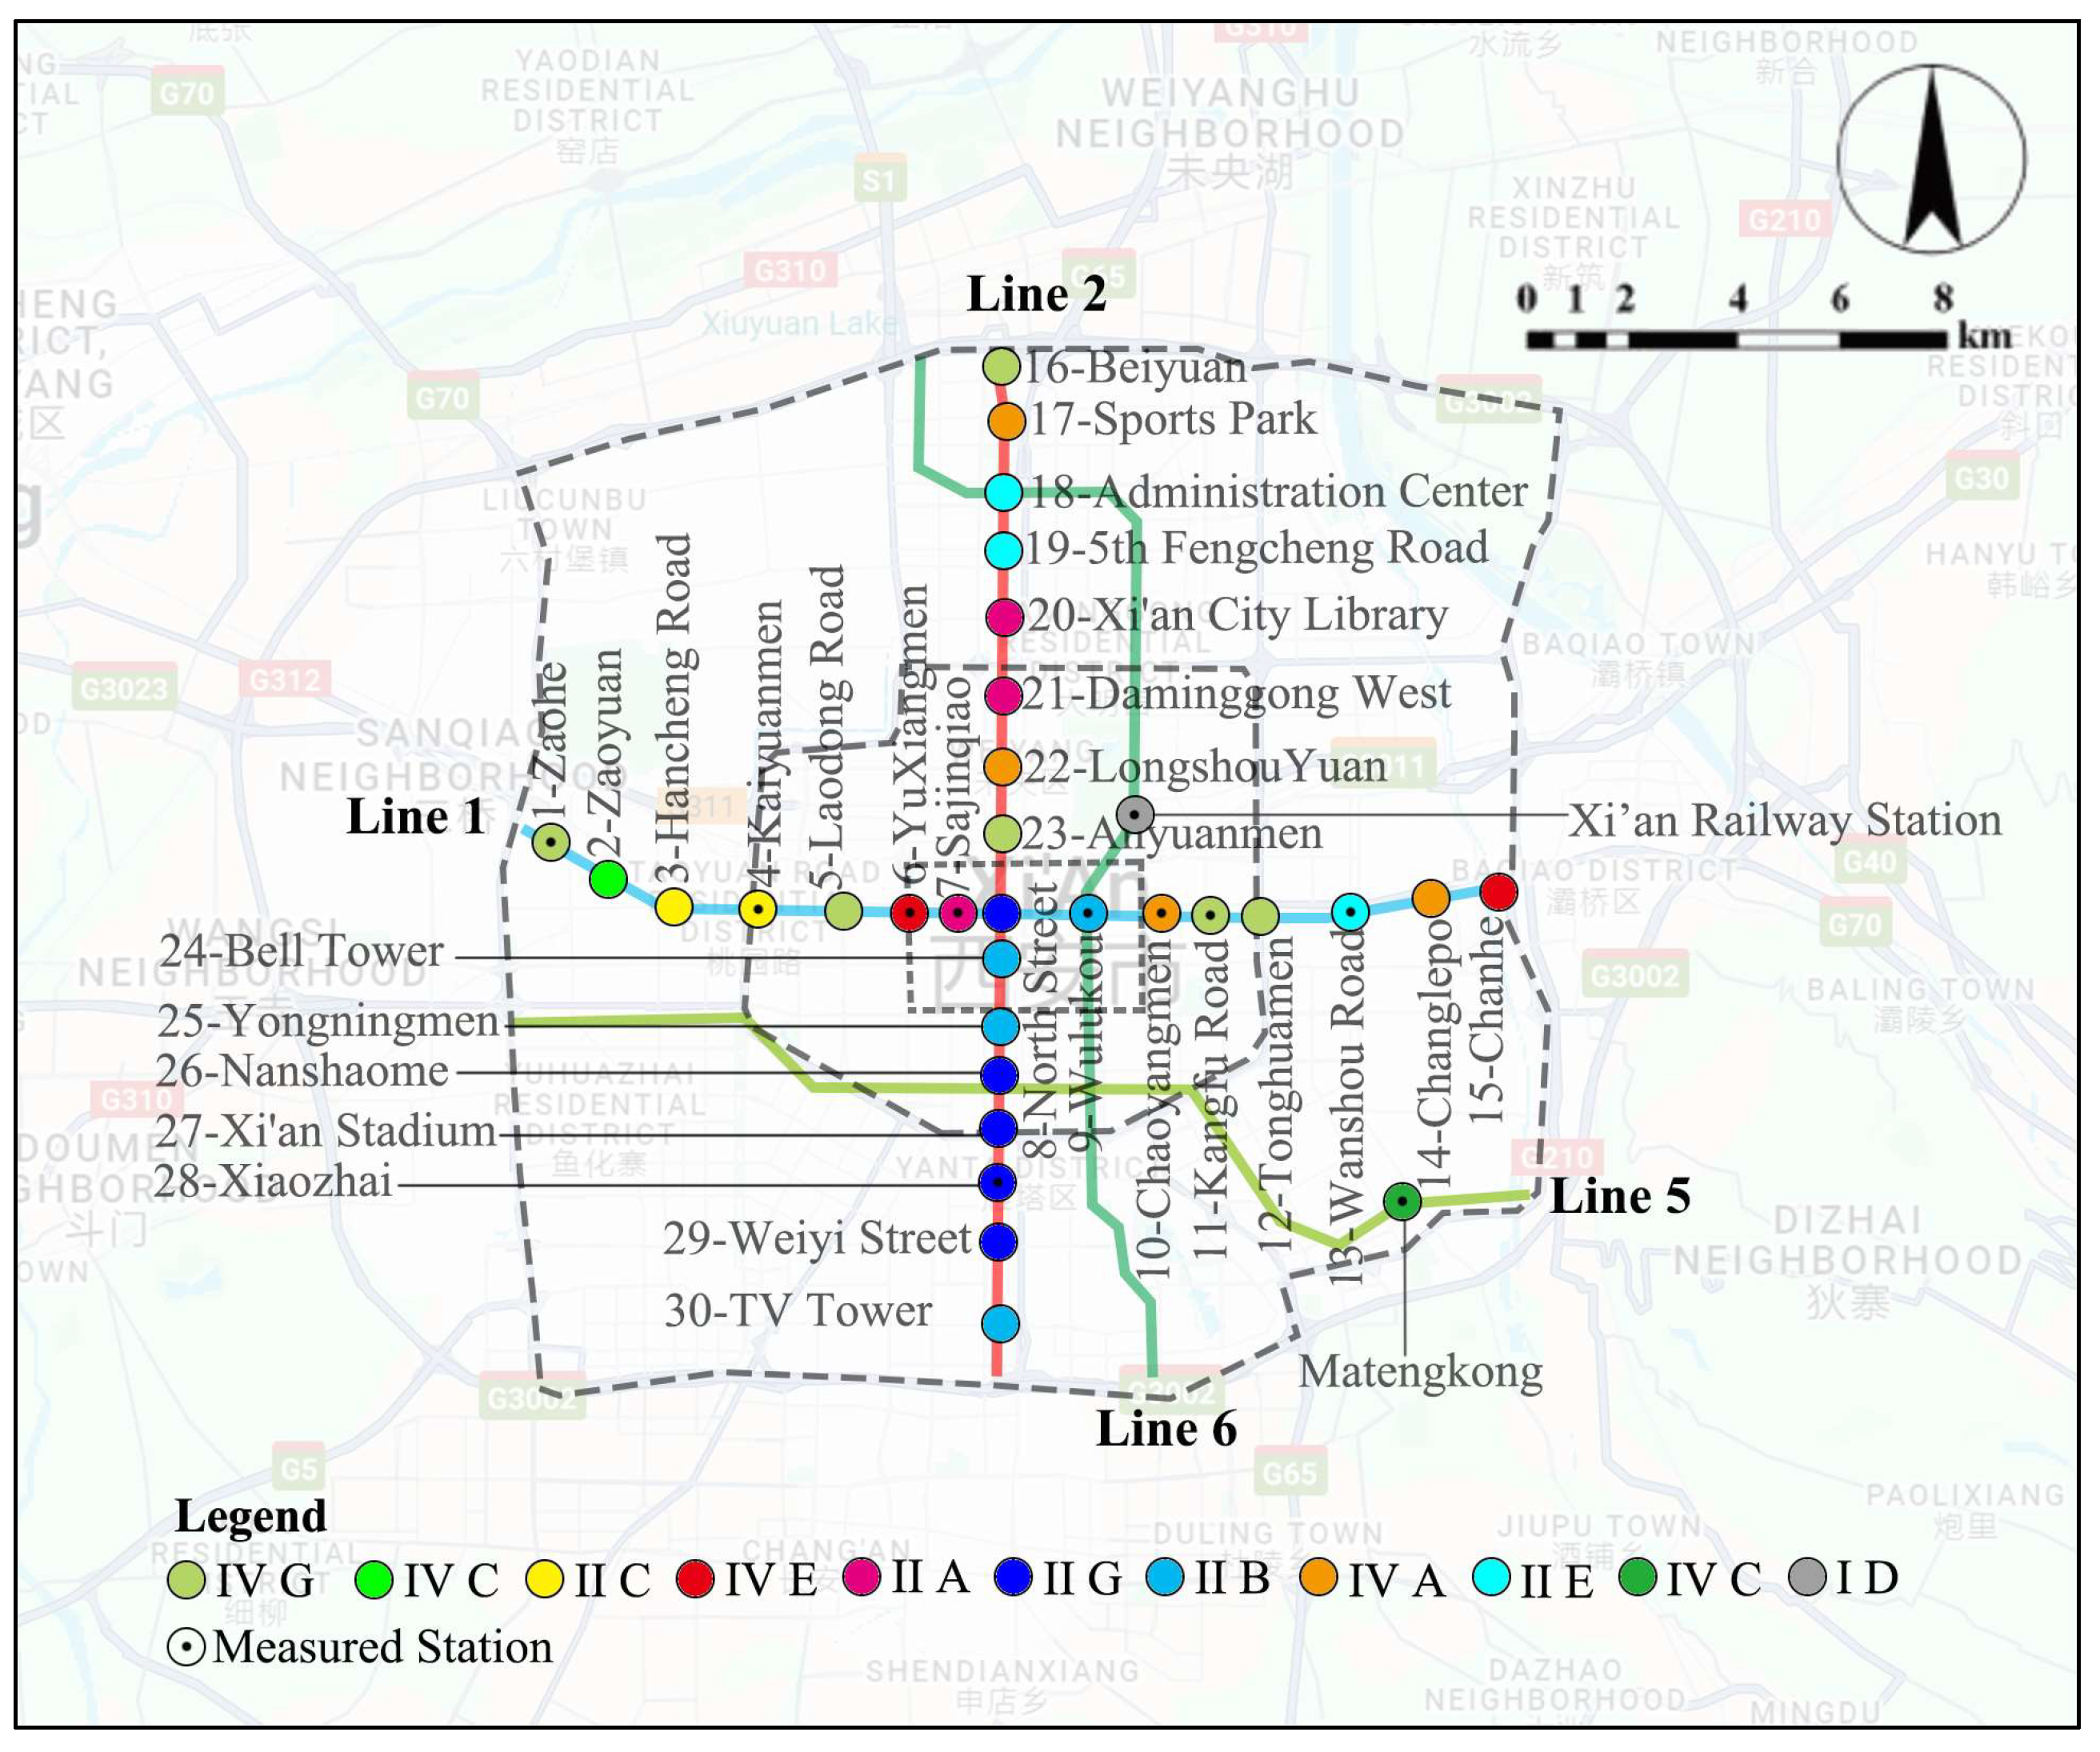
Thirty typical stations were analyzed and classified based on Table 1. The traffic levels of the stations were determined according to the positioning of the city center, sub-center, and cluster in the city master plan, as well as the locations of large-scale external transportation facilities, such as railway stations, high-speed rail stations, and airports. The dominant urban functions of the station CAs were calculated based on Figure 3c. Figure 4 shows the distribution of different types of stations. The results showed that Line 1 and Line 2 mainly contained nine types of stations. In terms of the traffic level, there were more central stations. In terms of urban function, there were many industrial and special stations on Line 1 and more commercial stations on Line 2. Line 1 passed through the east–west traffic arteries of Xi’an and connected many industrial parks and large green areas in the city. Line 2 passed through the north–south axis of Xi’an and connected many commercial districts.
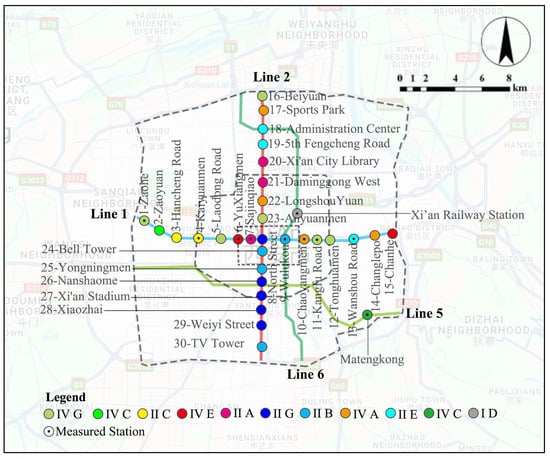
Figure 4.
Results of the typology analysis of the 30 stations of Line 1 and Line 2 within the third ring road and the distribution of the measured stations.
2.5. Passenger Flow Data
We used measured passenger flow data to analyze the characteristics of passenger flow on a typical weekday and validated them using metro operation data.
2.5.1. Field Monitoring of Passenger Flow at Typical Stations
For different types of stations, six different typical time periods on a typical weekday were selected to monitor the flow of passengers through different exits of each station to obtain a typical weekday passenger flow dataset.
- Selection of Typical Stations for Different Types
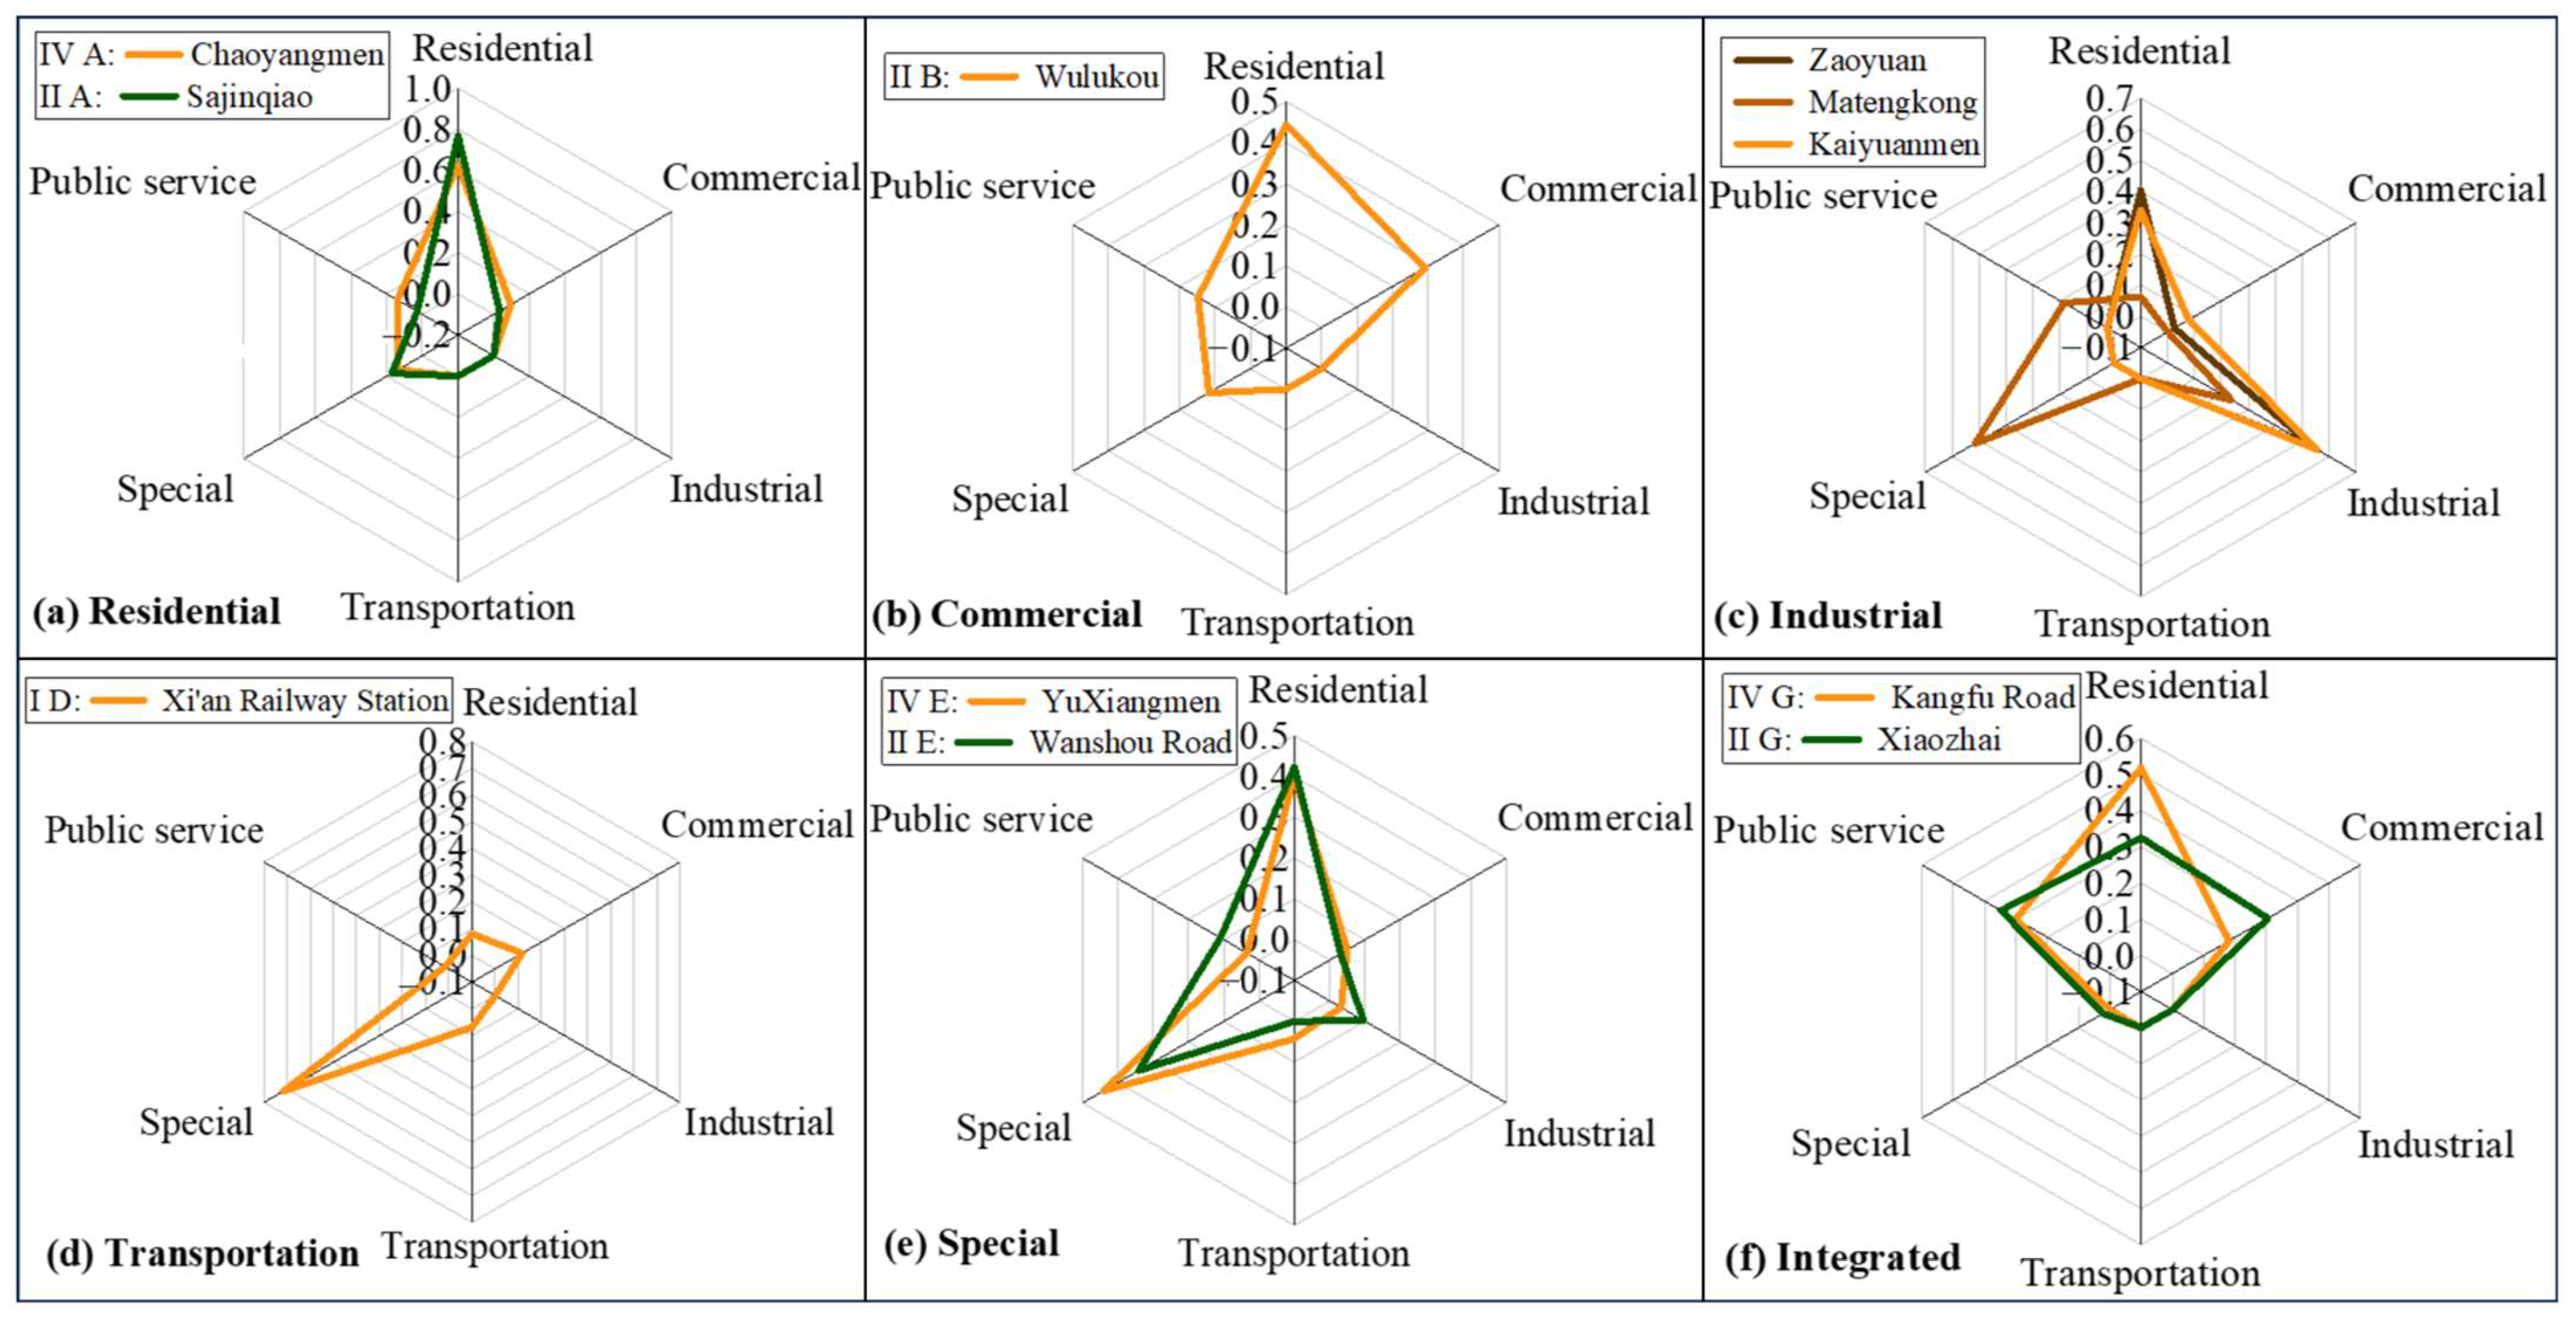
Based on the results of the typology analysis described in Section 2.4, we found that the 15 stations of Line 1 covered nine types, while the 15 stations of Line 2 covered only six types. Therefore, we selected Line 1 as the monitoring object. Notably, in order not to confuse the passenger flow on North Street (of the II G type), where Line 1 and Line 2 intersect, we replaced this station with Xiaozhai (of the II G type), which had the highest passenger flow on Line 2. Meanwhile, Xi’an had four train stations, and we added the hub transportation type (I D), i.e., Xi’an Railway Station, as a supplement. In addition, considering that Line 1 and Line 2 did not have departure stations, we selected Matengkong, the eastern departure station of Line 5 near the boundary of the third ring road, as a supplement for this type. In the end, 11 stations were chosen for monitoring, and the distribution of the measured stations is shown in Figure 4. Figure 5 shows the differences in the built environments of the 11 different types of stations.
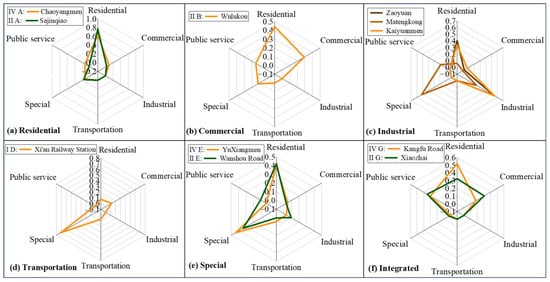
Figure 5.
Radar map of the characteristics of the built environments of the 11 stations: (a) residential; (b) commercial and official; (c) industrial; (d) transportation-oriented; (e) special; and (f) integrated.
- Manual Monitoring of the Passenger Flow
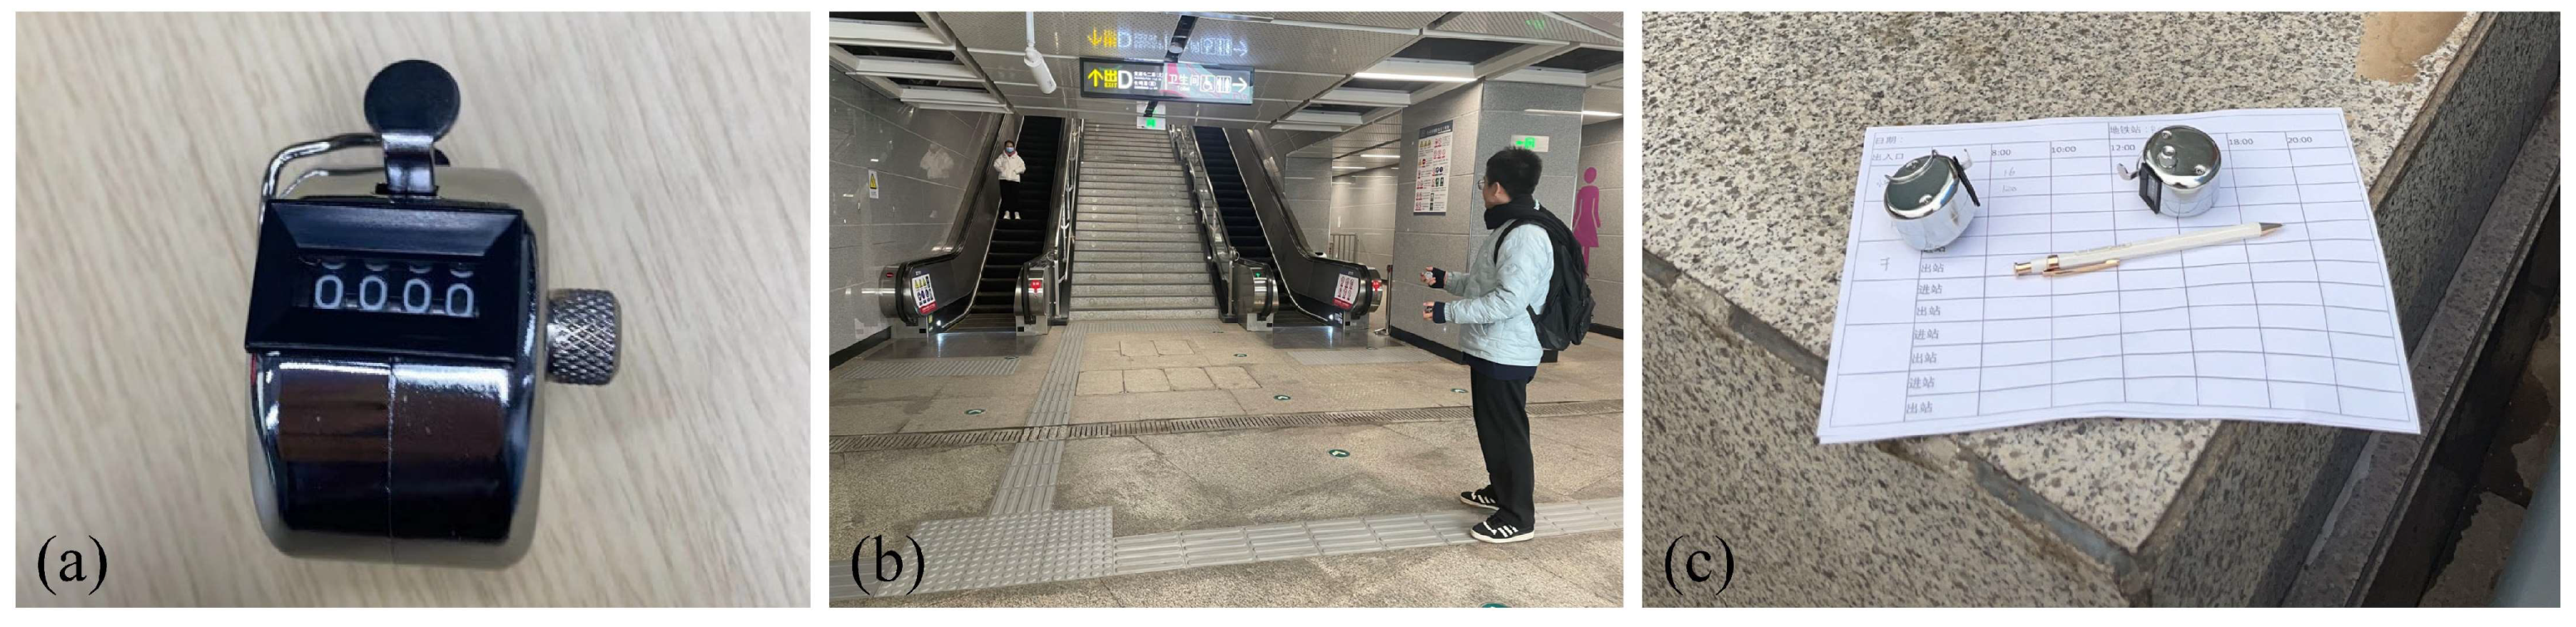
To obtain the passenger flow data at different exits of the stations, manual counting was performed using push counters, as shown in Figure 6. On a typical weekday (Wednesday, 15 February 2023), the number of people entering and exiting the station at each exit was counted at six moments (8:00, 10:00, 12:00, 15:00, 18:00, and 20:00). Each exit was recorded for 5 min. We assumed that the passenger flow in 5 min represented the level of passenger flow in 1 h and normalized the 5 min data to the 1 h passenger flow. One person was positioned at each station during the measurement process, and the measurements were carried out at all stations simultaneously.

Figure 6.
(a) Manual counters; (b) monitoring scenarios; and (c) inbound and outbound numbers were monitored and recorded simultaneously.
- Calculation of the Passenger Flow Indices
The passenger flow indices were divided into two dimensions—stations and exits—and each dimension included three indicators, as shown in Table 3.
Table 3.
Definitions and calculation of the passenger flow indices.
2.5.2. Validation of the Measured Data against Metro Operational Data
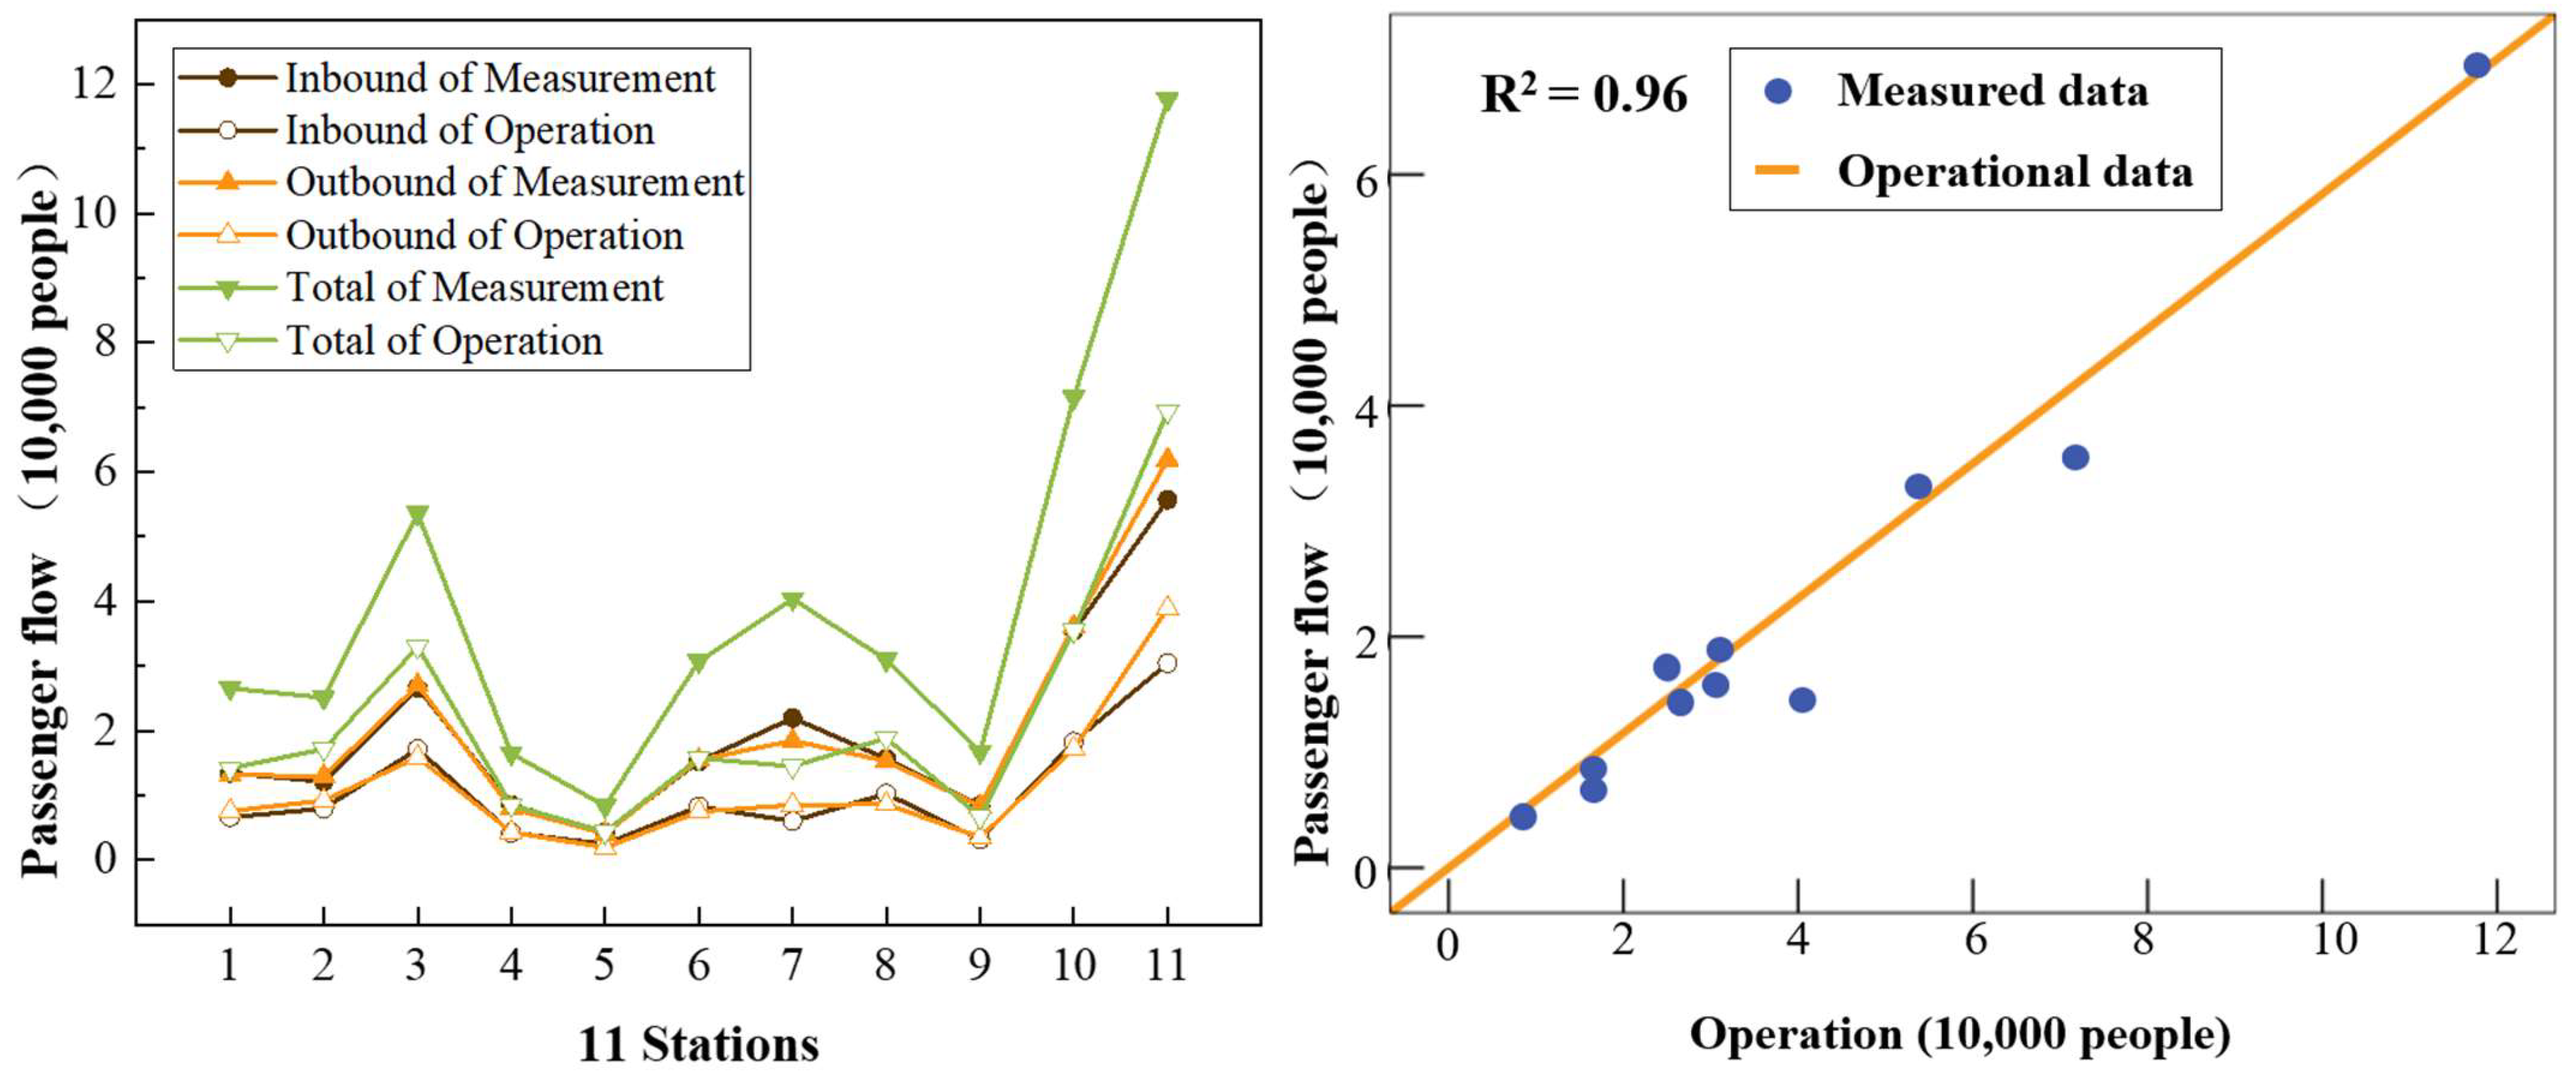
The operational ridership data from 11 stations on a typical weekday (13 December 2023) provided by the official Xi’an Metro were used for verification. The operation data included the daily inbound, outbound, and total passenger flow of the stations, and they excluded the dimensional data of the exits. As shown in Figure 7, the validation results showed that the measured and operational data of the 11 stations were significantly correlated with each other, with an R2 of 0.96. This confirmed the feasibility of the monitoring method and the accuracy of the measured passenger flow data.
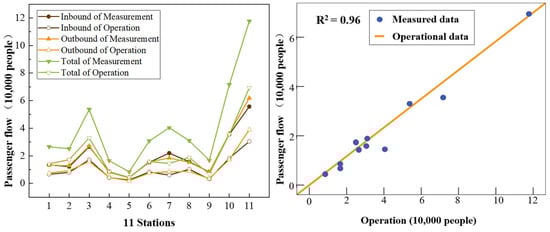
Figure 7.
Validation of the measured data against metro operational data.
3. Results
3.1. Passenger Flow Characteristics of Different Types of Stations
3.1.1. Passenger Flow Characteristics in the Station Dimension
The passenger flow characteristics of the stations were analyzed from three perspectives: total station ridership for six periods, station ridership in each different period, and inbound/outbound flow in the station in each different period.
- Total Station Ridership for Six Periods
Based on the different traffic levels and building functions, the total station ridership for six periods was analyzed. Figure 8a shows the results with the traffic level as the classification factor. The average total station ridership for six periods for the four stations that were classified as central stations was the highest (31,551); those of general stations (16,176) and hub stations (14,496) were close to each other. Xi’an Railway Station, as an urban railroad hub station, did not have a high passenger flow. This suggested that a high-level hub connecting with the city’s external transportation did not necessarily generate significant intra-city transfer traffic. Figure 8b shows the results when using building functions as the classification factor. The results showed that integrated (52,422) and commercial stations (33,000) had significantly greater values than those of other types; those of residential (15,660) and transportation-oriented stations (14,496) were normal, and those of special (12,750) and industrial stations (9532) were lower than those of the other types. This indicated that integrated functions, such as commercial and office functions, are the core functions that attract passengers.
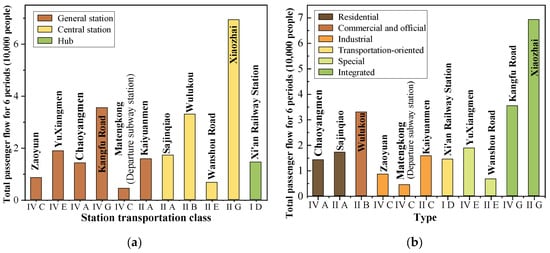
Figure 8.
The total station ridership for six periods with different classification factors: (a) traffic levels and (b) building functions.
- Station Ridership in Each Different Period
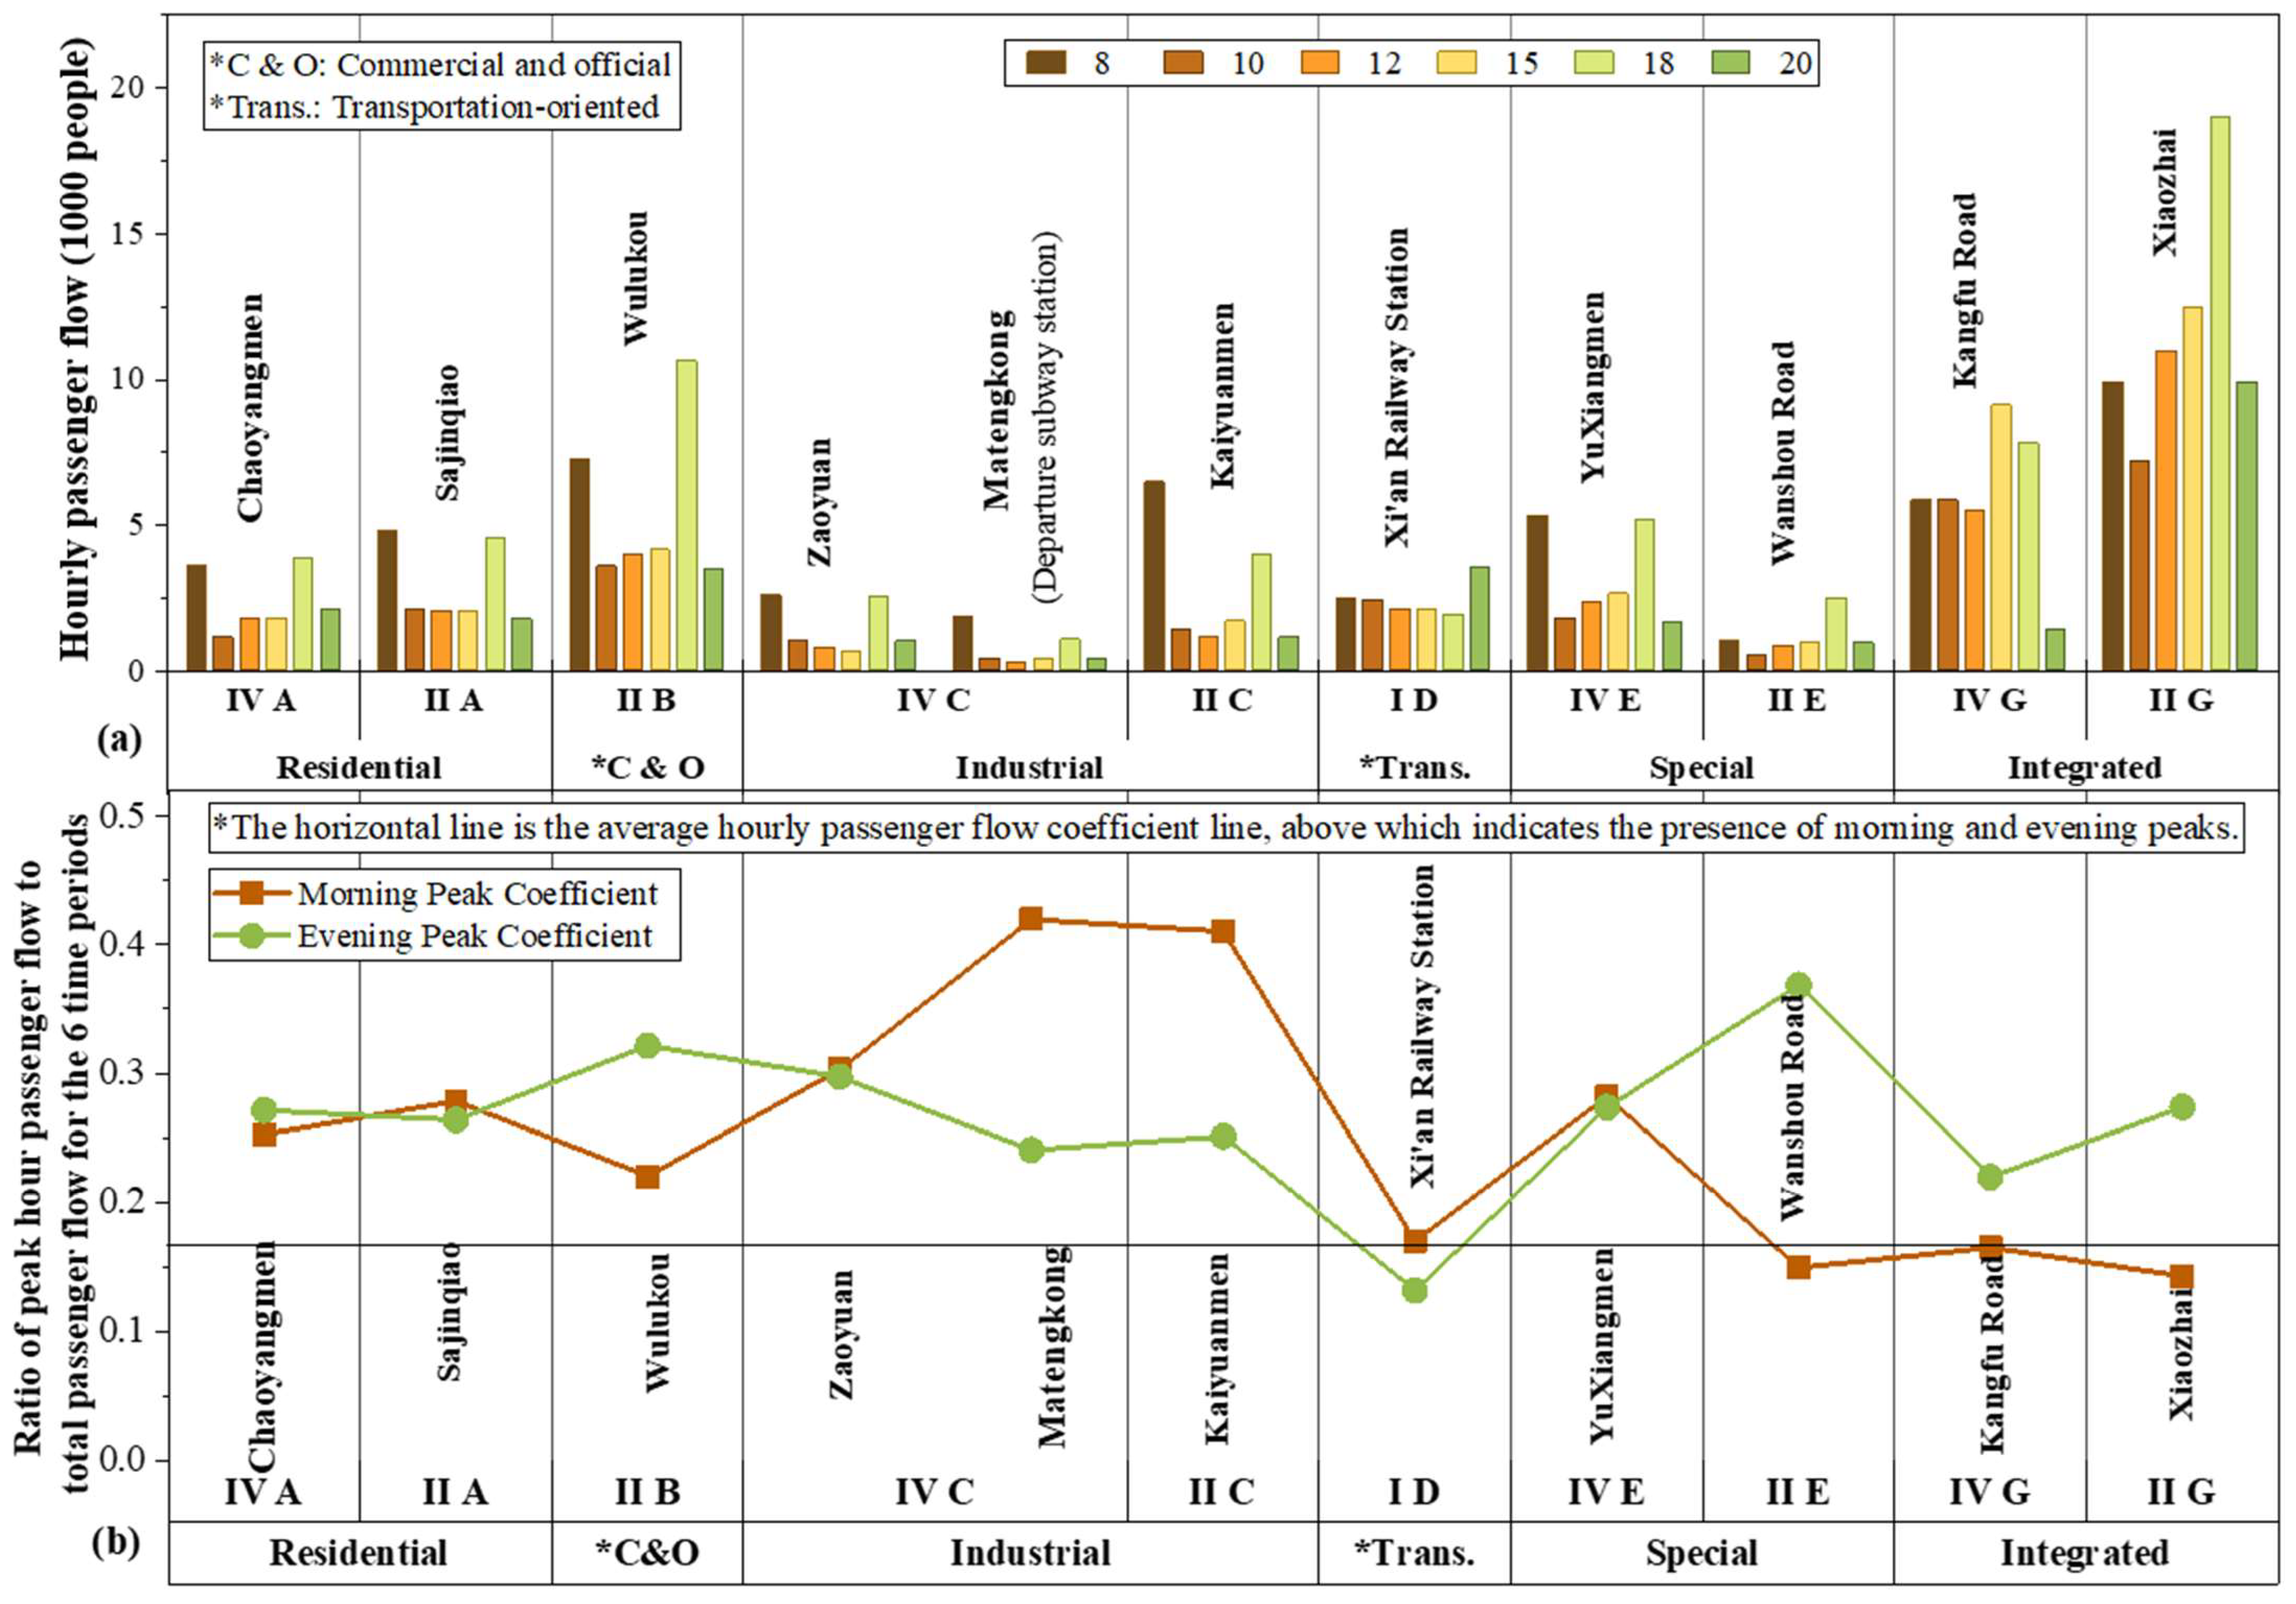
Figure 9a shows that there were significant differences in both the station ridership and the morning and evening peak characteristics for the different functional types. Figure 9b demonstrates the morning and evening peak coefficients of each station, with only evening peaks and no morning peaks for the integrated type; there was no bimodal phenomenon for the I D type, and double peaks were found at 8:00 and 18:00 for all the other types of stations. Overall, the morning peak was stronger than the evening peak, with the range of the morning peak coefficients being 0.14–0.42 and the range of the evening peak coefficients being 0.13–0.37. The specific characteristics of the different types of stations were as follows.
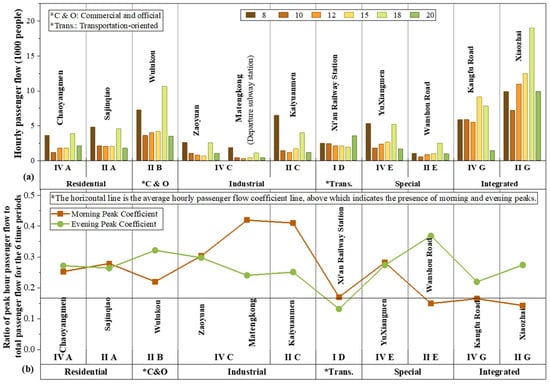
Figure 9.
(a) Station ridership in each different period for the 11 stations; (b) morning and evening peak coefficients for the 11 stations.
- (1)
- Residential: Both types of residential stations had a moderate passenger flow and bimodal peak intensity. There were significant morning and evening peaks, and the bimodal intensity was close, with an average peak coefficient of 0.27.
- (2)
- Commercial and official: The commercial type had a large flow of passengers; there were morning and evening peaks, and the evening peak was significantly stronger than the morning peak; the evening peak coefficient was 0.32, and it was ranked second among those of all the types.
- (3)
- Industrial: The industrial type had the lowest passenger flow, but the morning and evening peaks were the most significant. For the two stations of type IV C, the terminal Matengkong embodied a significant difference; the terminal’s morning peak was significantly higher than the evening peak, and the morning peak coefficient was the highest among all of the types at 0.42. In addition, the characteristics of the changes in different time periods for the industrial type were similar to those for the residential type, but the off-peak passenger flow was significantly lower than that of the residential types.
- (4)
- Transportation-oriented: The transportation-oriented type did not have morning and evening peaks, but the passenger flow was significantly higher at 20:00, which may have been influenced by the fact that external transportation, such as urban railroads, has more arrivals in the evening.
- (5)
- Special: The two special types reflected uncertainty in both passenger flow and morning and evening peak intensities, with IV E having a large passenger flow and the morning and evening peak intensities being close to one another; IIE had a small passenger flow with only significant evening peaks; and the highest evening peak coefficient of all types of stations was 0.37. The rest of the hours had strong heterogeneity in passenger flow.
- (6)
- Integrated: The integrated type had the highest passenger flow, with only significant evening peaks and a low evening peak intensity, and the average coefficient was 0.25. In addition, the passenger flow showed a gradual increase from 8:00 to 18:00, and it significantly decreased at 20:00.
- Inbound/Outbound Flows of Stations in Each Different Period
Figure 10 shows the spatial and temporal distribution characteristics of inbound and outbound flows at each station during the six time periods.
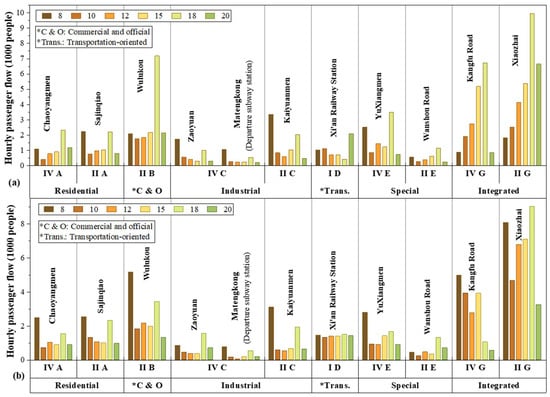
Figure 10.
Distribution of flows in each different period for the 11 stations: (a) inbound and (b) outbound.
- (1)
- Residential: There was a bimodal phenomenon for both inbound and outbound flows, but the intensity was different. IV A had a morning peak for outbound flows and an evening peak for inbound flows. This was not a typical characteristic of residential stations. This may have been because the employed population did not live on the residential land in the area of station IV A, thus resulting in the phenomenon of an imbalance between occupations and residences. II A had similar intensities for the inbound and outbound peaks in the morning and the evening, which also reflected a certain degree of imbalance between jobs and housing.
- (2)
- Commercial and official: The inbound flow only had an evening peak, and the outbound flow’s morning peak was stronger than the evening peak, which is a typical characteristic of employment-oriented access. This indicated that there were more employment flows out of the station during the morning peak, and attention should be paid to controlling the outbound flows during the morning peak and the inbound flows during the evening peak.
- (3)
- Industrial: Although the three stations had significant differences in passenger flow, they all had significant morning and evening peaks. For IV C, the terminal station Matengkong had the lowest passenger flow, and the intensity of the morning and evening peaks was close to that of IV C. II C had the highest passenger flow, and the inbound and outbound peaks were significantly stronger than the evening peaks.
- (4)
- Transportation-oriented: The outbound flow was significantly larger than the inbound flow throughout the day, and the outbound flow was close to the same at all times. There was a night peak for inbound flows at 20:00, which may have been due to the external traffic brought by the railroad being more concentrated in the evening; this part of the passenger flow through the station to transfer to the city’s internal traffic was larger. Therefore, for hub-type stations, the transfer passenger flow from external traffic to internal traffic should be controlled at 20:00, which is the peak hour in the evening.
- (5)
- Special type: For inbound flows, the evening peak was more significant than the morning peak. For outbound flows, the morning peak was more significant than the evening peak. This was a significant characteristic of employment-oriented traffic. This was caused by the greater number of land uses attracting employment in this type of area.
- (6)
- Integrated: The outbound flows had a double morning and evening peak, while the inbound flows had only an evening peak, and the evening peak occurred earlier. This was characterized by employment-oriented passenger flows. In comparison with the special and commercial and official types, this type had no morning peaks in the inbound flows, and the double-peak phenomenon occurred in the outbound flows. This indicated that this type was characterized by a high proportion of commercial and other public service functions, with the morning peak attracting employment and the evening peak attracting consumers.
3.1.2. Passenger Flow Characteristics in the Exit Dimension
The passenger flow characteristics of the exits were analyzed from three perspectives: total ridership at exits in six periods, total ridership at exits in each different period, and inbound/outbound flow at exits in each different period.
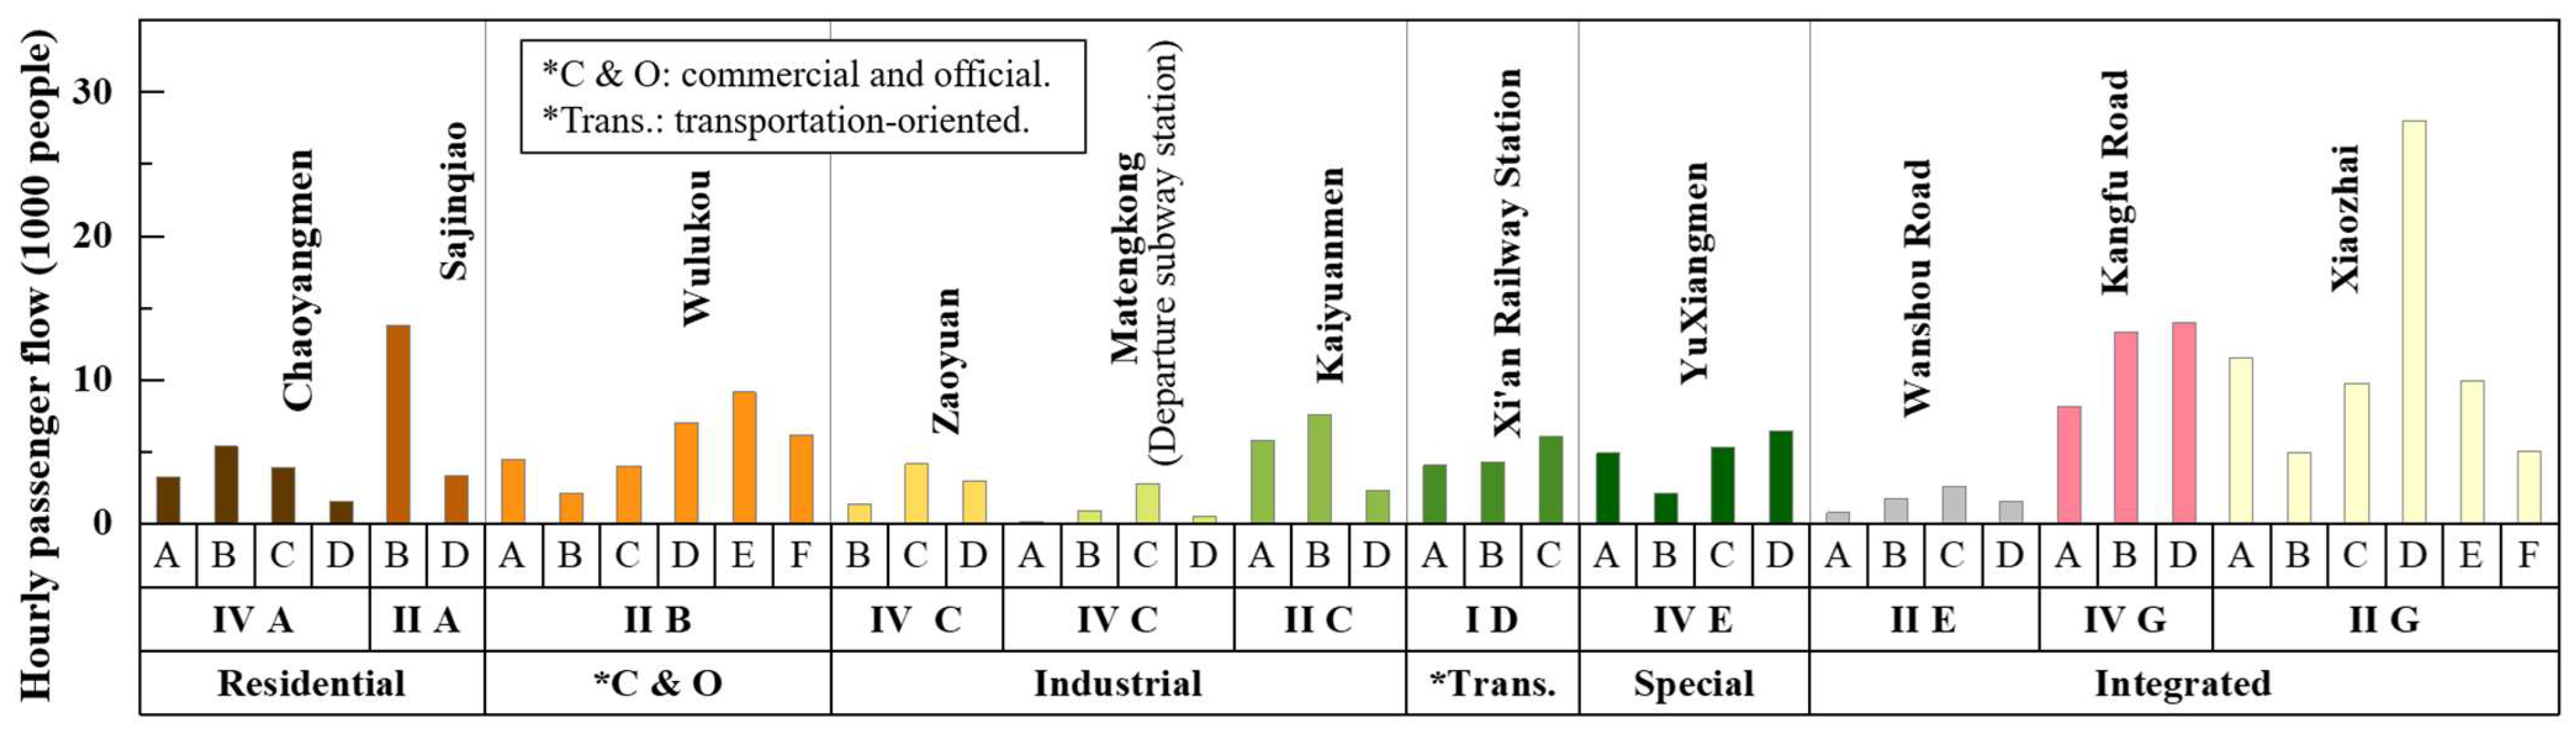
- Total Ridership at Different Exits in Six Periods
Figure 11 illustrates the total ridership at the different exits in six periods. Except for type I D, there was a significant difference in the passenger flows of the different exits of the other nine types. II A and II G both had one exit with significantly higher passenger flows than the other exits of the station, which was due to the fact that exit B of Sajinqiao was directly connected to a pedestrian commercial area and exit D of Xiaozhai was directly connected to the largest commercial complex in Xi’an; thus, the phenomenon of significantly higher passenger flows occurred at these two exits.
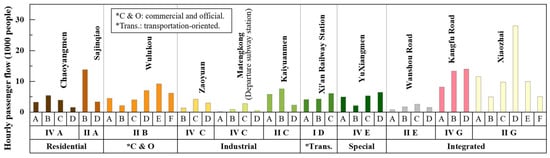
Figure 11.
Total ridership at different exits in six periods.
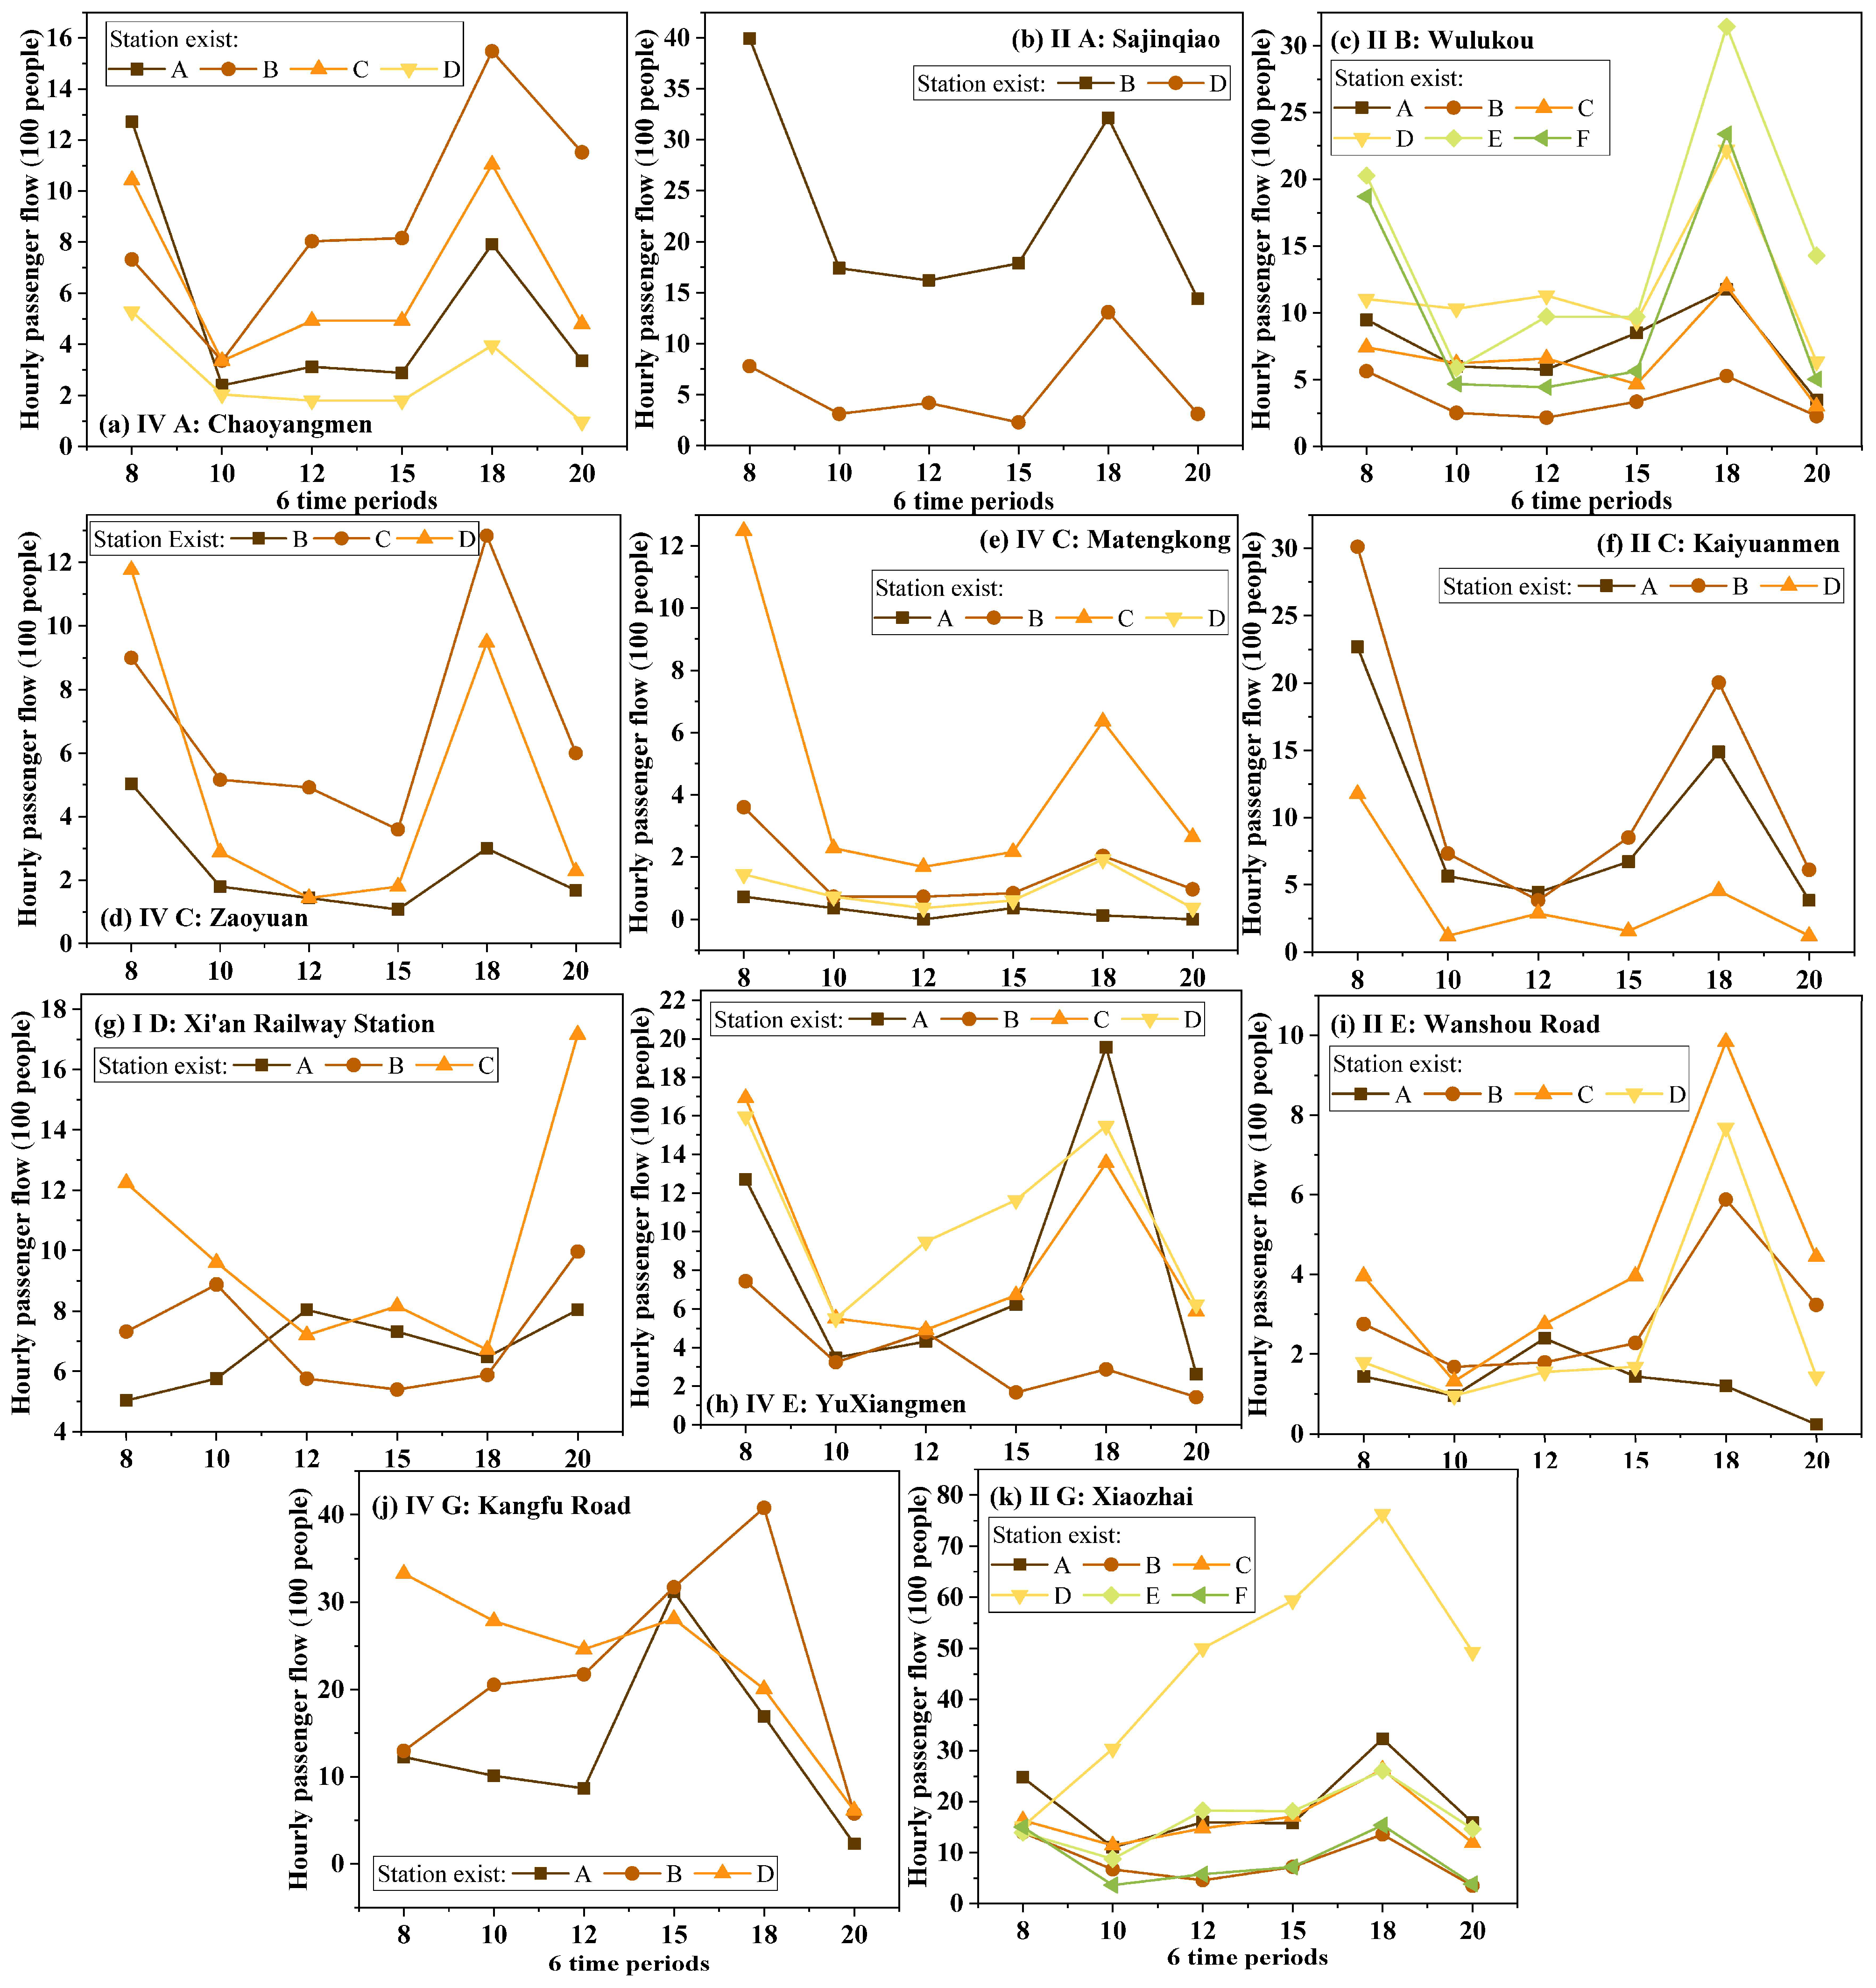
- Total Ridership at Exits in Each Different Period
Figure 12 shows that the spatiotemporal characteristics of the passenger flows at different exits of different types of stations showed significant differences.
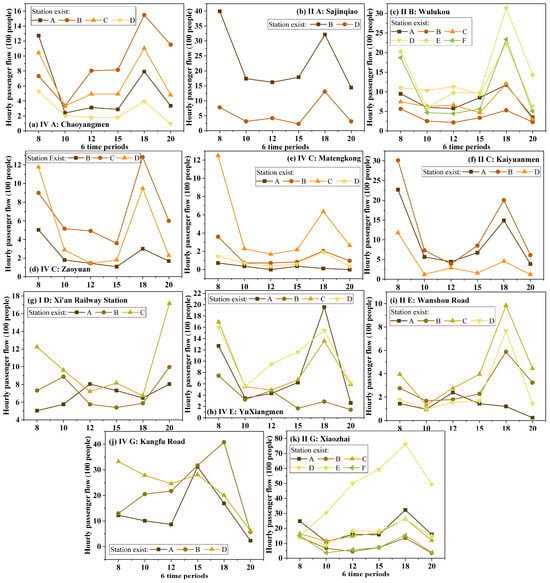
Figure 12.
Total ridership at different exits in each different period for the 11 stations.
- (1)
- Residential: Although there were significant differences in the passenger flows at each exit of the two types, the spatial and temporal characteristics were close to each other, and there were significant morning and evening peaks at each exit.
- (2)
- Commercial and official: There were significant differences in the total passenger flows and the spatiotemporal characteristics of the exits. There was significant bimodality in the morning and evening at only two exits, non-significant bimodal characteristics at three exits, and significant evening peaks at only one exit. This was due to the different land-use functions of the parcels of land connected to the exits. In addition, although Figure 9 shows that the evening peak was stronger than the morning peak in the station dimension, there were still certain exits (B) where the morning peak was stronger than the evening peak.
- (3)
- Industrial: There were significant differences in the total passenger flows at each exit, but the spatiotemporal characteristics were close to each other, with significant bimodal phenomena at all exists. This was similar to the findings for the residential type, but the passenger flows in off-peak hours were significantly lower than those of the residential type. Notably, the departure station Matengkong had uneven passenger flows at all exits, with one exit having significantly high passenger flows and a great intensity of morning and evening peaks. This can be managed operationally by guiding passenger flows to relieve congested exits. The morning and evening peaks at IV C (Zaoyuan) were close, and the intensity of the morning peak was stronger than that of the evening peak at all exits in II C (Kaiyuanmen).
- (4)
- Transportation-oriented: Although the station ridership was close in each period (Figure 9), there was a significant difference in the spatiotemporal characteristics of the morning and evening peaks at each exit.
- (5)
- Special: The overall spatiotemporal characteristics of the two types of passenger flows were close to each other, and there were morning and evening peaks at each exit, but the evening peak of the II E type was stronger than the morning peak, and the intensities of the morning and evening peaks of the IV E type were close to each other. Both types had individual exits with significantly lower passenger flows and insignificant bimodal phenomena.
- (6)
- Integrated: The passenger flow characteristics of the IV G and II G types were close in the station dimension, but there were significant differences in the exit dimension. There were significant differences in the spatiotemporal characteristics of all the exits of the IV G type, and the morning and evening peak characteristics were different. The passenger flows and spatiotemporal characteristics of the II G type were close to each other at all exits except for exit D, which was directly connected to a commercial complex in Xiaozhai. This suggests that for integrated stations, the focus should be on controlling exits that connect to large commercial facilities.
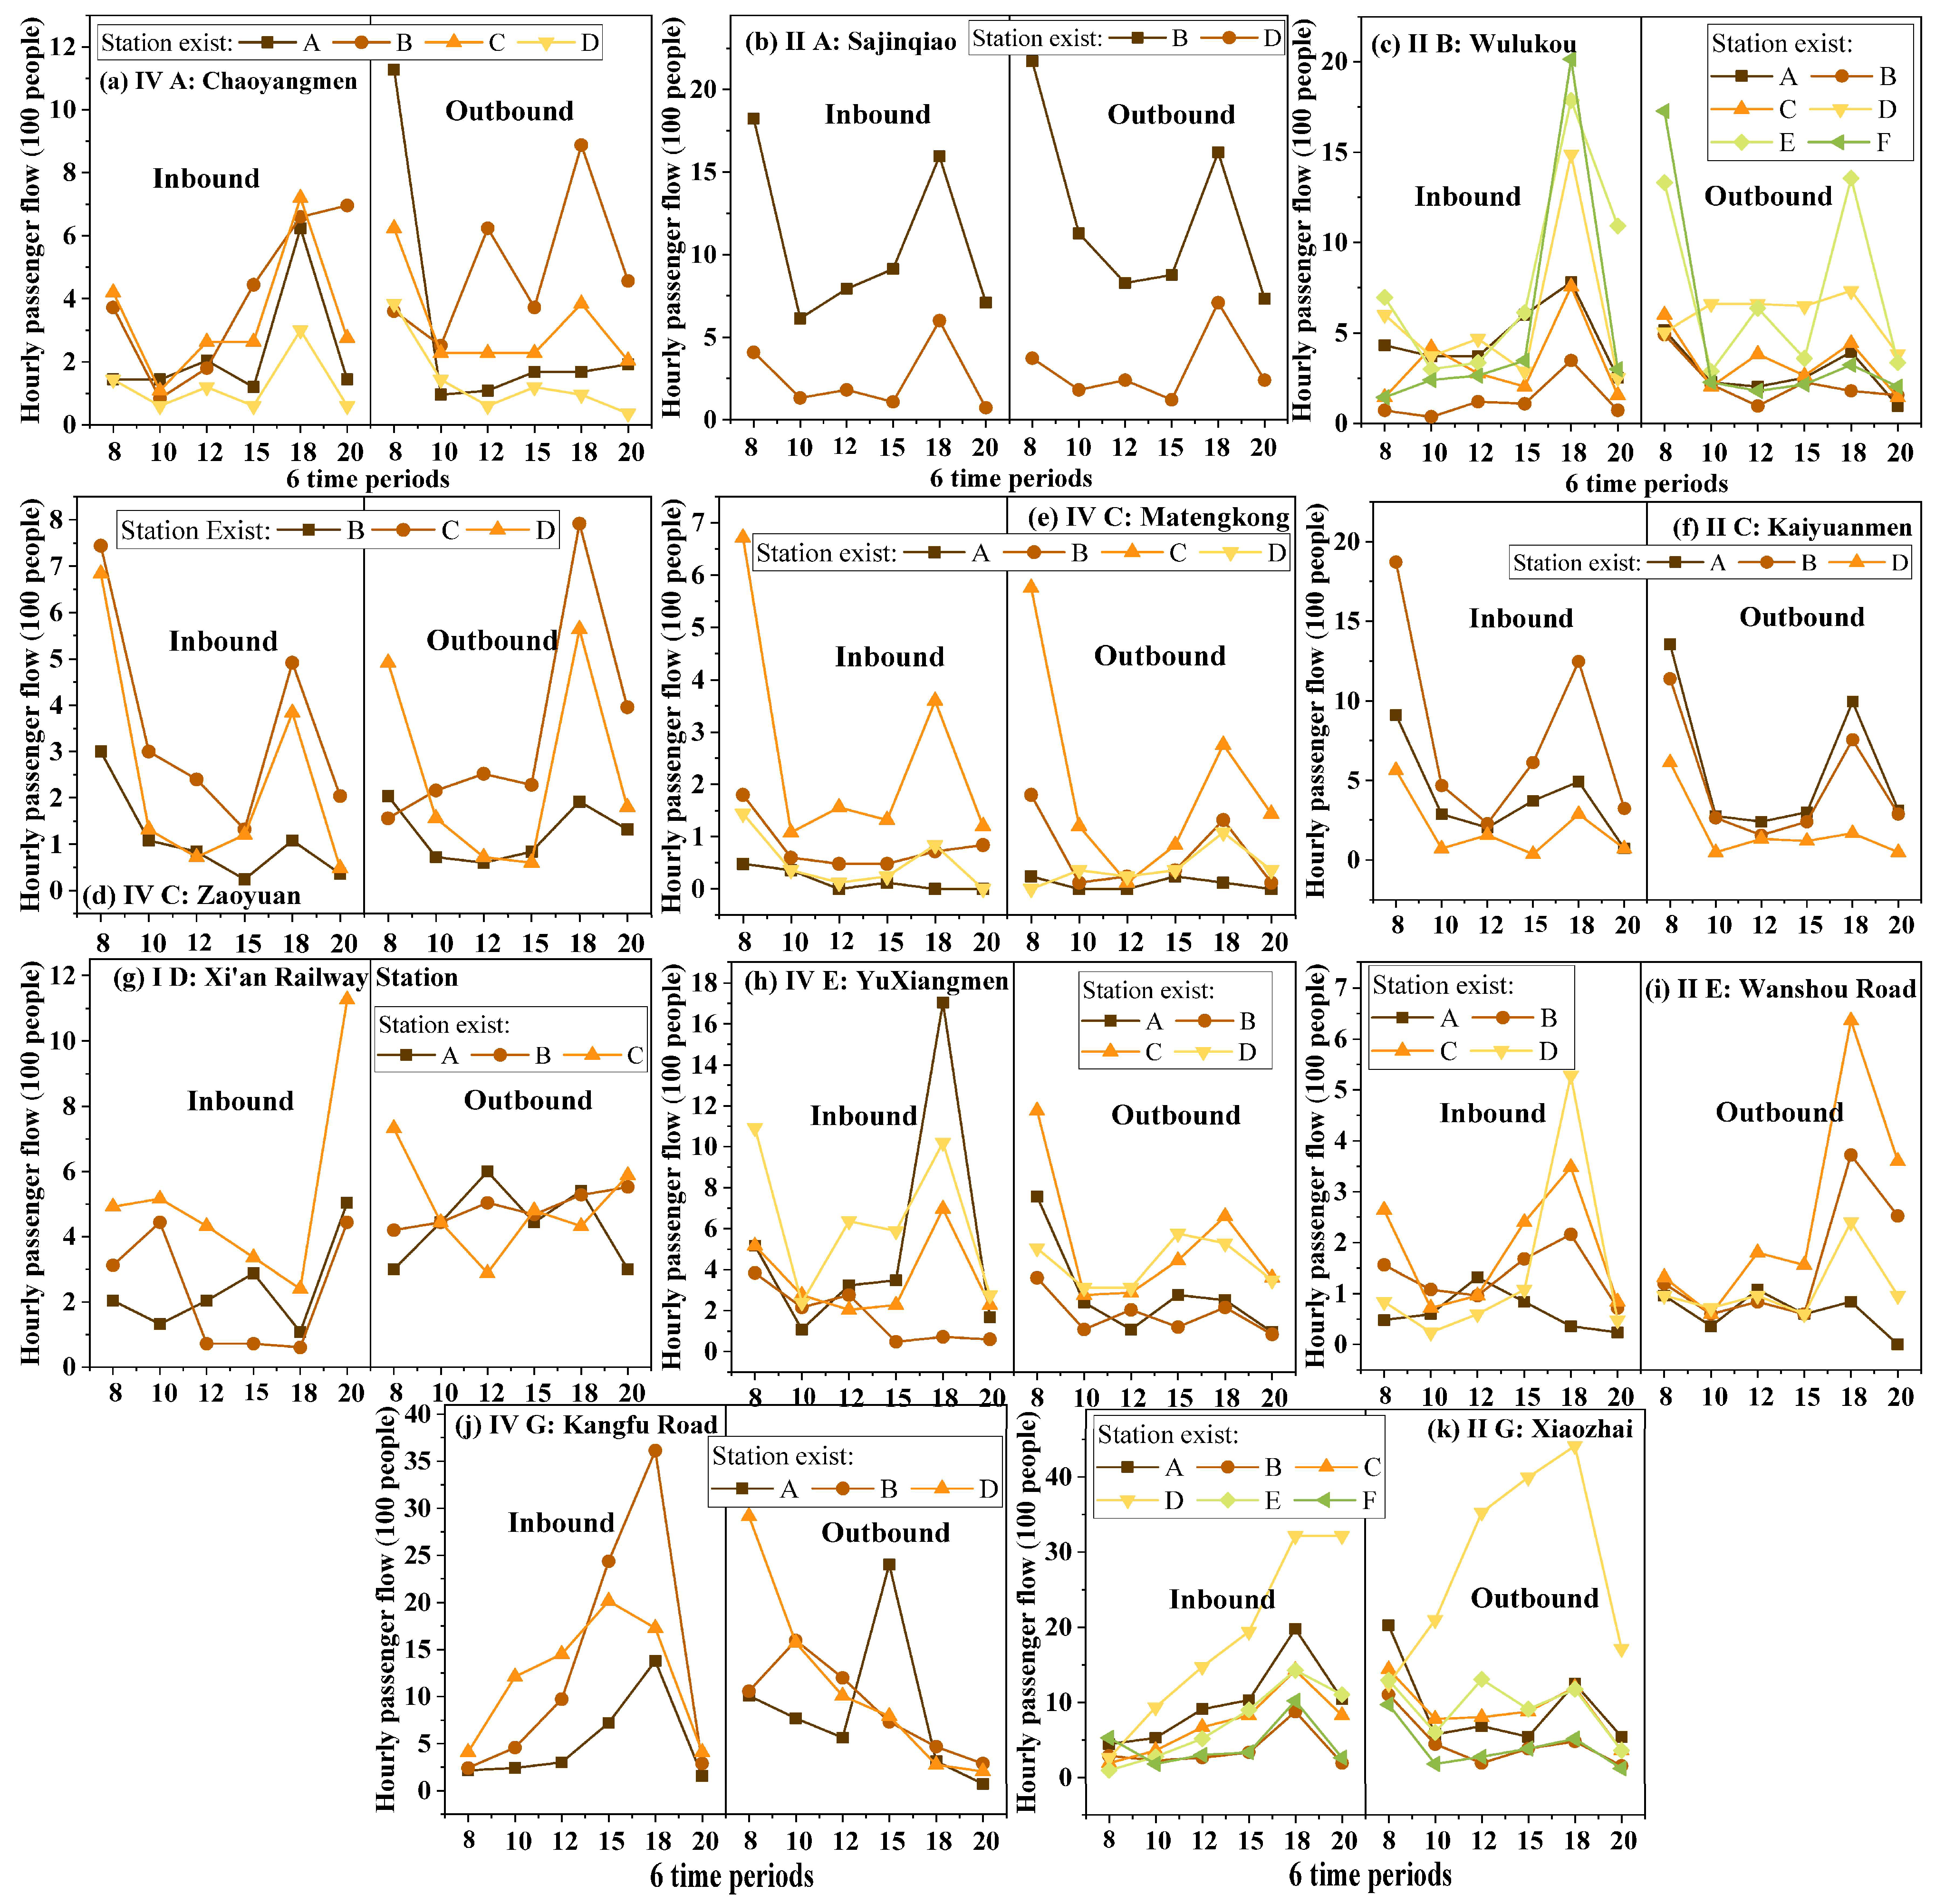
- Inbound/Outbound Flows at Exits in Each Different Period
Figure 13 demonstrates the spatiotemporal characteristics of the inbound and outbound flows for different types of stations in the exit dimension in the six time periods.
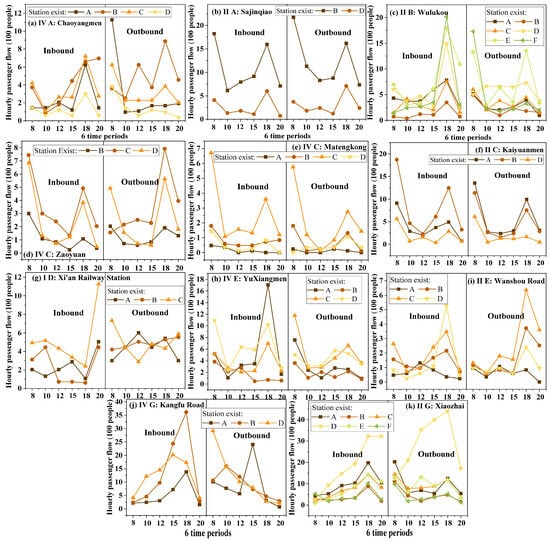
Figure 13.
Inbound/outbound flows at different exits in each different period.
- (1)
- Residential: There were significant differences between the two types. The inbound flows in the IV A type were more significant at the evening peak at all exits, which was consistent with the station dimension shown in Figure 10. However, there was uncertainty in the outbound flow, and the evening peak was stronger than the morning peak at exit B for the outbound flow. The remaining three exits were consistent with the station dimension shown in Figure 10, with the morning peak being stronger than the evening peak. For II A, there were significant differences in the two exits, with the morning peak being stronger than the evening peak at exit B and the opposite at exit D, which was different from the station dimension shown in Figure 10.
- (2)
- Commercial and official: All exits had stronger evening peaks than morning peaks for inbound flows, and there were complexities and uncertainties in the outbound flow. Exits A, B, and C had lower traffic and stronger morning peaks than evening peaks. Exit D had close outbound traffic in all time periods. Exit E had close morning and evening peaks, and F had only morning peaks. This indicated that the building functions connected to different exits had a significant impact on passenger flows, and management needs to pay attention to the key exits.
- (3)
- Industrial: Three stations were close to each other in terms of the morning and evening peaks at all exits. II C was the most stable, with the morning peaks being stronger than the evening peaks at all exits, and there was uncertainty in the morning and evening peaks at all exits in IV C.
- (4)
- Transportation-oriented: Compared with the other types, this type had the most significant difference in passenger flow characteristics among the exits. Only one exit had an inbound evening peak at 20:00. The inbound and outbound flows of each exit were close to each other, and management needs to implement control at 20:00 in the evening.
- (5)
- Special: The inbound peaks of IV E were uncertain, but the outbound peaks were stronger than the evening peaks. The outbound peaks of IIE had the same spatiotemporal characteristics, and there was only a significant evening peak. There was uncertainty in the morning and evening peak characteristics at all inbound exits.
- (6)
- Integrated: The spatiotemporal characteristics of the inbound flows of the two types were close, and only significant evening peaks were manifested for inbound flows. However, for the outbound flows, there were significant morning peaks at two exits and only evening peaks at one exit at IV G. There was a significant evening peak at the exit that directly connected to a commercial complex at II G, and the remaining five exits exhibited stronger morning than evening peaks, which was the opposite of what is shown in Figure 12. This suggested that the multiple connections of integrated stations to commercial complexes have a significant impact on the overall passenger flow at these stations.
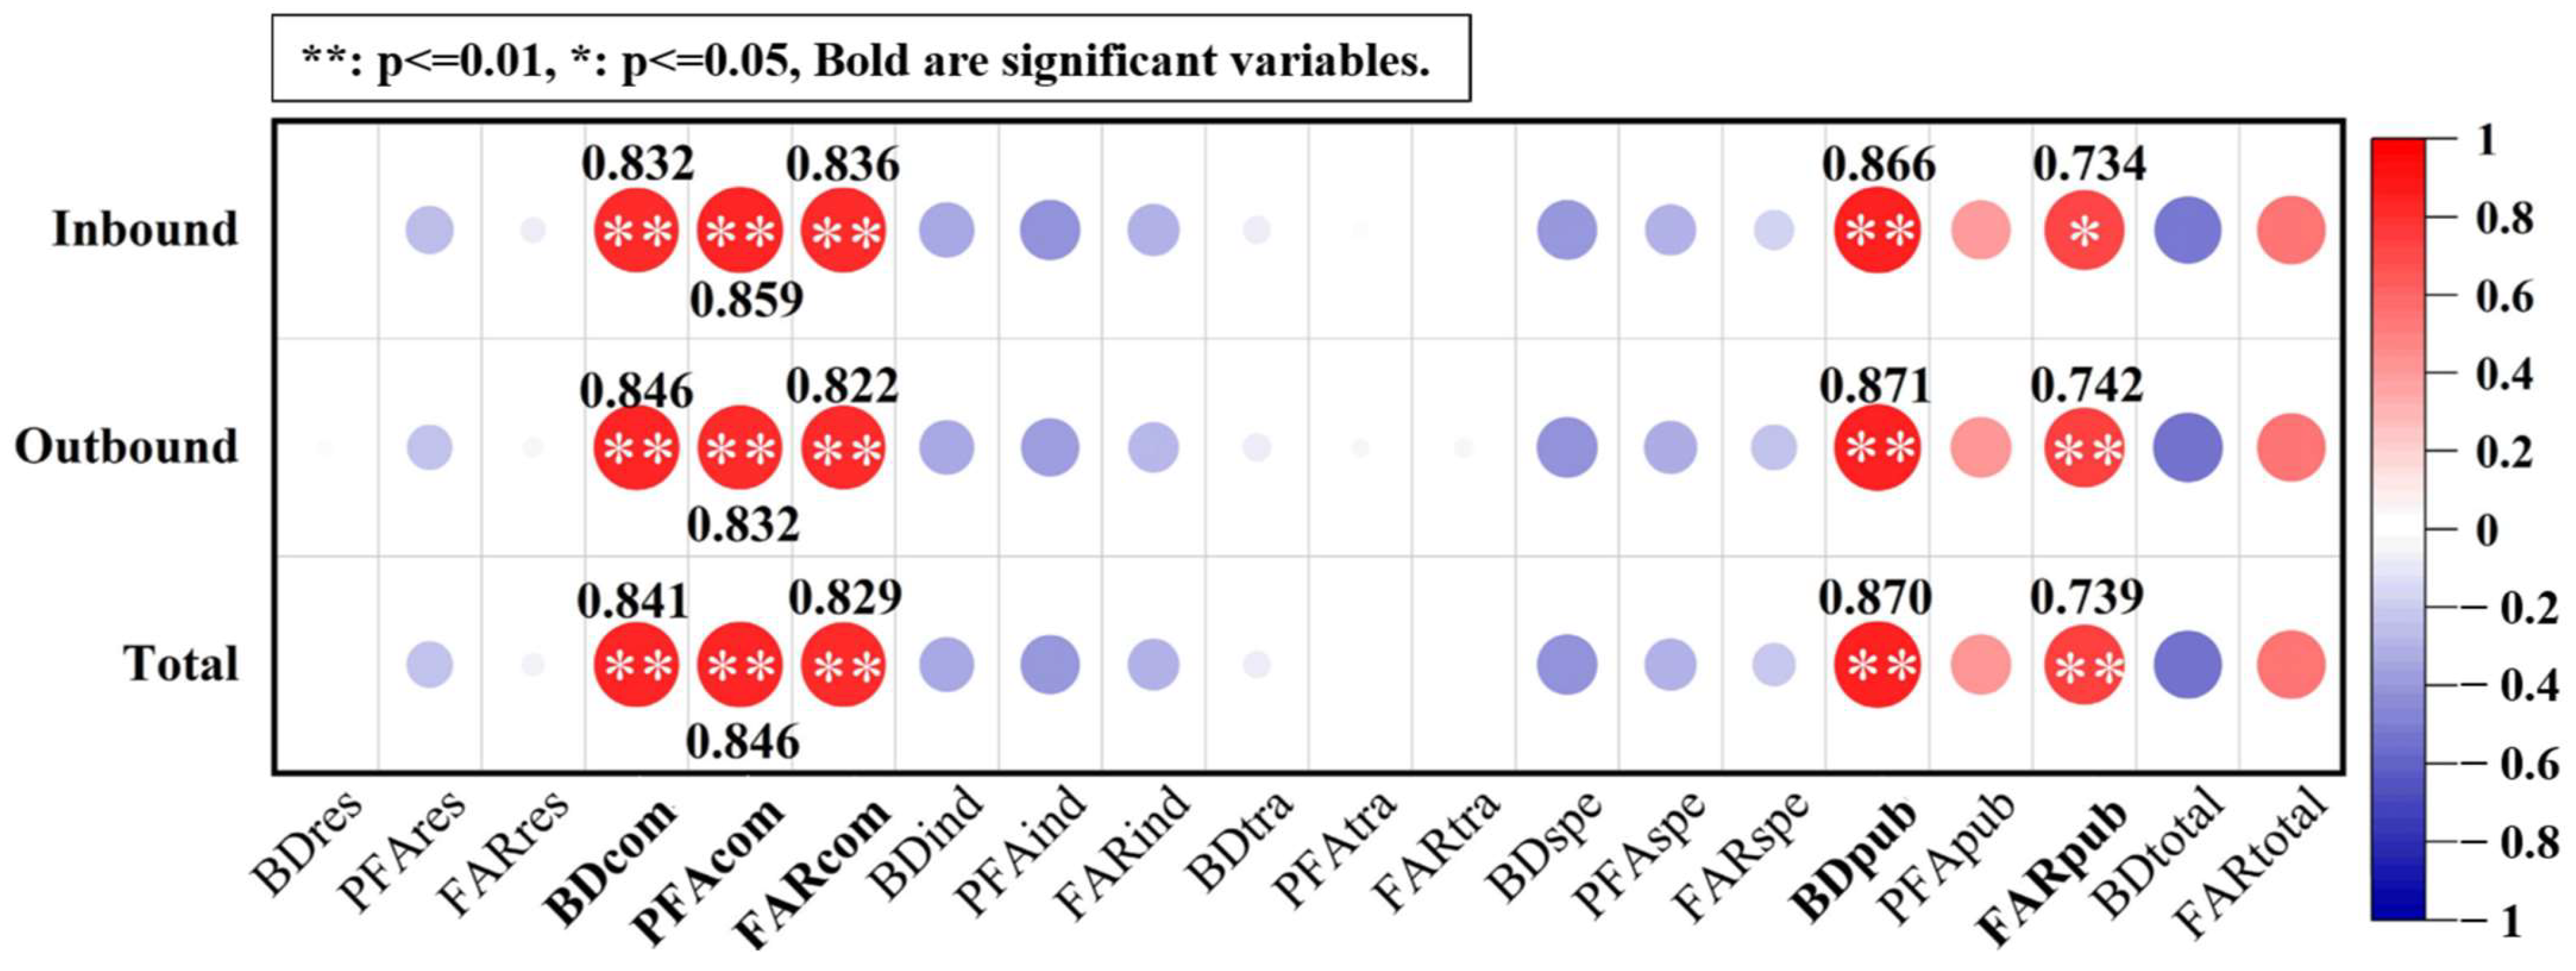
3.2. Analysis of the Correlation between Passenger Flows and the Characteristics of the Built Environment in CAs
To further analyze the relationship between different urban functions and intensities within the CAs and passenger flows, bivariate correlation analyses were conducted between the three operational passenger flow indices and seven types of indicators of the built environment for 30 stations. Figure 14 shows the details of the indices and the results.
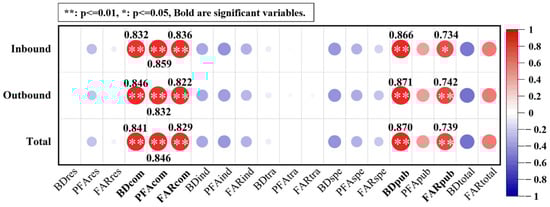
Figure 14.
Analysis of the correlation between the built environment and passenger flows at the 11 stations.
The correlation of the commercial type was the most significant, and the three built environment indicators were significantly and positively correlated with the three passenger traffic indicators at the level of 0.01. The correlations of building density as a station classification indicator with inbound, outbound, and total passenger traffic were 0.832, 0.846, and 0.841, respectively. Next was the public service function; the building density was significantly and positively correlated with the inbound, outbound, and total flows at the level of 0.01, with coefficients of 0.866, 0.871, and 0.879, respectively. The floor area ratio was significantly and positively correlated with the inbound flows at the level of 0.05 and with the outbound and total flows at the level of 0.01. This indicated that commercial functions and public service facilities are the most significant variables affecting passenger intensity. The two indices BDtotal and FARtotal did not manifest significant relations. This indicated that unilaterally considering the development intensity within a CA will not have a significant impact on passenger traffic.
In addition, although the industrial and special types did not manifest significant correlations, the three built-up indices were all negatively correlated with passenger traffic. This indicated that commercial functions and public services are the core functions that attract passenger traffic, while the industrial and special types are significant functions that decrease passenger traffic.
4. Discussion
In this study, based on the guidelines issued by the Chinese government, the station traffic level and different building functions within the CAs that were 800 m around the stations were extracted as classification factors. A new classification system was developed, and it is highly applicable to all cities in China. In addition, field measurements were performed to analyze the passenger flow patterns at different types of stations, demonstrating that the different functional characteristics of a station’s close vicinity result in different station passenger flow characteristics.
The correlation between station ridership and the different functions of the station area in terms of land and building capacity shows that commercial and public service functions are positively correlated with ridership, while residential functions do not reflect significance. The results from Shanghai also showed that for all-day ridership, residential land use was the least significant function, while commercial and entertainment were the most significant variables [22]. In addition, similar studies mostly used station operation data, which do reflect what occurs at the exits. In this study, field measurements of the passenger flow at each station exit were conducted, and the variance of the measured data was verified using the operational data; the R2 was as high as 0.96, which indicated the feasibility and accuracy of the monitoring method and provides a reference for similar studies.
This study provides guidance on the management of traffic demand at stations and the optimization of the built environment of CAs. (1) Guidance for station traffic demand and operation: for different types of stations, their traffic characteristics show different features due to the dominant surrounding building functions and their development intensity. Therefore, different operational strategies are adopted for different types of stations. Residential, industrial, and special stations should pay attention to controlling the morning and evening peaks for entering and leaving the station. Commercial and office stations should focus on controlling the morning peak for leaving the station and the evening peak for entering the station. Transportation-oriented stations should focus on controlling the inbound and outbound peak at 20:00. Integrated stations should control the inbound evening peak, outbound morning peak, and evening double peak. In addition, within the exit dimension, except for the transportation-oriented types, there were significant differences in passenger traffic through exits. Guidance is needed to relieve congested exits during the morning and evening peak periods and to try to equalize the passenger traffic flows at each exit. (2) Guidance for optimizing the built environment around the station area: most of the 11 typical stations for this study reflect passenger flow characteristics that are in accordance with the dominant building functions in the surrounding area, but neither of the two residential stations reflect the typical residential-oriented traffic characteristics. Similar studies have shown that this is due to the imbalance between station occupancy and residence [21], i.e., the residential and commercial office functions around the station are not coordinated. Therefore, for such stations, the station occupancy/residence balance can be optimized by adjusting the proportion of residential construction within the CA.
This study also has some limitations. First, only 10 types of stations on Line 1 and Line 2 were selected for this study, and for other types of stations, samples were not discussed. In addition, for the hub type, weekdays may not best reflect the stations’ passenger flow, and holidays may better characterize the changes in flow. Furthermore, this study only analyzes the correlation between different building functions and ridership, and the impact of the built environment on station ridership needs to be further quantified, which will be the content of our future work as well.
5. Conclusions
This study took Line 1 and Line 2 within the third ring road of Xi’an as the research objects and constructed a station classification system by taking the station traffic level and the functions of different buildings within CAs as the classification factors. At the same time, the passenger flow characteristics of 10 typical types of stations in the station dimension and the exit dimension were summarized. Finally, the correlations between indicators of different functions of the built environment within CAs and passenger traffic were quantified. The results show that, with the influence of the dominant function within the 800 m CA of a station, there is a significant difference in the passenger flow characteristics of different types of stations. The ridership is significantly higher in the integrated type than in the other types of stations and lowest in the industrial and special types. In addition, the traffic characteristics of each type of station are significantly different at different times of the day and at different station exits. Therefore, the traffic demand management of stations should be based on the dominant functions around different types of stations, and the time periods and exits with higher ridership should be guided and controlled to realize the equal distribution of ridership at each station exit.
The results of the correlation analysis show that the commercial and public service functions in the station area are significantly positively correlated with the total station ridership for the six periods at the 0.01 level. For commercial functions, the highest correlation coefficient between PFAcom and total ridership is 0.841, and for public service functions, the highest correlation coefficient between BDpub and total ridership is 0.870. This study provides a reference for the future operation and management of ridership at different types of stations and helps to promote the coordinated development of transportation demand and the built environment around the stations.
Author Contributions
Conceptualization, Y.W. and Y.L.; project administration, Y.L.; resources, Y.L.; methodology, L.C. and Y.W.; formal analysis, L.C. and Y.C.; investigation, L.C. and Y.C.; writing—review and editing, Y.C. and Y.W.; visualization, Y.C.; supervision, Y.W. and Y.L.; funding acquisition, Y.W. All authors have read and agreed to the published version of the manuscript.
Funding
This research was funded by China Railway First Survey and Design Institute Group Co., Ltd. (grant number 2022RJ22-01).
Data Availability Statement
The original contributions presented in the study are included in the article, further inquiries can be directed to the corresponding author.
Conflicts of Interest
Authors Li Chen and Ying Li were employed by the company China Railway First Survey and Design Institute Group Co., Ltd. The remaining authors declare that the research was conducted in the absence of any commercial or financial relationships that could be construed as a potential conflict of interest.
References
- Sun, L.; Chen, J.; Li, Q.; Huang, D. Dramatic uneven urbanization of large cities throughout the world in recent decades. Nat. Commun. 2020, 11, 5366. [Google Scholar] [CrossRef] [PubMed]
- Pang, L.; Jiang, Y.; Wang, J.; Qiu, N.; Xu, X.; Ren, L.; Han, X. Research of Metro Stations with Varying Patterns of Ridership and Their Relationship with Built Environment, on the Example of Tianjin, China. Sustainability 2023, 15, 9533. [Google Scholar] [CrossRef]
- Han, B.M.; Xi, Z.; Sun, Y.J.; Lu, F.; Niu, C.Y.; Wang, C.X.; Xu, K.L.; Yao, Y.F. Statistical analysis of urban rail transit operation in the world in 2022: A review. Urban Rapid Rail Transit 2023, 36, 5–11. [Google Scholar]
- Su, S.L.; Zhao, C.; Zhou, H.; Li, B.Z.; Kang, M.J. Unraveling the relative contribution of TOD structural factors to metro ridership: A novel localized modeling approach with implications on spatial planning. J. Transp. Geogr. 2022, 100, 103308. [Google Scholar] [CrossRef]
- Hu, J.; Chen, J.; Li, P.; Yan, J.; Wang, H. Systematic Review of Socially Sustainable and Community Regeneration: Research Traits, Focal Points, and Future Trajectories. Buildings 2024, 14, 881. [Google Scholar] [CrossRef]
- Lyu, G.; Bertolini, L.; Pfeffer, K. Developing a TOD typology for Beijing metro station areas. J. Transp. Geogr. 2016, 55, 40–50. [Google Scholar] [CrossRef]
- Yu, Z.; Zhu, X.; Liu, X. Characterizing metro stations via urban function: Thematic evidence from transit-oriented development (TOD) in Hong Kong. J. Transp. Geogr. 2022, 99, 103299. [Google Scholar] [CrossRef]
- Sung, H.; Oh, J.T. Transit-oriented development in a high-density city: Identifying its association with transit ridership in Seoul, Korea. Cities 2011, 28, 70–82. [Google Scholar] [CrossRef]
- Jiang, Y.S.; Yu, G.S.; Hu, L.; Li, Y. Refined classification of urban rail transit stations based on clustered station’s passenger traffic flow features. J. Transp. Syst. Eng. Inf. Technol. 2022, 22, 106–112. [Google Scholar] [CrossRef]
- Lu, Y.; Wen, X.R.; Liu, M.; Yu, H. A Review on the functional orientation of rail station regional planning based on typology. Urban Dev. Stud. 2023, 30, 28–31. [Google Scholar]
- Chen, J.; Pellegrini, P.; Yang, Z.; Wang, H. Strategies for Sustainable Urban Renewal: Community-Scale GIS-Based Analysis for Densification Decision Making. Sustainability 2023, 15, 7901. [Google Scholar] [CrossRef]
- Singh, Y.J.; Fard, P.; Zuidgeest, M.; Brussel, M.; Maarseveen, M.v. Measuring transit oriented development: A spatial multi criteria assessment approach for the City Region Arnhem and Nijmegen. J. Transp. Geogr. 2014, 35, 130–143. [Google Scholar] [CrossRef]
- Bertolini, L. Nodes and places: Complexities of railway station redevelopment. Eur. Plan. Stud. 1996, 4, 331–345. [Google Scholar] [CrossRef]
- Yin, Q.; Meng, B.; Zhang, L.Y.; Bin, M.; Liying, Z. Classification of subway stations in Beijing based on passenger flow characteristics. Prog. Geogr. 2016, 35, 126–134. [Google Scholar] [CrossRef]
- Zhang, J.W.; Li, K.L.; Guo, Z.C.; Wang, C.B. Grading research of subway stations based on traffic data analysis. J. Donghua Univ. (Nat. Sci.) 2018, 44, 652–657. [Google Scholar] [CrossRef]
- Dong, Y.Z. Grade Evaluation of Urban Rail Transit Stations and Method for Grading of Regional Stations. Urban Rapid Rail Transit 2023, 36, 146–151. [Google Scholar]
- Zhang, L.; Hou, P.; Qiang, D. Transit-Oriented Development in New Towns: Identifying Its Association with Urban Function in Shanghai, China. Buildings 2022, 12, 1394. [Google Scholar] [CrossRef]
- Vale, D.S.; Viana, C.M.; Pereira, M. The extended node-place model at the local scale: Evaluating the integration of land use and transport for Lisbon’s subway network. J. Transp. Geogr. 2018, 69, 282–293. [Google Scholar] [CrossRef]
- Qiang, D.; Zhang, L.; Huang, X. Quantitative Evaluation of TOD Performance Based on Multi-Source Data: A Case Study of Shanghai. Front. Public Health 2022, 10, 820694. [Google Scholar] [CrossRef]
- Yang, L.; Song, X.Y. TOD Typology Based on Urban Renewal: A Classification of Metro Stations for Ningbo City. Urban Rail Transit 2021, 7, 240–255. [Google Scholar] [CrossRef]
- Feng, H.; Chen, Y.; Wu, J.; Zhao, Z.; Wang, Y.; Wang, Z. Urban Rail Transit Station Type Identification Based on “Passenger Flow—Land Use—Job-Housing”. Sustainability 2023, 15, 15103. [Google Scholar] [CrossRef]
- An, D.; Tong, X.; Liu, K.; Chan, E.H.W. Understanding the impact of built environment on metro ridership using open source in Shanghai. Cities 2019, 93, 177–187. [Google Scholar] [CrossRef]
- Preis, T.; Zhong, C.; Batty, M.; Manley, E.; Wang, J.; Wang, Z.; Chen, F.; Schmitt, G. Variability in Regularity: Mining Temporal Mobility Patterns in London, Singapore and Beijing Using Smart-Card Data. PLoS ONE 2016, 11, e0149222. [Google Scholar] [CrossRef]
- Ren, L.J.; Yun, Y.X.; Quan, H.Y. Study on Classification and Characteristics of Urban Rail Transit Station Based on Node-Place Model: Empirical Analysis and Experience Enlightenment of Singapore. Urban Plan. Int. 2016, 31, 109–116. [Google Scholar]
- Ministry of Housing and Urban-Rural Development of the People’s Republic of China. Guidelines for Planning and Design of Areas along Urban Railways; Ministry of Housing and Urban-Rural Development of the People’s Republic of China: Beijing, China, 2015; p. 7. [Google Scholar]
- Urban Planning Society of China. Guidelines for Space Planning and Design of Facilities around Urban Rail Transit Station; Urban Planning Society of China: Beijing, China, 2021; p. 16. [Google Scholar]
- Xi’an 2022 Statistical Yearbook. Available online: http://tjj.xa.gov.cn/tjnj/2022/zk/indexch.htm (accessed on 24 January 2024).
- Xi’an Metro Official Homepage. Available online: https://www.xianrail.com/#/index (accessed on 24 January 2024).
- Xi’an Metro Statistics. Available online: https://metrodb.org/index/xian.html (accessed on 24 January 2024).
- Zhang, X.; Sun, Y.; Luan, X. Regulation flexibility and legitimacy building in governing intercity railways: The polymorphous role of the Chinese provincial government. J. Urban Aff. 2023, 1–16. [Google Scholar] [CrossRef]
- Xi’an Bureau of Statistics. Bulletin of Main Data of the Seventh National Population Census of Xi’an City; Xi’an Bureau of Statistics: Xi’an, China, 2021; p. 1. [Google Scholar]
- Xi’an City Planning Design and Research Institute. Annual Report on Urban Transportation Development in Xi’an, 2022; Xi’an Municipal Bureau of Natural Resources and Planning: Xi’an, China, 2023; pp. 11–12. [Google Scholar]


Disclaimer/Publisher’s Note: The statements, opinions and data contained in all publications are solely those of the individual author(s) and contributor(s) and not of MDPI and/or the editor(s). MDPI and/or the editor(s) disclaim responsibility for any injury to people or property resulting from any ideas, methods, instructions or products referred to in the content. |
© 2024 by the authors. Licensee MDPI, Basel, Switzerland. This article is an open access article distributed under the terms and conditions of the Creative Commons Attribution (CC BY) license (https://creativecommons.org/licenses/by/4.0/).