Article

Design Strategies to Improve Metro Transit Station Walking Environments: Five Stations in Chongqing, China

School of Architecture and Urban Planning, Chongqing University, Chongqing 400044, China
*
Author to whom correspondence should be addressed.
Buildings 2024, 14(4), 1025; https://doi.org/10.3390/buildings14041025
Submission received: 9 March 2024 / Revised: 31 March 2024 / Accepted: 3 April 2024 / Published: 6 April 2024
(This article belongs to the Special Issue Advanced Studies in Urban and Regional Planning)

Abstract

:
While transit-oriented development (TOD) has been widely adopted in urban design alongside the expansion of urban metro transit, the creation of pedestrian-friendly environments has often been overlooked during implementation. This has resulted in a lower walking advantage around metro transit stations. To address this issue and encourage walking and public transport use in metro transit station areas, this study undertook a quantitative comparative analysis of the pedestrian environment in five Chongqing metro transit station areas. The analysis focused on three key dimensions: “comprehensive evaluation”, “basic scale”, and “structural quality”. The comprehensive evaluation considered factors such as the pedestrian catchment area ratio, POI kernel density distribution, and crowd agglomeration. The basic scale dimension comprised floor area ratio, building density, pedestrian road density, and the quantity of station entrances and exits. Finally, structural quality factors included land use type mixing degree, POI function mixing degree, intersection connectivity, median street length, pedestrian route directness, and green view index. Based on these analyses, this study proposes a series of pedestrian environment design strategies including land use and transportation. The strategies for land use advocate for “developing compact and diverse land use”, “strengthening attraction of station center”, “positioning large projects on the edge”, “restricting private transportation capabilities”. The strategies for transportation consist of “increasing pedestrian road density”, “traffic calming organization”, “subdivision of road types”, and “three-dimensional pedestrian traffic system”. These strategies aim to create a more humanized and environmentally friendly pedestrian environment, proactively rise to the challenge of climate change, thereby cultivating sustainable urban development.

1. Introduction

Since the Industrial Revolution, the swift expansion of mechanized forms of transportation, including cars, trains, and subways, has led to urban challenges such as traffic jams, air pollution, and energy shortages. With environmental concerns becoming more pressing, the urban development model heavily reliant on private vehicles is proving to be unsustainable. The consensus for advancing sustainable urban transportation comprises controlling the expansion of private vehicular traffic, enhancing public transportation systems, and encouraging green commuting practices among residents. Urban metro transit has become a crucial solution to mitigate traffic congestion in high-density urban areas. Walking, as a transportation option, plays a critical role not only as a primary means of interchange for metro transit but also in connecting various service offerings in metro transit station zones [1]. However, the reality in China demonstrates that metro transit construction often stalls at the TOD planning phase, failing to fully capitalize on the “walking advantages” in station areas. The 2020 Annual Statistical and Analysis Report on Urban Metro Transit notes that China’s urban metro network extended to 7969.7 km in 2020, with the network’s size increasing annually. However, data from 2012 to 2020 reveal a decline in passenger density alongside the growth of the metro network’s reach. This indicates that urban metro systems should not merely focus on expansion but should prioritize enhancing the functionality and environment of existing stations through specific design improvements or urban rejuvenation projects, aiming for sustainable operation at each location [2]. The current limitations in designing pedestrian-friendly spaces around metro transit stations are primarily evident in several key areas: (1) a lack of coordination between transportation planning and land use, leading to areas around stations that lack appeal; (2) a prioritization of expanding the urban transportation network without equal emphasis on optimizing land use in the vicinity of metro transit stations, indicating potential for better land use efficiency; (3) an oversight in developing a conducive built environment and managing pedestrian flow in metro transit station areas, which reduces residents’ inclination to walk; and (4) a lack of attention to how urban landscapes are visually perceived and the implementation of visual navigation systems for transfers at stations, which curtails the benefits of pedestrian movement in these areas. Therefore, it is of significant importance to develop pedestrian-friendly environments in metro transit station areas for enhancing the willingness of pedestrians to walk to public stations, increasing the utilization rate of metro transit, and responding to climate change.
TOD is an integrated approach to urban planning that combines transportation infrastructure with land use, enhancing urban efficiency and promoting sustainable urban development [3,4,5,6]. The primary goals of TOD include encouraging walking, boosting public transit ridership, reducing congestion, and yielding environmental benefits [7,8,9,10,11]. This development strategy is widely implemented in urban planning and strategic development efforts around the globe [12,13,14,15]. Schlossberg highlights that understanding opportunities for pedestrian movement is a key component in assessing TOD projects [16]. Estupiñán emphasizes the importance of defining pedestrian spaces around transit stations to support the use of public transportation [17]. Jacobson [18] and Vale [19] argue that the walkability of communities surrounding transit stations is crucial to their success, as it facilitates convenient, safe, and direct access to transit nodes. This, in turn, encourages a greater use of transit stations and ensures that TOD residents have access to local amenities to meet their needs. King explores how the walkability of communities around transit stops can inform future TOD developments [20]. Morency, after conducting scenario simulations for four different plans in the Montreal metropolitan area, found that TOD areas could reduce walking travel distances by 28% [21]. Nasri studies the impact of the built environment on mode of transportation choice within the context of TOD, using discrete choice models and focusing on the built environment at the origin of trips [22]. Given that trips in rail transit begin and end with walking, walkability is a significant concern in TOD communities.
Regarding the assessment studies of urban walkability or pedestrian environments, the field of research can be classified into three categories: the objective spatial environment, the subjective spatial experience, and comprehensive evaluations. From the objective environment perspective, Dill [23], Marshall [24], and Jones [25] have explored the correlation between residents’ modes of transportation (i.e., cycling and walking) and the urban form. They emphasize the significant influence that the structural properties of the street network exert on road connectivity. Chinese researcher Lu has introduced the Walk Score system adopted in the United States, acknowledging its utility in demonstrating how the layout of everyday facilities can affect the walkability score of urban areas [26]. Yin has connected the walk score with urban design spatial variables across streets through the application of computer vision, presenting a 3D analytical perspective on urban walkability evaluation [27]. Peiravian [28] and Mayne [29] have simplified the evaluation process through developing a pedestrian environment index that incorporates indicators such as land use diversity, population density, commercial density, and intersection density. On the subjective evaluation front, Millstein [30] and Kurka [31] have shifted the focus from a broad analysis of street connectivity to the specific elements that may affect residents’ willingness to walk in the built environment. They have carried out a Microscale Audit of Pedestrian Streetscapes (MAPS) scoring evaluation from the pedestrian’s perspective. Gou, utilizing semantic differential (SD) analysis, has performed landscape perception evaluations of street spaces in Nanjing and Shanghai [32]. Similar studies include those by Shatu, who, in the absence of direct data, referenced existing factors influencing pedestrian path choices and employed computer virtual environments to facilitate the assessment of street walkability [33]. Evaluations of the objective spatial environment predominantly rely on quantitative analysis of urban spatial walkability, spatial morphological characteristics, and specific functional layouts. Subjective spatial experiences are derived from the pedestrian’s perspective, focusing on surveying and understanding residents’ preferences and satisfaction levels with the walking space, thereby summarizing relevant patterns to further inform spatial design. This approach represents a type of qualitative research; comprehensive evaluations bridge the gap between objective and subjective viewpoints, finalizing a weighted scoring following a holistic analysis.
Research in various regions, both in our own borders and globally, on the subject of pedestrian environments near metro transit stations, reveals a consensus: creating a walk-friendly atmosphere extends beyond merely ensuring accessible road networks to encourage walking. It also involves curating a rich variety of destinations in the spatial layout to maintain residents’ interest in walking. Scholars, including Yan [34], Guo [35], and Zhao [36], are of the opinion that managing the pedestrian space around metro transit stations should prioritize aspects such as connectivity, safety, comfort, and the holistic design of public spaces. Through the lens of the Ningbo case, Bai illustrated how communities around urban metro transit stations can be forged with thoughtful pedestrian environment planning [37]. Olaru’s research has validated that enhancing public transport access on a city-wide scale can broaden the scope of residents’ activities and lessen their dependence on personal vehicles. This strategy necessitates the aggregation of public amenities near stations in reasonable walking distances as part of land development initiatives [38]. Jeffrey and other scholars assessed the potential for transit-oriented development (TOD) at various stations along the Melbourne train loop, employing 14 pedestrian-centric criteria throughout their study [39]. Lamour emphasized the importance of considering public space quality (safety, comfort) in the walking experiences of those living near station areas for the successful implementation of TOD models [40]. Strategies to encourage walking among residents include diversifying land use types, introducing street-level commercial ventures, and interspersing small open areas (such as plazas and green spaces) along walkways. The inclusion of leisure amenities also plays a crucial role in making walking an attractive option for residents.
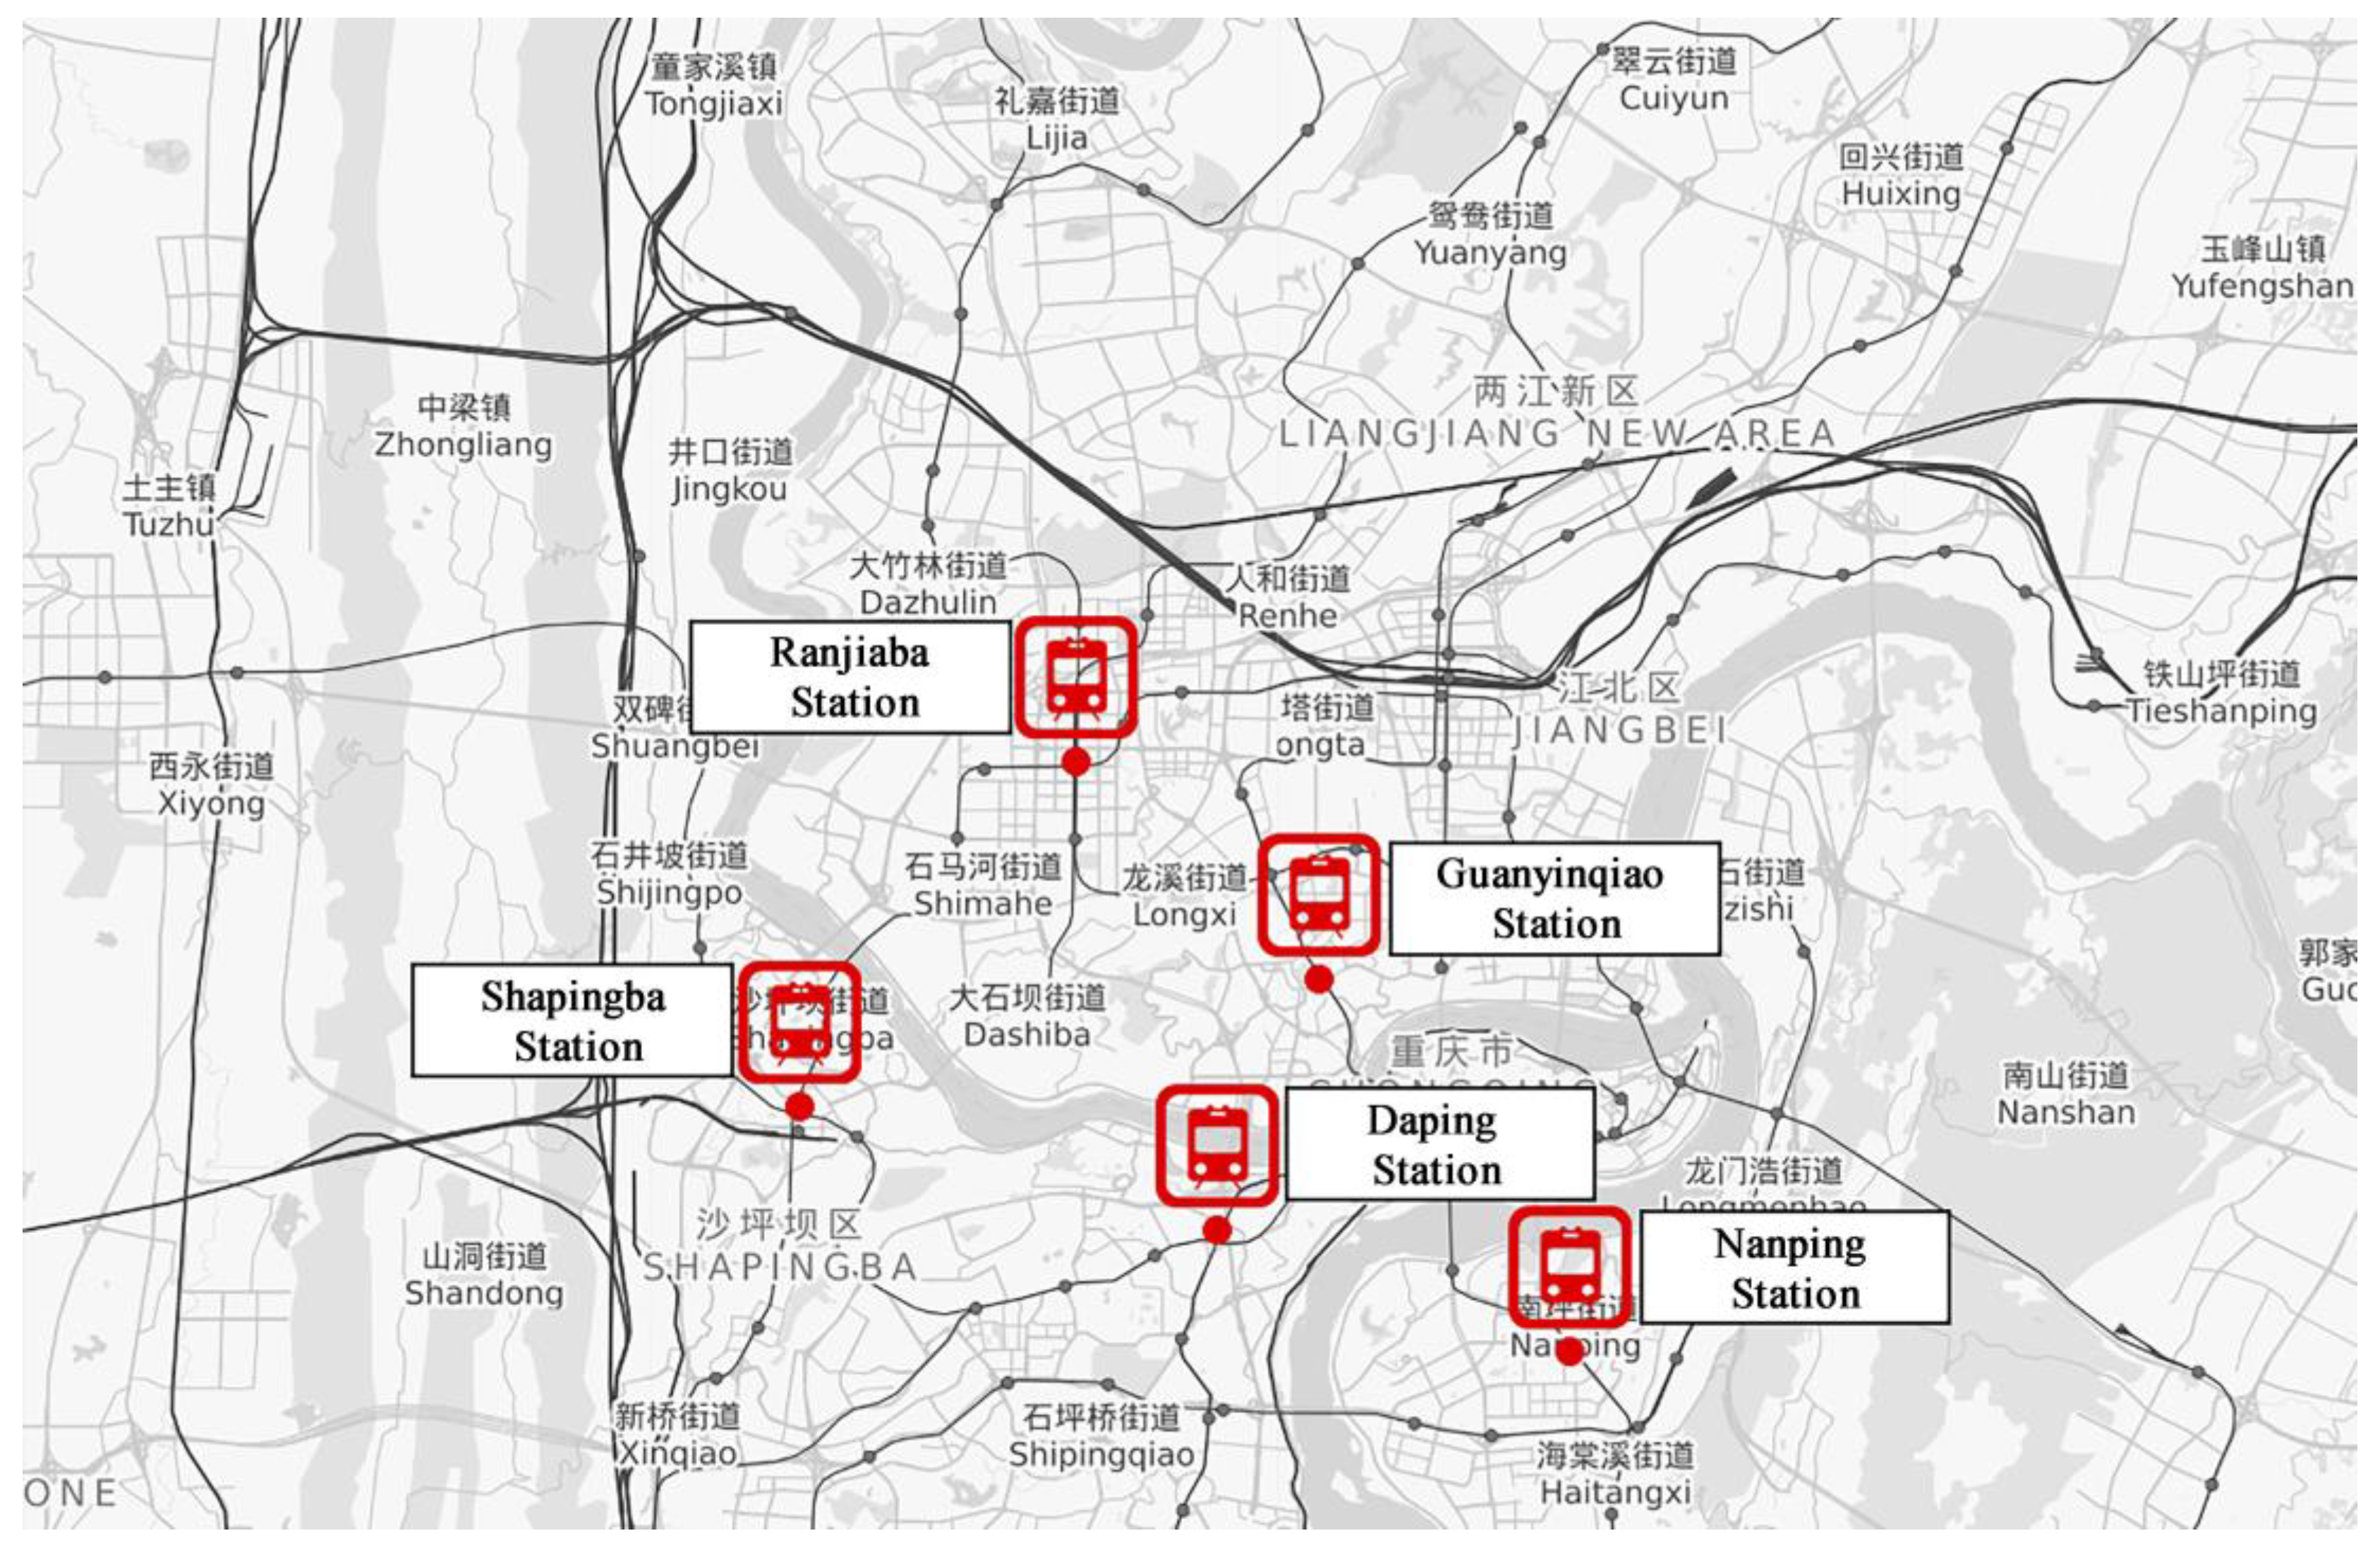
A comprehensive review of the existing literature identifies a limited scope of research focused specifically on evaluating pedestrian environments in these areas. Existing studies either lack granularity by focusing on the broader impact of TOD or utilize limited evaluation indicators that fail to reflect the full complexity of pedestrian experiences. Moreover, there appear to be insufficient systematic summaries of improvement strategies and empirical research on walking environments in Chinese metro transit systems. To address this gap, this study undertakes a quantitative comparative analysis of five metro transit station areas in Chongqing, China. The analysis focuses on three key dimensions: “comprehensive evaluation”, “basic scale”, and “structural quality”. The comprehensive evaluation considered factors such as the pedestrian catchment area ratio, POI kernel density distribution, and crowd agglomeration. The basic scale dimension comprised floor area ratio, building density, pedestrian road density, and the quantity of station entrances and exits. Finally, structural quality factors included land use type mixing degree, POI function mixing degree, intersection connectivity, median street length, pedestrian route directness, and green view index. By analyzing the shared spatial characteristics of these station areas and uncovering the linear relationships between relevant environmental variables, this study proposes optimization strategies for pedestrian-focused design in such situations. These findings can inform future planning efforts aimed at creating more walkable and accessible environments around metro transit stations, thus promoting sustainable transportation practices.

2. Research Object and Scope

2.1. Selection of Research Subjects

The central urban area of Chongqing is characterized by its cluster-style layout, heavily influenced by the surrounding mountainous geography. Metro transit emerges as a vital connector among these urban clusters. Beyond metro transit, Chongqing’s transportation network comprises private vehicles, public buses, and pedestrian pathways, while the topography renders non-motorized modes such as cycling impractical. The city is also outfitted with an extensive array of pedestrian infrastructures, including pathways, staircases, elevators, and escalators, all of which facilitate ease of movement for residents and boost both the efficiency and the appeal of walking as a commuting option. Walking, as a transfer method to metro transit, stands at the heart of TOD and represents a crucial strategy for achieving sustainable development in both land use and transportation planning in Chongqing.
The cluster-based urban structure in Chongqing creates a significant opportunity for the development of transfer stations, with various-sized regional commercial hubs emerging around the central metro transfer stations in each cluster. This setup draws on a unique combination of “urban characteristics + transportation features” associated with metro transit stations. For the purpose of this study, five stations have been chosen for in-depth analysis: Guanyinqiao Station in the Jiangbei District, Ranjiaba Station in the Yubei District, Daping Station in the Yuzhong District, Shapingba Station in the Shapingba District, and Nanping Station in the Nan’an District (Figure 1).

2.2. Research Data

The data on land use for this research were acquired through the color-translating in detailed planning maps from prior project disclosures. Information on the road network was sourced from Baidu Maps and the Open Street Map (OSM) website, with additional data on metro transit, building vectors, and Points of Interest (POI) sourced from the Baidu Maps website. Street view imagery and demographic scale data were also compiled from Baidu Maps. The preliminary data processing included converting the data to the WGS-84 coordinate standard and applying corrections through the ArcMap platform. This phase also involved the cleaning and supplementation of road data and the selective filtering of POI data.

2.3. Research Scope

TOD theory suggests that the vicinity of metro stations should be organized with these stations as the central area, forming a layered structure in space that is within walking distance of 400~800 m, or walking time of 5~10 min [3,41,42,43,44]. However, changes in related environmental factors suggest the necessity to extend the analysis beyond the immediate scope of study. Accordingly, this research extends the area of influence for metro stations to 1500 m, while confining the discussion to a maximum acceptable distance of 1000 m. With respect to individual factors, the focus is confined to within 400 m of the central area (Figure 2).
In this study, we refer to “station domain” as the ring buffer area centered on the station, including the pedestrian catchment area (PCA) derived from simulating actual walking paths [45,46,47]. The former is an ideal model based on the TOD theory, suggesting a core area with a specific radius, while the latter is determined by mapping out the accessible area on foot, taking into account the locations of station entrances and exits over a uniform distance. During the PCA’s calculation, it is crucial to define certain service area attributes, notably interruption values, setting a core area of 400 m and extending up to a maximum radius of 1000 m. To maintain the integrity and accuracy of road data, it is important to consider barriers such as campuses and gated communities. The approach incorporates “multiple facility point options” into the service areas, guided by the defined interruption values. Road data for this study are derived from the transformation of road centerlines. Additionally, a “trimming area” of 50 m is introduced to streamline the analysis of road width and the impact of building setbacks on the ease of travel for residents, reflecting the differences at the boundaries of pedestrian catchment areas (Figure 3).

3. Factors and Quantitative Methods for Evaluating the Impact of Pedestrian Environment

The focus of this article is on exploring the factors that shape the pedestrian environment near metro transit stations, specifically through the lens of the physical layout encountered by residents during their commute to metro transit hubs or central areas. The objective is to identify ways to enhance travel conditions and motivate residents to opt for walking by adjusting key planning and design parameters. The key issue of our discussion is the “3D” principle of TOD, encapsulating Density, Diversity, and Design [48,49,50]. This study further evaluates identifying factors that affect the pedestrian surroundings near metro transit stations, aiming to support pedestrian activities. These factors include walking opportunities, purposes, walkability, and the overall walking experience, grouped under comprehensive evaluation, basic scale, and structural quality indicators [51,52] (Table 1). Through comprehensive evaluation, we seek to reflect the differences in phenomena caused by the development of land and traffic organization in different station areas. The basic scale indicator serves to measure the development prospects of a metro station’s surrounding area, while the structural quality indicator seeks to unravel potential challenges.
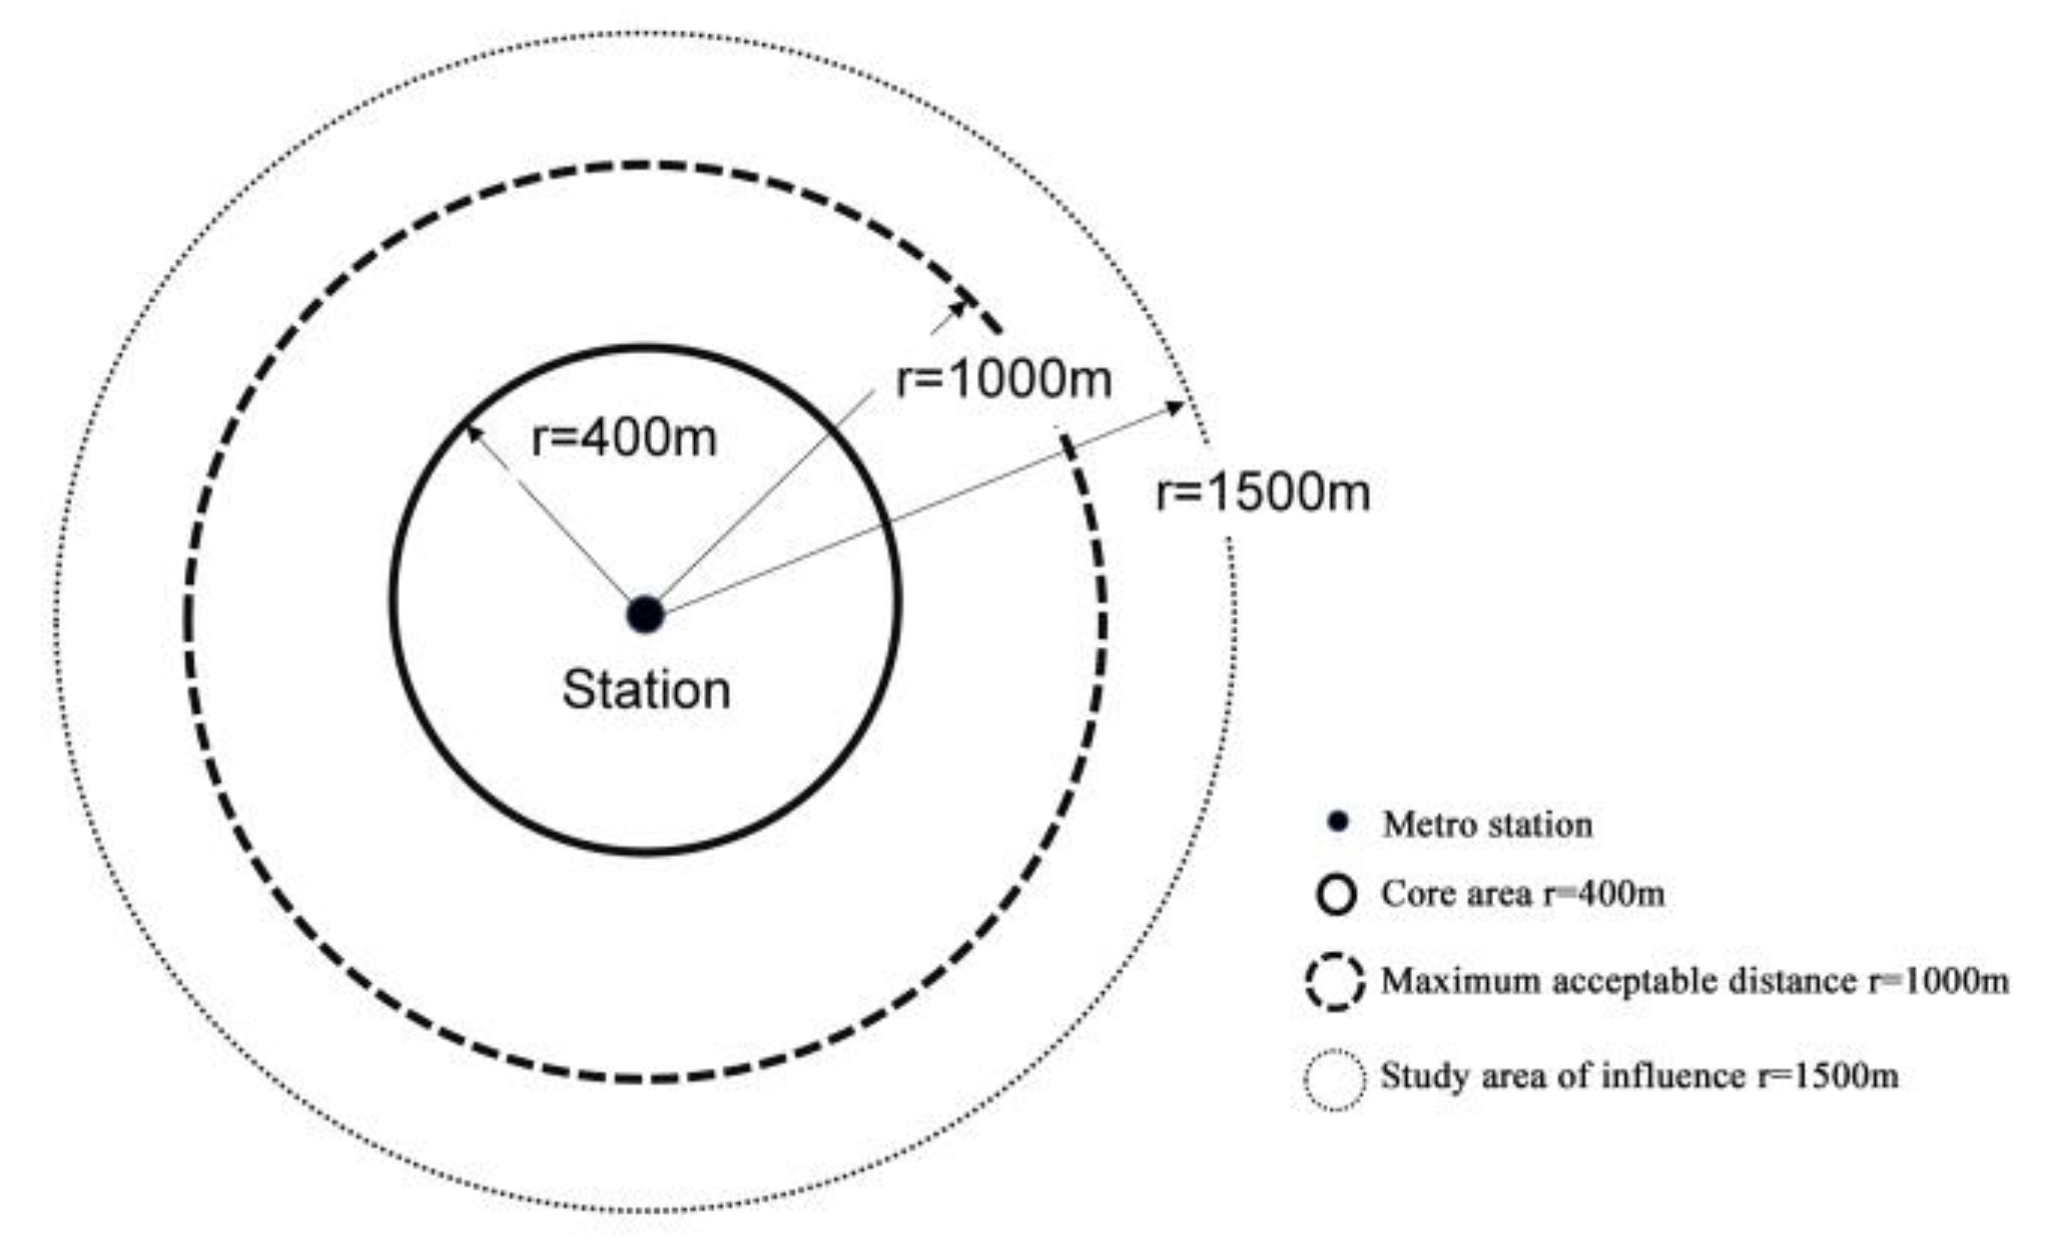
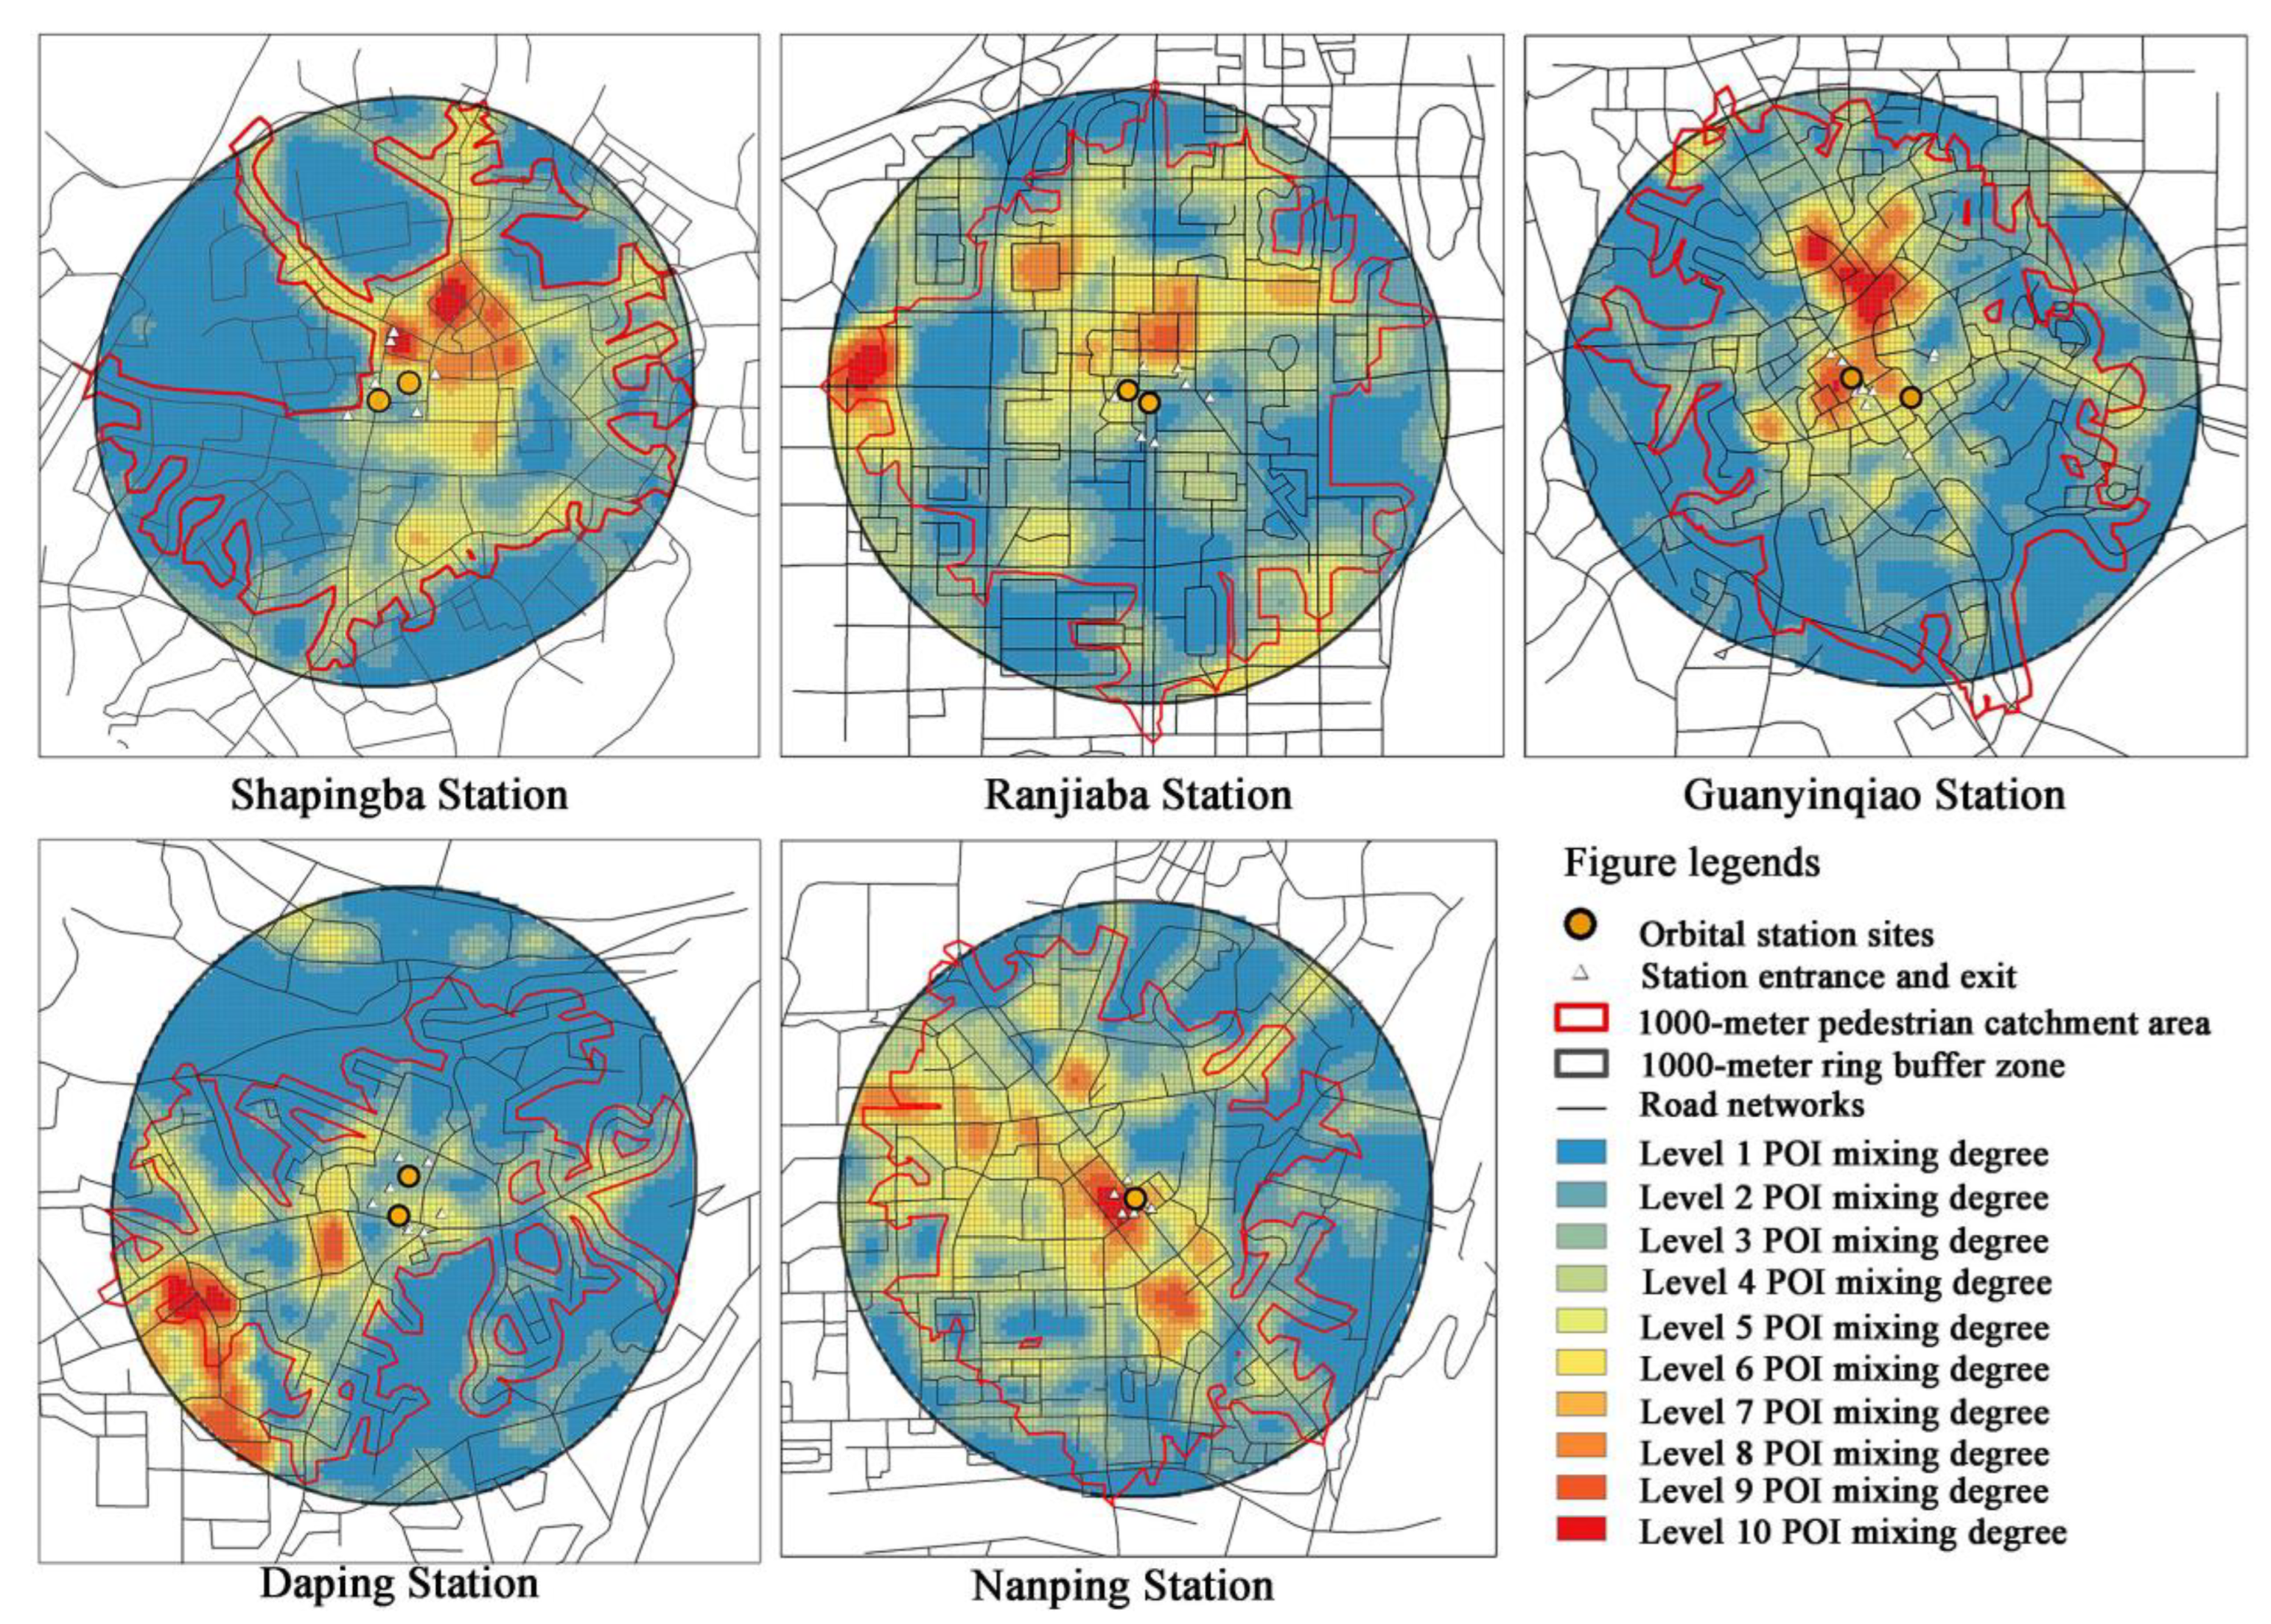
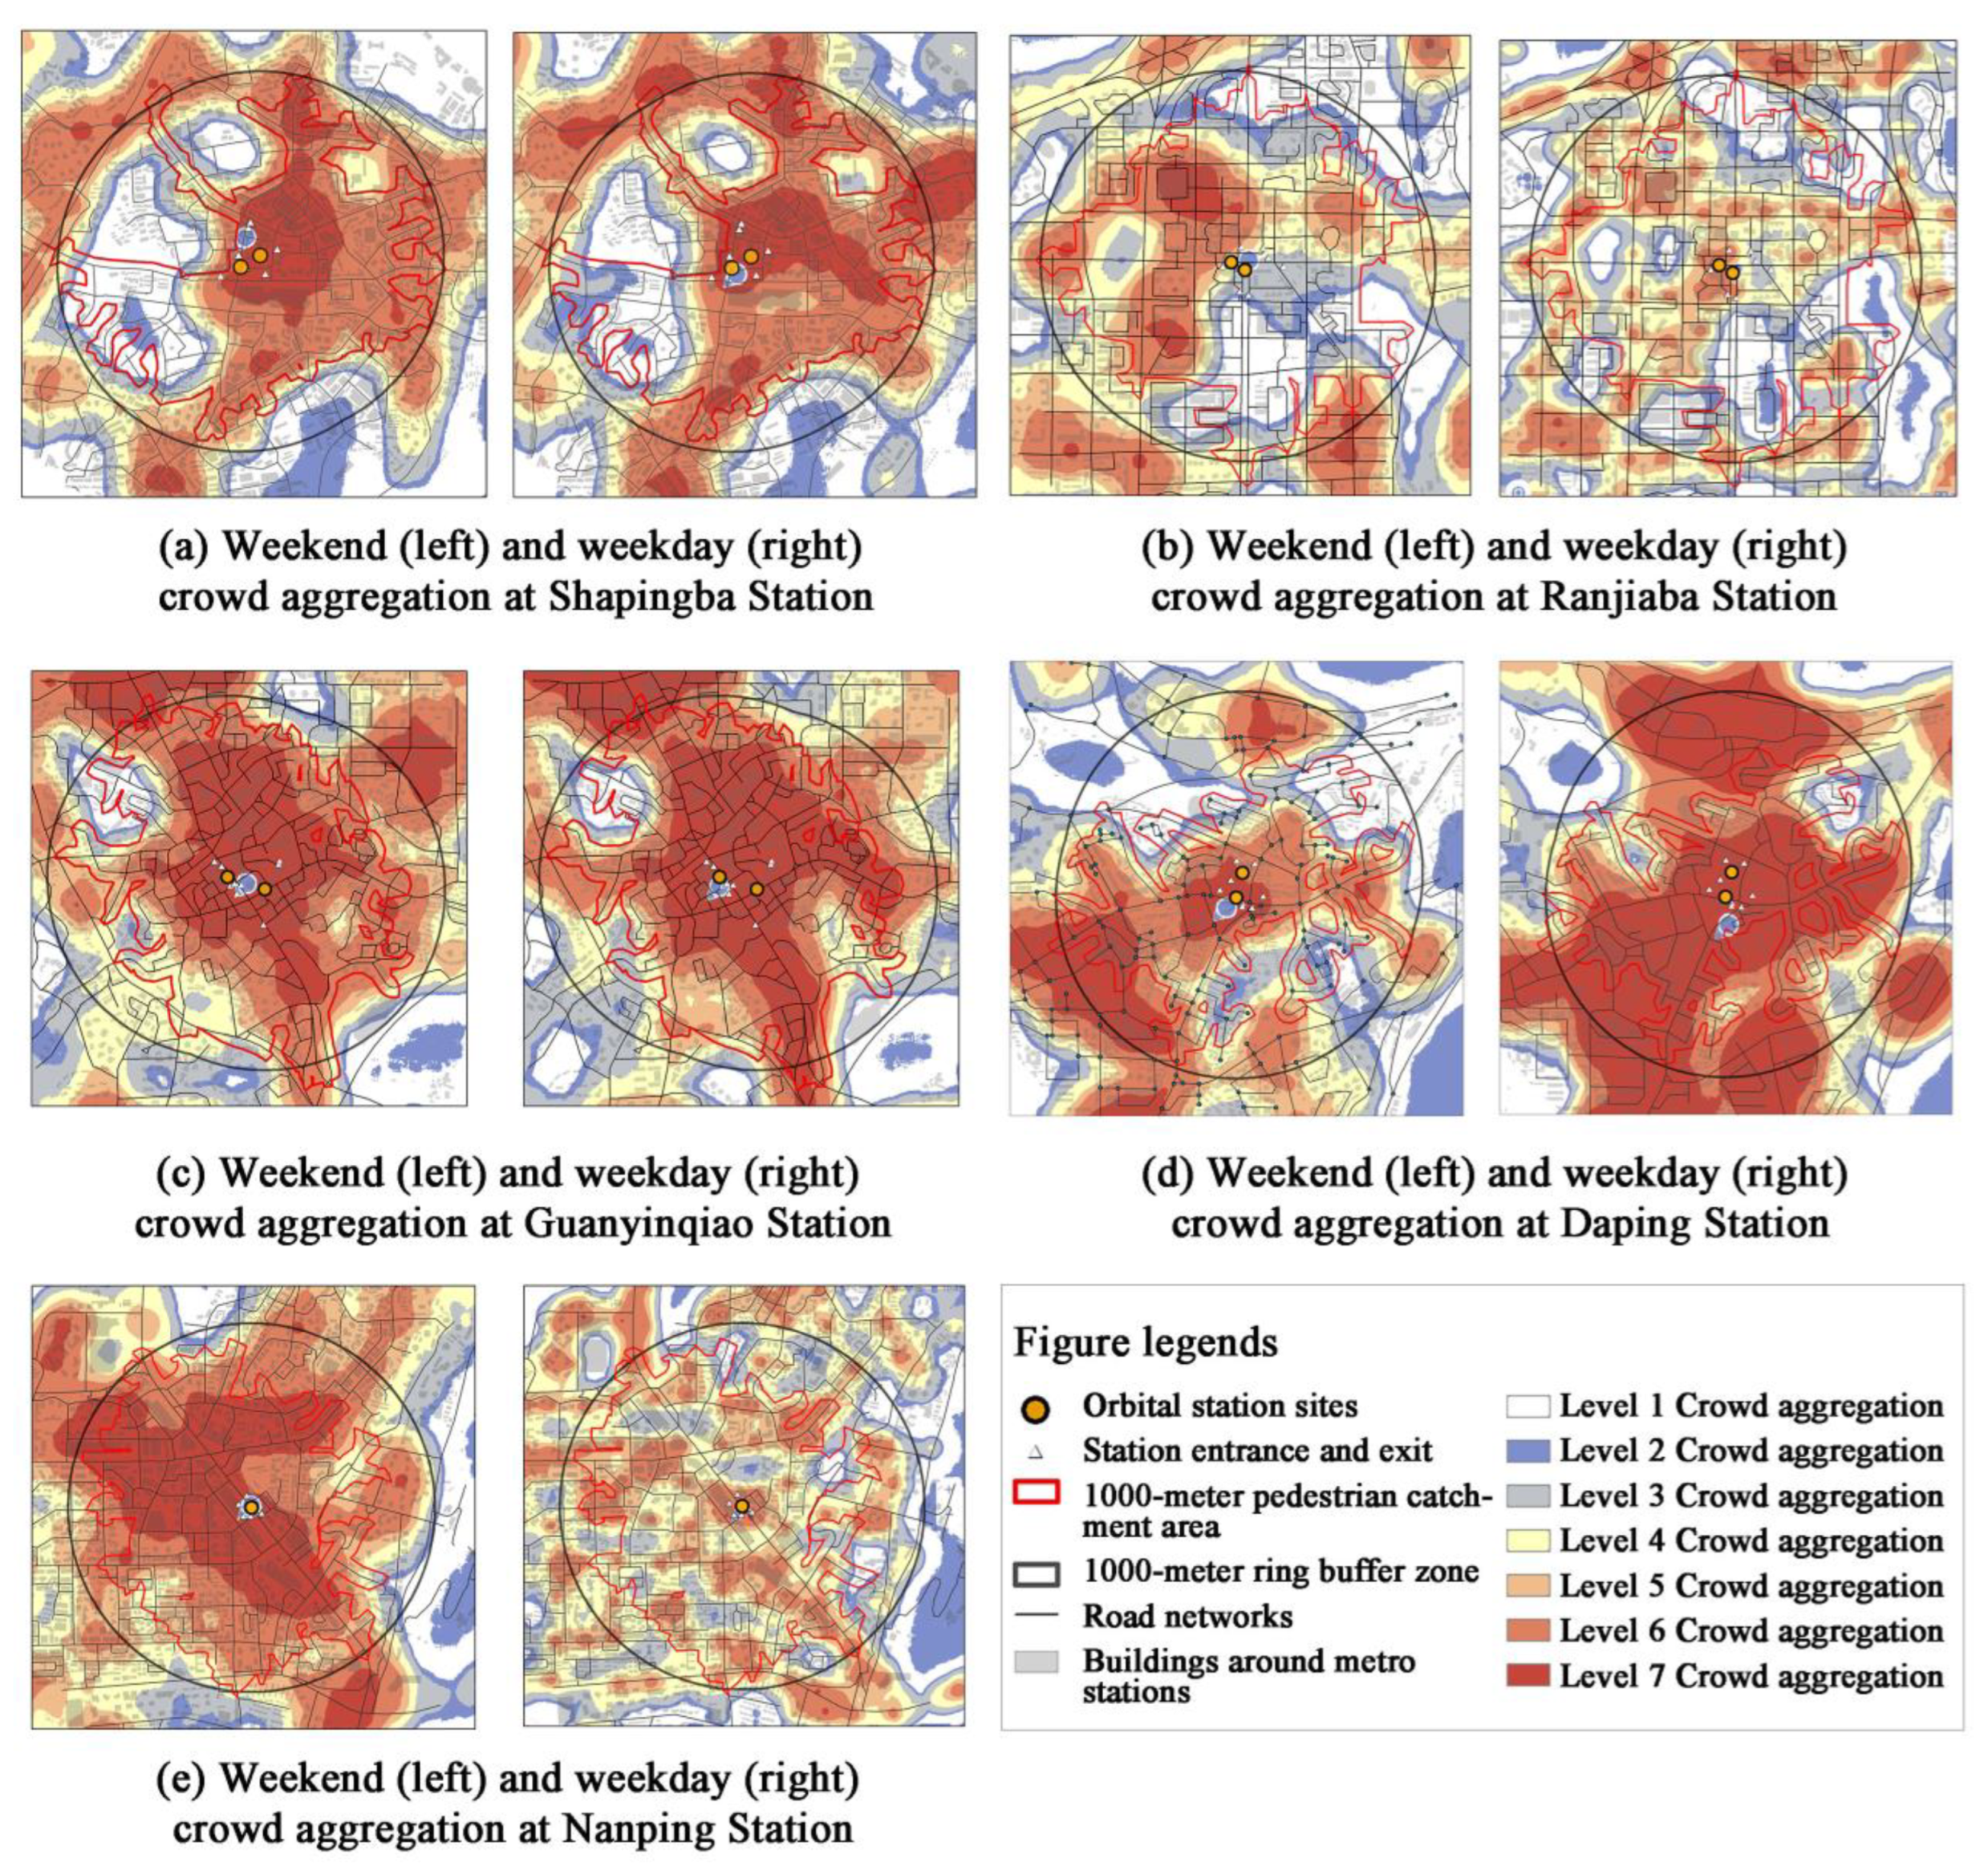
Comprehensive evaluation indicators offer a preliminary evaluation of the effects on development of metro transit station areas, thereby reflecting the holistic efficacy of the pedestrian environment and identifying areas with suboptimal pedestrian flow related to the walking environment. Comprehensive evaluation factors are operationalized through three indicators: pedestrian catchment area ratio, POI kernel density distribution, and crowd gathering.
On a fundamental level, basic scale indicators offer a preliminary judgment of the relationship between land utilization and transportation systems in the vicinity of metro transit stations. The presence of a robust population and comprehensive transportation services is key to optimizing pedestrian flow. Through an analysis of these basic scale indicators, it is possible to conduct a comparative analysis across different metro transit stations. Included in these indicators are the floor area ratio, building density, pedestrian road density, and the quantity of entrances and exits at metro transit stations.
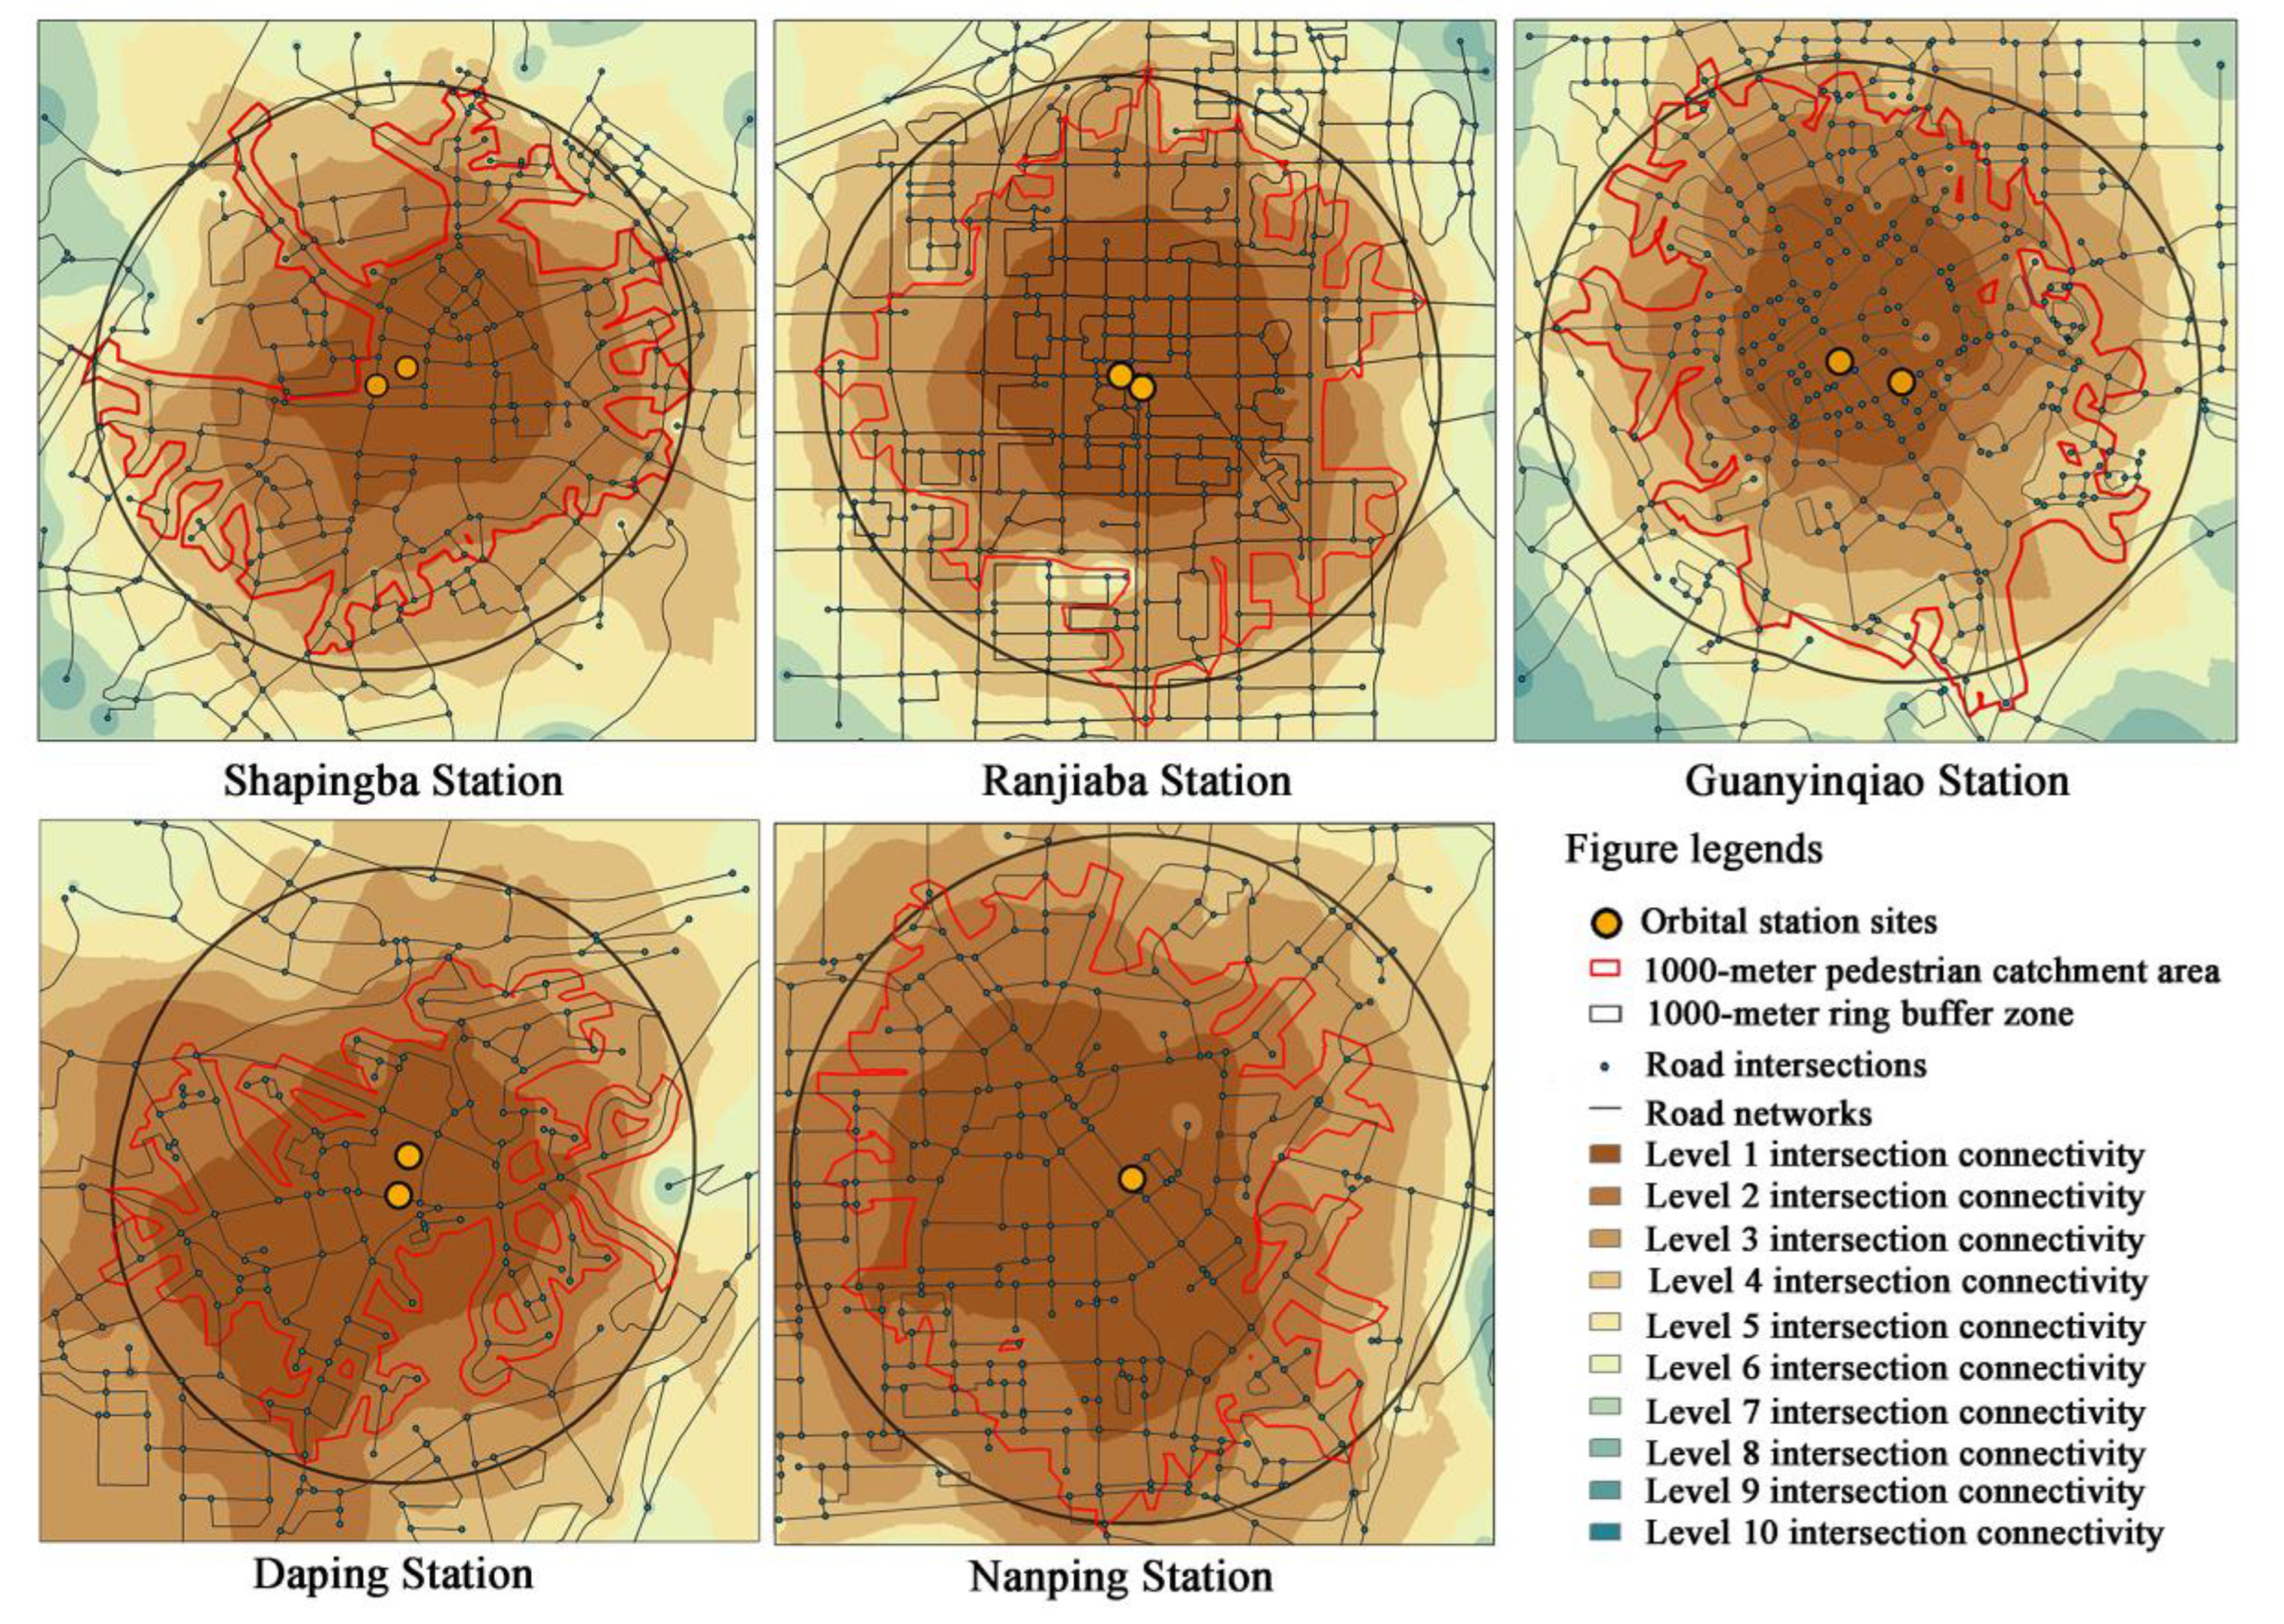
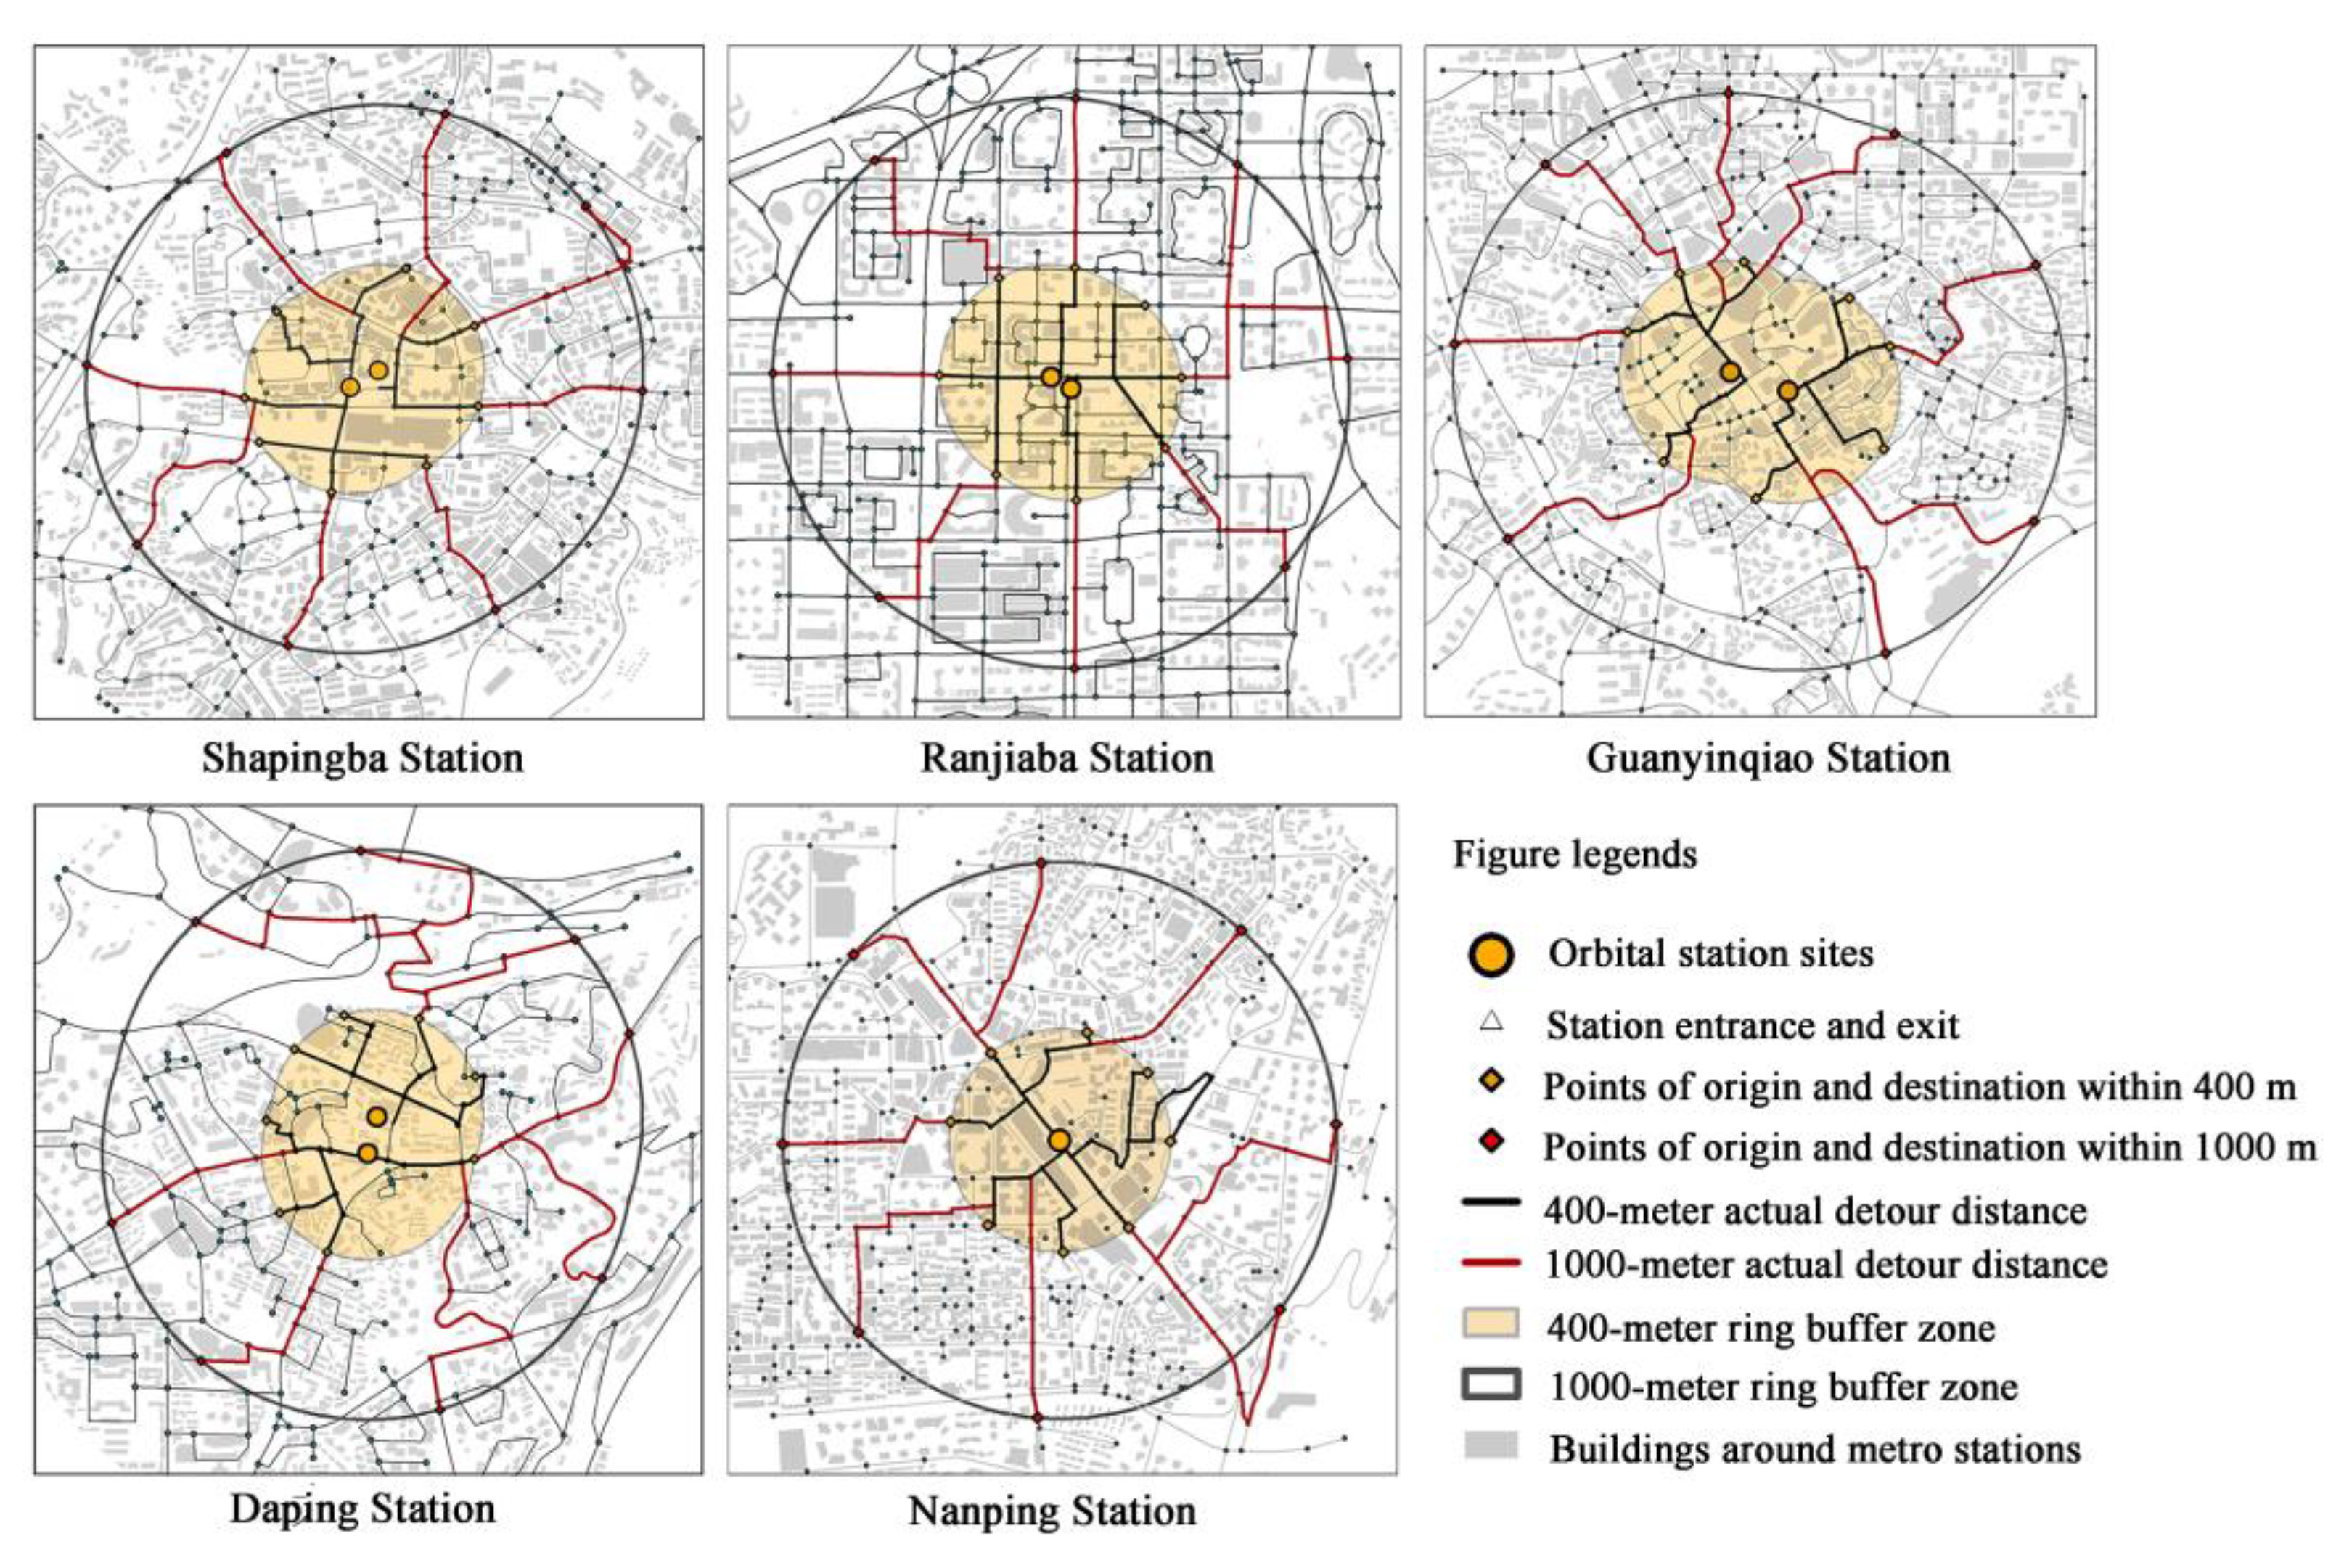
Comprehensive evaluation factors offer a broad analysis of various differential phenomena, while indicators of structural quality shed light on the specific differences arising from land development and the organization of transportation systems. These structural quality indicators are instrumental in identifying limitations in the design of pedestrian environments around metro transit station areas. They consist of six key indicators: land use type mixing degree, POI function mixing degree, intersection connectivity, median street length, pedestrian straightness coefficient, and green view rate. The pedestrian environmental impact factors and calculations for the metro station area are shown in Table 1.

4. Research Results and Analysis of Pedestrian Environment Factors

4.1. Research Results of Pedestrian Environment Factors

4.1.1. Comprehensive Evaluation Comparison

(1)
Pedestrian Catchment Area Ratio (A1)
With respect to the pedestrian catchment area ratio, we observe a spectrum ranging from the lowest to the largest, the stations are Daping Station (48.27%), Shapingba Station (53.28%), Nanping Station (61.34%), Ranjiaba Station (66.10%), and Guanyinqiao Station (66.32%).
Figure 4 offers insights into the spatial distribution of each station’s pedestrian catchment area (PCA). Specifically, Shapingba Station’s PCA is constricted in the northwest due to the closed management of nearby university campuses. Ranjiaba Station exhibits a relatively uniform, near-ideal rhombus-shaped PCA, with minor compression in the 400 m PCA range to the north and a more significant compression in the 1000 m PCA range due to the presence of Panxi River Park on its eastern flank. Guanyinqiao Station’s PCA takes on a leaf-like structure extending from northwest to southeast, largely influenced by the dense pedestrian network in this direction and the location of exit No. 8 on the south side. At Daping Station, natural and human-made boundaries such as Fotu Mountain Park, Hutouyan Tunnel, and the Xizhong metro line on the south and north sides force pedestrian into detours, resulting in a compressed 400 m PCA. Nanping Station’s actual pedestrian network and PCA stretch along both sides of the metro line, mirroring the shape observed at Guanyinqiao Station. However, a higher road density on the east and west sides contributes to a more elliptical form.
In general, the size and morphology of each metro transit station’s PCA are shaped by a confluence of factors, including road network density and structure, land use characteristics, management and ownership, block size, and topographical features.
(2)
POI Kernel Density (A2)
Analyzing the POI kernel density, we observe a spectrum of values from lowest to highest as follows: Ranjiaba Station (0.1896), Shapingba Station (0.4258), Nanping Station (0.4427), Daping Station (0.4646), and Guanyinqiao Station (0.6011).
The proximity of high-density POI clusters to metro transit station and the overall distribution of POI kernel density can reflect the degree to which station functionality correlates with pedestrian pathways.
Figure 5 offers a detailed visualization of the POI kernel density distribution for each metro transit station. Specifically, Shapingba Station’s POI density concentrates around the centrally located Sanxia Square, with a smaller cluster toward the southeast. The presence of the university campus in the northwest creates a dividing line, causing POIs to spread along its periphery and cultivating a vibrant street life atmosphere. Ranjiaba Station’s highest POI density, conversely, is situated in the Longhu Yuanzhu commercial district on the western edge, at a considerable distance from the station itself. This phenomenon is potentially attributable to the grid-like road network, which encourages a more dispersed distribution of POIs. Guanyinqiao Station presents a unique linear pattern in its POI kernel density distribution. This is due to the presence of numerous large-scale commercial facilities, such as Guanyinqiao Pedestrian Street, Longhu North City Tianjie, and Maoye Tiandi, which are situated contiguously along the east side of Jianxin North Road. Daping Station, facing competition from other commercial districts and transportation hubs in the southwest, no longer enjoys the advantage of spatial agglomeration. This is reflected in the shift of its highest POI kernel density toward the southwestern edge, suggesting that the station’s function as a transportation hub surpasses its commercial function. In other words, people are more likely to visit Daping Station for transfer purposes than for commercial activities. Finally, Nanping Station also displays a linear trend in its POI kernel density distribution, with the concentration primarily located in close proximity to the station itself.
(3)
Crowd Gathering Situation (A3)
Considering the emphasis on pedestrian behavior in metro transit stations areas, understanding the motivations driving pedestrian traffic—particularly commercial and transfer-related activities—is crucial for maximizing the economic and environmental benefits of station area development. Comparing pedestrian congregation patterns on weekends and weekdays offers valuable insights into a station’s ability to attract crowds and the underlying motivations for pedestrian visits (Figure 6).
Shapingba Station experiences consistent pedestrian congregation in the central Sanxia Square, irrespective of weekends or weekdays, while surrounding campuses exhibit lower pedestrian density. Ranjiaba Station displays the least pedestrian gathering among all stations. Specifically, during weekends, the focal point of pedestrian gathering at Ranjiaba is not the nearby Airong Hui commercial center, but rather the residential area surrounding the Red Star Macalline furniture market to the northwest. Even during peak hours, no significant pedestrian congregation appears, suggesting Ranjiaba Station’s limited appeal to pedestrian traffic. Guanyinqiao Station exhibits consistently high pedestrian density throughout the week, indicating its strong attraction to pedestrians. At Daping Station, the need for commuting and transfers during weekdays results in significantly higher pedestrian activity compared to weekends. Conversely, Nanping Station experiences greater pedestrian traffic on weekends, with crowds concentrated around commercial outlets along Jiangnan Avenue.
Among the five stations, except for Ranjiaba Station, the remaining stations exhibited significant activity. According to the general observation, Guanyinqiao Station attracted substantial crowds on both weekdays and weekends, indicating its potential as a central hub. Daping Station, on the other hand, served primarily as a transfer point for commuters, while Nanping Station attracted crowds primarily for commercial and leisure activities.
Considering the three key evaluation indicators, namely the dimensions and form of the PCR, the POI density distribution at focal points, and the patterns of crowds gathering across various times in the vicinity of metro transit stations, this study posits that Guanyinqiao Station exemplifies an optimal equilibrium in its overall efficacy, standing out as the top performer among the five research subjects. Shapingba Station is second, followed by Nanping Station. Ranjiaba Station and Daping Station occupy the final two positions, in that order.

4.1.2. Basic Scale Comparison

(1)
Floor Area Ratio (B1)
Analysis of floor area ratio indicates that Guanyinqiao Station possesses the highest value (2.5318) in its 1000 m ring buffer zone. In contrast, Shapingba Station exhibits a higher floor area ratio (3.0022) when considering the 1000 m PCA range. Conversely, Ranjiaba Station demonstrates the lowest floor area ratio in both the 1000 m ring buffer and PCA range. Specifically, the discrepancies in FAR between the two spatial scales for the five stations are relatively insignificant (Table 2).
(2)
Building Density (B2)
An analysis of building density indicates that Nanping Station exhibits the highest concentration (26.06%) in a 1000 m ring buffer zone, while Shapingba Station has the highest density (29.57%) in a 1000 m PCA range. Conversely, Ranjiaba Station displays the lowest building density in both the 1000 m ring buffer and 1000 m PCA range. Specifically, the five stations demonstrate significant discrepancies in building density between the 1000 m ring buffer and 1000 m PCA range, suggesting potential changes in spatial distribution patterns (Table 3).
(3)
Pedestrian Road Density (B3)
A study of pedestrian road density indicates that Ranjiaba Station consistently exhibits the highest values in both the 1000 m ring buffer and 1000 m PCA range. Conversely, Daping Station displays the lowest pedestrian road density across both indicators. Specifically, the ranking of pedestrian road density for all five metro transit stations remains consistent across both the ring buffer and PCA, suggesting minimal differences in pedestrian road density (Table 4).
(4)
Quantity of Station Entrances and Exits (B4)
With regard to metro transit station access points, Guanyinqiao and Daping Stations have the highest number at nine each, followed by Shapingba and Ranjiaba Stations with eight, while Nanping Station possesses the lowest count of six. The number of station entrances and exits will influence the extraction and comparison of PCA-related indicators.
Measurements of the basic scale of the metro transit station areas indicate that four of the five research subjects exhibit characteristics of high-density urban development. Ranjiaba Station, however, presents an exception, with its lower basic scale score suggesting a less compact land development model. This is reflected in the failure of building structures to effectively enclose street spaces, resulting in a scattering of open spaces in individual plots.

4.1.3. Structural Quality Comparison

(1)
Land Use Type Mixing Degree (C1)
Analysis of land use mixing degree indicates that Shapingba and Daping stations demonstrate a high degree of diversity in their immediate surroundings. While Shapingba exhibits a strong presence of educational and commercial land uses, the remaining four stations are predominantly characterized by residential land use, both in the 1000 m buffer zone and the 1000 m PCA (Table 5).
(2)
POI Function Mixing Degree (C2)
Analysis of POI data indicates a consistent pattern across all five metro transit stations, with shopping services constituting the dominant function in both the 1000 m buffer and PCA. While specific business formats remain largely similar across stations, a difference exist in the overall quantity of POIs present (Table 6).
(3)
Intersection Connectivity (C3)
Daping Station’s 1000 m PCA exhibits lower intersection connectivity compared to its 1000 m ring buffer, suggesting a higher prevalence of dead-end roads in its pedestrian catchment area, Guanyinqiao Station, despite having a relatively high number of intersections, which does not reach the expected connectivity levels. Conversely, Ranjiaba and Nanping Stations, despite having fewer intersections, demonstrate superior connectivity. This suggests that a grid-like road network layout cultivates greater connectivity between intersections, minimizes dead-end roads, and offers pedestrians a wider range of route choices. This study utilizes the OD Cost Matrix Analysis from the Network Analyst toolset and the Inverse Distance Weighted (IDW) interpolation method to comprehensively analyze and evaluate intersection connectivity. As illustrated in Figure 7, the intersection connectivity of each metro transit station displays a concentric distribution pattern, with values decreasing outward from the center. Specifically, all stations are located in the innermost zone characterized by the highest connectivity, indicating that their spatial layout has already established them as core areas for TOD development (Table 7).
(4)
Median Street Length (C4)
By comparing the average, median, and maximum values of street lengths, we can determine the distribution trends of street lengths in the ring buffer areas and pedestrian catchment areas of each station. The results indicate that, except for Nanping Station, all five research sites exhibit a characteristic where the median street length is lower than the average street length. This holds true for both the ring buffer area and the pedestrian catchment area (Table 8). This suggests that the street length values at the respective stations tend to concentrate in intervals higher than the median. Considering the specific averages and medians of the five stations, the average street length in metro transit station areas should be between 90 and 120 m, with room for individual variations.
(5)
Pedestrian Route Directness (PRD) (C5)
China’s guidelines provided by the Code for transport planning on urban road (GB 502220-95) [53] assert that the coefficient reflecting the indirectness of public transport routes should ideally not surpass 1.4. A PRD exceeding this threshold suggests a more complex network of pedestrian pathways in areas surrounding metro transit stations. Notably, Guanyinqiao Station exhibits the lowest PRD for both the 400 m and 1000 m ring buffer areas. This suggests an extensive array of navigational choices available at Guanyinqiao Station. Conversely, the 1000 m ring buffer area around Daping Station and the 400 m ring buffer area around Nanping Station both present PRDs that exceed 1.5 (Table 9, Figure 8). Further analysis of spatial data revealed that the increased PRDs at Daping Station, particularly near the northern Huacun Interchange and Fotuguan Park, as well as near Nanping Station’s eastern Guohui Mountain Park, can be attributed to the detours necessitated by the mountainous terrain.
(6)
Street Green View Index (C6)
In terms of Street Green View Index (C6), the stations are ranked from the least to the most green view as follows: Guanyinqiao Station (19.93%), Shapingba Station (20.97%), Ranjiaba Station (23.35%), Nanping Station (29.07%), and Daping Station (34.57%). Relevant studies indicate an inverted U-shaped correlation between the street green view index and the alleviation of pedestrian congestion. A green view perception between 15% and 25% is regarded as excellent, while a percentage beyond 25% is considered superior. However, excessive green view can also affect interface transparency [54,55,56]. Despite this, the greenery levels at all five stations are commendable, with Daping Station’s particularly green environment offering opportunities for enhancement through the strategic thinning of plant density.

4.2. Explanation and Analysis of Research Results

4.2.1. Evaluation Criteria and Comprehensive Results

According to the previous study on various environmental factors, the correlation between the trend of each environmental factor and the quality of the pedestrian environment can be defined (Table 10). It was discovered that the length of the median street (C5) and the pedestrian directness coefficient (C6) share an inverse relationship, whereas the number of station entrances/exits (B4) and the street green view index (C6) are neutral. The remaining environmental factors display a positive relationship with the quality of the environment. A greater median street length (C5) suggests a reduced number of intersections in the vicinity of the station, limiting pedestrian pathway choices and reducing the road network’s service area. This scarcity of incidental opportunities for pedestrians to pause and linger renders the area less appealing for relaxed, aimless strolls, potentially leading to quicker cognitive exhaustion and loss of interest in walking. A higher pedestrian directness coefficient (PRD) (C5) signifies a more circuitous route for pedestrians around the metro station area. A significant detour in a specific quadrant could reduce the PCA in that direction. The quantity of station entrances/exits (B4) and the street green view index (VGI) (C6), while not directly dictating the pedestrian environment’s quality, offer valuable insights for urban planning.

4.2.2. Descriptive Statistics of Pedestrian Environment Factors

This study also evaluates the PCA’s internal variability, demonstrated the descriptive statistics—minimum, maximum, average values, standard deviation, and skewness—for various factors across the five subjects, as presented in Table 11.
The differences in the PCA scale are most pronounced in the 400 m core area. The positive skew of the numerical statistics indicates an asymmetrical distribution leaning toward the right and the minimum influencing value observed at Shapingba Station, whereas the comparative results of PCR are negatively skewed for all five stations.
The specific changes in POIs relate to land development and the spatial draw of the metro station area. Irrespective of Kernel_Max or the number of POIs, the minimum value for both is found at Ranjiaba Station.
Land development-related factors, such as the plot ratio and building density, tend to lean toward lower values, influenced by the baseline set by Ranjiaba Station. However, on average, the correlation factors at the other stations still maintain relatively higher values.
The diversity in the pedestrian environment is affected by the mix of land use and the variety of POI functions, which play a crucial role in fulfilling the needs of non-transfer travel. The statistical results demonstrate a consistent negative skewness across all continuous factors, though the standard deviation of POI function mixing degree is not significant. In contrast, Nanping Station stands out for its high proportion of residential land, indicating opportunities for transformation.
The minimum values for pedestrian road density and intersection connectivity are both observed at Daping Station. This suggests that Daping Station needs further improvements to the pedestrian road capacity.
The median street length and PRD, despite their inverse relationship, both exhibit a tendency toward higher values, suggesting that optimization efforts should target the station marking the lowest values. Specifically, Guanyinqiao Station has the lowest one for a 400 m radius, and also records the shortest median street length. Evaluating the performance of each station, the enhancement of the transportation network could take cues from the spatial features unique to Guanyinqiao Station.
In summary, this study performs an analysis of the relationship and asymmetry among different variables. It is found that Guanyinqiao Station and Shapingba Station exhibit superior performance in comparison to the other three stations under review. It is suggested that these remaining stations could benefit from tailored design improvements, taking into account their unique geographical and transportational attributes.

4.2.3. Pearson Correlation Coefficients of Transportation Factors

The previous study identified strong correlations between various environmental factors in the TOD transport framework. Therefore, a Pearson correlation analysis was applied to appraise the environmental factors surrounding each metro station area (Table 12).
The analysis results demonstrate that the correlation coefficient between the size of the PCA and the density of pedestrian pathways is notably high at 0.826, signifying a strong and positive correlation. There appears to be a significant negative correlation between PCA size and both the median length of streets and PRD. Meanwhile, the relationship between building density and the degree of intersection interconnectivity appears to be minor. Overall, it is evident that factors associated with the transport framework influence both the dimensions and configuration of the PCA, with the variance in these factors collectively shaping the land use patterns around metro station zones. To boost land use efficiency and enhance walkability around metro station areas, priority should be given to improving the quantity and quality of roadway infrastructure in their spatial layout. Moreover, it is crucial to implement design adjustments in response to land system feedback promptly. Promoting spatial diversity is key to accommodating a range of travel needs in the PCA to the fullest extent.

5. Chongqing Metro Transit Station Walking Environment Optimization Study

5.1. Design Strategies for Metro Transit Station Walking Environment

This study argues that the determinants of the pedestrian environment in metro station zones can be categorized into three categories: comprehensive evaluation, basic scale, and structural quality. Nonetheless, each factor is integral to the broader frameworks of land use and transportation. Metro station areas optimized for pedestrian access should exhibit certain spatial organizational traits, and identifying these characteristics can lead to effective design approaches for enhancing the pedestrian experience in these areas.
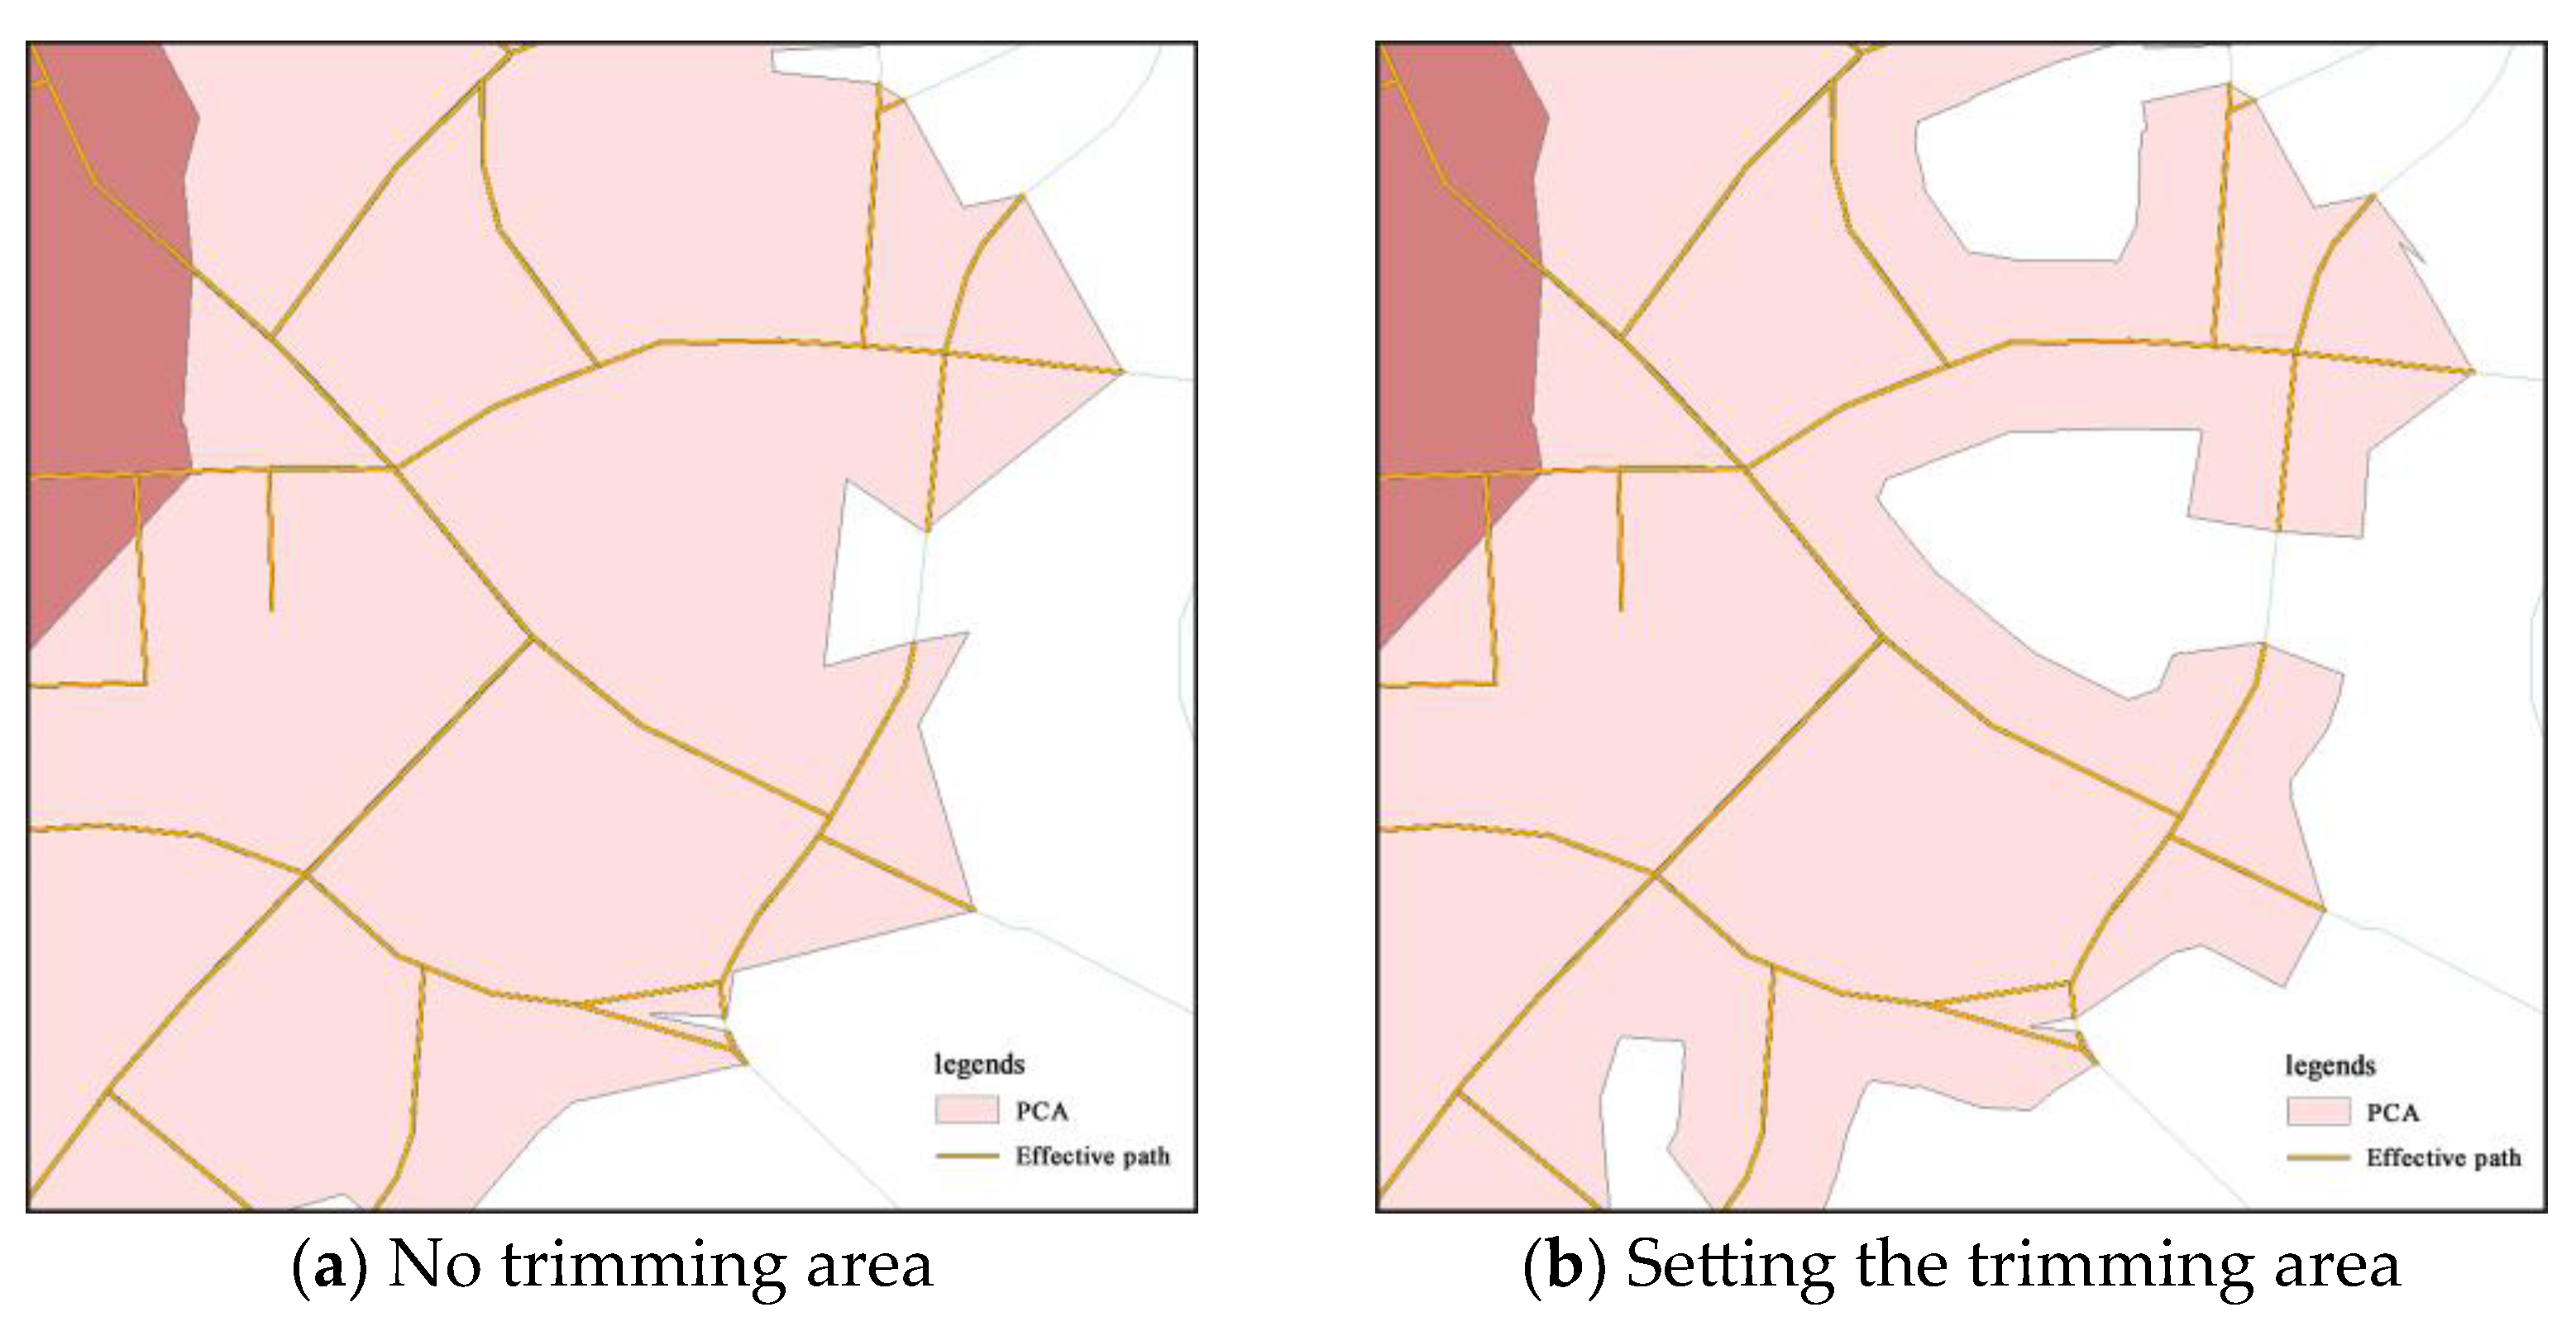
In terms of the land system: (1) Implement compact development in metro station areas to ensure functional mix and diversity. This approach, characterized by high density and intensity, shortens distances between functions and increases the number of potential metro transit users and pedestrians in walking distance. In addition, each metro station should emphasize land-use compatibility. (2) In station core areas, attractive public centers should be created. Such centers highlight the advantages of pedestrian traffic and strengthen the connection between pedestrian behavior and urban space. This convergence of activity and transportation hubs offers mutually beneficial growth potential. (3) To ensure accessibility and maintain the integrity of pedestrian catchment areas and potential paths, large-scale functions and projects should be positioned with specific requirements on the outskirts of the stations, but in acceptable walking distances. The nature of these developments—including large land areas, closed management, and potentially poor land compatibility—can disrupt pedestrian pathways. (4) The advantages of walking by restricting private motorized traffic in core station areas should be emphasized. Metro station TOD should prioritize pedestrian traffic. Limiting private vehicles highlights the benefits of walking, reinforces positive pedestrian attitudes, and encourages potential pedestrians to embrace walking.
In terms of the transportation system: (1) Increase the density of pedestrian walkways to enhance the network of pedestrian paths, thereby reducing their dependency on roads designated for motor vehicles. Pedestrian routes offer the advantage of flexibility, allowing them to exist independently of vehicular lanes. By combing urban streets, alleys, and adjacent structures to incorporate pedestrian facilities, transform building sites, and carry out other design measures, it is possible to significantly increase the network of walkways near metro stations. This approach will lead to a comprehensive pedestrian path network, improving the connectivity of the road system. (2) In the core areas of stations, where the intermingling of pedestrian and vehicle traffic is especially significant, introducing traffic calming strategies is necessary. This can be achieved by directing traffic flow away from these congested zones using permeable transportation options, realigning roads to naturally reduce vehicle speed, creating separate paths for pedestrians and vehicles through underpasses, and designing traffic plans that favor pedestrian movement. Such measures aim to balance the needs of pedestrian and private vehicle traffic around metro stations, without entirely excluding the latter. (3) Promote pedestrianization in metro station areas, categorize road types and align them in a manner that favors pedestrian access in metro station vicinities. This involves a detailed analysis of urban road designations, construction methodologies, and the utilization of land adjacent to these roads. The objective is to distinguish between main roads utilized for traffic and local roads that serve the daily needs of residents, assigning them appropriate importance. Main roads should be relocated to the periphery, while local roads should be situated in the core station area, either parallel to each other or in a circular layout. This strategy focuses on road design with a priority on pedestrian movements in and around metro station zones. (4) Development of a multilevel pedestrian transit system: Enhancing the efficiency of pedestrian movement necessitates the creation of a three-dimensional transportation network. The traditional, flat-plane approach to traffic movement can be inefficient and disorienting for pedestrians. A multilevel system offers varied path options across different planes and elevations, integrating with surrounding buildings to minimize travel distances.

5.2. Strategies for Optimizing Pedestrian Environments at Various Orbital Station Sites

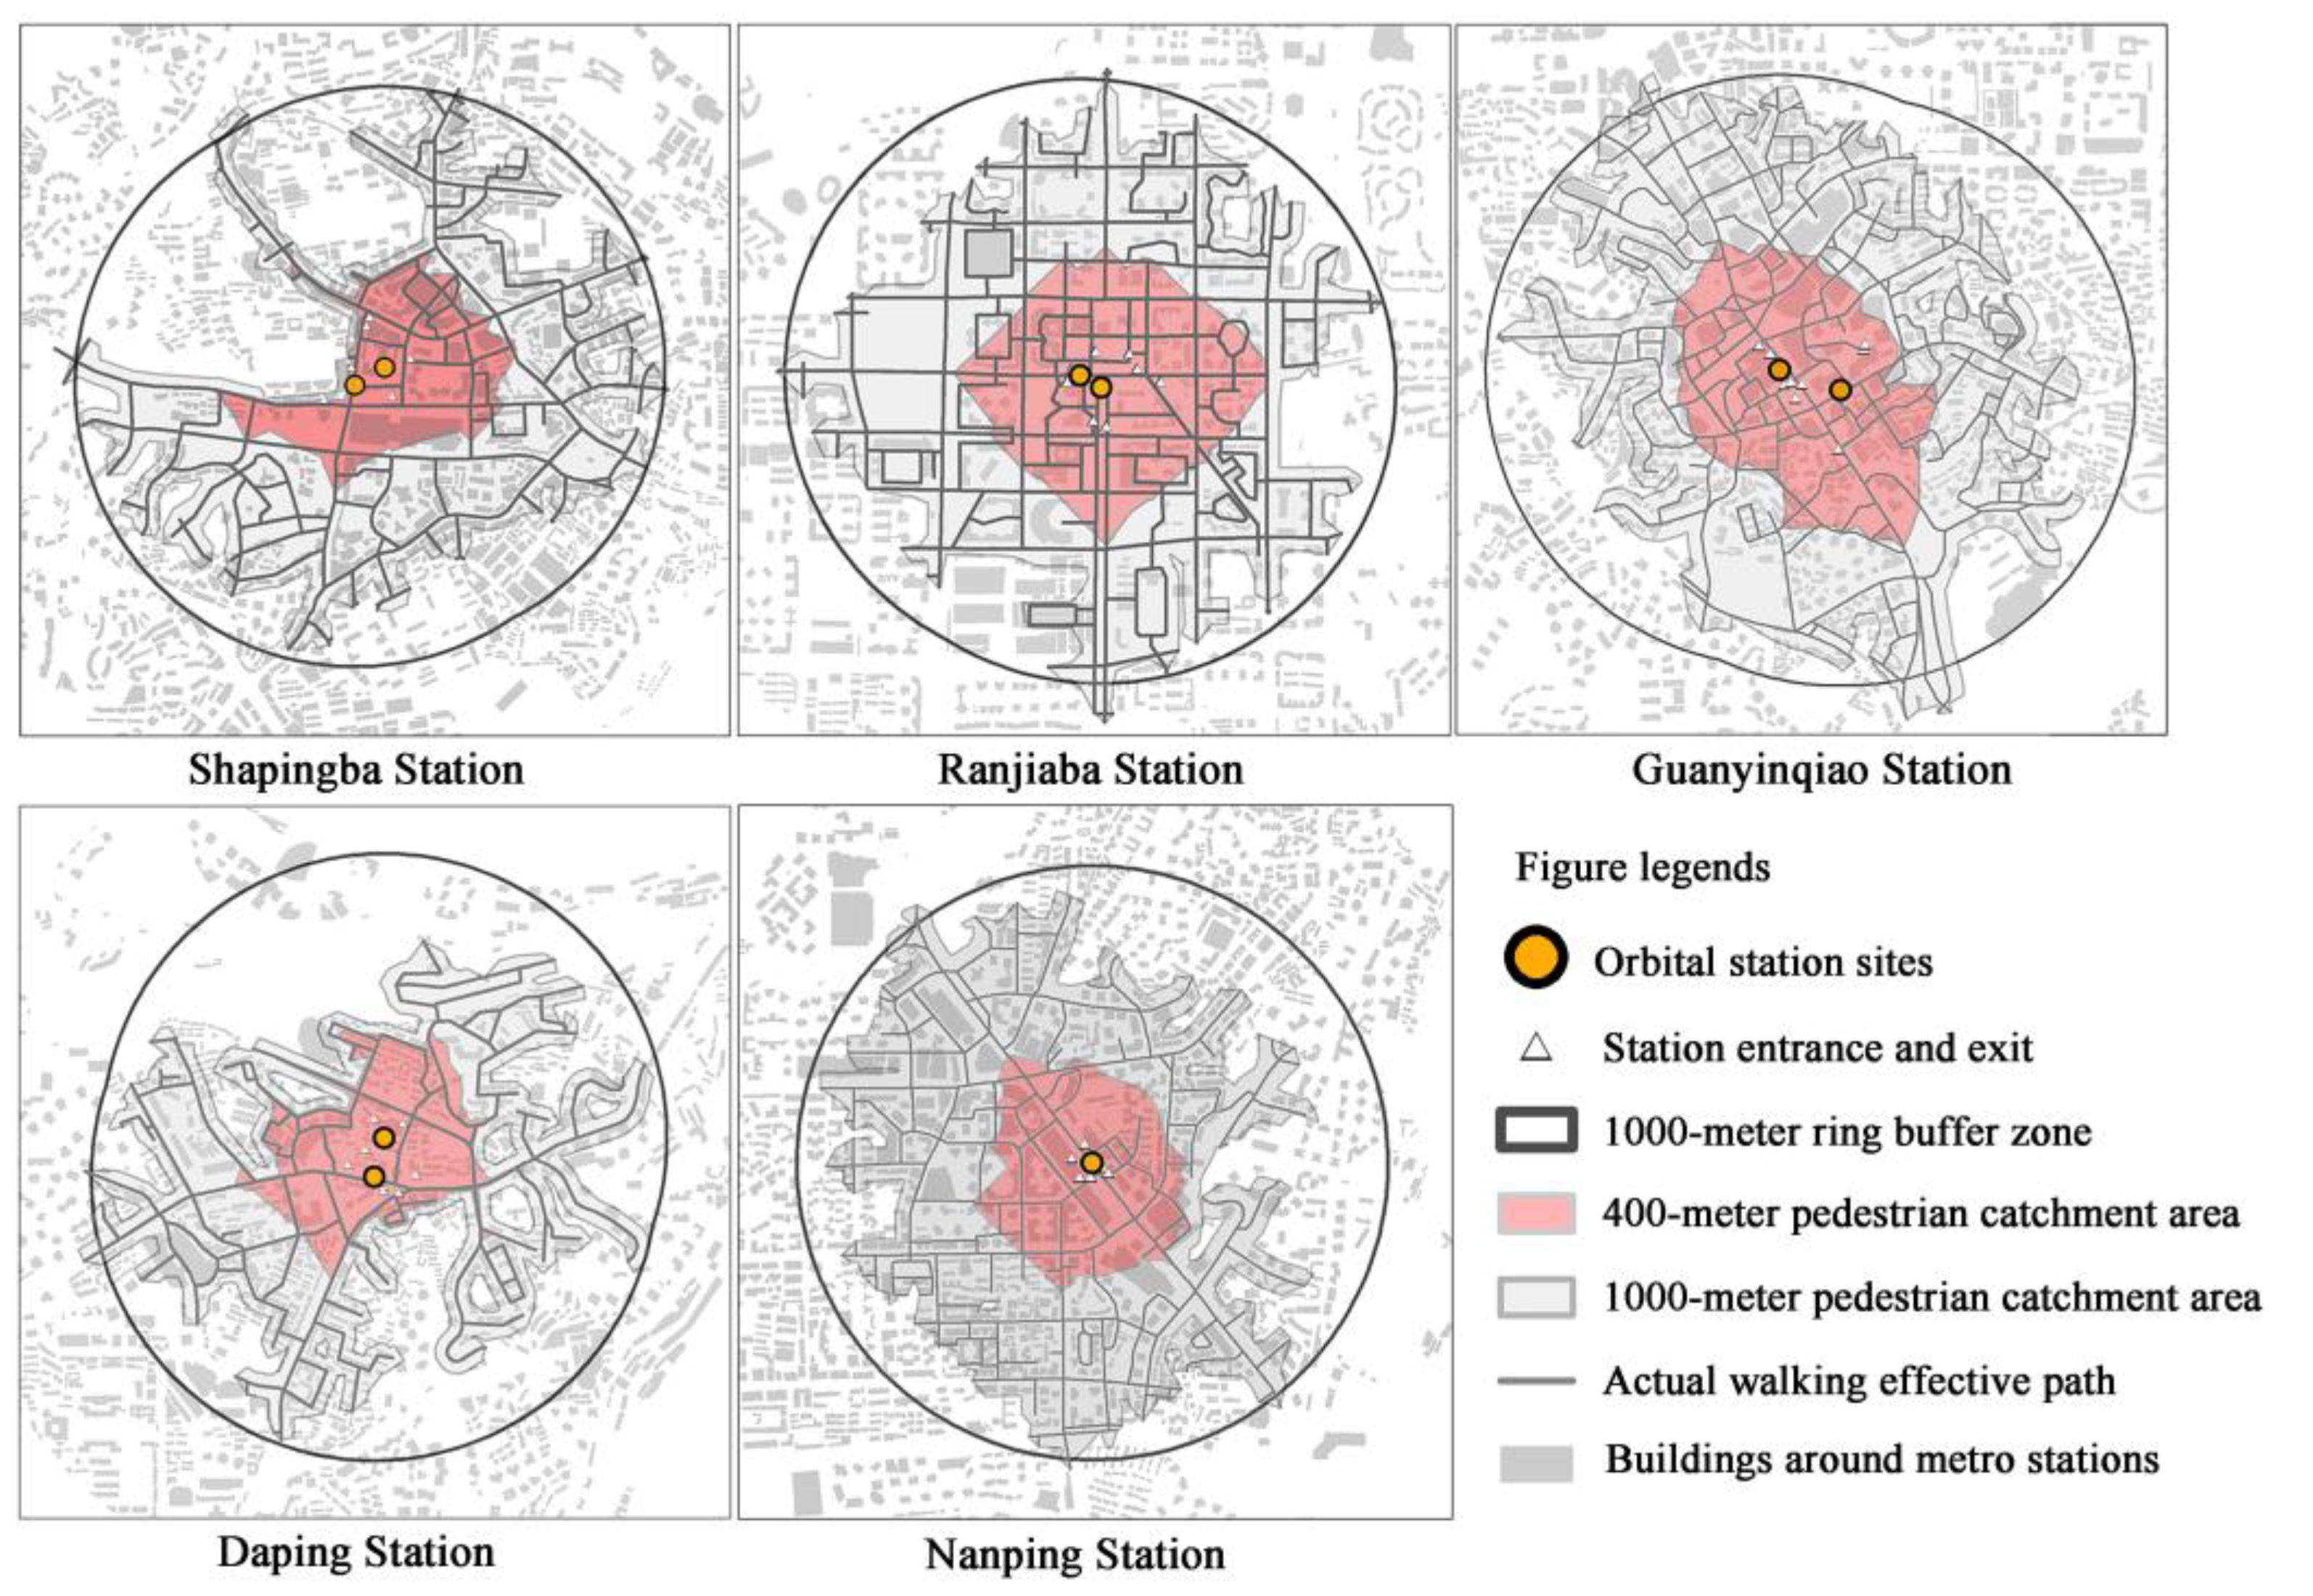
The areas to the north and south of Shapingba Station face spatial constraints due to the campus’s enclosed management, while the extensive centralized greenery of Shaping Park, located on the station’s southwest side, adversely affects the station area’s overall land use efficiency. Moreover, the high volume of traffic and volume of motor vehicles on nearby roads create human-made barriers, which restrict pedestrian movement. To address these challenges, we recommend the following optimization strategies: (1) To alleviate spatial compression, it is advisable to remove walls to extend the campus boundaries, thereby facilitating temporary pathways. This approach aims to mitigate the tension between land usage and transportation demands. By directing the flow of passengers to utilize internal roads during peak commuting times and holidays, we can offer a greater variety of routes and thereby broaden the accessible area around the metro station. (2) By reimagining centralized green areas, transitioning them from broad expanses to linear shapes, and eventually to focal points, we can boost land utilization. It is essential to promptly integrate underutilized parcels in the station’s vicinity into urban regeneration initiatives. This includes the creation, renovation, and enlargement of urban green spaces, such as street-side greenery, mini-parks, and green corridors, enhancing the living environment. Such measures should also aim to coordinate the spatial relationships between various land uses and the station. (3) To overcome the limitations imposed by artificial barriers, introducing vertical spatial integration and establishing access points that cross these barriers, is recommended. This involves separating pedestrian and vehicle traffic vertically in the traffic management design and constructing station entrances and exits to improve pedestrian transfer convenience.
The volume rate and the construction density at Ranjiaba Station rank as the lowest when compared to four other stations, and its geometric layout combined with the organization of factors does not favor the establishment of a TOD area in the vicinity of the metro station. The variety of POI functions at Ranjiaba Station is considered moderate, yet it has the smallest number of POIs among the stations in question. The areas surrounding the station predominantly consist of residential zones and government buildings, featuring uniform primary functions and enclosed spatial development patterns for each block, which restricts pedestrian access to city services. The layout of the streets and pathways at Ranjiaba Station results in a scattered arrangement of POIs, exhibiting less concentrated POI clusters compared to other nearby regions. In light of these challenges, we propose the following strategies for enhancement: (1) Adopt a compact development approach to address the issues related to the low density and intensity of development. This can be achieved by setting minimum thresholds for building density and volume rate through rigorous planning controls, thereby fostering a balance between environmental quality and the efficient use of space. Adjusting the share of land designated for roads and encouraging the creation of open spaces in blocks will support the desired high-density and vibrant spatial characteristics specific to the metro station area. (2) Introduce a variety of factors to cultivate appealing public areas near the station. (3) Restructure the distribution of road access to facilitate the development of pedestrian zones in the metro station area. This involves prioritizing pedestrian mobility services and imposing limitations on private vehicle traffic, with the aim of enhancing and protecting the community’s preference for walking as a mode of transport.
The quantified results from Guanyinqiao Station exhibit that, while several aspects are excellent, the connection between intersection buffering zones and PCA is notably weak. The landscape in the station’s vicinity features varying elevations, with roads that are both straight and winding, alongside the presence of cul-de-sacs in certain sections. Among the five stations analyzed, Guanyinqiao Station scored the lowest on the VGI, highlighting a less than ideal pedestrian experience. To enhance the walkability around the station, it is crucial to address the issue of cul-de-sacs by integrating them into a more comprehensive pedestrian network. Improving the design of street landscapes could also play a significant role in rendering longer walks more appealing, thereby encouraging greater participation in walking as a viable mode of transport.
With respect to Daping Station, it is observed that its connectivity as a transit hub surpasses its commercial appeal, and it displays a rather dense development pattern. However, in its vicinity, there exist underdeveloped plots such as aged residential blocks, governmental bodies, and public enterprises. Moreover, the 1000 m PRD assessment points out that Daping Station experiences the most significant detours for pedestrians among the stations studied. To foster a better walking environment around the station, it is necessary to promptly redevelop underutilized lands to boost land use efficiency, albeit in a constrained scope. Embracing high-density urban layouts where feasible will elevate the overall density of the station area. Concurrently, enhancing the pedestrian network by increasing the density of walkways and broadening their reach is essential for rendering the area more accessible and walk-friendly.
The residential land use of Nanping Station is excessively concentrated, paired with a significant lack of diversity in both land utilization and the functions of POIs. Constructed in the mountainous terrain, Nanping Station contends with significant elevation differences, complicating the creation of efficient spatial connections with the nearby buildings. This situation adversely affects the walkability and convenience for pedestrians, particularly in navigating transfers. Moreover, an analysis with the 400 m PRD metric reveals a pronounced tendency for circuitous routes around Nanping Station. To address these challenges, we propose several optimization strategies aimed at enhancing the area’s functionality and accessibility: (1) promoting land use adjustment and improving the diversity of metro station domain. (2) In consideration of the significant elevation difference, a three-dimensional walking system to be established for walking efficiency enhancement in different directions and spatial levels is required. (3) Optimize the 400 m core circle layer road network to improve detours and highlight the advantages of walking. In addition to increasing pedestrian road density, attention should also be paid to the layout of surrounding land use. Encouraging non-residential functions in the core vicinity as well as establishing compatible land use policies can ensure that the area remains open and accessible, free from constraints of spatial ownership. Moreover, managing the dimensions of streets and land parcels can help in developing a compact, densely built environment that supports a pedestrian-oriented metro station area, through joint land and transport planning efforts. (4) The connection between the station entrances and exits as well as the walking system can be strengthened to facilitate residents’ walking transfers.

6. Conclusions

While metro transit demonstrably alleviates traffic congestion and improves the climate in densely populated urban areas, the pedestrian environment surrounding stations is often neglected during construction, hindering the full potential of walkability. This study addresses this critical gap by proposing pedestrian-focused improvement strategies, not only to enhance the walking experience in metro transit station areas but also to cultivate more human-centric and sustainable urban spaces. Optimizing the pedestrian environment in the station domain can increase the appeal of public transportation, encouraging a modal shift toward metro transit and promoting low-carbon walking habits. This transformation is expected to effectively reduce greenhouse gas emissions from the transportation sector, thereby addressing the challenge of climate change, and contributing meaningfully to the realization of sustainable urban development.
This article evaluates five metro transit stations in Chongqing as case studies and categorizes the factors influencing the environmental aspects of metro station zones into three groups: “comprehensive assessment”, “basic scale”, and “structural quality”. It employs a mix of quantitative and qualitative analyses to explore the relationship between various factors, facilitating a comparative review across different stations. Based on these analyses, this study proposes a series of pedestrian environment design strategies including land use and transportation. The strategies for land use advocate for “developing compact and diverse land use”, “strengthening attraction of station center”, “positioning large projects on the edge”, “restricting private transportation capabilities”. The strategies for transportation consist of “increasing pedestrian road density”, “traffic calming organization”, “subdivision of road types”, and “three-dimensional pedestrian traffic system”. This article concludes by identifying the challenges faced by the five stations and suggests improvement measures for pedestrian spaces at each location.
This paper carries out an objective evaluation of the metro transit station environment through quantitative analysis of key performance indicators and by informing optimization strategies for pedestrian flow and experience. Nonetheless, two limitations remain in this research: (1) The methodological approach lacks qualitative insights collected from pedestrian interviews. Future research should integrate quantitative and qualitative methodologies for a holistic evaluation. (2) The current indicators neglect the effect of weather conditions on pedestrian behavior. Further analysis is required to optimize and assess pedestrian-centric design solutions in extreme temperatures.

Author Contributions

Conceptualization, C.Y. and G.L.; methodology, G.L. and S.Y.; software, C.Y. and G.L.; validation, C.Y. and G.L.; formal analysis, C.Y. and G.L.; investigation, G.L.; data curation, G.L.; writing—original draft preparation, C.Y. and G.L.; writing—review and editing, C.Y.; visualization, C.Y. and G.L.; supervision, S.Y.; project administration, S.Y.; funding acquisition, S.Y. All authors have read and agreed to the published version of the manuscript.

Funding

This research is supported by National key R&D plan “Joint Research and Demonstration for Carbon Reduction Key Technologies in Urban areas and Neighborhoods” (NO.2022YFE0208700).

Data Availability Statement

Data are contained within the article.

Conflicts of Interest

The authors declare no conflicts of interest.

References

  1. Liu, Q. Walking scale of tod area along rail transit line. City Plan. Rev. 2019, 43, 88–95. (In Chinese) [Google Scholar]
  2. Pan, H. Urban rail transit and sustainable development. Urban Transp. China 2008, 4, 35–39. (In Chinese) [Google Scholar]
  3. Calthorpe, P. The Next American Metropolis: Ecology, Community, and the American Dream; Princeton Architectural Press: New York, NY, USA, 1993. [Google Scholar]
  4. Wey, W.-M.; Zhang, H.; Chang, Y.-J. Alternative transit-oriented development evaluation in sustainable built environment planning. Habitat Int. 2016, 55, 109–123. [Google Scholar] [CrossRef]
  5. Papa, E.; Bertolini, L. Accessibility and Transit-Oriented Development in European metropolitan areas. J. Transp. Geogr. 2015, 47, 70–83. [Google Scholar] [CrossRef]
  6. Cucuzzella, C.; Owen, J.; Goubran, S.; Walker, T. A TOD index integrating development potential, economic vibrancy, and socio-economic factors for encouraging polycentric cities. Cities 2022, 131, 103980. [Google Scholar] [CrossRef]
  7. Sung, H.; Oh, J.-T. Transit-oriented development in a high-density city: Identifying its association with transit ridership in Seoul, Korea. Cities 2011, 28, 70–82. [Google Scholar] [CrossRef]
  8. Kamruzzaman, M.; Baker, D.; Washington, S.; Turrell, G. Residential dissonance and mode choice. J. Transp. Geogr. 2013, 33, 12–28. [Google Scholar] [CrossRef]
  9. Higgins, C.D.; Kanaroglou, P.S. A latent class method for classifying and evaluating the performance of station area transit-oriented development in the Toronto region. J. Transp. Geogr. 2016, 52, 61–72. [Google Scholar] [CrossRef]
  10. Griffiths, B.; Curtis, C. Effectiveness of Transit Oriented Development in Reducing Car Use: Case Study of Subiaco, Western Australia. Urban Policy Res. 2017, 35, 391–408. [Google Scholar] [CrossRef]
  11. Ibraeva, A.; Correia, G.H.d.A.; Silva, C.; Antunes, A.P. Transit-oriented development: A review of research achievements and challenges. Transp. Res. Part A Policy Pract. 2020, 132, 110–130. [Google Scholar] [CrossRef]
  12. Feldman, S.; Lewis, P.; Schiff, R. Transit-oriented Development in the Montreal Metropolitan Region Developer’s Perceptions of Supply Barriers. Can. J. Urban Res. 2012, 21, 25–44. [Google Scholar]
  13. Topalovic, P.; Carter, J.; Topalovic, M.; Krantzberg, G. Light Rail Transit in Hamilton: Health, Environmental and Economic Impact Analysis. Soc. Indic. Res. 2012, 108, 329–350. [Google Scholar] [CrossRef]
  14. Guthrie, A.; Fan, Y. Developers’ perspectives on transit-oriented development. Transp. Policy 2016, 51, 103–114. [Google Scholar] [CrossRef]
  15. Paulhiac Scherrer, F. Assessing Transit-Oriented Development Implementation in Canadian Cities: An Urban Project Approach. J. Plan. Educ. Res. 2019, 39, 469–481. [Google Scholar] [CrossRef]
  16. Schlossberg, M.; Brown, N. Comparing Transit-Oriented Development Sites by Walkability Indicators. Transp. Res. Rec. 2004, 1887, 34–42. [Google Scholar] [CrossRef]
  17. Estupiñán, N.; Rodríguez, D.A. The relationship between urban form and station boardings for Bogotá’s BRT. Transp. Res. Part A Policy Pract. 2008, 42, 296–306. [Google Scholar] [CrossRef]
  18. Jacobson, J.; Forsyth, A. Seven American TODs: Good practices for urban design in transit-oriented development projects. J. Transp. Land Use 2008, 1, 51–88. [Google Scholar] [CrossRef]
  19. Vale, D.S. Transit-oriented development, integration of land use and transport, and pedestrian accessibility: Combining node-place model with pedestrian shed ratio to evaluate and classify station areas in Lisbon. J. Transp. Geogr. 2015, 45, 70–80. [Google Scholar] [CrossRef]
  20. King, T.L.; Bentley, R.J.; Thornton, L.E.; Kavanagh, A.M. Does the presence and mix of destinations influence walking and physical activity? Int. J. Behav. Nutr. Phys. Act. 2015, 12, 115. [Google Scholar] [CrossRef] [PubMed]
  21. Morency, P.; Plante, C.; Dubé, A.-S.; Goudreau, S.; Morency, C.; Bourbonnais, P.-L.; Eluru, N.; Tétreault, L.-F.; Hatzopoulou, M.; Iraganaboina, N.C.; et al. The Potential Impacts of Urban and Transit Planning Scenarios for 2031 on Car Use and Active Transportation in a Metropolitan Area. Int. J. Environ. Res. Public Health 2020, 17, 5061. [Google Scholar] [CrossRef] [PubMed]
  22. Nasri, A.; Zhang, L. How Urban Form Characteristics at Both Trip Ends Influence Mode Choice: Evidence from TOD vs. Non-TOD Zones of the Washington, D.C. Metropolitan Area. Sustainability 2019, 11, 3403. [Google Scholar] [CrossRef]
  23. Dill, J. Measuring network connectivity for bicycling and walking. In Proceedings of the Proceedings of the 83rd Annual Meeting of the Transportation Research Board, Washington, DC, USA, 11–15 January 2004; pp. 11–15. [Google Scholar]
  24. Marshall, W.E.; Garrick, N.W. Effect of Street Network Design on Walking and Biking. Transp. Res. Rec. J. Transp. Res. Board 2010, 2198, 103–115. [Google Scholar] [CrossRef]
  25. Jones, T.; Horton, D.; Mullen, C.; Pooley, C.; Scheldeman, G.; Strano, E.; Tight, M. The role of street network connectivity and access to everyday facilities in shaping everyday walking and cycling in English cities. In Strategies for Sustainable Mobilities; Routledge: London, UK, 2016; pp. 15–38. [Google Scholar]
  26. Lu, Y.; Wang, D. Walkability measuring in america and lts enlightenment. Urban Plan. Int. 2012, 27, 10–15. (In Chinese) [Google Scholar]
  27. Yin, L. Street level urban design qualities for walkability: Combining 2D and 3D GIS measures. Comput. Environ. Urban Syst. 2017, 64, 288–296. [Google Scholar] [CrossRef]
  28. Peiravian, F.; Derrible, S.; Ijaz, F. Development and application of the Pedestrian Environment Index (PEI). J. Transp. Geogr. 2014, 39, 73–84. [Google Scholar] [CrossRef]
  29. Mayne, D.; Morgan, G.; Wilmore, A.; Bauman, A.; Jalaludin, B.; Bambrick, H.; Rose, N.; Rodgers, B.; Bennett, C. An objective index of walkability for the Sydney metropolitan region. J. Sci. Med. Sport 2012, 15, S32–S33. [Google Scholar] [CrossRef]
  30. Millstein, R.A.; Cain, K.L.; Sallis, J.F.; Conway, T.L.; Geremia, C.; Frank, L.D.; Chapman, J.; Van Dyck, D.; Dipzinski, L.R.; Kerr, J.; et al. Development, scoring, and reliability of the Microscale Audit of Pedestrian Streetscapes (MAPS). BMC Public Health 2013, 13, 403. [Google Scholar] [CrossRef]
  31. Kurka, J.M.; Adams, M.A.; Geremia, C.; Zhu, W.; Cain, K.L.; Conway, T.L.; Sallis, J.F. Comparison of field and online observations for measuring land uses using the Microscale Audit of Pedestrian Streetscapes (MAPS). J. Transp. Health 2016, 3, 278–286. [Google Scholar] [CrossRef]
  32. Gou, A.; Bo, W. SD method based street space vitality evaluation. Planners 2011, 27, 102–106. (In Chinese) [Google Scholar]
  33. Shatu, F.; Yigitcanlar, T. Development and validity of a virtual street walkability audit tool for pedestrian route choice analysis—SWATCH. J. Transp. Geogr. 2018, 70, 148–160. [Google Scholar] [CrossRef]
  34. Yan, T.; Ren, L.; Gao, H. Integrative urban design for urban railway station vicinity: Beiing M15 line shunyi section case. Planners 2012, 28, 42–45. (In Chinese) [Google Scholar]
  35. Guo, W.; Hou, X. Desian strategies for urban pedestrian space under the tod mode. Landsc. Archit. 2015, 5, 100–104. (In Chinese) [Google Scholar] [CrossRef]
  36. Zhao, P.; Wang, Y. The empirical study on pedestrian-friendly tod design-A case of beijing municipality. J. Hum. Settl. West China 2015, 30, 36–40. (In Chinese) [Google Scholar] [CrossRef]
  37. Bai, W. Community Development of Rail Transit Terminal Area: Ningbo TOD Community Case. Planners 2015, 31, 63–68. (In Chinese) [Google Scholar]
  38. Olaru, D.; Curtis, C. Designing TOD precincts: Accessibility and travel patterns. Eur. J. Transp. Infrastruct. Res. 2015, 15, 6–26. [Google Scholar] [CrossRef]
  39. Jeffrey, D.; Boulangé, C.; Giles-Corti, B.; Washington, S.; Gunn, L. Using walkability measures to identify train stations with the potential to become transit oriented developments located in walkable neighbourhoods. J. Transp. Geogr. 2019, 76, 221–231. [Google Scholar] [CrossRef]
  40. Lamour, Q.; Morelli, A.M.; Marins, K.R.d.C. Improving walkability in a TOD context: Spatial strategies that enhance walking in the Belém neighbourhood, in São Paulo, Brazil. Case Stud. Transp. Policy 2019, 7, 280–292. [Google Scholar] [CrossRef]
  41. O’Sullivan, S. Walking Distances to and from Light Rail Transit Stations in Calgary. Master’s Thesis, University of Calgary, Calgary, AB, Canada, 1996. [Google Scholar]
  42. Nasri, A.; Zhang, L. The analysis of transit-oriented development (TOD) in Washington, DC and Baltimore metropolitan areas. Transp. Policy 2014, 32, 172–179. [Google Scholar] [CrossRef]
  43. Liu, Q. Factors affecting circle structure of tod concentric models. Urban Plan. Int. 2017, 32, 72–79. (In Chinese) [Google Scholar] [CrossRef]
  44. Jaafar Sidek, M.F.; Bakri, F.A.; Kadar Hamsa, A.A.; Aziemah Nik Othman, N.N.; Noor, N.M.; Ibrahim, M. Socio-economic and Travel Characteristics of transit users at Transit-oriented Development (TOD) Stations. Transp. Res. Procedia 2020, 48, 1931–1955. [Google Scholar] [CrossRef]
  45. Andersen, J.L.E.; Landex, A. Catchment areas for public transport. WIT Trans. Built Environ. 2008, 101, 175–184. [Google Scholar]
  46. Jun, M.-J.; Choi, K.; Jeong, J.-E.; Kwon, K.-H.; Kim, H.-J. Land use characteristics of subway catchment areas and their influence on subway ridership in Seoul. J. Transp. Geogr. 2015, 48, 30–40. [Google Scholar] [CrossRef]
  47. Pafka, E.; Dovey, K. Permeability and interface catchment: Measuring and mapping walkable access. J. Urban. Int. Res. Placemaking Urban Sustain. 2017, 10, 150–162. [Google Scholar] [CrossRef]
  48. Cervero, R.; Kockelman, K. Travel demand and the 3Ds: Density, diversity, and design. Transp. Res. Part D Transp. Environ. 1997, 2, 199–219. [Google Scholar] [CrossRef]
  49. Cervero, R. Built environments and mode choice: Toward a normative framework. Transp. Res. Part D Transp. Environ. 2002, 7, 265–284. [Google Scholar] [CrossRef]
  50. Lee, C.; Moudon, A.V. The 3Ds+R: Quantifying land use and urban form correlates of walking. Transp. Res. Part D Transp. Environ. 2006, 11, 204–215. [Google Scholar] [CrossRef]
  51. Kamruzzaman, M.; Shatu, F.M.; Hine, J.; Turrell, G. Commuting mode choice in transit oriented development: Disentangling the effects of competitive neighbourhoods, travel attitudes, and self-selection. Transp. Policy 2015, 42, 187–196. [Google Scholar] [CrossRef]
  52. Li, G. Research on the Influence Factors of Pedestrian Environment in Chongqing Subway Station Area—Take 5 Typical Stations for Example. Master’s Thesis, Chongqing University, Chongqing, China, 2022. Available online: https://kns.cnki.net/kcms2/article/abstract?v=Skeo7MzZydZCr7gTm8SdgB2ESFbbhCSc8gGUQtH03Kl7qpEAnQLQ_hqXSvBViDOrywq5oyq0tJPiPsYa80iSLt7a-3f_JsmHOkLfz6sRBilOMsxYJbwIErDEA5DY4GLpu3XAjp4IuvlC27NMaexxnw==&uniplatform=NZKPT&language=CHS (accessed on 2 April 2024). (In Chinese).
  53. GB 50220-95; Code for Transport Planning on Urban Road. Planning Press of China: Beijing, China, 1995.
  54. Aikoh, T.; Homma, R.; Abe, Y. Comparing conventional manual measurement of the green view index with modern automatic methods using google street view and semantic segmentation. Urban For. Urban Green. 2023, 80, 127845. [Google Scholar] [CrossRef]
  55. Zhang, W.; Zeng, H. Spatial differentiation characteristics and influencing factors of the green view index in urban areas based on street view images: A case study of Futian District, Shenzhen, China. Urban For. Urban Green. 2024, 93, 128219. [Google Scholar] [CrossRef]
  56. Huang, D.; Jiang, B.; Yuan, L. Analyzing the effects of nature exposure on perceived satisfaction with running routes: An activity path-based measure approach. Urban For. Urban Green. 2022, 68, 127480. [Google Scholar] [CrossRef]
Figure 1. Distribution map of research object locations.
Buildings 14 01025 g001
Figure 2. Division of research area and influence area.
Buildings 14 01025 g002
Figure 3. Comparison of PCA before and after trimming area setting.
Buildings 14 01025 g003
Figure 4. Illustration of pedestrian catchment areas (PCAs) for various metro stations.
Buildings 14 01025 g004
Figure 5. Distribution of POI kernel density at each metro transit station.
Buildings 14 01025 g005
Figure 6. Crowd gathering at various metro transit stations on weekends and weekdays.
Buildings 14 01025 g006
Figure 7. Intersection connectivity of each metro transit station area.
Buildings 14 01025 g007
Figure 8. Illustration of PRD (pedestrian route directness) for each metro transit station area.
Buildings 14 01025 g008
Table 1. Factors influencing the pedestrian environment around metro transit stations.
CategoriesEncodingsIndicatorsCalculation Method
Comprehensive evaluation categoryA1Pedestrian catchment area ratio P C R = S P C A * S b u f f e r
A2POI kernel density distributionArcMap kernel density calculation tool
A3Crowd gatheringBaidu heat map vectorization
Basic scale categoryB1Floor area ratio F A R = ( i = 1 n S a r c * F l o o r ) / S b u f f e r
B2Building density D a r c = S a r c / S b u f f e r
B3Pedestrian road density D w a l k = L w a l k / S b u f f e r
B4The quantity of entrances and exits at metro transit stationsinformation access and field statistics
Structural quality categoryC1Land use type mixing degree D l a n d   m i x = n = 1 N S i * log S i
C2POI function mixing degree D p o i   m i x = p = 1 P N p * log N p
C3Intersection connectivity L j u n c t i o n = 2 m / N
C4Median street length M s t r e e = L ( m + 1 ) / 2
M s t r e e = ( L m 2 + L m 2 + 1 ) / 2
C5Pedestrian route directness P R D = M w a l k / L b u f f e r
C6Green view rateOpenCV tools
Table 2. Calculation results of floor area ratio (B1) for each metro station area.
StationFAR—in 1000 m Ring Buffer AreaFAR—in 1000 m Pedestrian Catchment AreaMagnitude of Change
Shapingba Station2.18763.00220.8146 ↑
Ranjiaba Station1.69081.81860.1278 ↑
Guanyinqiao Station2.53182.83060.2988 ↑
Daping Station1.78812.40580.6177 ↑
Nanping Station2.20512.70320.4981 ↑
↑ indicates rising
Table 3. Calculation results of building density (B2) for each metro station area.
StationBD—In 1000 M Ring Buffer AreaBD—in 1000 m Pedestrian Catchment AreaMagnitude of Change
Shapingba Station25.36%29.57%4.21% ↑
Ranjiaba Station16.85%17.25%0.4% ↑
Guanyinqiao Station25.81%28.26%2.45% ↑
Daping Station21.32%28.17%6.85% ↑
Nanping Station26.06%29.54%3.48% ↑
↑ indicates rising
Table 4. Calculation results of pedestrian road density (B3) for each metro station area.
StationPedestrian Road Density—in 1000 m Ring Buffer Area
(km/km2)
Pedestrian Road Density—in 1000 m Pedestrian Catchment Area
(km/km2)
Magnitude of Change
Shapingba Station9.783412.51542.732 ↑
Ranjiaba Station13.504915.21731.7124 ↑
Guanyinqiao Station11.543613.82592.2823 ↑
Daping Station8.259211.59393.3347 ↑
Nanping Station11.059112.96631.9072 ↑
↑ indicates rising
Table 5. Calculation results of land use type mixing degree (C1) for each metro station area.
Station1000 m Ring Buffer Area1000 m Pedestrian Catchment Area
Land Use Type Mixing DegreeDominant TypePercentageLand Use Type Mixing DegreeDominant TypePercentage
Shapingba Station0.9132Educational land32.32%0.9154Business land30.78%
Ranjiaba Station0.8386Residential land41.48%0.8235Residential land38.31%
Guanyinqiao Station0.80002Residential land42.04%0.8217Residential land38.15%
Daping Station0.9491Residential land29.64%0.9121Residential land32.28%
Nanping Station0.6812Residential land55.95%0.6447Residential land51.15%
Table 6. Calculation results of POI functional mixing degree (C2) for each metro station area.
Station1000 m Ring Buffer Area1000 M Pedestrian Catchment Area
POI Mixing DegreeDominant TypePercentagePOI Mixing DegreeDominant TypePercentage
Shapingba Station0.9394Shopping Services25.30%0.9242Shopping Services26.68%
Ranjiaba Station0.9750Shopping Services24.16%0.9597Shopping Services25.82%
Guanyinqiao Station0.9217Shopping Services26.74%0.9075Shopping Services27.80%
Daping Station0.9587Shopping Services23.24%0.9423Shopping Services26.22%
Nanping Station0.9622Shopping Services23.67%0.9452Shopping Services23.31%
Table 7. Calculation results of intersection connectivity (C3) for each metro station area.
Station1000 m Ring Buffer Area1000 m Pedestrian Catchment Area
Number of SectionsNumber of IntersectionsIntersection ConnectivityNumber of SectionsNumber of IntersectionsIntersection Connectivity
Shapingba Station3242063.14562441443.3889
Ranjiaba Station4202533.32023371973.4213
Guanyinqiao Station4633063.02614002563.1250
Daping Station1981332.97741541052.9333
Nanping Station3542283.10532821753.2229
Table 8. Calculation results of median street length (C4) for each metro station area.
Station1000 m Ring Buffer Area1000 M Pedestrian Catchment Area
Mean (M)Med (M)Max (M)Mean (M)Med (M)Max (M)
Shapingba Station135.6924117.7710730.4128122.8114107.6503730.4128
Ranjiaba Station141.0615118.9701549.0844130.9317112.9775543.0548
Guanyinqiao Station118.329695.2120513.6606108.798289.6119522.7639
Daping Station190.3246164.29721241.0906164.9648153.0923647.6561
Nanping Station130.0667150.7599669.9187117.4318151.0518345.9430
Table 9. Calculated pedestrian route directness (C5) for each subway station domain.
StationPRD-400 mPRD-1000 m
Shapingba Station1.29171.2003
Ranjiaba Station1.23471.2437
Guanyinqiao Station1.21691.2275
Daping Station1.34871.5264
Nanping Station1.51831.3047
Table 10. Correlation between environmental factors and pedestrian environment quality.
CategoriesEncodingsIndicatorsCorrelation
Comprehensive evaluation categoryA1Pedestrian catchment area ratioPositive correlation
A2POI kernel density distributionPositive correlation
A3Crowd gatheringPositive correlation
Basic scale categoryB1Floor area ratioPositive correlation
B2Building densityPositive correlation
B3Pedestrian road densityPositive correlation
B4The quantity of entrances and exits at metro transit stations--
Structural quality categoryC1 Land use type mixing degreePositive correlation
C2POI function mixing degreePositive correlation
C3Intersection connectivityPositive correlation
C4Median street lengthNegative correlation
C5Pedestrian route directnessNegative correlation
C6Green view rate--
Table 11. Descriptive statistics of environmental factors in PCA of each metro station area.
Environmental FactorsMinimum ValueMaximum ValuesAverage ValueStandard DeviationVariance Skewness
PCA-1000 m2.19123.14772.6373600.38545510.1490.343
PCA-400 m0.51350.80620.6349600.15401980.0240.600
PCR-1000 m0.48270.66320.5906200.08020290.006−0.571
POI kernel density maximum0.18960.60110.4247600.14858180.022−0.947
Number of POI385312,8968098.803570.9757412,751,867.70.190
Floor area ratio1.81863.00222.5520800.46433000.216−1.172
Building density0.17250.29570.2655800.05246400.003−2.145
Pedestrian road density11.593915.217313.2237601.37488891.8900.551
land use type mixing degree0.64470.91540.8234840.10986100.012−1.332
POI function mixing degree0.90750.95970.9357800.02023160.000−0.471
Intersection connectivity2.93333.42133.2182800.20016520.040−0.552
Median street length89.6119153.0923122.87676028.0321382785.8010.163
PRD-1000 m1.20031.52641.3005200.13195050.0171.804
PRD-400 m1.21691.51831.3220740.12124300.0151.336
Table 12. Pearson correlation coefficients of various metro station area transportation system factors.
PCA 1000 mBuilding Density in 1000 m Pedestrian Catchment AreaPedestrian Road Density in 1000 m Pedestrian Catchment AreaIntersection Connectivity in 1000 m Pedestrian Catchment AreaMedian Street Length in 1000 m Pedestrian Catchment AreaPRD 1000 m
PCA 1000 m1−0.0420.8260.295−0.733−0.634
Building density in 1000 m pedestrian catchment area−0.0421−0.47−0.193−0.074−0.218
Pedestrian road density in 1000 m pedestrian catchment area0.826−0.4710.628−0.554−0.628
Intersection connectivity in 1000 m pedestrian catchment area0.295−0.1930.6281−0.445−0.816
Median street length in 1000 m pedestrian catchment area−0.733−0.074−0.554−0.44510.775
PRD 1000 m−0.634−0.218−0.628−0.8160.7751
Disclaimer/Publisher’s Note: The statements, opinions and data contained in all publications are solely those of the individual author(s) and contributor(s) and not of MDPI and/or the editor(s). MDPI and/or the editor(s) disclaim responsibility for any injury to people or property resulting from any ideas, methods, instructions or products referred to in the content.

