
Optimized Design of Anchor Plates for 2200 MPa-Class Prestressing Anchorage Zones
Abstract
:1. Introduction
2. Theoretical Analysis
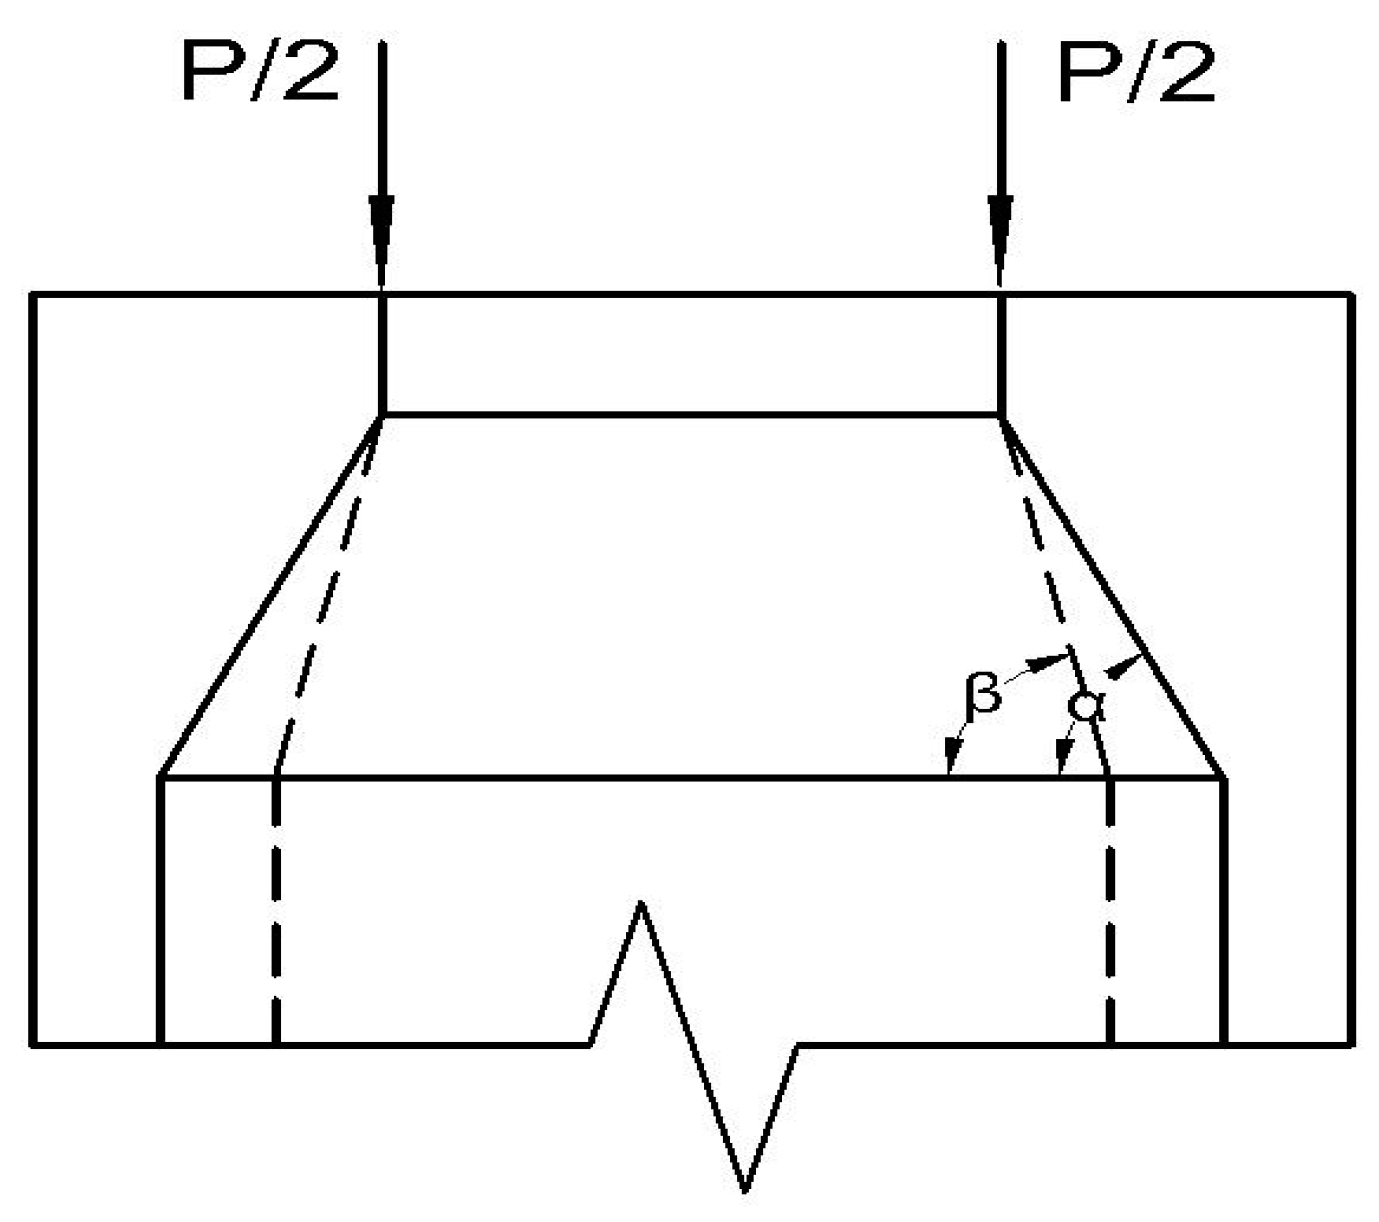
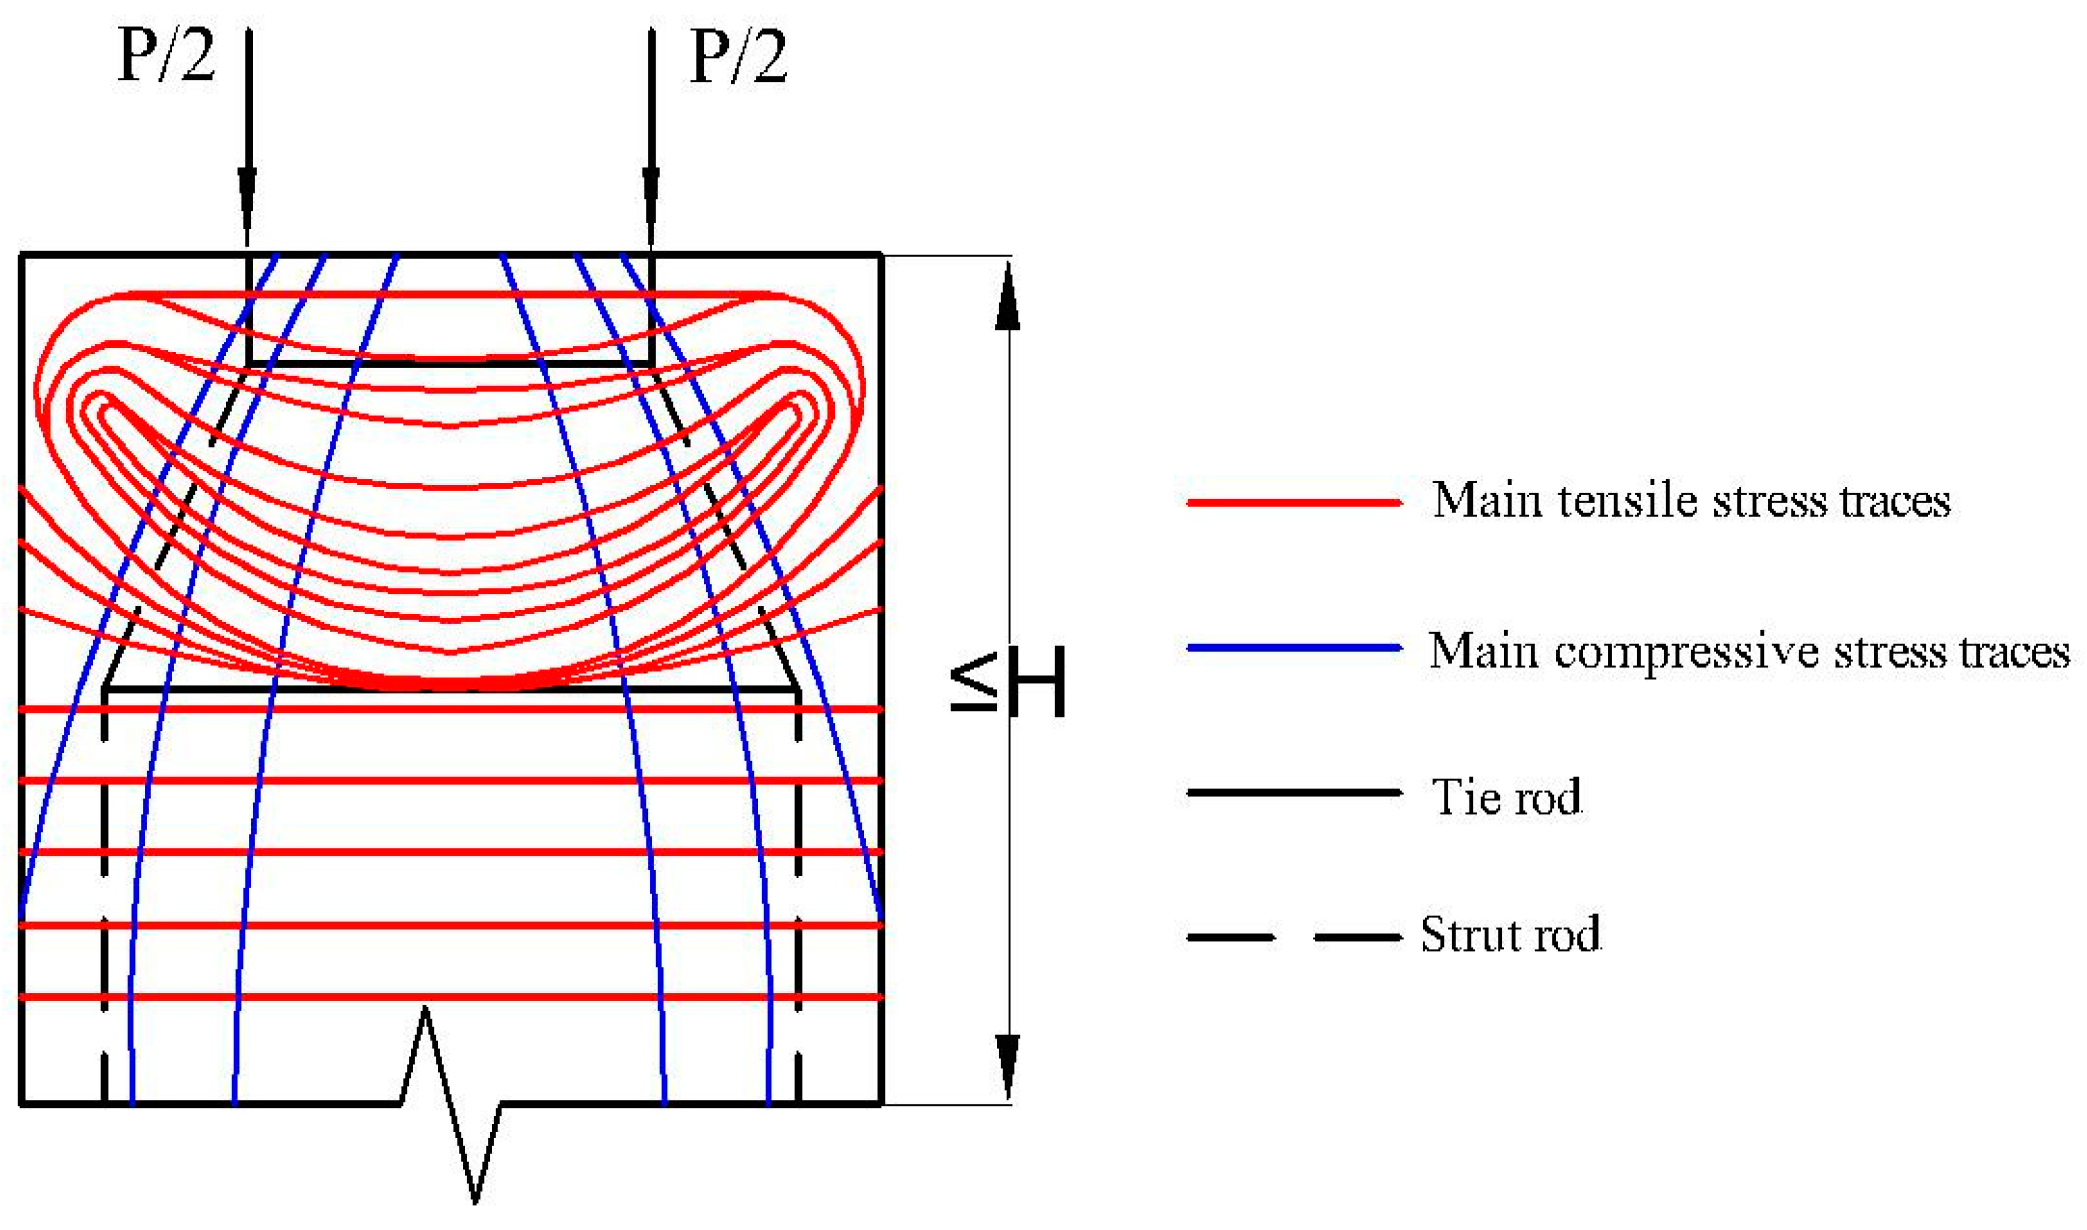
2.1. Basic Configuration of the Strut-and-Tie Model
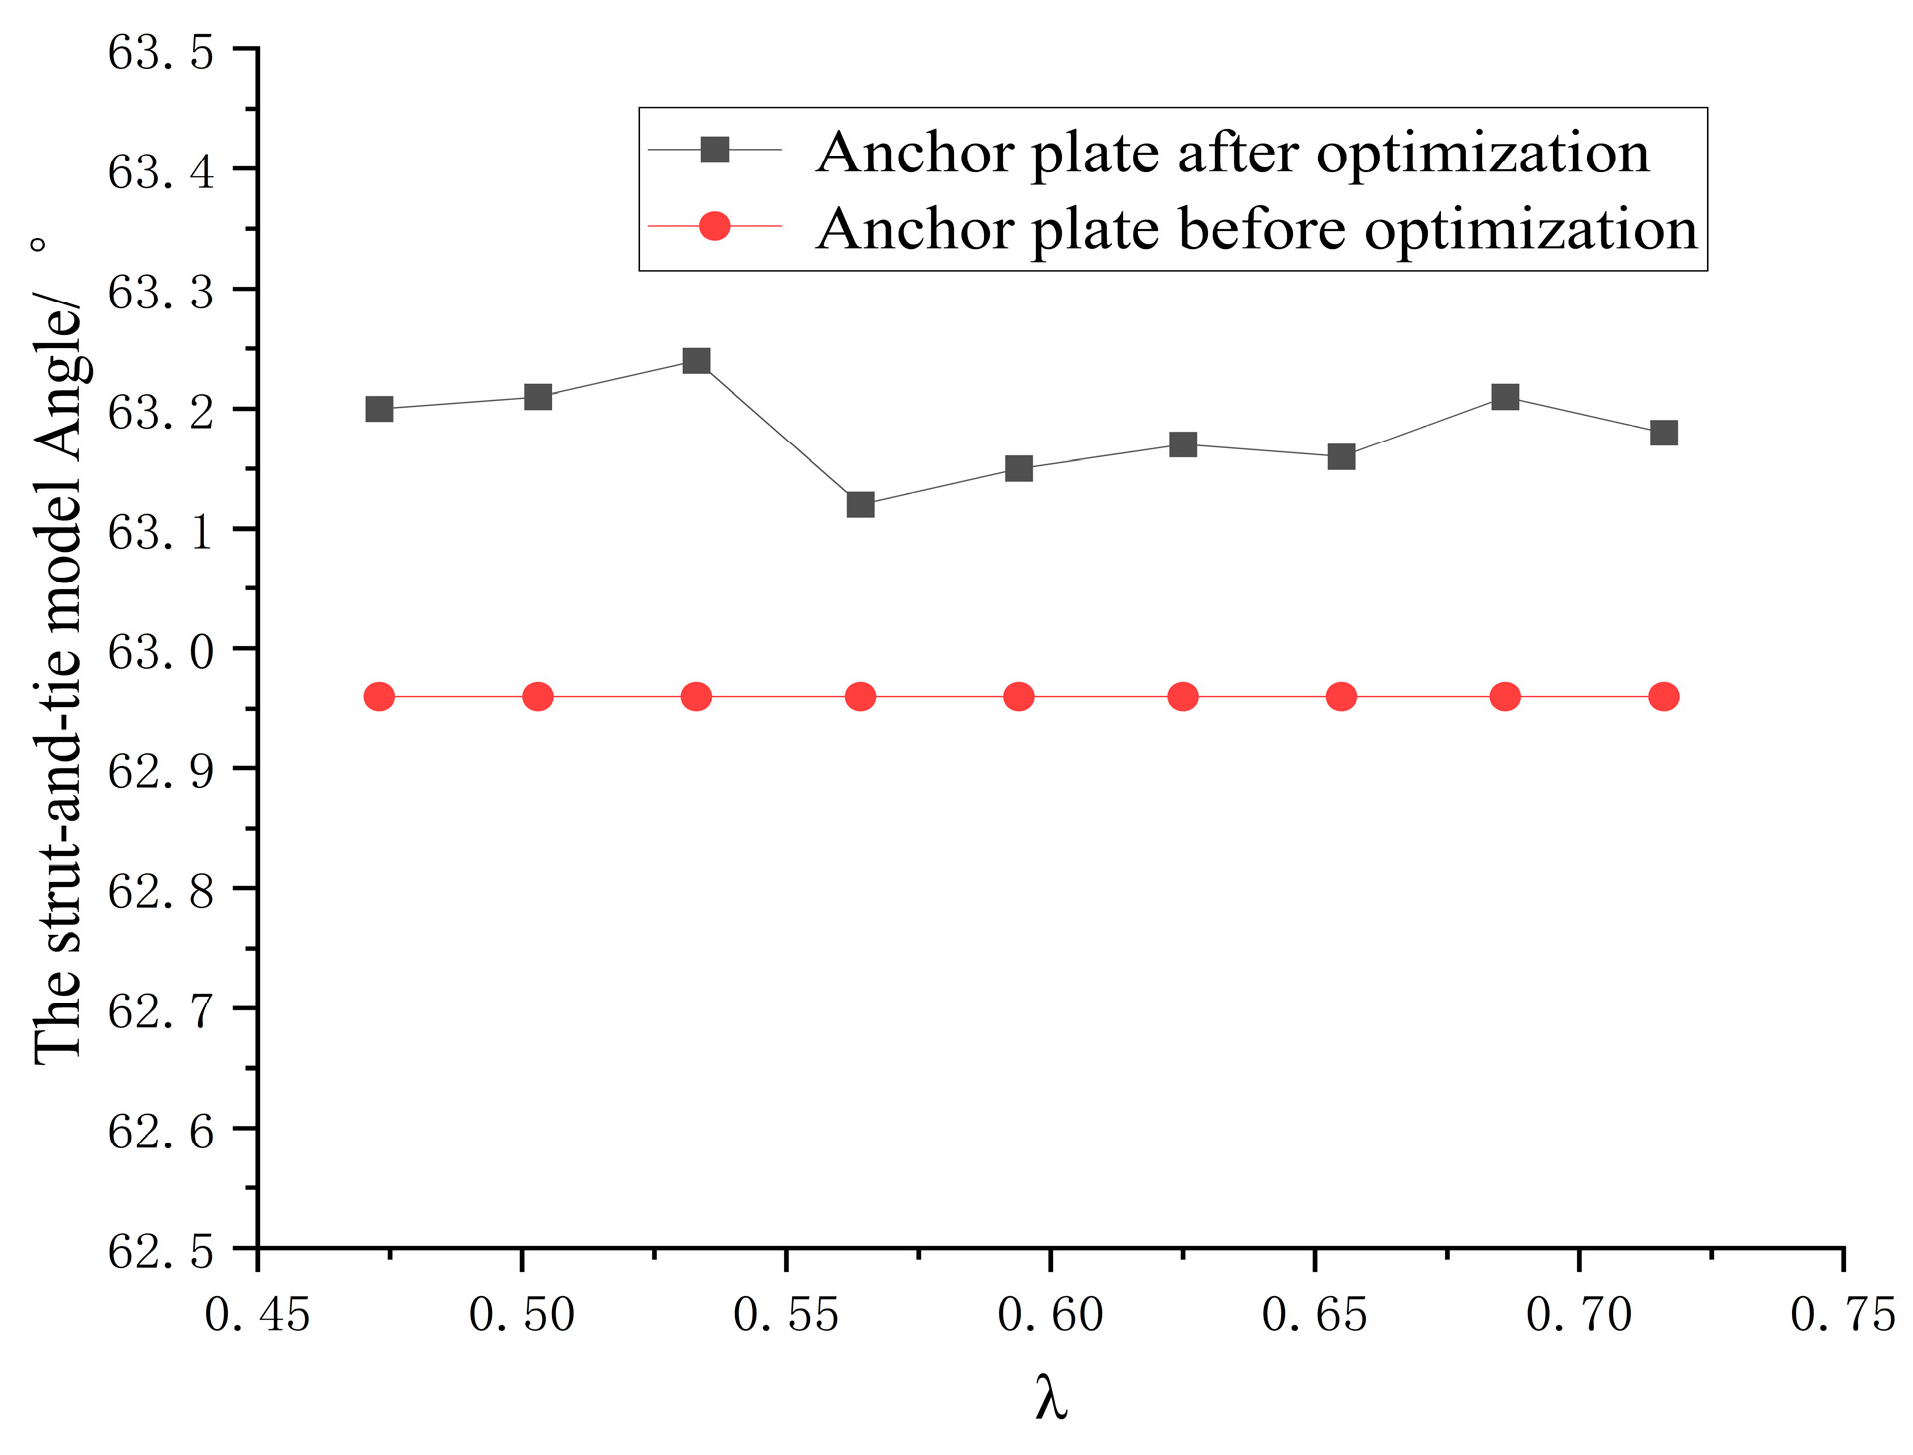
2.2. Angle Calculation of the Strut-and-Tie Model
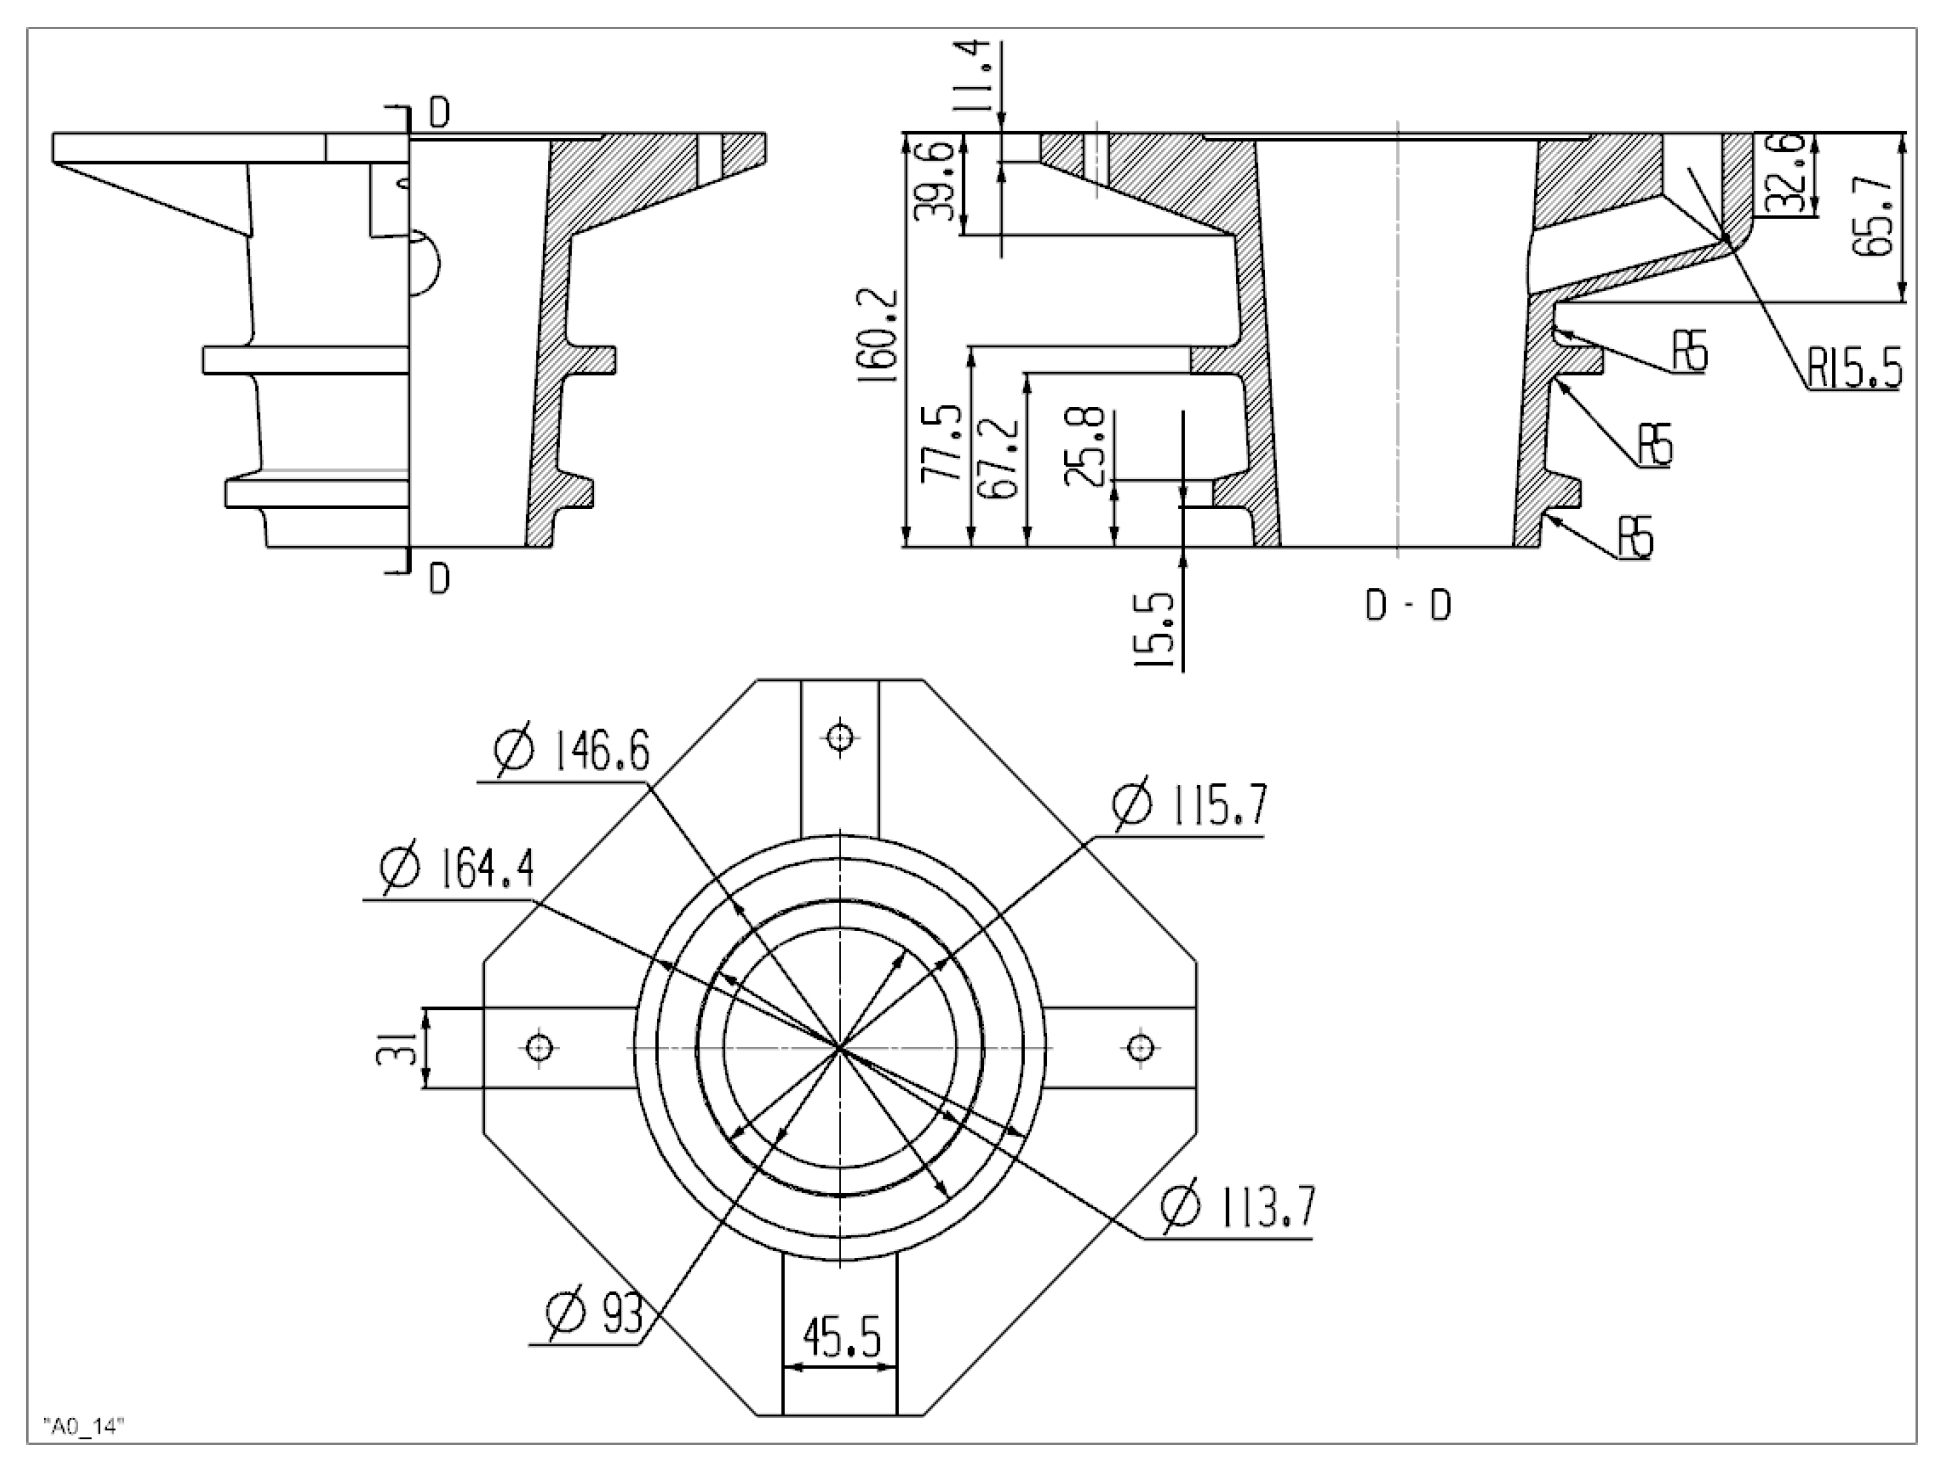
3. The Anchoring Zone Model Was Established
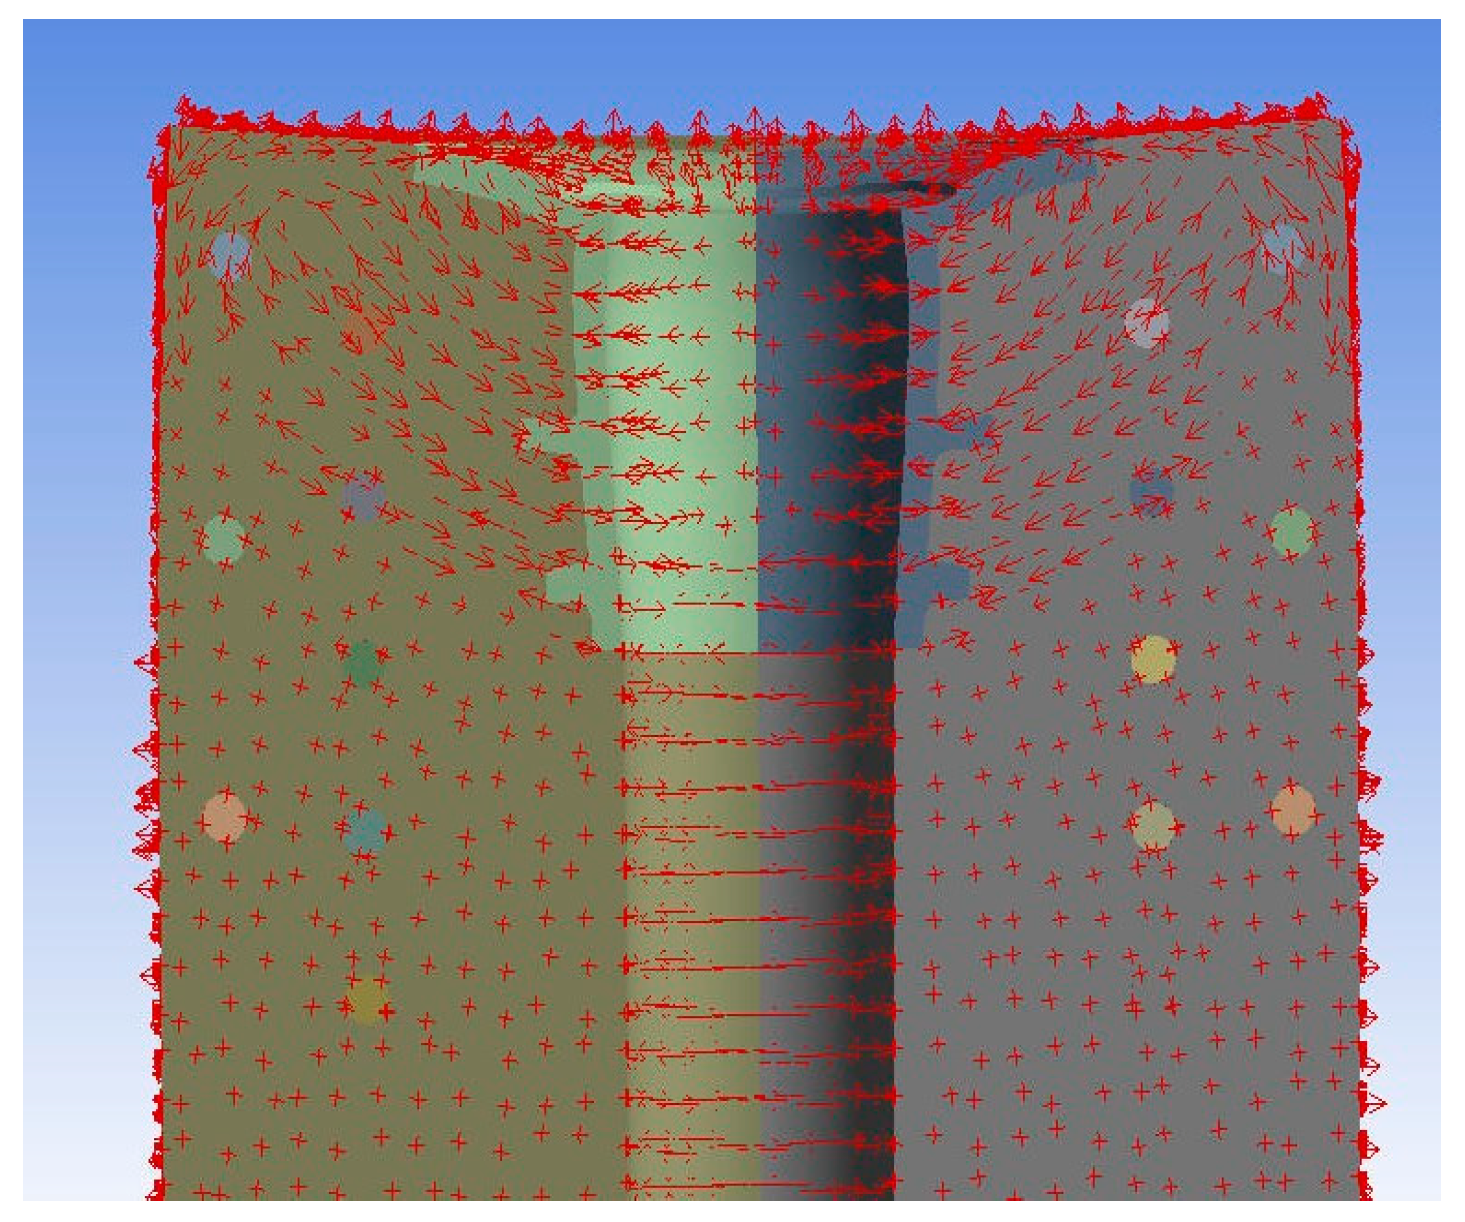
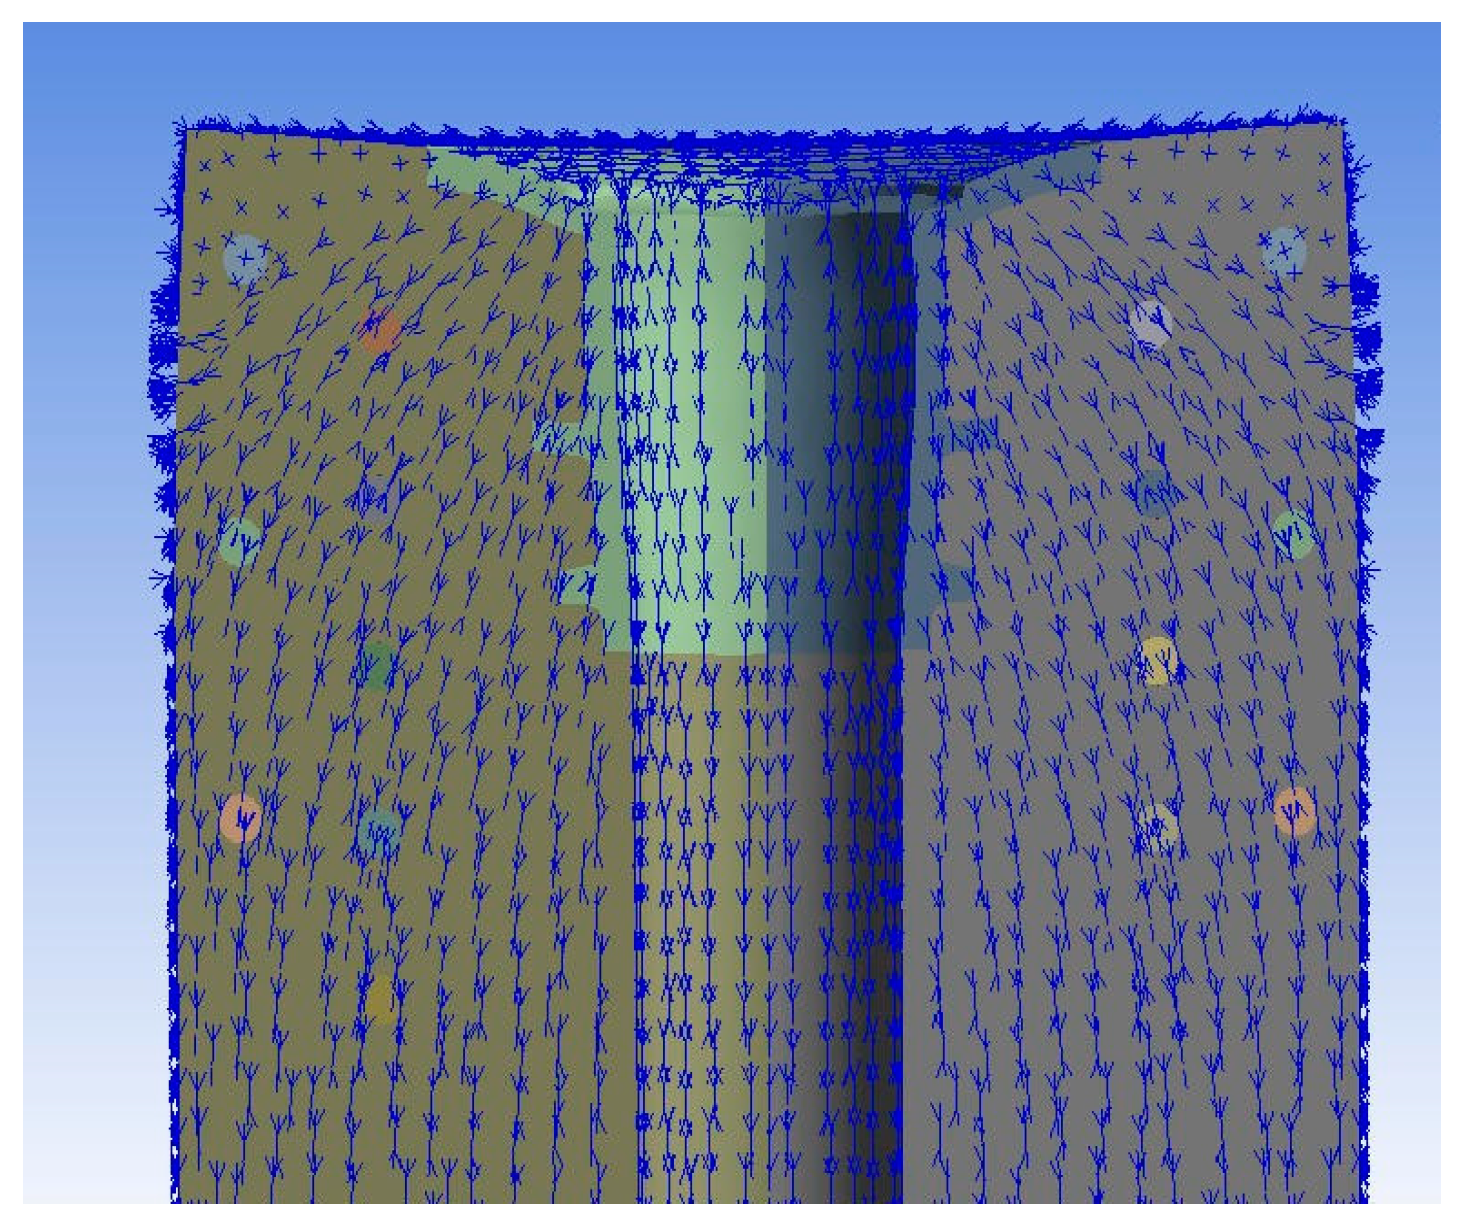
4. Finite Element Analysis
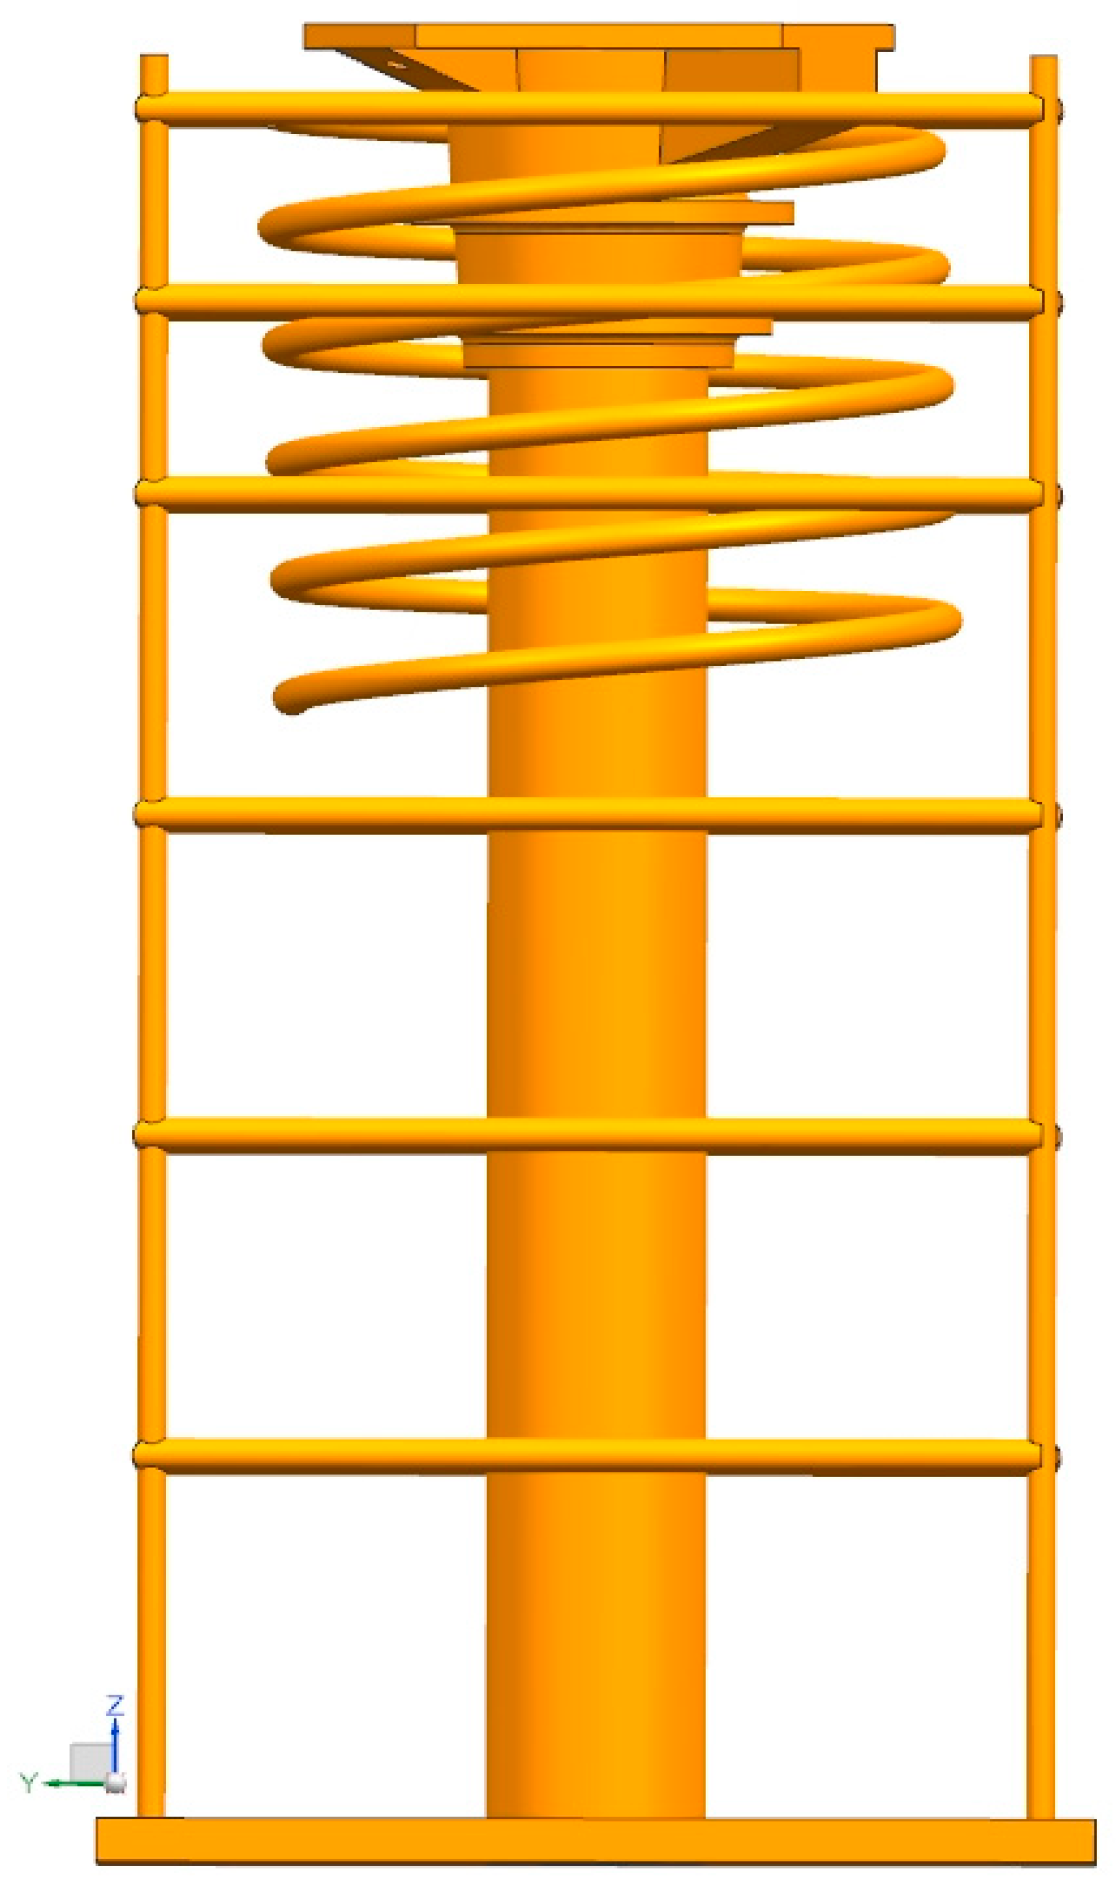
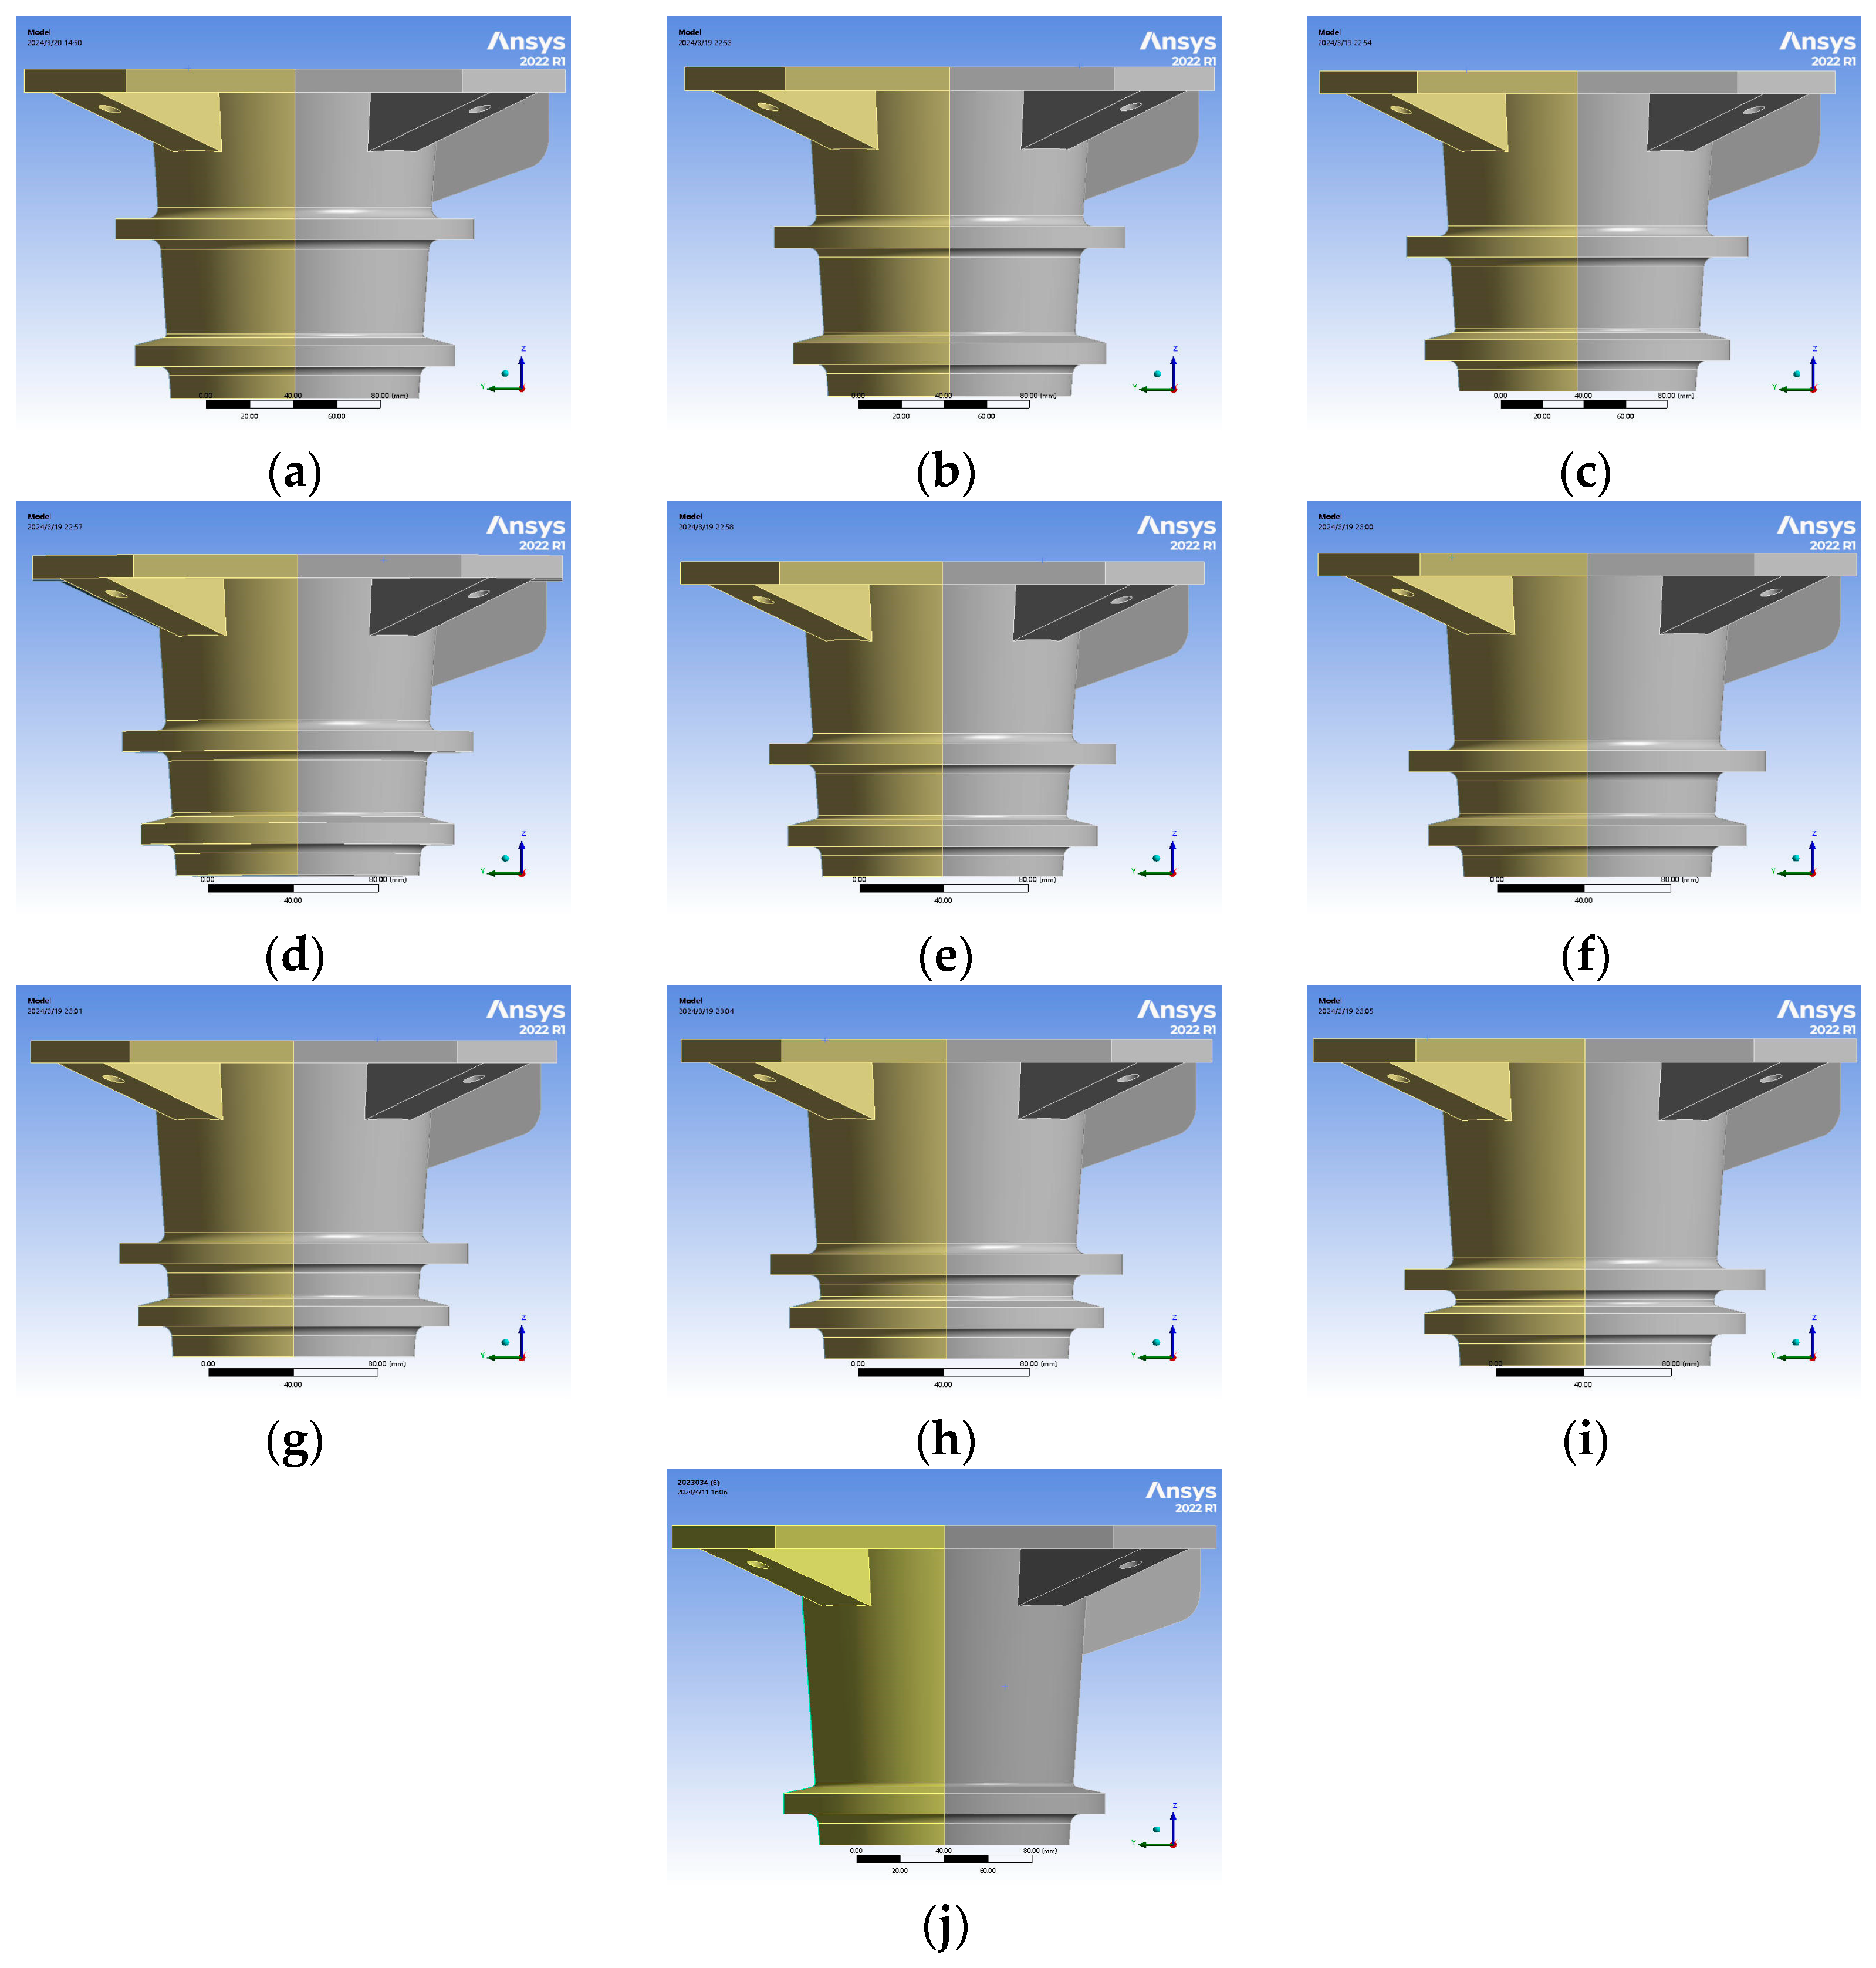
4.1. Finite Element Analysis of Model
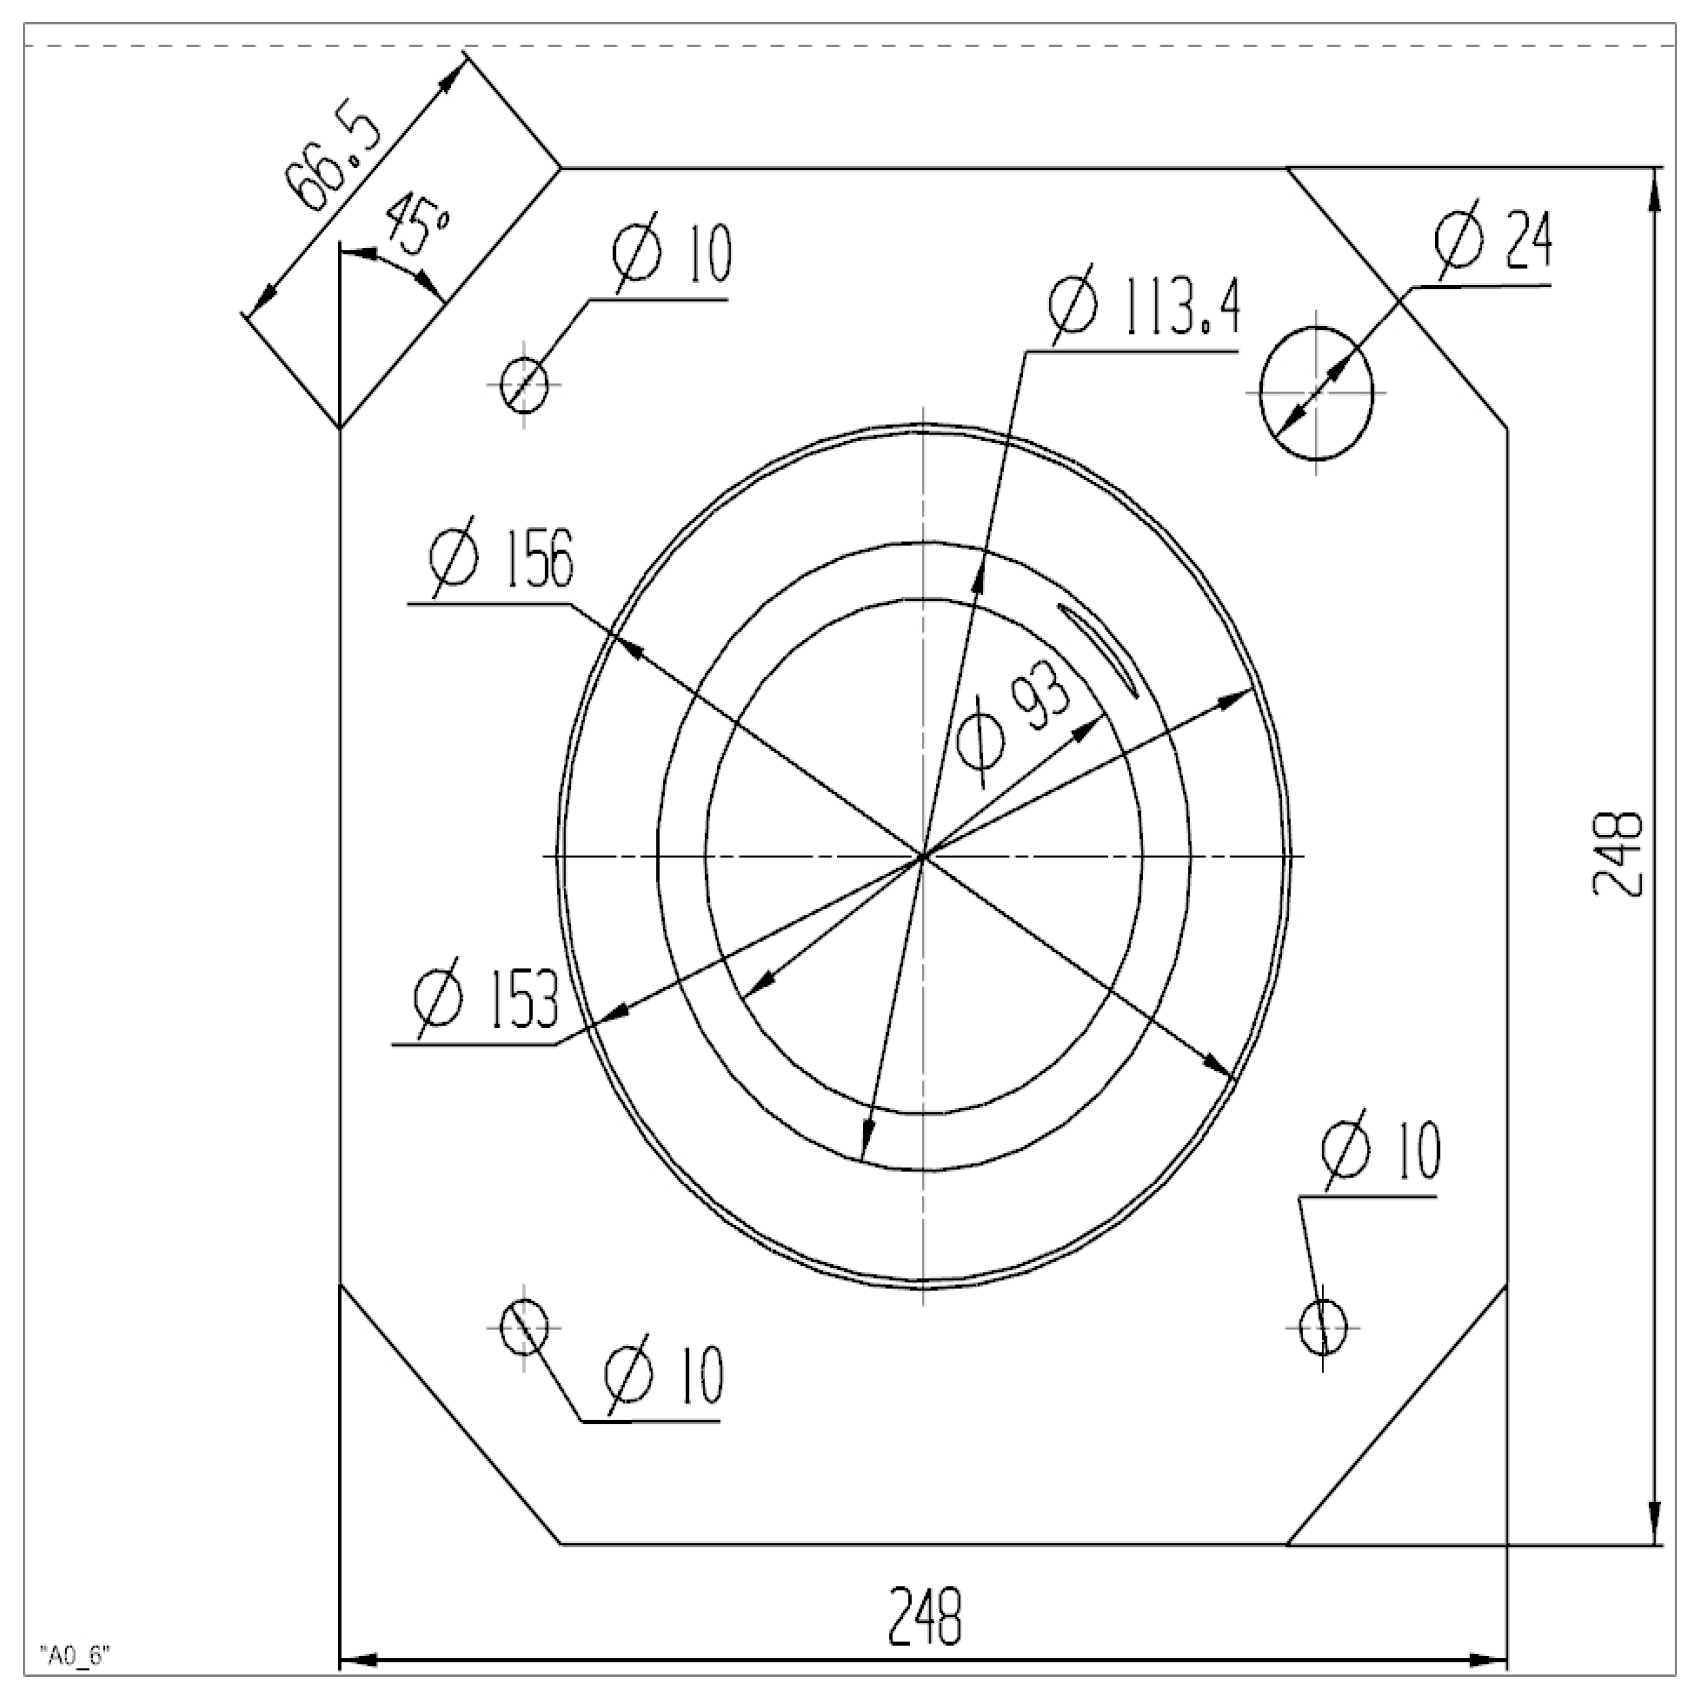
Model Overview
4.2. The Strut-and-Tie Model Analysis
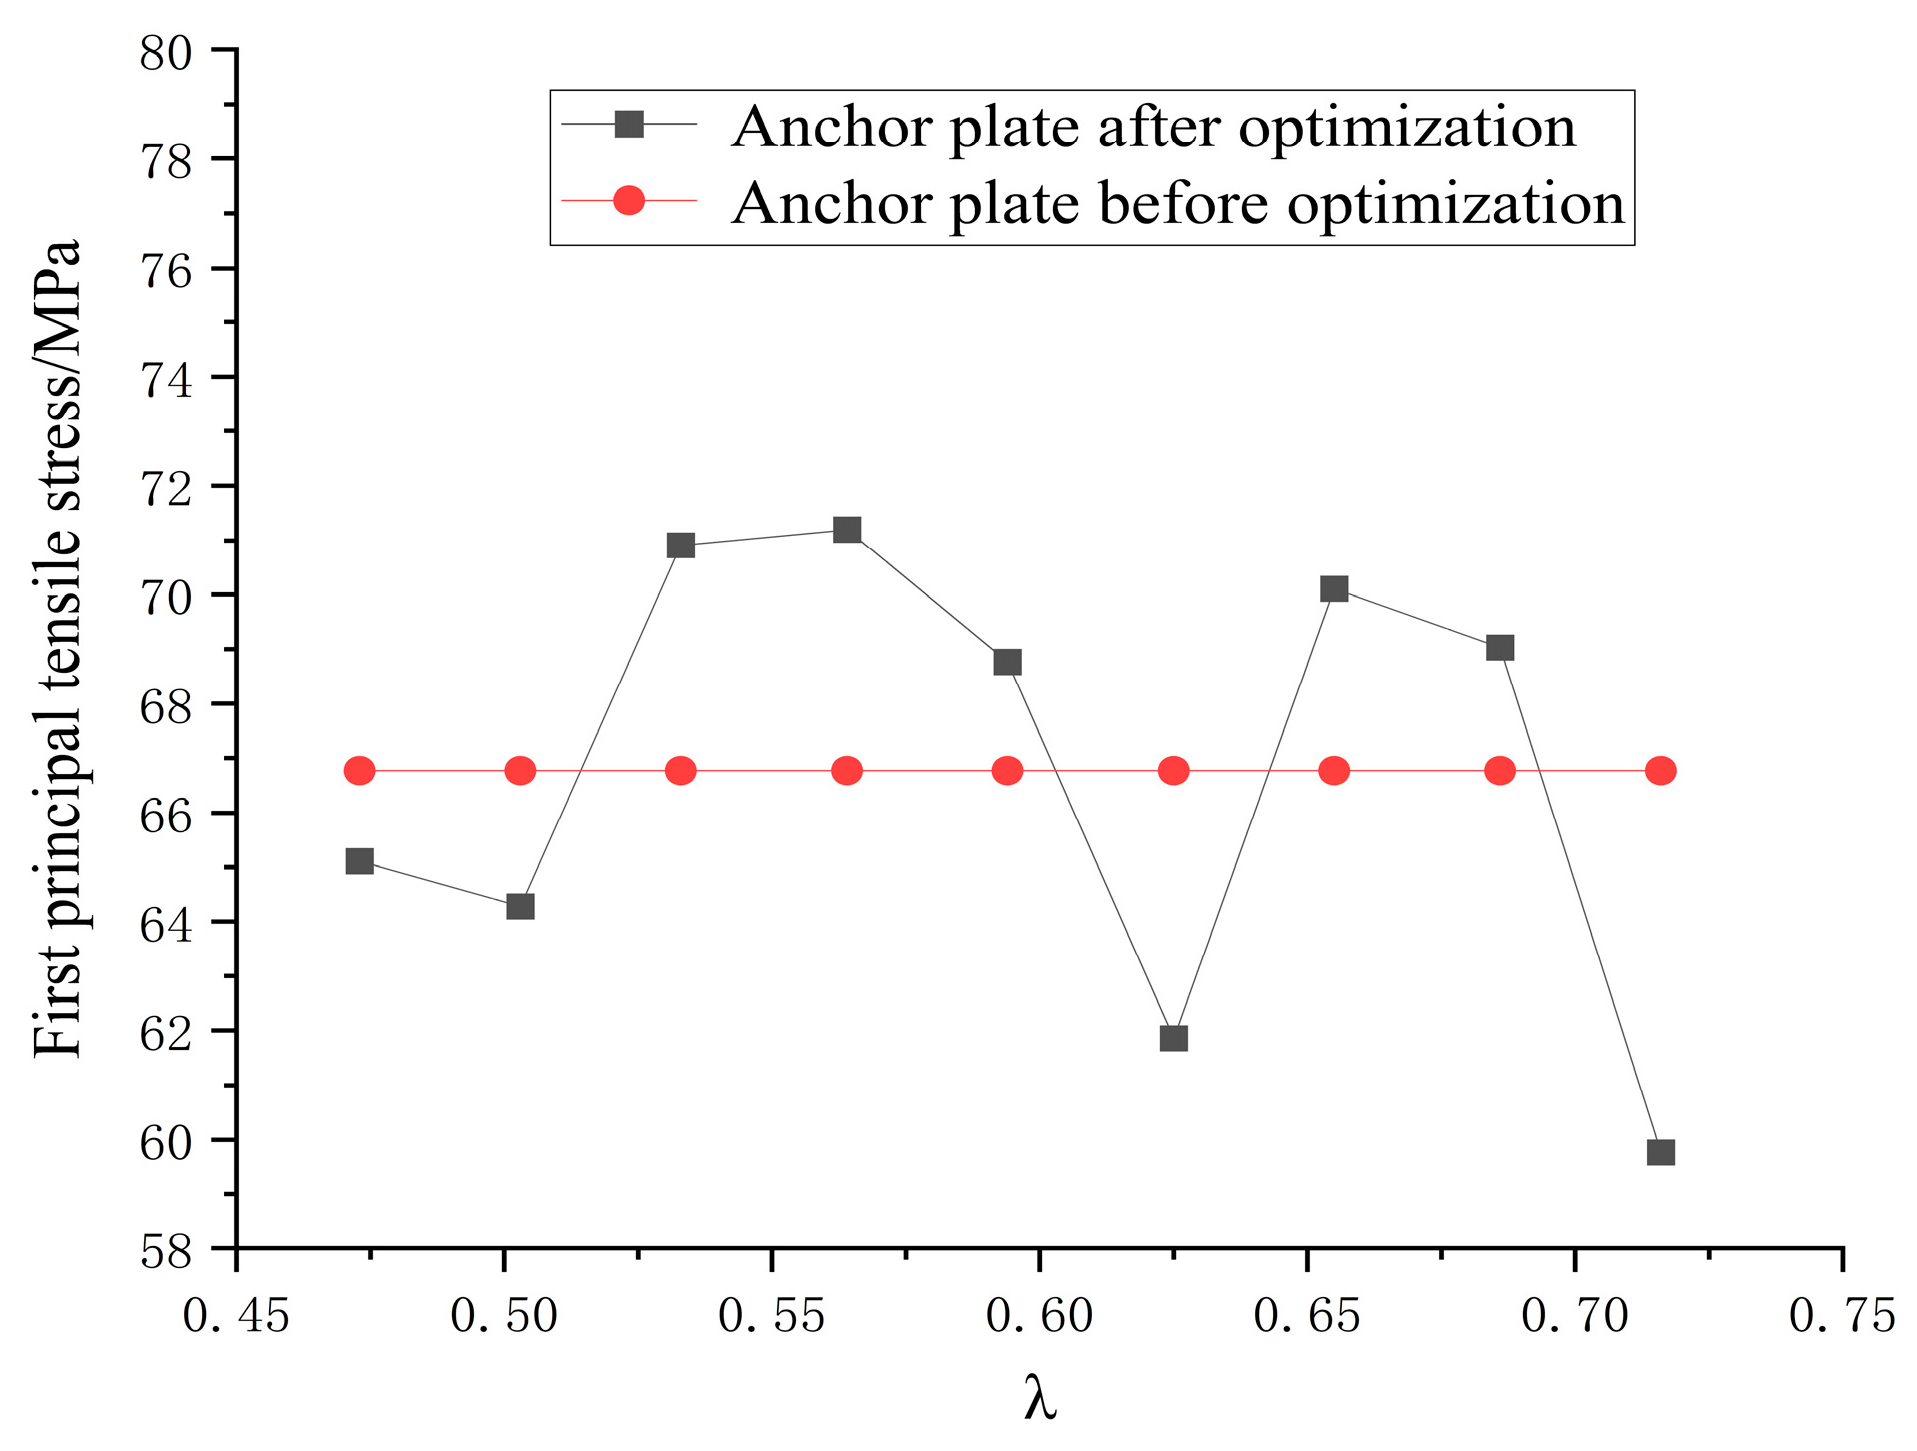
4.3. Comparison of Finite Element Calculation Results
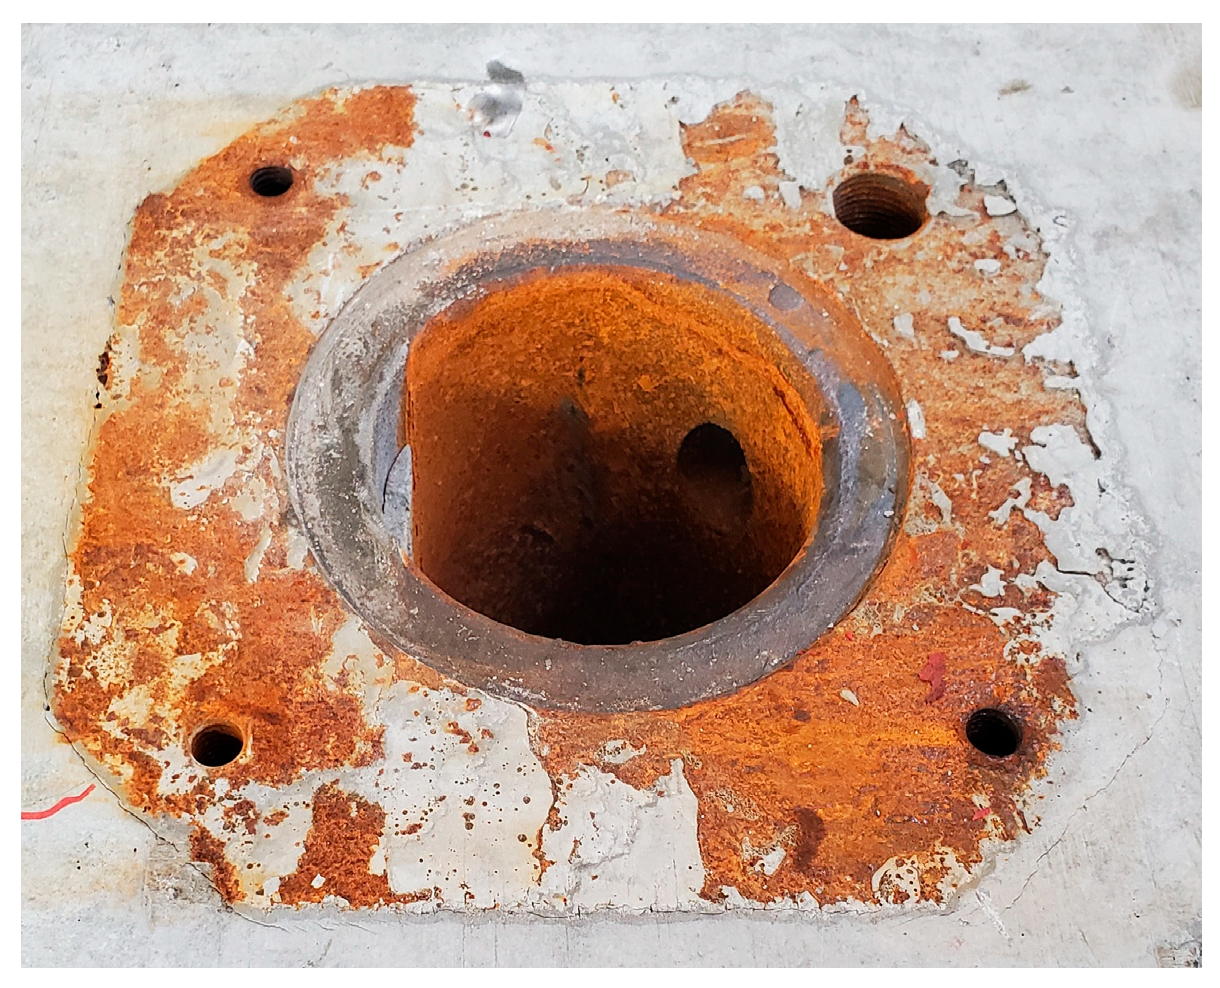
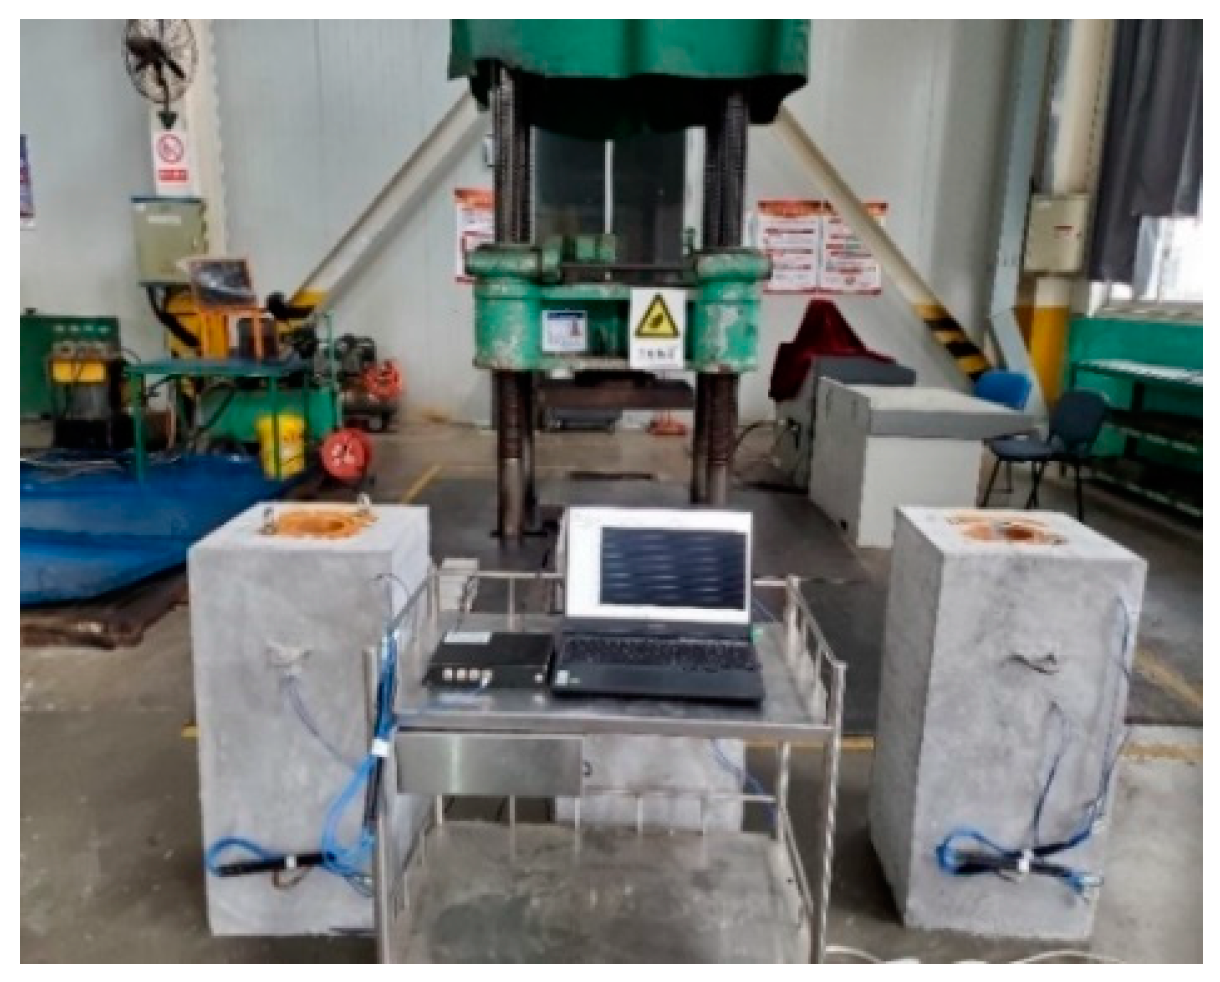
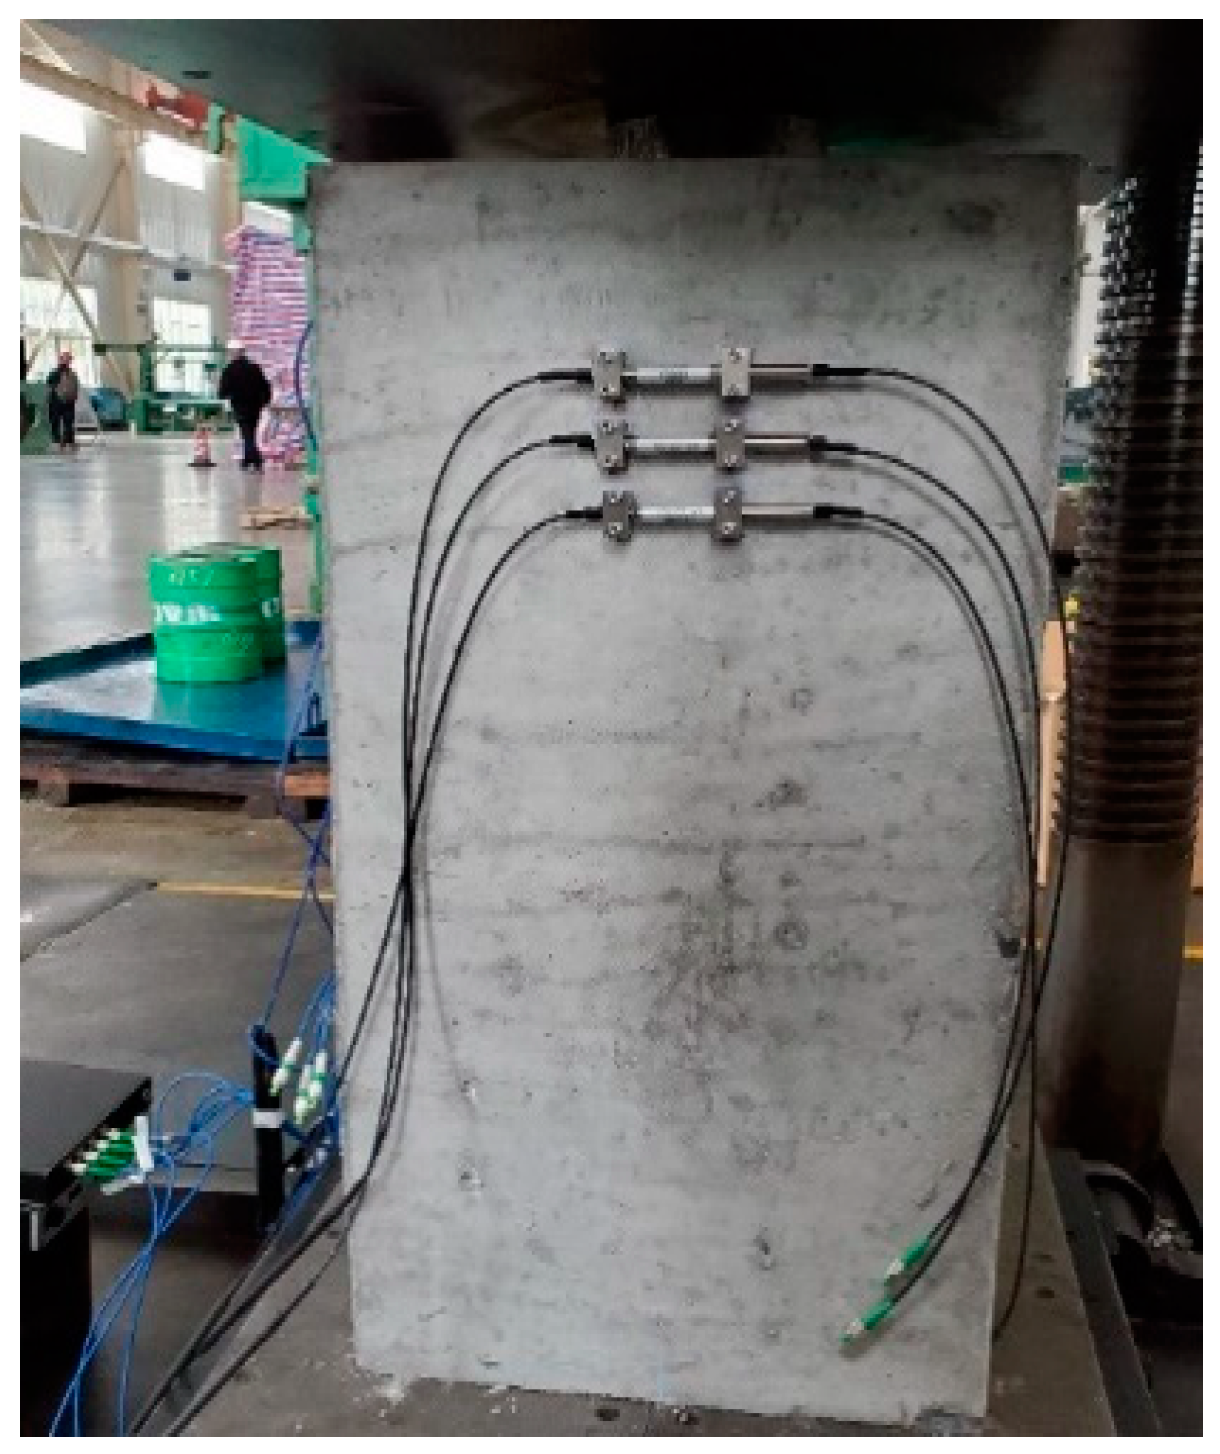
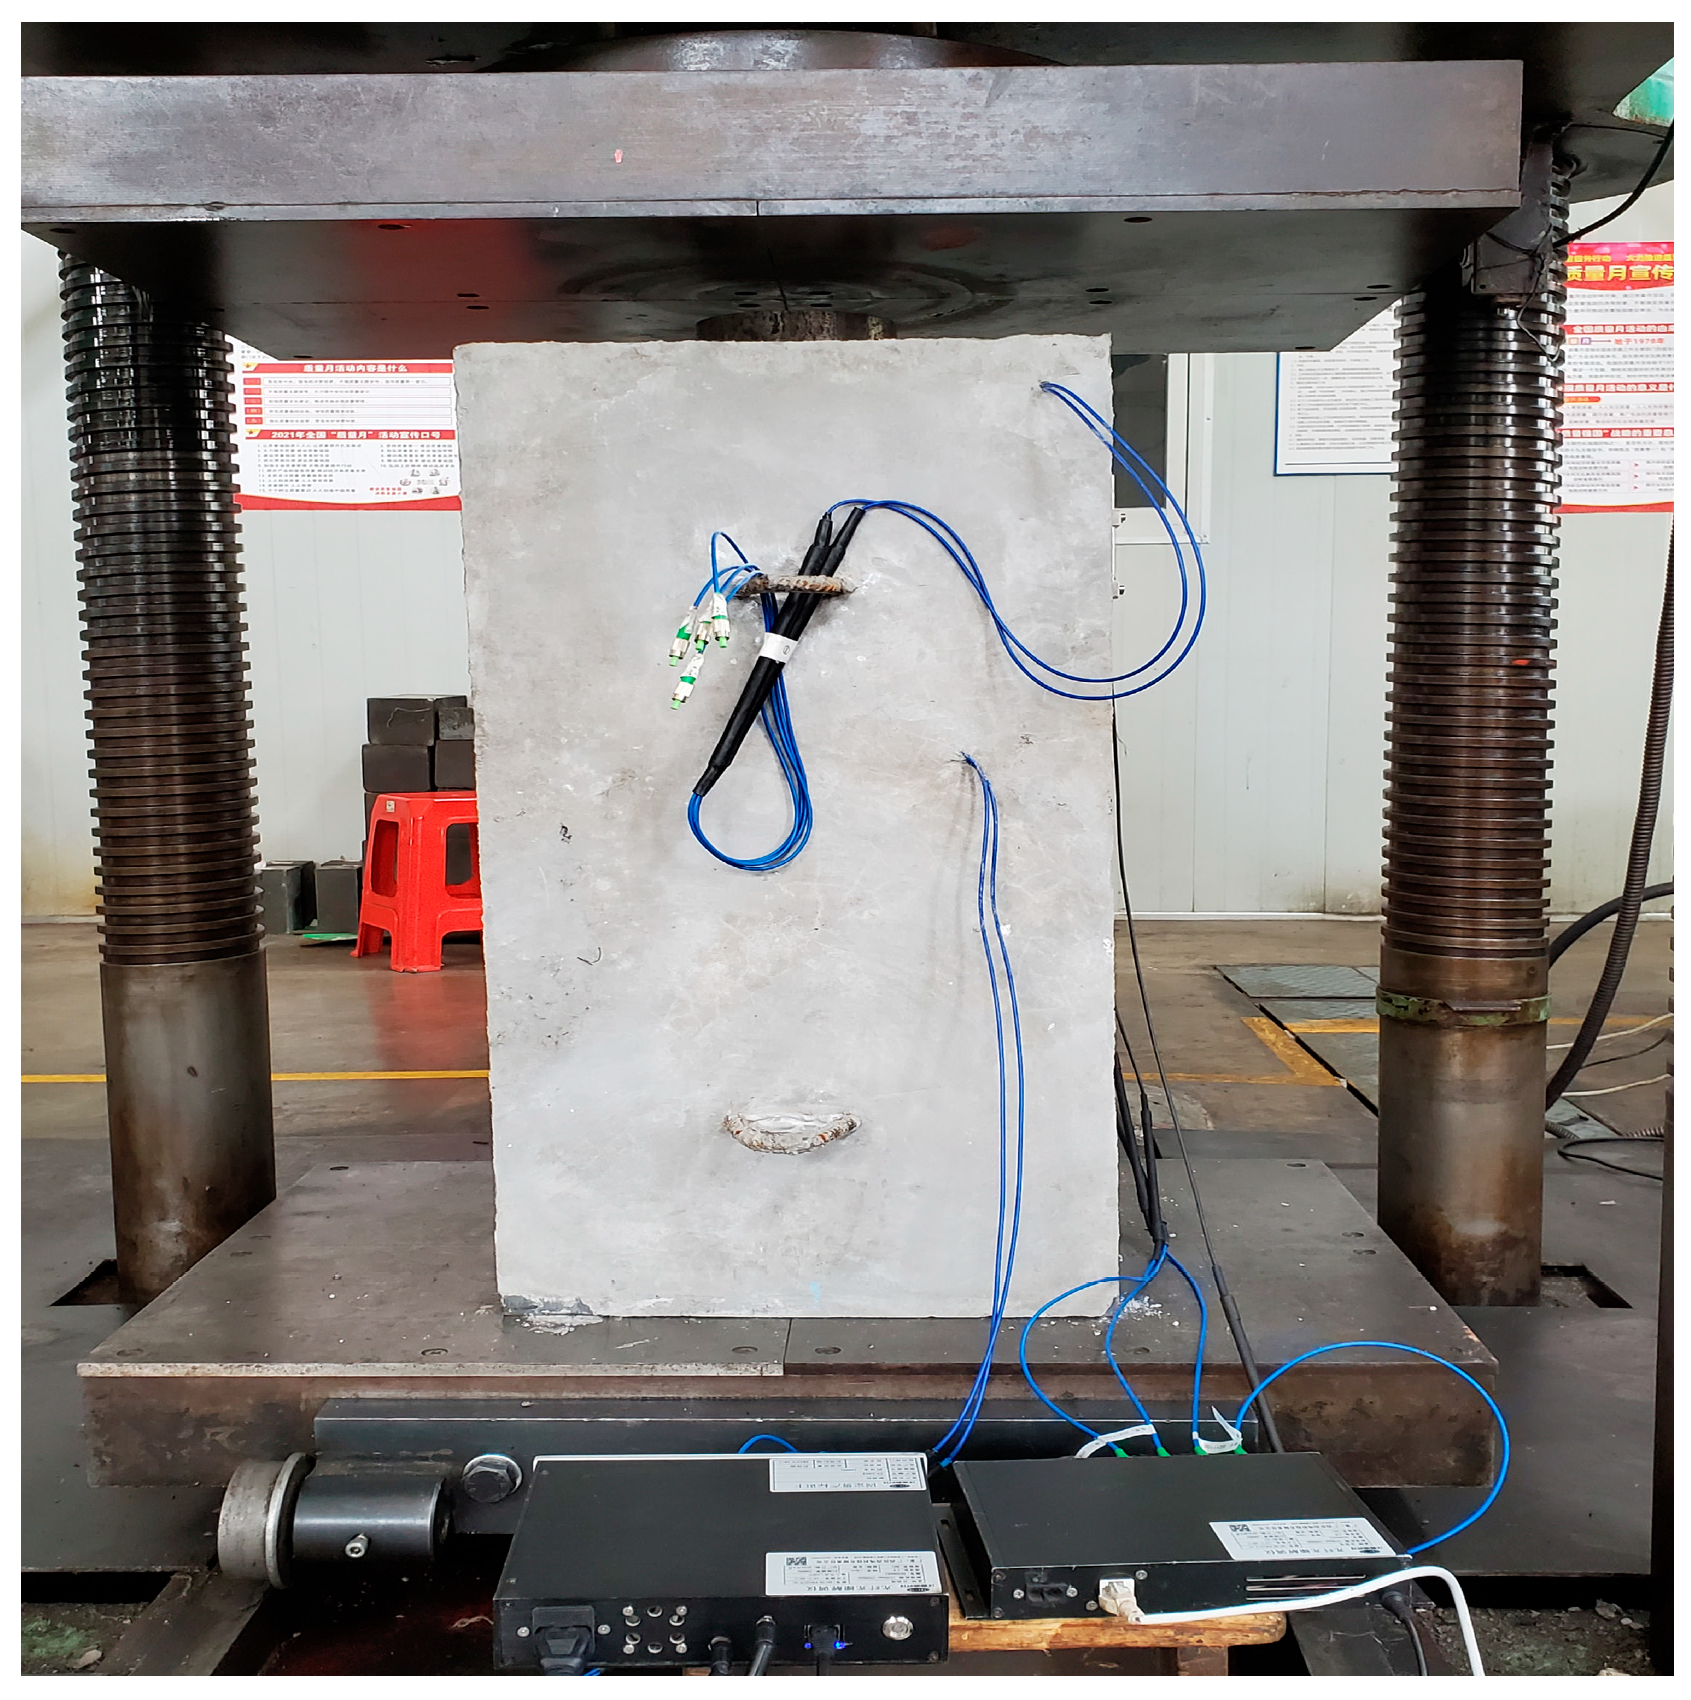
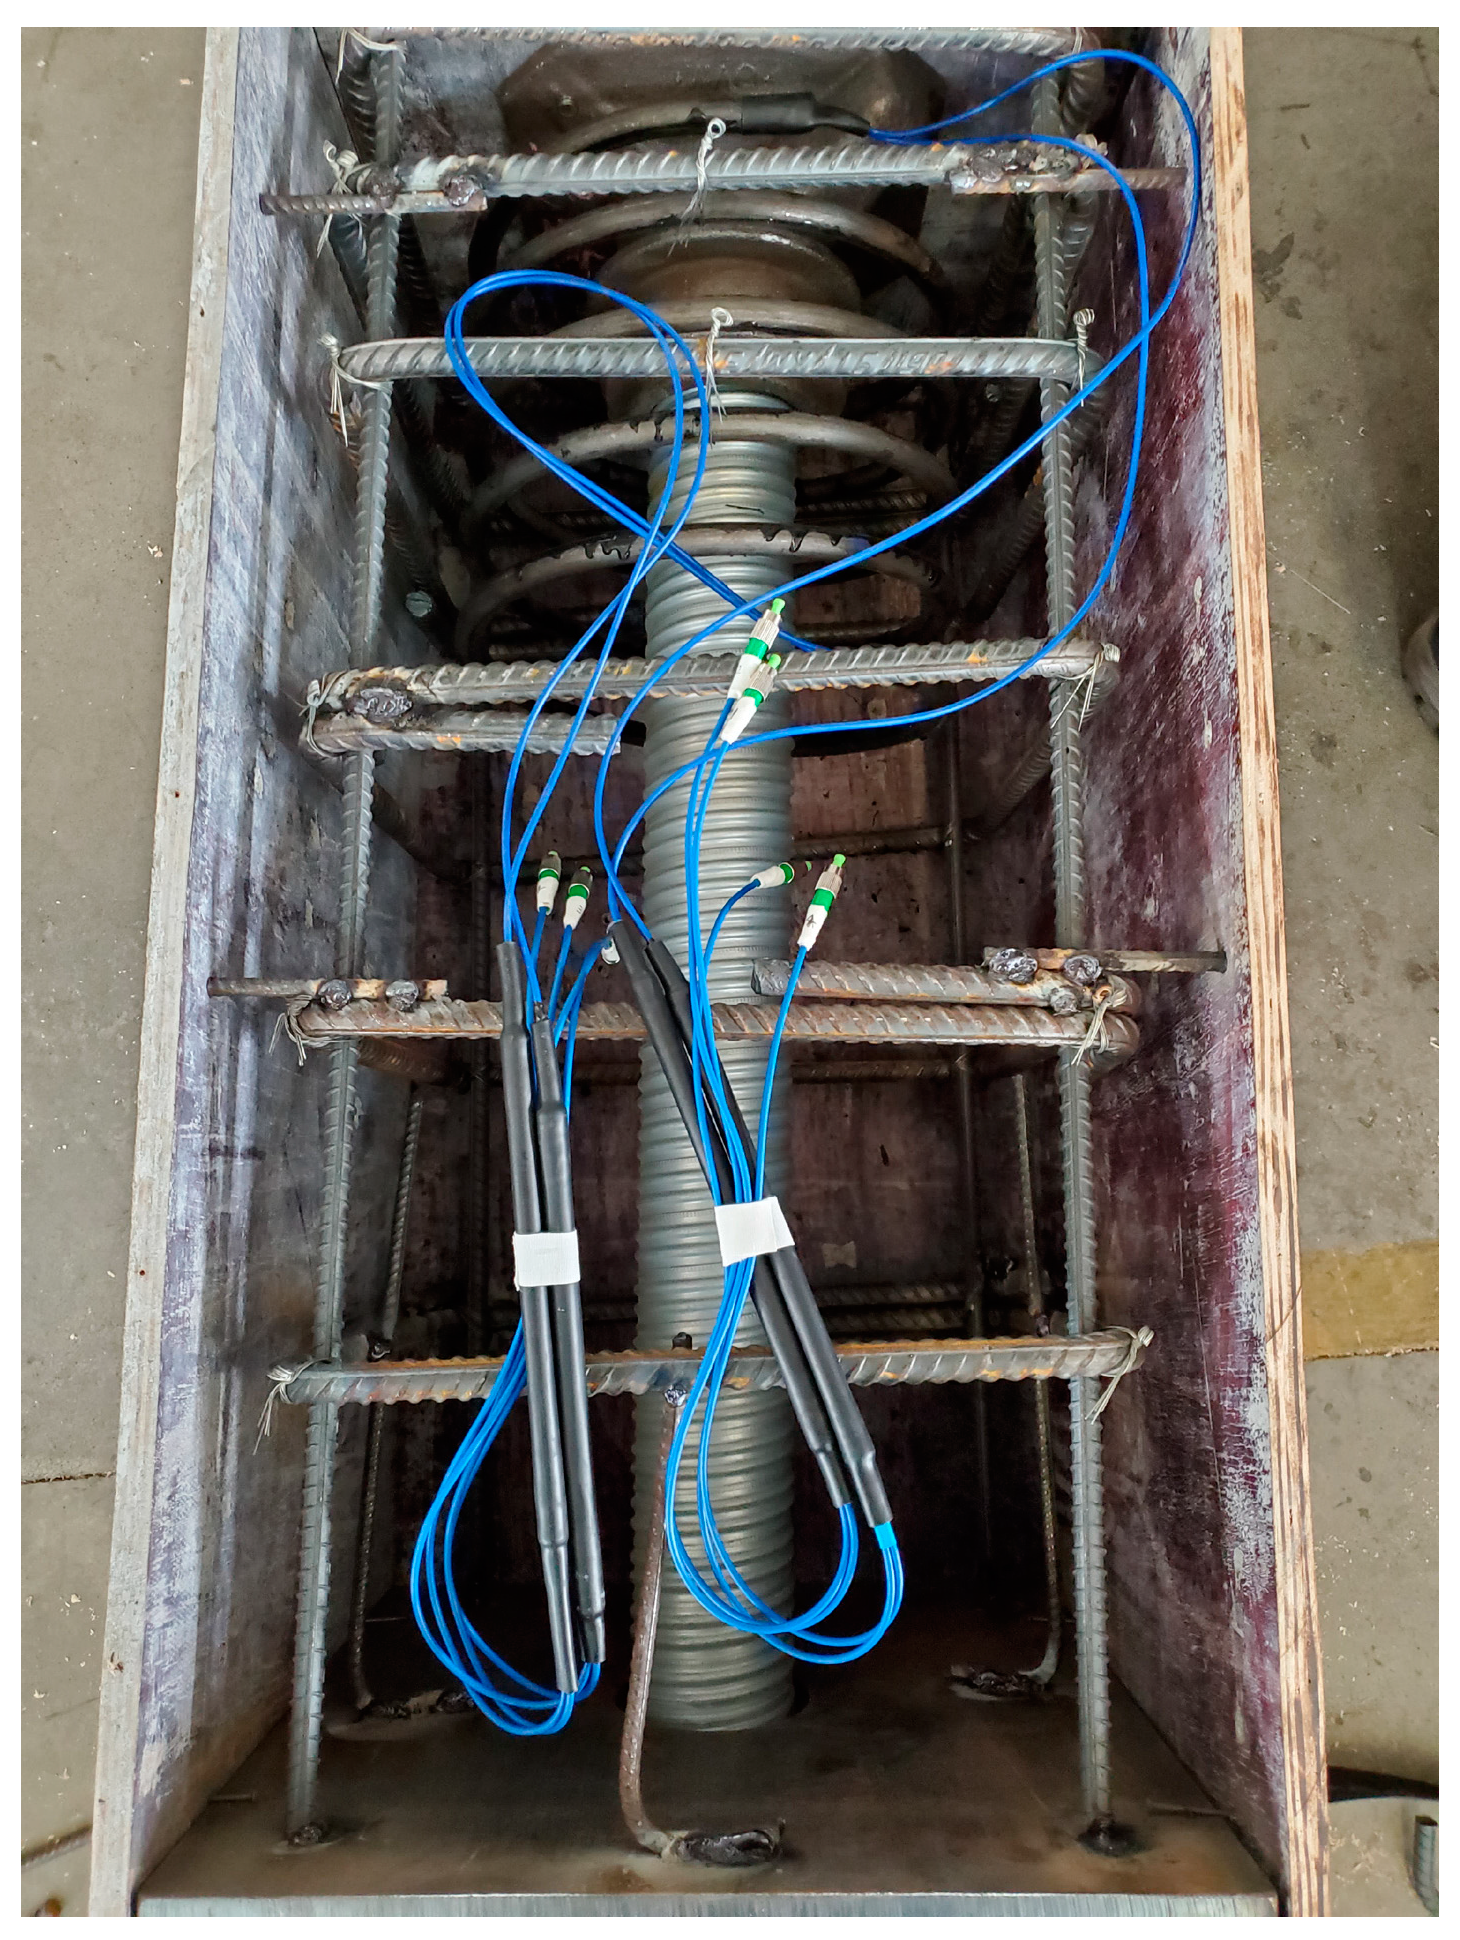
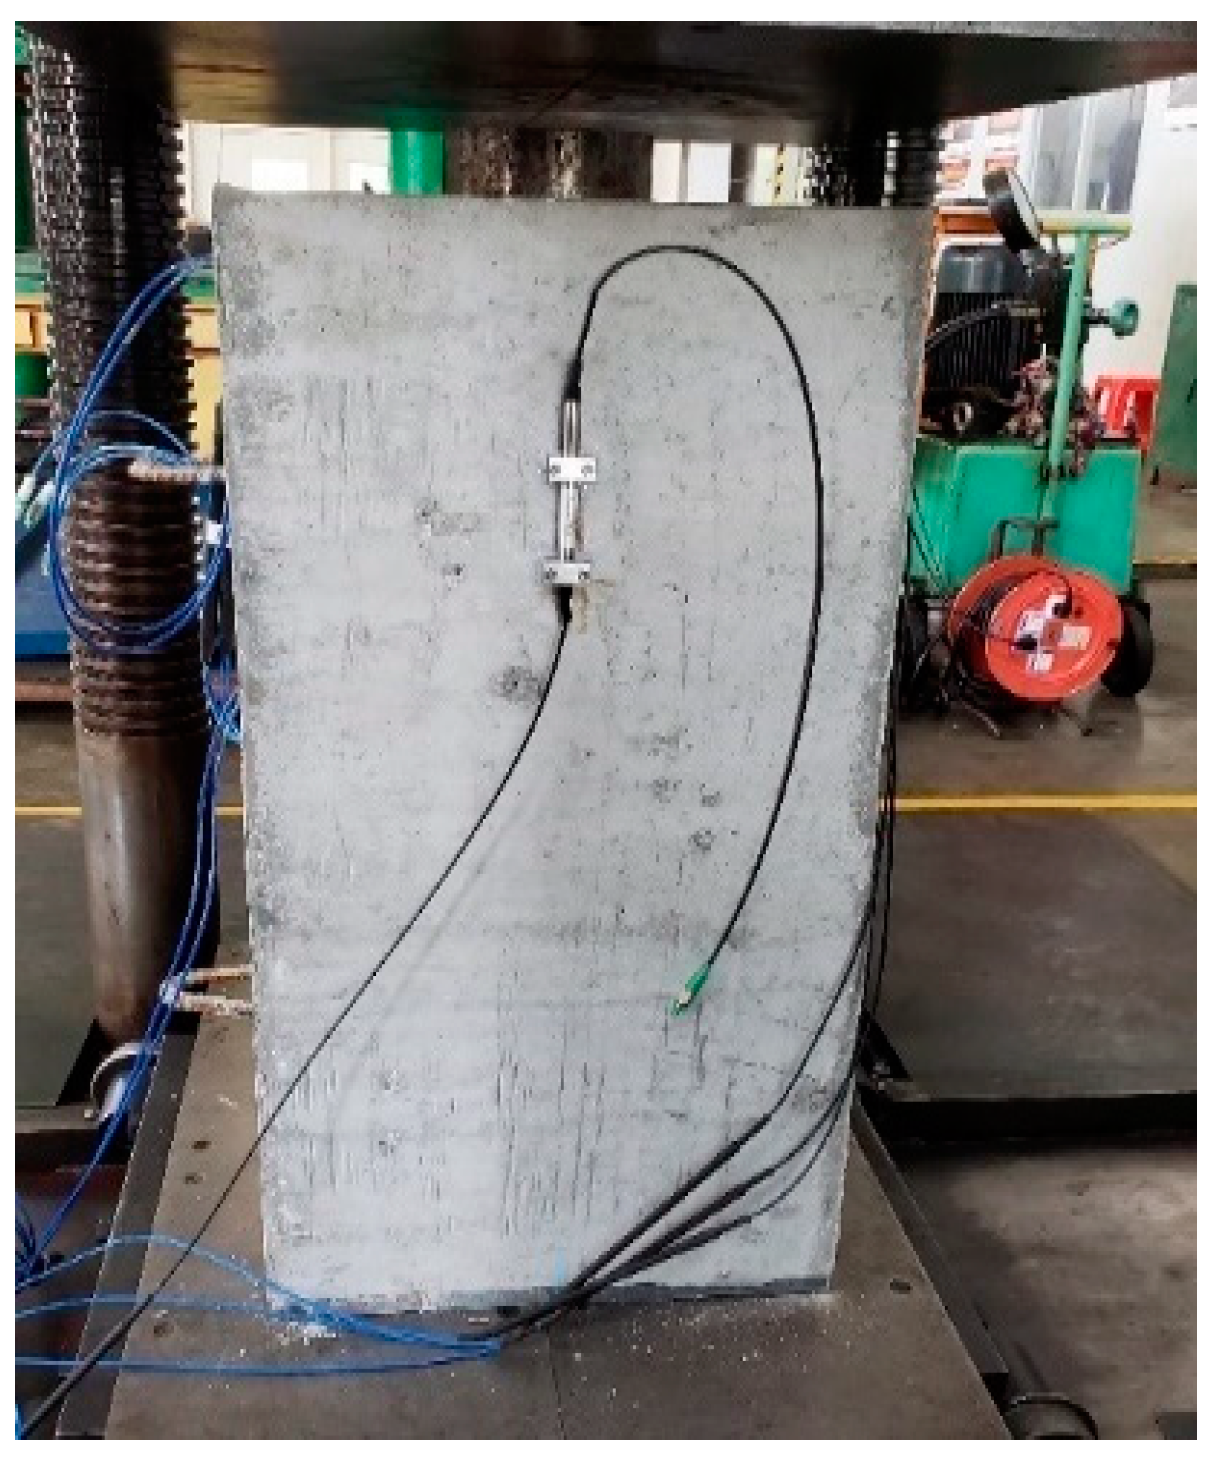
5. Load Transfer Test
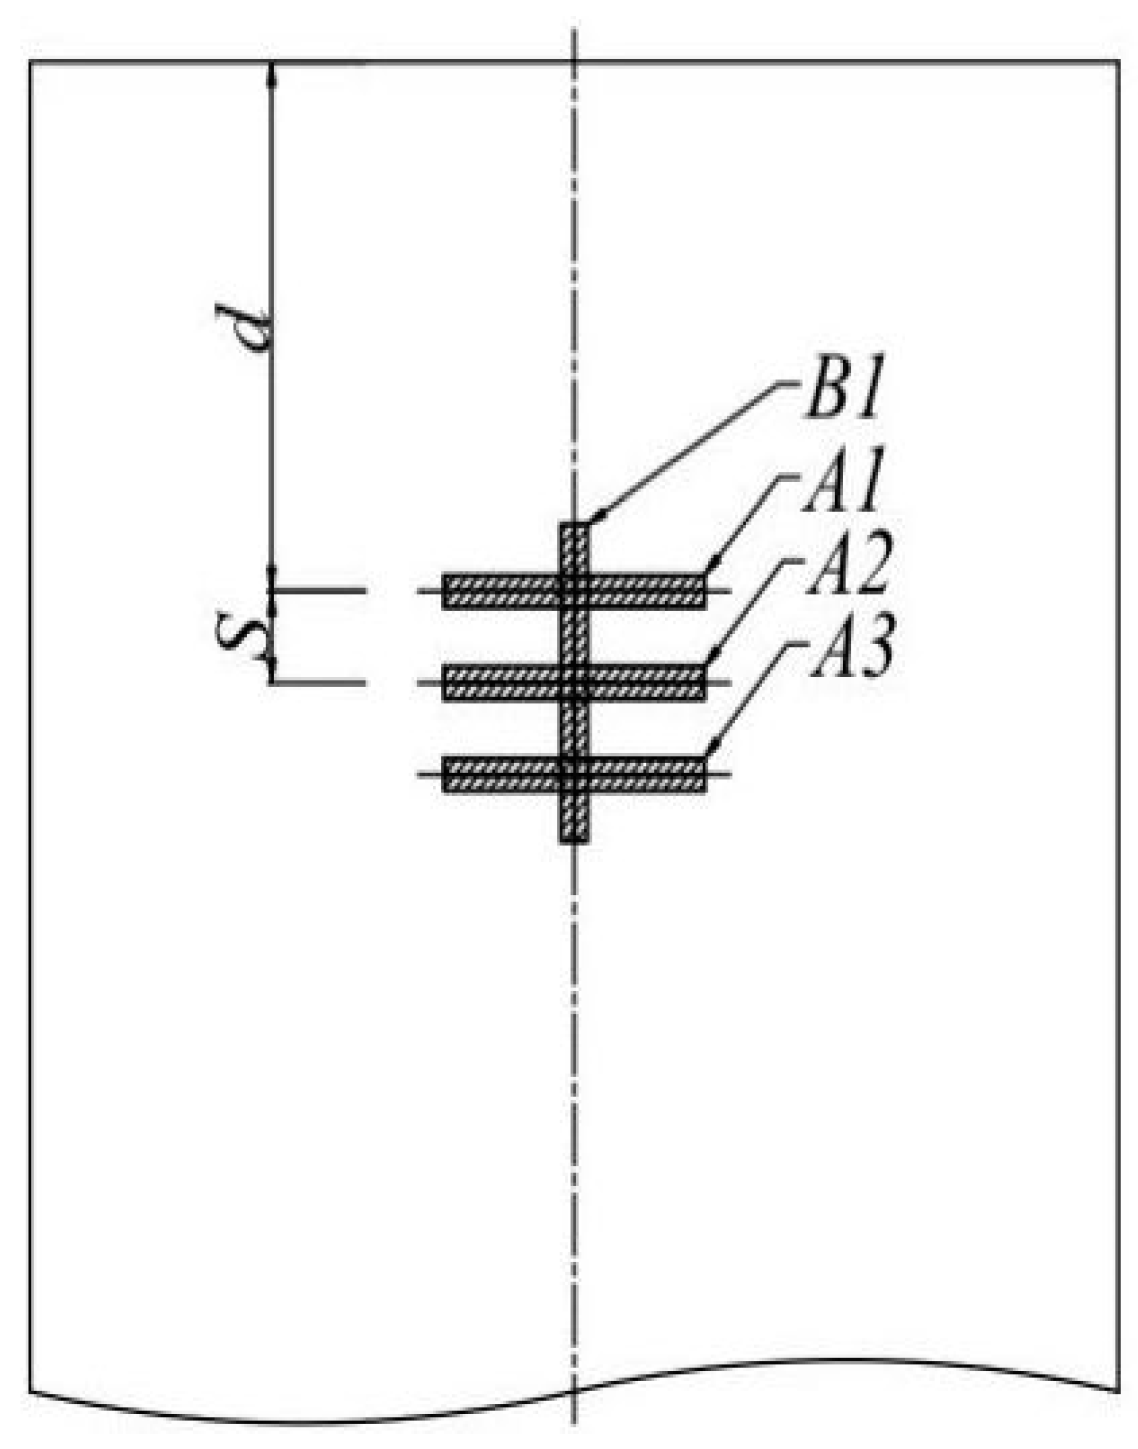
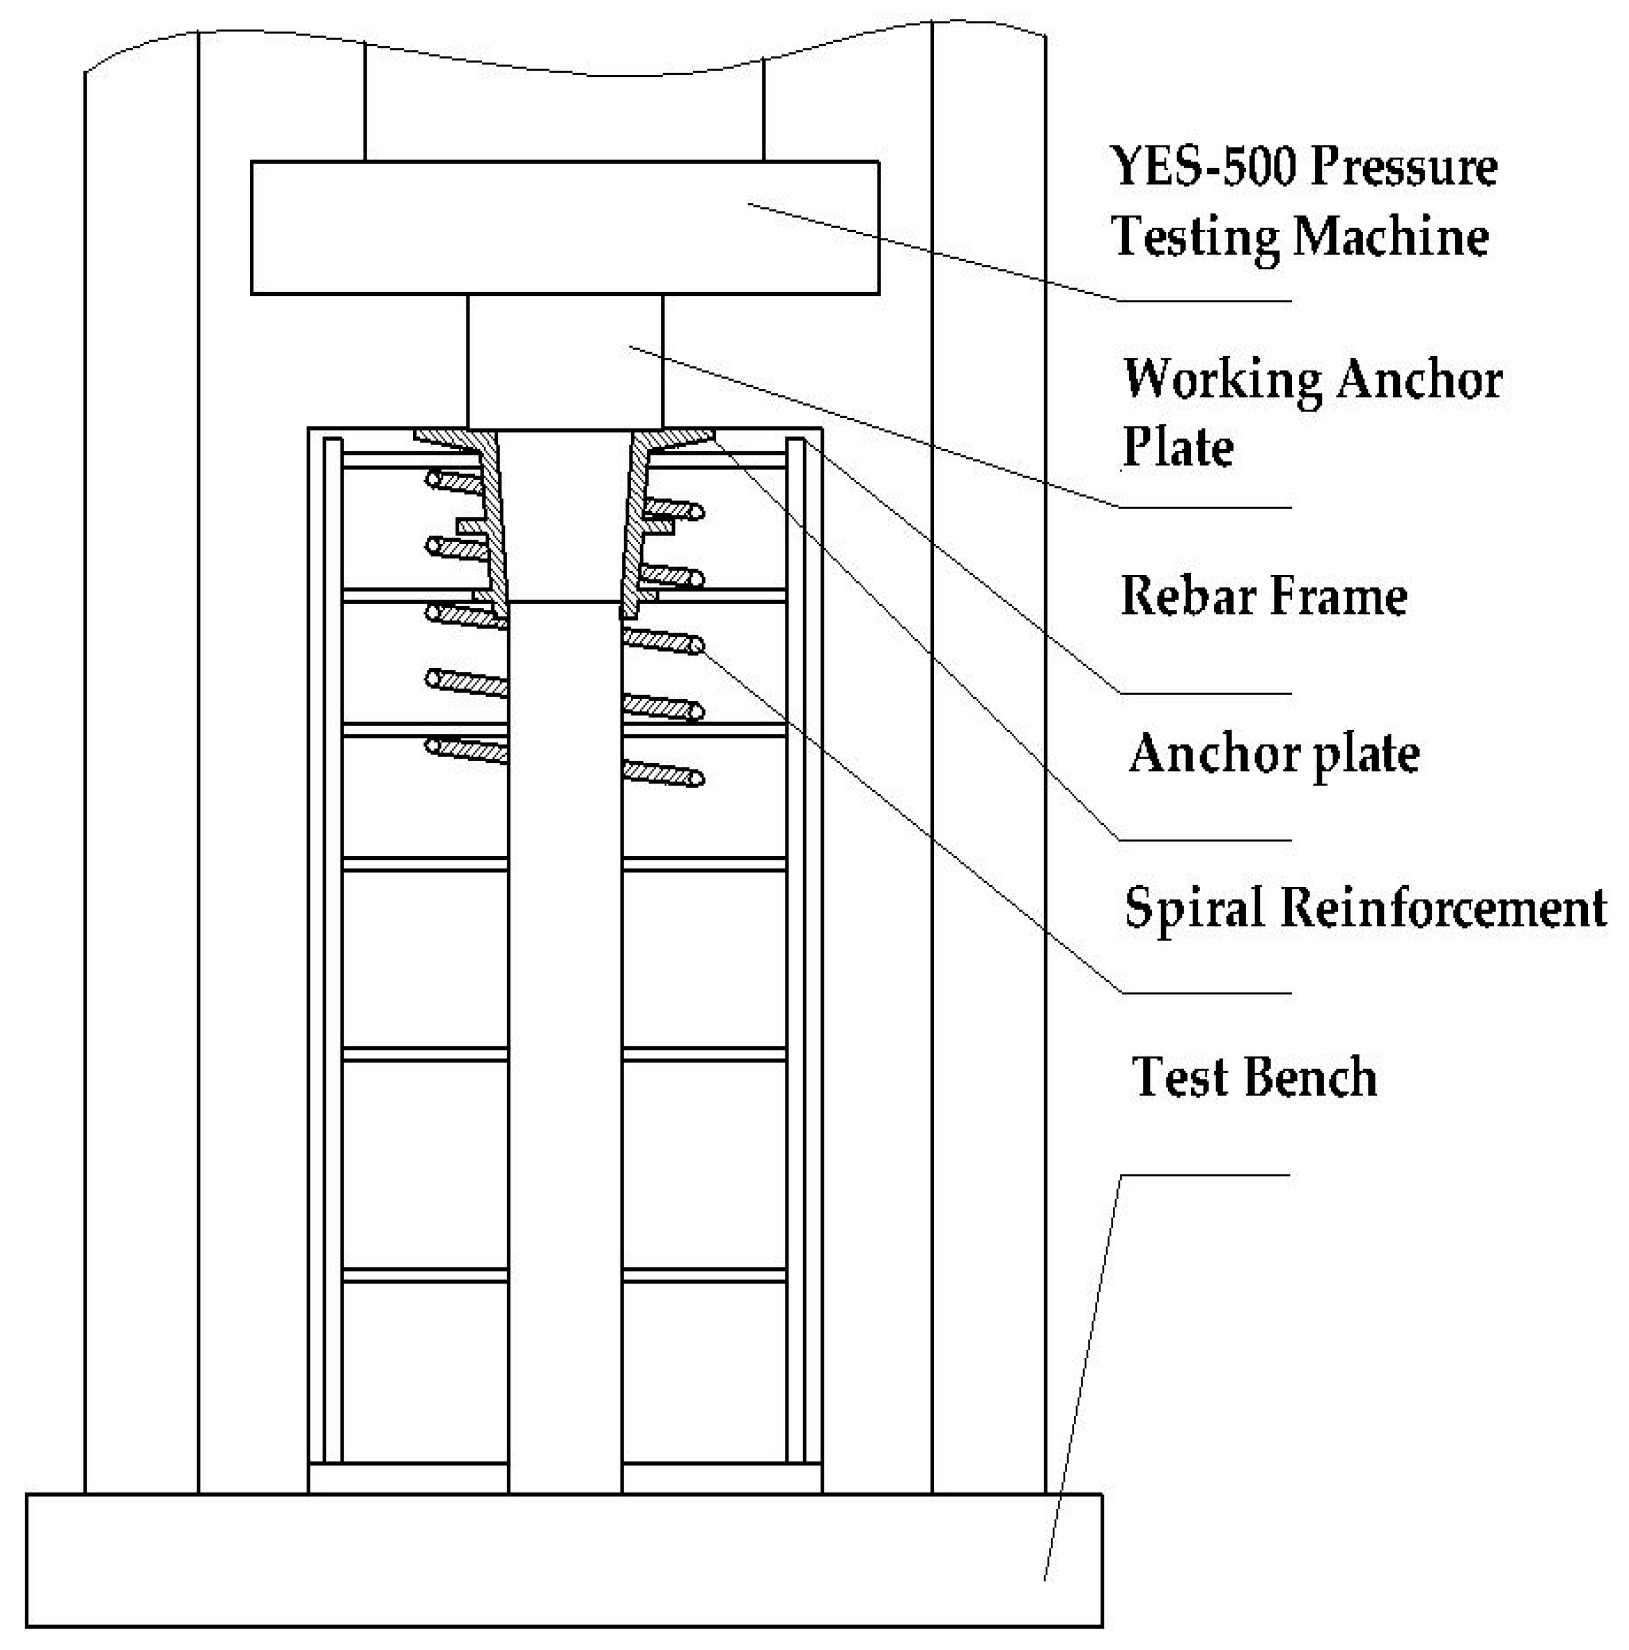
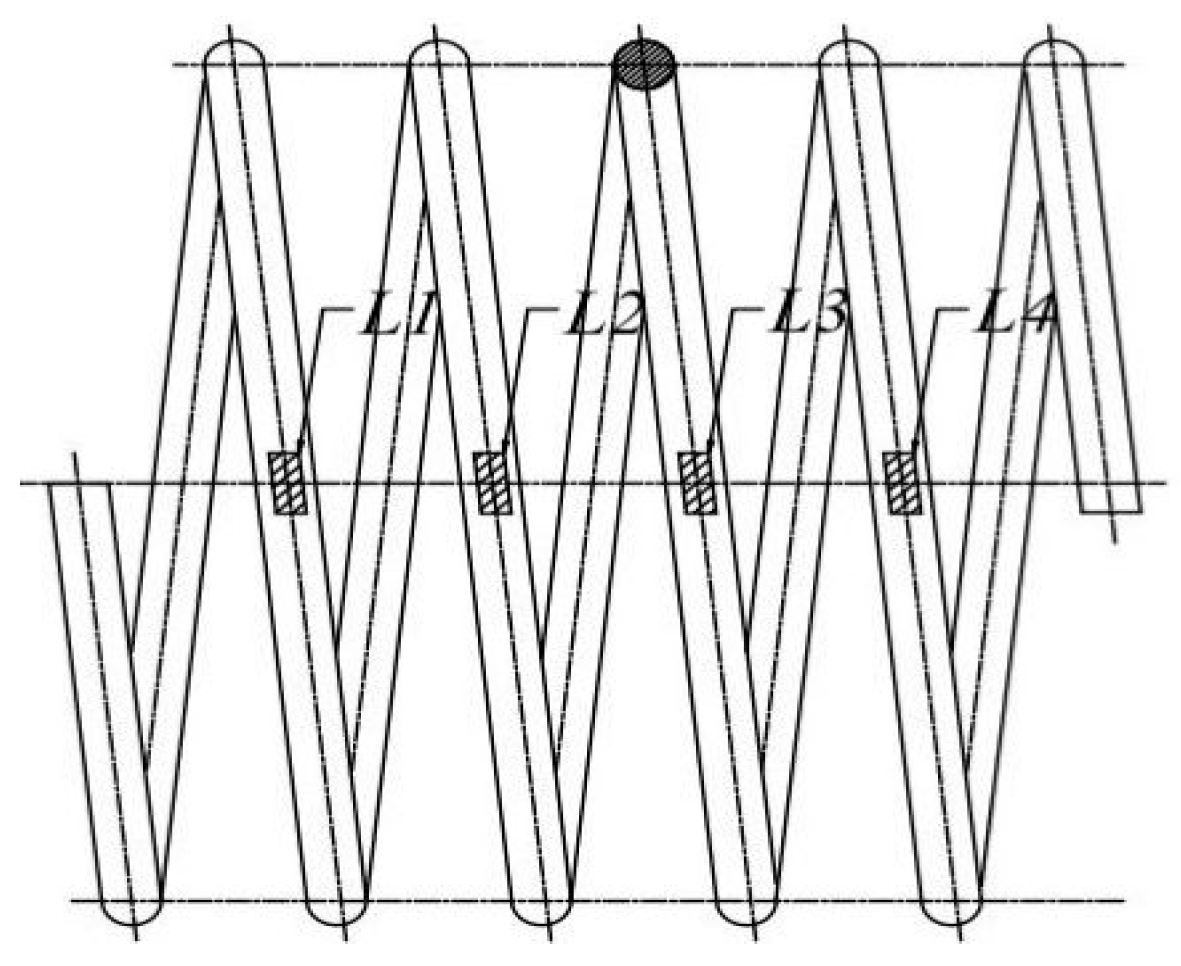
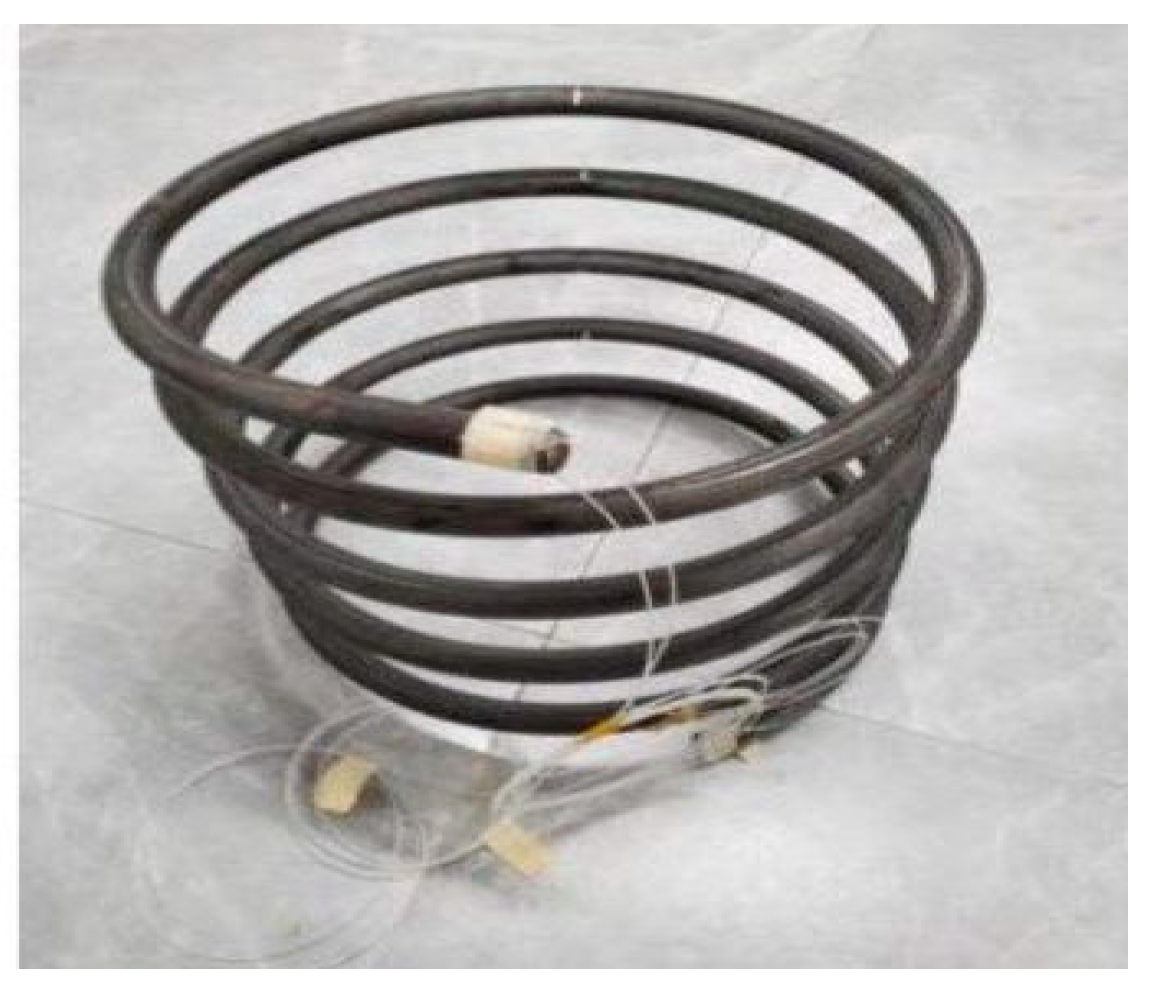
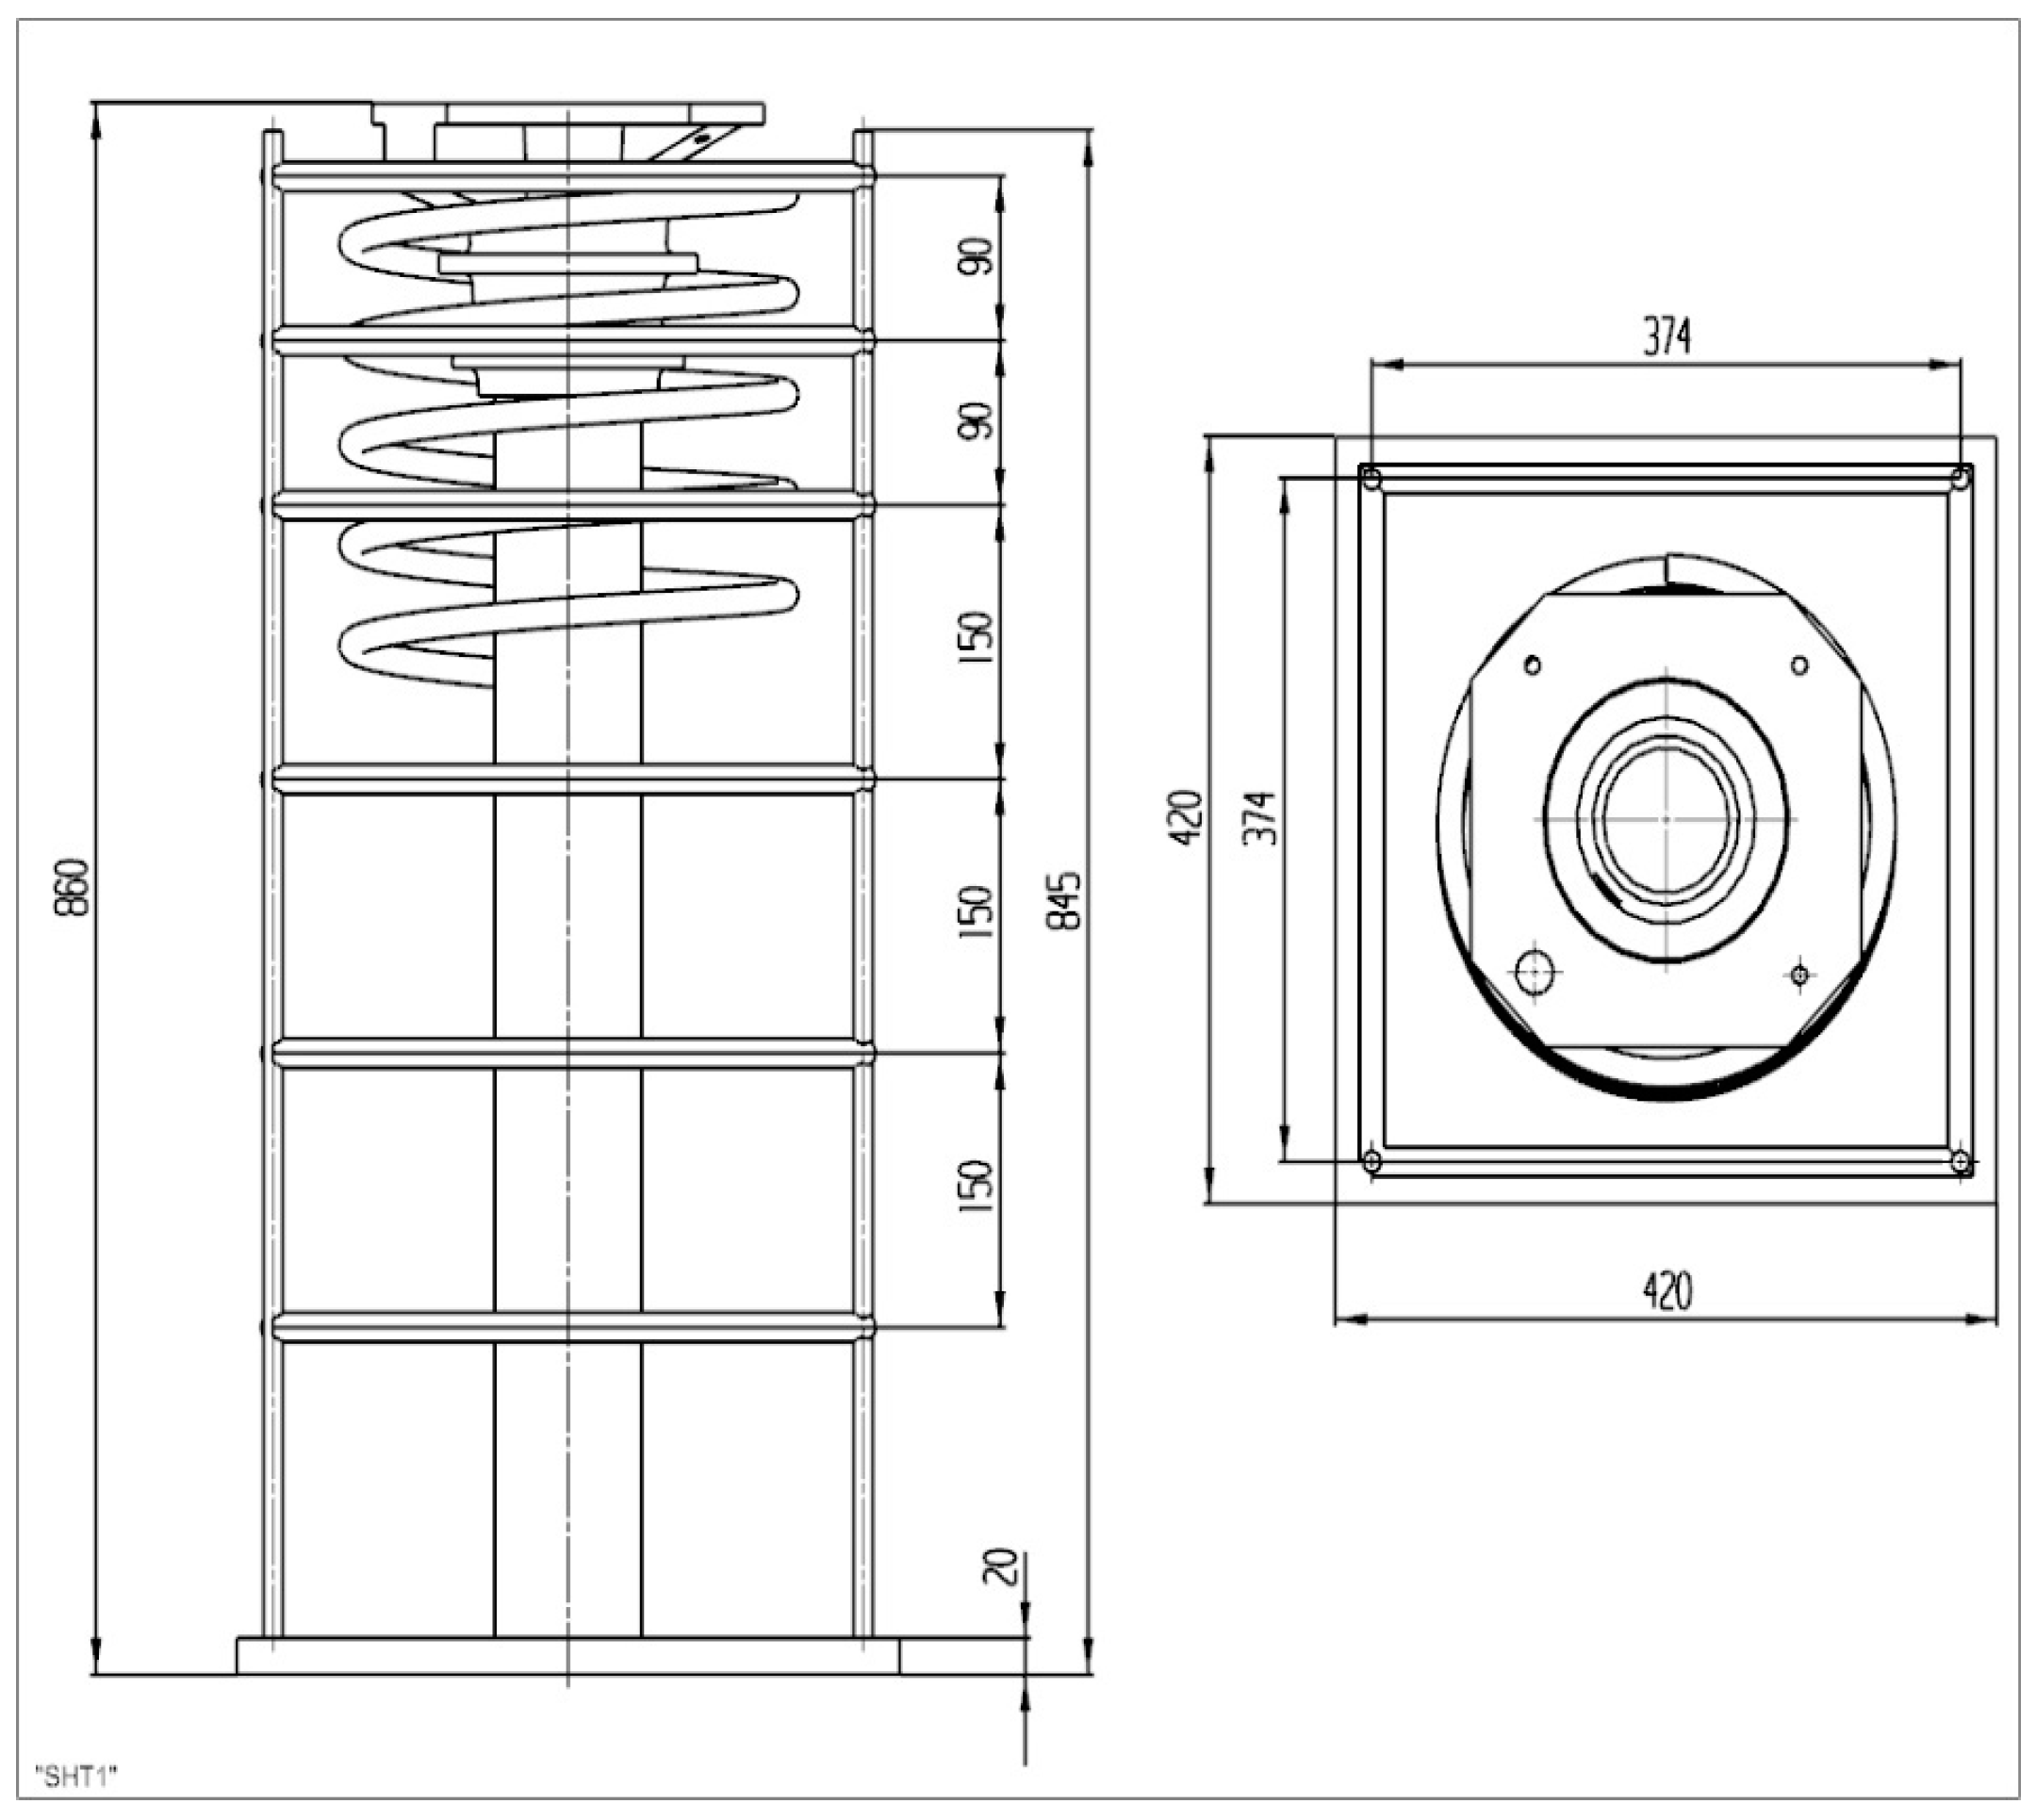
5.1. Test Method
5.2. Test Results and Analysis
- (1)
- (2)
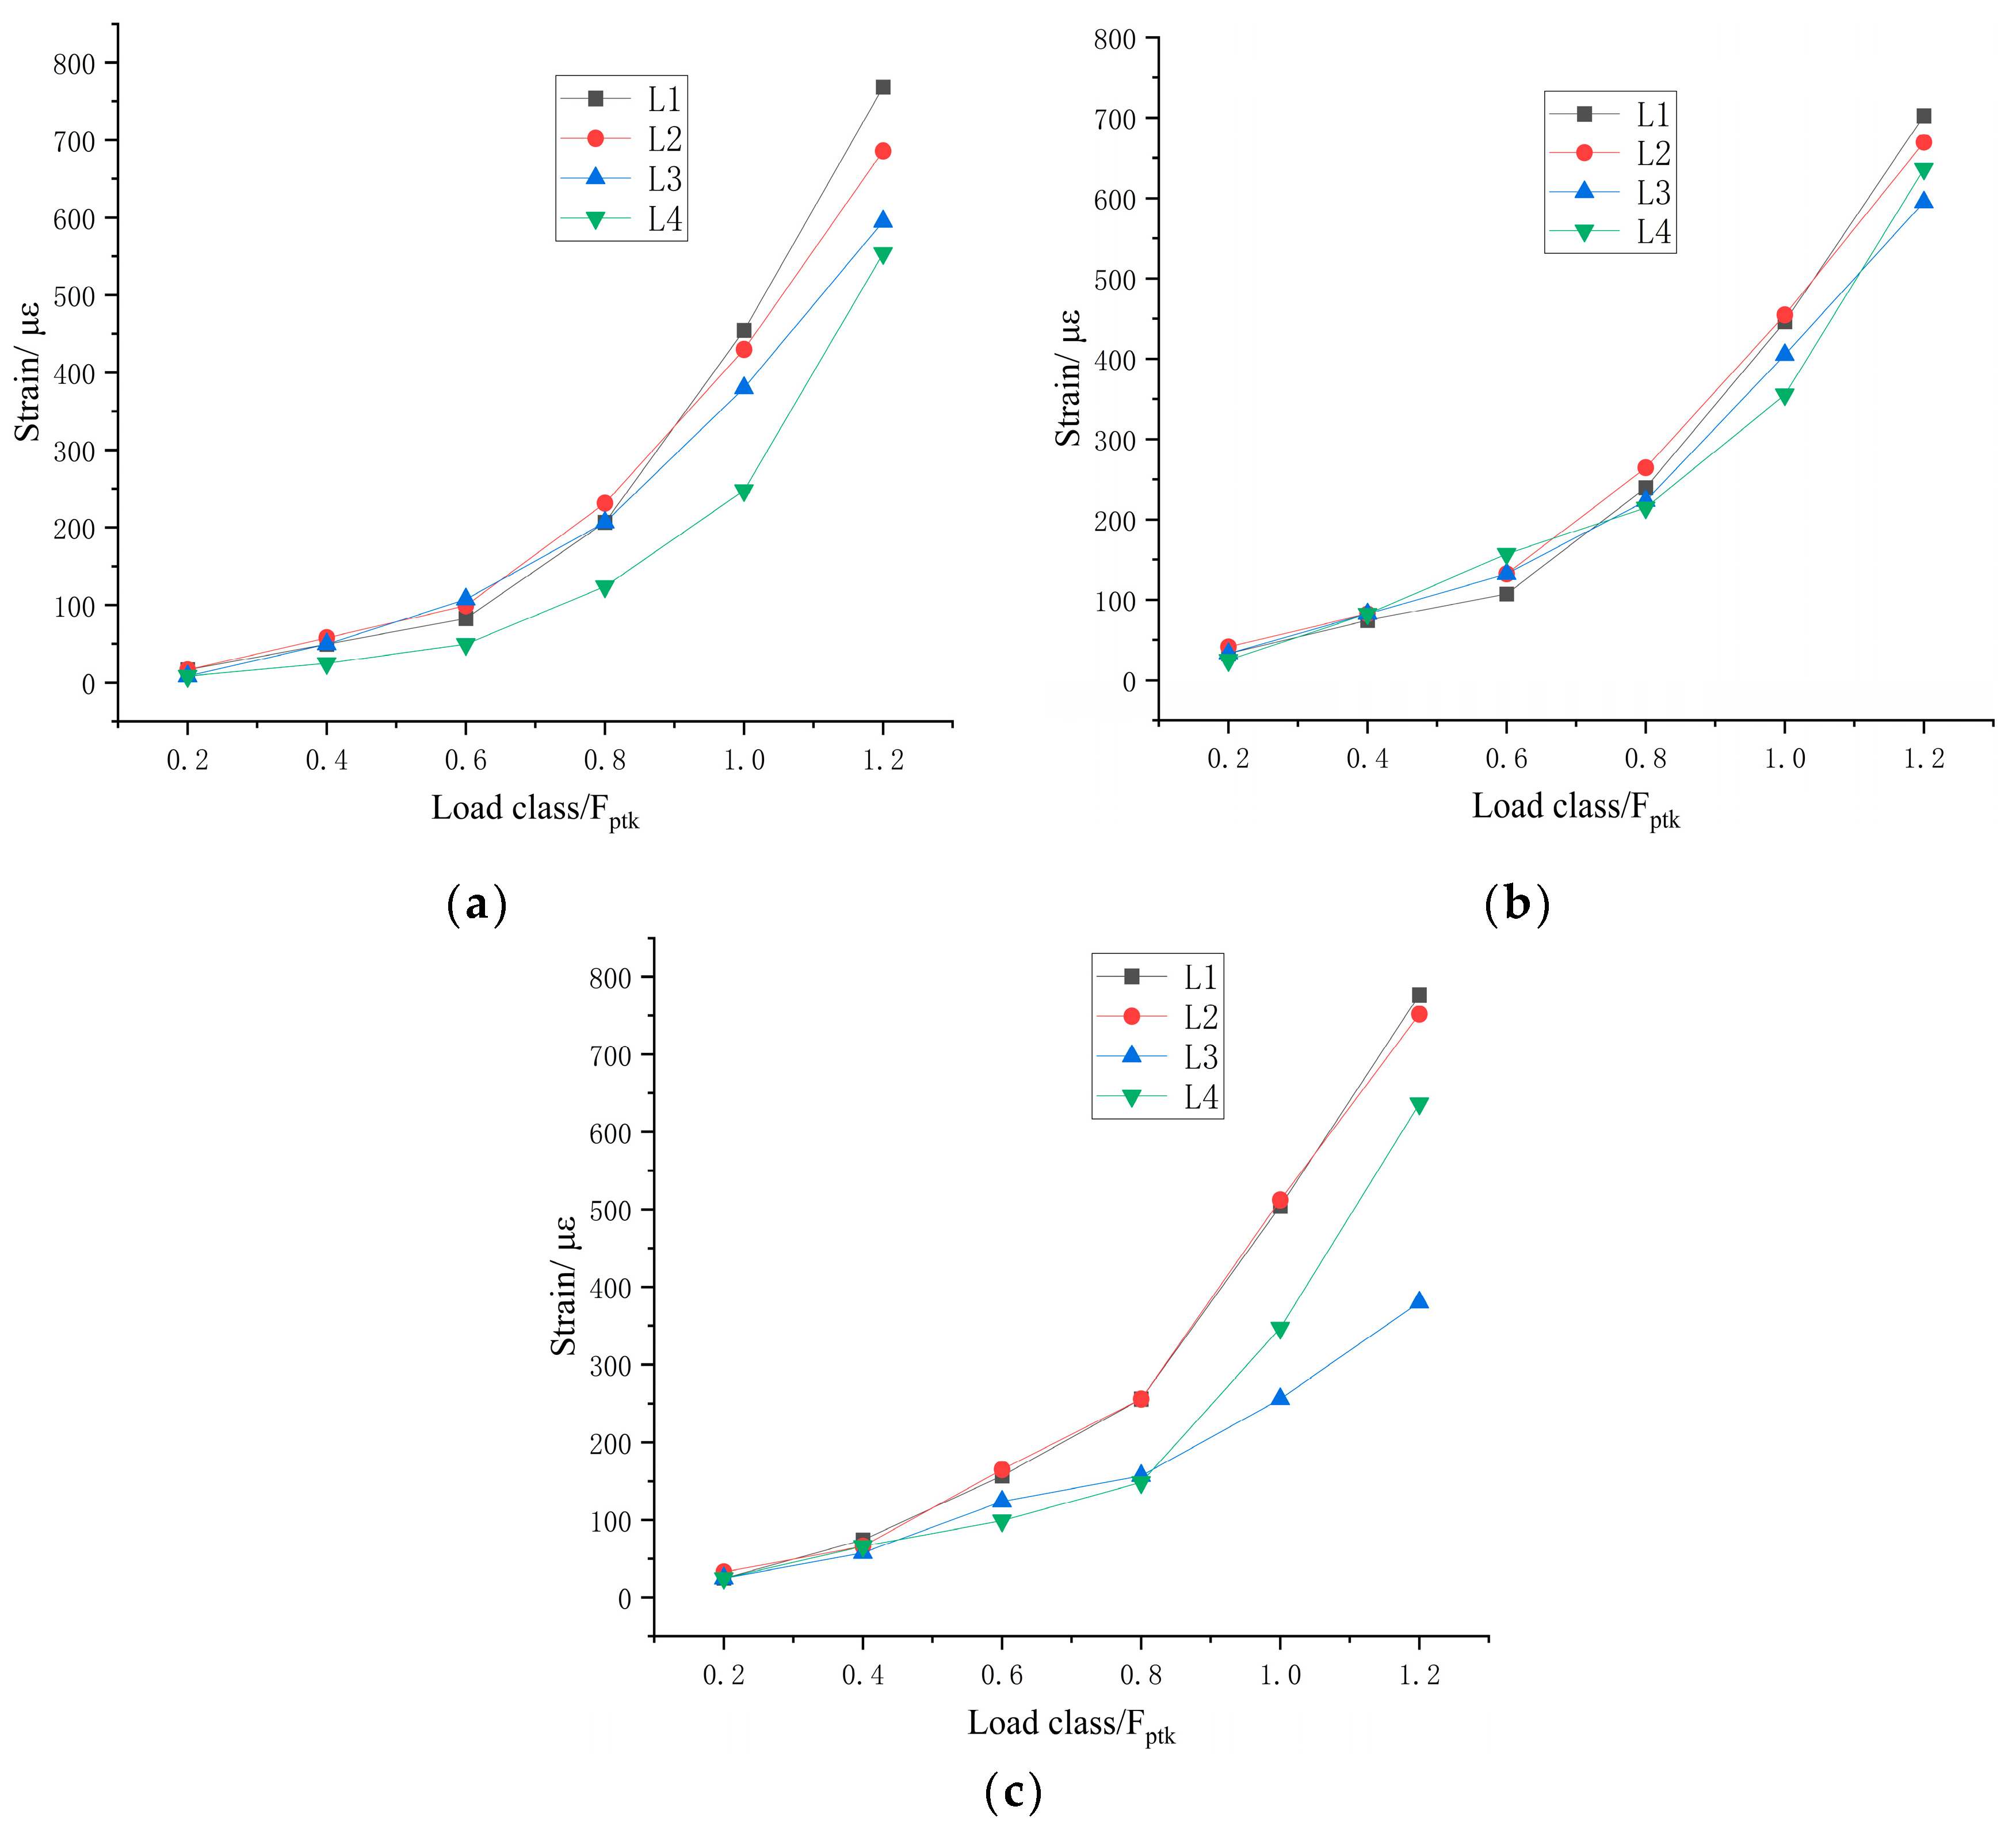
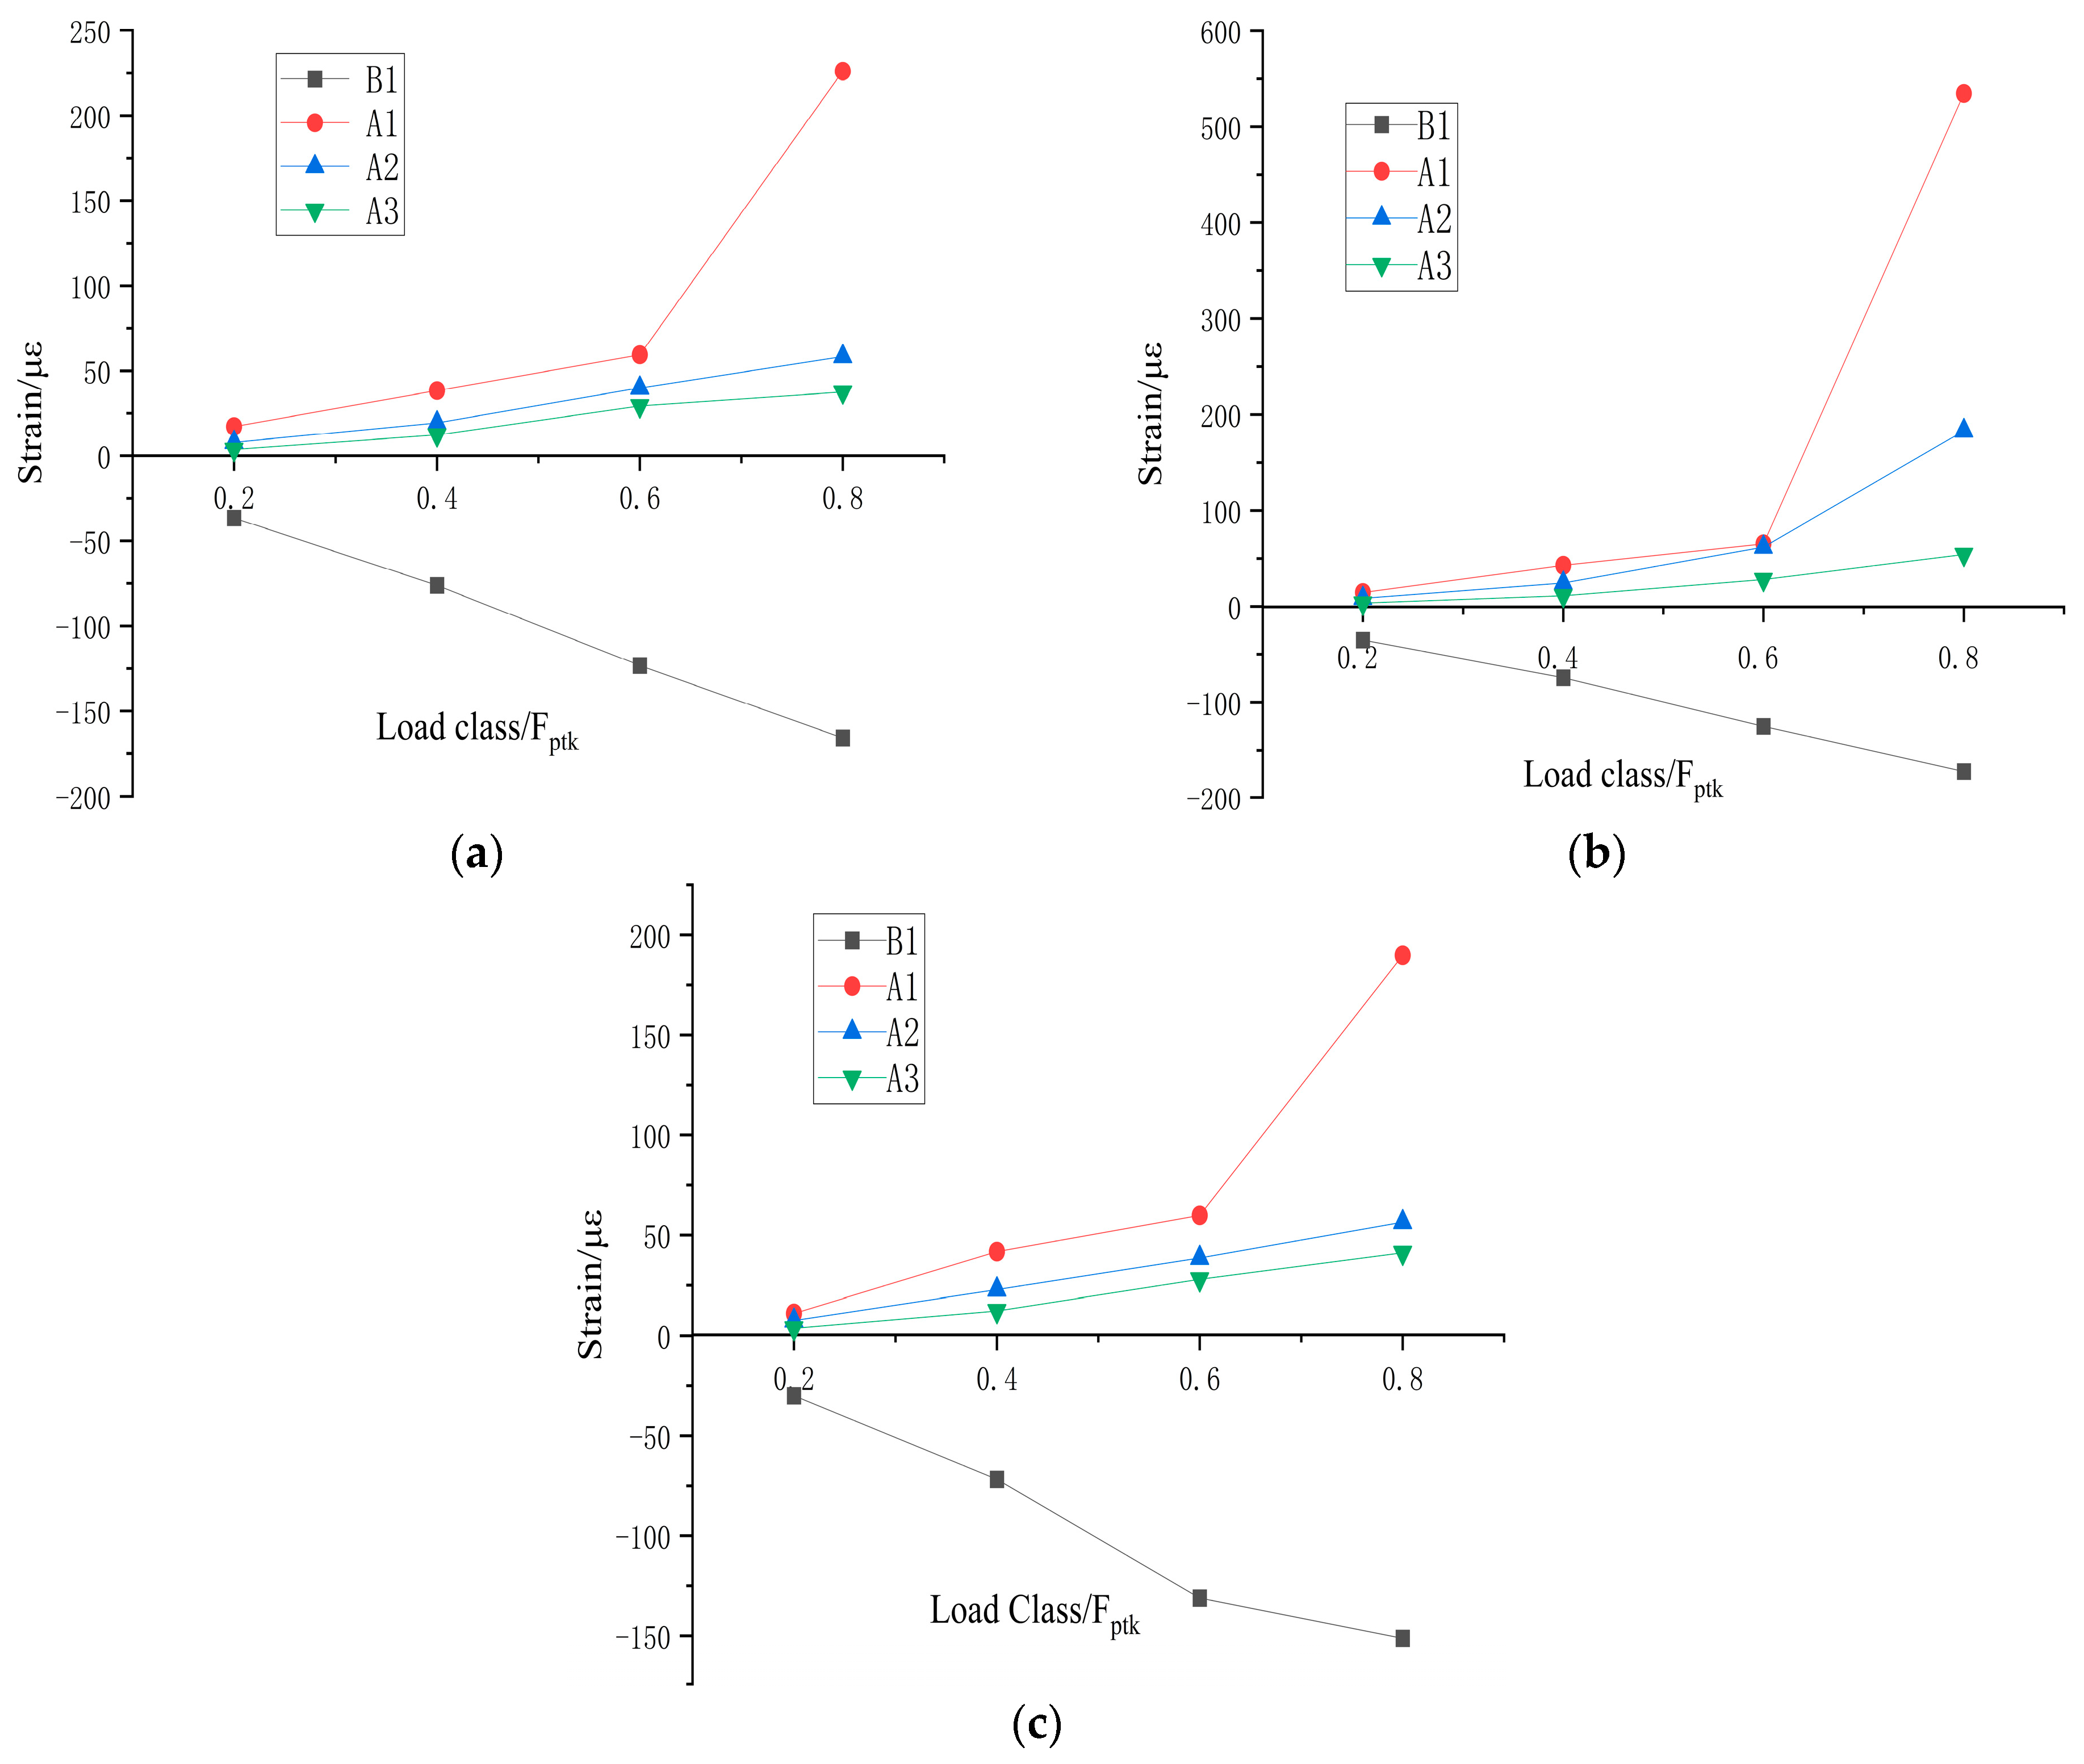
- When loading to 1.0 , the crack widths of the three concrete specimens continue to spread along the previous cracks, and new cracks are generated. The maximum crack widths do not exceed 0.11 mm. No other failure forms were found in the anchor plates of the three specimens.
- (3)
- When loading to 1.2 , the crack widths of the three concrete specimens continue to spread along the previous cracks, and new cracks are generated. The maximum crack widths do not exceed 0.15 mm. During the test, there is a slight subsidence around the anchor plate, the edge is slightly warped, and the whole structure of the anchor plate is not deformed.
6. Conclusions
- (1)
- After the three-dimensional model establishment, finite element analysis, and establishment of the strut-and-tie model, in the second pressure-bearing step anchor plate, based on the addition of the middle third pressure-bearing step, the angle of its anchorage zone strut-and-tie model increased. The anchor plate increases, the middle pressure-bearing step position is different, and its anchorage zone strut-and-tie model strut and compression rod angle are different. Optimizing the design of the anchor plate according to the 0.533 position parameter of the intermediate pressure-bearing step, the angle of the strut-and-tie model in the anchorage zone is the largest, and the bearing capacity of the anchorage zone is relatively high. The change in the internal structure of the anchor plate affects the stress distribution in the anchorage zone.
- (2)
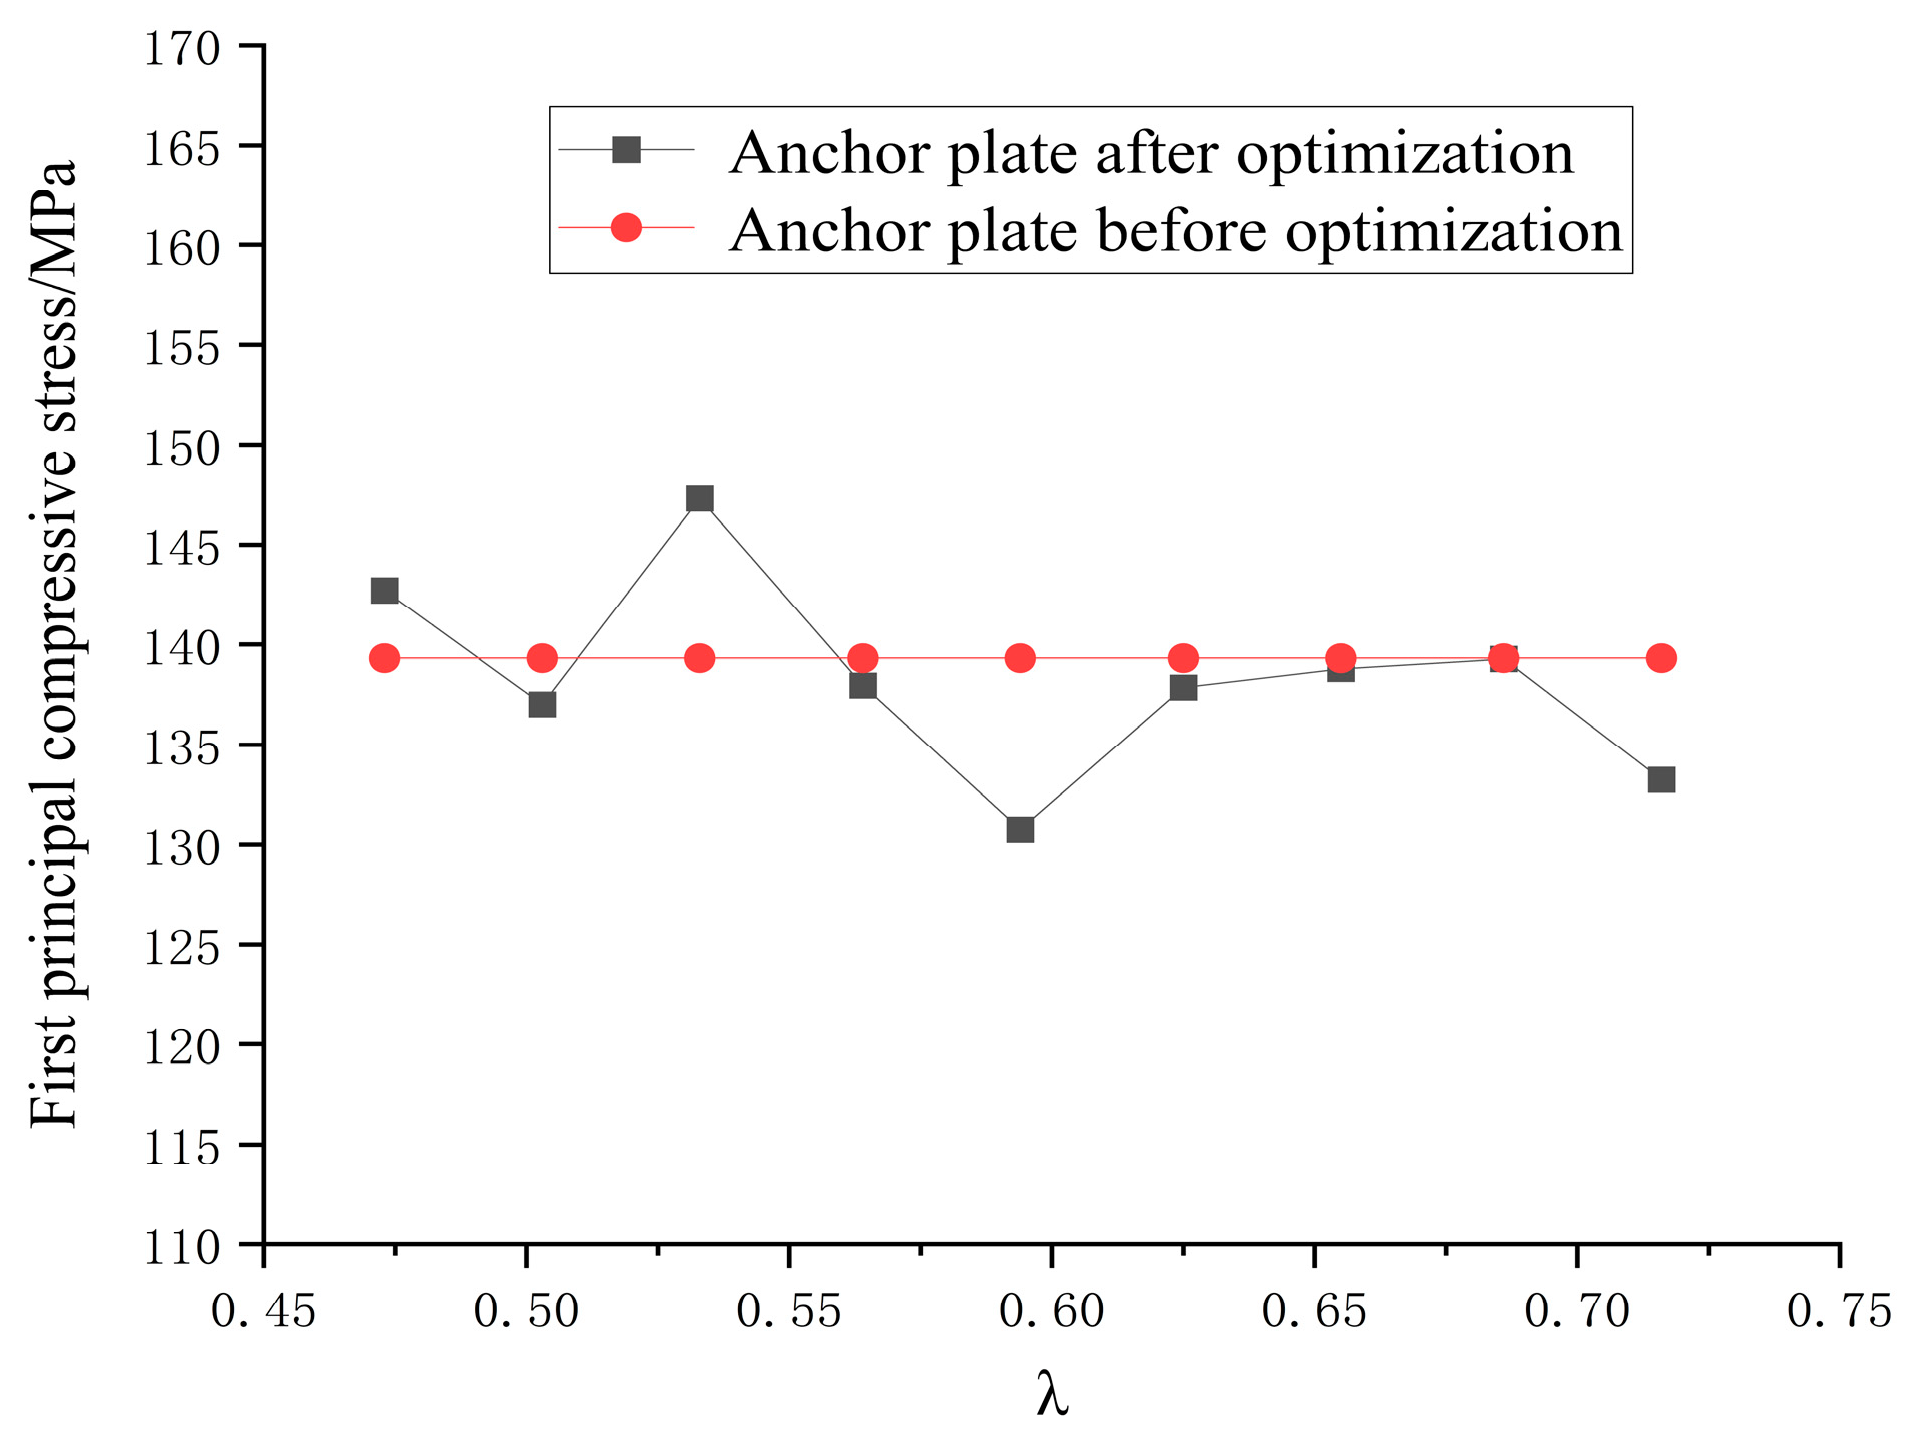
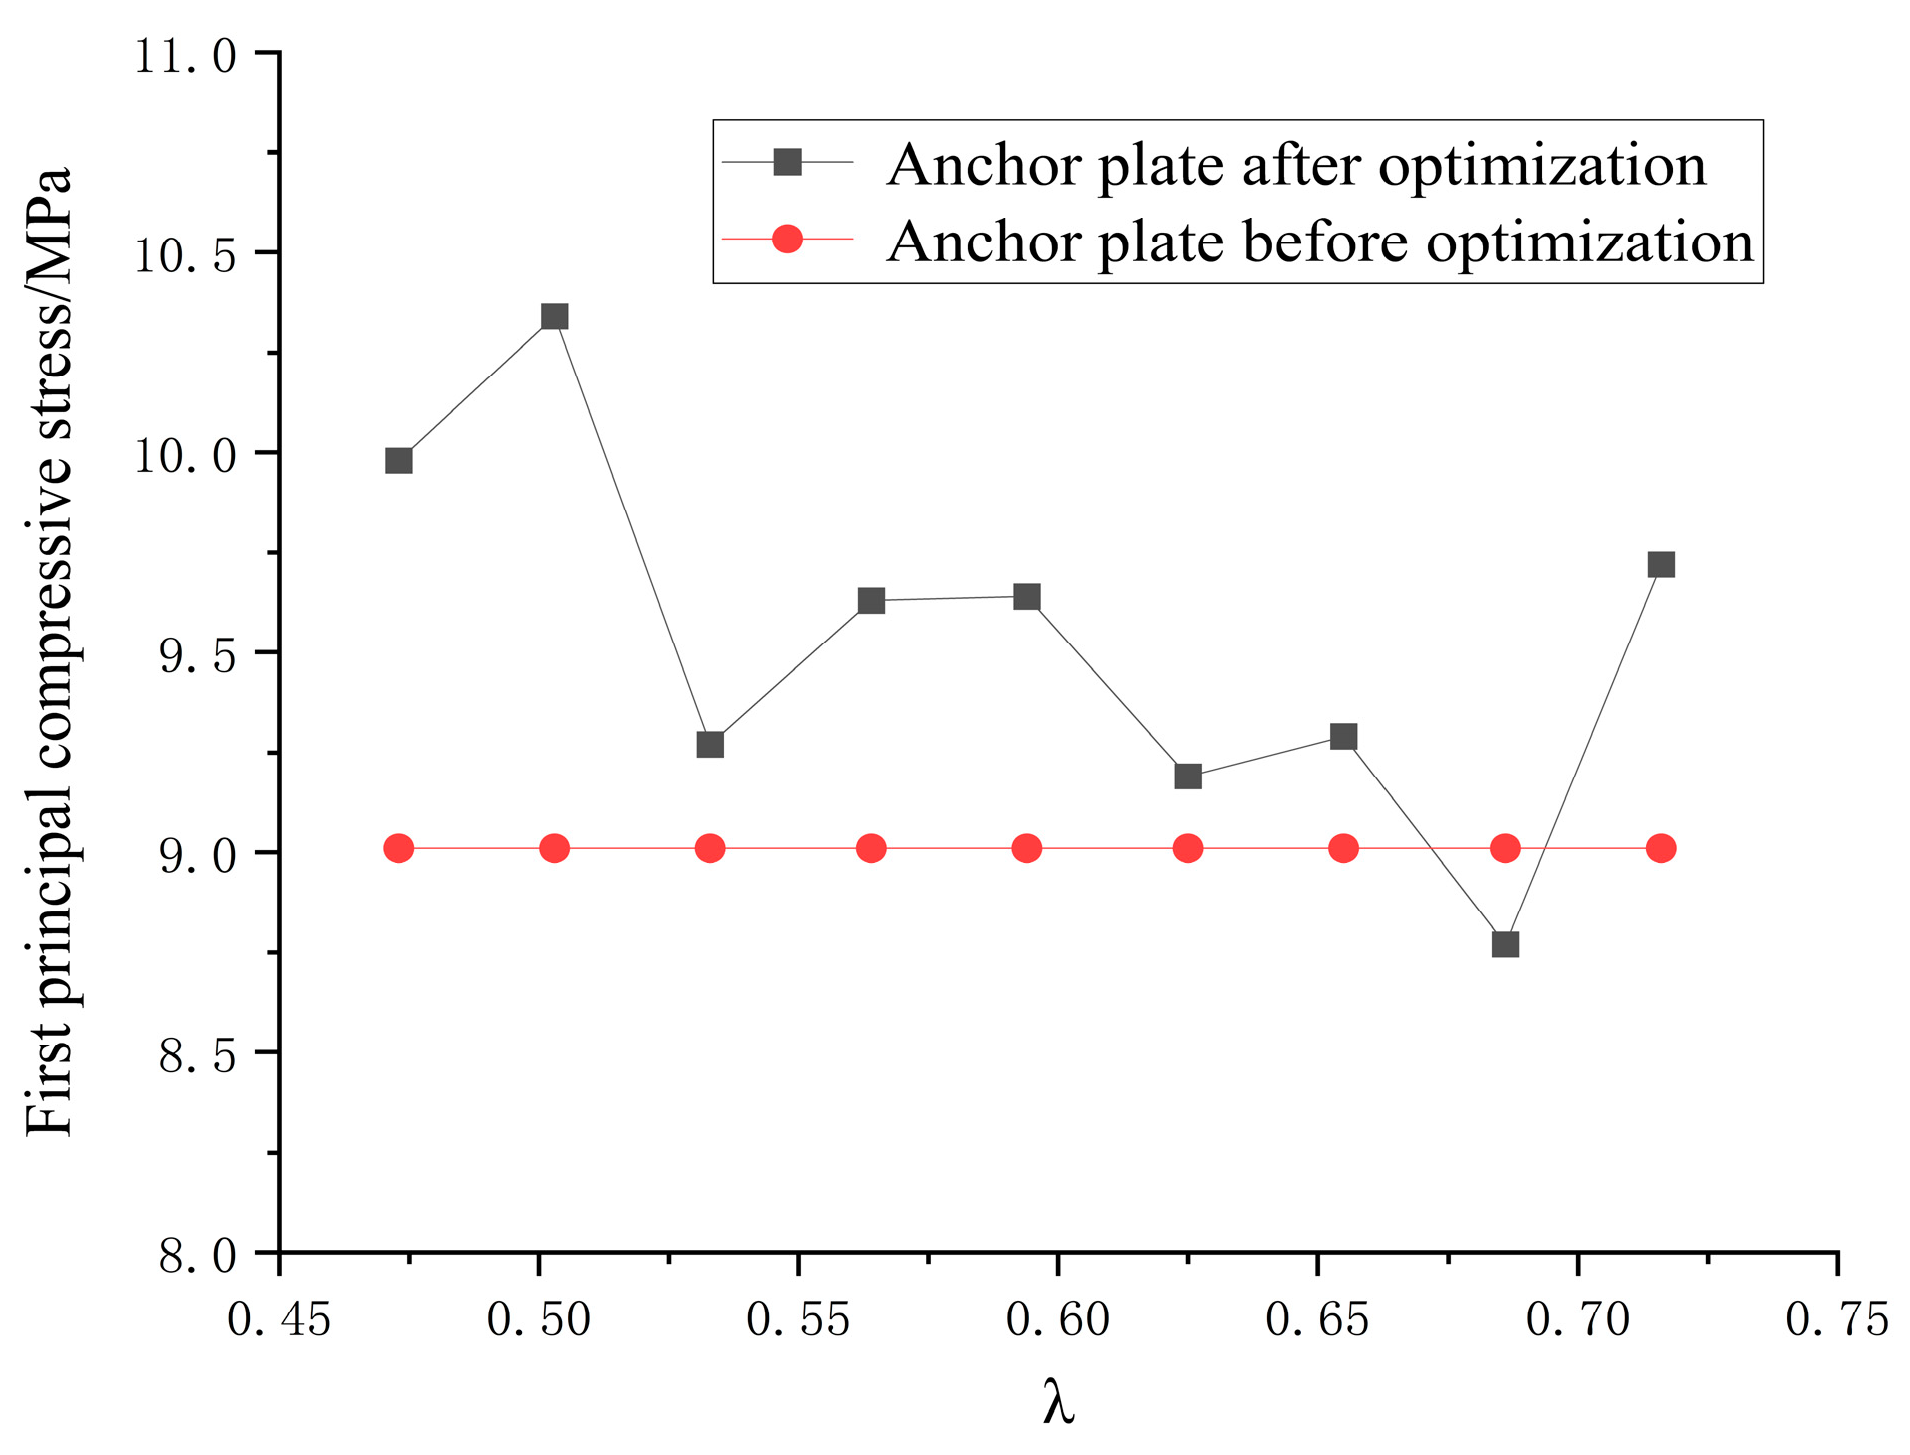
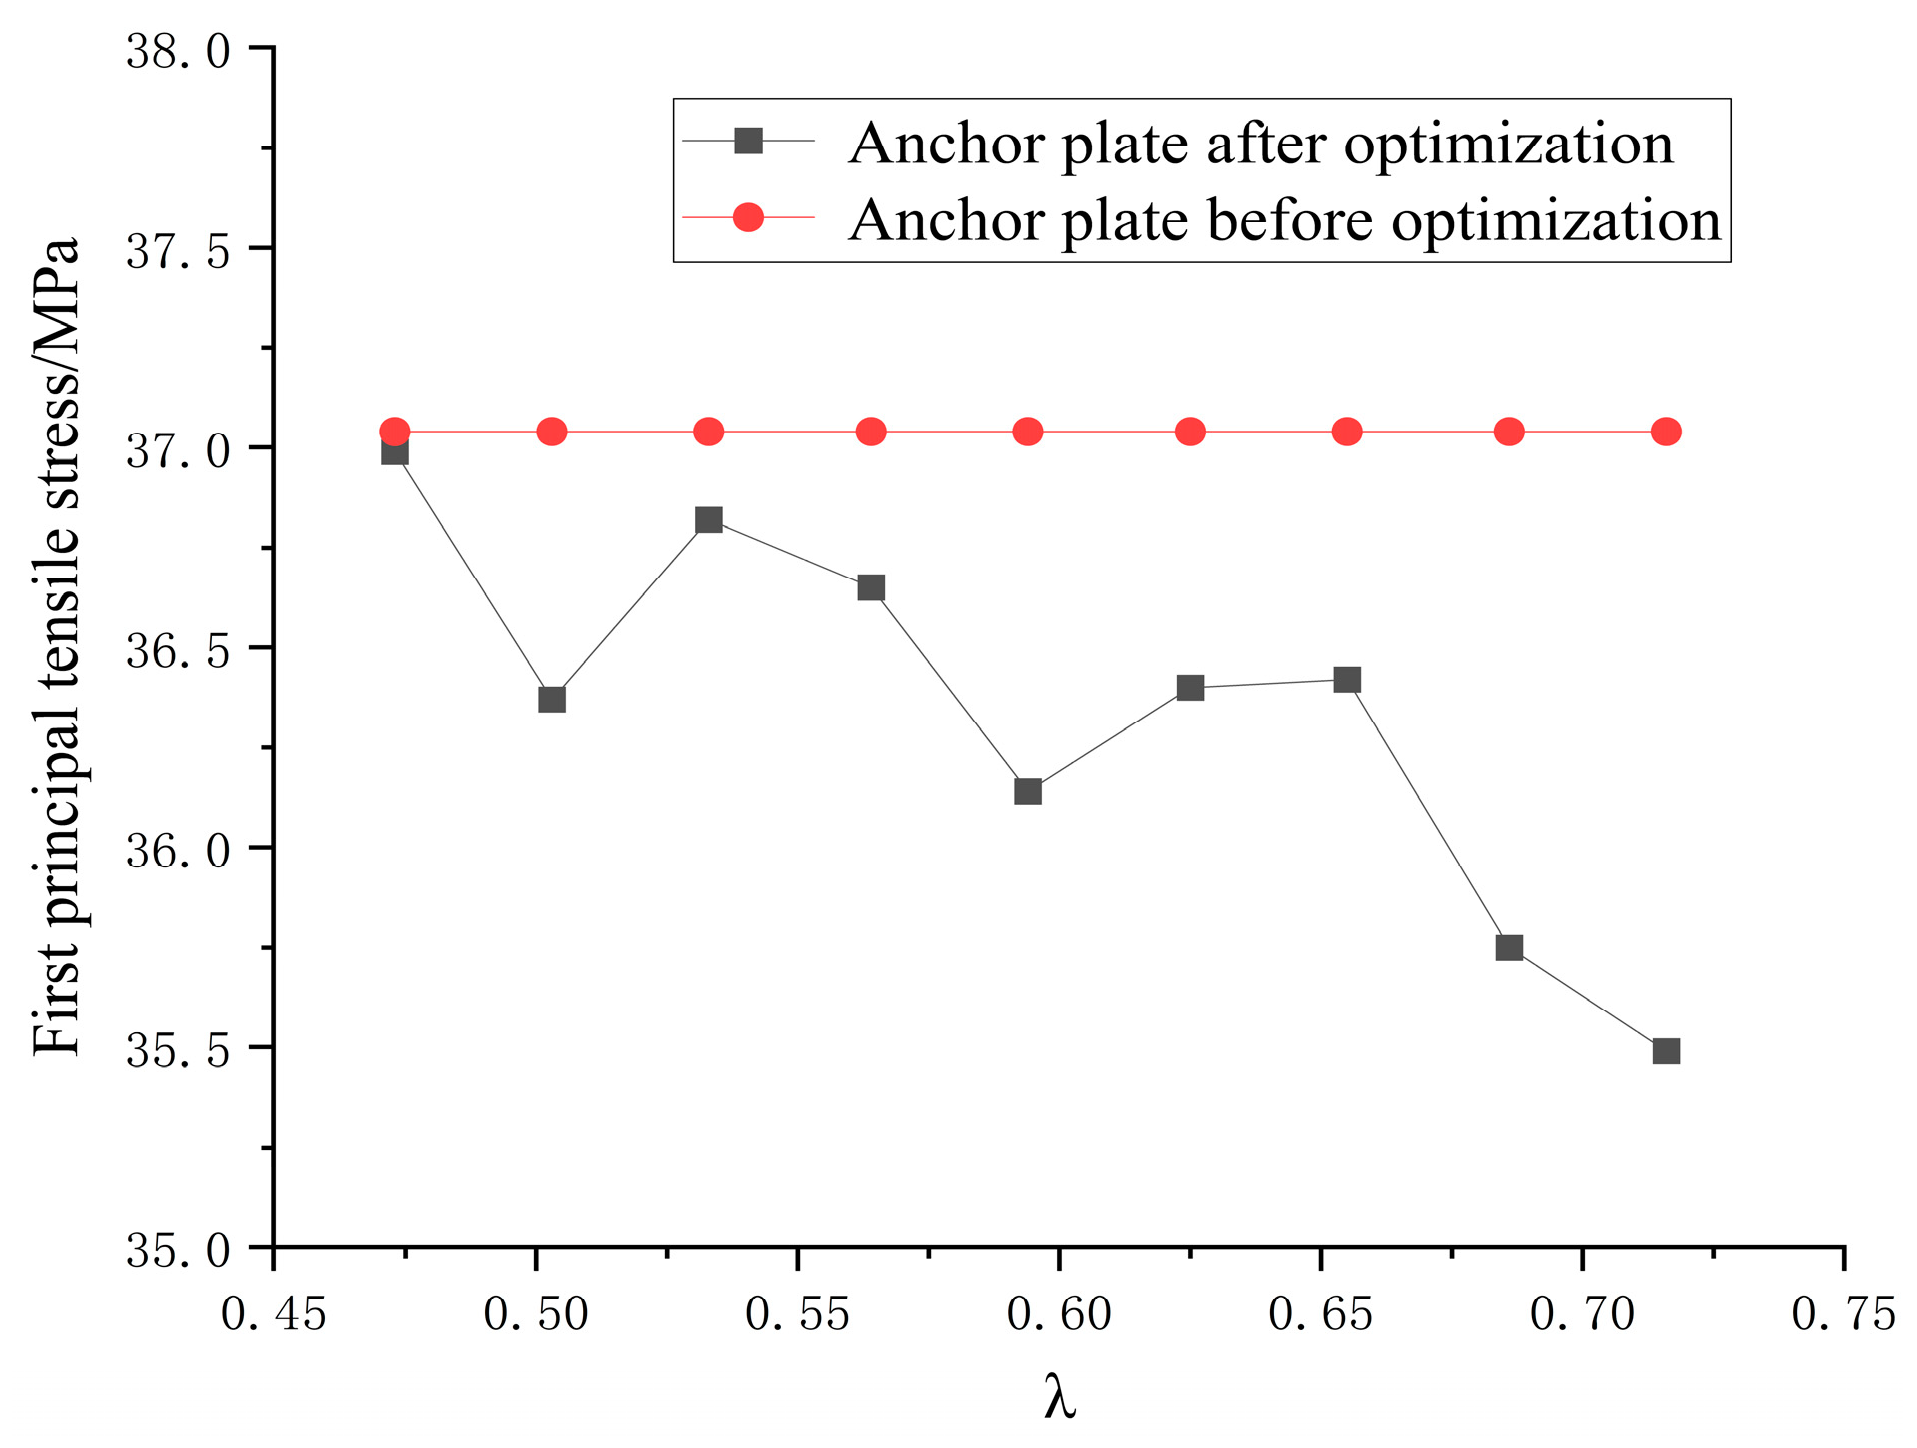
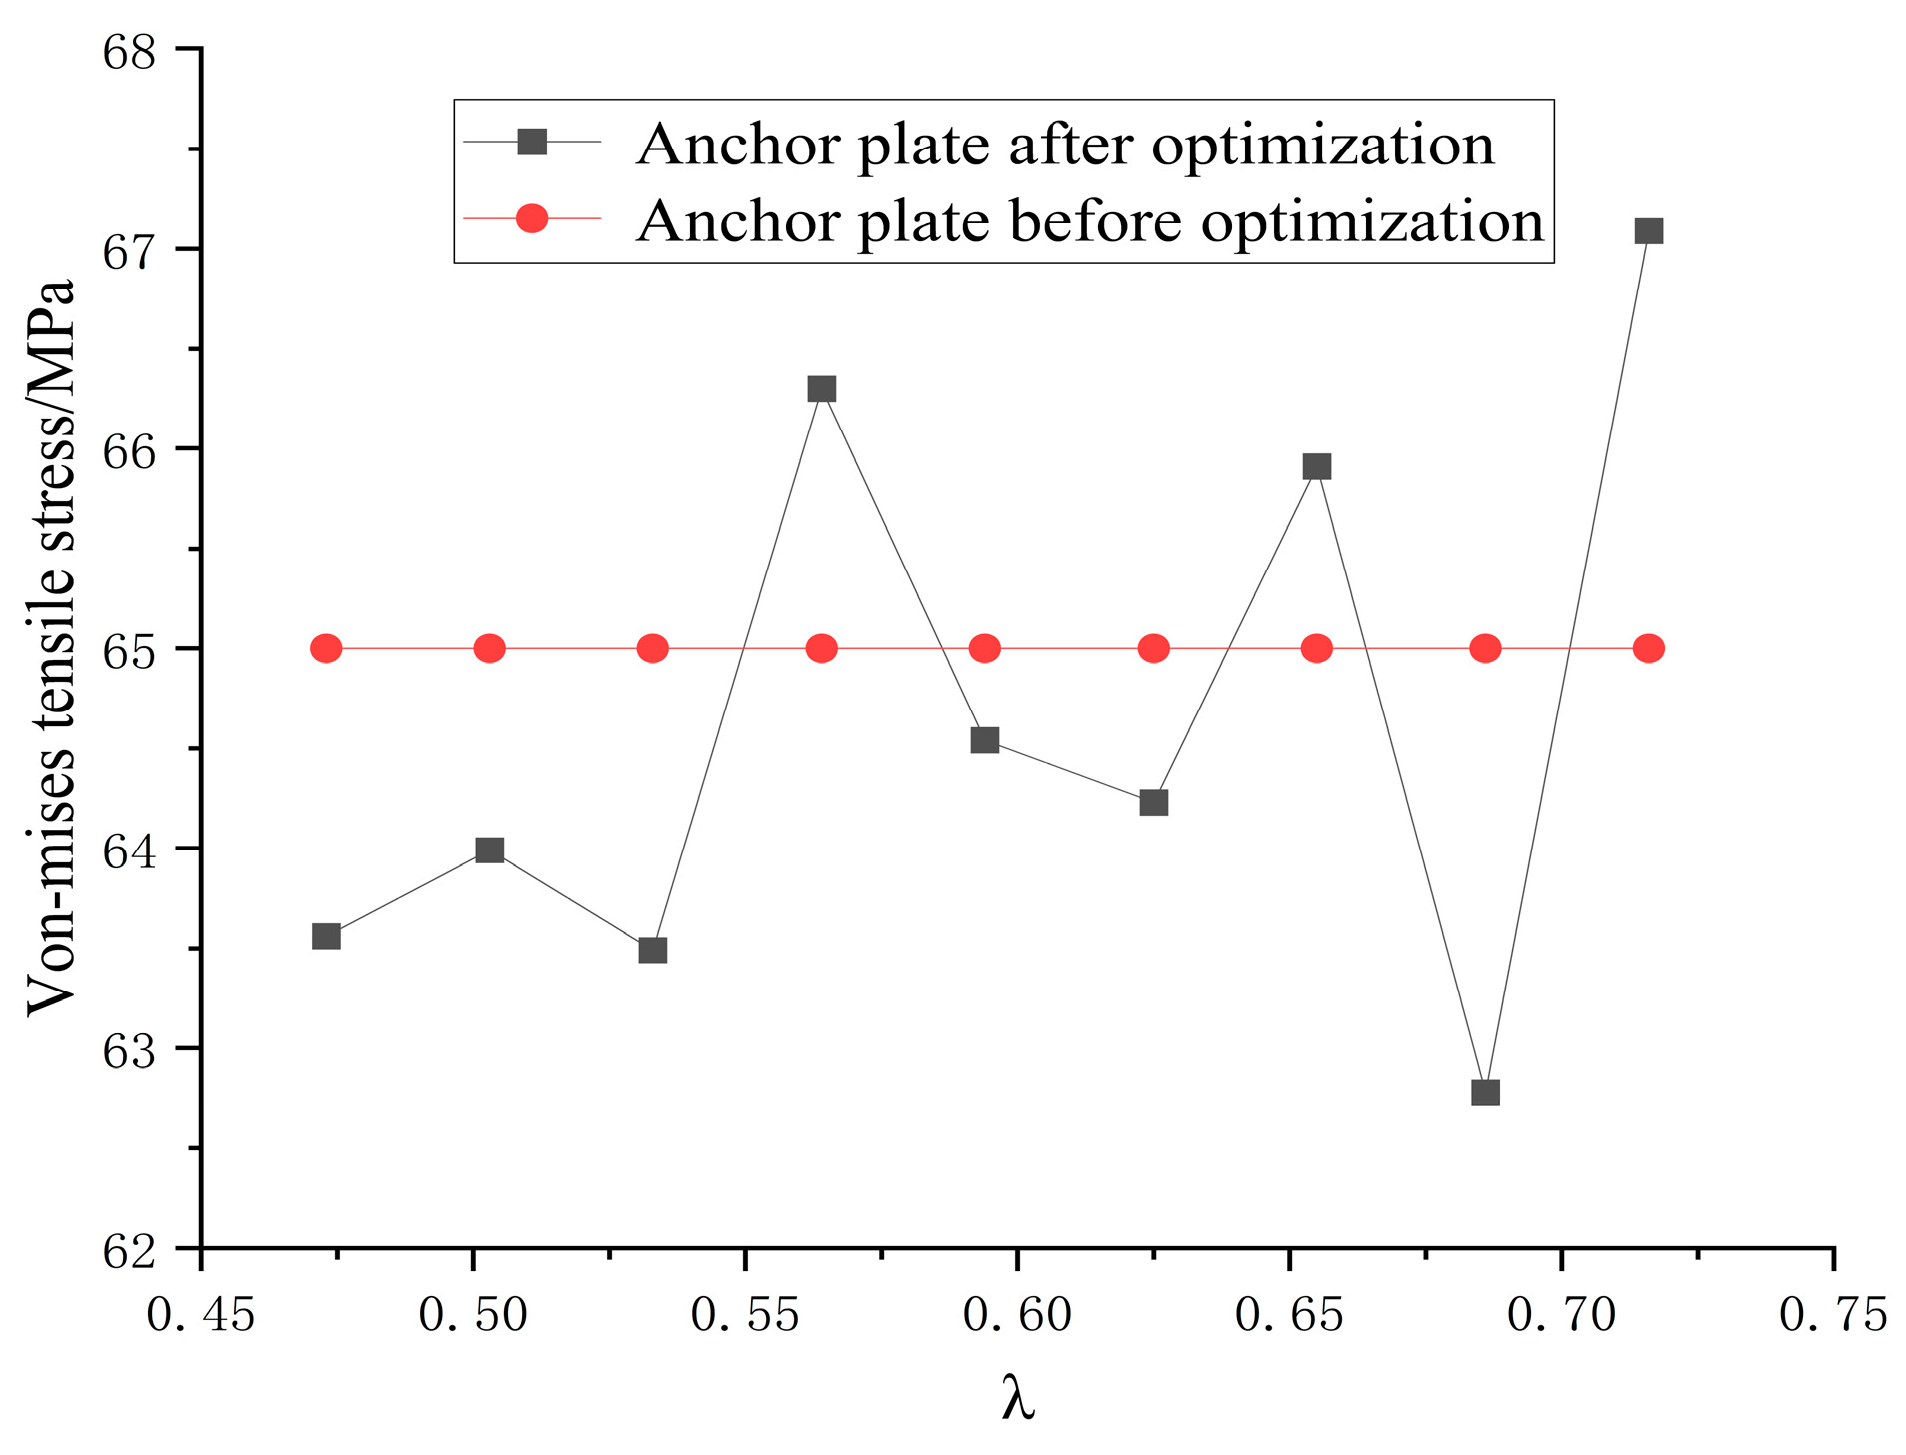
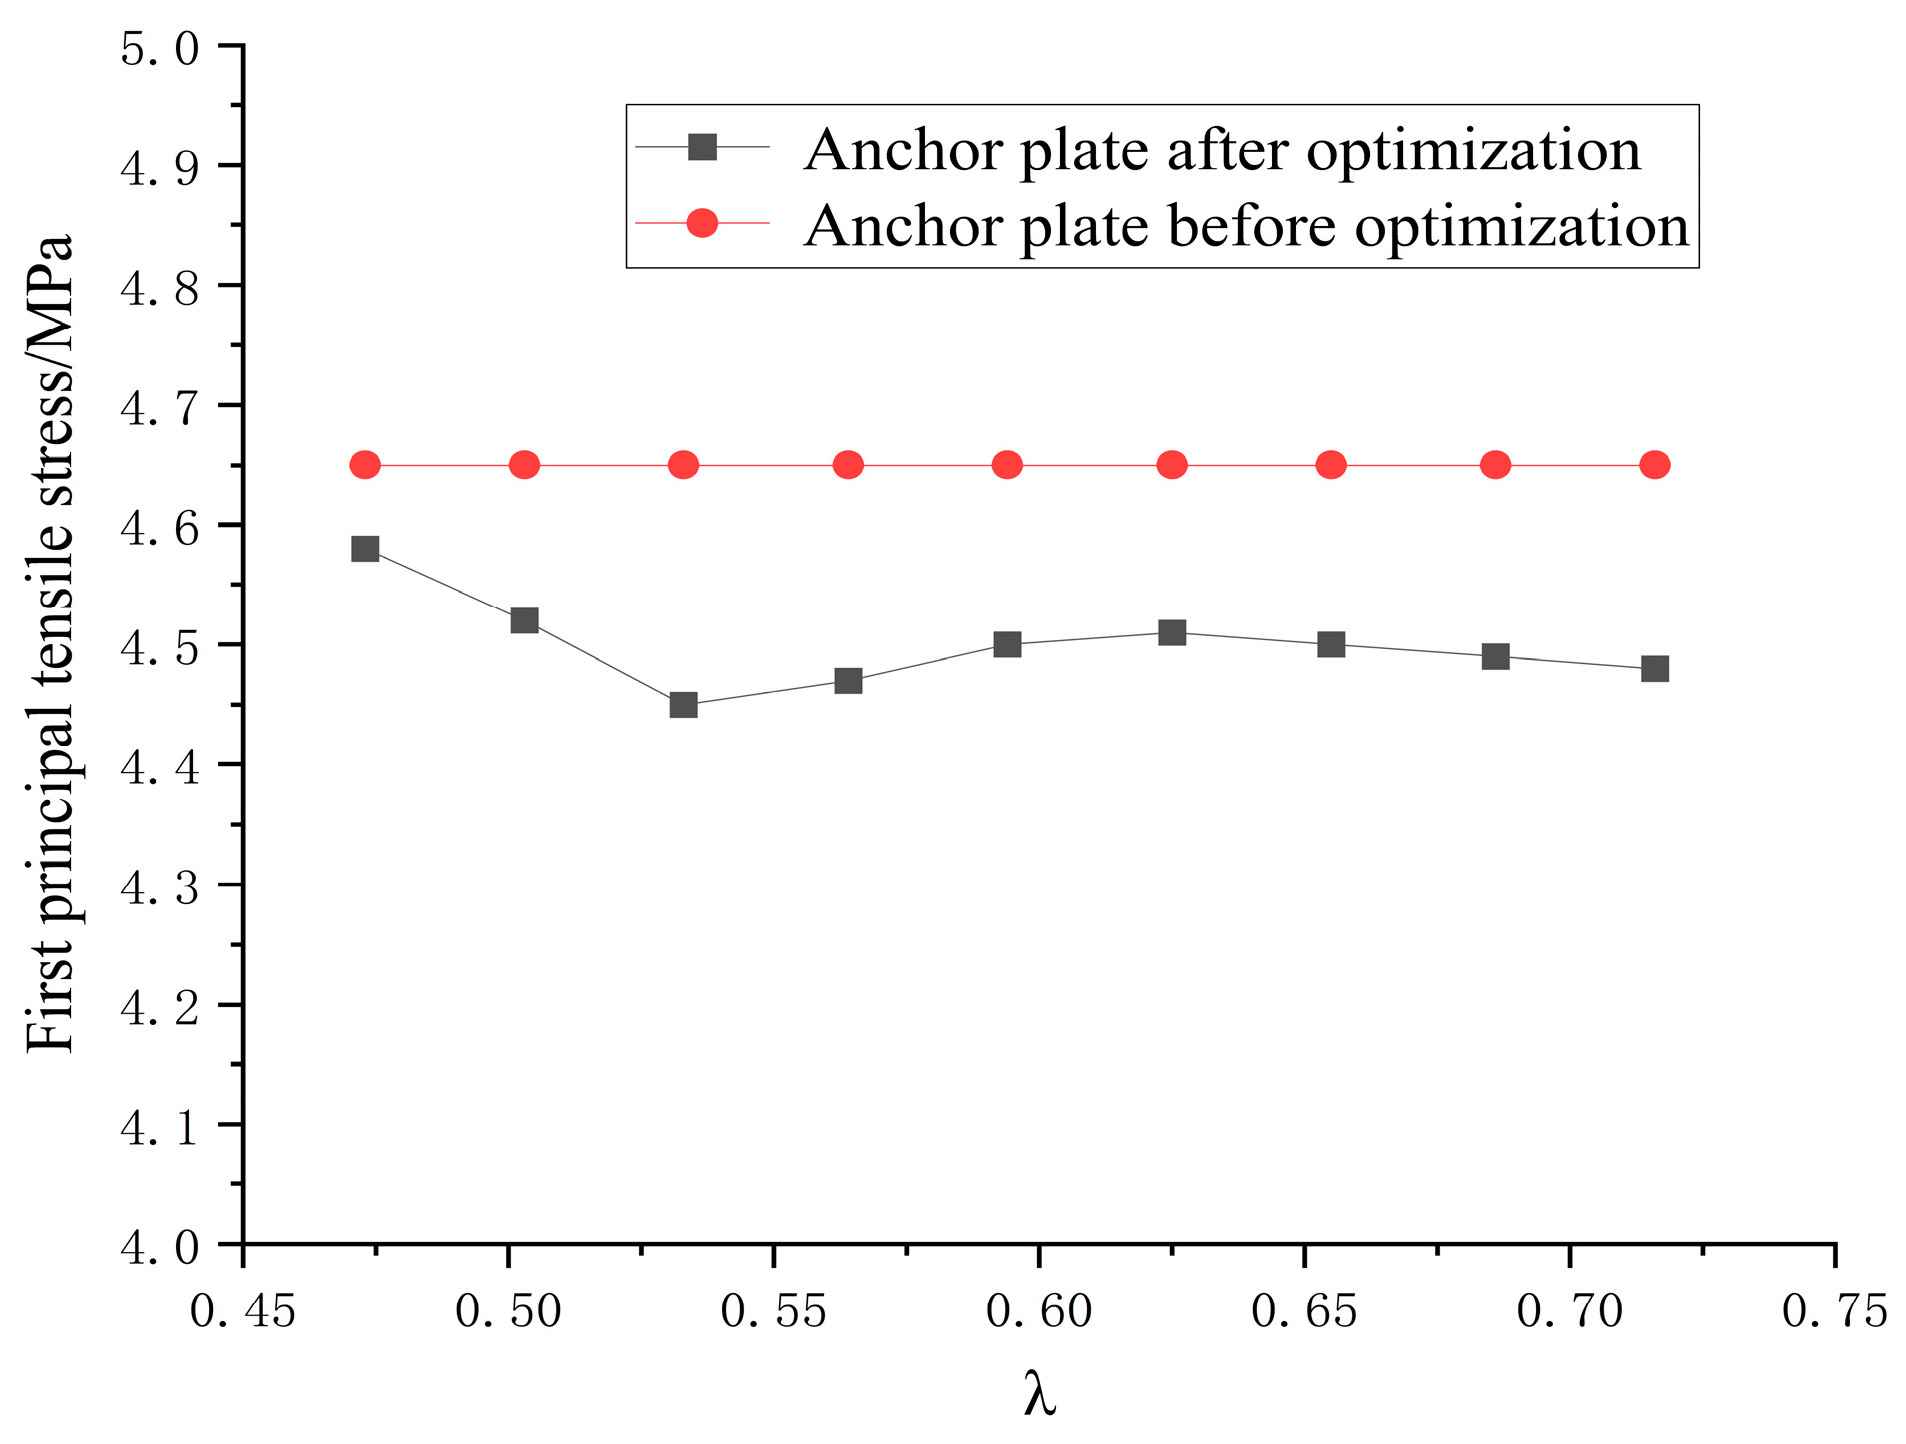
- Comparative analysis by finite element. According to the middle pressure-bearing step position parameter of 0.533 to optimize the design of the anchor plate, the main tensile and compressive stresses of the anchor plate after optimization increased by 6.2% and 5.74%, respectively, compared with the anchor plate after optimization. The main tensile stress of the spiral reinforcement under the anchor decreased by 0.59%, the main compressive stress increased by 2.89%, and the Von Mises tensile stress decreased by 2.32%. The side surface tensile stress of concrete under the anchor decreased by 4.3%.
- (2)
- After the anchorage zone force transfer test, through the use of FBG strain transducer measured 1, 2, and 3 specimens are in the load 0~0.6 , the spiral reinforcement strain value, the concrete side surface strain value show a linear growth, the finite element simulation stress value and the average value of the measured stress comparison of the basic match, the spiral reinforcement finite element stress simulation value compared with the average value of the measured stress is greater than the average value of the stress by 2.74~8.51%, the spiral reinforcement finite element stress simulation value compared with the average value of the measured stress is greater by 8~9.91%. The concrete side surface finite element analysis stress value is smaller than the average value of measured stress by 8~9.91%. Under the load of 0.8 , the first crack appeared in all three concrete specimens, due to the stress redistribution, the strain of spiral reinforcement, and the concrete side surface strain are steeply increasing phenomena, and the width of the crack is not more than 0.08 mm. When the load is loaded to 1.2 , the maximum value of the specimen’s crack width is not more than 0.15 mm, which meets the requirements of the FIP’s crack width limit, and the anchor plate has no deformation except the slight subsidence around the anchor plate. There was no overall deformation except for a slight subsidence around it. Therefore, it is further verified that the anchor plate after optimization designed according to the intermediate pressure-bearing step position parameter 0.533 is structurally safe and suitable for a 2200 MPa grade high-strength strand, and its 2200 MPa grade prestressing anchorage zone has sufficient bearing capacity.
Author Contributions
Funding
Data Availability Statement
Acknowledgments
Conflicts of Interest
References
- Rebelo, J.; Marchão, C.; Lúcio, V. Study on the efficiency of confinement reinforcement in post-tensioning anchorage zones. Mag. Concr. Res. 2019, 73, 1–39. [Google Scholar]
- Shin, J.; Kim, J.H.; Chang, H.J. Anchor plate effect on the breakout capacity in tension for thin-walled concrete panels. Eng. Struct. 2016, 106, 147–153. [Google Scholar] [CrossRef]
- Kwon, Y.; Kim, J.K.; Yang, J.M. Development of Efficient Anchorage Device and Estimation of Its Bearing Strength of Posttensioning Anchorage Zone. J. Struct. Eng. 2017, 144, 04017219. [Google Scholar] [CrossRef]
- Ji, J.H.; Dong, Z.Q.; Liu, Z.Q.; Sun, Y.; Zhu, H.; Wu, G. Chee-Kiong Soh, Feasibility of using Fe-SMA rebar as cracking resistance spiral stirrup in the anchorage zone of post-tensioned prestressed concrete. Structures 2023, 48, 823–838. [Google Scholar] [CrossRef]
- Vladimir, C.; Rudolf, G.H. Validation of post-tensioning anchorage zones by laboratory testing and numerical simulation. Struct. Concr. 2014, 15, 258–268. [Google Scholar]
- Mao, W.Z.; Gou, H.Y.; He, Y.N.; Pu, Q.H. Local Stress Behavior of Post-Tensioned Prestressed Anchorage Zones in Continuous Rigid Frame Arch Railway Bridge. Appl. Sci. 2018, 8, 1833. [Google Scholar] [CrossRef]
- Kook, K.J.; Yangsu, K.; Gyoung, K.H. Anchorage Zone Behavior in the Slab with Flat Anchorage. J. Korean Soc. Hazard Mitig. 2014, 14, 1738–2424. [Google Scholar]
- Chen, D.S.; Cao, G.K. Finite element analysis of high strength environmental prestressed anchor anchor plate. Sichuan Build. Mater. 2019, 45, 162–163. (In Chinese) [Google Scholar]
- Shi, L.; Ma, L.; Chen, S.L.; Su, Y.H. Research on High-strength Prestressed Anchorage System Technology of Railway Bridge. Railw. Eng. 2021, 61, 1–4+39. (In Chinese) [Google Scholar]
- Ma, Q.; Zhu, W.X.; Su, H.T.; Fu, W.; Yang, B.D. Optimization Design for Prestressed Anchor plate Structure. J. Sichuan Univ. Sci. Eng. (Nat. Sci. Ed.) 2014, 27, 8187. (In Chinese) [Google Scholar]
- Zhao, Y.; Li, D.B.; Cheng, Z.J.; Zhu, W.X.; Zhou, J.M. Experimental study of the load transfer behavior of post-tensioned concrete anchorage zone with cast anchor plate. China Civ. Eng. J. 2011, 44, 47–54. (In Chinese) [Google Scholar]
- Chen, J.Y.; Xie, X.; Xu, A.M. Study of tendon anchorage zones of long span post tensioned prestressed concrete box girder. J. Zhejiang Univ. (Eng. Sci.) 2009, 43, 1077–1082, 1176. [Google Scholar]
- Zhu, W.X.; Qin, H.Y.; Gan, G.R.; Fu, W. Key Techniques of Prestressed High-strength Rebar Anchorage Structure for Segmental Precast Piers of Hong Kong-Zhuhai-Macao Bridge. J. China Railw. Soc. 2017, 39, 118–124. (In Chinese) [Google Scholar]
- Zhu, W.X.; Zhang, H.L.; Gan, G.R.; Fu, W. Experimental Research on Prestressed High Strength Rebar Anchorage System for Segmental Precast Piers of Hong Kong-Zhuhai-Macao Bridge. Constr. Technol. 2017, 46, 101–105. (In Chinese) [Google Scholar]
- Aashto, L.R.F.D. Bridge Design Specifications, 9th ed.; American Association of State Highway and Transportation Officials: Washington, DC, USA, 2020. [Google Scholar]
- Zhou, L.Y.; Wan, S. Full-range nonlinear analysis of post-tensioned anchorage zones based on modified strut-and-tie model. Structures 2022, 35, 565–576. [Google Scholar] [CrossRef]
- Cui, N.N.; Huang, S.P. On the optimal strut-and-tie models and design approach for the cable-pylon anchorage zone. J. Civ. Eng. Manag. 2019, 25, 576–586. [Google Scholar] [CrossRef]
- Hou, D.W.; Zhao, J.L.; Shen, S.L.; Chen, J. Investigation and improvement of strut-and-tie model for design of end anchorage zone in post-tensioned concrete structure. Constr. Build. Mater. 2017, 136, 482–494. [Google Scholar] [CrossRef]
- Lin, B.; Liu, Z. Strut-and-tie model and reinforcement design method for isolated rectangular anchor block for external tendons. Eng. Mech. 2011, 28, 59–64. (In Chinese) [Google Scholar]
- Zaborac, J.; Choi, J.; Bayrak, O. Assessment of deep beams with inadequate web reinforcement using strut-and-tie models. Eng. Struct. 2020, 218, 141–296. [Google Scholar] [CrossRef]
- Kumar, A.; Jangid, R.S. Strength prediction of a bottle-shaped strut for evaluating the shear capacity of reinforced concrete deep beam. Eng. Res. Express 2023, 5, 015048. [Google Scholar] [CrossRef]
- Hamid, K.; Abolfazl, A. A STM-based analytical model for predicting load capacity of deep RC beams with openings. Structures 2021, 34, 1185–1200. [Google Scholar]
- Panatchai, C.; Jaruek, T.; Sukit, Y. Modified interactive strut-and-tie modeling of reinforced concrete deep beams and corbels. Structures 2022, 45, 284–298. [Google Scholar]
- Yi, W.J.; Li, Y.; Chen, H.; Ma, J.Z.G.; Zhou, K.J.; Huang, Y.; Zhou, Y. Shear strength evaluation of RC D-Regions based on Single-Panel Strut-and-Tie model. Eng. Struct. 2022, 265, 114500. [Google Scholar] [CrossRef]
- Li, S.S.; Zheng, J.Y.; Zhang, F.J.; Li, H.M.; Jia, M.X.; Liu, Z.J.; Chen, A.J.; Xie, W. Prediction of Shear Strength for Steel-Fiber High-Strength Concrete Corbels with the Softened Strut-and-Tie Model. Buildings 2023, 13, 1107. [Google Scholar] [CrossRef]
- Ministry of Housing and Urban-Rural Development. TB/T3193-2016 PRC; Clamp Type Anchors, Clamps and Connectors for Prestressed Tendons in Railway Engineering. China Building Industry Press: Beijing, China, 2016. (In Chinese) [Google Scholar]
- Zhao, J.L.; Shen, S.L.; Sun, Y. Application of Strut-and-tie Model for Design of Interior Anchorage Zone in Post-tensioned Concrete Structure. J. Shanghai Jiao Tong Univ. (Sci.) 2010, 15, 273–278. (In Chinese) [Google Scholar] [CrossRef]
- FIP Recommendations. Acceptance of Post-Tensioning Systems; International Federation of Structural Concrete FIB: Lausanne, Switzerland, 2010. [Google Scholar]
- CEB-FIP. CEB-FIP Model Code 1990: Design Code; Thomas Telford Publishing: London, UK, 1993. [Google Scholar]
- ACI (American Concrete Institute). Building Code Requirements for Structural Concrete and Commentary; American Concrete Institute: Farmington Hills, MI, USA, 2019; pp. 318–319. [Google Scholar]


| Material Name | Poisson’s Ratio | Young’s | ||
|---|---|---|---|---|
| Concrete of C50 | 0.2 | 34.5 | 1.89 | 33.5 |
| Anchor plate of HT200 | 0.3 | 135 | 200 | 200 |
| Reinforcement frame of HRB400 | 0.3 | 210 | 360 | 360 |
| Spiral reinforcement of HPB300 | 0.3 | 210 | 270 | 270 |
| Position Parameter | Internal Force on the Tie Rod/kN | Strut-and-Tie Model Clamp Angle/° |
|---|---|---|
| 0 | 132.67 | 62.96 |
| 0.473 | 131.26 | 63.20 |
| 0.503 | 131.16 | 63.21 |
| 0.533 | 131.04 | 63.24 |
| 0.564 | 131.73 | 63.12 |
| 0.594 | 131.53 | 63.15 |
| 0.625 | 131.41 | 63.17 |
| 0.655 | 131.46 | 63.16 |
| 0.686 | 131.22 | 63.21 |
| 0.716 | 131.36 | 63.18 |
| Position Parameter (λ) | A1/MPa | A0/MPa | B1/MPa | B0/MPa |
|---|---|---|---|---|
| 0.473 | 65.11 | 66.77 | 142.72 | 139.32 |
| 0.503 | 64.26 | 66.77 | 137.01 | 139.32 |
| 0.533 | 70.91 | 66.77 | 147.32 | 139.32 |
| 0.564 | 71.20 | 66.77 | 137.96 | 139.32 |
| 0.594 | 68.77 | 66.77 | 130.75 | 139.32 |
| 0.625 | 61.86 | 66.77 | 137.86 | 139.32 |
| 0.655 | 70.11 | 66.77 | 138.80 | 139.32 |
| 0.686 | 69.03 | 66.77 | 139.28 | 139.32 |
| 0.716 | 59.77 | 66.77 | 133.25 | 139.32 |
| Position Parameter (λ) | C1/MPa | C0/MPa | D1/MPa | D0/MPa |
|---|---|---|---|---|
| 0.473 | 36.99 | 37.04 | 9.98 | 9.01 |
| 0.503 | 36.37 | 37.04 | 10.34 | 9.01 |
| 0.533 | 36.82 | 37.04 | 9.27 | 9.01 |
| 0.564 | 36.65 | 37.04 | 9.63 | 9.01 |
| 0.594 | 36.14 | 37.04 | 9.64 | 9.01 |
| 0.625 | 36.40 | 37.04 | 9.19 | 9.01 |
| 0.655 | 36.42 | 37.04 | 9.29 | 9.01 |
| 0.686 | 35.75 | 37.04 | 8.77 | 9.01 |
| 0.716 | 35.49 | 37.04 | 9.72 | 9.01 |
| Position Parameter (λ) | E1/MPa | E0/MPa | F1/MPa | F0/MPa |
|---|---|---|---|---|
| 0.473 | 63.56 | 65.00 | 4.58 | 4.65 |
| 0.503 | 63.99 | 65.00 | 4.52 | 4.65 |
| 0.533 | 63.49 | 65.00 | 4.45 | 4.65 |
| 0.564 | 66.30 | 65.00 | 4.47 | 4.65 |
| 0.594 | 64.54 | 65.00 | 4.50 | 4.65 |
| 0.625 | 64.23 | 65.00 | 4.51 | 4.65 |
| 0.655 | 65.91 | 65.00 | 4.50 | 4.65 |
| 0.686 | 62.78 | 65.00 | 4.49 | 4.65 |
| 0.716 | 67.09 | 65.00 | 4.48 | 4.65 |
| Name | Type Specification | Materials |
|---|---|---|
| Anchor plate | M15T-9D | HT200 |
| Spiral reinforcement | M15T-9/10L (C) | HPB300 |
| bellows | Ø80 × 825 | - |
| Longitudinal reinforcement | Ø12 × 825 | HRB400 |
| stirrup | Ø16 × 374 × 374 | HRB400 |
| Steel plate | 420 × 420 | Q235 |
| Load Class | Specimen No. 1 | Specimen No. 2 | Specimen No. 3 | |||||||||
|---|---|---|---|---|---|---|---|---|---|---|---|---|
| L1 | L2 | L3 | L4 | L1 | L2 | L3 | L4 | L1 | L2 | L3 | L4 | |
| 0.2 | 16.35 | 16.53 | 8.26 | 8.26 | 33.06 | 41.32 | 33.06 | 24.79 | 24.79 | 33.06 | 24.79 | 24.79 |
| 0.4 | 49.59 | 57.85 | 49.59 | 24.79 | 74.38 | 82.64 | 82.64 | 82.64 | 74.38 | 66.12 | 57.85 | 66.12 |
| 0.6 | 82.64 | 99.17 | 107.44 | 49.59 | 107.44 | 132.23 | 132.23 | 157.02 | 157.02 | 165.29 | 123.97 | 99.17 |
| 0.8 | 206.61 | 231.40 | 206.61 | 123.97 | 239.67 | 264.46 | 223.14 | 214.88 | 256.20 | 256.20 | 157.02 | 148.76 |
| 1.0 | 454.55 | 429.75 | 380.17 | 247.93 | 446.28 | 454.55 | 404.96 | 355.37 | 504.13 | 512.40 | 256.20 | 347.11 |
| 1.2 | 768.60 | 685.95 | 595.04 | 553.72 | 702.48 | 669.42 | 595.04 | 636.36 | 776.86 | 752.07 | 380.17 | 636.36 |
| Load Class | Station Position | Specimen No. 1/MPa | Specimen No. 2/MPa | Specimen No. 3/MPa | Mean Value /MPa | ANSYS1 /MPa | ANSYS2 /MPa |
|---|---|---|---|---|---|---|---|
| 0.2 | L1 | 3.43 | 6.94 | 5.21 | 5.19 | - | - |
| L2 | 3.47 | 8.68 | 6.94 | 6.36 | 8.88 | 6.84 | |
| L3 | 1.73 | 6.94 | 5.21 | 4.63 | - | - | |
| L4 | 1.73 | 5.21 | 5.21 | 4.05 | - | - | |
| 0.4 | L1 | 10.41 | 15.62 | 15.62 | 13.88 | - | - |
| L2 | 12.14 | 17.35 | 13.89 | 14.46 | 17.77 | 15.69 | |
| L3 | 10.41 | 17.35 | 12.15 | 13.30 | - | - | |
| L4 | 5.21 | 17.35 | 13.89 | 12.15 | - | - | |
| 0.6 | L1 | 17.35 | 22.56 | 32.97 | 24.29 | - | - |
| L2 | 20.83 | 27.77 | 34.71 | 27.77 | 30.69 | 28.53 | |
| L3 | 22.56 | 27.77 | 26.03 | 25.45 | - | - | |
| L4 | 10.41 | 32.97 | 20.83 | 21.40 | - | - |
| Load Class | Specimen No. 1 | Specimen No. 2 | Specimen No. 3 | |||||||||
|---|---|---|---|---|---|---|---|---|---|---|---|---|
| B1 | A1 | A2 | A3 | B1 | A1 | A2 | A3 | B1 | A1 | A2 | A3 | |
| 0.2 | −36.49 | 17.27 | 7.93 | 3.7 | −34.89 | 14.62 | 8.42 | 3.57 | −30.03 | 11.60 | 7.62 | 3.67 |
| 0.4 | −76.16 | 38.43 | 19.38 | 12.26 | −74.10 | 42.98 | 24.51 | 11.11 | −71.72 | 41.71 | 22.87 | 12.30 |
| 0.6 | −123.22 | 59.42 | 39.85 | 29.30 | −124.79 | 65.33 | 61.84 | 28.17 | −131.04 | 59.86 | 38.57 | 27.92 |
| 0.8 | −165.69 | 226.06 | 58.33 | 37.51 | −171.90 | 534.58 | 183.28 | 54.15 | −152.25 | 189.76 | 56.47 | 41.23 |
| Load Class | Station Position | Specimen No. 1/MPa | Specimen No. 2/MPa | Specimen No. 3/MPa | Mean Value/MPa | ANSYS1 /MPa | ANSYS2 /MPa |
|---|---|---|---|---|---|---|---|
| 0.2 | B1 | 1.26 | 1.20 | 1.03 | 1.16 | 1.62 | 1.59 |
| A1 | 0.59 | 0.50 | 0.40 | 0.50 | 0.68 | 0.46 | |
| A2 | 0.27 | 0.29 | 0.26 | 0.27 | - | - | |
| A3 | 0.13 | 0.12 | 0.13 | 0.13 | - | - | |
| 0.4 | B1 | 2.63 | 2.56 | 2.47 | 2.55 | 3.23 | 3.19 |
| A1 | 1.32 | 1.48 | 1.44 | 1.41 | 1.57 | 1.27 | |
| A2 | 0.67 | 0.85 | 0.79 | 0.77 | - | - | |
| A3 | 0.42 | 0.38 | 0.42 | 0.41 | - | - | |
| 0.6 | B1 | 4.25 | 4.31 | 4.52 | 4.36 | 4.85 | 4.78 |
| A1 | 2.05 | 2.25 | 2.07 | 2.12 | 2.35 | 1.91 | |
| A2 | 1.37 | 2.13 | 1.33 | 1.61 | - | - | |
| A3 | 1.01 | 0.97 | 0.96 | 0.98 | - | - |
| Load Class | Specimen Number | Crack Width/mm |
|---|---|---|
| 0.8 | Specimen No. 1 | = 0.07 |
| Specimen No. 2 | = 0.08 | |
| Specimen No. 3 | = 0.06 | |
| 1.0 | Specimen No. 1 | = 0.10; = 0.08; = 0.06 |
| Specimen No. 2 | = 0.11; = 0.07 | |
| Specimen No. 3 | = 0.09; = 0.06; = 0.05 | |
| 1.2 | Specimen No. 1 | = 0.12; = 0.09; = 0.08; = 0.05; = 0.04 |
| Specimen No. 2 | = 0.15; = 0.09; = 0.05; = 0.05; = 0.04 | |
| Specimen No. 3 | = 0.10; = 0.08; = 0.06; = 0.04 |
Disclaimer/Publisher’s Note: The statements, opinions and data contained in all publications are solely those of the individual author(s) and contributor(s) and not of MDPI and/or the editor(s). MDPI and/or the editor(s) disclaim responsibility for any injury to people or property resulting from any ideas, methods, instructions or products referred to in the content. |
© 2024 by the authors. Licensee MDPI, Basel, Switzerland. This article is an open access article distributed under the terms and conditions of the Creative Commons Attribution (CC BY) license (https://creativecommons.org/licenses/by/4.0/).
Share and Cite
Lu, X.; Zhu, W. Optimized Design of Anchor Plates for 2200 MPa-Class Prestressing Anchorage Zones. Buildings 2024, 14, 1073. https://doi.org/10.3390/buildings14041073
Lu X, Zhu W. Optimized Design of Anchor Plates for 2200 MPa-Class Prestressing Anchorage Zones. Buildings. 2024; 14(4):1073. https://doi.org/10.3390/buildings14041073
Chicago/Turabian StyleLu, Xin, and Wanxu Zhu. 2024. "Optimized Design of Anchor Plates for 2200 MPa-Class Prestressing Anchorage Zones" Buildings 14, no. 4: 1073. https://doi.org/10.3390/buildings14041073