Article

Corrosion Performance of Buried Corrugated Galvanized Steel under Accelerated Wetting/Drying Cyclic Corrosion Test

Department of Civil and Resource Engineering, Dalhousie University, Halifax, NS B3H 4R2, Canada
*
Author to whom correspondence should be addressed.
Buildings 2024, 14(4), 1079; https://doi.org/10.3390/buildings14041079
Submission received: 19 February 2024 / Revised: 1 April 2024 / Accepted: 3 April 2024 / Published: 12 April 2024

Abstract

:
Rehabilitation of corroded buried galvanized steel structures, including corrugated metal culverts (CMCs) and pipes (CMPs), requires a deep understanding of the corrosion process and the corresponding deterioration. The current paper describes an accelerated laboratory corrosion test of corrugated galvanized steel coupons exposed to sequenced wetting/drying cycles ranging from 50 and up to 1600 cycles. The analysis demonstrates the influence of applying an increased number of wetting/drying cycles on the acceleration of the developed corrosion in the buried galvanized steel coupons. The study examines changes in the steel geometry represented by thickness loss and the accompanied deterioration of the mechanical properties such as tensile strength, hardness, and ductility over relatively short periods of time. It was observed that corrosion was insignificant as long as the zinc coating of the galvanized steel lasted. However, when the zinc was almost fully depleted, the bare steel was directly subjected to the surrounding corrosive environment, causing greater corrosion damage during subsequent wetting/drying cycles. Based on four standard mathematical models, the paper also presents approximate average corrosion predictions for bare steel in the galvanized coupons, to assess the impact of potential damage due to corrosion and determine essential rehabilitation measures.

1. Introduction

Buried steel structures in direct contact with soil, and exposed to aggressive environments, usually suffer from corrosion during their intended service life, imposing huge repair and maintenance burdens [1,2,3,4]. Numerous engineering infrastructures, including corrugated metal culverts (CMCs) and corrugated metal pipes (CMPs) that are designed to be buried under soil deposits, are manufactured with zinc-coated galvanized steel due to its ability to resist corrosion. The galvanization process that is used to cover the steel surface with a zinc layer of a specific thickness is essential for resisting corrosion as long as the zinc lasts. This zinc coating acts as a passivating layer, hindering rust from extending to the bare steel, and thus preventing dealloying due to corrosion.
In cold climates, road salts are often used to facilitate the melting of snow on pavements. Over time, as a result of water seepage, these salts form chloride solutions that flow through soil layers, including the backfill soil surrounding underground steel structures, creating a triggering corrosion environment. In general, steel corrosion can have significant negative impacts, including reduced profile thickness and deterioration (i.e., degradation) of the steel mechanical properties. This results in changes in the roughness characteristic of the steel surface [5] and decreases axial and flexural stiffnesses, which is reflected in reduced effective structural capacity [6,7]. It has been observed that the aggressiveness of corrosion in soils is impacted by various chemical and physical properties (e.g., soil pH, moisture content, soil resistivity, temperature, dissolved oxygen, and microbial activity) which affect the long-term workability of buried steel structures [8,9,10].
In steel structures, the developed corrosion can be assessed using various methods including field observations and on-site surveys, laboratory measurements, and theoretical predictions [11,12,13,14]. Monitoring the corrosion in field observations has the advantage of revealing the effects of the actual corrosion process in real life to avoid sudden damages and catastrophic failures [15,16,17,18,19,20]. Several field corrosion databases were reported to present the measurements of corrosion damage depths in buried pipelines with the corresponding parameters of the surrounding environments (e.g., Mexican database [15], National Bureau of Standard (NBS) database [16,17], and New York (NY) database [18]). Recently, Xia et al. [19] conducted corrosion monitoring field research that summarized field measurements of corrosion over the past 30 years for metallic material and coating/metal systems in different environments (e.g., soil, marine, and atmospheric). Using field exposure tests to study the actual in situ corrosion behavior is beneficial. However, the process is time-consuming and may take several years, and research has been focused on accelerated corrosion tests.
Several researchers have performed cyclic accelerated corrosion tests on uncoated and coated (e.g., zinc-coated) metal specimens to accelerate the propagation of rust layers and monitor the corrosion process [21,22,23]. Many of these tests have focused on detecting atmospheric corrosion of open-air coupons (e.g., hot dip galvanized perforation coupons) to study the impact of important climate parameters such as temperature, drying level, relative humidity, duration of humidity cycles, intensity (i.e., concentration) of sodium chloride (NaCl, %), and frequency of exposure to salt spray solutions [24,25]. Furthermore, some accelerated tests have been used to provide preliminary evaluations of various precoated products to examine the degree of protection provided [25,26]. Other research has been performed to calibrate accelerated cyclic corrosion tests, introduced in well-known standards, and compared to field exposure tests, to supply correlations based on acceleration coefficients for the laboratory tests [27]. Wetting/drying cyclic accelerated tests aim to simulate similar corrosion-triggering factors represented by chloride deposits and temperature fluctuations that might occur in coastal regions and affect the performance of buried steel structures.
It should be noted that there is limited research available in the literature addressing the rust development process during accelerated corrosion tests of steel structures buried in soil. Hence, the current paper presents an accelerated cyclic laboratory corrosion test, where corrugated galvanized steel coupons were buried and exposed to repetitive wetting/drying cycles. The specimens were covered with cohesionless soil to propagate corrosion similar to that commonly developed in situ in buried steel structures which were occasionally attacked by saline due to using dicing salts to thaw the snowfall on roads in cold territories. The current tests investigate the effectiveness of the zinc coating in providing corrosion resistance to achieve a longer service life than in the case of uncoated steel. The accelerated corrosion test was started by adding a sodium chloride electrolyte solution (NaCl), with 3.5% concentration, to cohesionless sandy soil covering corrugated galvanized steel coupons in Pyrex pots. Repetitive wetting/drying cycles (i.e., 50, 100, 200, 400, 800, and 1600 cycles) were then applied to accelerate the steel corrosion.
Furthermore, this research studies steel deterioration in the galvanized coupons resulting from the corrosion propagation by monitoring the profile geometry thickness loss, and the reduced mechanical properties of the steel in terms of tensile strength, ductility, and hardness. The loss of thickness was determined by using the weight loss method, while the mechanical properties were examined by applying tensile strength and hardness tests. Furthermore, a simplified prediction model, developed based on the average predictions of different commonly utilized empirical mathematical models (i.e., the Darbin/Romanoff model modified by Elias, the Stuttgart model, the Caltrans model, and the American Association of State Highway and Transportation Officials (AASHTO) model) [28] for corrosion damage prediction in the bare steel, was used to estimate the predicted corrosion times (i.e., years) versus the results obtained by the accelerated corrosion tests.

2. Experimental Procedures

Ezzeldin et al. [6] proposed in detail a cyclic wetting/drying test for accelerating corrosion propagation in buried corrugated uncoated mild steel coupons. In the current study, the same testing procedure was performed on corrugated galvanized steel coupons (i.e., from a Z610 (610 g/m2) steel sheet [29]). The steel was made via a hot-dip galvanizing process, where a zinc coating layer with an average thickness of 41 µm was applied on each side. Each corrugated coupon had a profile with one and a half waves (i.e., two valleys and one crest) and projection dimensions of approximately 110 mm × 110 mm. The corrugation geometry had a nominal thickness of around 1.3 mm (±0.15 mm tolerance), a corrugation wavelength of 68 mm (i.e., a design value of 67.7 mm), and a corrugation depth of 13 mm (i.e., a design value of 12.7 mm). Figure 1 presents the experimental setup for the conducted accelerated wetting/drying test. Moreover, the bare steel of the galvanized coupons had the chemical composition, as specified in Table 1 [30].
The accelerated wetting/drying test was initiated by placing the candidate corrugated coupons underneath 400 g of well-compacted cohesionless granular sandy soil having the grain size distribution (GSD) shown in Figure 2 to represent a common in situ interface between buried corrugated metal culverts/pipes and the surrounding backfill. Silicone sealant was applied to the edges of the steel coupon inside the Pyrex pot to prevent any water leakage from the soil above during the wetting stages. To simulate accumulated road salts used for thawing snow in cold regions, prior to beginning the wetting/drying cycles, an electrolyte solution with 3.5 wt% NaCl in distilled deionized water was sprayed onto the soil in each Pyrex pot to provide a saline solution. In the field, salts form a saline solution after being mixed with water from melting ice, and this solution then flows downward through underlying soil deposits until reaching buried steel structures beneath. Due to repeated exposure to road salt solutions during snow seasons, the soil surrounding buried steel structures increases in salinity, thus triggering corrosion propagation.
Following spraying the NaCl electrolyte solution, the specimens were placed inside the convection oven to start the wetting/drying cycles in which four seconds were set for the wetting stage to saturate the specimen soil with distilled water, followed by 60 min for the drying stage to dry the specimen soil. The soil temperature reached around 90 °C when the soil was completely dry. Immediately after the spraying (wetting) stage, the soil temperature decreased by about 30 °C to approximately 60 °C. During the subsequent drying stage (i.e., 60 min), the soil temperature rose again as the specimen dried, to around 90 °C. The entire process was then repeated in sequence by using two programmed timers. It should be noted that the 3.5% NaCl electrolyte solution was added only once, at the beginning of the experiment, to control the salt concentration in the pots containing the coupons. Furthermore, a spatula was used to mix and adjust the soil surface, crusted with solid salt particles, every 20 wetting/drying cycles. This step was performed, without disturbing the interface with the buried galvanized steel coupons, to break up any solid salt crusts and thus provide good soil aeration, then carefully recompacting the soil surface.
The conducted accelerated corrosion tests were applied on galvanized steel coupons, exposed to different accumulative numbers of wetting/drying cycles, i.e., 50, 100, 200, 400, 800, and 1600 cycles with two coupons per each set of cycles. These numbers of cycles were selected based on lab trials to investigate the optimum set of accumulative cycles to develop an accelerated corrosion, and also to compare the results of the galvanized coupons, utilized in this study, with the mild coupons developed earlier by Ezzeldin et al. [6]. For subsequent corrosion characterization, the flaky rusts were then collected in accordance with American Society for Testing and Materials (ASTM) recommendations [31,32] (i.e., scrubbing and brushing with a mild abrasive-distilled water slurry and a bristle brush). This method aimed to take only the sticky rust layers out of the metal coupons, without disturbing the bare metal surface. The accelerated propagation of corrosion after 50, 100, 200, 400, 800, and 1600 wetting/drying cycles can be clearly shown in Figure 3, for corroded coupons before and after the removal of rust layers.
The impact of corrosion on the surface of each corroded coupon was examined by using a three-dimensional (3D) confocal visual profilometer (i.e., Keyence VK-X1000 model, Keyence Corporation of America, Itasca, IL, USA) to show the variations in surface roughness and topography. For each coupon, several spots were monitored, with a confocal lens magnification of 20×, corresponding to 480× on the computer display screen. These scans helped to determine the most severely affected areas and to investigate surface features such as surface roughness, maximum pit depth, and maximum surface height. The surface variation is attributable to the corrosion developed (i.e., a combination of uniform and pitting corrosion), which can result in serious nonuniform metal damage (e.g., holes or cavities). To characterize the corrosion products, the rusts collected for each coupon were ground and sieved (with a No. 325 sieve) and were then examined (i.e., two samples per each set of wetting/drying cycles) via an X-ray diffractometer (i.e., Bruker D8 Advance XRD model) followed by scanning electron microscopy (i.e., Hitachi S-4700 SEM model) with an energy-dispersive X-ray spectroscopy (EDS) system to obtain micrograph surface mapping (i.e., 200× magnification scale) for the corrosion products.
The loading capacity of steel structures is primarily based on their mechanical properties such as the structural axial stiffness (EA) and the structural flexural stiffness (EI). Corrosion mainly impacts the surface geometry (e.g., the profile thickness) as well as the mechanical properties (e.g., the steel strength, hardness, and ductility). To assess the geometry of the corroded galvanized steel coupons, it is necessary to recalculate the corrugated profile area (A) and moment of inertia (I) with the reduced thickness, to account for thickness loss due to corrosion damage. The reduction in thickness was determined via the weight loss method, where each coupon was weighed before and after testing. To examine the mechanical properties, the metal coupons were investigated via a tensile strength test and a hardness test. As presented in Figure 4, based on the ASTM requirements for tensile strength testing [33,34], dog-bone-shaped specimens (four specimens per each set of wetting/drying cycles) with a length of around 100 mm were cut from the candidate coupons (i.e., intact and corroded with the flat portion between the crest and the valley) and then tested in an Instron loading frame with a rate of tension around 2 MPa/sec, utilizing a mechanical regular extensometer with 10 µm accuracy. Furthermore, based on ASTM recommendations [35], a Rockwell hardness test with HRE scale readings was also performed at multiple points (around six points per each set of wetting/drying cycles) on each coupon.

3. Results

3.1. Surface Morphology and Corrosion Products

As illustrated in Figure 5, following the removal of rust layers from each coupon, surface topography was performed on the most severely corroded spots by using a 3D optical confocal profilometer. Corroded coupon surface variations were examined via 2D and 3D displays for 50, 100, 200, 400, 800, and 1600 wetting/drying cycles. Table 2 presents confocal analysis surface roughness results in terms of the maximum surface elevation (Sz) and the maximum surface depth (Sv) (i.e., pit depth). The characterization of the corrosion products was performed for the specimens corresponding to each set of wetting/drying cycles as illustrated in Figure 6 and Figure 7 for the XRD diffraction patterns and the SEM micrograph mapping, respectively.

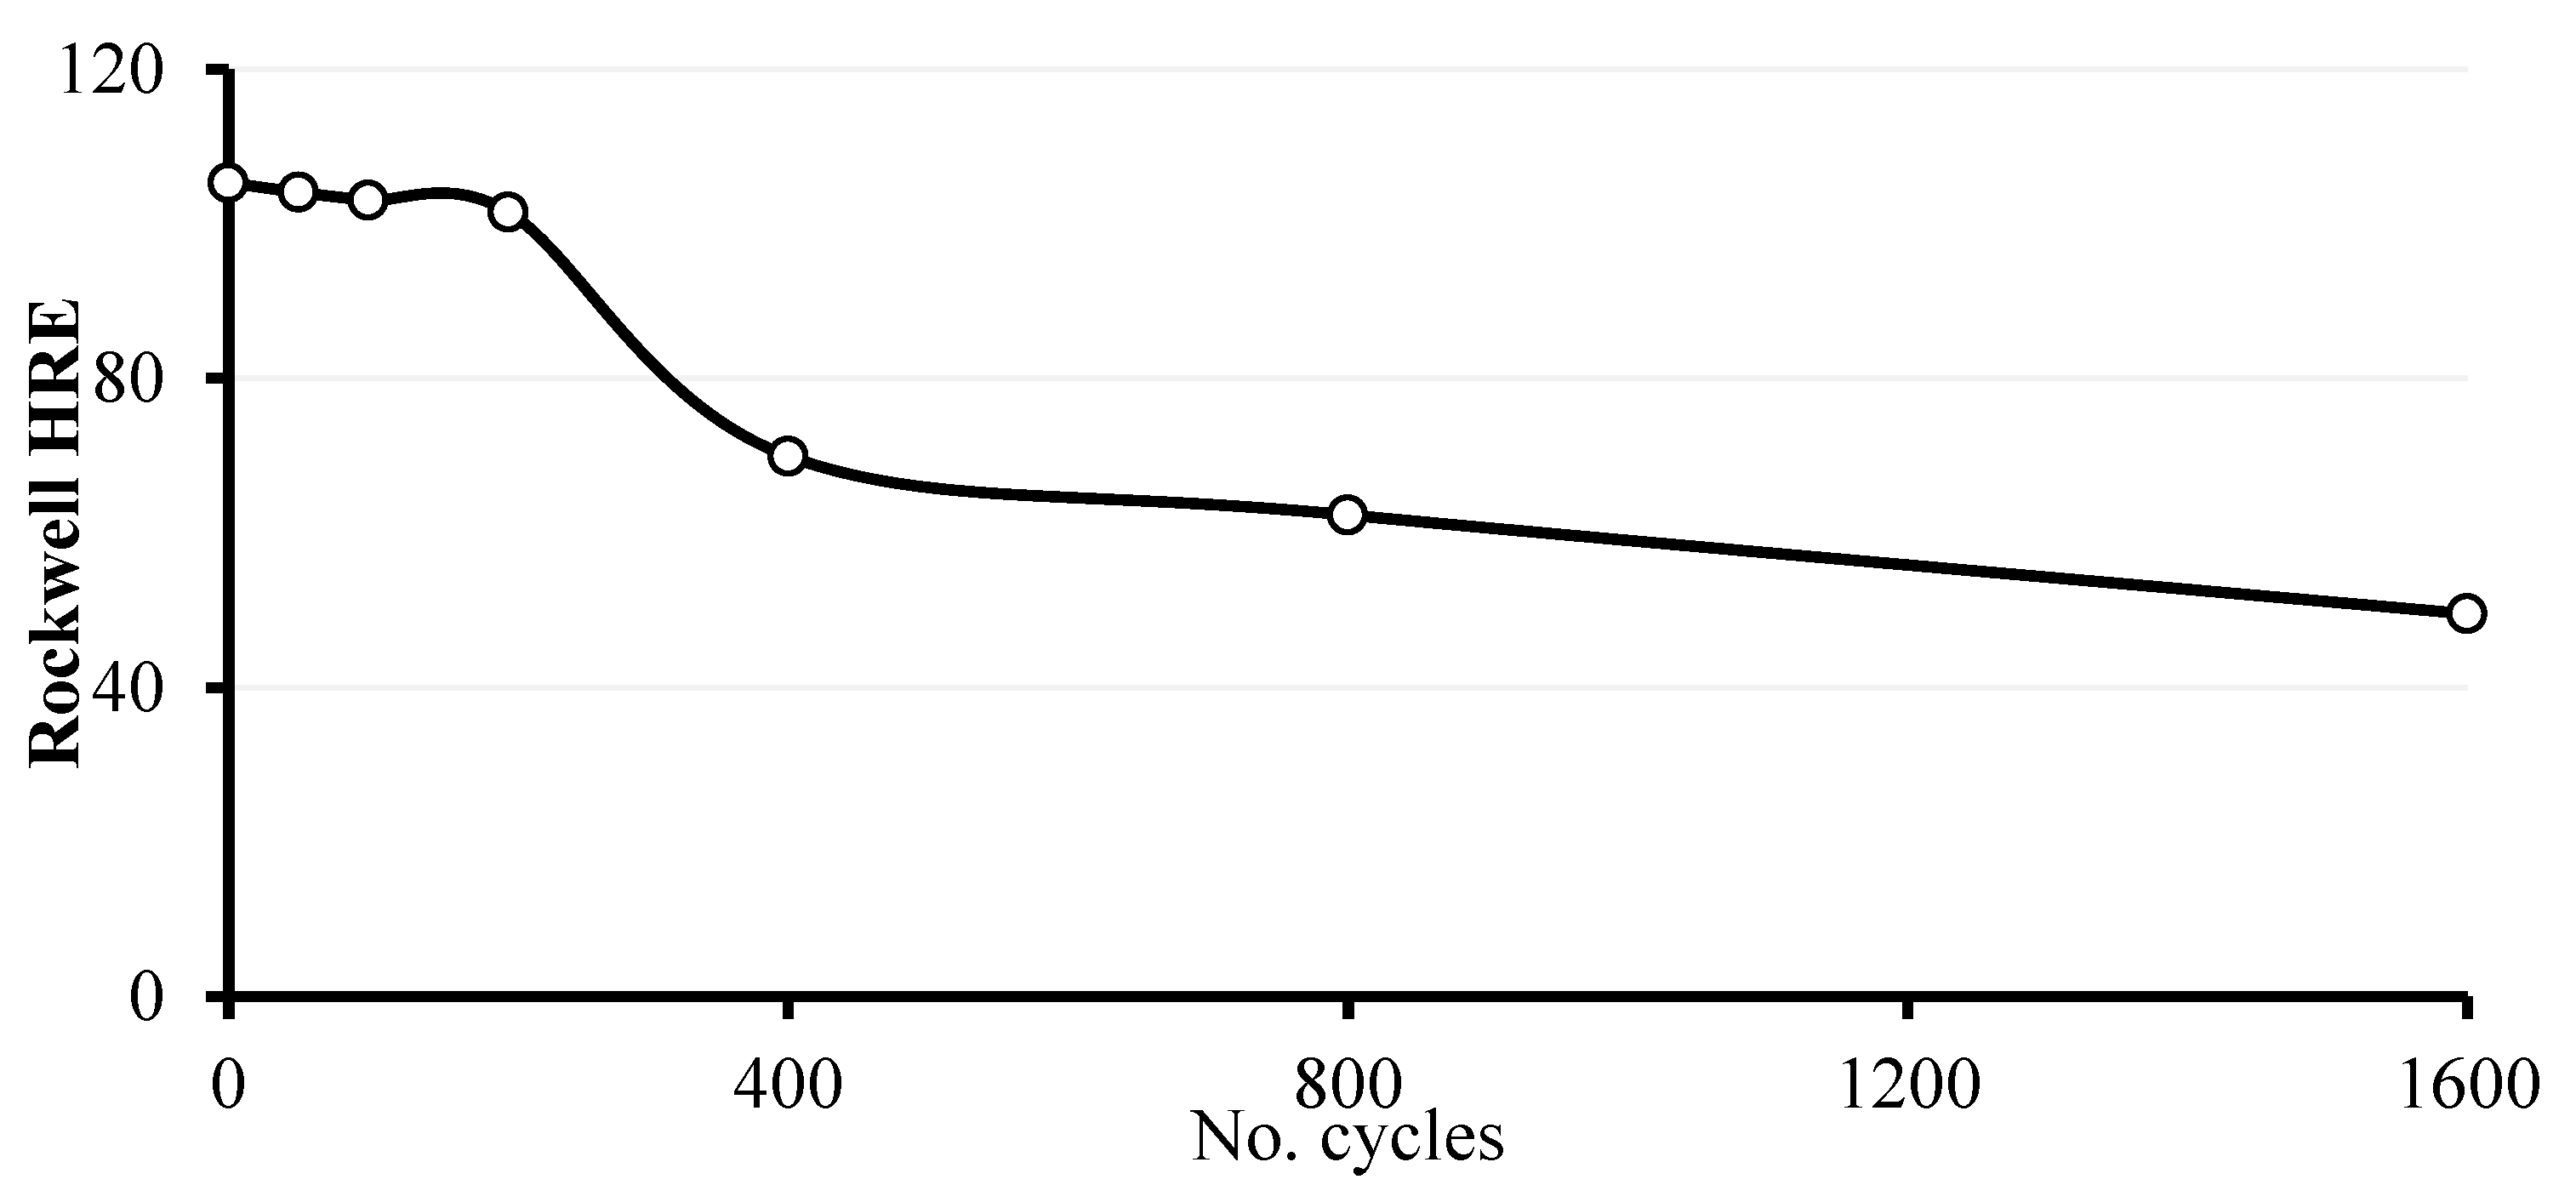
3.2. Mechanical Characteristics

The main objective of the conducted wetting/drying accelerated test is to investigate the impact of accelerating the developed corrosion of buried galvanized steel coupons by increasing the number of wetting/drying cycles. In the current study, the utilized galvanized steel with a zinc coating layer of 41 µm thick had better potential for resisting corrosion, requiring up to 1600 wetting/drying cycles for the worst corrosion propagation to occur, as illustrated in Figure 3a compared to the extensive corrosion that happened much earlier in the uncoated coupons after only 800 cycles [6]. The impact of the zinc coating is shown in Figure 3b, for coupons exposed to 0, 50, 100, and 200 wetting/drying cycles, where it can be seen that the zinc coating resisted corrosion until it was almost completely consumed in around 200 wetting/drying cycles, exposing the bare steel to the surrounding corrosive environment.
Average corrosion damage in terms of total thickness loss, including the bare steel and the zinc coating, is illustrated in Figure 8a for galvanized steel coupons exposed to 50, 100, 200, 400, 800, and 1600 wetting/drying cycles. In Figure 8a, to demonstrate the effect of the zinc coating, corrosion damage for mild steel coupons with no zinc coating [6], exposed to the same wetting/drying accelerated corrosion test, is compared to corrosion damage results for the galvanized steel coupons investigated in the current study. Based on ASTM recommendations [31,32], Figure 8b plots average galvanized steel corrosion rates in mm/year against the number of cycles to which the galvanized steel coupons were exposed (where each wetting/drying cycle took around one hour).
To assess the mechanical performance of the buried galvanized steel coupons in the intact and corroded states, the coupons (i.e., intact and corroded) were tested for tensile strength (see Table 3) and hardness. In Figure 9a, stress–strain curves are presented for tensile strength tests of the dog-bone-shaped specimens (with a length of 100 mm) cut from the galvanized steel coupons exposed to 0 (intact), 50, 100, 200, 400, 800, and 1600 wetting/drying cycles. The ultimate strength (σU) and the yield strength (σY) are plotted in Figure 9b based on the adjusted cross-sectional area (i.e., reduced thickness) due to corrosion. Axial (EA) and flexural (EI) stiffnesses are the determining factors for the loading capacity of steel structures. Figure 9c shows the decreases in the axial stiffness and flexural stiffness for the corroded corrugated galvanized steel coupons exposed to the increasing numbers of wetting/drying cycles. Figure 10 illustrates changes in the steel material hardness due to corrosion by plotting the Rockwell hardness HRE scale readings for the galvanized steel coupons exposed to 0 (intact), 50, 100, 200, 400, 800, and 1600 wetting/drying cycles.

4. Discussion

4.1. Corrosion Analysis

Corrosive soils are usually characterized by a high chloride and/or sulfate content, combined with good aeration and sufficient moisture. Thus, in the present study, the developed corrosion in the candidate steel coupons can be attributable to the impact of corrosive soil which initiated the dealloying of the steel molecules (i.e., dealloying corrosion in which one or more constituents of an alloy are attacked, leaving a lower density, which could cause a sudden failure due to the degradation of the mechanical properties). As shown in Figure 3a,b, before and after the removal of the rust layers, in the conducted accelerated wetting/drying corrosion test, the buried galvanized steel coupons exhibited progressive corrosion at a higher number of wetting/drying cycles. In this study, it was observed that the corrugated galvanized steel coupons exposed to 50, 100, and 200 wetting/drying cycles were protected from corrosion by the zinc coating layer, and the bare steel material was basically not affected until the zinc was almost fully depleted, by the end of 200 wetting/drying cycles. This shows the impact of the galvanization process in providing resistance to corrosion attacks. In contrast, under the same testing conditions, uncoated mild steel exhibited corrosion damage after only 50 wetting/drying cycles [6]. As illustrated in Figure 3b, the coupons exposed to 1600 wetting/drying cycles had severe corrosion effects, including holes and pits penetrating through the entire thickness of the steel, such as the pit outlined in yellow at the corrugation crest. It was also found that the surface area of the extreme coupons exposed to 1600 wetting/drying cycles was reduced by around 12%, in comparison to the original coupon’s surface area prior to corrosion. In Figure 4, it can be observed that at a higher number of wetting/drying cycles, the tensile strength specimens (i.e., dog-bone-shaped specimens) cut from the intact and corroded coupons showed a gradual change in surface color and texture due to the progressive corrosion.
In Figure 5, 2D and 3D surface topographs of the coupons following the removal of rust layers illustrate variations in the surface texture, with greater pit and cavity damage in the coupons exposed to a higher number of wetting/drying cycles. This can be clearly seen in the distribution of pitting, represented by the blue areas in the 3D displays. The corrosion modes appear to combine uniform corrosion with localized pitting corrosion. In the worst cases, damage penetrated through the whole thickness of the steel material, as shown for the coupons exposed to 1600 wetting/drying cycles. In the confocal analysis, several spots were scanned to measure the surface roughness in terms of maximum pit depth and maximum surface height, representing the variations in the surface topographs. As indicated in Table 2, the magnitudes of the maximum pit depth and maximum surface elevation (i.e., height) generally became greater at a higher number of wetting/drying cycles (i.e., specifically greater than 200 wetting/drying cycles).
In hot-dip galvanized steel, the bare steel and its zinc coating are connected together via good electrical contact, which enhances corrosion resistance. Plain zinc coating can be used for higher temperature applications up to around 120 °C as a low-cost protection against corrosion whereas the formed white corrosion products are not detrimental [36]. Zinc coatings are usually utilized to provide corrosion resistance, but the coating performance relies on several factors, such as the coating thickness, the supplementary treatment if it exists, and the exposure environment [36]. It has been noted that as the temperature increases the resistance against corrosion of the galvanized steel reduces, indicating higher corrosion rates [37]. For example, Cox [38] investigated the temperature impact on the developed corrosion rates of zinc in distilled water up to 100 °C. The results of the zinc corrosion rate showed a very small increase as the temperature increased up to 50 °C followed by a rapid increase at approximately 65 °C, above which the corrosion rate decreased rapidly until reaching 100 °C to have a low corrosion rate almost similar to the corrosion rate at 50 °C. Hence, several cyclic accelerated corrosion tests available in the literature were performed on zinc-coated steel (e.g., galvanized steel) with temperatures of up to 60 °C in the dry stage, e.g., the accelerated corrosion test, method B in General Motors Engineering Standard [39], the accelerated corrosion test for electrical appliances (ACTE) [40], and other research regarding cyclic corrosion tests [25,41]. In the present study, the cyclic accelerated corrosion test on the galvanized coupons was performed under the same test conditions through which mild steel coupons were tested to compare and assess the two states, the mild steel (i.e., low corrosion resistance) and the galvanized steel (i.e., high corrosion resistance).
When a spot on the galvanized steel is damaged due to corrosion or mechanical scratches, the zinc layer around this spot corrodes and a galvanic cell is formed via an active electrolyte. The zinc then serves as an anode to be sacrificed, while the bare steel becomes a cathode which is protected from corrosion in relation to the zinc coating. Furthermore, corrosion products precipitated from other galvanic cells with cathodes and anodes developed from the bare steel provide additional corrosion resistance on the steel surface. With continuous exposure of the metal to an aggressive surrounding corrosive environment, the corrosion extends increasingly to the bare steel. Eventually, when the zinc is almost fully consumed, more galvanic cells form in the bare steel material, leading to damage to the steel surface. In the case of having carbon steel buried in saline soil with a high chloride content, the corrosion products usually include one or more components such as magnetite (Fe3O4), hematite (Fe2O3), quartz (SiO2), lepidocrocite (γ-FeOOH), akageneite (β-FeOOH), or goethite (α-FeOOH) [42]. Based on the environmental conditions and site type (e.g., marine/urban or marine/industrial), additional corrosion products can be expected in galvanized steel due to the presence of the zinc coating such as zinc oxide (ZnO) and/or gordaite (NaZn4(SO4)(OH)6Cl·6H2O) and/or zinc hydroxysulfates ((Zn(OH)2)3·ZnSO4·nH2O) [43].
As exhibited in Figure 6, based on the results of the XRD analysis, the corrosion products obtained from the galvanized steel coupons included silicon oxide (quartz) (SiO2), zinc oxide (ZnO) (see Equations (1) to (10) below), magnetite (Fe3O4) (see Equation (11) below), and hematite (Fe2O3) (see Equations (12) to (16) below). In addition, forms of iron oxyhydroxides (FeOOH) such as akageneite (β-FeOOH) and lepidocrocite (γ-FeOOH) were hardly observed. The formation of quartz and zinc oxide was observed in the corrosion products of almost all the candidate galvanized steel coupons. The existence of quartz can be attributed to the cohesionless granular sandy soil used to bury these coupons, and to the stickiness of the sand particles at the coupon’s surface during the corrosion test wetting/drying cycles. In contrast, zinc oxide developed due to depletion of the zinc coating layer during the corrosion test, until the zinc coating was almost fully depleted at around 200 wetting/drying cycles. The corrosion of the zinc coating layer began with the dissolution of zinc at the anodic zone in an aqueous solution based on three different intermediates (see Equations (1) to (8)) followed by an oxygen reduction reaction at the cathodic zone (see Equation (9)). Then, the initial rust layer develops by the reaction of OH and Zn2+ (see Equation (10) for the overall reaction) [44,45].
Following 400 wetting/drying cycles, the formation of magnetite and hematite was observed in the XRD analysis. The XRD analysis results are also supported by the appearance of the corroded coupons shown in Figure 3a. For the coupons exposed to 50, 100, and 200 wetting/drying cycles, the white color represents zinc oxide, and the yellow-white color represents quartz (silicon oxide). Moreover, for the coupons exposed to 400, 800, and 1600 wetting/drying cycles, the dark black rust corresponds to magnetite, and the reddish-brown rust corresponds to hematite, as discussed in the previous literature [6,46]. The formation of black magnetite corrosion products is usually associated with a lower oxygen environment, which may have occurred in the conducted accelerated wetting/drying corrosion test due to a decrease in dissolved oxygen over time, caused during the drying stages under high temperatures. Moreover, variations in the dissolved oxygen content could also occur at different spots due to compaction of the cohesionless sandy soil above each coupon. A lower concentration of dissolved oxygen could arise particularly in highly densified soil zones, because of the reduced volume of voids following soil compaction. In contrast, the presence of hematite could result from the periodic remixing and recompacting of the soil surface after approximately every 20 wetting/drying cycles, to break up salt crusts and aerate soil voids, and could also be due to temperature fluctuations in the wet and dry stages and the presence of the NaCl electrolyte during wet stages. As shown in Figure 7, the SEM analysis with EDS found that the main components of the developed corrosion products resulting from electrochemical reactions during the accelerated wetting/drying corrosion test included iron (Fe), oxygen (O), zinc (Zn), and silicon (Si). Iron was more prevalent for coupons exposed to a greater number of cycles, i.e., 400, 800, and 1600 wetting/drying cycles, indicating extreme damage to the bare steel material. In contrast, zinc was more apparent in the corrosion products of coupons exposed to 50, 100, and 200 wetting/drying cycles, reflecting the gradual depletion of the zinc coating. The two elements, oxygen and silicon, were evenly distributed in the corrosion products of all of the coupons, from 50 to 1600 wetting/drying cycles. The corrosion products developed in the present accelerated wetting/drying corrosion test were formed via electrochemical processes represented by the following chemical reactions [44,45,47]:
Zinc oxide (ZnO):
Zn ↔ Zn+ad + e
Zn+ad → e + Zn2+ad
Zn + H2O → ½H2 + ZnOHad
Zn+ad + Zn → Zn2+sol + Zn+ad + 2e
Zn2+ad → Zn2+
ZnOHad + Zn → ZnOHad + Zn2+sol + 2e
ZnOHad → ZnOH+sol + e
ZnOH+sol → Zn2+sol + OH
½O2 + H2O + 2e → 2OH
Zn(s) + ½O2 + H2O → Zn(OH)2 ↔ ZnO + H2O
Magnetite (Fe3O4):
8FeOOH + Fe → 3Fe3O4 + 4H2O
Hematite (Fe2O3):
2 Fe ( S ) + 3 2   O 2 Fe 2 O 3 ( S )
Fe + H2O → Fe(OH) + H+
Fe(OH) → Fe2+ + OH + 2e
Fe3+(aq) + 3OH(aq) → Fe(OH)3(s)
2Fe(OH)3 → Fe2O3(s) + 3H2O(aq)

4.2. Mechanical Analysis

Corrosion damage is often associated with a reduction in profile thickness and/or a deterioration of mechanical properties. As illustrated in Figure 8a, in both galvanized and mild [6] steel coupons, the depth of corrosion damage grew at a higher number of wetting/drying cycles. For instance, the maximum reduction in thickness reached approximately 691 µm (i.e., 49%) for the galvanized steel coupons exposed to 1600 wetting/drying cycles, indicating deterioration to around half the original thickness (i.e., 1.3 mm ± 0.15). This can be attributed to a longer period of exposure to the surrounding corrosive environment, leading to the development of more galvanic cells and a higher corrosion potential with less corrosion resistance at the coupon surface, resulting in more rust and a rougher surface with a larger number of pits. However, it is apparent that when exposed to the same number of wetting/drying cycles, the mild steel coupons had less corrosion resistance than the galvanized steel coupons. This shows the effectiveness of the zinc coating in providing corrosion resistance and delaying corrosion of the bare steel material, with the result that less damage occurred in the galvanized steel coupons than in the mild steel coupons during the same period of exposure. For instance, after 800 wetting/drying cycles, the galvanized steel coupons exhibited a thickness damage of around 368 µm, as compared to the thickness damage of 585 µm in the mild steel coupons [6]. This means that the zinc coating of the galvanized steel provided greater corrosion resistance, which reduced the damage to the thickness of the galvanized steel coupons by around 37% in comparison to the results for the uncoated mild steel coupons. Figure 8b shows that the rate of corrosion was low at the beginning of the test and increased gradually until the completion of 200 wetting/drying cycles. However, the corrosion rate then rose sharply between 200 and 400 wetting/drying cycles, remained almost constant between 400 and 800 cycles, and finally declined slightly between 800 and 1600 wetting/drying cycles. The slight increase in the corrosion rate observed at 50, 100, and 200 wetting/drying cycles is attributable to the zinc coating, which acted as a passivating layer, providing protection against corrosion of the bare steel while being sacrificed. When the zinc layer was almost entirely depleted at around 200 wetting/drying cycles, the bare steel was exposed, resulting in a steep increase in the corrosion rates between 200 and 400 wetting/drying cycles. However, the formation of accumulated rust layers resulted in a stable corrosion rate after 400 wetting/drying cycles. In other words, the surface of the coupon was then covered by inner rust layers, which acted as passivating layers. Thus, corrosion resistance was enhanced, causing the corrosion rate to almost stabilize after 400 cycles, and even decline slightly between 800 and 1600 wetting/drying cycles, as presented in Figure 8b.
The corrosion of metals usually leads to deterioration of the structural capacity, which may result in sudden failure in certain situations. As illustrated in Figure 9 and Figure 10, in the current study, material deterioration (i.e., degradation) of the corroded galvanized steel coupons was monitored via tensile strength and hardness tests. Figure 9a records lower failure strains in coupons exposed to a greater number of wetting/drying cycles, indicating lower ductility in the steel material. In Figure 9b, it can be noted that the ultimate strength and yield strength decreased at a higher number of wetting/drying cycles. However, the changes were slight and fluctuating until the zinc layer was fully depleted, at around 200 wetting/drying cycles. In contrast, coupons exposed to 400, 800, and 1600 wetting/drying cycles revealed considerable reductions in strength and stiffness, due to damage to the bare steel caused by the surrounding corrosive environment. The decreases in strength, stiffness, and ductility evident from the tensile strength test and the hardness test could be attributable to the pit damage impact, which results in a reduced effective cross-section area of the corroded coupons, indicating the apparent actual surface area with pit damage, in comparison to the measured cross-section areas of the same coupons. This has also been reported for similar cases in the literature [6,48,49,50,51,52,53,54,55,56]. Thus, the reduction monitored in the mechanical properties (e.g., ultimate strength and yield strength), calculated based on the measured cross-section area with the reduced thickness of the corroded coupons, may compensate for the actual reduction in the effective cross-section area due to the existence of variable pits in the corroded specimens.
Because of the corrosion impact on the structural capacity, the axial (EA) and flexural (EI) stiffnesses were also affected by the accelerated corrosion and the increasing number of wetting/drying cycles, as illustrated in Figure 9c. The stiffness values fluctuated until the completion of 200 wetting/drying cycles, but as the number of cycles continued to increase, significantly greater stiffness reductions (%) were recorded. The trends, as shown in Figure 9, are in agreement with the Rockwell hardness test values presented in Figure 10, where it can be seen that hardness decreased for corroded coupons exposed to a greater number of wetting/drying cycles. This implies softening of the steel material, resulting in lower ductility performance. Softening became apparent in coupons exposed to 400 or more wetting/drying cycles. This confirmed the fact that after around 200 wetting/drying cycles, depletion of the zinc layer resulted in damage to the bare steel, leading to material softening, reflected by lower HRE hardness values.
In general, the deteriorations in the mechanical properties found in the current study could be attributed to the combination of general and localized pitting corrosions associated with greater surface roughness in galvanized steel exposed to a higher number of wetting/drying cycles. A comparison between the mild steel coupons and the galvanized steel coupons is presented in Table 4 to mimic the discrepancies in the mechanical properties, i.e., reductions (%) in the nominal thickness, axial stiffness, and flexural stiffness, under the same test conditions, representing the surrounding environment, corresponding to each set of cycles. The existence of the zinc coating layer was deployed to resist corrosion attacks and increase the serviceability time with adequate capacity. It can be presumed that such corrosion has a significant impact on steel performance, mild or galvanized, which can require essential rehabilitation measures for corroded buried steel structures, or replacement in severe cases.

4.3. Prediction Models

Extensive research findings have been employed in the development of empirical models to predict metal thickness loss. In the literature, corrosion prediction analyses have focused on the construction and maintenance of steel bridges and on structures related to the design of mechanically stabilized earth (MSE) walls [28]. The durability of earth reinforcements relies on several factors, including site conditions, steel type (whether galvanized or not), climate, backfill, project sequence, and in-service operations. The current study investigates the application of different metal loss prediction models, based on two variables: the initial zinc coating thickness ( z i ) and the exposure time (tf), to predict the service lifetime in years of the bare steel in the galvanized steel coupons utilized in this research, where the cohesionless soil covering the coupons has a pH of around 9.8 and a resistivity, ρ (Ω⋅m), of approximately 30.1. The prediction models examined are the Darbin/Romanoff model modified by Elias, the Stuttgart model, the AASHTO model, and the Caltrans model. The original differences in developing these models relied on the steel type and the properties of the surrounding environment (e.g., pH and resistivity), which determine the depletion rate for the zinc coating and the bare steel. The sacrifice in thickness can be determined by using different corrosion rates for the bare steel and the zinc coating depletion, based on the exposure time in years. The formulas utilized for the four prediction models are presented in the following Equations (17) to (21), where X (µm) represents the thickness loss of the bare steel (i.e., base material) per side, tf (year) represents the design life, and zi (µm) represents the initial zinc thickness in the galvanized steel.
When used to predict the corrosion time (in years) of the bare steel utilized in this study, these formulas yielded various results, as illustrated in Figure 11. Therefore, a simplified prediction model was developed according to the average predictions of the four considered prediction models. The simplified developed model is presented in Equation (22).
As an example, to relate the thickness reduction developed from the conducted accelerated tests to the predicted time in years calculated from the simplified prediction model, the coupons exposed to 1600 wetting/drying cycles (the greatest number of cycles) exhibited corrosion damage thickness loss of around 691.4 µm, including the loss of the zinc coating, which had a thickness of 41 µm. Thus, the thickness loss of the bare steel alone was around 650.4 µm (i.e., 691.4 µm minus 41 µm). Based on the average corrosion prediction curve (i.e., the average model presented in Equation (22) and shown in Figure 11), the bare steel corrosion damage of 650.4 µm corresponds to a predicted corrosion time of around 45.8 years following depletion of the zinc coating (see Table 5). According to the average prediction curve, depletion of the zinc coating takes approximately 4 years. Therefore, the total predicted time for a total thickness loss of 691.4 µm (41 µm of zinc coating plus 650.4 µm of bare steel) is around 49.8 years (i.e., 4 years until zinc depletion plus 45.8 years of bare steel corrosion), which corresponds to 1600 wetting/drying cycles (1600 h) in the accelerated corrosion test, as shown in Table 5. However, for a more conservative design, it might be preferable to use the predicted corrosion time of the bare steel only (e.g., 45.8 years in the current study) to represent the total corrosion time, without considering the time required for depletion of the zinc coating.
The conducted accelerated corrosion tests related the damage reduction in the thickness to the number of wetting/drying cycles, not to the time in years. Therefore, the simplified corrosion model was used later to relate the corrosion damages developed from the accelerated tests to a predicted time in years. This was attained based on the assumption that the thickness damage from a certain number of cycles, developed from the accelerated tests, has an equivalent predicted number of years, developed from the prediction models, to represent the predicted actual corrosion propagated under a similar surrounding corrosive environment. In this manner, we can assume that at the same thickness damage for buried steel exposed to a similar corrosive environment, we could relate the number of cycles from the accelerated corrosion test to the predicted number of years from the mathematical model in which both, i.e., the accelerated test and the mathematical model, have a common factor, which is the thickness damage loss.
In general, this corrosion prediction approach for galvanized steel could be used to make decisions regarding the replacement and/or rehabilitation of damaged underground steel structures. By not including the time for depletion of the zinc layer, risks of steel failure could be minimized, since a conservative estimate of the serviceability lifetime of the structure would be obtained. Table 5 presents the predicted corrosion times for the utilized galvanized steel coupons corresponding to the depth of corrosion damage, i.e., total steel thickness, zinc coating thickness, and bare steel thickness, and percentage reductions in nominal total steel thickness obtained in the accelerated corrosion test exposed to 0, 50, 100, 200, 400, 800, and 1600 wetting/drying cycles. Furthermore, Figure 12 plots the percentages of corrosion damage (i.e., reduction in the 1.5 mm nominal total steel thickness), for the proposed galvanized steel material, corresponding to the predicted corrosion time in years.
Darbin/Romanoff model modified by Elias:
If   t f > z i 25 1.54 then   X = 25 μ m y e a r t f 0.65 z i
If   t f z i 25 1.54 then   X = 0
Bare steel corrosion rate: 25 µm/year following zinc depletion.
Stuttgart model:
X = 12 μ m y e a r t f 3 z i 51 2
Zinc corrosion rate: 17 µm/year for the first 3 years, then 2 µm/year until zinc depletion.
Bare steel corrosion rate: 12 µm/year following zinc depletion.
AASHTO model:
X = 12 μ m y e a r t f 2 z i 30 4
Zinc corrosion rate: 15 µm/year for the first 2 years, then 4 µm/year until zinc depletion.
Bare steel corrosion rate: 12 µm/year following zinc depletion.
Caltrans model:
X = 28 μ m y e a r t f C
C, the time required for zinc depletion, is around 4.77 years for a zinc coating 41 µm thick.
Bare steel corrosion rate: 28 µm/year following zinc depletion.
Average model:
X = 14.2 μ m y e a r t f z i 10.25
Zinc corrosion rate: 10.25 µm/year until zinc depletion.
Bare steel corrosion rate: 14.2 µm/year following zinc depletion.

5. Conclusions

The conducted accelerated corrosion tests with sequenced wetting/drying cycles proved efficient in propagating corrosion in buried corrugated galvanized steel coupons. The corrosion was started by applying a 3.5% NaCl electrolyte solution to the buried candidate coupons, which were then exposed to repetitive wetting/drying cycles. The test results demonstrated how additional wetting/drying cycles increased the corrosion damage, i.e., thickness loss, and the deterioration of mechanical properties. Based on the results of the tests conducted in this study, the following conclusions could be drawn.
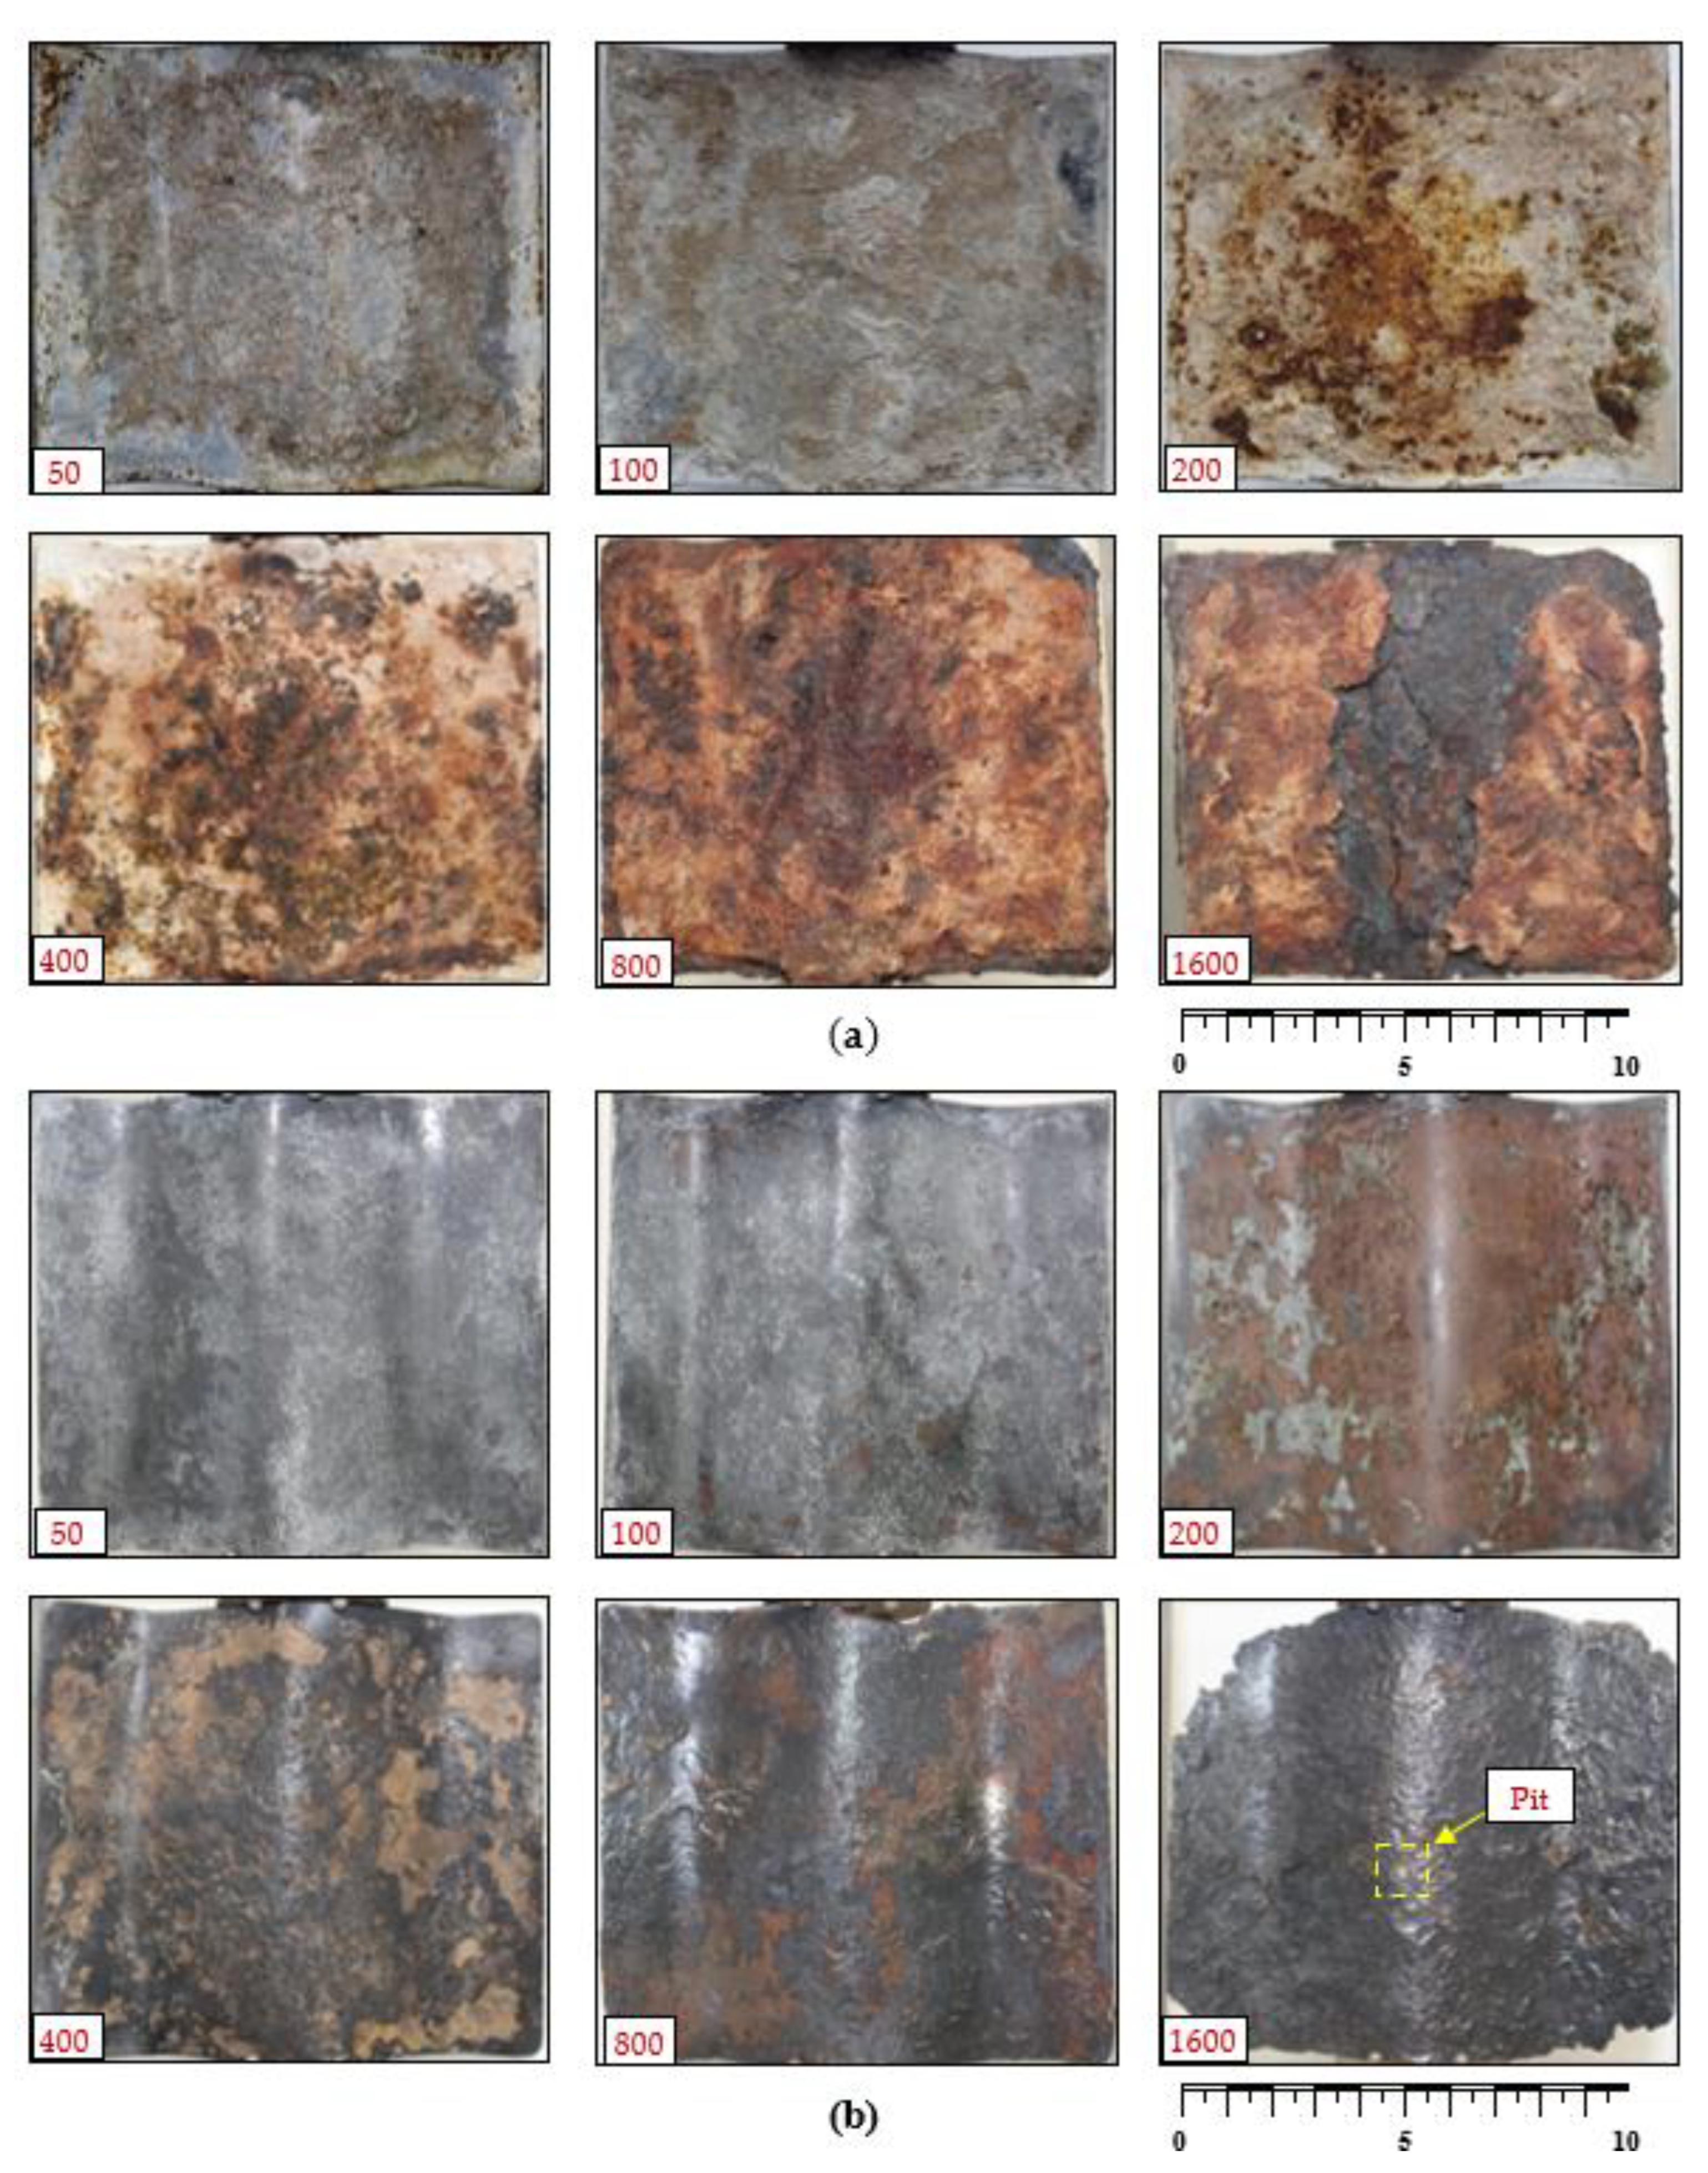
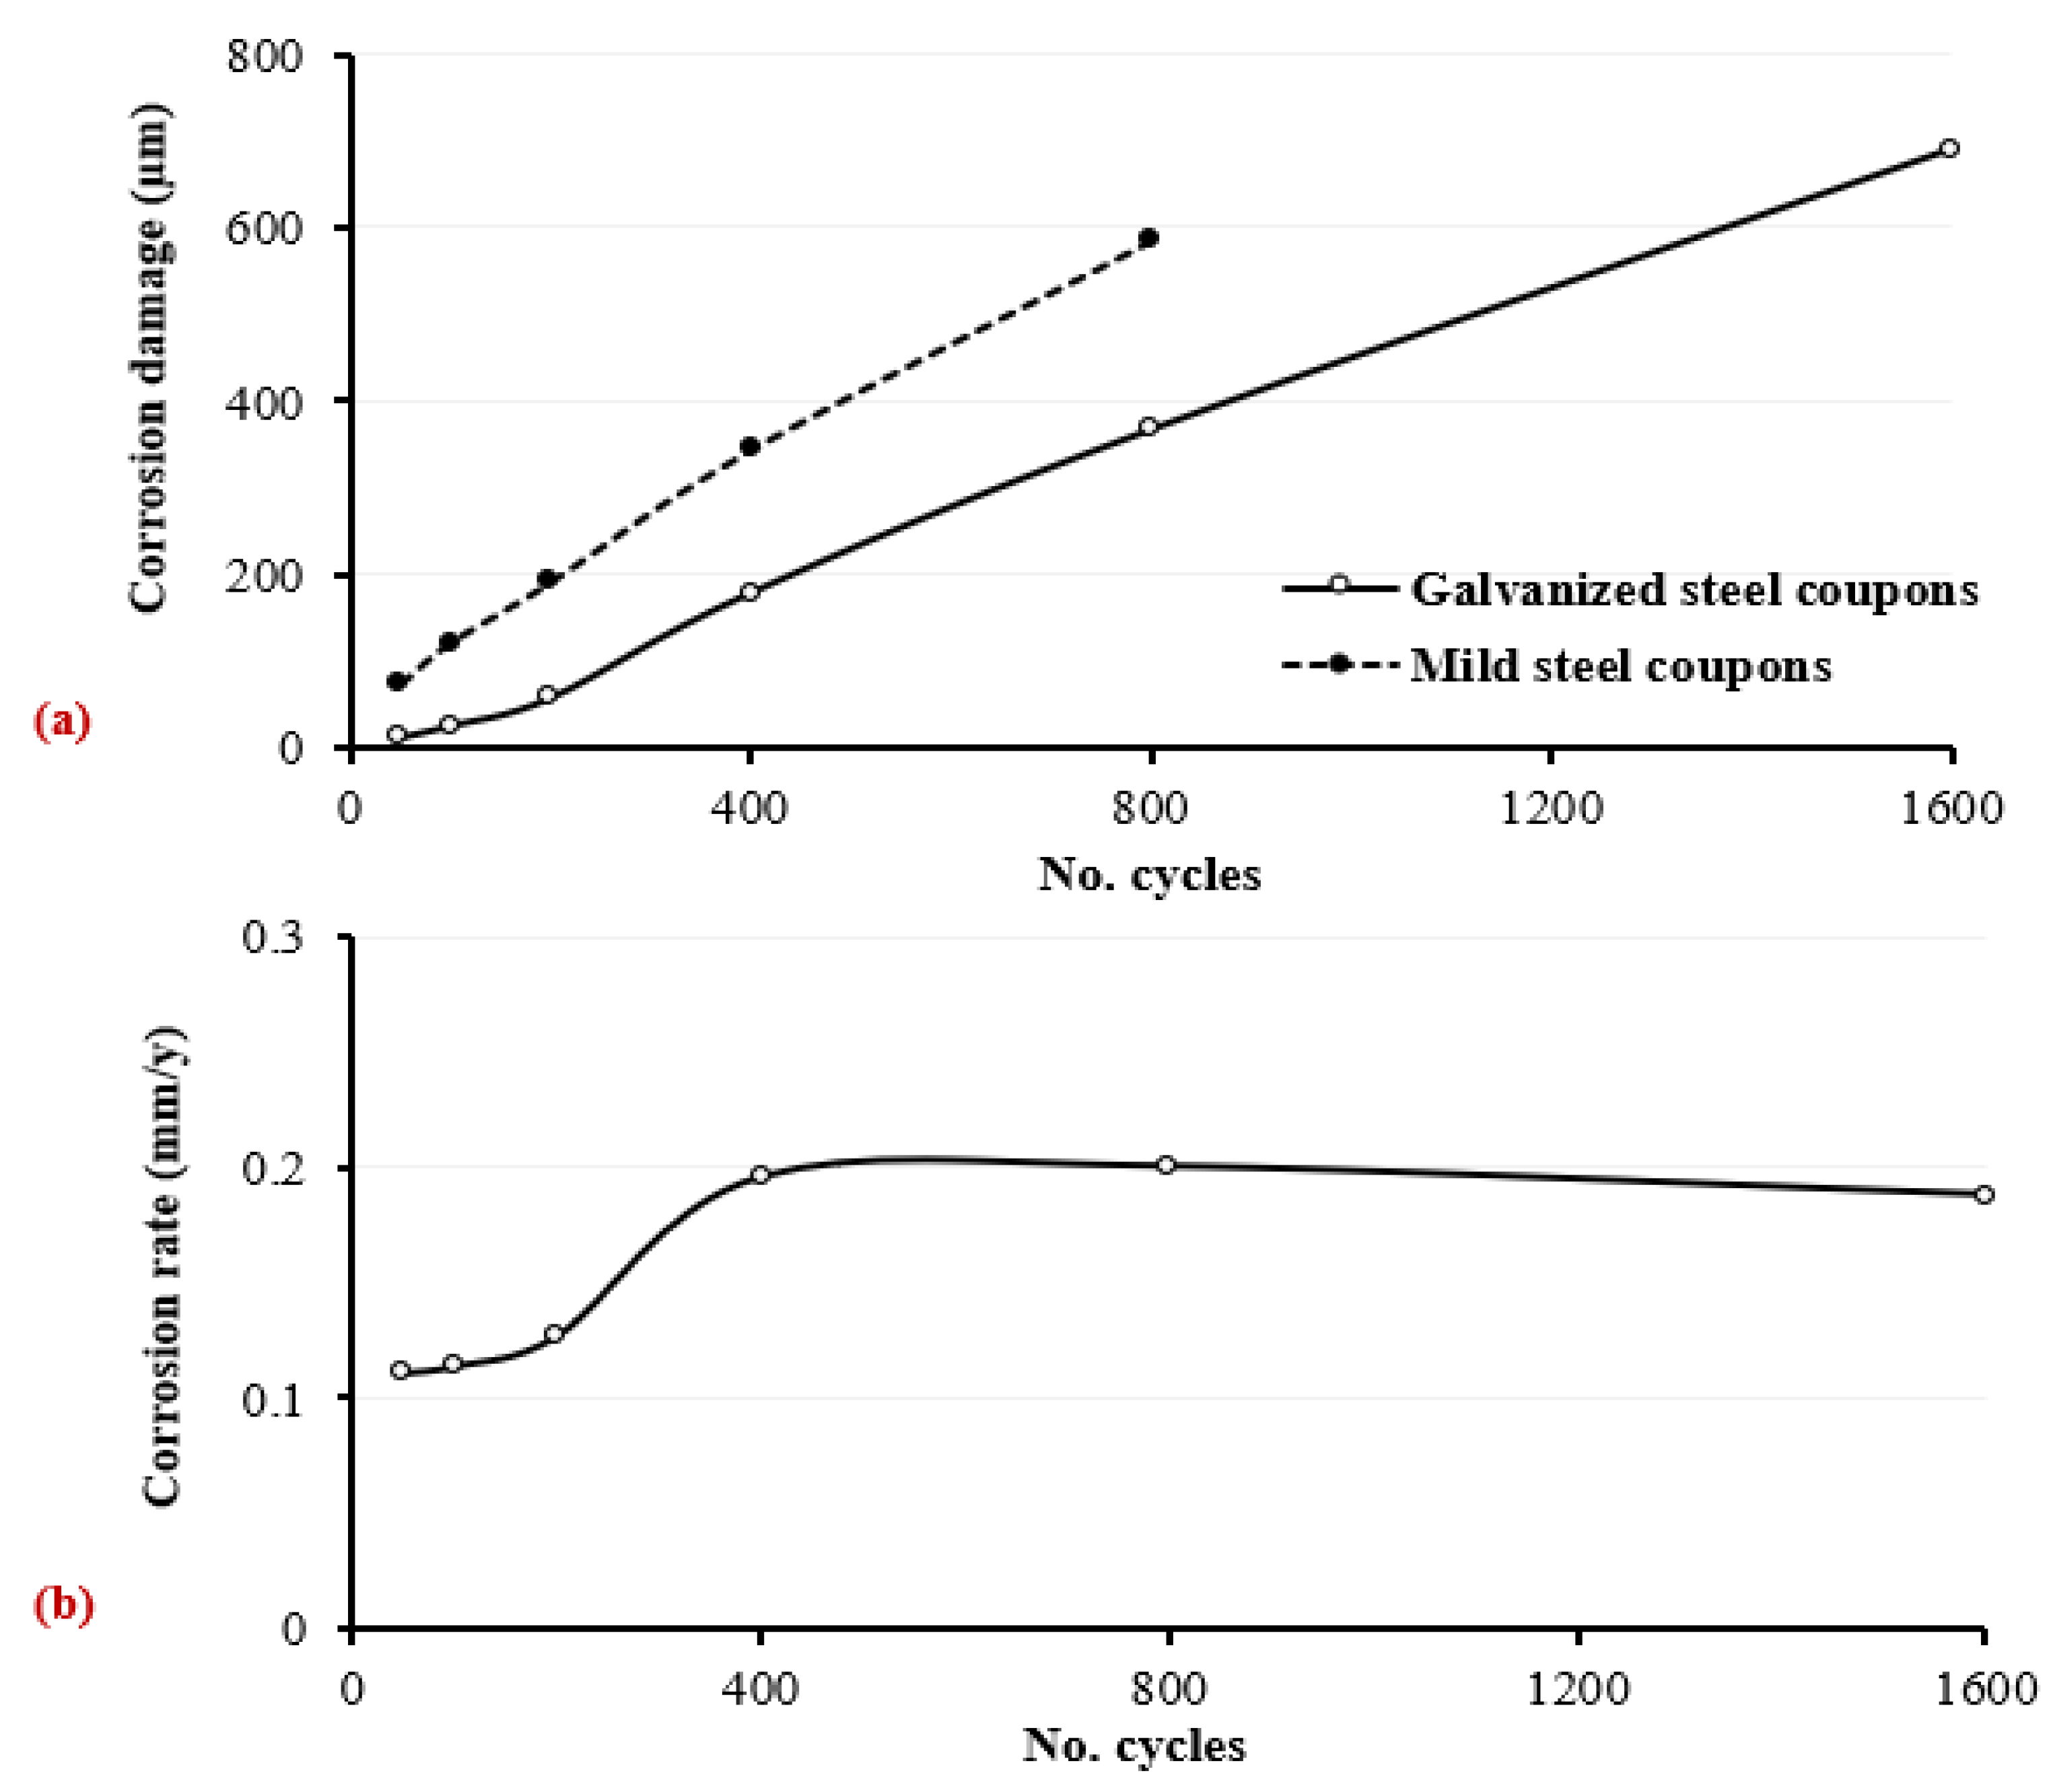
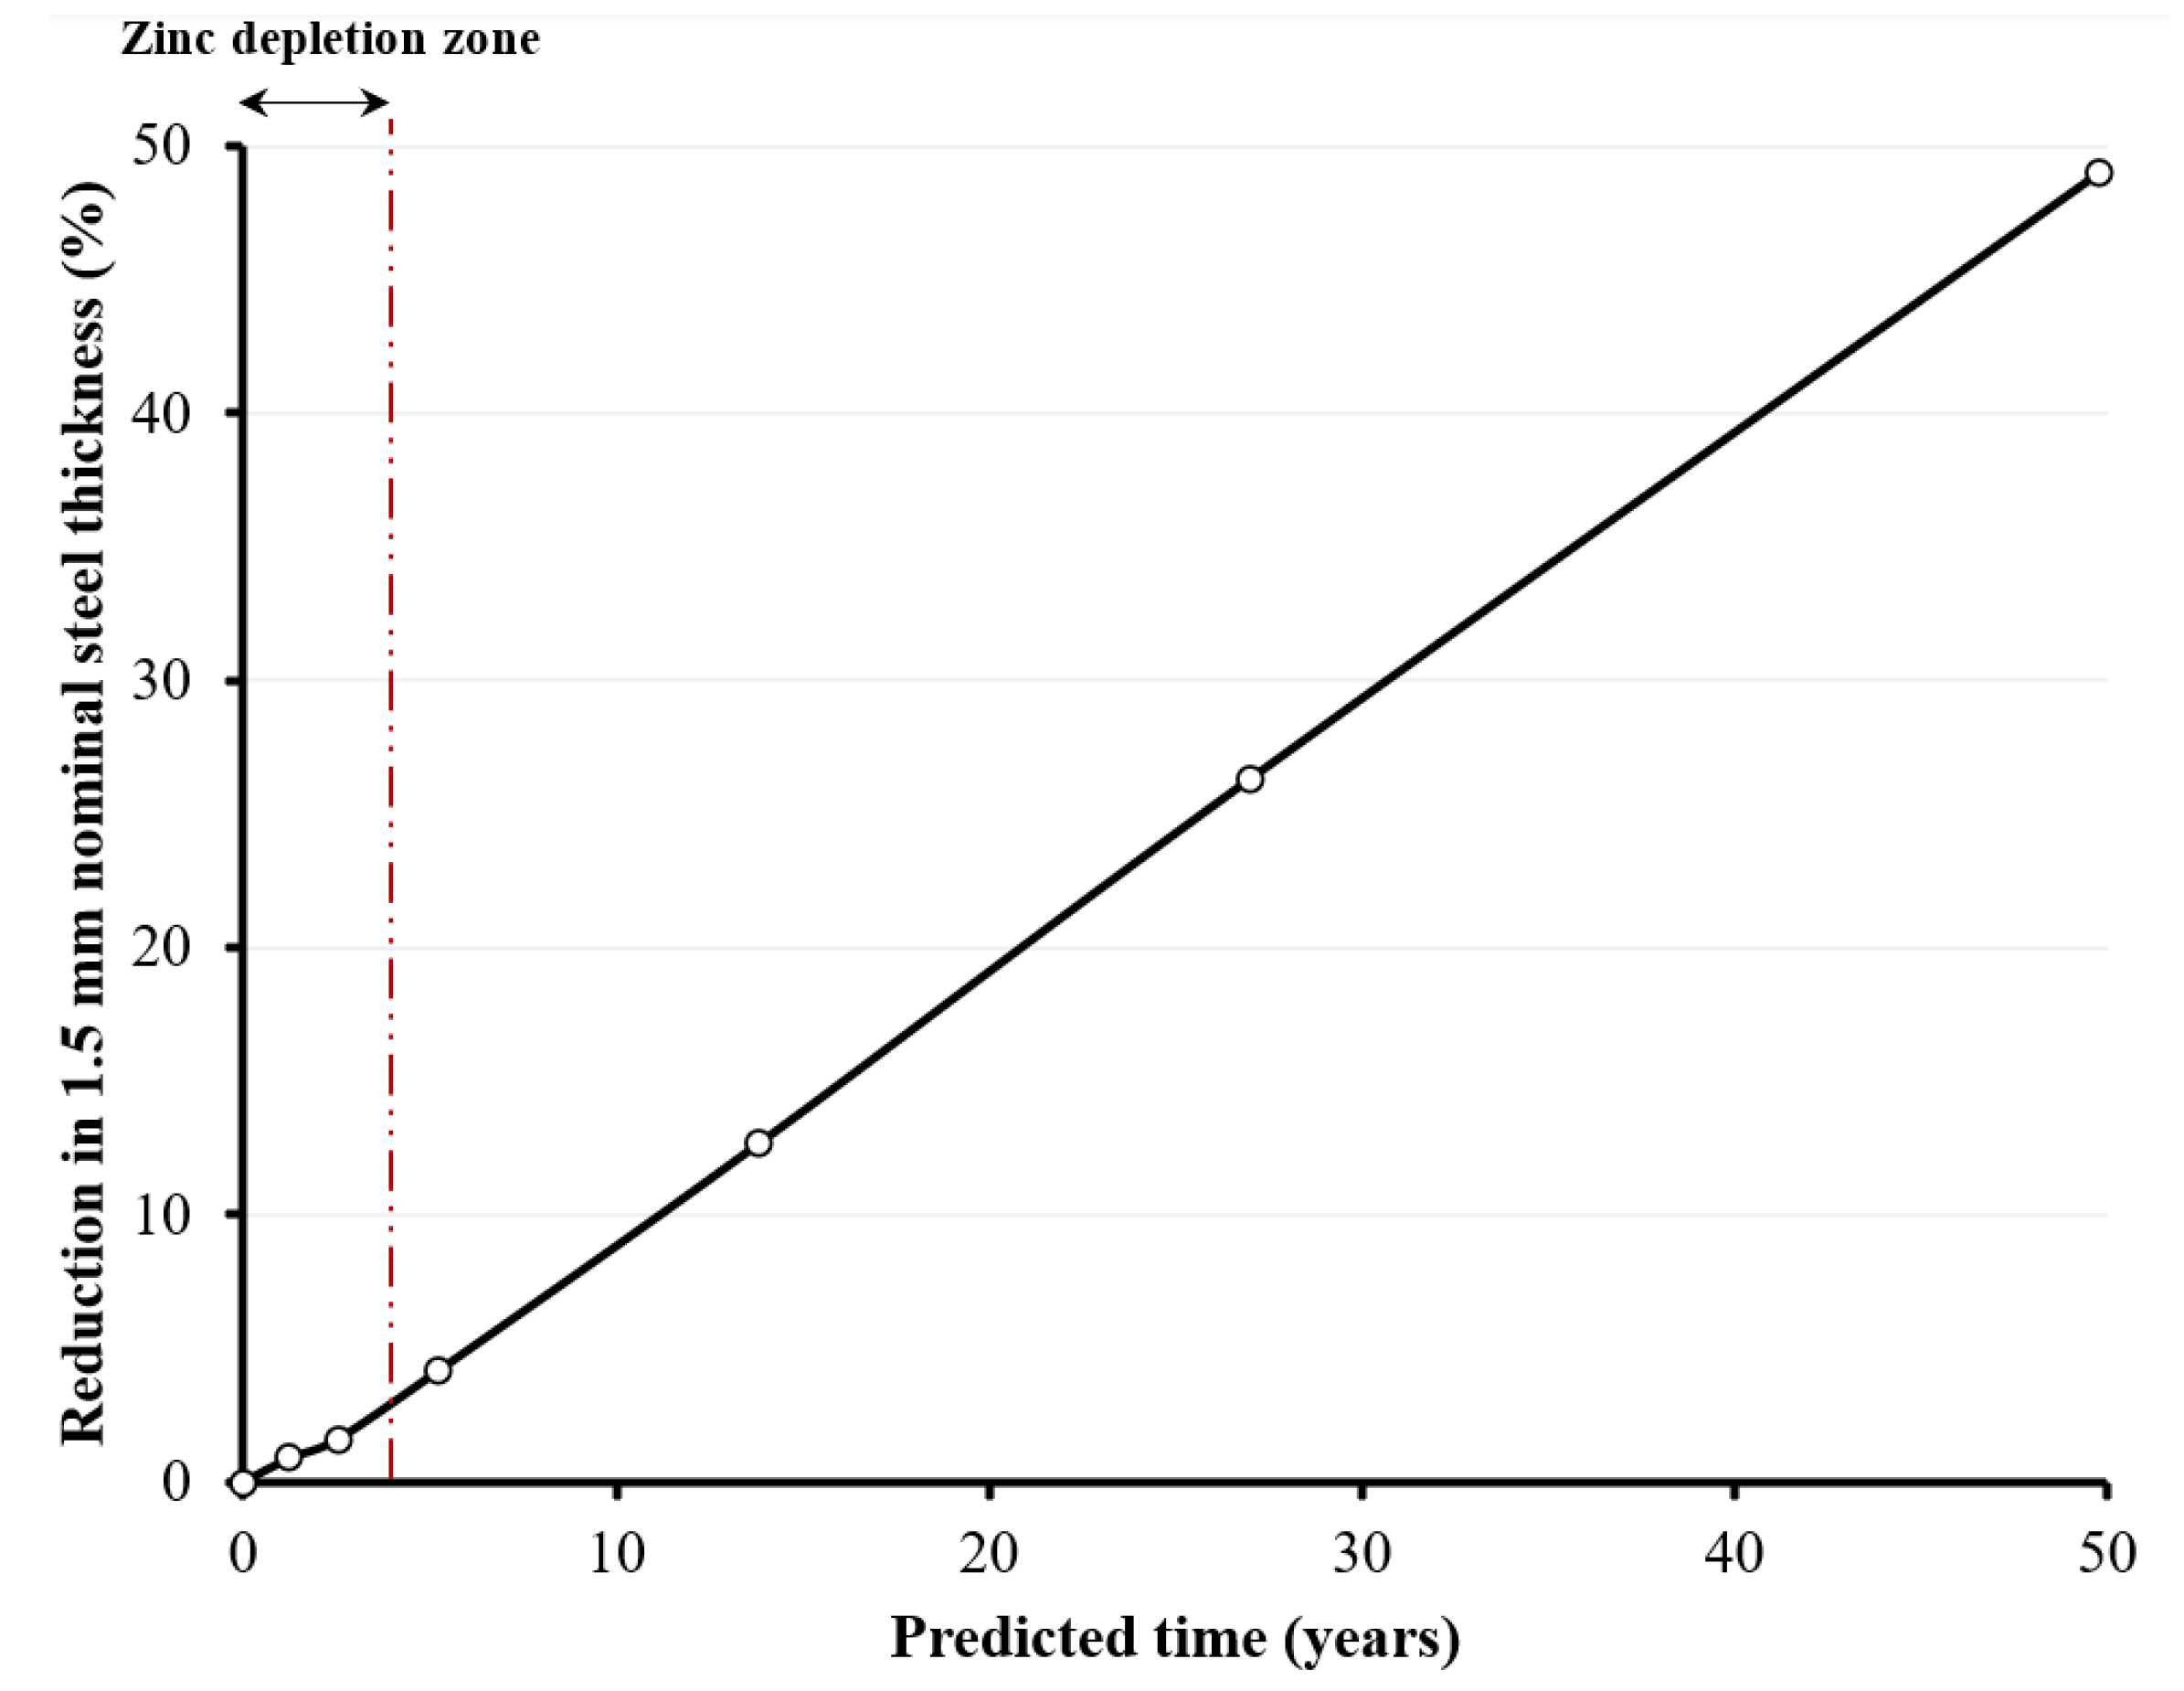
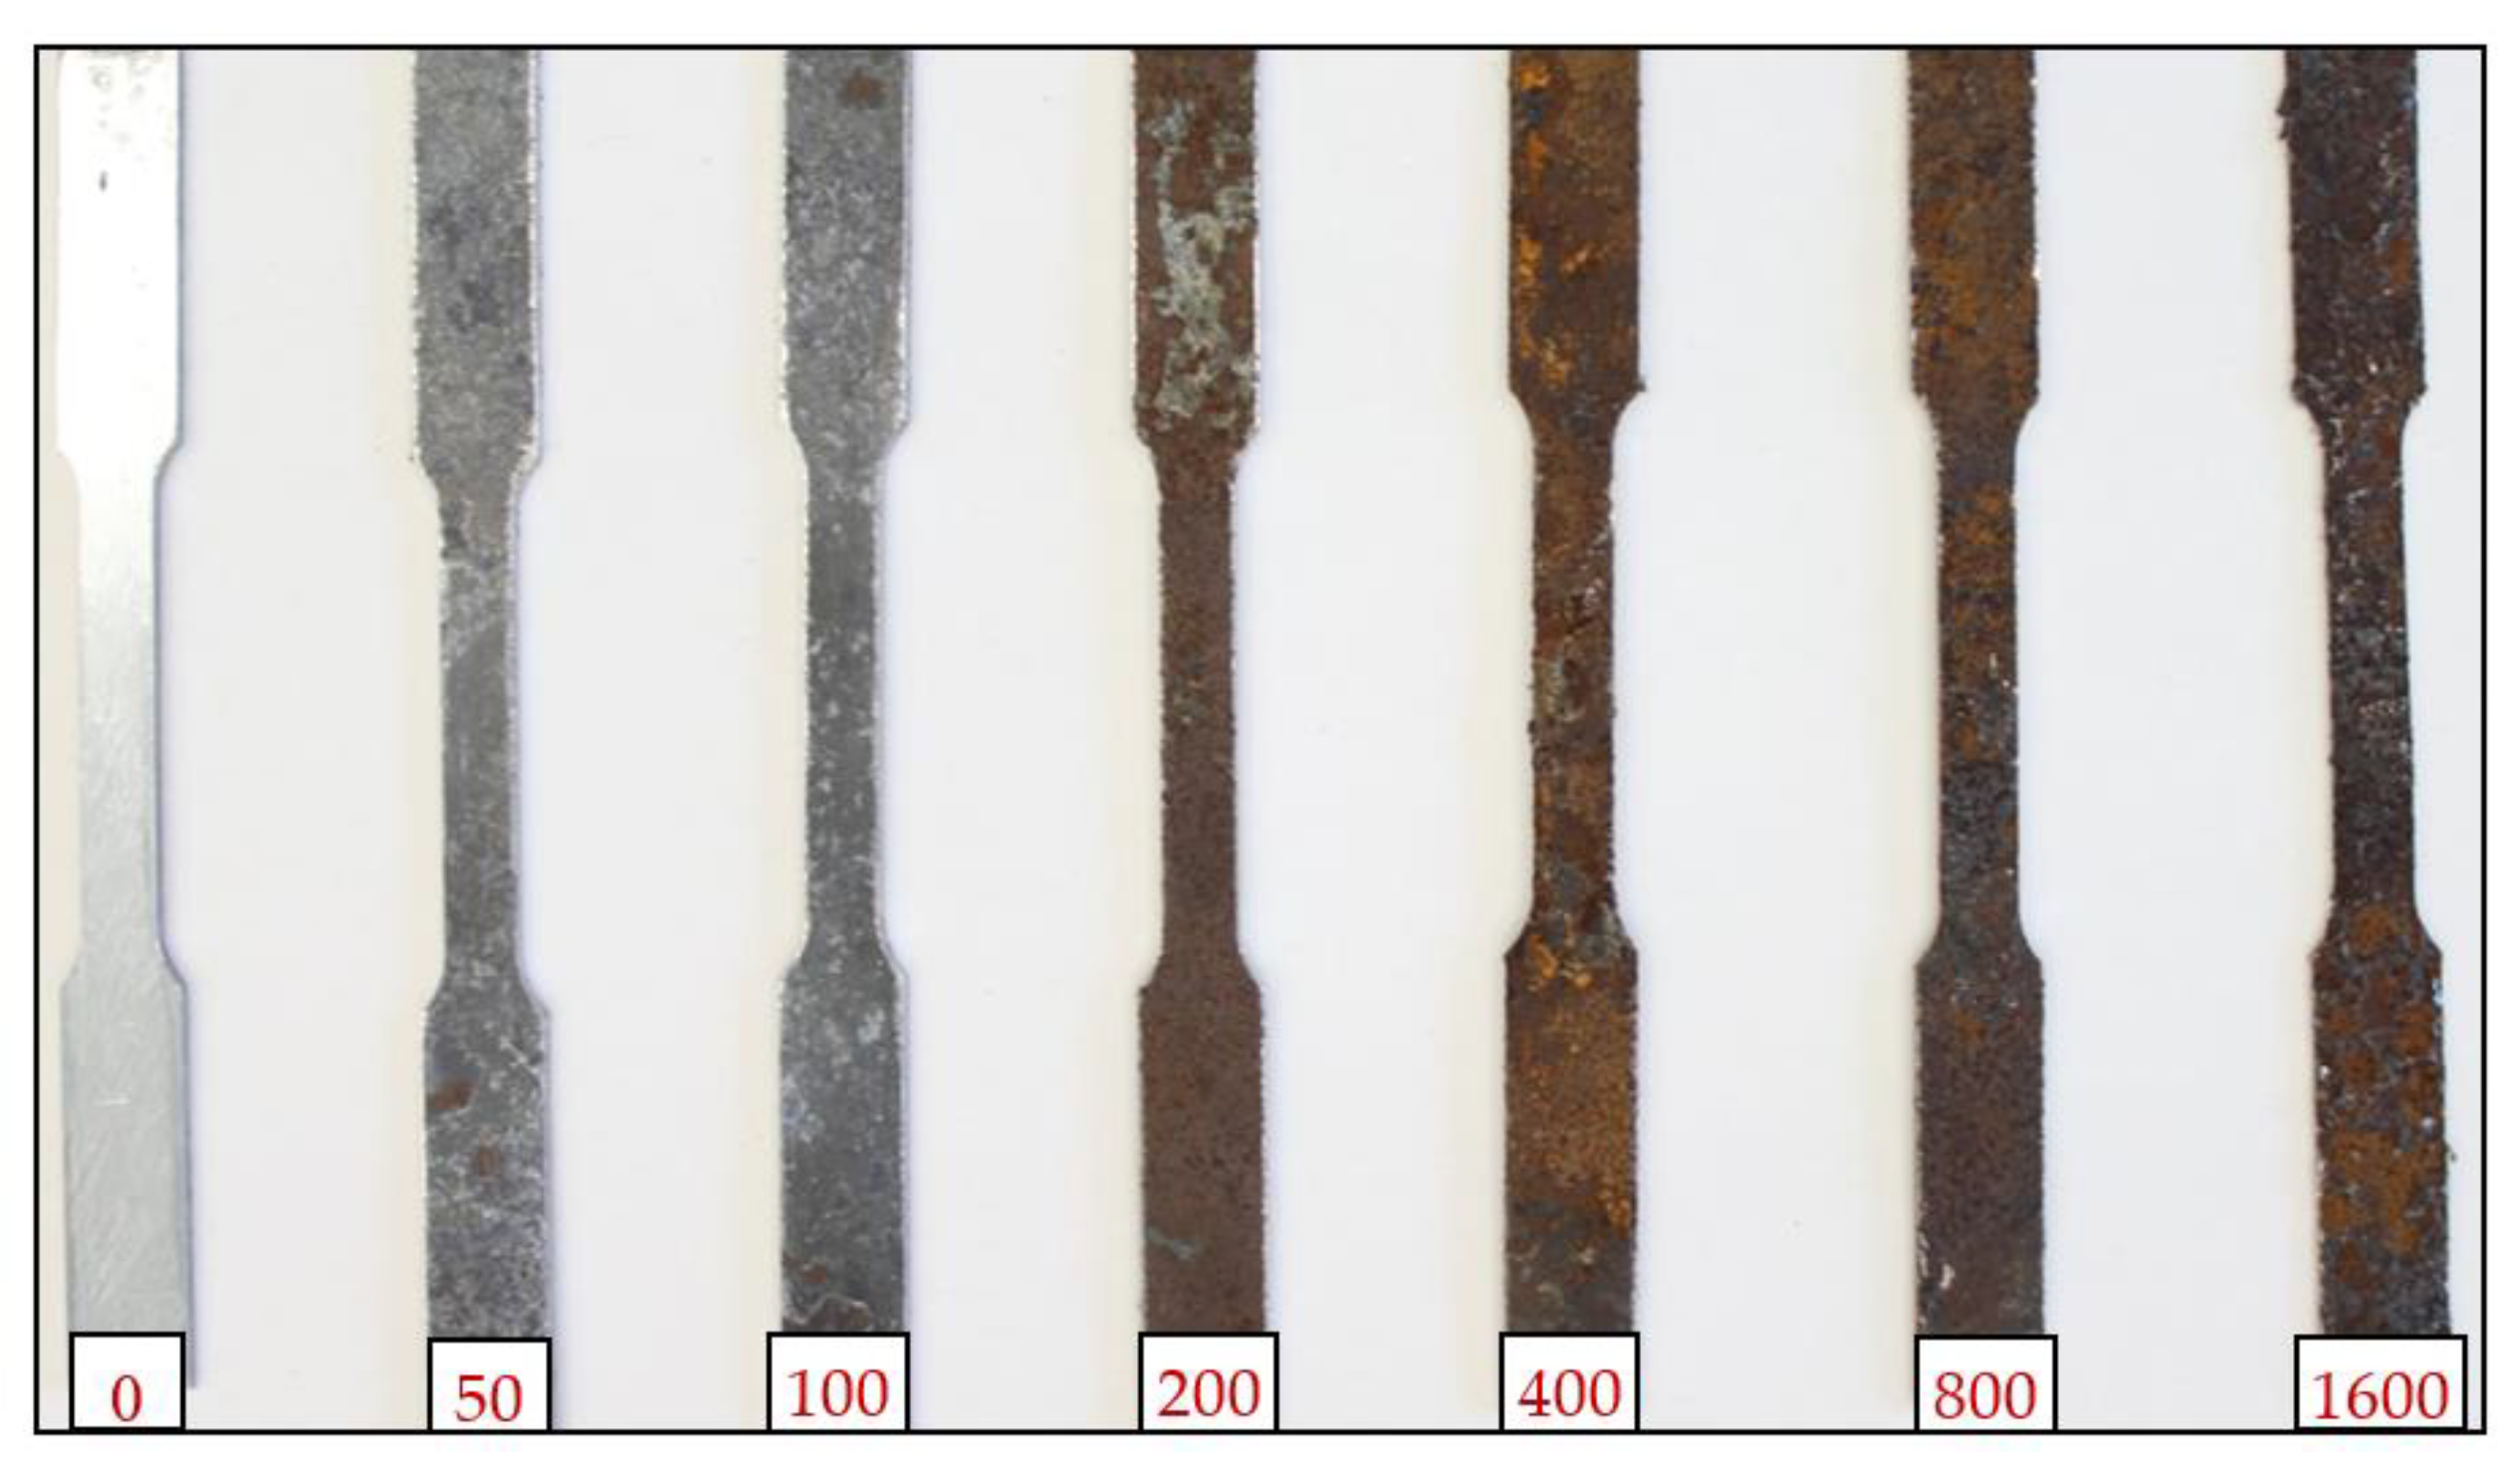
  • The existence of the zinc coating layer significantly delayed the impact of corrosion, until the zinc layer was almost fully depleted (i.e., at around 200 wetting/drying cycles), resulting in the direct exposure of bare steel to the aggressive surrounding corrosive environment. For instance, under the worst corrosive state, corresponding to 1600 wetting/drying cycles, the maximum thickness loss was around 691 µm (around 49% of the nominal thickness).
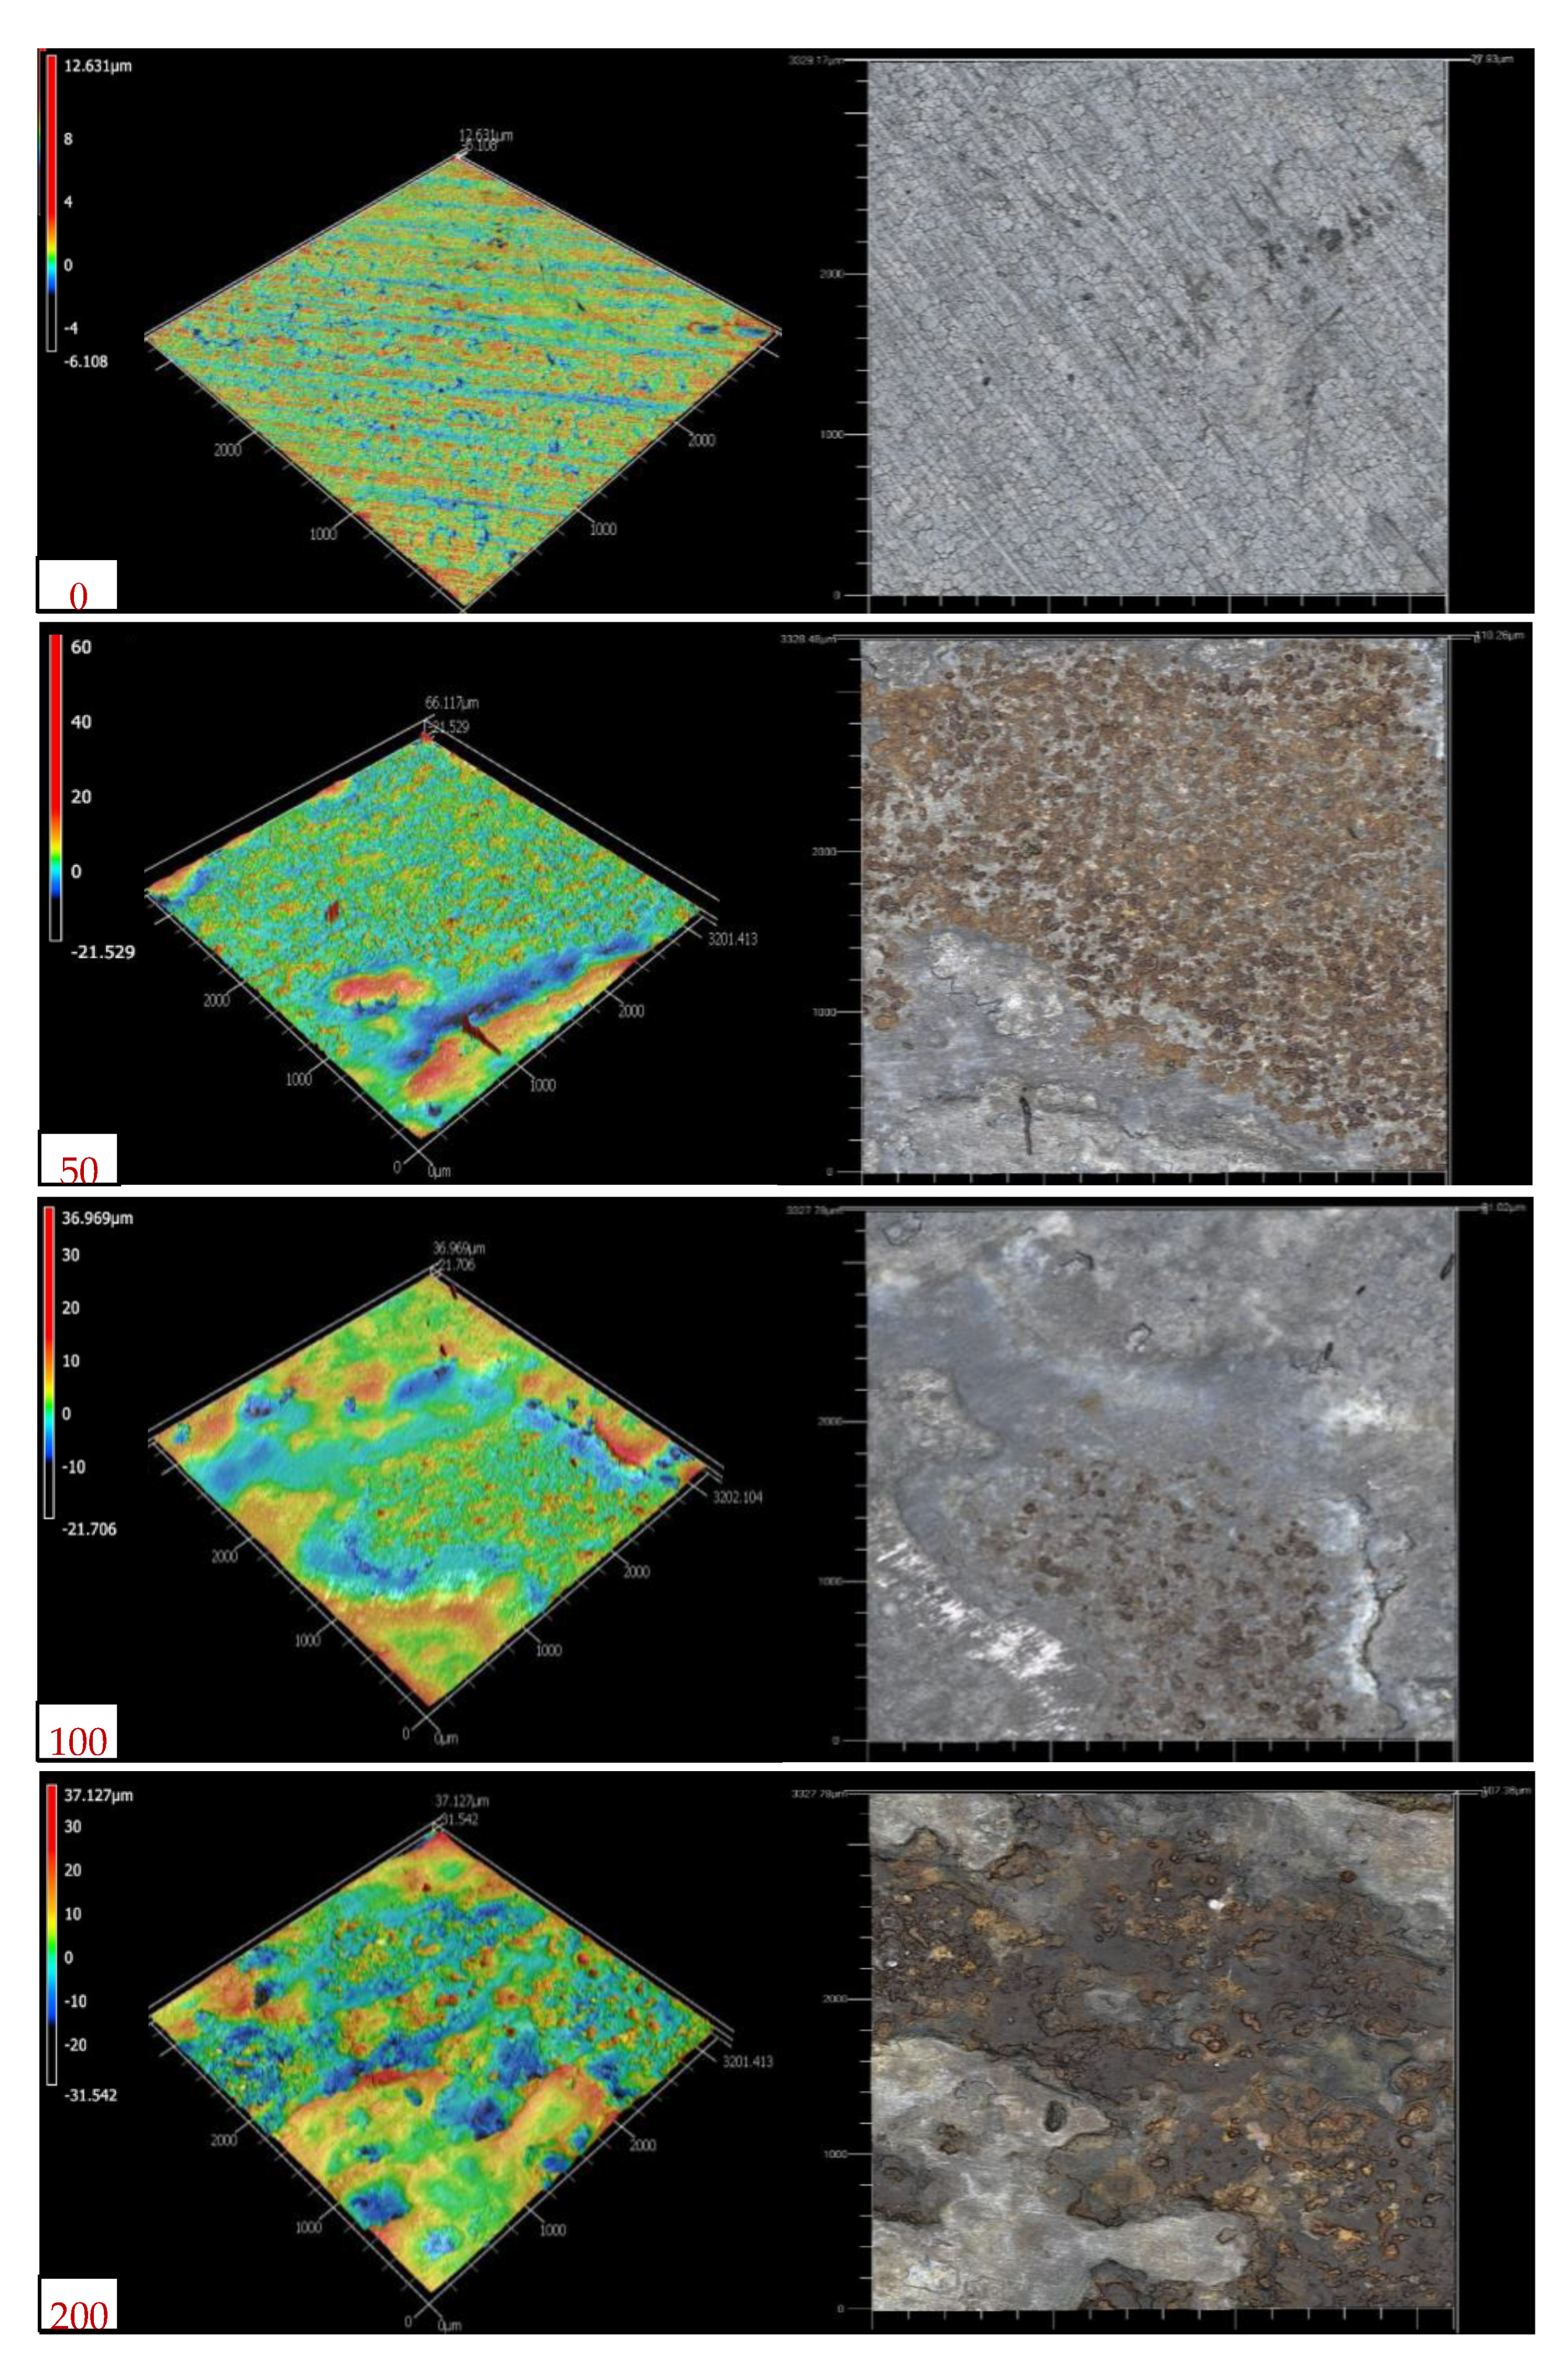
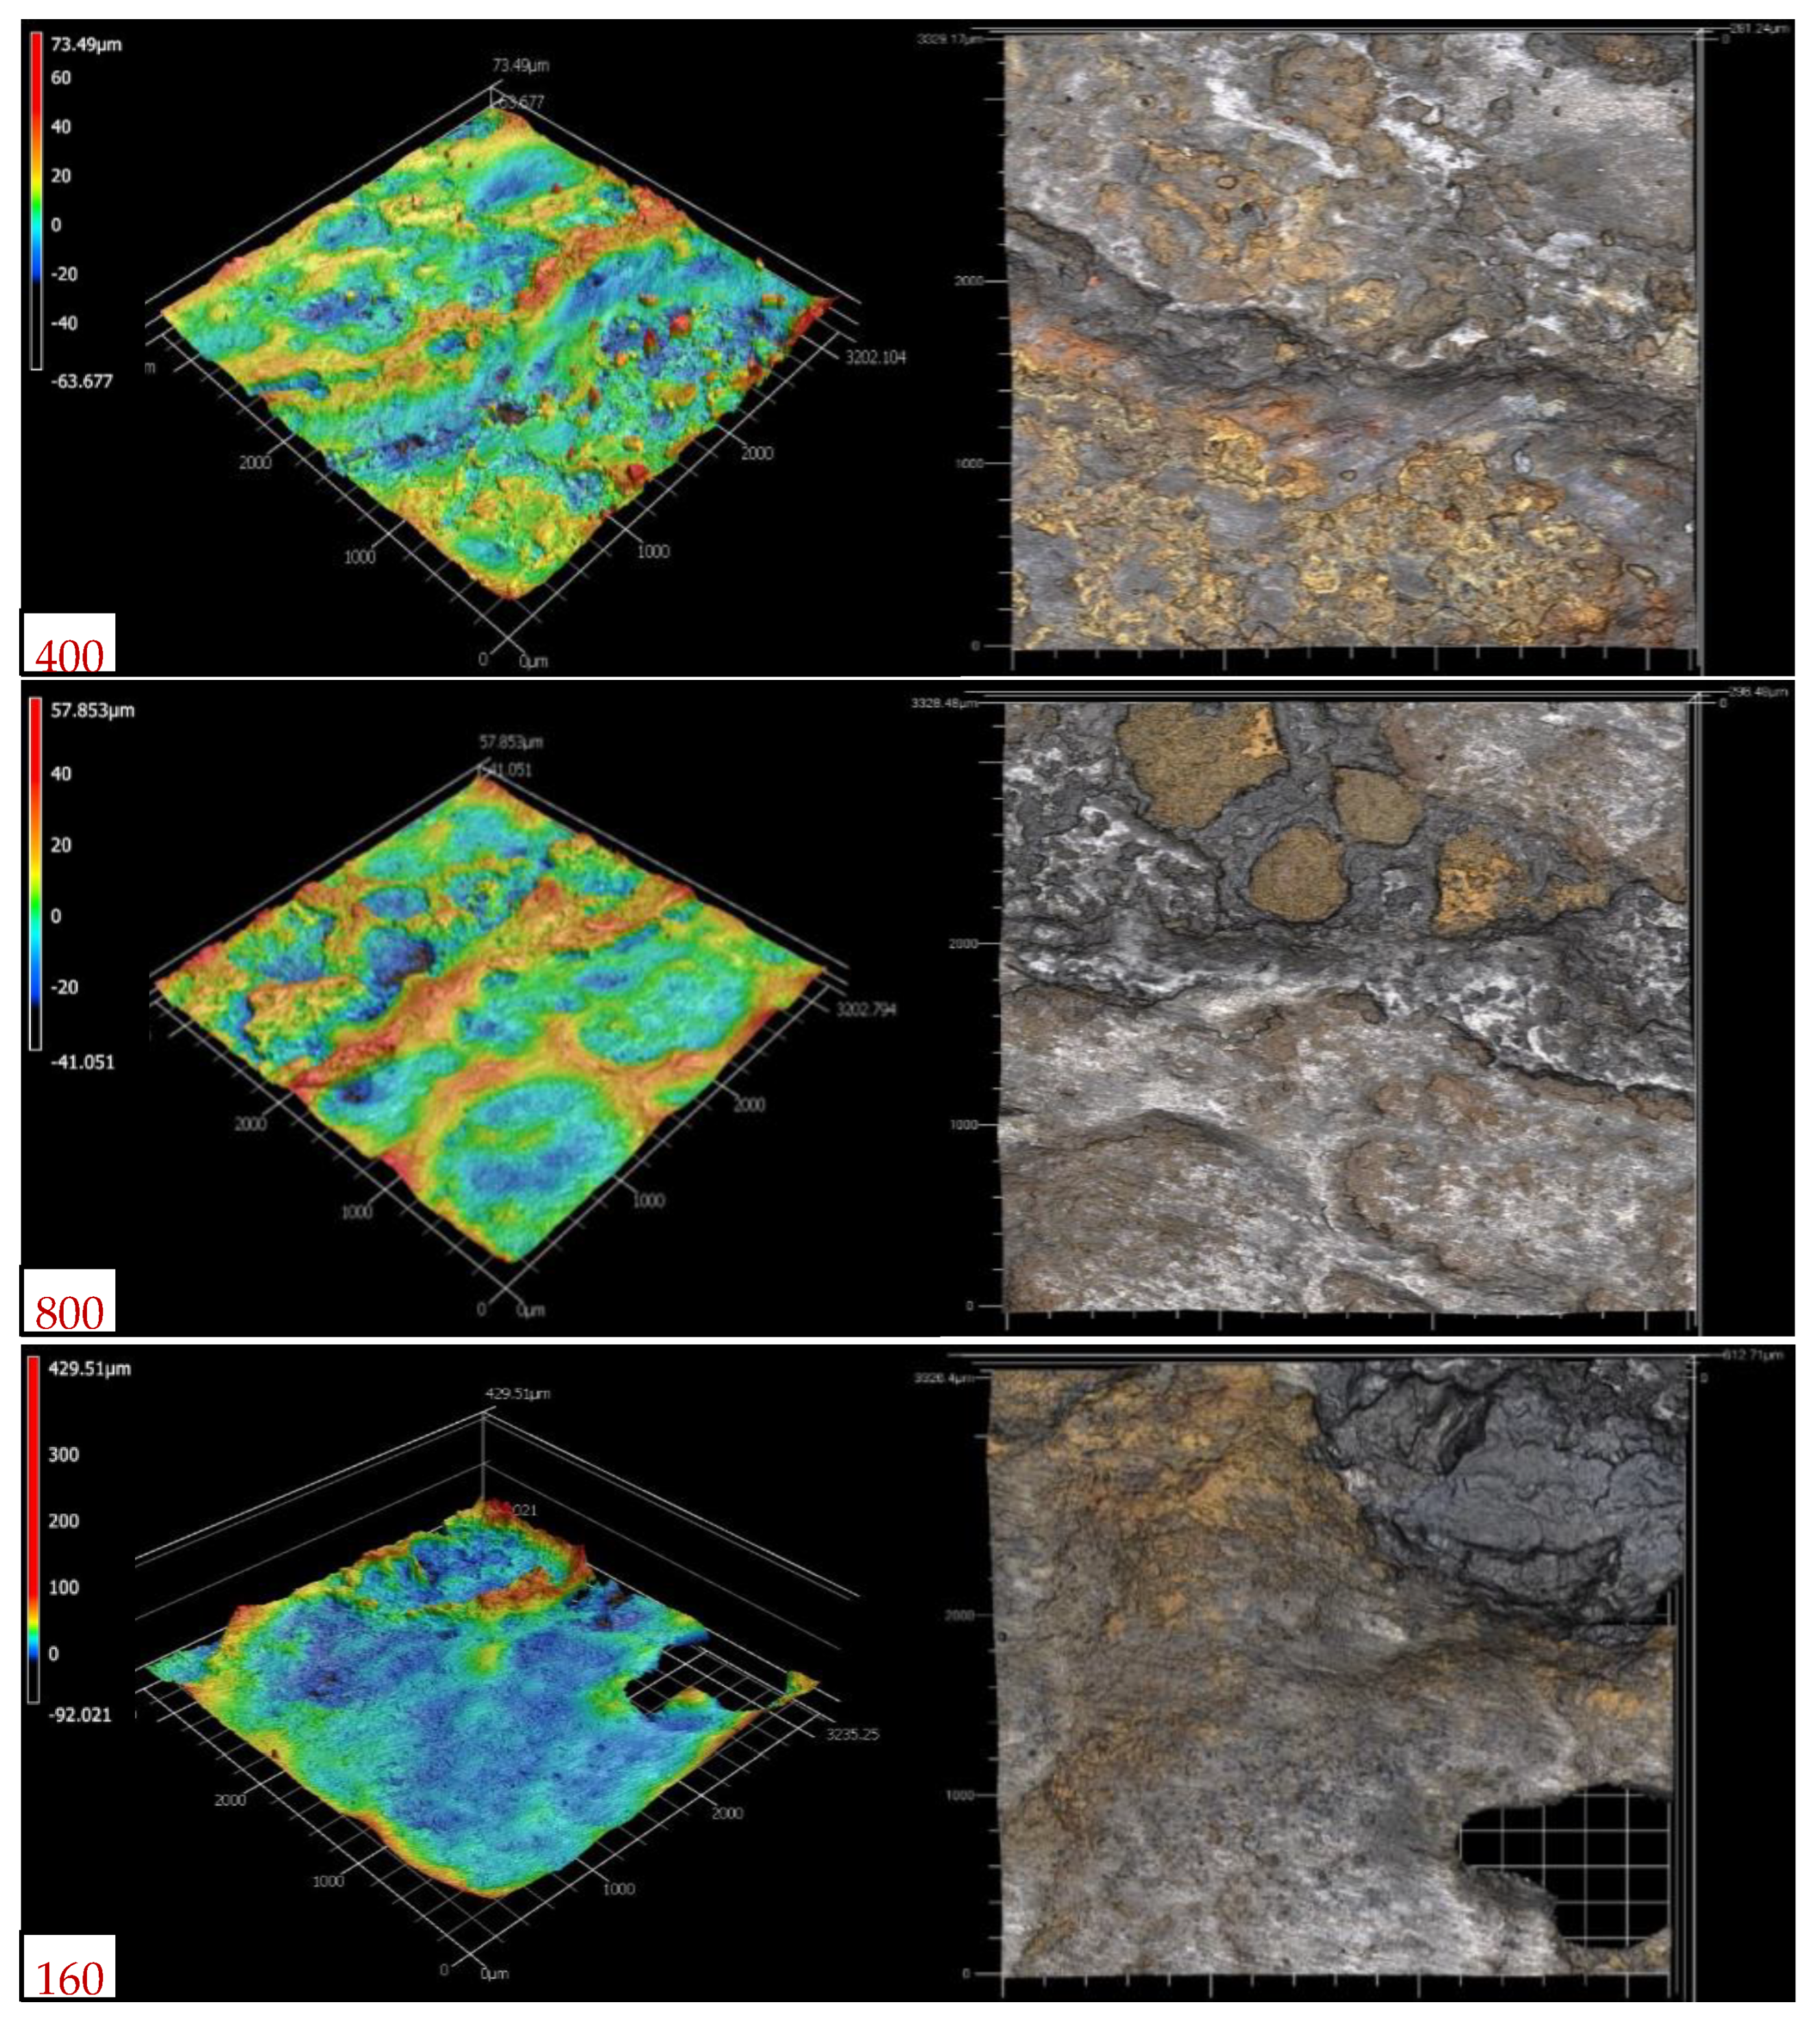
  • The corrosion rates at lower numbers of wetting/drying cycles (i.e., 50, 100, and 200 cycles) increased only slightly, with insignificant variations, demonstrating the corrosion resistance provided by the zinc coating. However, following zinc depletion and exposure to the bare steel surface, a substantial sharp increase in corrosion was observed for coupons exposed to 400 wetting/drying cycles. The developed corrosion modes included a combination of uniform and pitting corrosions, extending to cavities in the case of the coupons exposed to a higher number of wetting/drying cycles (e.g., 1600 cycles).
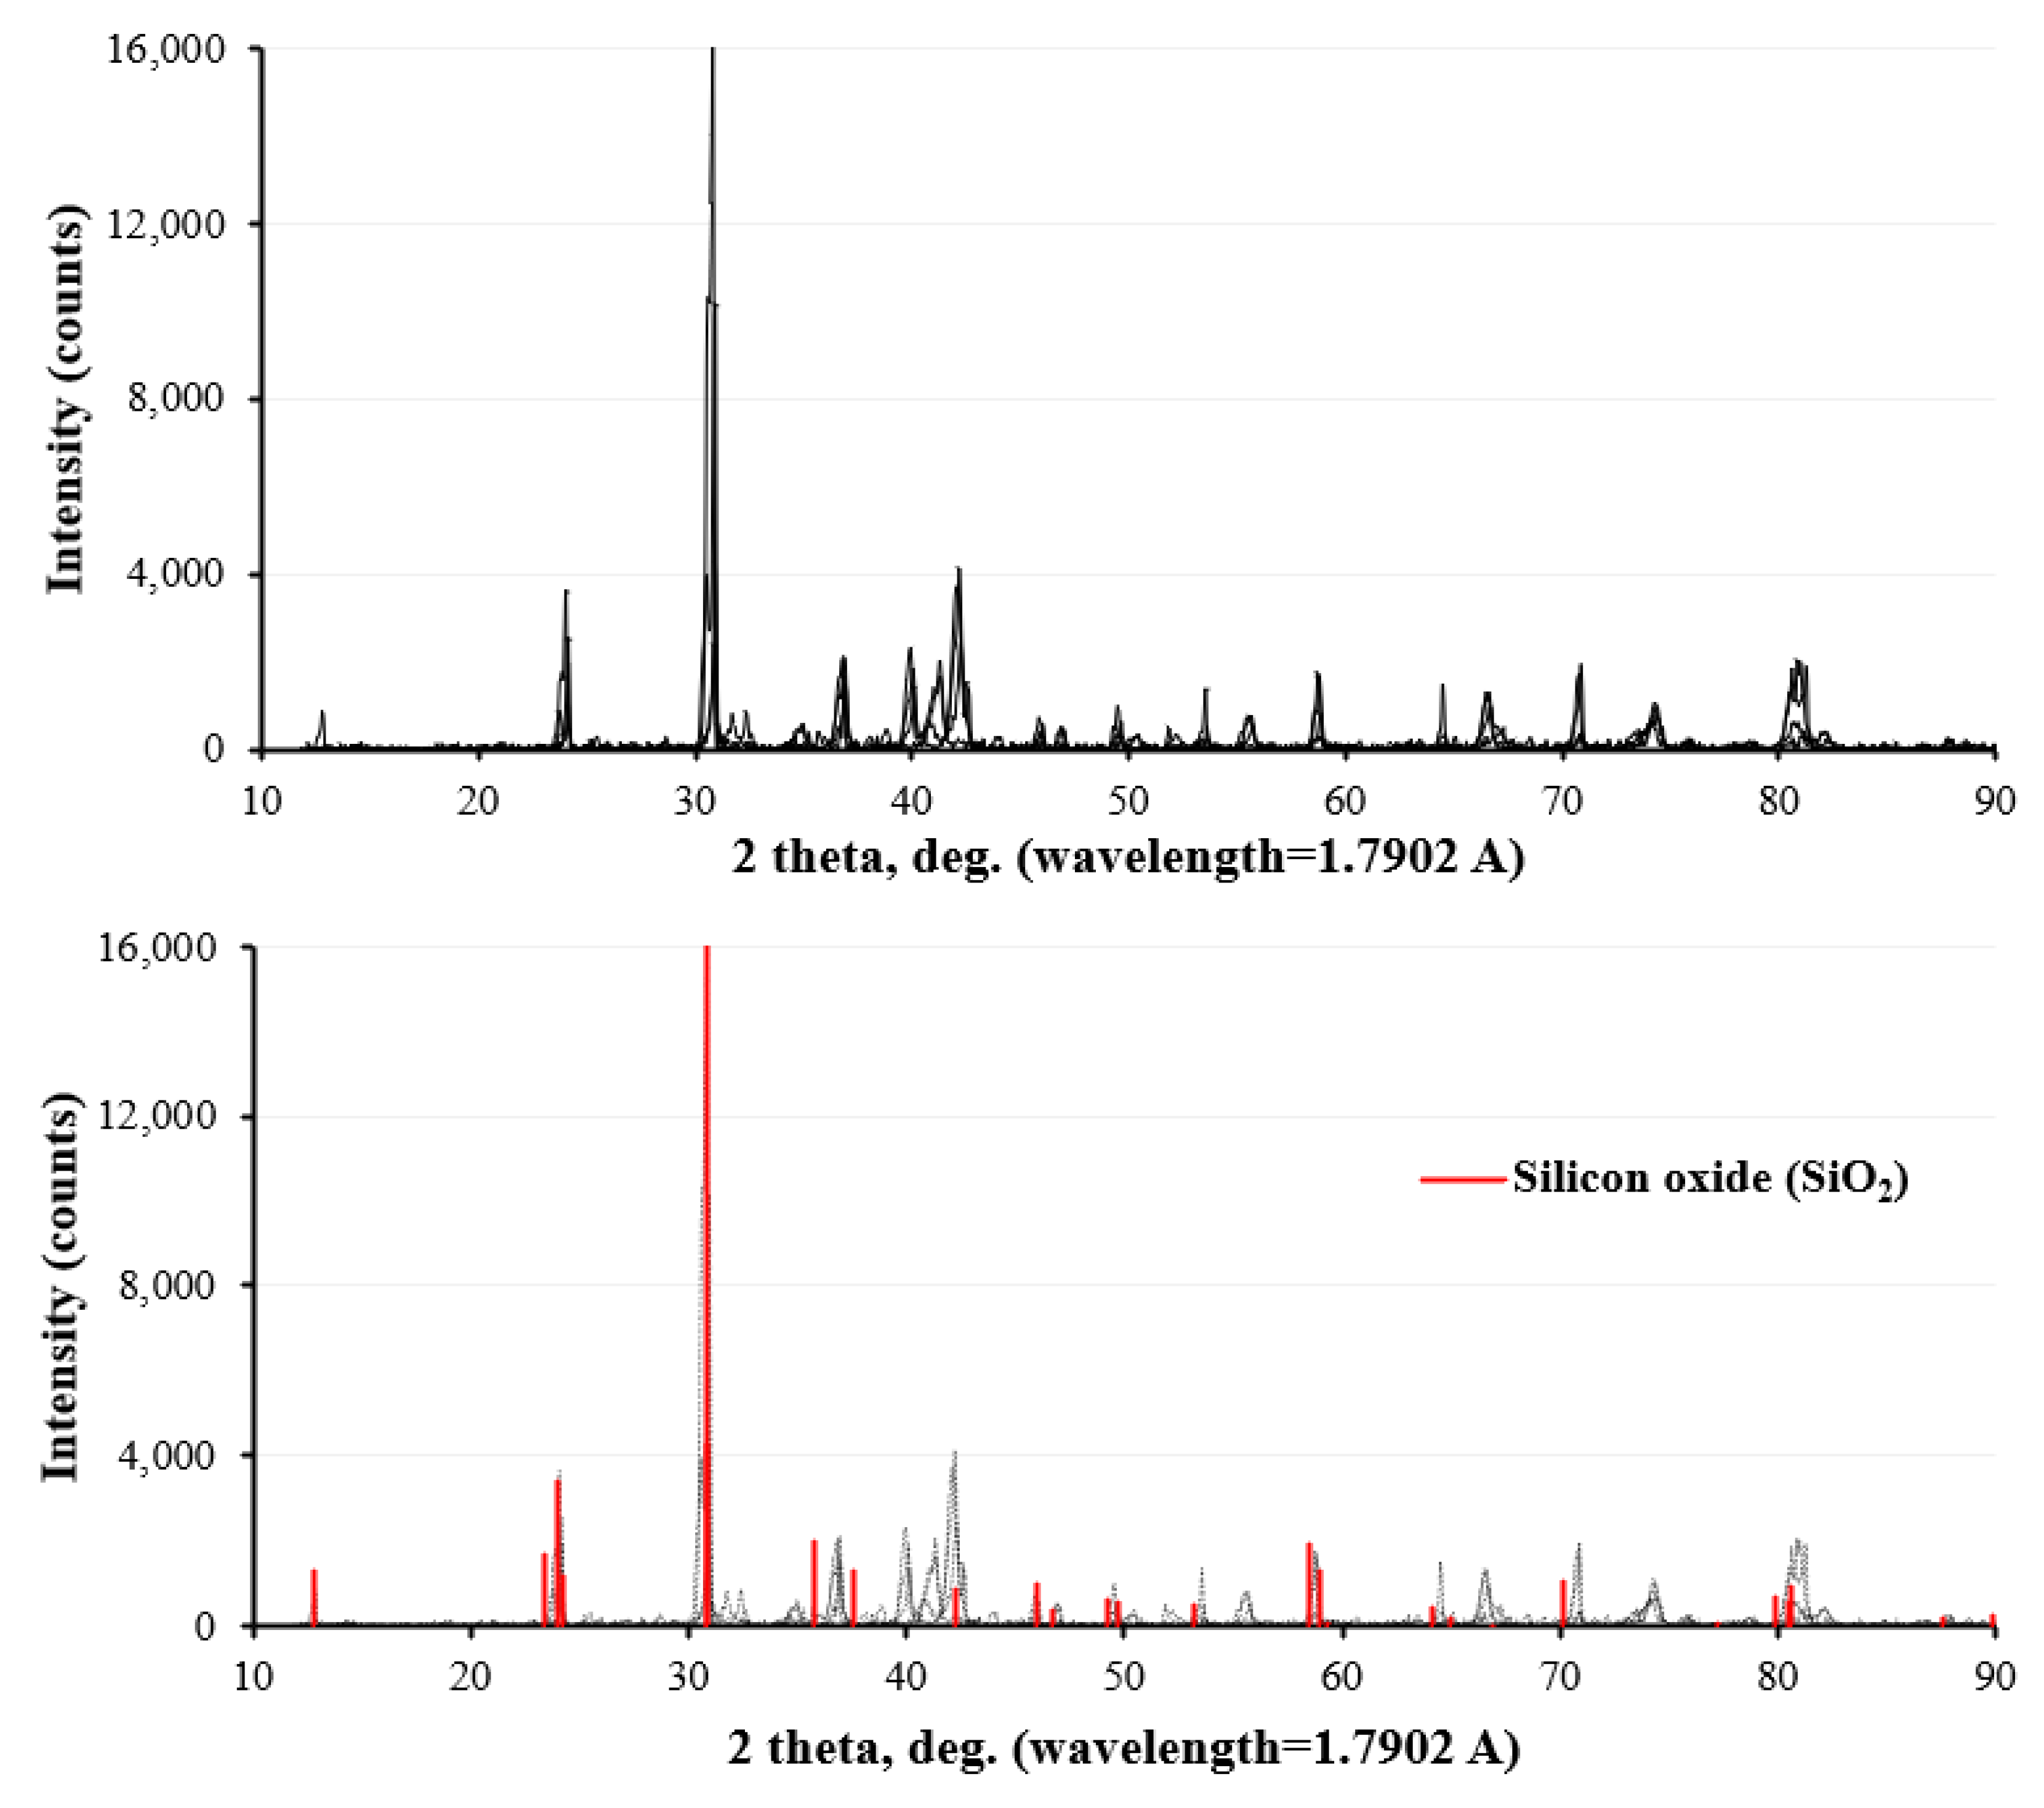
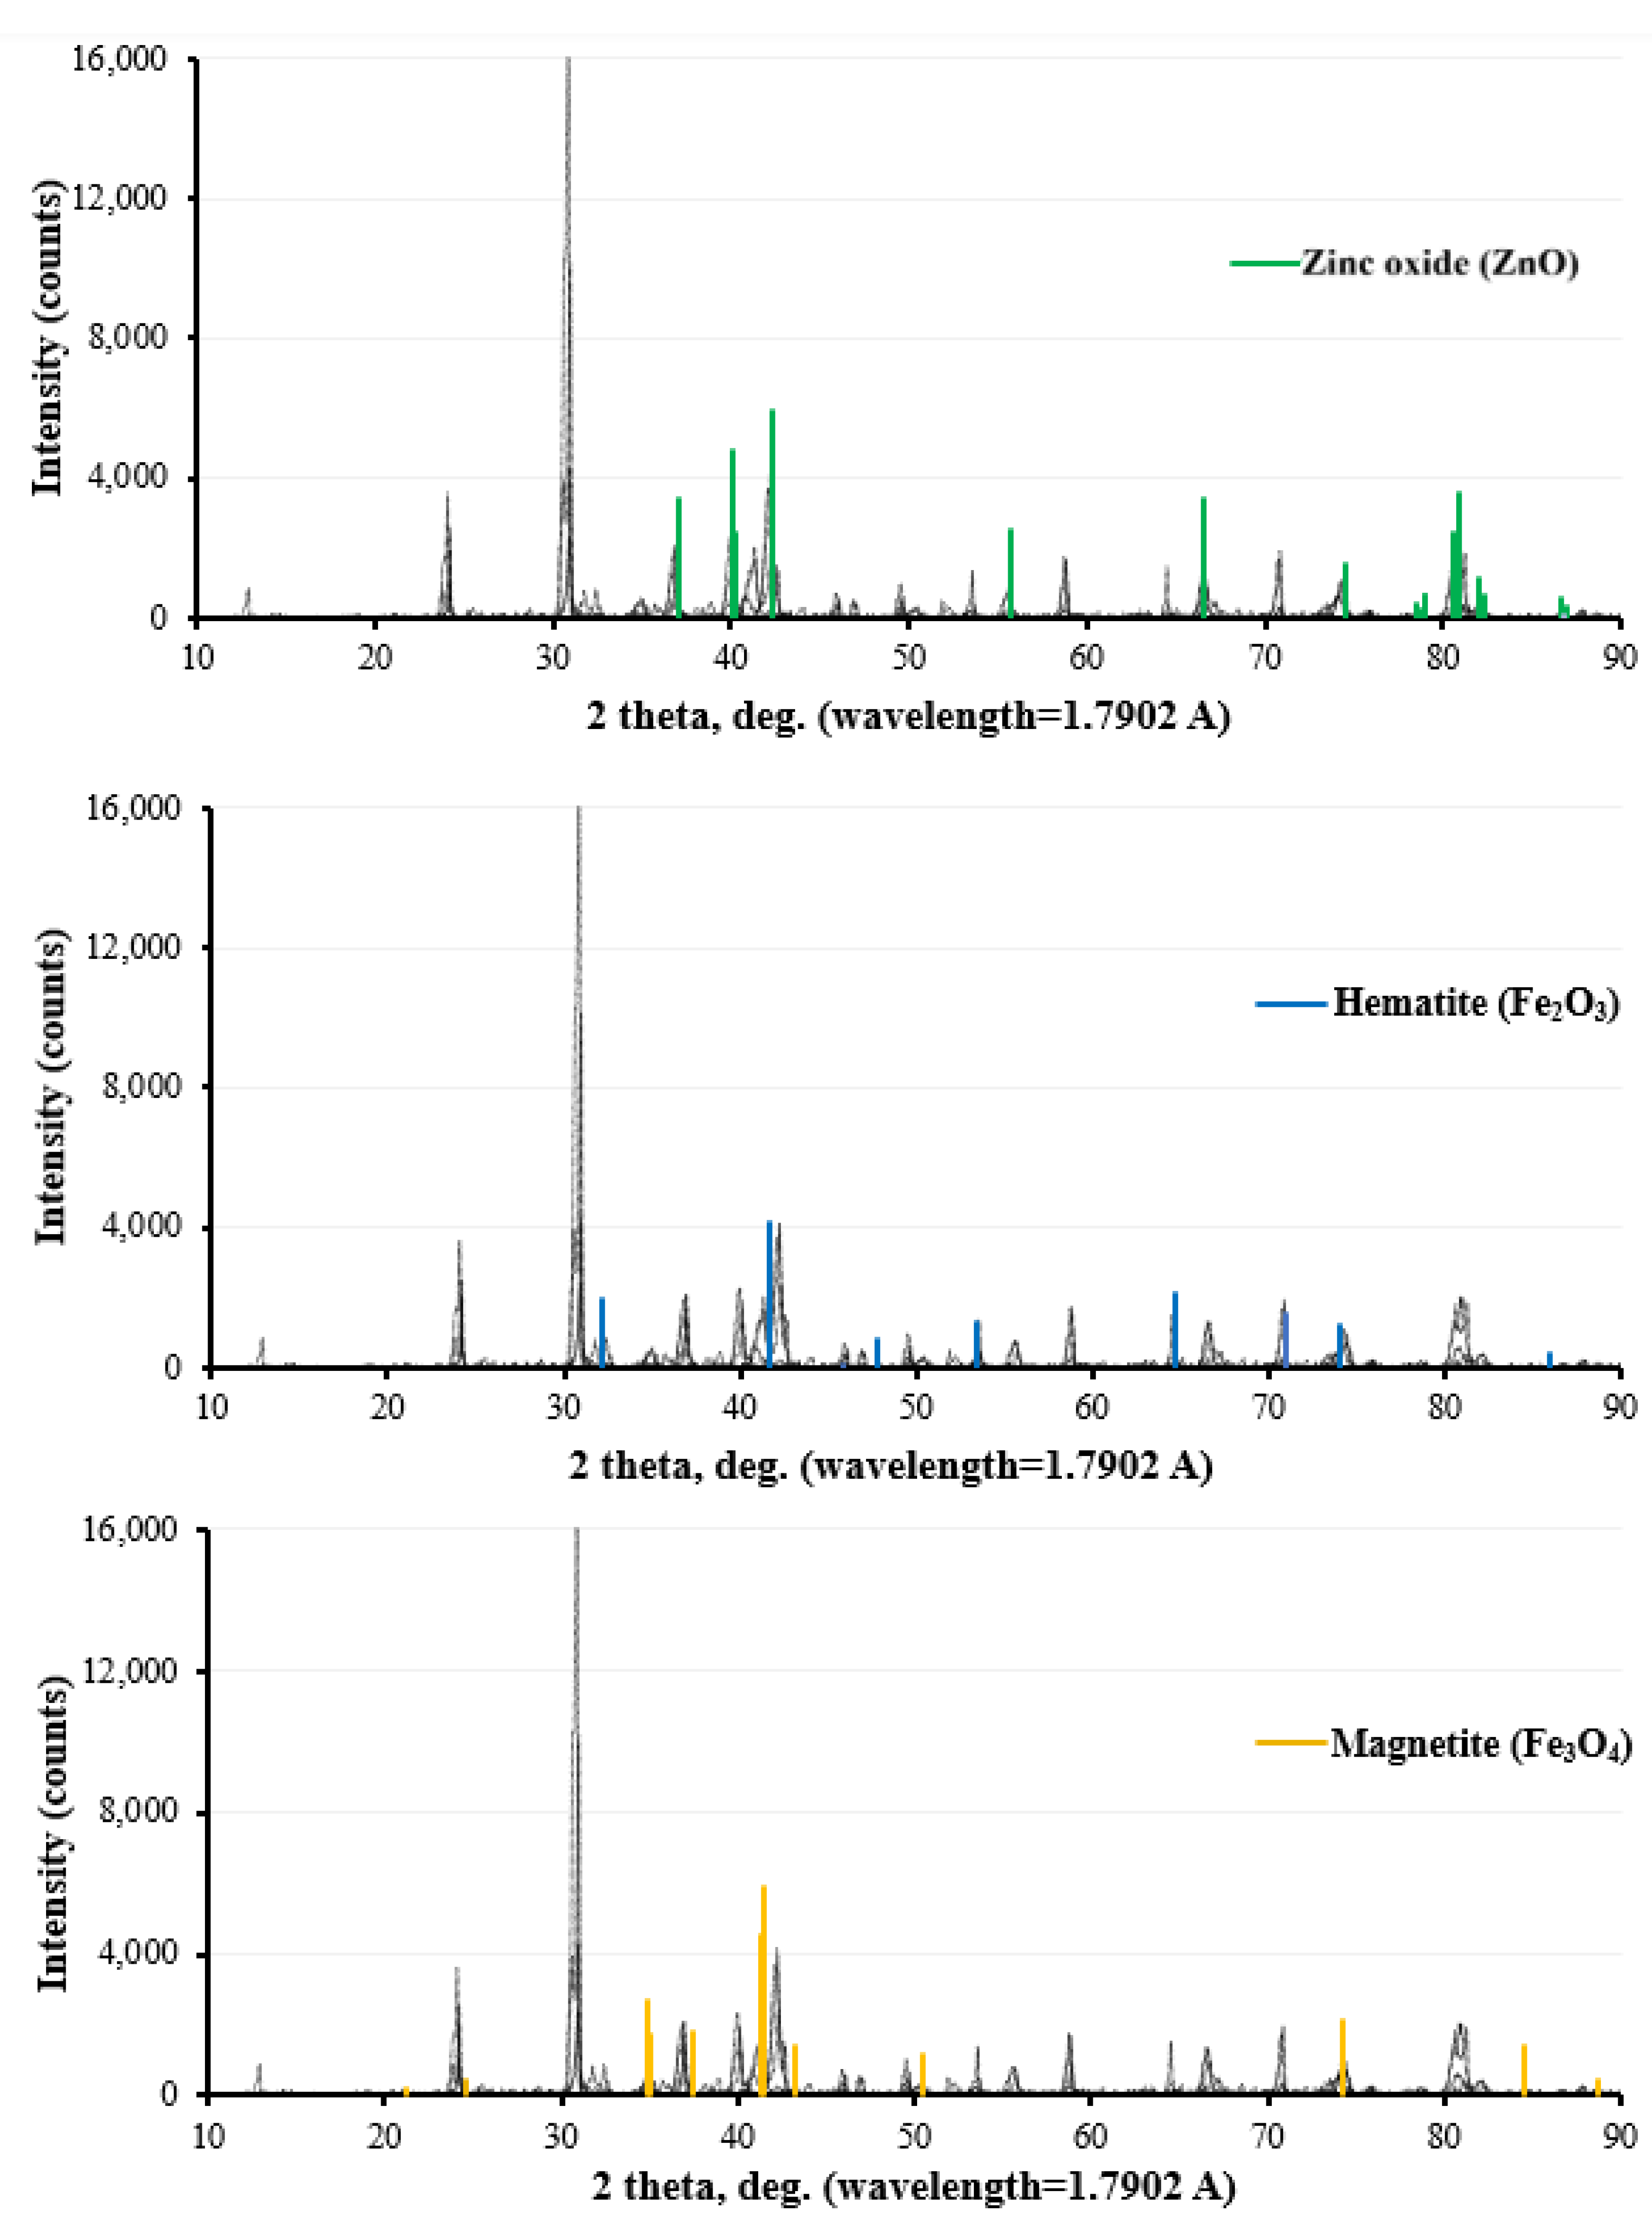
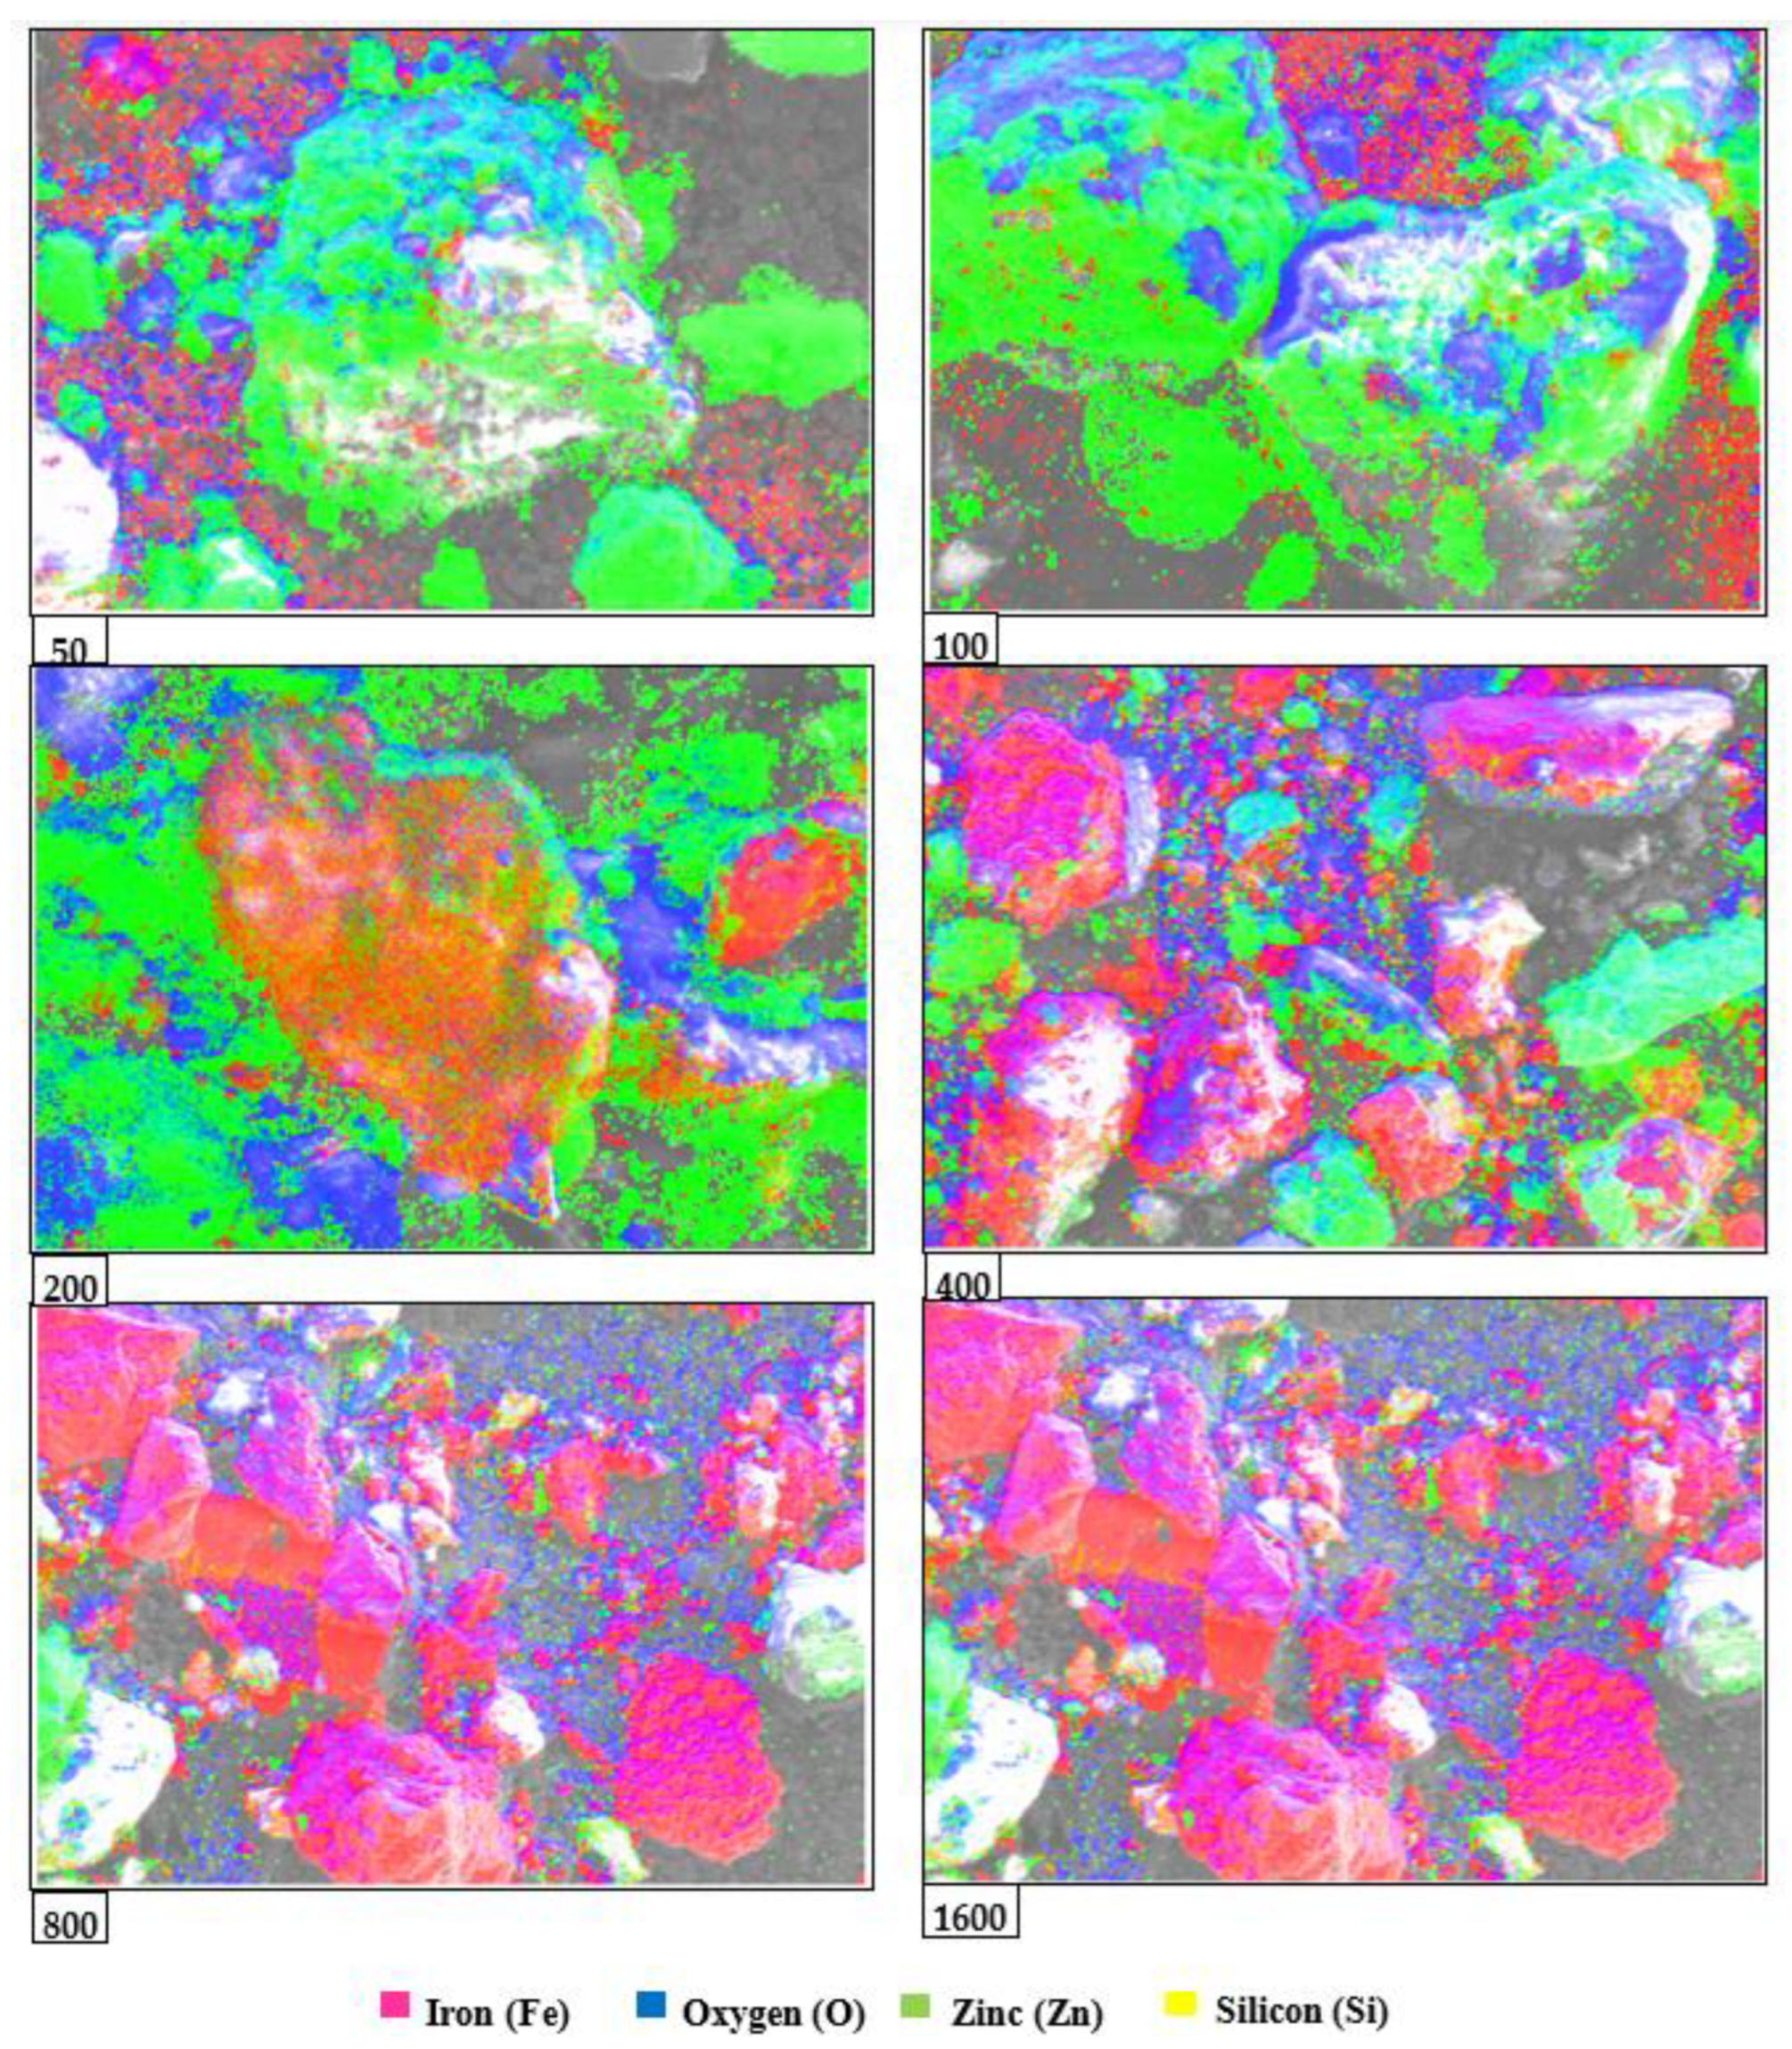
  • The analysis of the rust layers showed similar corrosion product morphologies for all of the galvanized steel coupons. The XRD analysis results included four main chemical compounds: zinc oxide, quartz, magnetite, and hematite; while the SEM analysis with EDS indicated major elements such as iron, oxygen, zinc, and silicon.
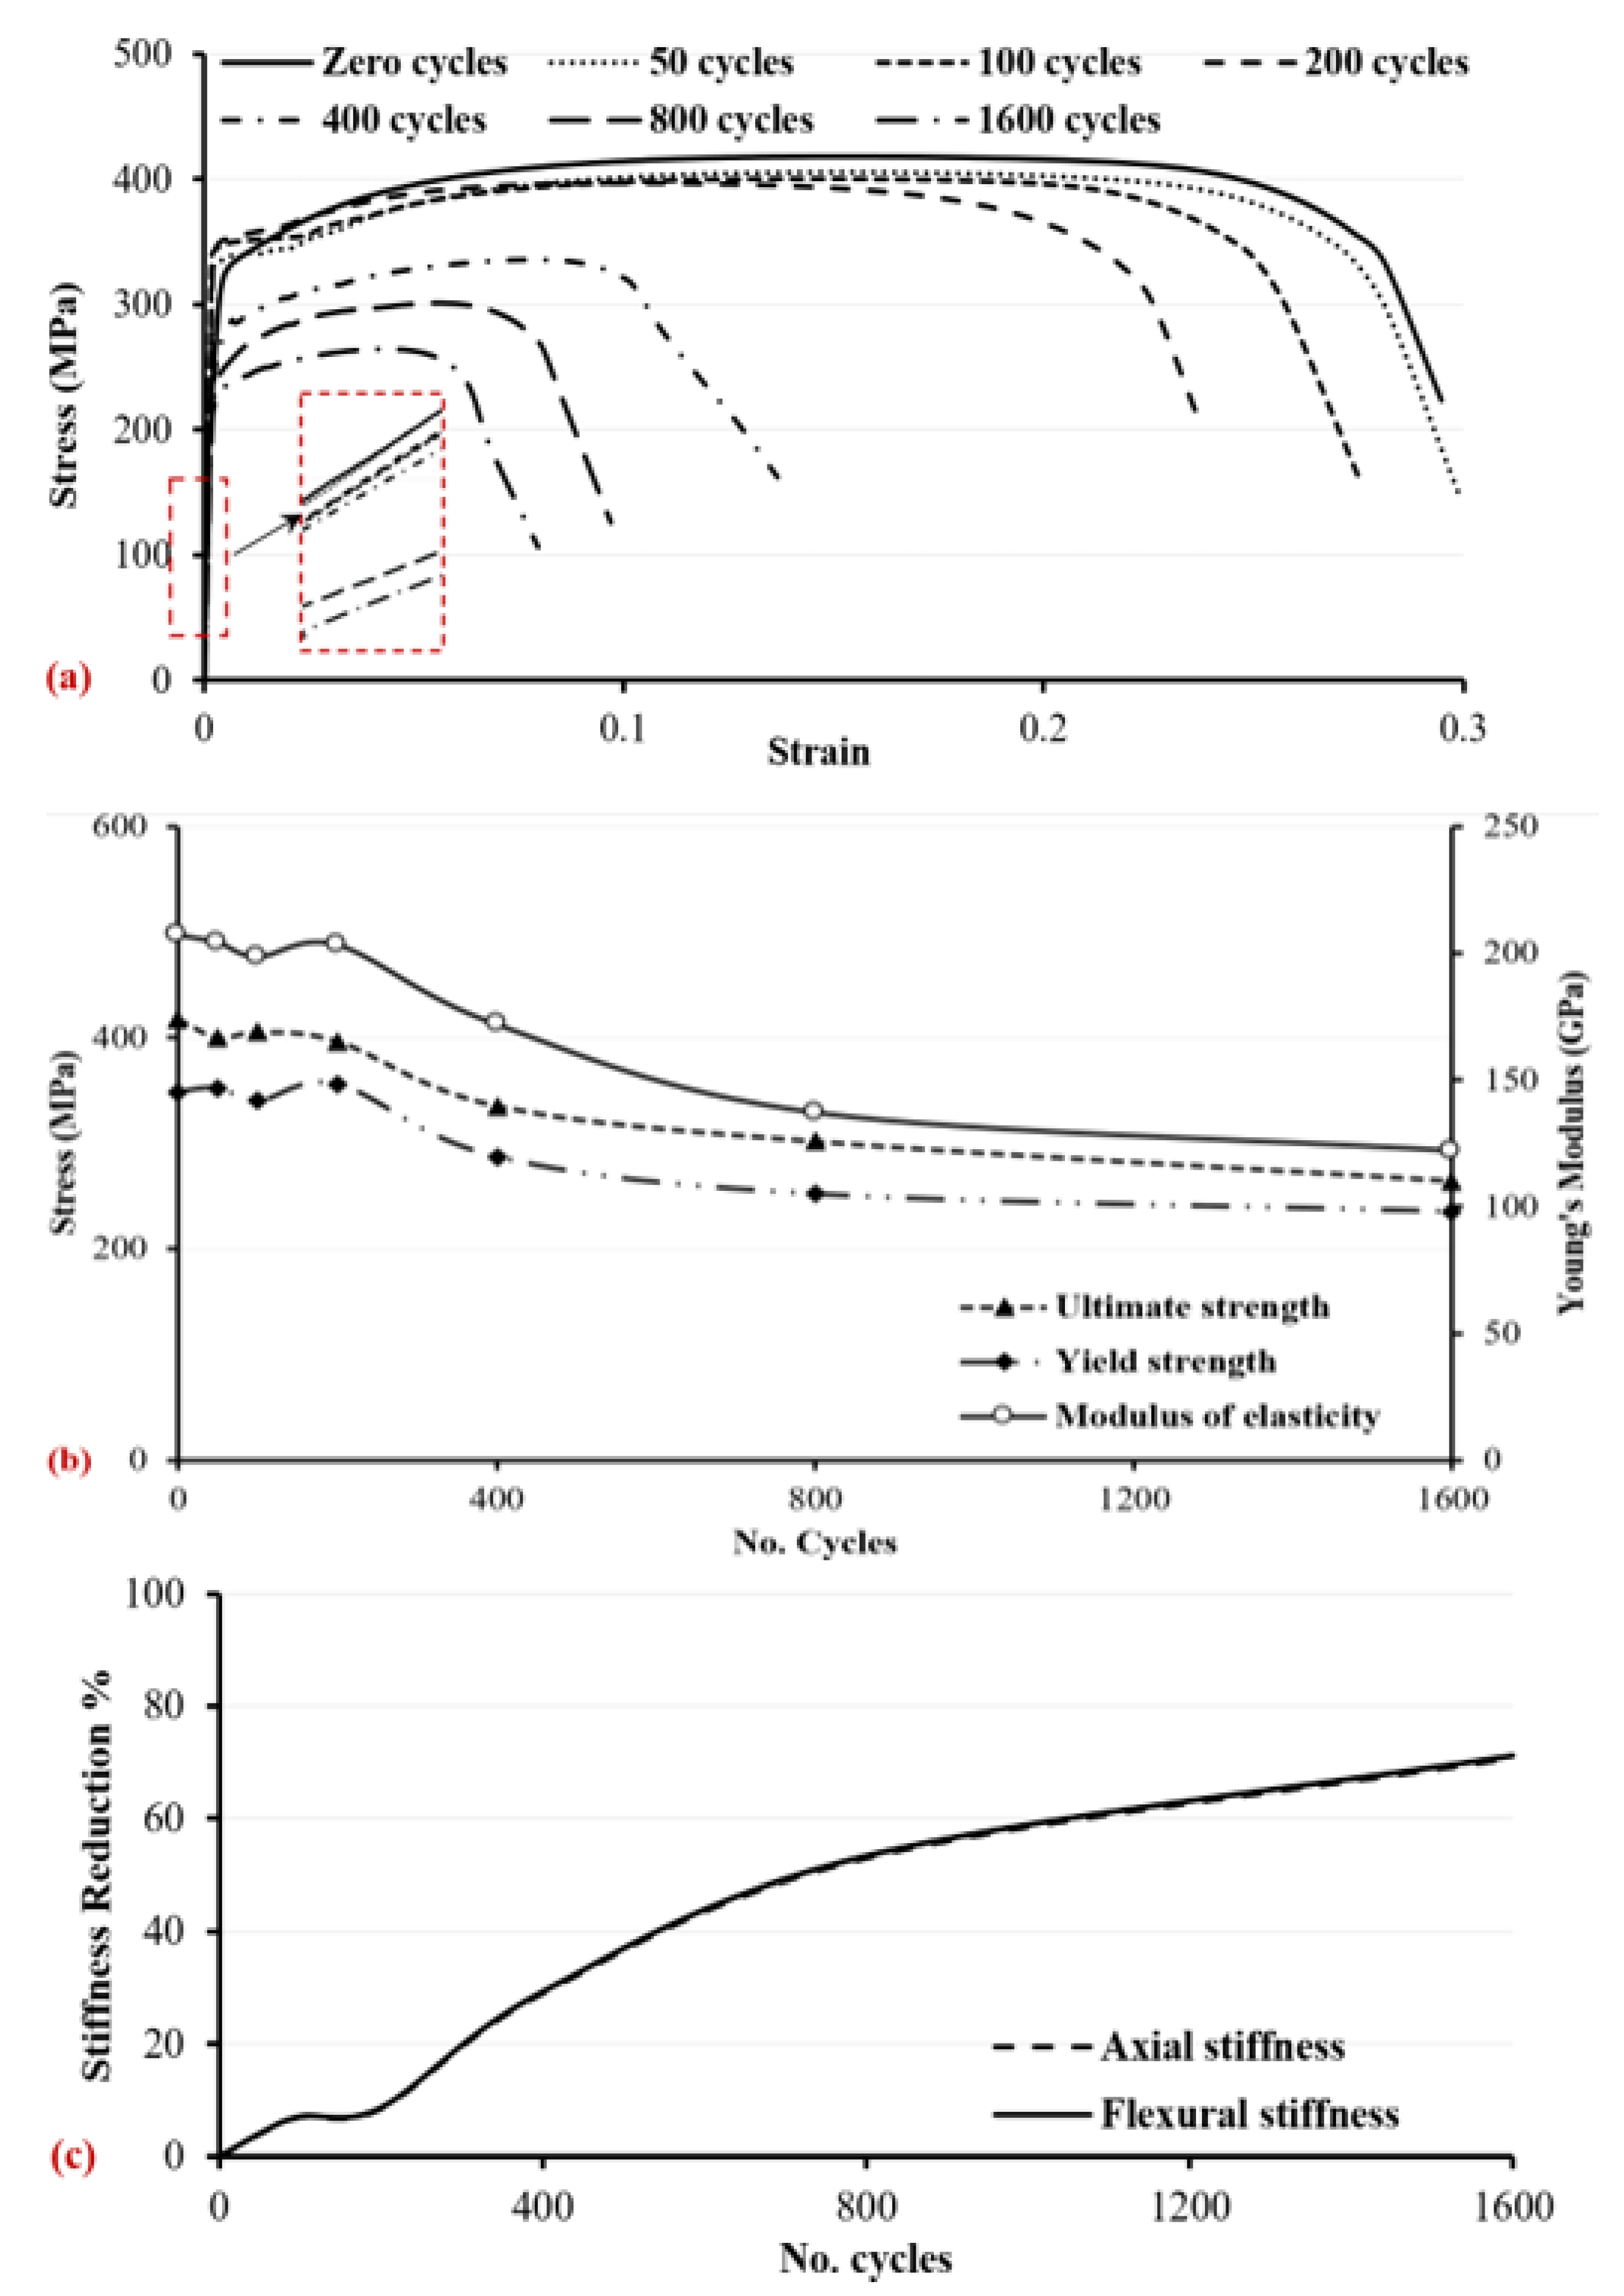
  • With regard to the mechanical properties of the corroded specimens, at a higher number of wetting/drying cycles, the tensile strengths, i.e., ultimate strength and yield strength, calculated based on the measured reduced cross-sectional area, hardness, and material ductility, decreased. The damage loss of the profile thickness and the deterioration of mechanical properties resulted in reduced axial stiffness and flexural stiffness, e.g., around 71% reductions corresponding to 1600 wetting/drying cycles, which weakened the loading capacity of the steel.
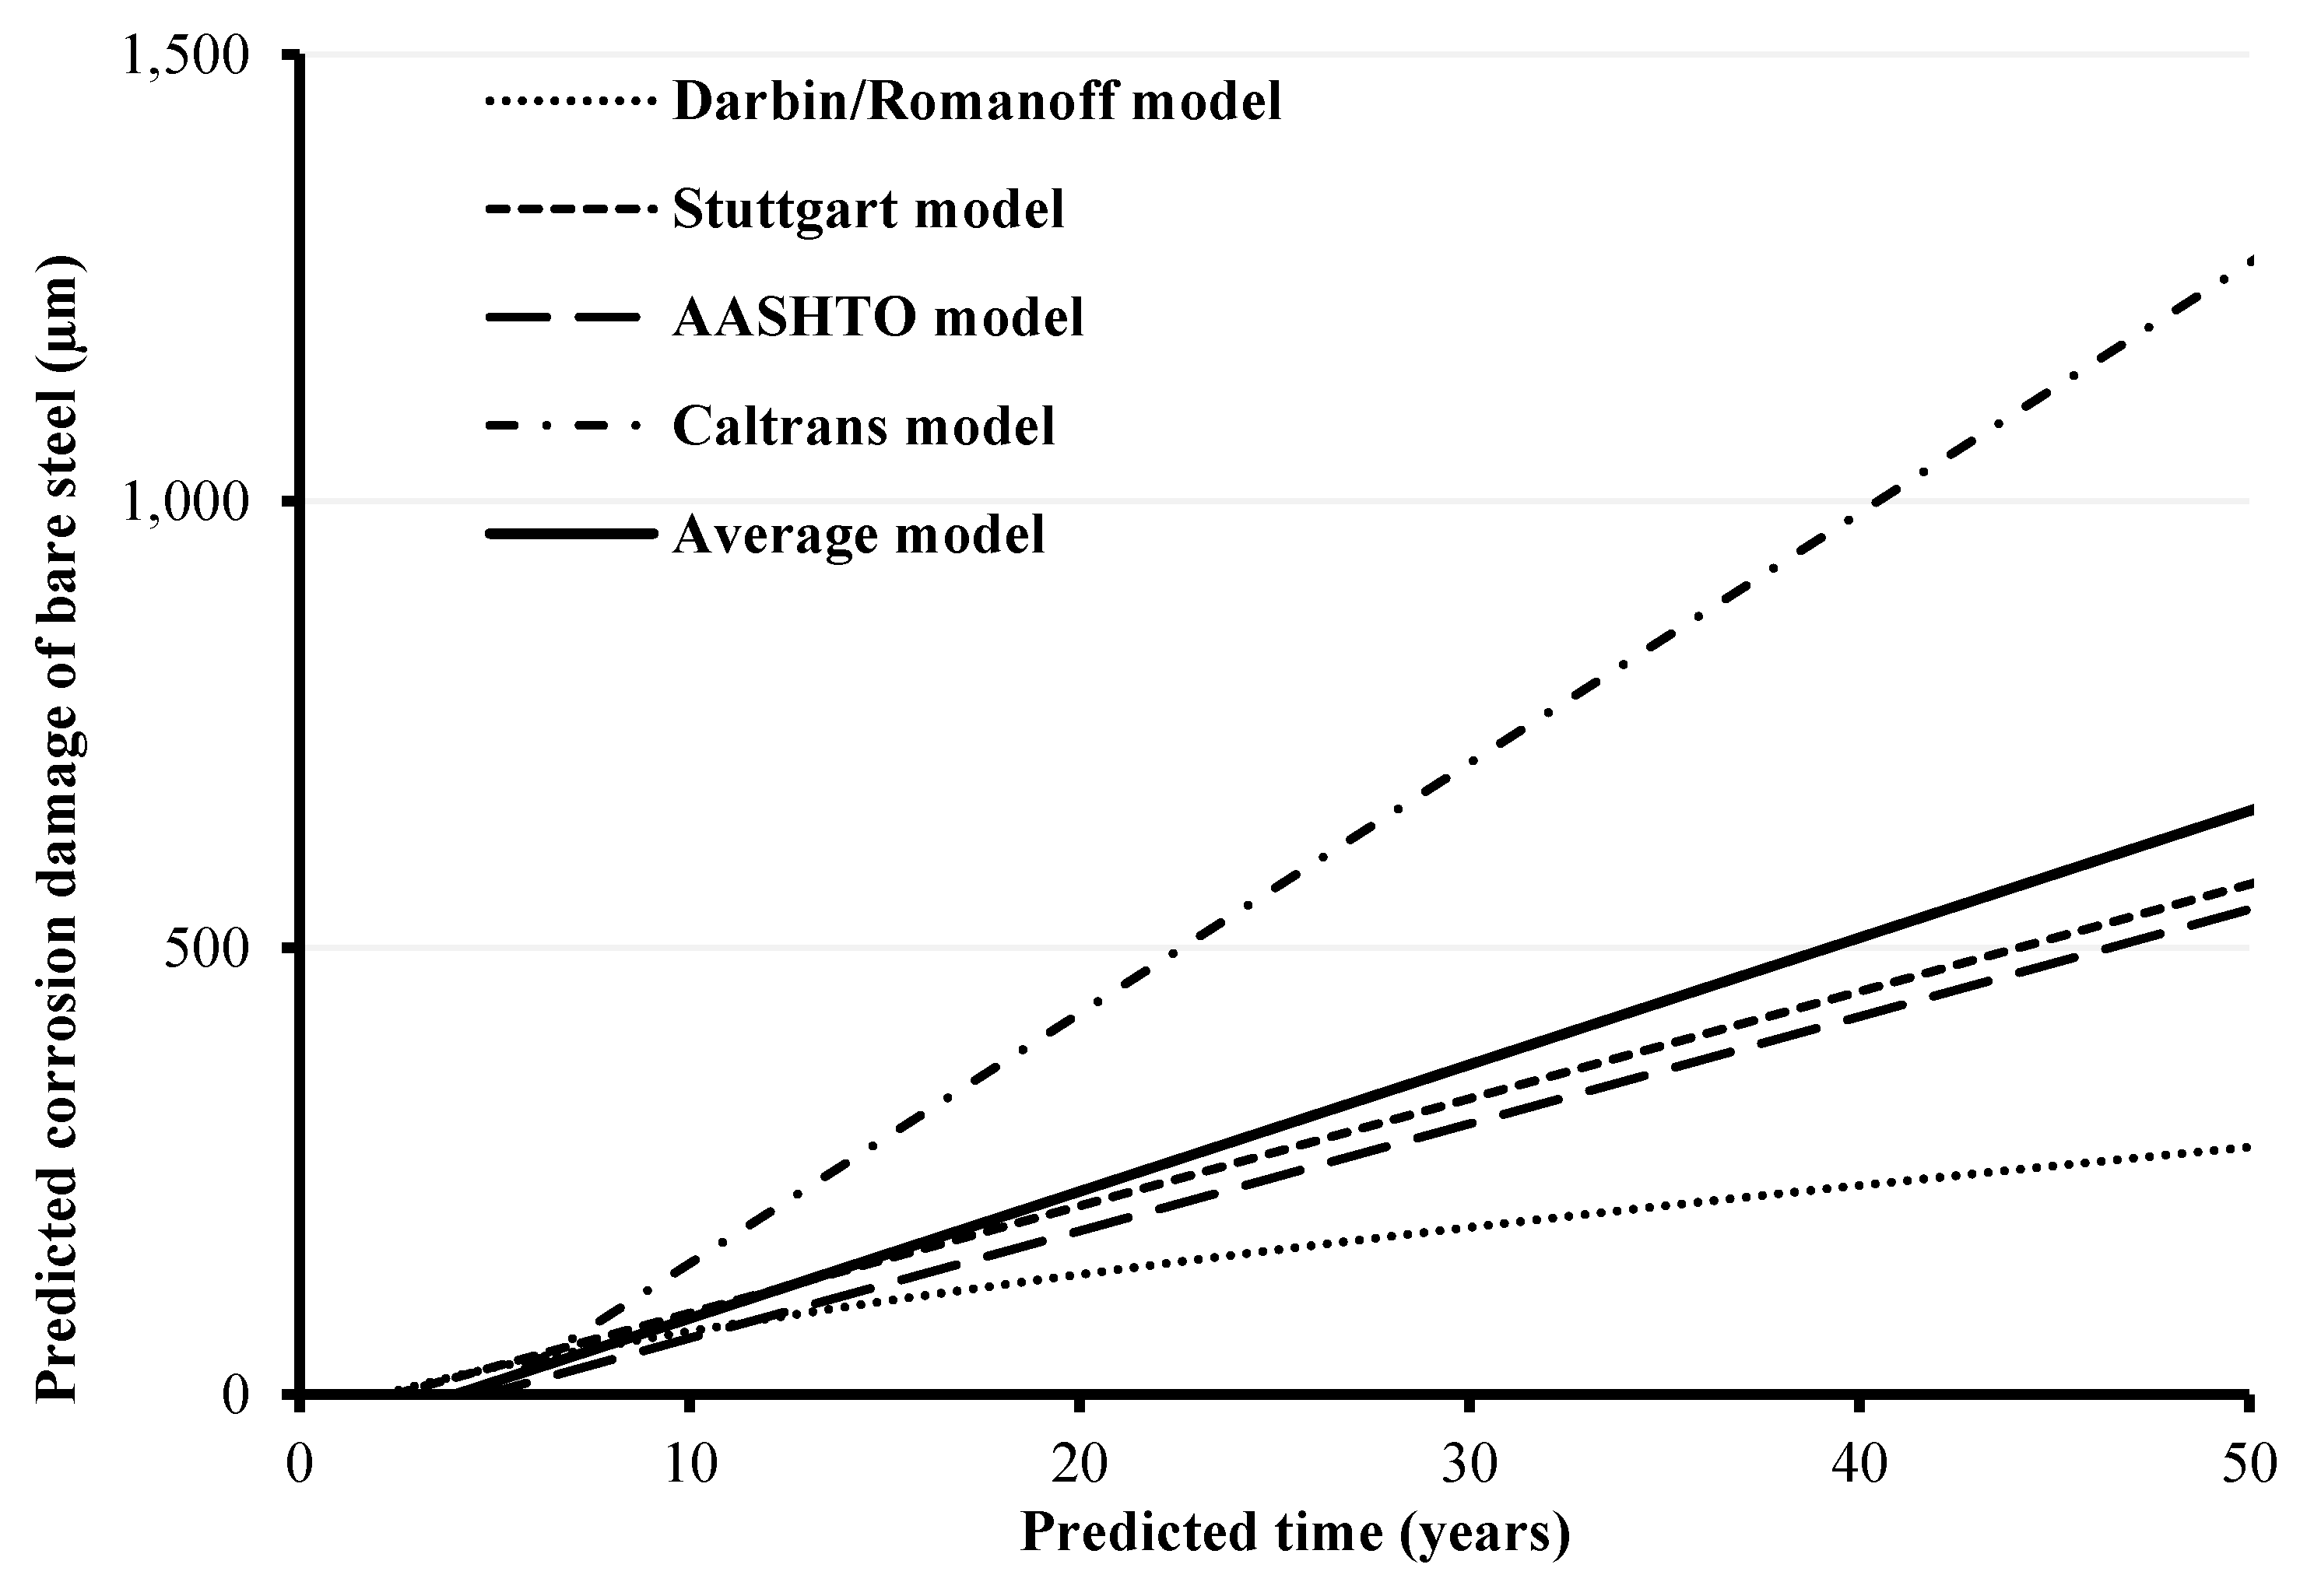
  • Lastly, a simplified approximate corrosion prediction model, based on average predictions of four standard mathematical models, was presented to predict the corrosion of the bare steel in the galvanized coupons. The model predicts the corrosion time in years, corresponding to the thickness loss of the bare steel in the galvanized coupons following the depletion of the zinc coating. For instance, the average predictions corresponding to the corrosion developed in the coupons subjected to 1600 wetting/drying cycles gave around 50 years including the zinc depletion time. However, for a safer design, it is recommended that the predicted corrosion time for bare steel only should be used (around 46 years in the case of the 1600-cycle coupons), without adding the time required for depletion of the zinc coating. This would provide a conservative estimate for the timing of potential future damage that could lead to failure due to deterioration of the steel. The objective is to facilitate the implementation of measures necessary for avoiding failure, by providing rehabilitation solutions for damaged structures, or full replacement in severe cases.

6. Future Works

The research on corrosion analysis and the accompanying damages is an important field that requires a detailed focus on various aspects to attain a close fit to real lifetime corrosion. Future works could be implemented to extend the objectives of the current research by considering the following subjects:
  • Investigating the influence of corrosion propagation on the performance of buried steel pipes and culverts;
  • Studying different rehabilitation measures to fix in-service deteriorated (damaged) steel structures;
  • Lastly, investigating the effects of applying the proposed accelerated corrosion tests on coated metal specimens to evaluate the painting process on the steel surface with different primers, e.g., epoxy polyamide primer, at variable thicknesses to obtain their potential resistance against corrosion.

Author Contributions

Conceptualization, H.E.N.; Data curation, I.E.; Investigation, I.E., H.E.N. and J.N.; Supervision, H.E.N. and J.N.; Writing—original draft, H.E.N. and I.E.; Writing—review & editing I.E., H.E.N. and J.N. All authors have read and agreed to the published version of the manuscript.

Funding

The authors acknowledge the funding provided by the Natural Sciences and Engineering Research Council of Canada (NSERC) and Nova Scotia Department of Public Works (NSDPW) for this research project.

Data Availability Statement

All data, models, and code generated or used during the study appear in the submitted article.

Conflicts of Interest

The authors declare that they have no known competing financial interests or personal relationships that could have appeared to influence the work reported in this paper.

References

  1. Liu, H.; Dai, Y.; Cheng, Y. Corrosion of underground pipelines in clay soil with varied soil layer thicknesses and aerations. Arab. J. Chem. 2020, 13, 3601–3614. [Google Scholar] [CrossRef]
  2. Wasim, M.; Li, C.; Robert, D.; Mahmoodian, M. Corrosion behaviour of pipes in soil and in simulated soil solution. In Proceedings of the Corrosion and Prevention Conference, Sydney, Australia, 12–15 November 2017; pp. 1–12. [Google Scholar]
  3. Ezzeldin, I.M.; El Naggar, H. Three-dimensional finite element modeling of corrugated metal pipes. Transp. Geotech. 2021, 27, 100467. [Google Scholar] [CrossRef]
  4. Ezzeldin, I.M.; El Naggar, H. Earth pressure distribution around flexible arch pipes. Eng. Struct. 2021, 237, 112226. [Google Scholar] [CrossRef]
  5. Wang, Y.; Wang, W.; Huang, J.; Luo, L. Effect of corrosion on soil-structure interfacial shearing property and bearing capacity of steel foundation in submarine soil environment. J. Comput. Geotech. 2023, 156, 105269. [Google Scholar] [CrossRef]
  6. Ezzeldin, I.M.; El Naggar, H.; Newhook, J.; Jarjoura, G. Accelerated wetting/drying corrosion test for buried corrugated mild steel. Case Stud. Constr. Mater. 2022, 17, e01152. [Google Scholar]
  7. Artigas, A.; Monsalve, A.; Sipos, K.; Bustos, O.; Mena, J.; Seco, R.; Garza-Montes-de-Oca, N. Development of accelerated wet–dry cycle corrosion test in marine environment for weathering steels. Corros. Eng. Sci. Technol. 2015, 50, 628–632. [Google Scholar] [CrossRef]
  8. Zhang, X.G. Corrosion and Electrochemistry of Zinc; Plenum Press: New York, NY, USA, 1996; pp. 183–213. [Google Scholar]
  9. Wasim, M.; Shoaib, S.; Mubarak, N.; Asiri, A.I. Factors influencing corrosion of metal pipes in soils. Environ. Chem. Lett. 2018, 16, 861–879. [Google Scholar] [CrossRef]
  10. El-Shamy, A.M.; Shehata, M.F.; Metwally, H.I.M.; Melegy, A. Corrosion and corrosion inhibition of steel pipeline in montmorillonitic soil filling material. Silicon J. 2018, 10, 2809–2815. [Google Scholar] [CrossRef]
  11. Wang, W.; Yang, W.; Shi, W.; Li, C. Modeling of corrosion pit growth for buried pipeline considering spatial and temporal variability. ASCE J. Eng. Mech. 2021, 147, 04021065. [Google Scholar] [CrossRef]
  12. Kim, C.; Chen, L.; Wang, H.; Castaneda, C. Global and local parameters for characterizing and modeling external corrosion in underground coated steel pipelines: A review of critical factors. J. Pipeline Sci. Eng. 2021, 1, 17–35. [Google Scholar] [CrossRef]
  13. Arriba-Rodriguez, L.; Ortega-Fernandez, F.; Villanueva-Balsera, J.; Rodriguez-Montequin, V. Corrosion predictive model in hot-dip galvanized steel buried in soil. Hindawi Complex. 2021, 2021, 9275779. [Google Scholar] [CrossRef]
  14. Bao, J.; Zhou, W. A random field model of external metal-loss corrosion on buried pipelines. J. Struct. Saf. 2021, 91, 102095. [Google Scholar] [CrossRef]
  15. Velázquez Altamirano, J.C. Modelación Estadística de Crecimiento de Picaduras en Tuberías Enterradas. Master’s Thesis, ESIQUIE, IPN, Ciudad de México, Mexico, 2006. [Google Scholar]
  16. Denison, I.A.; Romanoff, M. Corrosion of galvanized steels in soils. J. Res. Natl. Bur. Stand 1952, 49, 299–314. [Google Scholar] [CrossRef]
  17. Romanoff, M. Underground Corrosion; National Bureau of Standards, Circular 579; US Government Printing Office: Washington, DC, USA, 1957.
  18. Manning, P.E.; Duquette, D.J.; Savage, W.F. The role of sulfide inclusion morphology in pit initiation of several type 300 series stainless steels. Corrosion 1980, 36, 313–319. [Google Scholar] [CrossRef]
  19. Xia, D.; Deng, C.; Macdonald, D.; Jamali, S.; Mills, D.; Luo, J.; Strebl, M.G.; Amiri, M.; Jin, W.; Song, S.; et al. Electrochemical measurements used for assessment of corrosion and protection of metallic materials in the field: A critical review. J. Mater. Sci. Technol. 2022, 112, 151–183. [Google Scholar] [CrossRef]
  20. Shi, X.; Zhou, G.; Muthumani, A. Corrosion of metals exposed to 25% magnesium chloride solution and tensile stress: Field and laboratory studies. J. Case Stud. Constr. Mater. 2017, 7, 1–14. [Google Scholar] [CrossRef]
  21. Liu, M.; Cheng, X.; Li, X.; Hu, J.; Pan, Y.; Jin, Z. Indoor accelerated corrosion test and marine field test of corrosion-resistant low-alloy steel rebars. J. Case Stud. Constr. Mater. 2016, 5, 87–99. [Google Scholar] [CrossRef]
  22. Calero, J.; Alcantara, J.; Chico, B.; Diaz, I.; Simancas, J.; Fuente, D.; Morcillo, M. Wet/dry accelerated laboratory test to simulate the formation of multilayered rust on carbon steel in marine atmospheres. Corros. Eng. Sci. Technol. 2017, 52, 178–187. [Google Scholar] [CrossRef]
  23. Qian, S.; Cheng, Y.F. Accelerated corrosion of pipeline steel and reduced cathodic protection effectiveness under direct current interference. J. Constr. Build. Mater. 2017, 148, 675–685. [Google Scholar] [CrossRef]
  24. Suzumura, K.; Nakamurs, S. Environmental factors affecting corrosion of galvanized steel wires. J. Mater. Civ. Eng. 2004, 16, 1–7. [Google Scholar] [CrossRef]
  25. Lambert, M.R.; Townsend, H.E.; Hart, R.G.; Frydrych, D.J. Accelerated Corrosion Tests of Precoated Sheet Steels for Automobiles. Ind. Eng. Chem. Prod. Res. Dev. 1985, 24, 378–384. [Google Scholar] [CrossRef]
  26. Lyon, S.B.; Thompson, G.E.; Johnson, J.B.; Wood, G.C.; Ferguson, J.M. Accelerated Atmospheric Corrosion Testing Using a Cyclic Wetting/drying Exposure Test: Aluminum, Galvanized Steel, and Steel. Natl. Assoc. Corros. Eng. 1987, 43, 719–726. [Google Scholar]
  27. Itoh, Y.; Kim, I. Accelerated cyclic corrosion testing of structural steels and its application to assess steel bridge coatings. Anti-Corros. Methods Mater. 2006, 53, 374–381. [Google Scholar] [CrossRef]
  28. Fishman, K.L.; Withiam, J.L. LRFD Metal Loss and Service-Life Strength Reduction Factors for Metal-Reinforced Systems; National Cooperative Highway Research Program (NCHRP), Report No. 675; Transportation Research Board: Washington, DC, USA, 2011. [Google Scholar]
  29. CAN/CSA-G401; Corrugated Steel Pipe Products. Canadian Standards Association (CSA): Mississauga, ON, Canada, 2014.
  30. CAN/CSA-S6-14; Canadian Highway Bridge Design Code. Canadian Standards Association (CSA): Mississauga, ON, Canada, 2014.
  31. ASTM G1-03; Standard Practice for Preparing, Cleaning, and Evaluating Corrosion Test Specimens. ASTM International: West Conshohocken, PA, USA, 2003.
  32. ASTM G1-03(2017); Standard Practice for Preparing, Cleaning, and Evaluating Corrosion Test Specimens. ASTM International: West Conshohocken, PA, USA, 2017.
  33. ASTM A370-17a; Standard Test Methods and Definitions for Mechanical Testing of Steel Products. ASTM International: West Conshohocken, PA, USA, 2017.
  34. ASTM E8/E8M-21; Standard Test Methods for Tension Testing of Metallic Materials. ASTM International: West Conshohocken, PA, USA, 2021.
  35. ASTM E18-20; Standard Test Methods for Rockwell Hardness of Metallic Materials. ASTM International: West Conshohocken, PA, USA, 2020.
  36. ASTM B695-21; Standard Specification for Coatings of Zinc Mechanically Deposited on Iron and Steel. ASTM International: West Conshohocken, PA, USA, 2021.
  37. Sabzi, M.; Dezfuli, S.M.; Asadian, M.; Tafi, A.; Mahaab, A. Study of the effect of temperature on corrosion behavior of galvanized steel in seawater environment by using potentiodynamic polarization and EIS methods. Mater. Res. Express 2019, 6, 076508. [Google Scholar] [CrossRef]
  38. Cox, G.L. Effect of Temperature on the Corrosion of Zinc; Research Laboratory of Applied Chemistry, Department of Chemical Engineering, Massachusetts Institute of Technology: Cambridge, MA, USA, 1931; Volume 23, pp. 902–904. [Google Scholar]
  39. GM9540P; General Motors Engineering Standards, Materials and Processes-Procedures. Accelerated Corrosion Test: Detroit, MI, USA, 1997.
  40. Hiroshi, K.; Sakae, F.; Masaeu, S. New Accelerated Corrosion Test “ACTE” for Zinc-Coated Steel Sheets Used in Electrical Appliances; JFE Technical Report No. 12; JFE: Tokyo, Japan, 2006; pp. 36–41. [Google Scholar]
  41. Meade, C.L. Accelerated Corrosion Testing; National Exposure Testing: Sylvania, OH, USA, 1999; pp. 526–531. [Google Scholar]
  42. Song, Y.; Jiang, G.; Chen, Y. Effects of chloride ions on corrosion of ductile iron and carbon steel in soil environments. Sci. Rep. 2017, 7, 6865. [Google Scholar] [CrossRef] [PubMed]
  43. Persson, D.; Thierry, D.; Karlsson, O. Corrosion and corrosion products of hot dipped galvanized steel during long term atmospheric exposure at different sites world-wide. Corros. Sci. 2017, 126, 152–165. [Google Scholar] [CrossRef]
  44. Cachet, C.; Ganne, F.; Maurin, G.; Petitjean, J.; Vivier, V.; Wiart, R. EIS investigation of zinc dissolution in aerated sulfate medium. Part I: Bulk zinc. Electrochem Acta 2001, 47, 509–518. [Google Scholar] [CrossRef]
  45. Sun, H.; Liu, S.; Sun, L. A comparative study on the corrosion of galvanized steel under simulated rust layer solution with and without 3.5wt%NaCl. Int. J. Electrochem. Sci. 2013, 8, 3494–3509. [Google Scholar] [CrossRef]
  46. Pojtanabuntoeng, K.; Machuca, L.; Salasi, M.; Kinsella, B.; Cooper, M. New experimental rig to investigate corrosion under insulation at different climate conditions. Corros. Mater. 2015, 40, 46–51. [Google Scholar]
  47. Rana, A.R.K.; Yang, M.; Umer, J.; Veret, T.; Brigham, G. Influence of robust drain openings and insulation standoffs on corrosion under insulation behavior of carbon steel. Corros. J. 2021, 77, 681–692. [Google Scholar] [CrossRef]
  48. Saad-Eldeen, S.; Garbatov, Y.; Guedes Soares, C. Effect of corrosion severity on the ultimate strength of a steel box girder. Eng. Struct. 2013, 49, 560–571. [Google Scholar] [CrossRef]
  49. Nikoloy, N.; Marcheva, Y.; Tsonev, V. Methods for preparation of corroded steel specimens for mechanical testing. MATEC Web Conf. 2019, 287, 07004. [Google Scholar] [CrossRef]
  50. Lee, H.; Cho, Y. Evaluation of the mechanical properties of steel reinforcement embedded in concrete specimen as a function of the degree of reinforcement corrosion. Int. J. Fract. 2009, 157, 81–88. [Google Scholar] [CrossRef]
  51. Hou, Y.; Lei, D.; Li, S.; Yang, W.; Li, C.-Q. Experimental investigation on corrosion effect on mechanical properties of buried metal pipes. Int. J. Corros. 2016, 2016, 5808372. [Google Scholar] [CrossRef]
  52. Cárdenas-Arias, C.; Rincón-Quintero, A.D.; Santos-Jaimes, A.; Sandoval Rodriguez, C.L.; Rojas-Gomez, D.; Ardila-Galvis, S.J. Elasticity modulus variation of the AISI SAE 1045 steel exposed to corrosion process by chloride using tension test destructive. IOP Conf. Ser. Mater. Sci. Eng. 2020, 844, 012059. [Google Scholar] [CrossRef]
  53. Kim, H.; Tae, S.; Lee, H.; Lee, S.; Noguchi, T. Evaluation of mechanical performance of corroded reinforcement considering the surface shape. ISIJ Int. 2009, 49, 1392–1400. [Google Scholar] [CrossRef]
  54. Chen, B.Q.; Garbatov, Y.; Guedes Soares, C. Mechanical properties assessment of specimens subjected to random non-uniform general corrosion and tensile load. In Maritime Engineering and Technology; Soares, C.G., Garbatov, Y., Sutulo, S., Santos, T.A., Eds.; Taylor & Francis Group: London, UK, 2012; ISBN 978-0-415-62146-5. [Google Scholar]
  55. Jurisic, P.; Parnuov, J. Influence of corrosion-related degradation of mechanical properties of shipbuilding steel on collapse strength of plates and stiffened panels. In Towards Green Marine Technology and Transport; Soares, C.G., Dejhalla, R., Pavletic, D., Eds.; Taylor & Francis Group: London, UK, 2015; ISBN 978-1-138-02887-6. [Google Scholar]
  56. Yu, H.; Zeng, X.; Ma, H.; Yue, P. Evolution law of reinforcement corrosion and mechanical properties under the conditions of basic magnesium sulfate cement concrete. KSCE J. Civ. Eng. 2022, 26, 4697–4708. [Google Scholar] [CrossRef]
Figure 1. Schematic layout of the experimental setup proposed for the cyclic accelerated wetting/drying corrosion test [6].
Buildings 14 01079 g001
Figure 2. Grain size distribution (GSD) curve of the utilized cohesionless sandy soil.
Buildings 14 01079 g002
Figure 3. Coupons exposed to accumulative wetting/drying cycles: (a) before and (b) after rust removal.
Buildings 14 01079 g003
Figure 4. Tensile strength specimens (i.e., dog-bone-shaped) cut from the candidate coupons exposed to accumulative wetting/drying cycles.
Buildings 14 01079 g004
Figure 5. The 3D (left) with L:W:H aspect ratio = 1:1:2, and 2D (right) surface topography of galvanized steel coupons exposed to accumulative wetting/drying cycles, with magnification 480×.
Buildings 14 01079 g005aBuildings 14 01079 g005b
Figure 6. X-ray diffraction (XRD) patterns (intensity) indicating corrosion products propagated on the candidate corroded galvanized steel coupons.
Buildings 14 01079 g006aBuildings 14 01079 g006b
Figure 7. Scanning electron microscope (SEM) micrograph mapping of corrosion product elements found on coupons exposed to accumulative wetting/drying cycles, with magnification 200×.
Buildings 14 01079 g007
Figure 8. (a) Average corrosion damages in galvanized and mild [6] steel coupons, and (b) corrosion rates for the galvanized steel coupons.
Buildings 14 01079 g008
Figure 9. (a) Tensile stress–strain curves, (b) ultimate strength, yield strength, and elastic modulus, and (c) reduction (%) in the axial stiffness and flexural stiffness for the galvanized steel coupons.
Buildings 14 01079 g009
Figure 10. Rockwell hardness HRE scale readings for the galvanized steel coupons exposed to 0 (intact), 50, 100, 200, 400, 800, and 1600 wetting/drying cycles.
Buildings 14 01079 g010
Figure 11. Corrosion damage predictions for the bare steel in the galvanized coupons.
Buildings 14 01079 g011
Figure 12. Theoretical corrosion prediction times corresponding to the reduction in 1.5 mm nominal steel thickness (%).
Buildings 14 01079 g012
Table 1. The chemical composition of the bare steel material in the corrugated coupons.
FeCMnPS
~0.990.1–0.150.5–0.60.080.05
Table 2. Surface roughness: maximum pit depths (Sv) and maximum surface heights (Sz).
Number of Wetting/Drying Cycles0501002004008001600
Maximum pit depth (Sv, µm)7.021.725.033.867.781.6125.3
Maximum surface height (Sz, µm)22.060.657.970.7139.8229.0680.5
Table 3. Results of the tensile strength tests on the intact and corroded coupons.
No. CyclesSampleElastic Modulus (GPa)Ultimate Strength (MPa)Yield Strength (MPa)
01201407331
2205415343
3212432365
4208418355
Mean207418349
Standard Deviation4913
501202394351
2198397342
3206407352
4208401361
Mean204400352
Standard Deviation457
1001204397342
2194410332
3201405343
4192408341
Mean198405340
Standard Deviation554
2001199394355
2205395356
3211411362
4197389349
Mean203397356
Standard Deviation585
4001160324274
2172336292
3182332282
4175352301
Mean172336287
Standard Deviation81010
8001137304258
2129312260
3139289238
4144304251
Mean137302252
Standard Deviation589
16001122264235
2110248224
3135281245
Mean122264235
Standard Deviation10139
Table 4. Comparison between the mild steel coupons and galvanized steel coupons based on the reductions (%) in the nominal thickness, axial stiffness, and flexural stiffness.
Galvanized Steel CouponsMild Steel Coupons
No. CyclesCorrosion Damage (%)Axial Stiffness (%)Flexural Stiffness (%)Corrosion Damage (%)Axial Stiffness (%)Flexural Stiffness (%)
500.94.04.14.910.713.8
1001.67.07.18.018.322.0
2004.18.58.712.829.132.4
40012.629.029.322.343.145.8
80026.352.953.337.572.874.1
160049.070.771.1---
Table 5. Corrosion of steel in terms of corrosion damage per side (total steel with zinc coating, zinc coating, and bare steel without zinc coating) and reduction in the nominal total steel thickness, for galvanized steel coupons exposed to 0, 50, 100, 200, 400, 800, and 1600 wetting/drying cycles, related to the predicted corrosion times in years.
Wetting/drying accelerated test (cycles)0501002004008001600
Corrosion damage of total steel (with 41 µm zinc coating) (µm)012.826.358.5179.6367.8691.4
Corrosion damage of zinc coating (41 µm thickness)012.826.341414141
Corrosion damage of bare steel (without 41 µm zinc coating) (µm)00017.5138.6326.8650.4
Reduction in nominal steel thickness (zinc coating + bare steel) (%)00.91.634.1312.6326.349
Predicted time corresponding to corrosion damage of steel (zinc coating + bare steel) (years) *01.252.575.213.82749.8
* The total zinc depletion time can be taken as approximately 4 years, based on the average prediction model shown in Equation (22) and Figure 11.
Disclaimer/Publisher’s Note: The statements, opinions and data contained in all publications are solely those of the individual author(s) and contributor(s) and not of MDPI and/or the editor(s). MDPI and/or the editor(s) disclaim responsibility for any injury to people or property resulting from any ideas, methods, instructions or products referred to in the content.

