Article

Synergy in Action: Integrating Environmental Monitoring, Energy Efficiency, and IoT for Safer Shared Buildings

by
Alessandro Franco
1,*,
Emanuele Crisostomi
1,
Stefano Dalmiani
2 and
Roberta Poletti
2
1
Department of Energy, Systems, Territory and Constructions Engineering, University of Pisa, Largo Lucio Lazzarino, 56126 Pisa, Italy
2
Fondazione Toscana Gabriele Monasterio, Via Moruzzi 1, 56100 Pisa, Italy
*
Author to whom correspondence should be addressed.
Buildings 2024, 14(4), 1077; https://doi.org/10.3390/buildings14041077
Submission received: 15 March 2024 / Revised: 3 April 2024 / Accepted: 10 April 2024 / Published: 12 April 2024

Abstract

:
Shared public buildings have become centers of innovation, integrating advanced technologies to meet evolving societal needs. With a heightened emphasis on occupants’ health and well-being, these buildings serve as hubs for technological convergence, facilitating seamless connectivity and intelligent data analysis and management. Within this context, environmental monitoring emerges as a foundational element, pivotal to all aspects of building management. This article provides findings from the nationally funded RE-START project, which focuses on shared public buildings, with special regard to educational and medical facilities. The project explores enhanced indoor air quality monitoring, focusing on CO2 concentration that is directly correlated with occupancy, as a fundamental element for developing health and safety protocols, energy efficiency strategies, the integration of smart building technologies, and data-driven energy management. The intersection of environmental monitoring, energy efficiency, security, and IoT technologies in in indoor spaces is relevant. The outcomes of the study reveal the delicate nature of all the involved components, which need to be carefully developed in an integrated manner.

1. Introduction

1.1. Background and Motivation

In today’s urban landscape, shared public buildings have evolved into hubs of innovation, blending advanced technologies with evolving societal needs. From environmental monitoring and energy efficiency to security and access control, these spaces have become focal points for integrating diverse technological solutions. With the rise of digital technologies and heightened emphasis on occupants’ health and well-being, these buildings have emerged as centers of technological convergence. Leveraging internet technologies, they facilitate instant information sharing and streamlined coordination, epitomizing our commitment to shaping a sustainable and cutting-edge future: environmental monitoring stands as the foundational keystone, pivotal to all aspects.
This paper describes part of the work developed in the framework of the RE-START project supported by the Tuscany Region. The project involves academic structures, in particular the Department of Energy, Systems, Territory and Constructions Engineering and the Department of Information Engineering of the University of Pisa, and a medical structure, Fondazione Toscana Gabriele Monasterio (FTGM). The Monasterio Foundation is a Research Center of the Regional Health Service. The Foundation was established by the National Research Council and the Tuscany Region for the management and development of specialized healthcare activities and medical research. There are two locations for the activities: the San Cataldo-CNR Hospital in Pisa and the “Heart Hospital” in Massa, both of which are in Tuscany, Italy. While the project had been initially conceived to address the post-emergency context, it has then been re-elaborated to address long-lasting objectives concerning the sharing of public buildings, where the different aspects of environmental stewardship, energy efficiency, and occupant safety converge.

1.2. State of the Art

In recent years, there has been a significant surge in technical–scientific literature focusing on the monitoring of environmental parameters such as temperature, humidity, light, and concentrations of various pollutants. Several recent studies collectively contribute to advancing understanding and strategies for maintaining high-quality indoor air across diverse settings—see for instance [1] for a comprehensive review of indoor air quality, European legislation, and insight in the Italian research, and [2] for cross cutting issues related to the analysis of the building sector in the Industry 4.0 era. Baqer et al. in [3] address Internet of Things (IoT) sensory technology’s development for optimal indoor air quality in hospitals, emphasizing taxonomy, challenges, motivations, and recommended solutions. Alonso et al. propose a methodology using de-trended cross-correlation for pollutant selection to ensure excellent indoor air quality [4]. Shen et al. in [5] conducted a literature review focusing on creating a satisfactory indoor environment for healthcare facilities’ occupants. In an extensive exploration of environmental monitoring, Butt et al. [6] provide a comprehensive review focusing on optical waveguide and fiber-based sensors. Broday and Gameiro da Silva [7] examined the pivotal role of IoT in evaluating and communicating indoor environmental quality (IEQ) in buildings. Anik et al. [8] proposed a cost-effective, scalable, and portable IoT data infrastructure for indoor environment sensing. Soheli et al. [9] presented a smart greenhouse monitoring system utilizing IoT and artificial intelligence, demonstrating the integration of advanced technologies in agricultural environments. These studies collectively contribute valuable insights into the evolving landscape of environmental monitoring and IoT applications. Furthermore, the integration of data-driven models, now commonplace, plays a pivotal role, particularly in applications like crowd management in commercial buildings. The integration of machine learning and deep learning methods has been also demonstrated in recent works [10,11], with the objective of developing occupant-centric paradigms [12] or, in general, digital twins for optimizing the building’s environmental performance [13], leading to IoT solutions for energy efficiency [14].
However, a closer examination of the literature reveals that data collection often serves diverse and not always clearly defined purposes. Generic references to “comfort” are common, necessitating a critical analysis of the multifaceted landscape of environmental monitoring. Indeed, most of the literature spans from individual houses and residential buildings to shared public structures of diverse types, which are currently receiving considerable attention, not only concerning health but also in terms of energy consumption patterns. However, in many of such articles, the true objective of data collection is often unclear. Today, this type of data holds significant importance, extending beyond generic environmental parameter monitoring. Indeed, they prove highly valuable for facility management and, crucially, for controlling environments, addressing aspects such as occupancy and optimizing system operations [15]. Today, the availability of substantial data from environmental monitoring, facilitated by advancements in computer systems, could be highly beneficial for developing building models based on these data. This enables the implementation of various strategies for optimized building management, potentially in combination with artificial intelligence and machine learning models [16]. This growth is attributed, on one hand, to the widespread availability of diverse sensor technologies and the increasing need for precise control over environmental conditions. Initially driven by comfort considerations, the emphasis has shifted towards environmental safety, especially in the wake of events such as the COVID-19 pandemic.

1.3. Paper Contributions

The present work addresses, in a comprehensive fashion, several aspects that generally aim at laying the groundwork for sustainable and resilient building management practices, as summarized below:
(i)
Enhanced Indoor Air Quality Measures—In the wake of COVID-19, there has been a heightened emphasis on managing shared spaces to ensure both energy efficiency and compliance with stringent safety regulations. This involves re-evaluating ventilation systems and implementing measures to enhance indoor air quality, which are crucial for the well-being of occupants;
(ii)
Health and Safety Measures—With a renewed focus on occupant health and safety, understanding and managing occupant density and flow within buildings has become paramount. This includes considerations for optimizing indoor air quality and ventilation systems to mitigate health risks;
(iii)
Energy Efficiency—Heating, Ventilation and Air Conditioning (HVAC) systems stand out as significant energy consumers in buildings. Balancing the imperative of indoor air quality and safety with the need for energy efficiency poses a significant challenge, as evidenced in [17]. The project aims to explore strategies for optimizing HVAC systems to achieve a balance between energy conservation and occupant comfort;
(iv)
Integration of Smart Building Technologies—Leveraging advancements in smart building technologies, particularly the proliferation of various sensors like Z-Wave wireless sensors, offers new opportunities for monitoring indoor parameters. These sensors provide invaluable insights into building performance and comfort, facilitating informed decision-making regarding system operation and maintenance;
(v)
Data-Driven Energy Management—The data acquired from monitoring indoor parameters require careful analysis to extract meaningful high-level insights. Through the application of machine learning and data-driven modeling techniques, the project seeks to unlock the full potential of monitoring data, enabling more effective energy management strategies.
The overarching goal of this paper, inspired by a reassessment of commercially available sensor technologies and their reliability, is to showcase the potential of environmental data monitoring. Emphasis is placed on CO2 and movement sensors, their network integration, and the management and analysis of collected data, potentially employing advanced machine learning methods. An integral aspect of environmental monitoring is the connection to human presence within shared spaces. Parameters such as CO2 concentration, obtained through sensors, offer valuable anonymous insights. Elevated CO2 levels become a formidable indicator of crowded environments, as also explained by Franco and Leccese in ref. [18].
The utilization of movement data, available from some modern sensors, poses challenges, as the direct correlation between movement and the actual number of people in an environment is not always straightforward. The utility of these insights lies in the optimal management of diverse structures, aiming not only for sustained environmental comfort but, more importantly, for energy conservation. The article concludes by presenting results from a long-term monitoring effort spanning various facilities, including educational and outpatient healthcare settings. Detailed monitoring with the acquisition of data unveils substantial value in crafting advanced data-driven building models, entirely bypassing the need for traditional physical models. This data-driven approach provides a more flexible and efficient perspective in understanding and optimizing building dynamics. Our project, originated from other original publications of some of the authors of the present paper [19,20], searches to navigate this complexity by devising a comprehensive framework that addresses these multifaceted challenges in an aggregate manner. By harmonizing different elements—such as environmental monitoring, energy management, and IoT infrastructure—we endeavor to unlock synergies that yield tangible benefits across diverse domains. Starting from the theme of environmental monitoring and the availability of various monitoring data, these can be used for different purposes, all aimed at improving facility management. Among the various parameters, CO2 concentration is considered as a fundamental one. Within educational facilities, the availability of monitoring data can enable the effective regulation of energy systems (lighting, heating, and ventilation), thus achieving energy-saving objectives. In healthcare facilities, on the other hand, managing monitoring data can be useful for maintaining safety conditions, particularly in areas with hospitalized patients, and for analyzing the functioning of patient reception and management protocols, especially in the case of caregivers and accompanying persons attending outpatient spaces. Currently, the management of medical visits and instrumental examinations is handled through Booking Centers (CUP), which orchestrate flows from a global patient and persons safety perspective, trying to mitigate the possible occurrence of peaks of occupants, which may occur anyway under unexpected circumstances.

2. Environmental Monitoring: Sensors and Facilities

Environmental measurements inside shared buildings are common and widely conducted for different purposes. Monitoring and measuring different parameters within indoor spaces provide valuable insights into the performance, comfort, and safety of the built environment. Common measurements include temperature, humidity, CO2 levels, other air quality parameters such as volatile organic compounds (VOCs) or particulate matter (PM), light levels, energy consumption and occupancy monitoring. Figure 1 provides a scheme in which the importance of environmental sensors in buildings is shown. Among the various measurements that environmental sensors can provide, one with significant relevance is the concentration of CO2. The concentration of CO2 serves not only as a general indicator of thermal and humidity comfort, but it also, due to its correlation with human occupancy, can be utilized for other purposes where the building occupancy is essential, and other occupancy sensors (such as cameras) are inappropriate (e.g., for privacy reasons). However, it is worth noting that CO2 measurements are more intricate and complex compared to other metrics. In the following section, we delve into the diverse array of sensors employed in shared public buildings, examining their functionalities, and assessing their suitability for the unique requirements of universities and healthcare facilities.

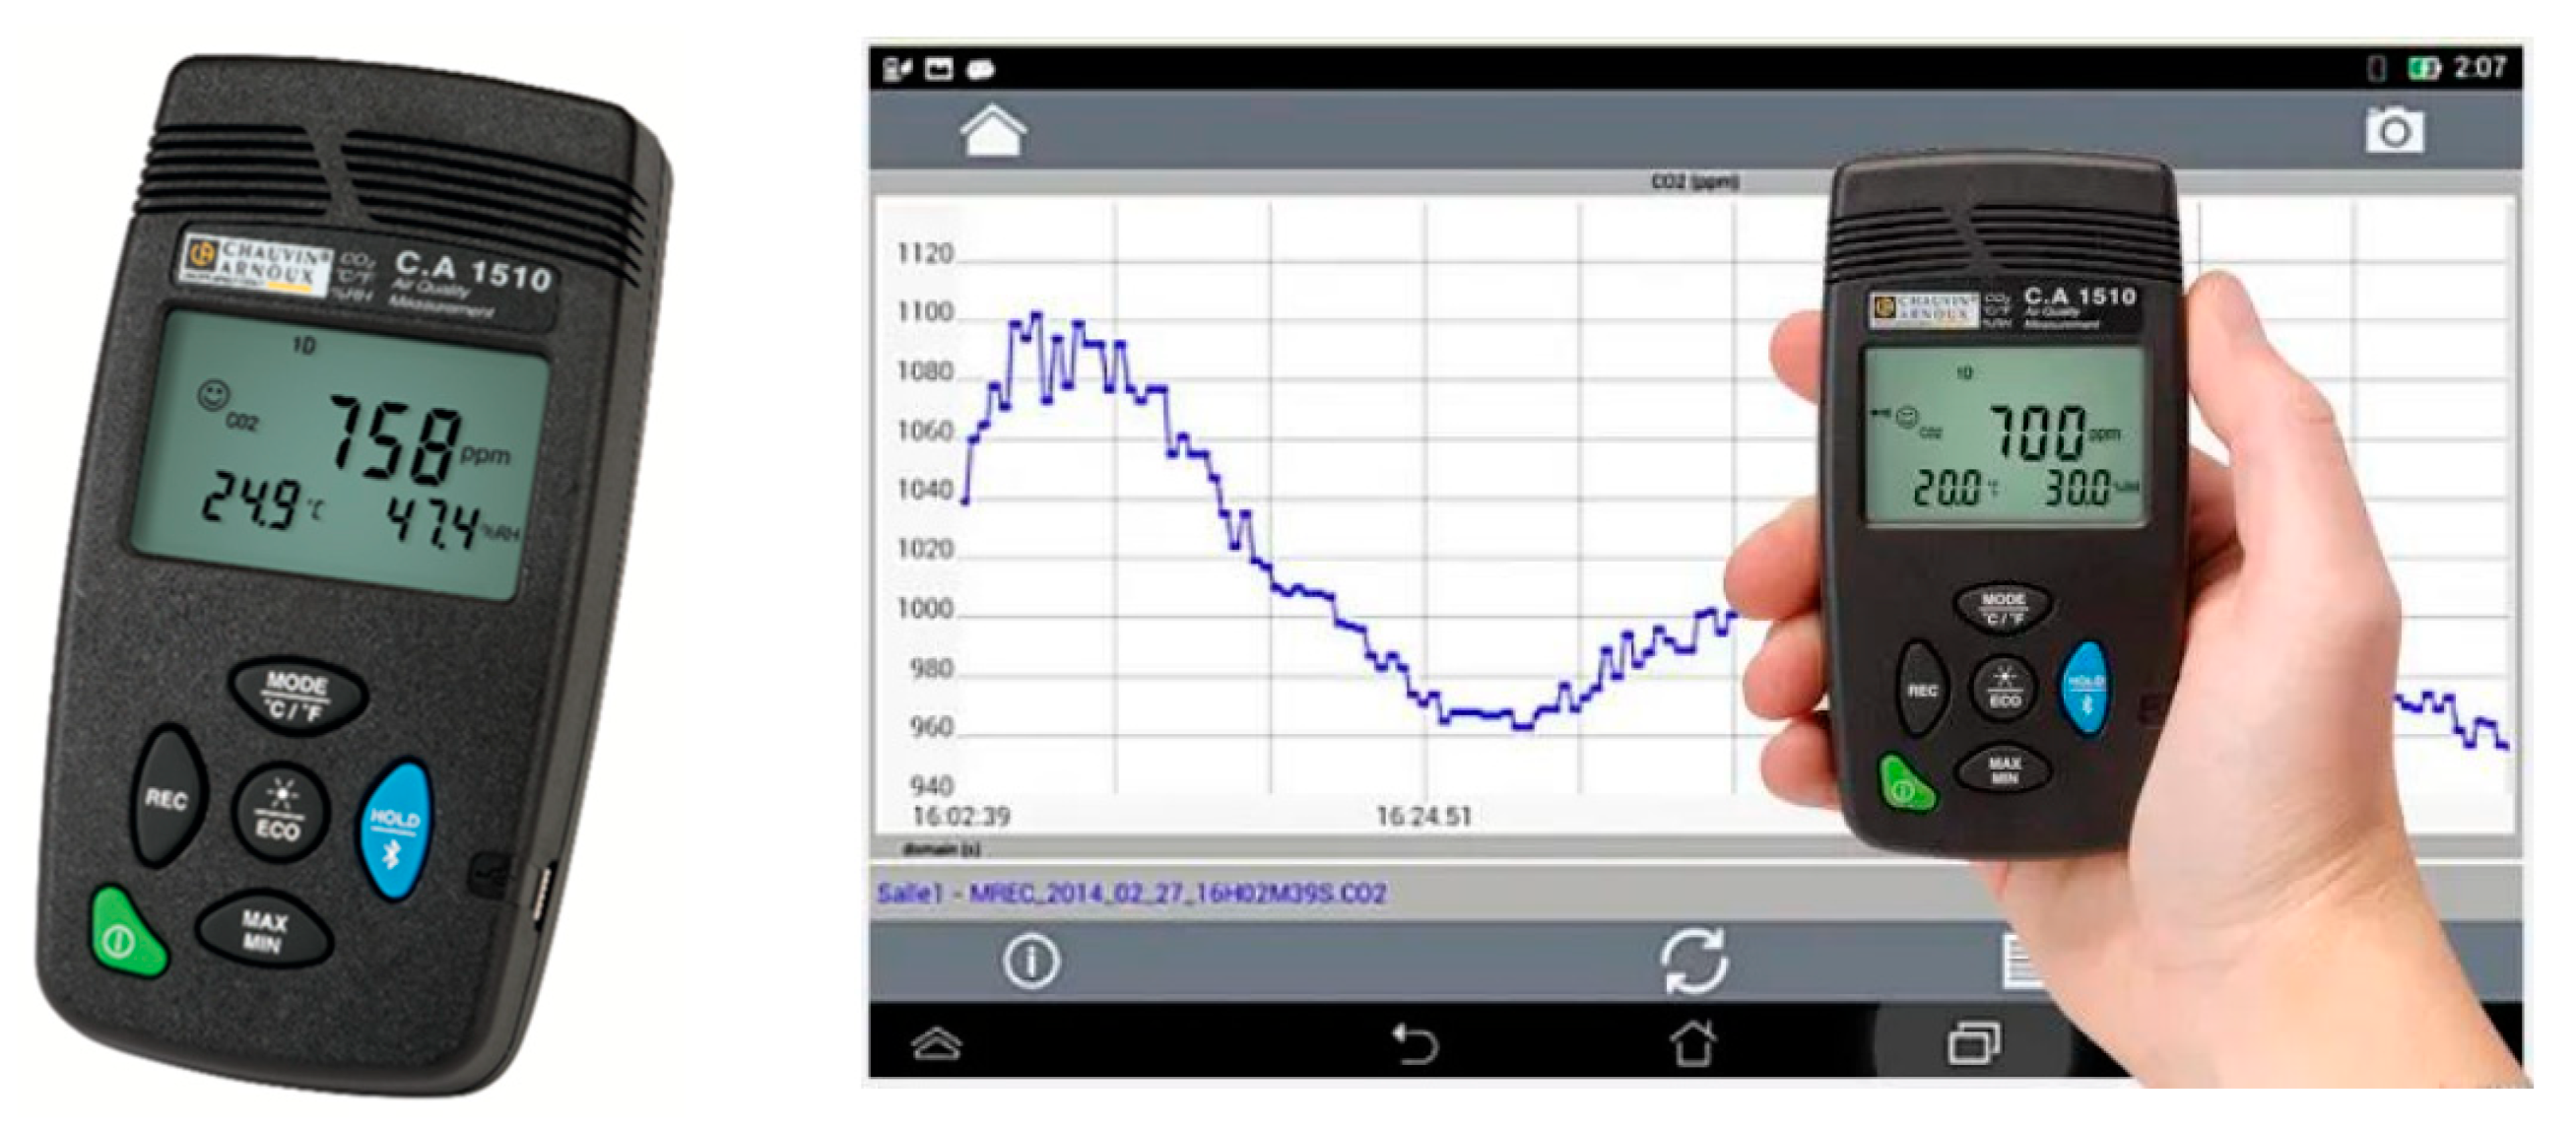
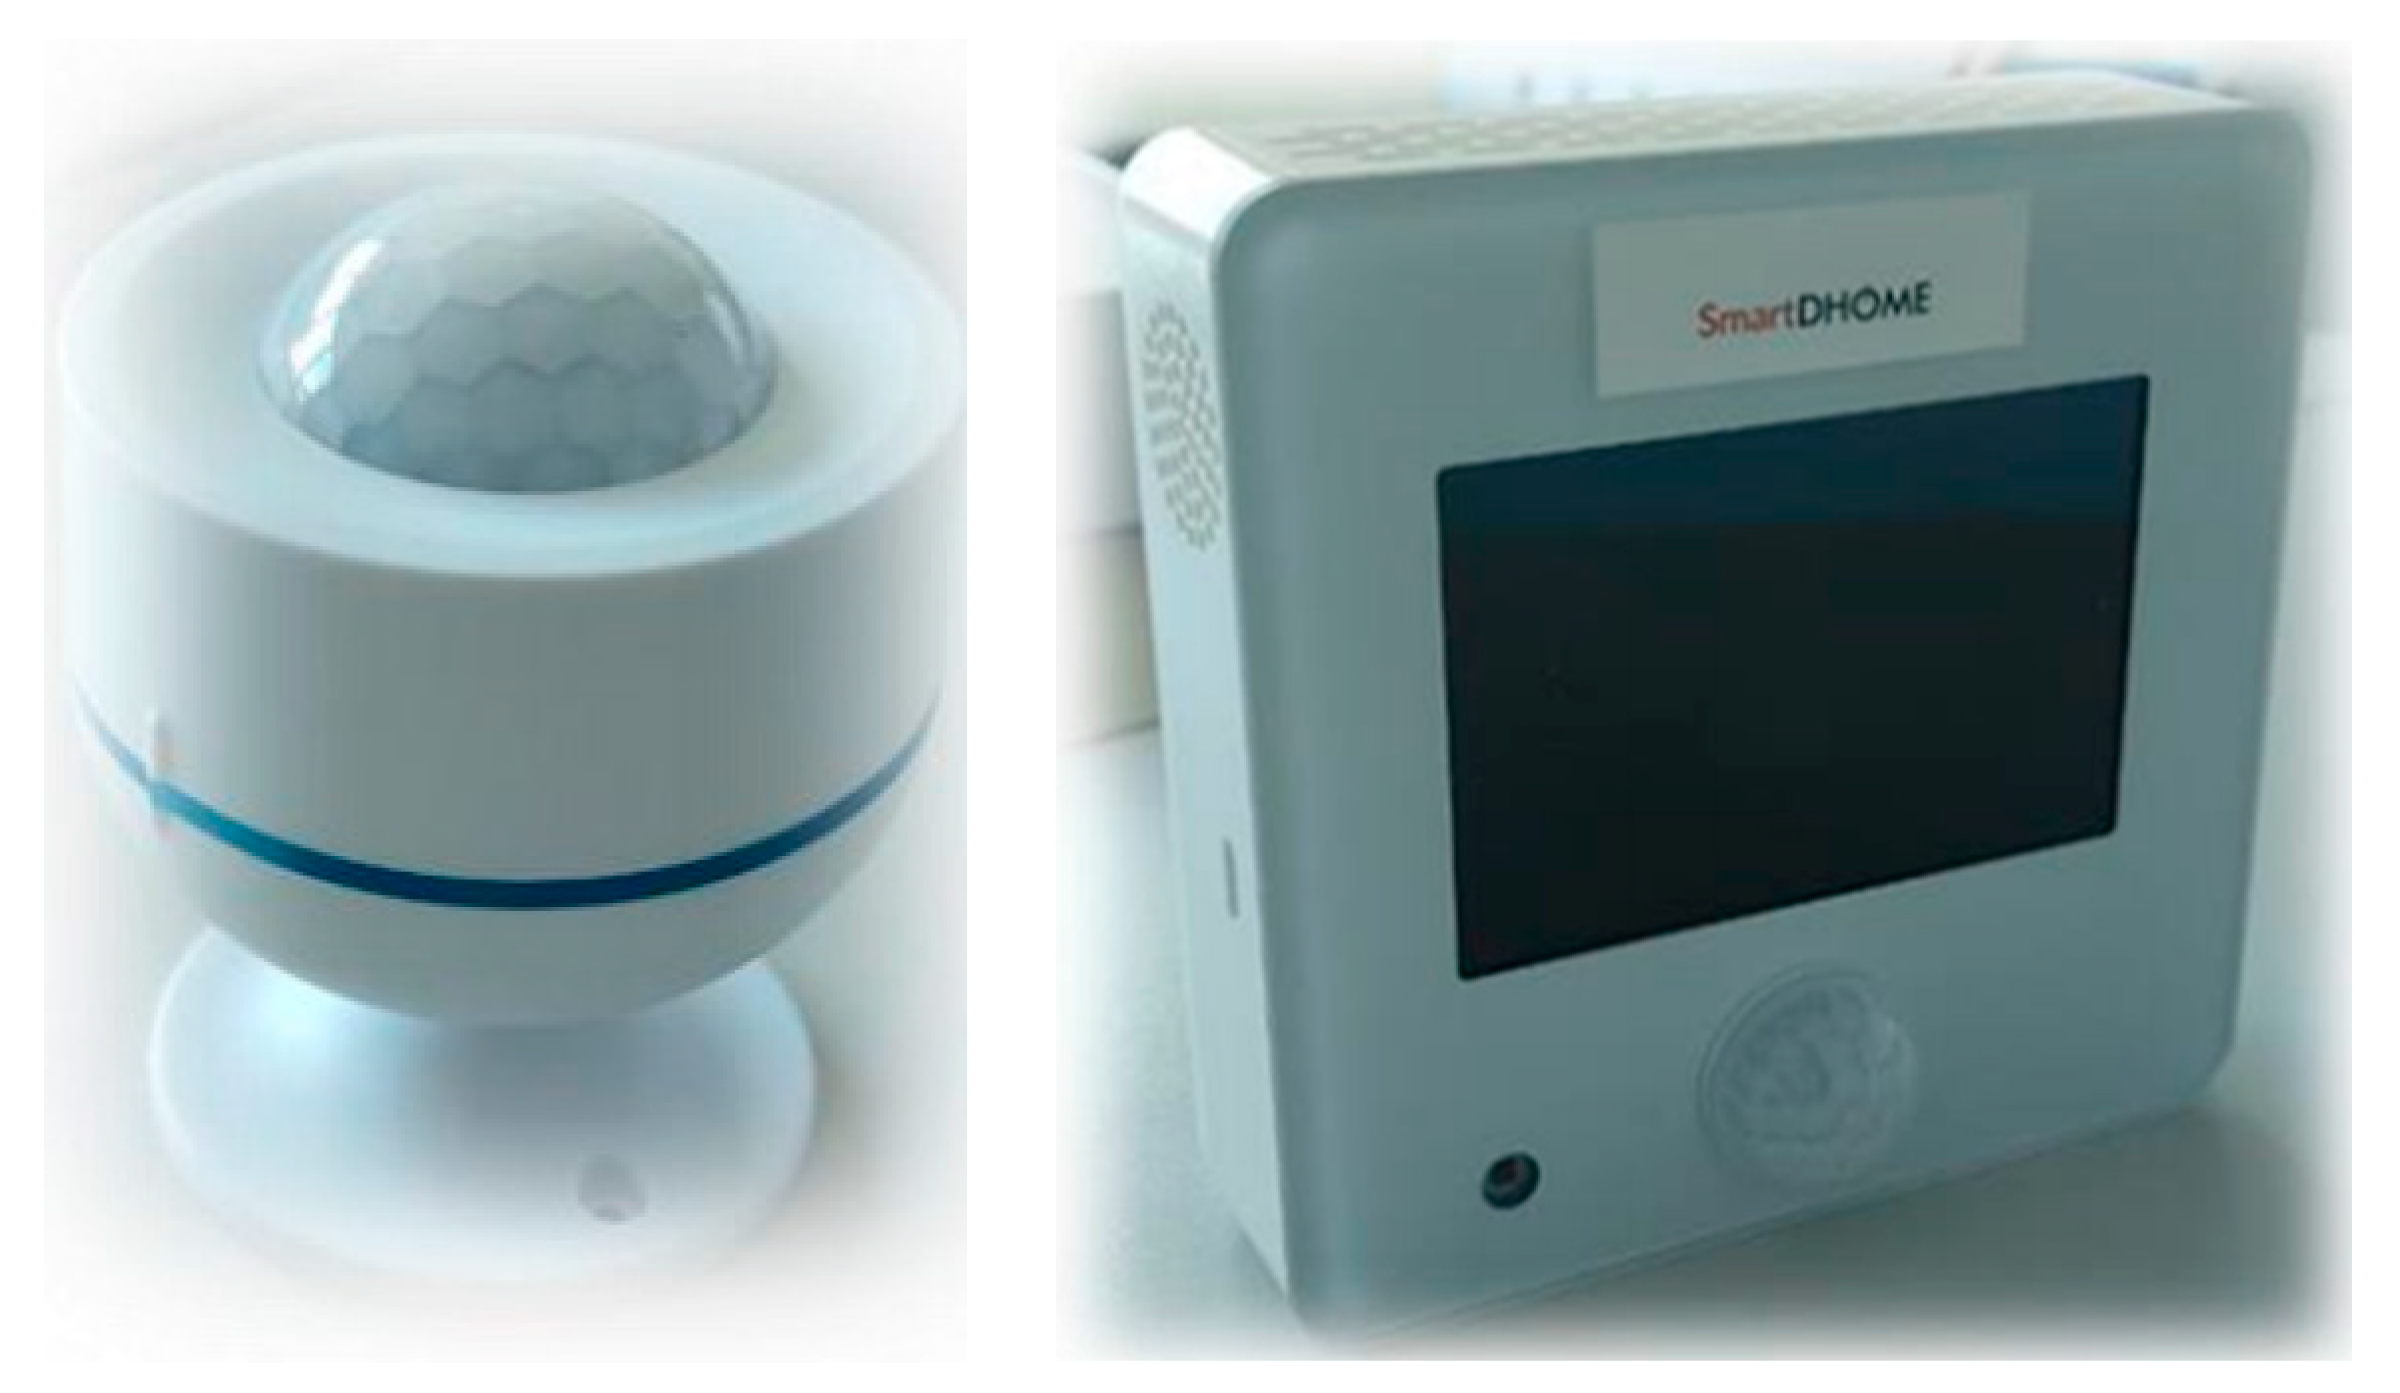
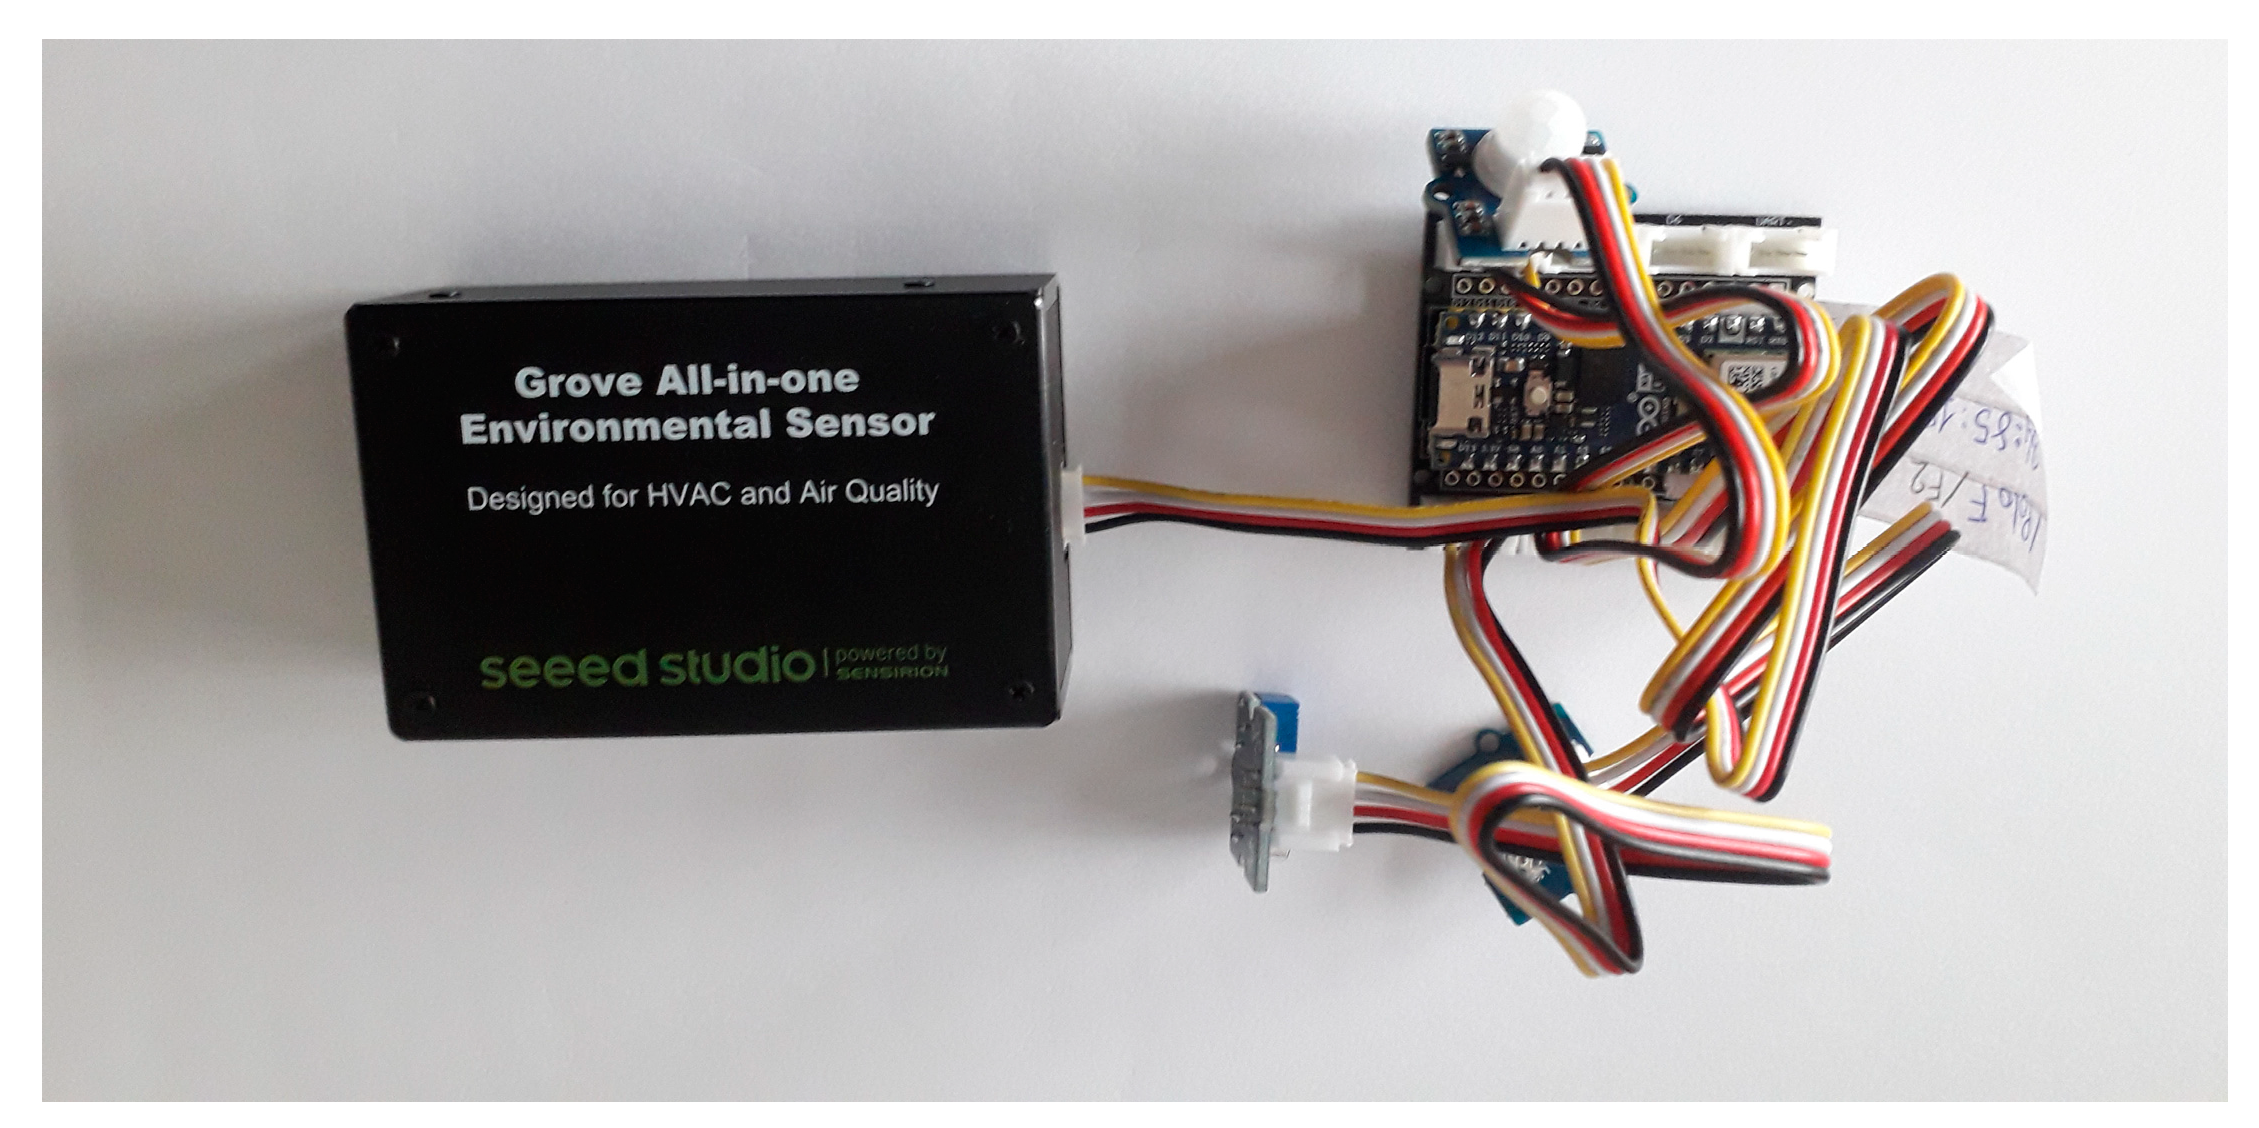
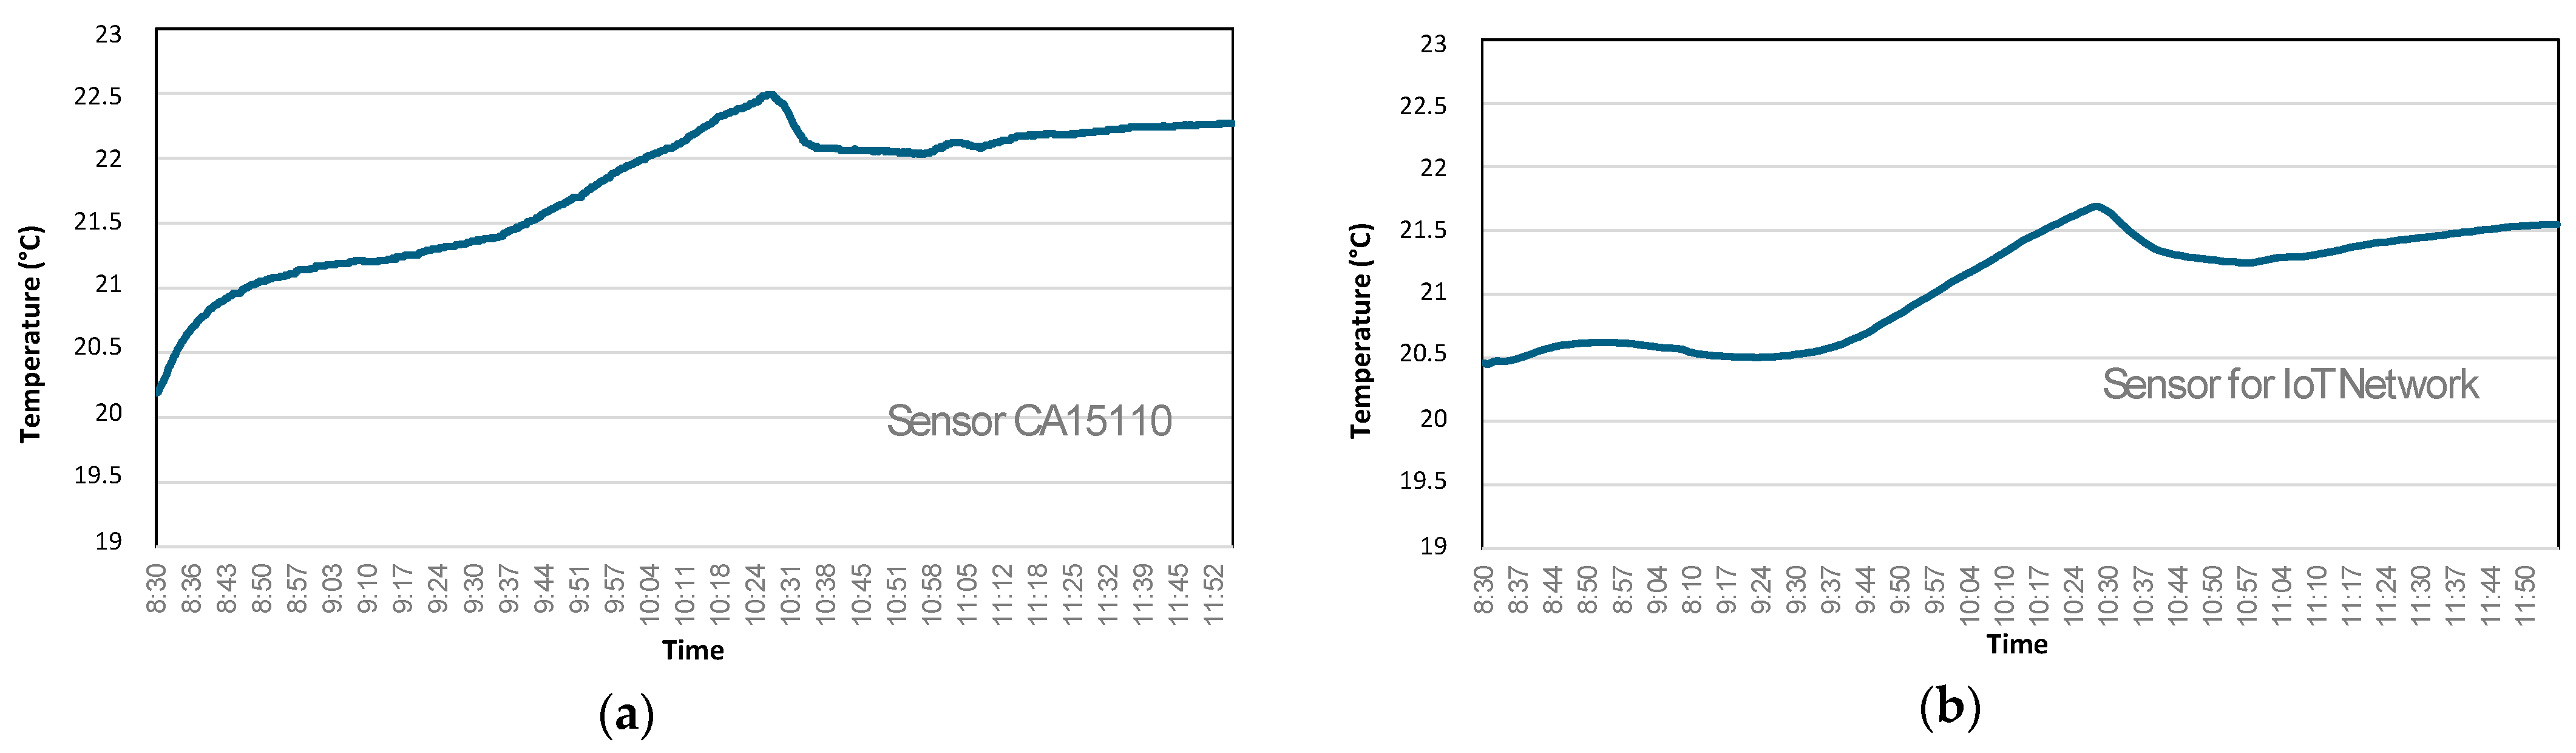
2.1. Analysis of Sensor Types and Functionalities

The evolution of sensor technology over the past 50 years has been characterized by miniaturization, integration, digitalization, increased accuracy, energy efficiency, and enhanced connectivity, as summarized in Table 1. These advancements have significantly expanded the range of applications and capabilities of sensors in industrial and civil sectors. The evolution of sensor technology has been extended to environmental monitoring sensors, initially focused on indoor air quality but progressively expanding to encompass energy efficiency, safety, and disability support concerns.
We now survey sensors that may be used for CO2 monitoring. For simplicity, we examine three classes of sensors that could cater to three different technological advancements. First, we consider reliable analog sensors whose performance has been previously documented in other evaluations and reported in scientific papers. As a second class, we have also considered conventional commercial home automation sensors capable of network integration. Finally, we have evaluated the ability of self-built sensors by evaluating the market’s offerings for those that could be network-enabled through simple communication protocols.
In detail, we first consider the Chauvin Arnoux 1510 sensor: this device allows for the simultaneous detection of temperature, relative humidity, and CO2 concentration in ppm (Figure 2). The sensor is quite reliable in terms of measurement and has been tested in different contexts [18]; data can be retrieved from the instrument either by downloading or by connecting via Bluetooth to the device. In the second class, we test the Z-Wave sensor [21] from Smart-D-Home, and the 4-in-1 sensor and the 9-in-1 sensor (Figure 3). These sensors have also proven to be quite reliable in terms of measurement results, and upload data to an external network connected to an external gateway. While the method is conceptually interesting, it is weak from a cybersecurity standpoint as the gateway could be susceptible to cyber-attacks. In addition, mesh networks as in the Z-Wave communication protocol require a gateway for every cluster of sensors, which implies that at least one gateway is required for every building.
As a third example, considering low cost sensors for building monitoring [22], we have tested a self-assembled sensorized platform, constructed by connecting different digital sensors to a specific Arduino ESP32 board (Figure 4). In this case, the server collecting data from the several sensors and the communication protocols may be devised to achieve desired cyber-security levels. Also, a single server is required to gather all the data across different buildings served by the same wireless network.
The three types of sensors tested correspond to three different concepts of measurement system and to three different data management methods, given that the first requires reduced interaction with the network (it is accessible only via Bluetooth connection) while the others can be inserted more easily on the internet.
However, particular care should be dedicated to selecting the most appropriate sensors, since they usually require long calibrating procedures, and usually suffer from less accurate measurements, compared with the other commercial products. In some cases, we have also noticed that the measured values also fail to follow the trend of actual values (i.e., they measure decreasing values of CO2/temperature, when CO2/temperature is increasing). As an example, Figure 5 compares the temperature measurements of the first and the last sensor, placed in the same position. In this case, although the two sensors qualitatively appear to provide the same measurements, the first sensor registers a total increase in temperature of approximately 2 °C, while the second sensor registers an increase of approximately 1 °C. Table 2 compares the accuracy of the sensors of the three classes in terms of measurements of CO2 concentration. In this case as well, not all sensors are equally accurate, and the self-built sensorized platforms using sensors dedicated to IoT networks tend to be less accurate in detection, both for reasons related to the electronics and due to the indirect methodology adopted for measuring CO2 concentration.

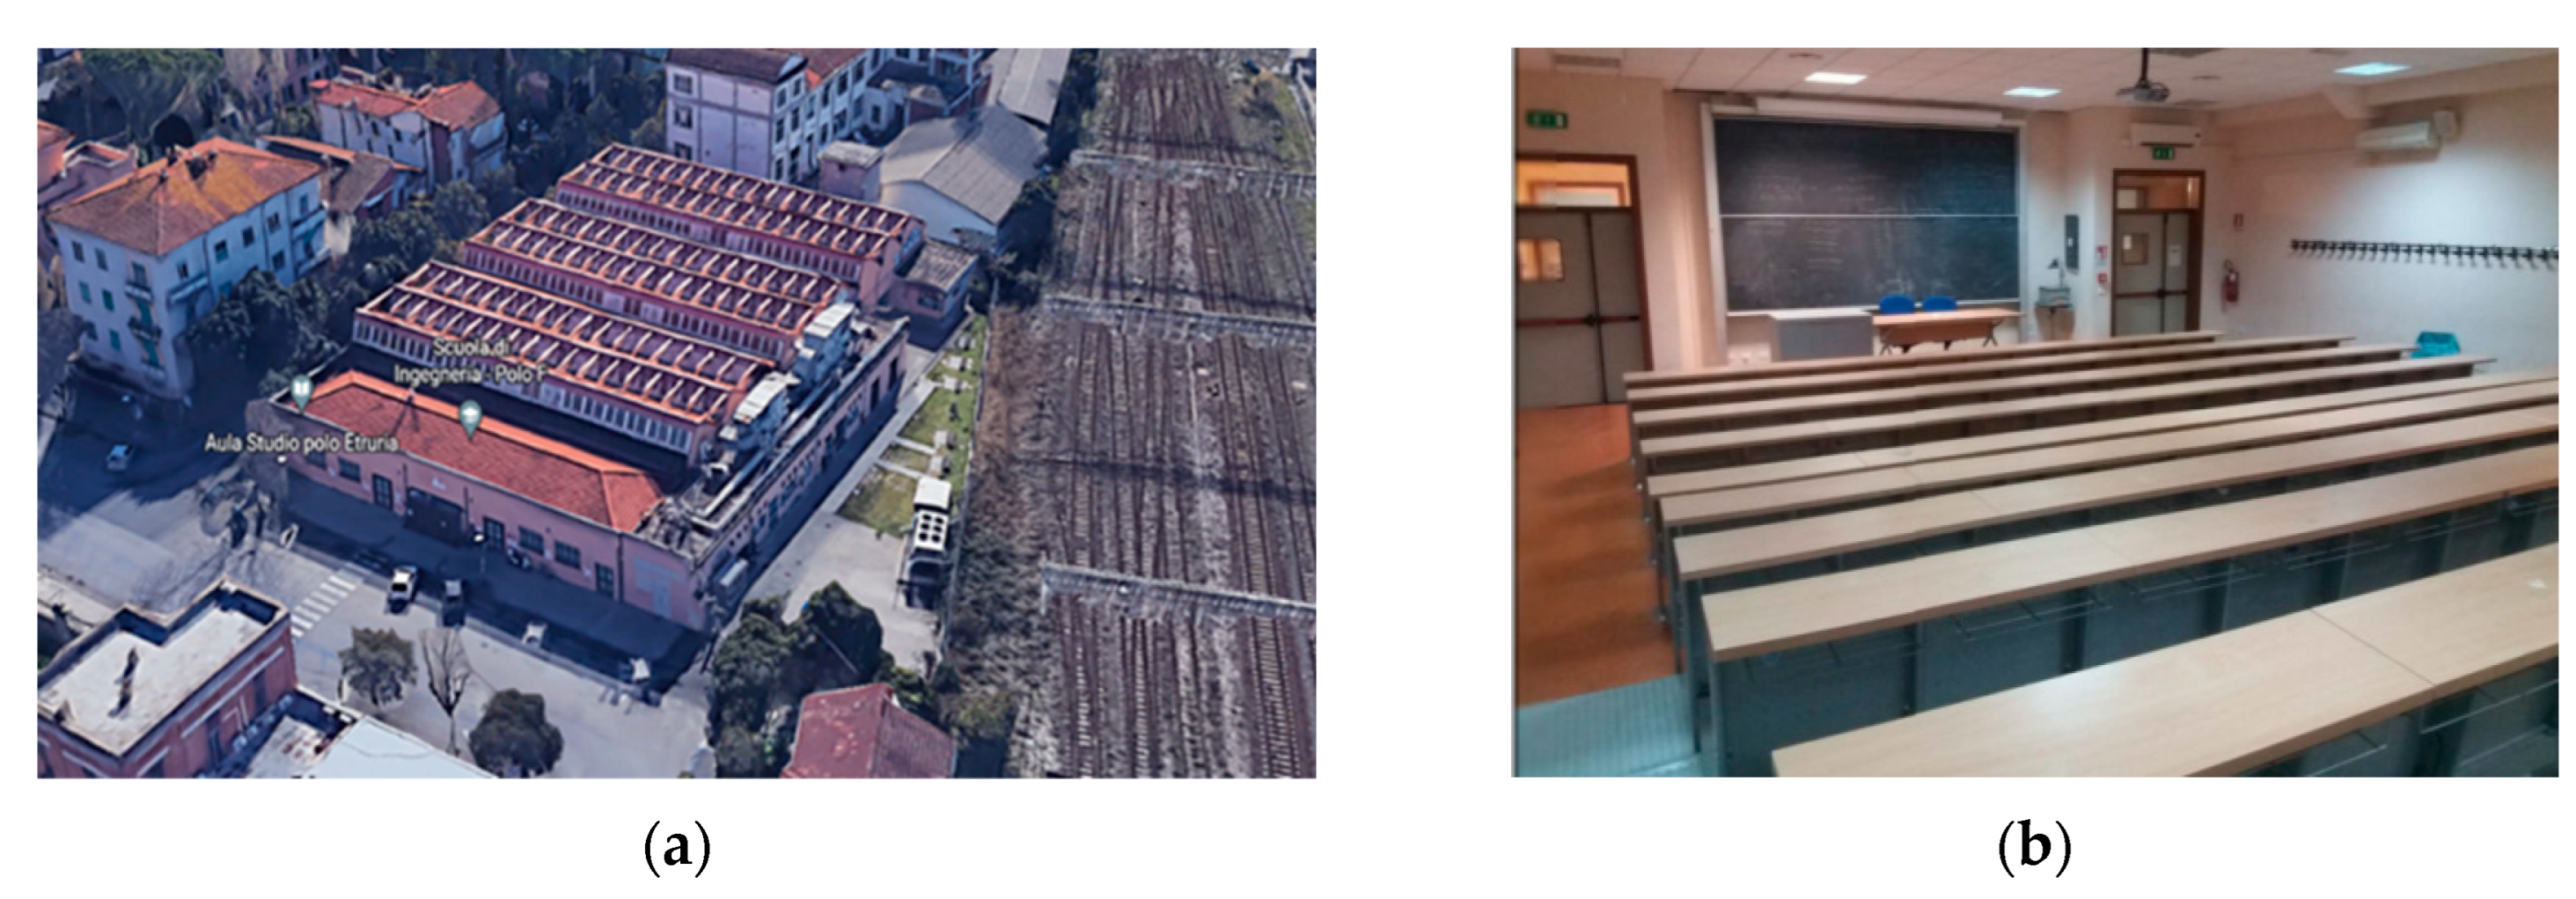
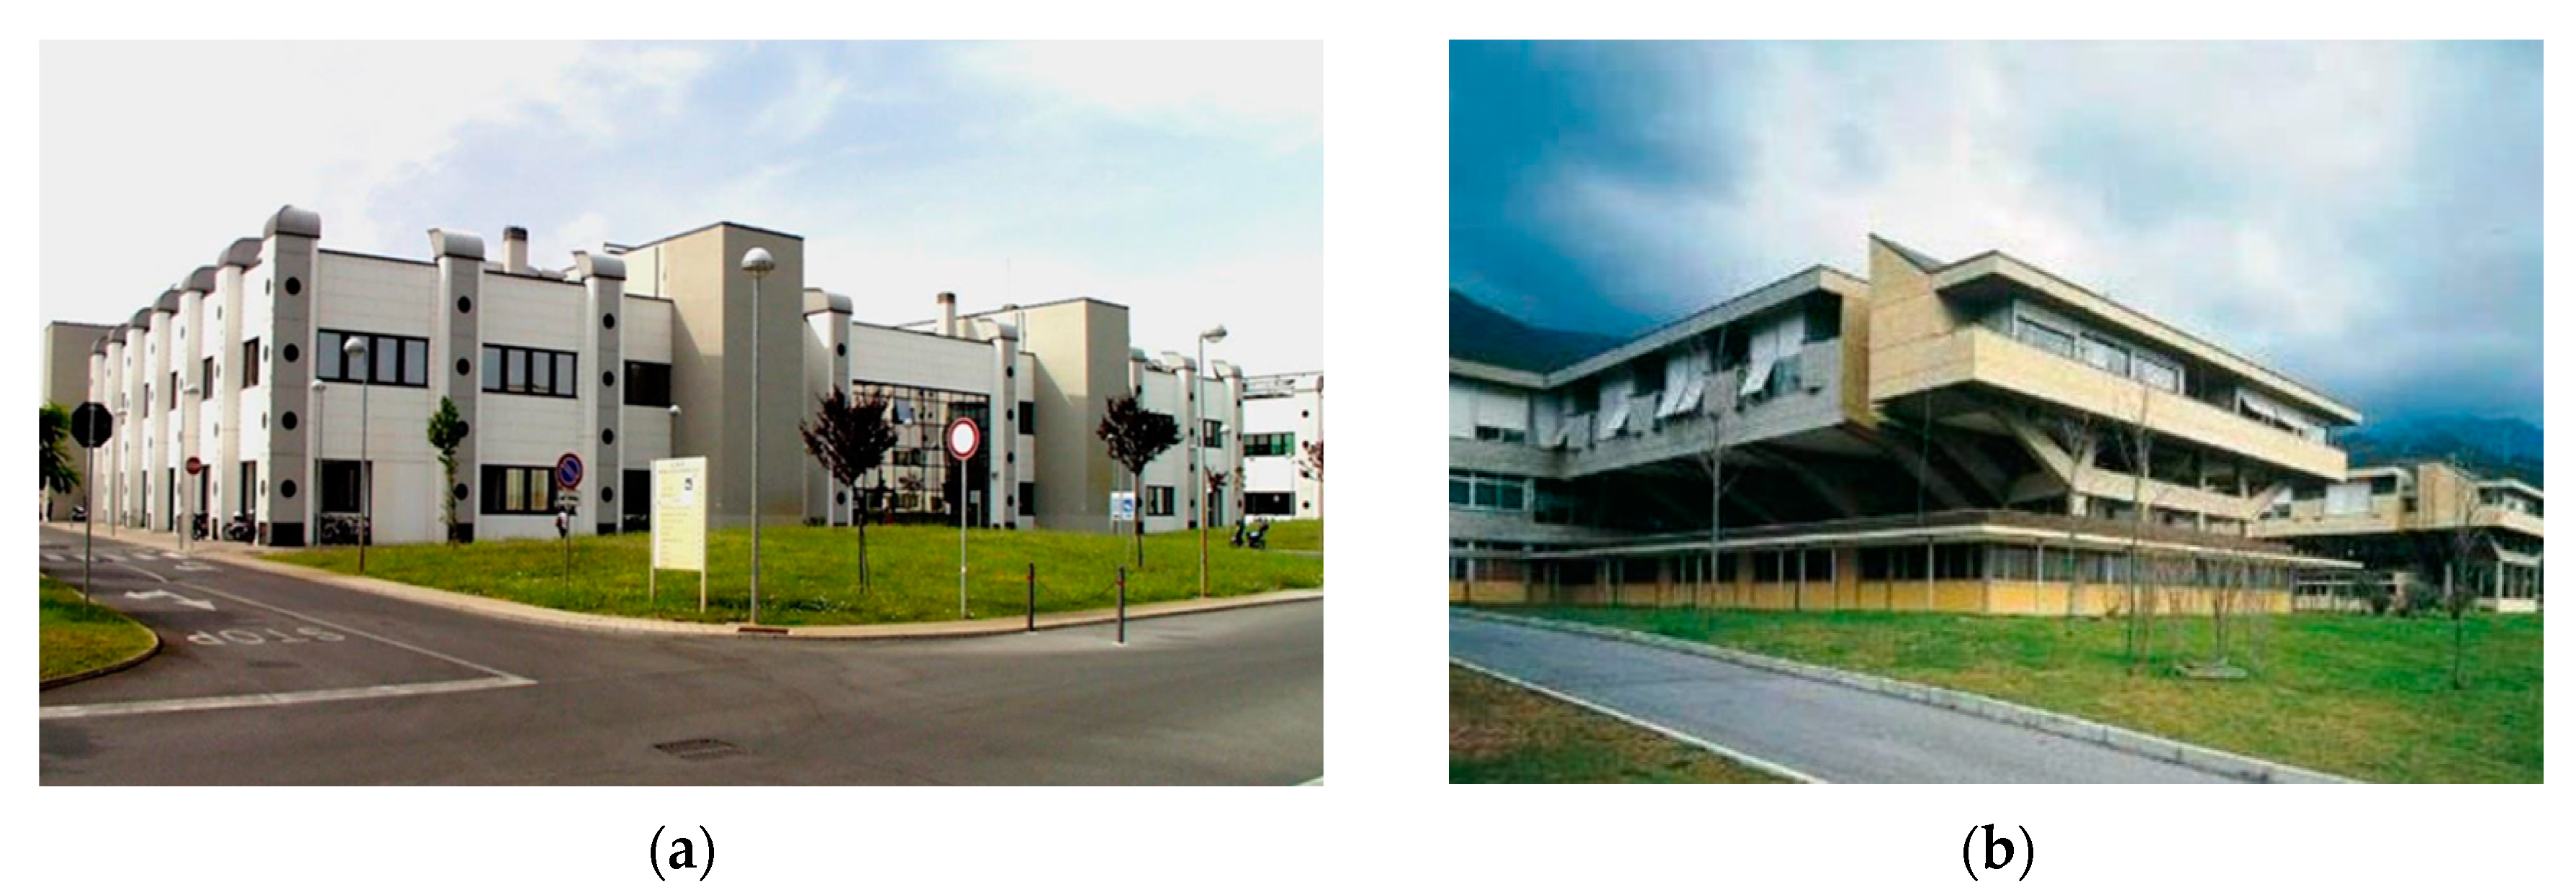
2.2. Characteristics of Examined Facilities: Universities and Healthcare Settings

The study focused on two types of structures, academic and healthcare facilities; in both, the post-pandemic re-opening phase has been critical and linked to the direct monitoring of occupancy. While concerns regarding the occupancy of indoor spaces have been recently relaxed, it is still convenient to maintain certain best practices that were established during the pandemic period, including environmental parameter monitoring, which can still enable the indirect anonymous detection of occupancy. Both healthcare facilities, especially those with low-intensity care, and educational institutions share common traits as shared public buildings, with occupancy patterns that are not always uniform but suffer from predictable peak times. They also exhibit significant differences, as their users and objectives vary considerably. In the case of university didactic facilities, the focus of the energy optimization may primarily concern the management of plant operation and the consequent energy use, whereas in healthcare settings, the priority is to minimize unforeseen overcrowding issues leading to the risky exposure to transmissible diseases. Interestingly, similarities can be observed between these two types of structures in terms of this aspect. In the context of our research, those structures present unique characteristics and operational requirements that necessitate tailored approaches to environmental monitoring and safety protocols, despite the anonymous aspect of the data collection process. This is mandatory in healthcare settings, due to the sensitivity of data management. Figure 6 and Figure 7 show, respectively, a typical teaching structure of the University of Pisa and the two healthcare structures of the Gabriele Monasterio Foundation (FTGM). Universities, as centers of education and research, typically accommodate diverse populations with varying schedules, leading to fluctuating occupancy levels throughout the day. In contrast, healthcare facilities, particularly those providing continuous care, require stringent safety measures and precise environmental control to ensure patient well-being and regulatory compliance.
Both settings prioritize factors such as indoor air quality, temperature regulation, and occupant comfort. A summary of the main descriptive characteristics of the considered structures is reported in Table 3 and Table 4. The structures that have been taken into consideration have a further common feature, which is that they are characterized by a significant level of energy consumption, due to the operation of mechanic ventilation systems, and the winter and summer heating/air conditioning systems. For this reason, it is important to monitor the occupancy of rooms in the buildings in order to modulate the operation of HVAC systems based on actual occupancy levels, as this would allow for significant advantages in terms of energy savings. In the following section, we now investigate and compare the capabilities of the three classes of sensors for environmental monitoring. While commercial sensors appear to provide more accurate measurements, self-assembled sensors are still attractive because they provide cost-effective solutions, which may be more convenient for large-scale deployment in university campuses and medical facilities. By evaluating the performance and applicability of the sensors in the different settings, our research aims to inform decision-making processes regarding the implementation of environmental monitoring systems in universities and healthcare facilities. Through targeted sensor deployment and data-driven insights, stakeholders can enhance occupant comfort, improve safety protocols, and optimize resource allocation to meet the unique needs of each environment.

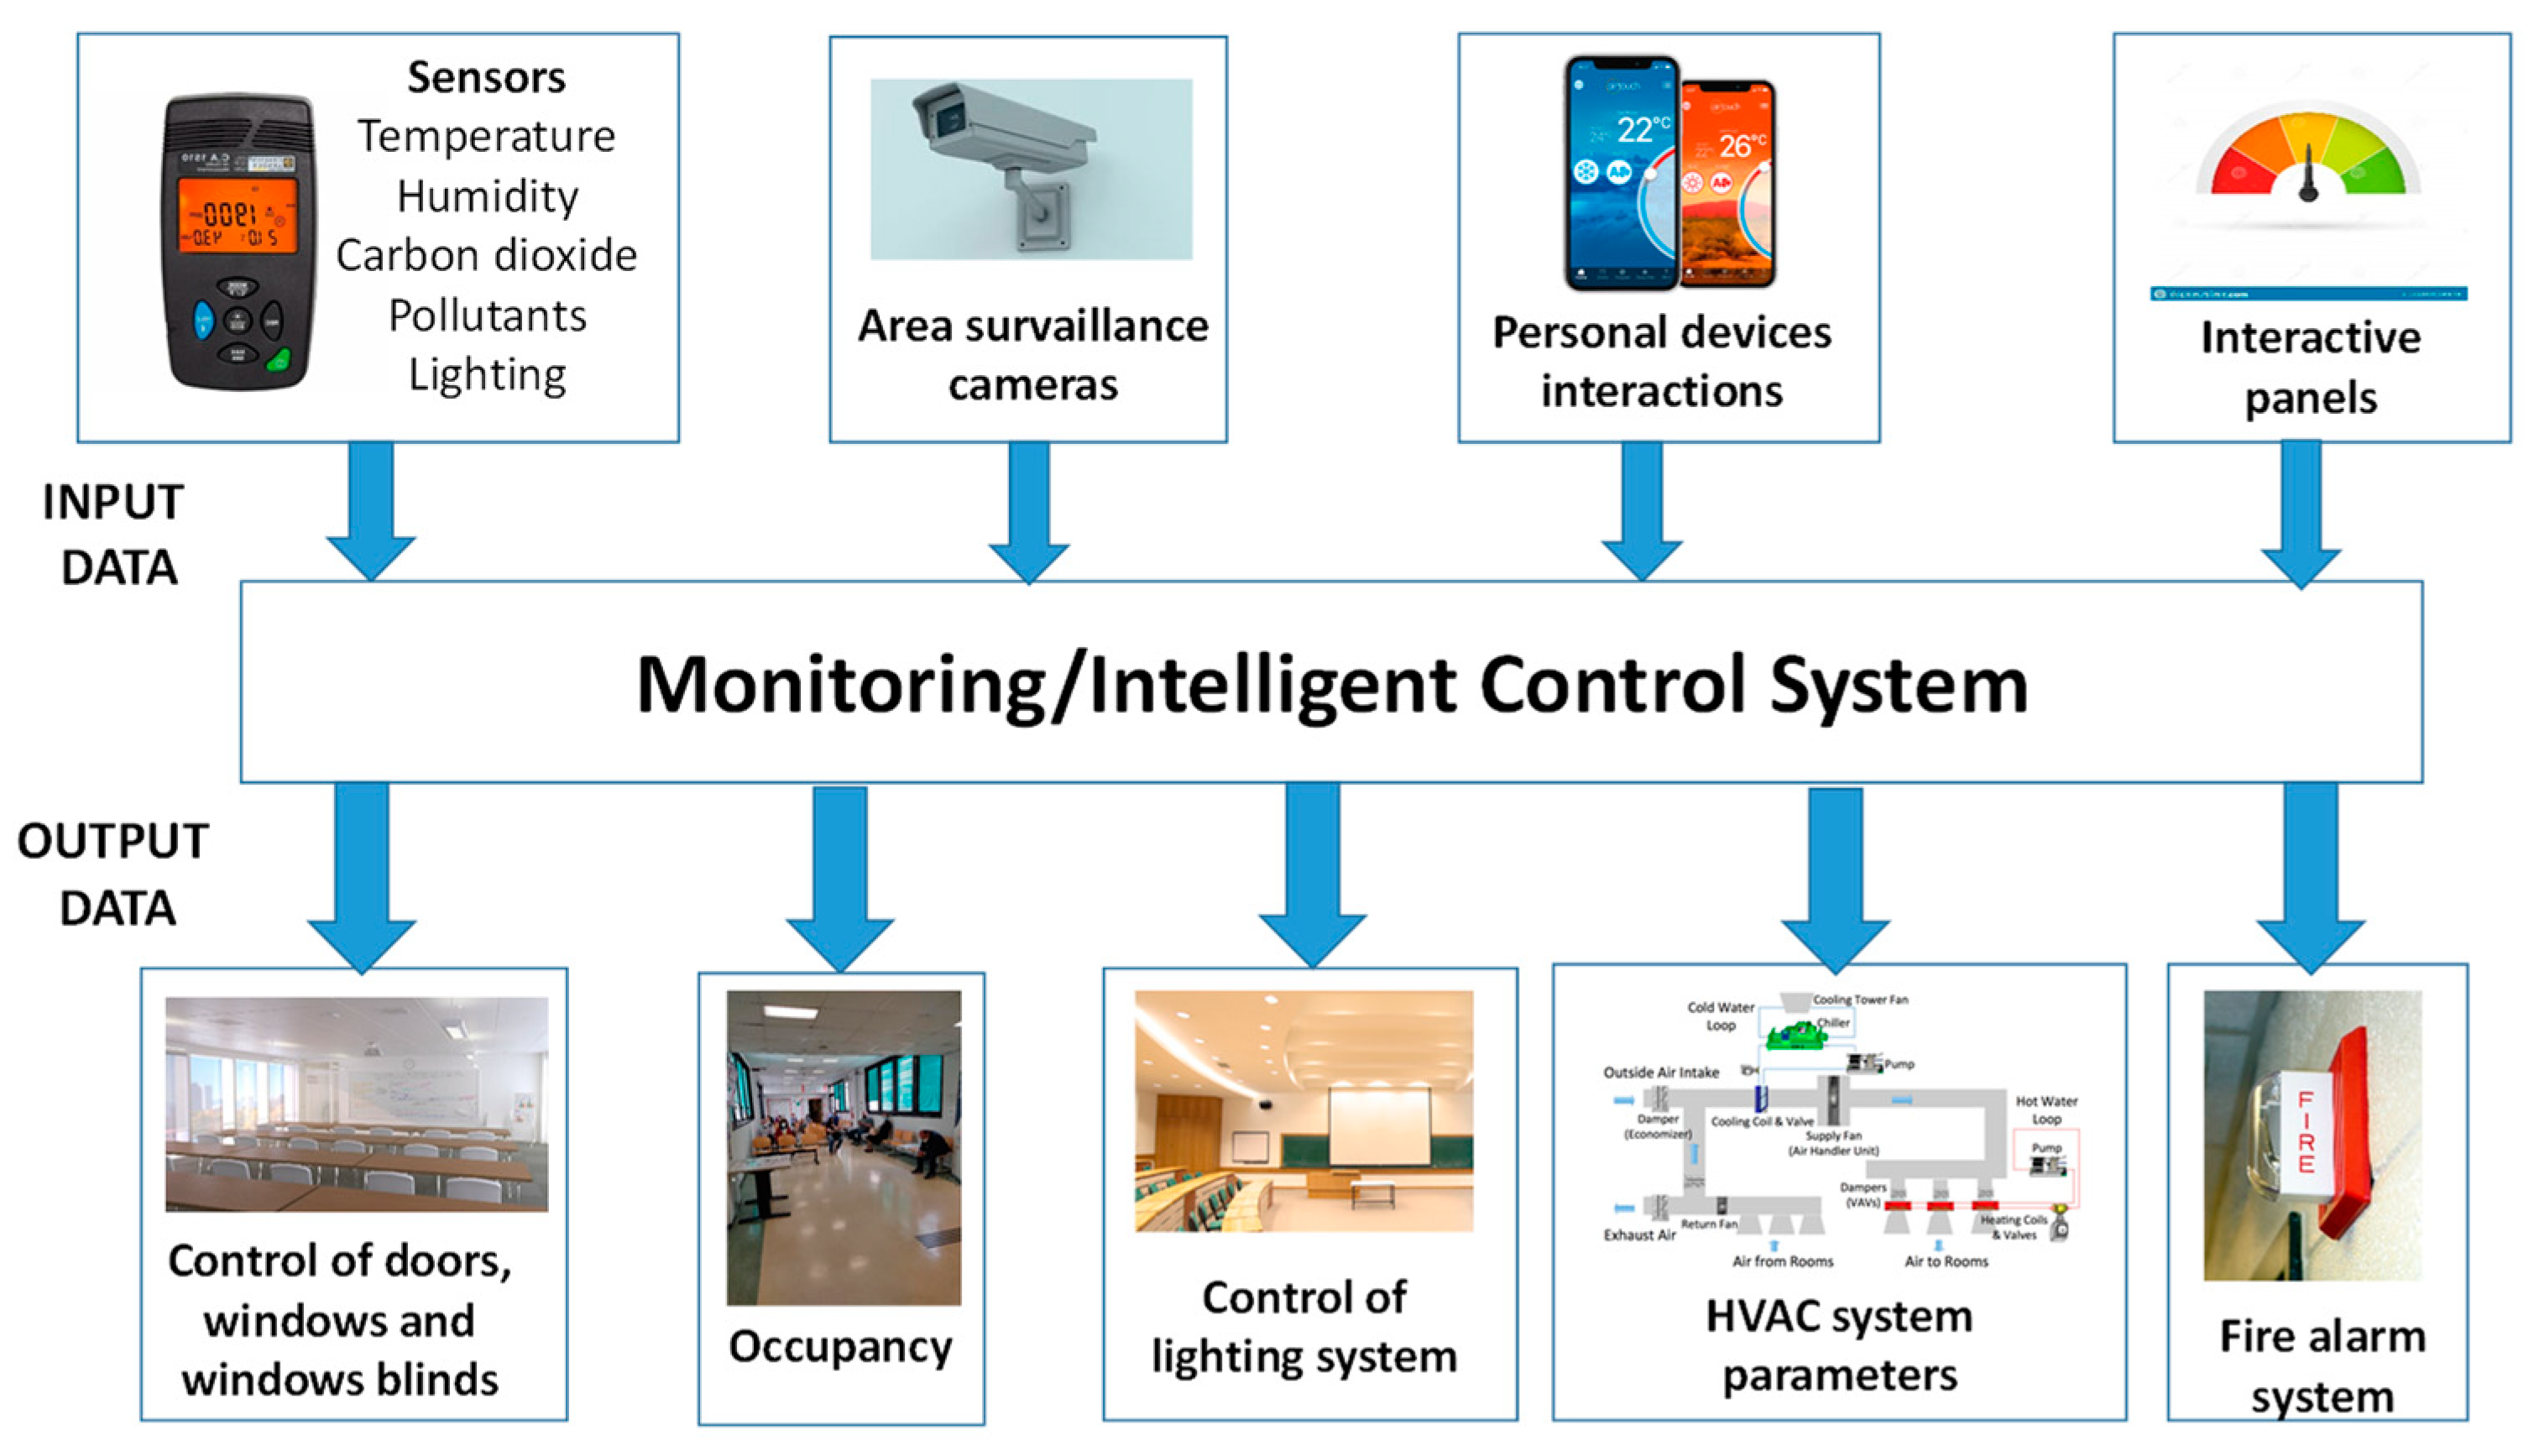
3. Environmental Parameter Control for Indoor Air Quality and Possible Use for Energy Efficiency Purposes

This structured approach allows for a comprehensive exploration of the monitoring and control challenges in university and healthcare facilities, while also providing a detailed analysis of methodologies and insights derived from measurement campaigns, with a specific focus on CO2 monitoring. As previously mentioned, environmental parameter control can serve various objectives. Firstly, it offers informative data for users of the facilities. Secondly, it can help highlight any operational anomaly within the structure, such as unexpected overcrowding, reduced occupancy, or other noteworthy situations related to safety concerns (e.g., the presence of toxic or harmful substances) or other anomalies. Recently, there has been growing interest in integrating environmental control with energy management systems. Following the COVID-19 pandemic, many states have implemented stringent regulations regarding air circulation and HVAC system operation, leading to significant energy wastes in some cases. In this context, the monitoring of CO2 levels becomes particularly relevant, serving as an indirect indicator of occupancy within enclosed spaces; although not sufficient to precisely define a contagion hazard in the healthcare facilities, it can be considered as fair proxy information. In this section, based on the analysis of data collected from the analyzed structures, we aim to evaluate current situations deserving attention and the potential energy-saving benefits achievable. We present insights gleaned from measurement campaigns conducted within university and healthcare facilities, with a particular focus on CO2 monitoring, as already discussed by Franco, Crisostomi and Hammoud in ref. [23].

3.1. Monitoring and Control Challenges

In this subsection, we examine the unique challenges encountered in monitoring and controlling environmental parameters within the university and healthcare facilities under analysis. Factors such as fluctuating occupancy levels, diverse user requirements, and regulatory compliance pose significant challenges that must be addressed to maintain indoor environmental quality, considering the different specifications and the different uses of the different structures under analysis. Among the environmental monitoring parameters, the detection of CO2 concentration stands out as particularly significant. Elevated CO2 levels inherently signify poor air quality, especially indoors, posing not only comfort issues but also the risk of pathogen transmission, as highlighted by the recent COVID-19 experience. Acceptable CO2 levels vary based on activity and environment. A healthy environment maintains CO2 concentrations below 800 ppm, while acceptable levels may be under 1200 ppm, with levels exceeding 1500 ppm (such as, for example, 1900 ppm) warranting attention and brief exposure (Figure 8). Ventilation, whether natural or mechanical, maintains health standards. Distinctions are crucial based on building usage and occupants, notably in healthcare and educational settings catering to diverse demographics.
In Figure 9, monitoring data from two areas of the “hospital wards” section of the facility depicted in Figure 6b are presented. Each monitoring session lasted approximately 1 h. As shown, CO2 concentration levels consistently remained well below 800 ppm, with minimal fluctuations linked to specific situations. The monitoring of environmental parameters is inherently significant, but there are variables whose specific monitoring can provide valuable insights and serve as an indirect indicator of occupancy levels.
In Figure 10 and Figure 11, measurements taken in a specific room of the building used for didactic activity at the University of Pisa, shown in Figure 6a, are presented. The characteristics of the room tested (room 8) are shown in Table 5.
The data reflect monitoring experiments conducted under two similar climatic conditions with significantly varied occupancy levels (low occupancy in the case of Figure 10 and maximum occupancy level in the case of Figure 11).
Figure 10 displays temperature and CO2 concentration data in a classroom described as Case 1 in Table 6 where a three-hour examination took place, focusing on the second and third hours. Occupancy conditions and dynamics are outlined in the Case 1 of Table 6, with no mechanical ventilation during operation. Figure 11, on the other hand, depicts data from a more dynamic event in the sameclassroom, and on the same day of the week (Saturday), but in a different occasion (final degree examination). Climatic conditions were similar on both days, with reduced differences. Occupancy and dynamics are further defined as Case 2 of Table 6.
As observed, while temperature data are sensitive to capacity and ventilation variations, CO2 concentration emerges as a highly reliable and sensitive indicator of human presence, thus holding greater significance for facility management.

3.2. Methodologies for Ensuring Optimal Comfort and Safety Standards

This subsection explores various methodologies employed to maintain optimal comfort and safety standards in shared public buildings. From advanced HVAC systems to strategic ventilation strategies, we analyze the effectiveness of different approaches in meeting the diverse needs of occupants while ensuring compliance with safety regulations. By analyzing the data collected during these campaigns, we uncover intriguing findings regarding indoor air quality, ventilation effectiveness, and occupant comfort.
In Figure 12 and Figure 13, the results in terms of temperature and CO2 concentration in the structure shown in Figure 7a are presented from a long-term trial spanning approximately 12 days (from Wednesday, 13 September 2023, to Monday, 25 September 2023). Data were collected at 10 min intervals, resulting in 144 data points per day.
The data were collected in the most crowded area of the structure, corresponding to a waiting room for outpatient visits. Upon observing the collected data, a certain periodicity in CO2 concentration results can be noticed. Starting from nighttime values just above 400 ppm, similar to typical outdoor conditions, the peaks of CO2 concentrations are generally above 1000 ppm, but always remain below 1200 ppm. As evident from the CO2 concentration data analysis, the curves closely resemble each other and allow for the clear identification of the 8 weekdays (Monday to Friday), the pre-holiday days (two Saturdays), and the two holiday days (Sunday), albeit with slight differences. Similarly, it is observed that the ventilation system effectively maintains levels below the 1200 ppm threshold. The results shown in Figure 12 and Figure 13 were detected with Smart D Home 9-in-1 type sensors. If the temperature data are significantly affected by climatic temperature fluctuations, those linked to the CO2 concentration appear to be very reliable and capable of effectively identifying the crowded conditions of the structure, allowing for the detection of possible inconsistencies in the visit booking system. As can be seen, in fact, there is a clear periodicity in the pattern of the peaks of CO2 concentration levels.

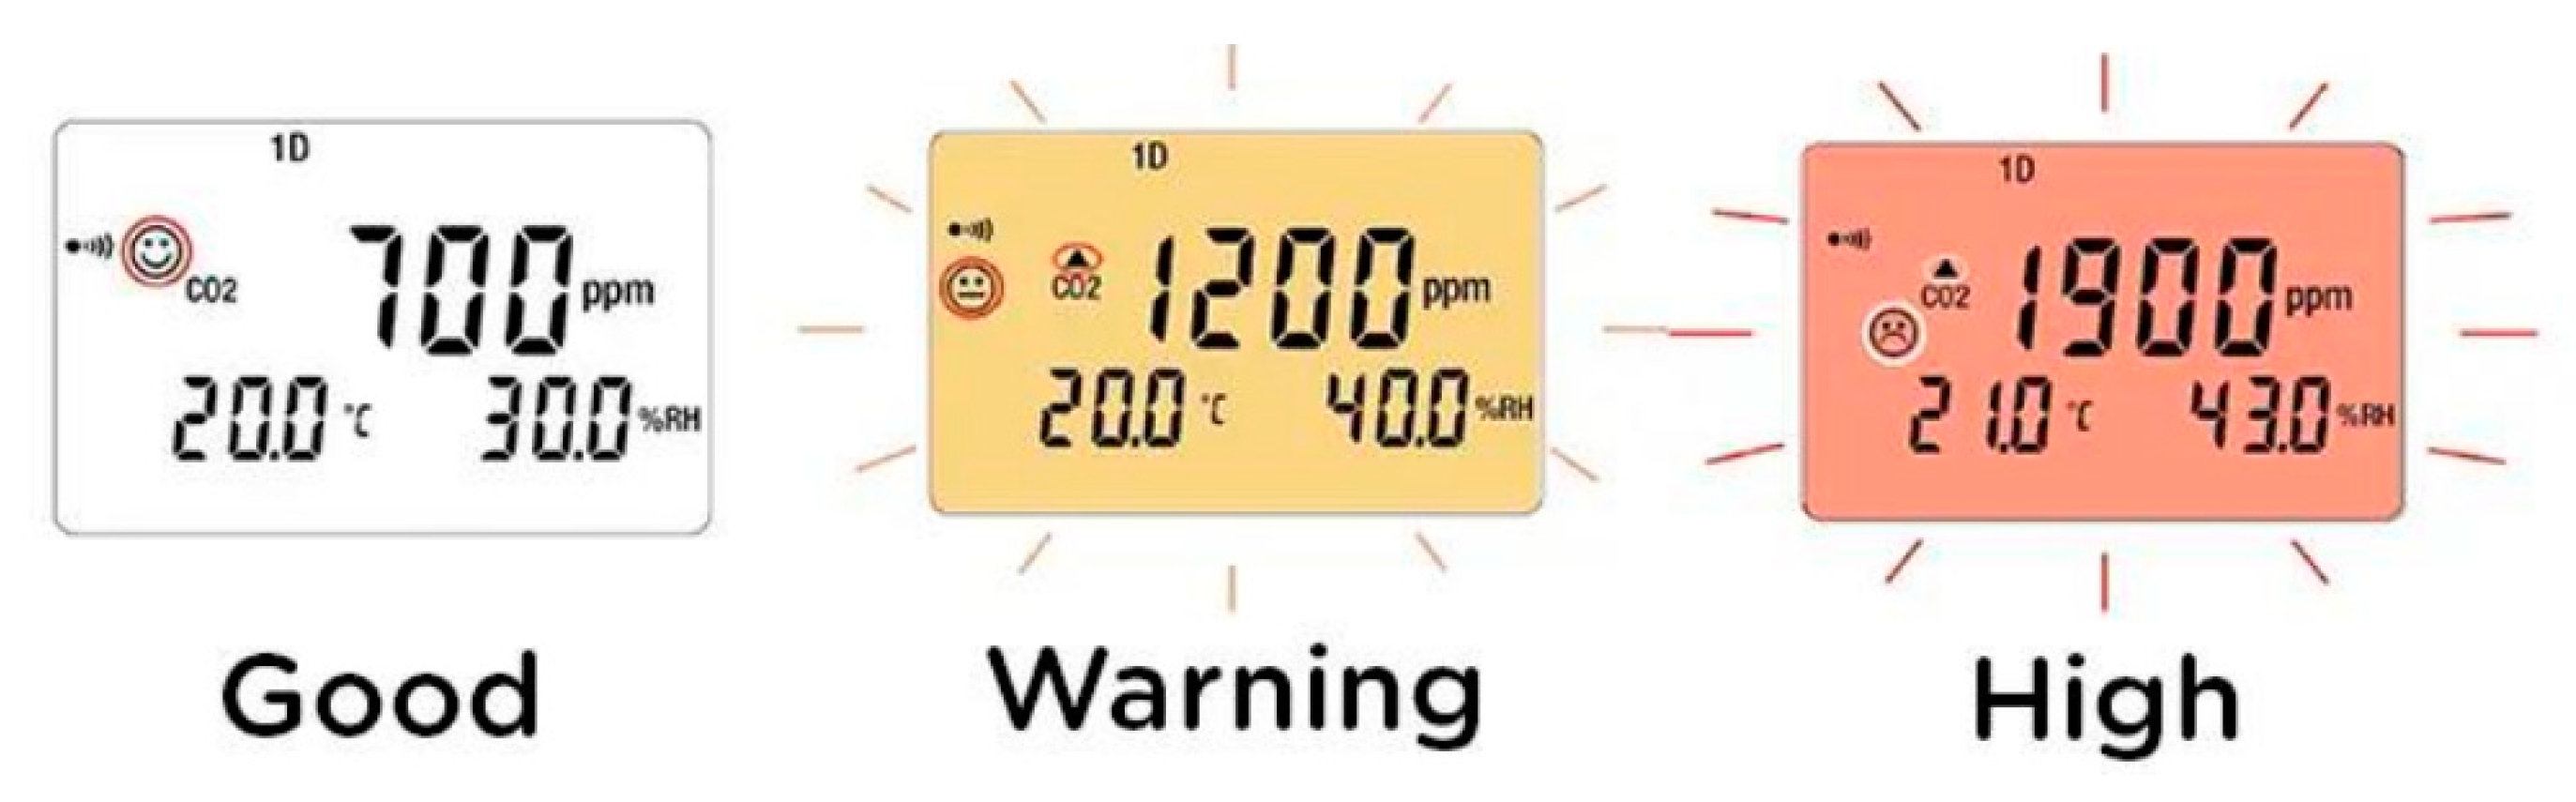
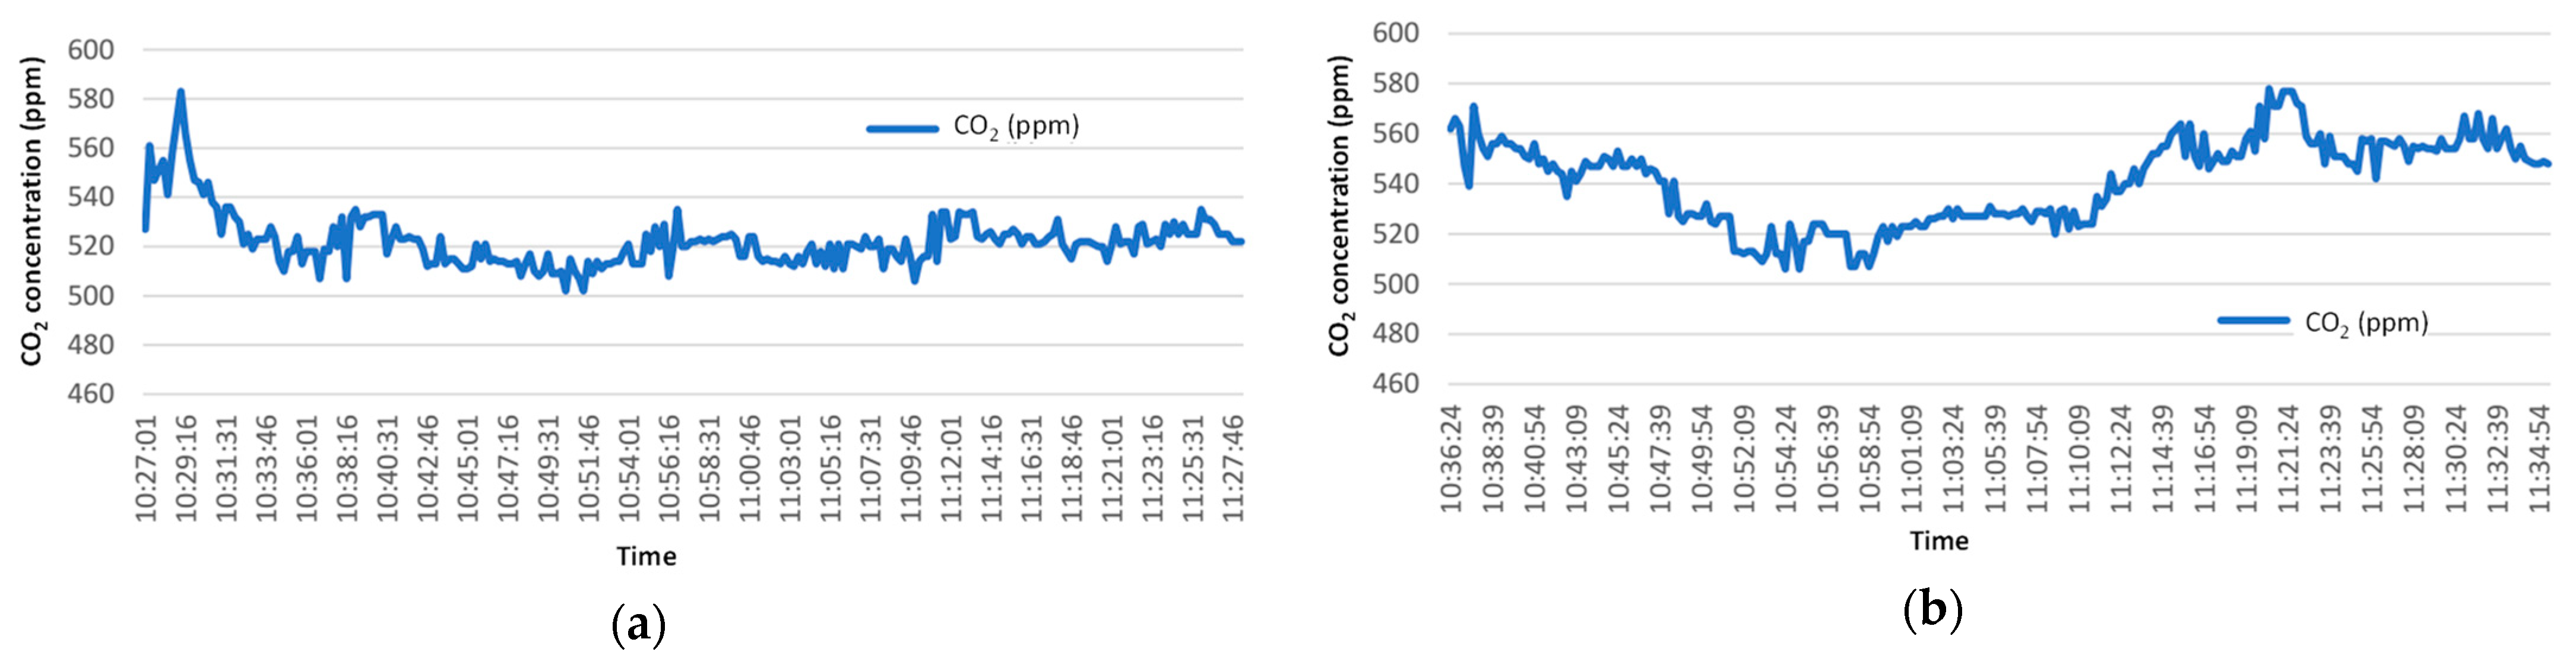
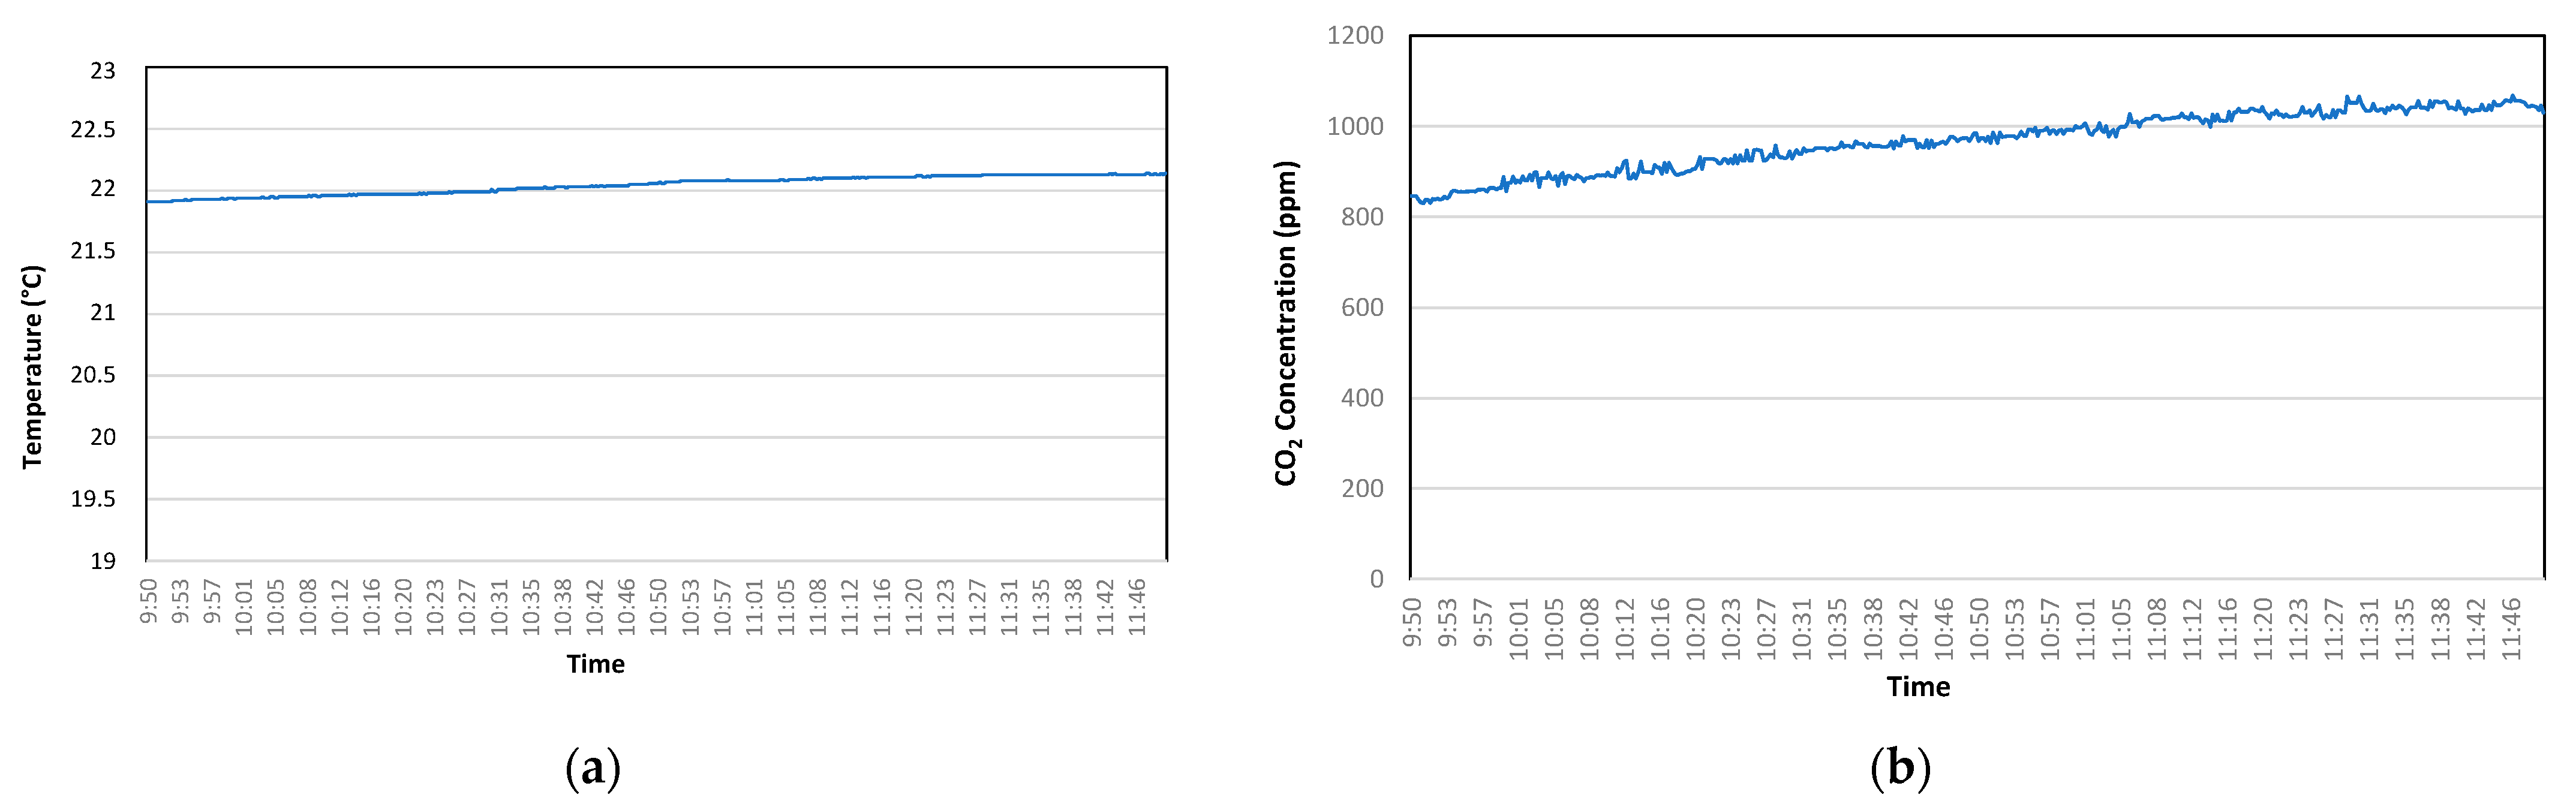
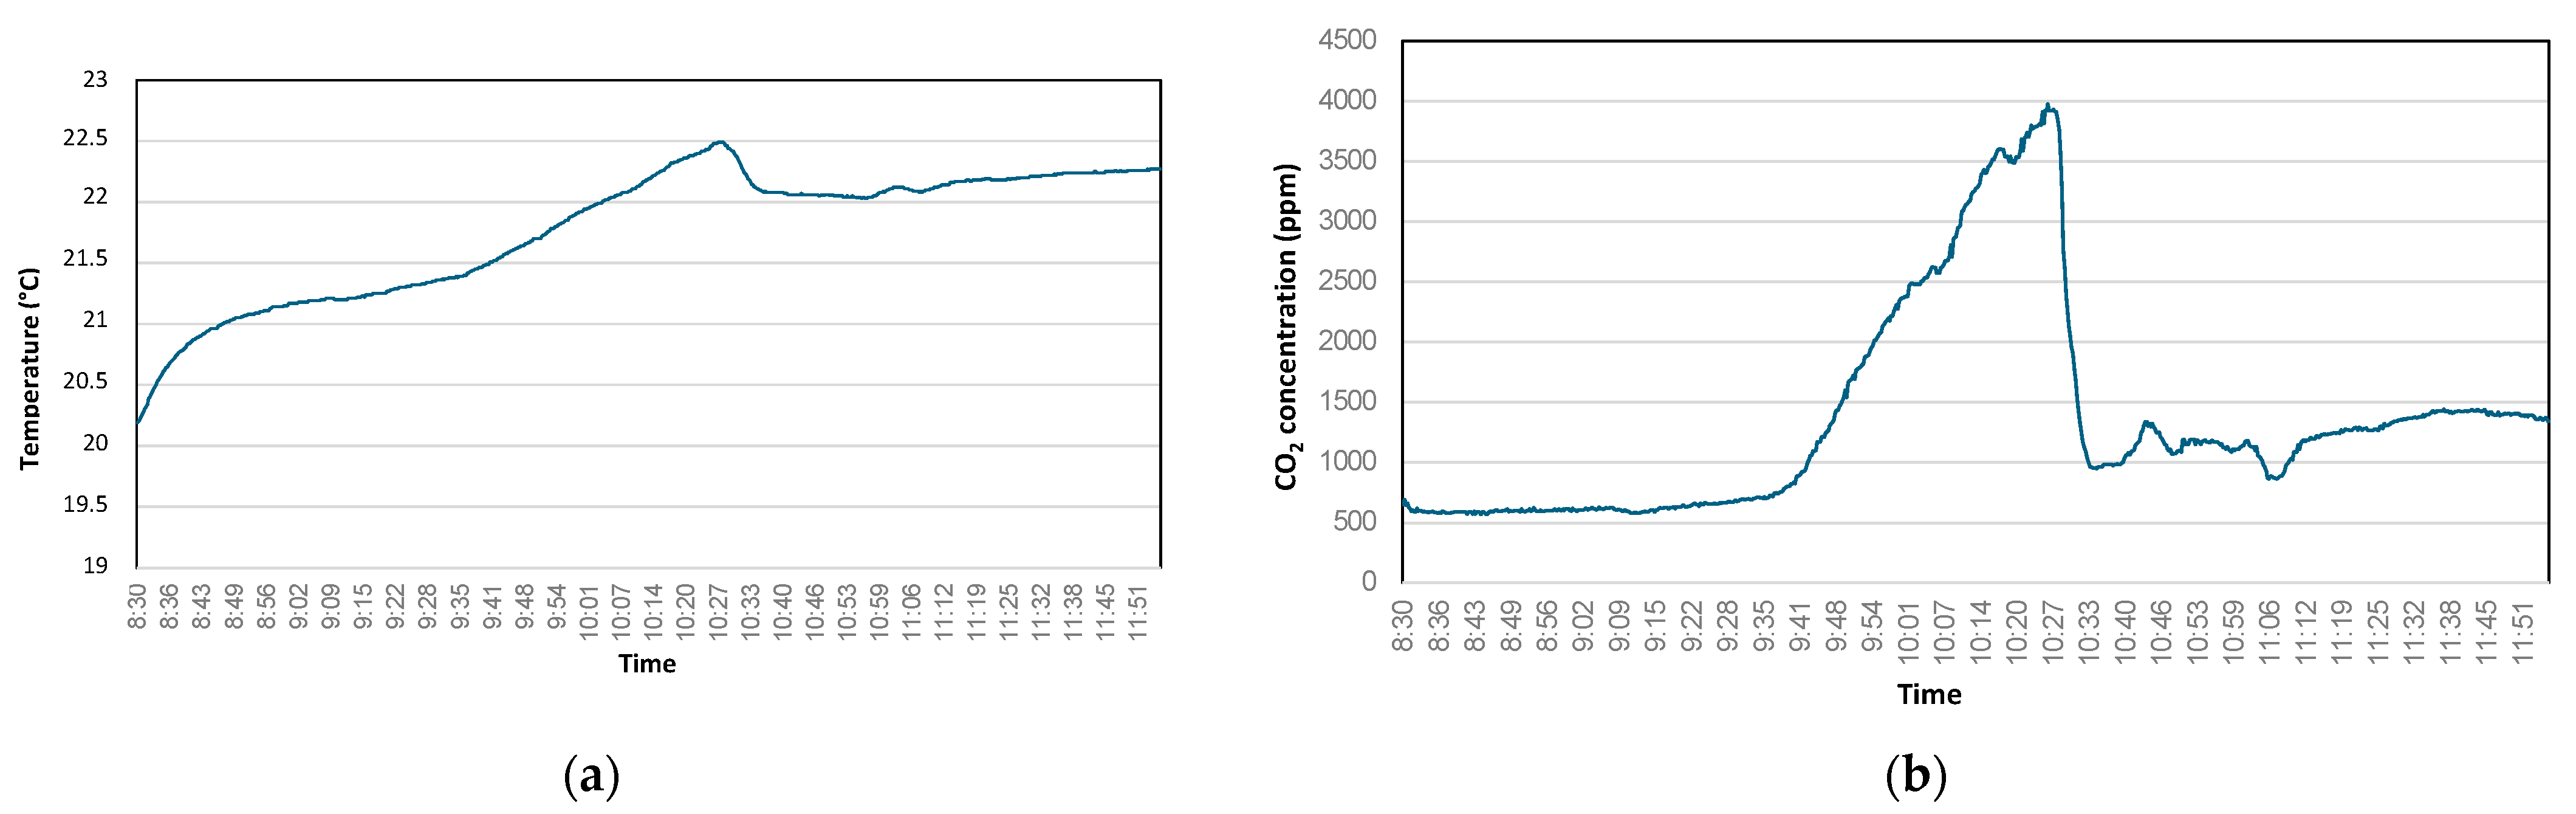
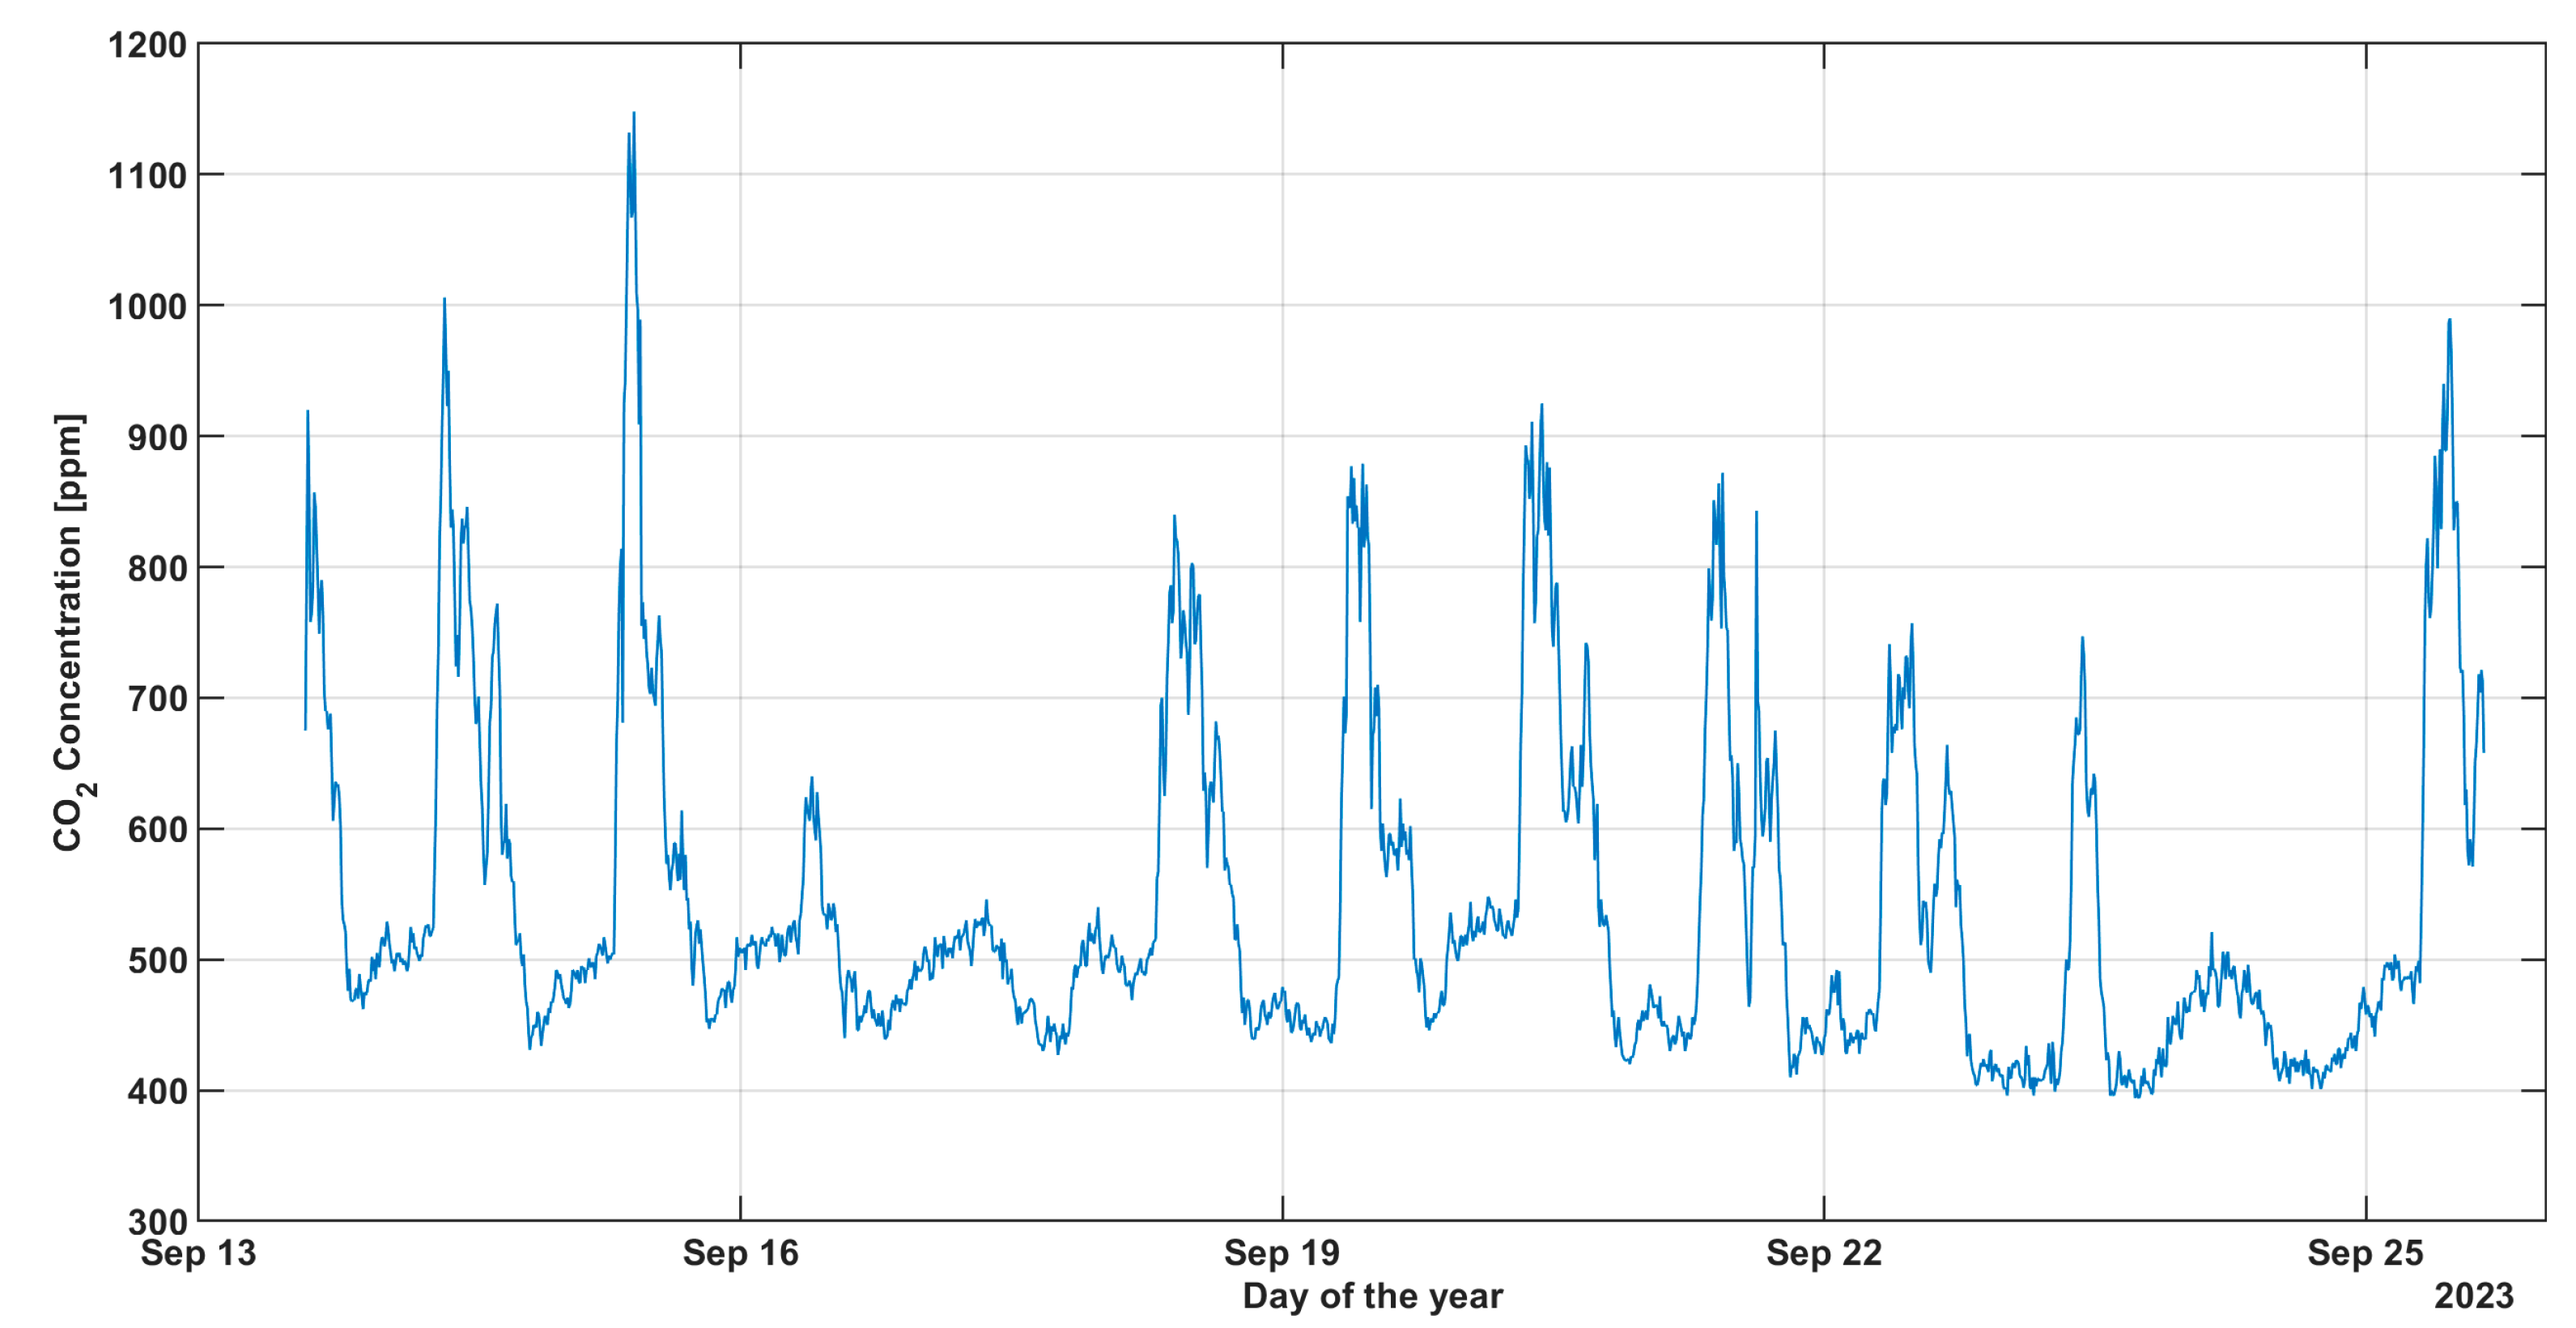
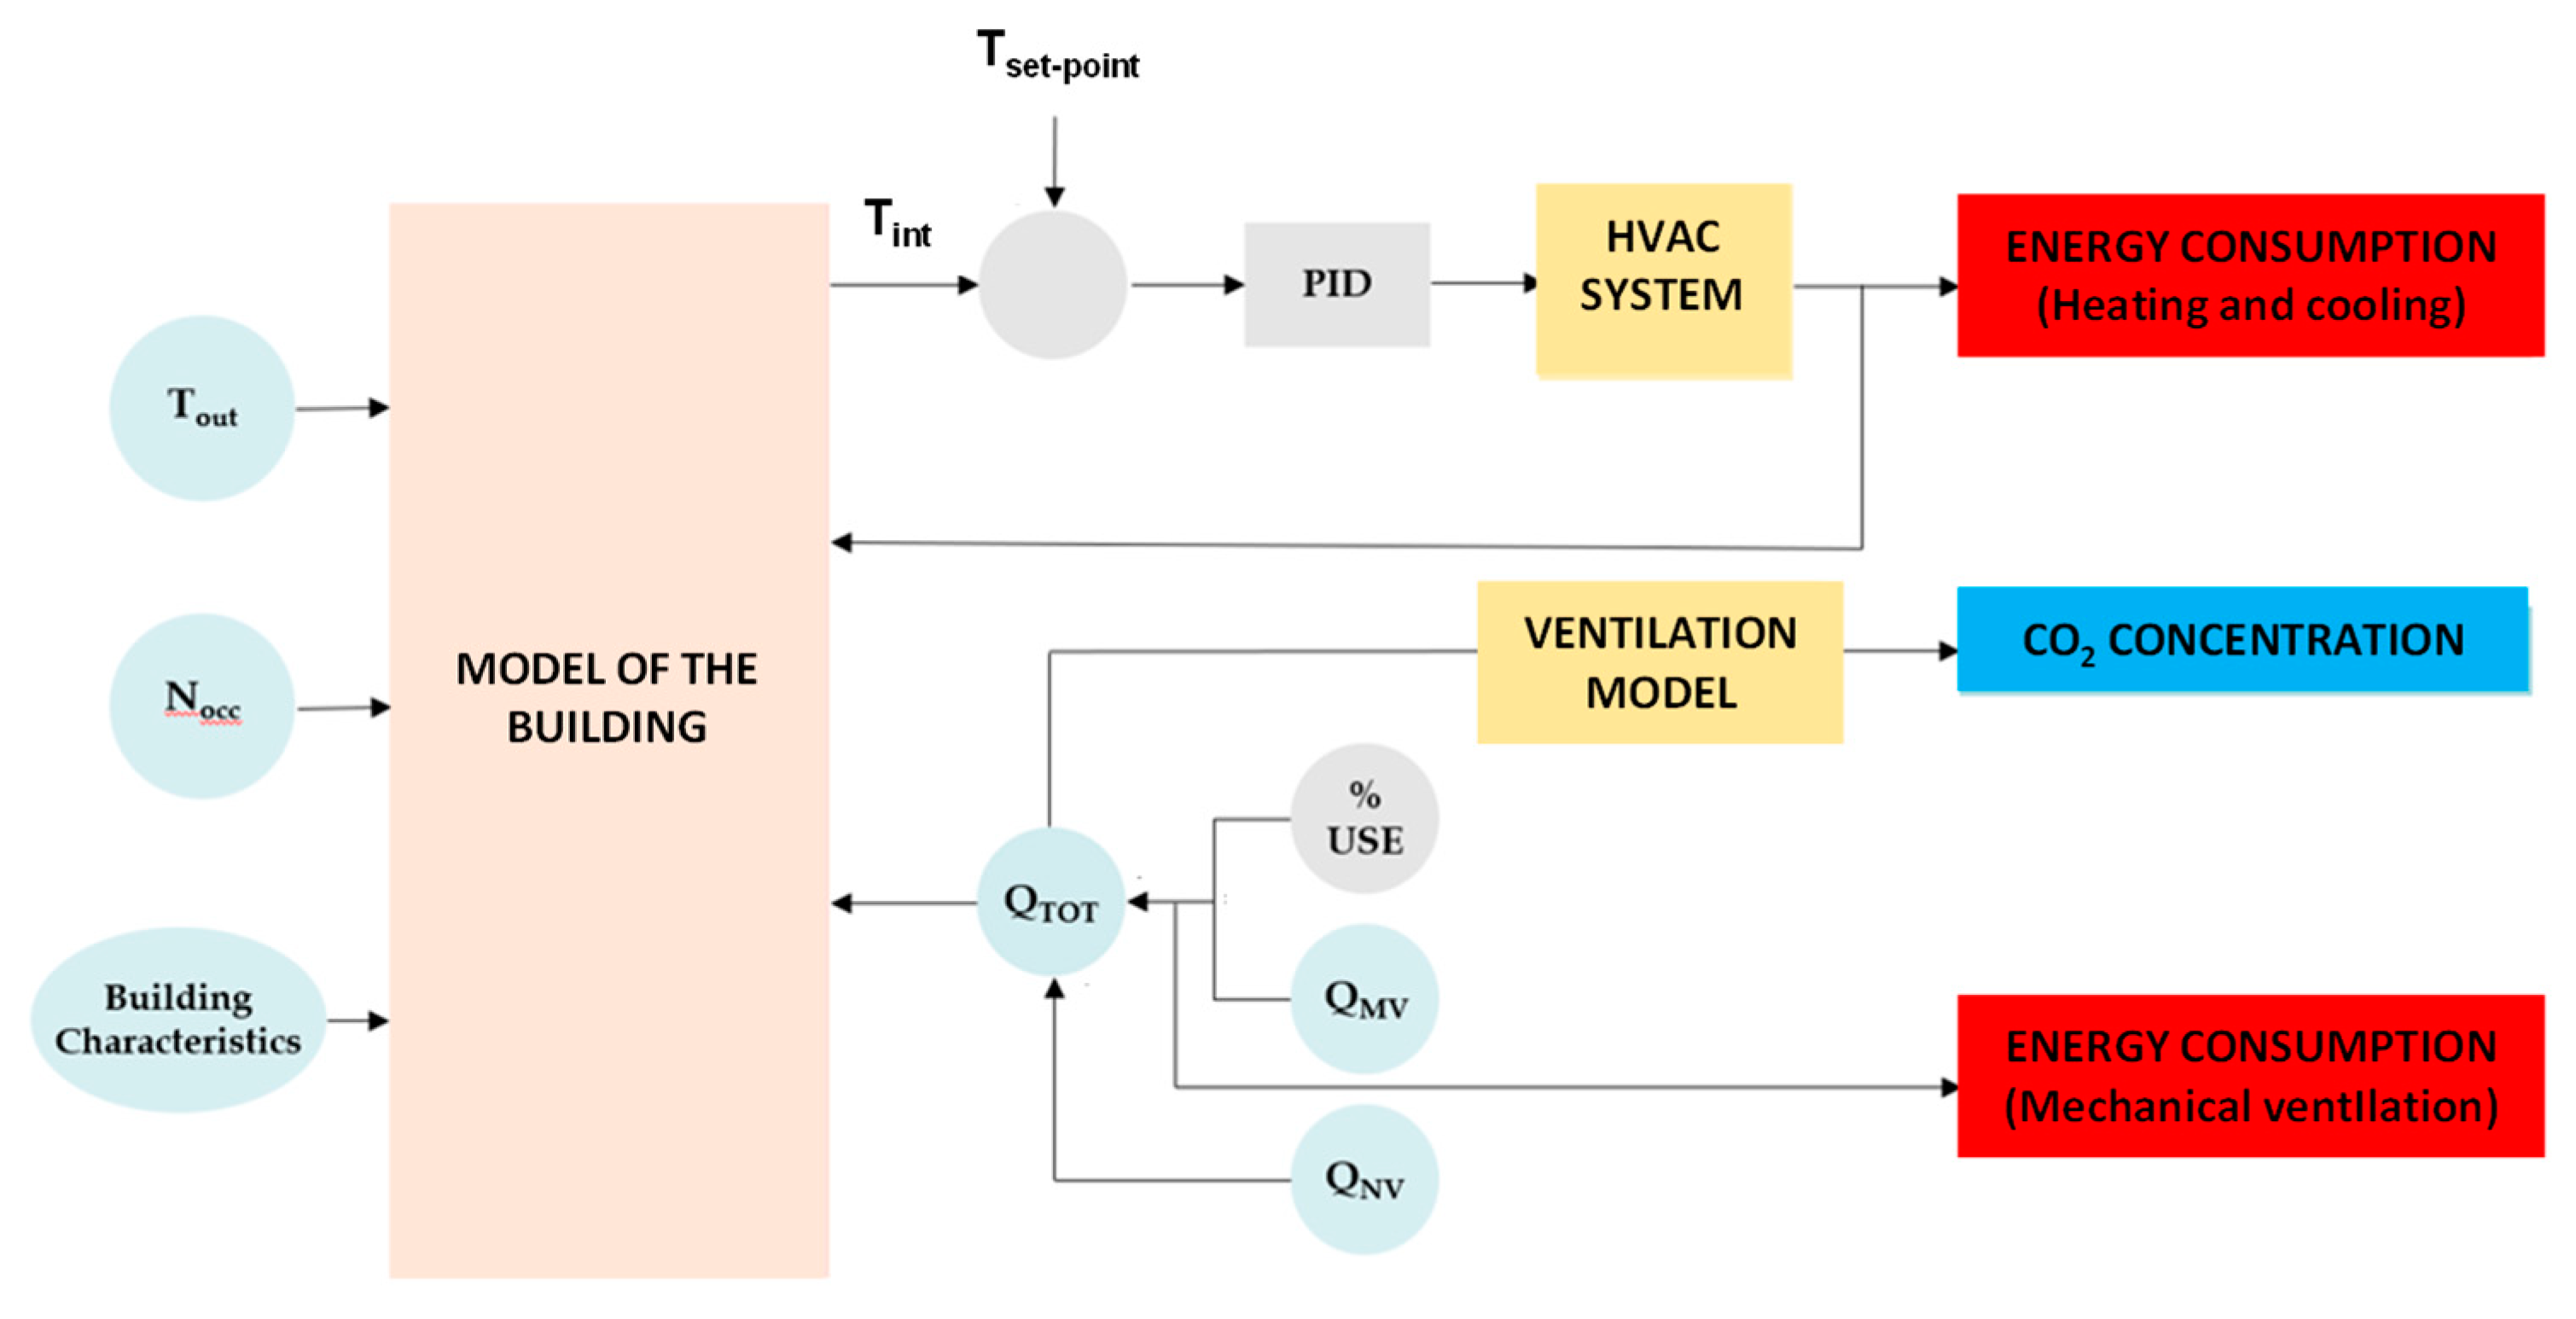
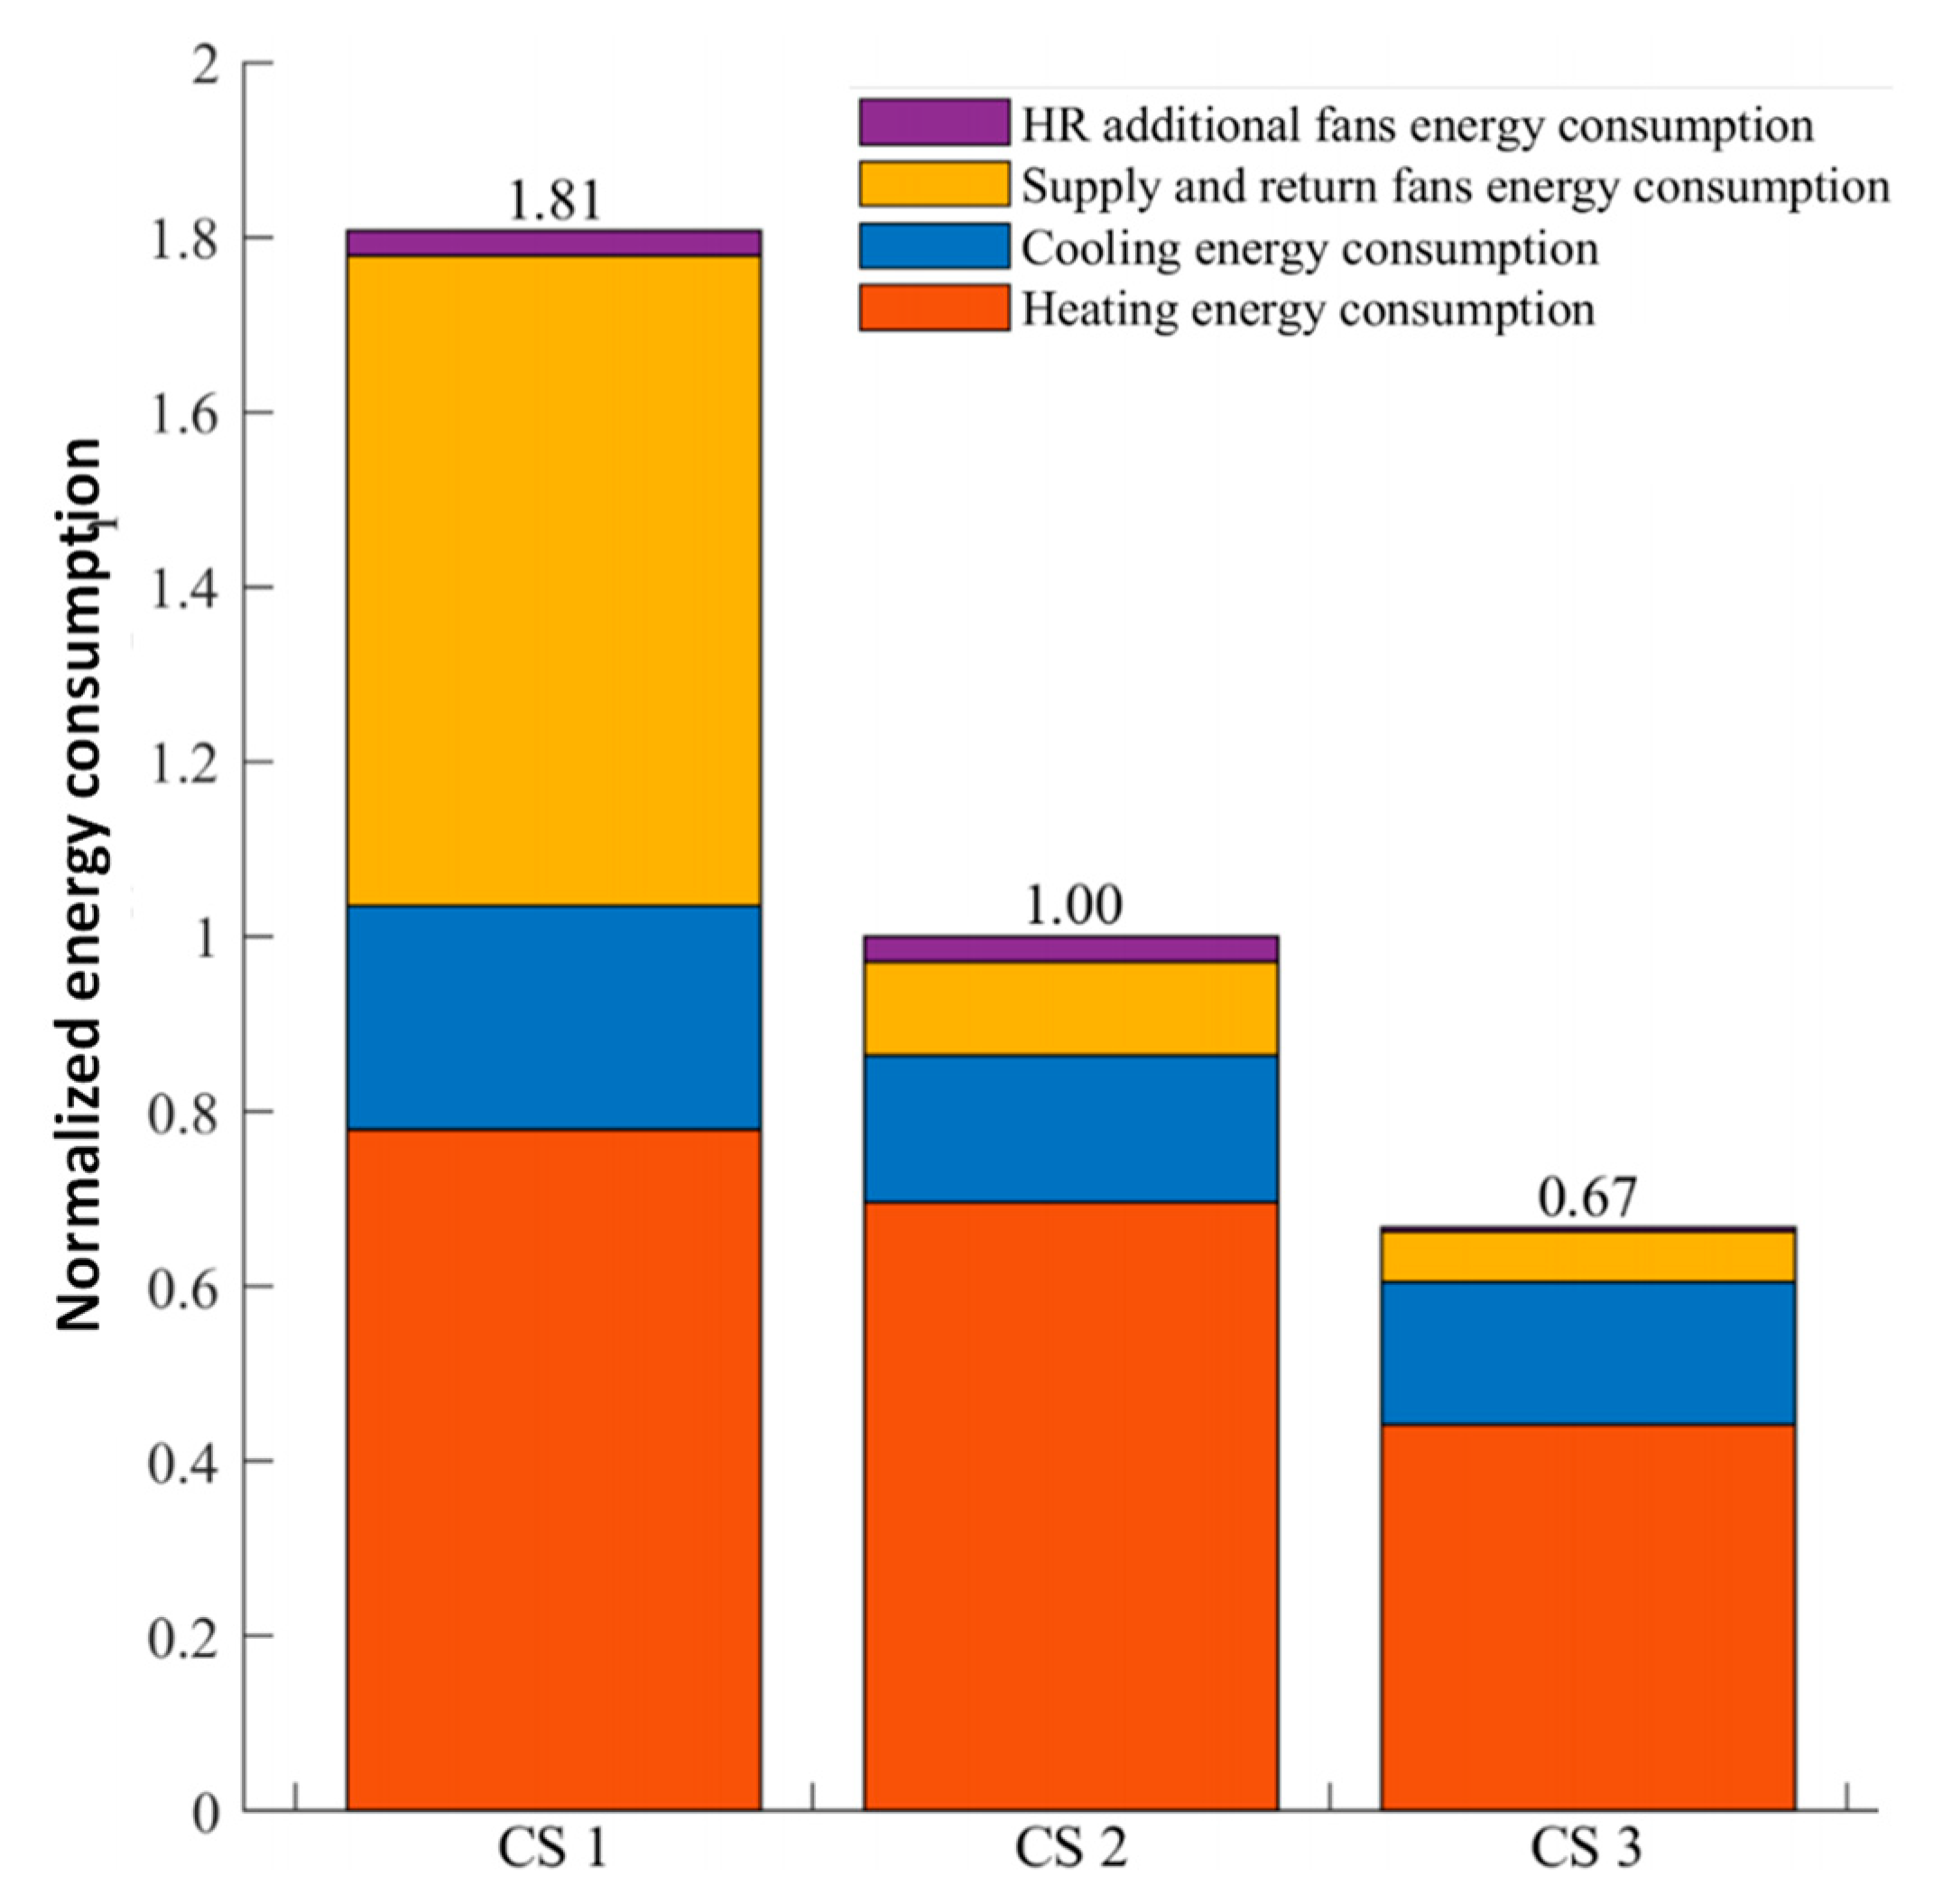
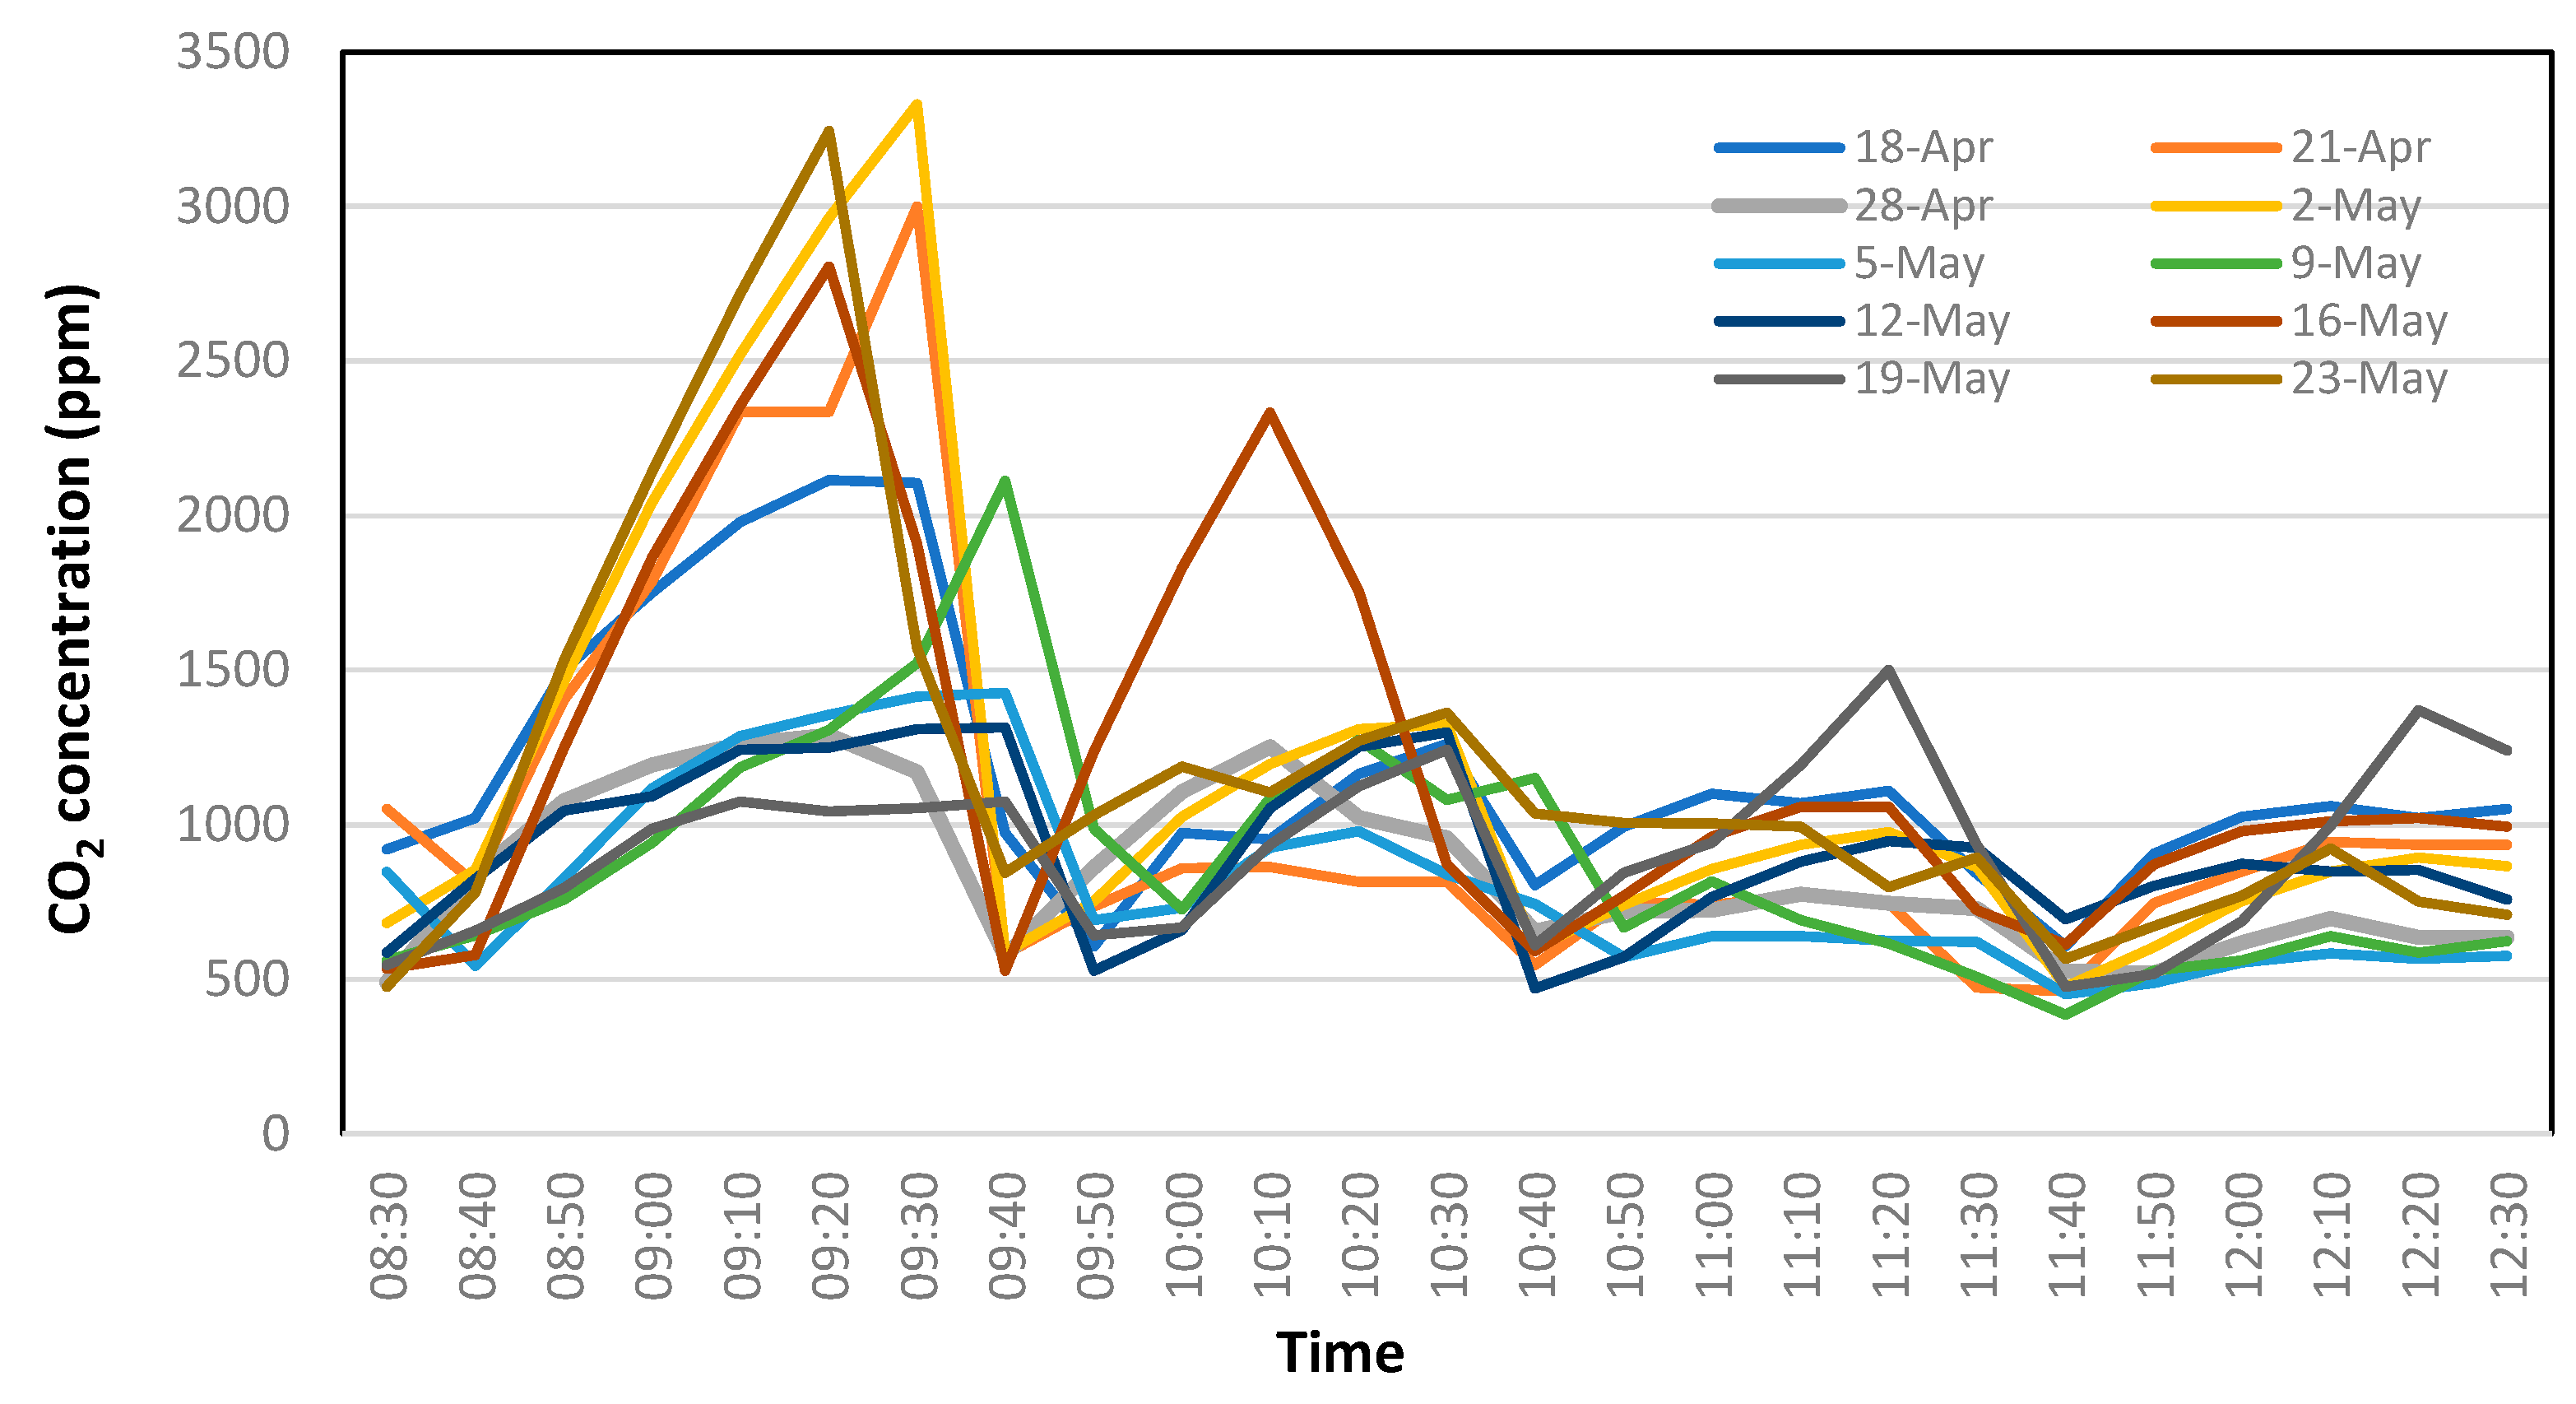
3.3. Insights from Measurement Campaigns: Focus on CO2 Monitoring and Optimization of HVAC Operation

In this section, we try to explain the reason why CO2 concentration can be directly correlated with the occupancy. In a closed volume, the rise in CO2 concentration over time dC { CO 2 } ( t ) / dt depends on the volume of the space, on the number of occupants, on their activity, and on the characteristics of ventilation. In a closed room of volume V with N occ number of occupants, where r ˙ is the production rate of CO2 of each occupant (value depending on the type of person and on the activity), the rate of increase in CO2 concentration with time can be described by the law
dC { CO 2 } ( t ) dt = r ˙   N occ V
The rate of CO2 increase can also be reformulated in terms of the volume available for each person (V/Nocc). In general, the volume is not truly closed because of the air change rate due to infiltrations, natural ventilations, or mechanical ventilation, if active.
As discussed in [18] by one of the authors of the present paper, the CO2 concentration at general time t, C { CO 2 } ( t ) , in general terms can be expressed by the following equation:
C { CO 2 } ( t ) = C { CO 2 } ( t 0 ) exp ( Q V t ) + ( C { CO 2 } ext + r ˙   N occ Q ) ( 1 exp ( Q V t ) )
where C { CO 2 } ( t 0 ) is the concentration measured at the initial time, C { CO 2 } ext is the concentration in the external environment, r ˙ is the production rate of each occupant (value depending on the type of person and on the activity), N occ is the number of occupants, V is the volume of the room and Q is the air change rate, which considers both natural and mechanical ventilation (if present). According to Equation (2), it is possible to compute the airflow rate required to maintain a certain level of CO2. Assuming the starting value of the CO2 concentration, C { CO 2 } ( t 0 ) , equal to the outdoor value (CCO2,out = CCO2,0), and that the CO2 generation rate (r) is constant, the trend of CO2 concentration can be inferred to be:
C { CO 2 } , e q = C { CO 2 } ( t 0 ) + r ˙   N occ Q
When people leave the room and it remains empty, the CO2 concentration typically drops proportionally to the rate of air exchange, until it reaches the external levels. This can be described by the following equation:
C { CO 2 } ( t ) = C { CO 2 } ext + ( C { CO 2 } ( t 0 ) C { CO 2 } ext ) · e Q V   t
From a conceptual point of view, it would seem quite easy to build a physical model of CO2 evolution. However, as can be noticed from Equation (1), concentration depends on many variables that act in a combined manner, and none of them can usually be easily determined. Thus, the monitoring data can be very useful for developing a control system for ventilation systems.
The CO2 concentration data, along with other environmental parameters, can be utilized to develop a model for the optimal control of operation. This model incorporates building characteristics, outdoor temperature, occupancy levels, and ventilation type (natural or mechanical), with airflow rate serving as input data. The model yields trends in energy consumption, CO2 levels, and indoor temperature as output. A building model (containing information about geometrical parameters and main physical characteristics) is essential for assessing energy demands, which are contingent upon the specified input parameters. Figure 14 provides a possible structure of the control system for the HVAC system implemented in a public shared building, similar to the one represented in Figure 6a. The model uses the characteristics of the building, the outdoor temperature, Tout, the number of occupants (Nocc), and the required ventilation rate, QTOT (natural, QNV and/or mechanical, QMV), obtaining as output the trends of energy consumption, the CO2 concentration, and the indoor temperature Tint, that must be close to the defined set-point value (Tset-point). The model of the building is necessary to evaluate the energy demands, which depend on the input parameters set.
By meticulously analyzing the methodology associated with HVAC system operation control based on real occupancy profile and using the Demand Controlled Ventilation (DCV) strategy, it has been observed that adapting the HVAC system’s operation to these specific conditions can result in relevant energy saving compared to conventional pre-COVID-19 approaches, which typically relied on fixed-time scheduling (benchmark).
Via the results described in Figure 15, it can be observed how the control of the CO2 concentration, applied to the teaching structure of Figure 6a, in which mechanical ventilation is activated according to the actual occupancy of the building, can lead to significant energy savings, which increased significantly during the phase following the COVID-19 pandemic. Figure 15 compares three control strategies of the HVAC system: (i) The first strategy, denoted as CS1, represents the solution that was applied to manage the structures during the pandemic emergency, when the ventilation was operating at full capacity during the full time of operation of the structure (from 8:00 to 24:00 for 310 days in a year). (ii) The CS2 strategy, considered as a reference strategy, is the one that was typically active before the COVID phase, when only the temperature control system was active during the operation of the building, while the ventilation system was only activated at some specific hours. (iii) The CS3 strategy implements controlled demand ventilation, capable of varying the ventilation itself based on the maintenance of appropriate CO2 concentration conditions referring to the typical occupancy profile. Strategy CS3 permits obtaining the advantages envisaged by CS1 (i.e., in terms of indoor air quality) while spending less energy than CS2 (i.e., when mechanic ventilation was used less). This comparison emphasizes the potential of designing energy efficiency strategies, and even more significant energy savings may be obtained if more sophisticated control strategies were to be designed.

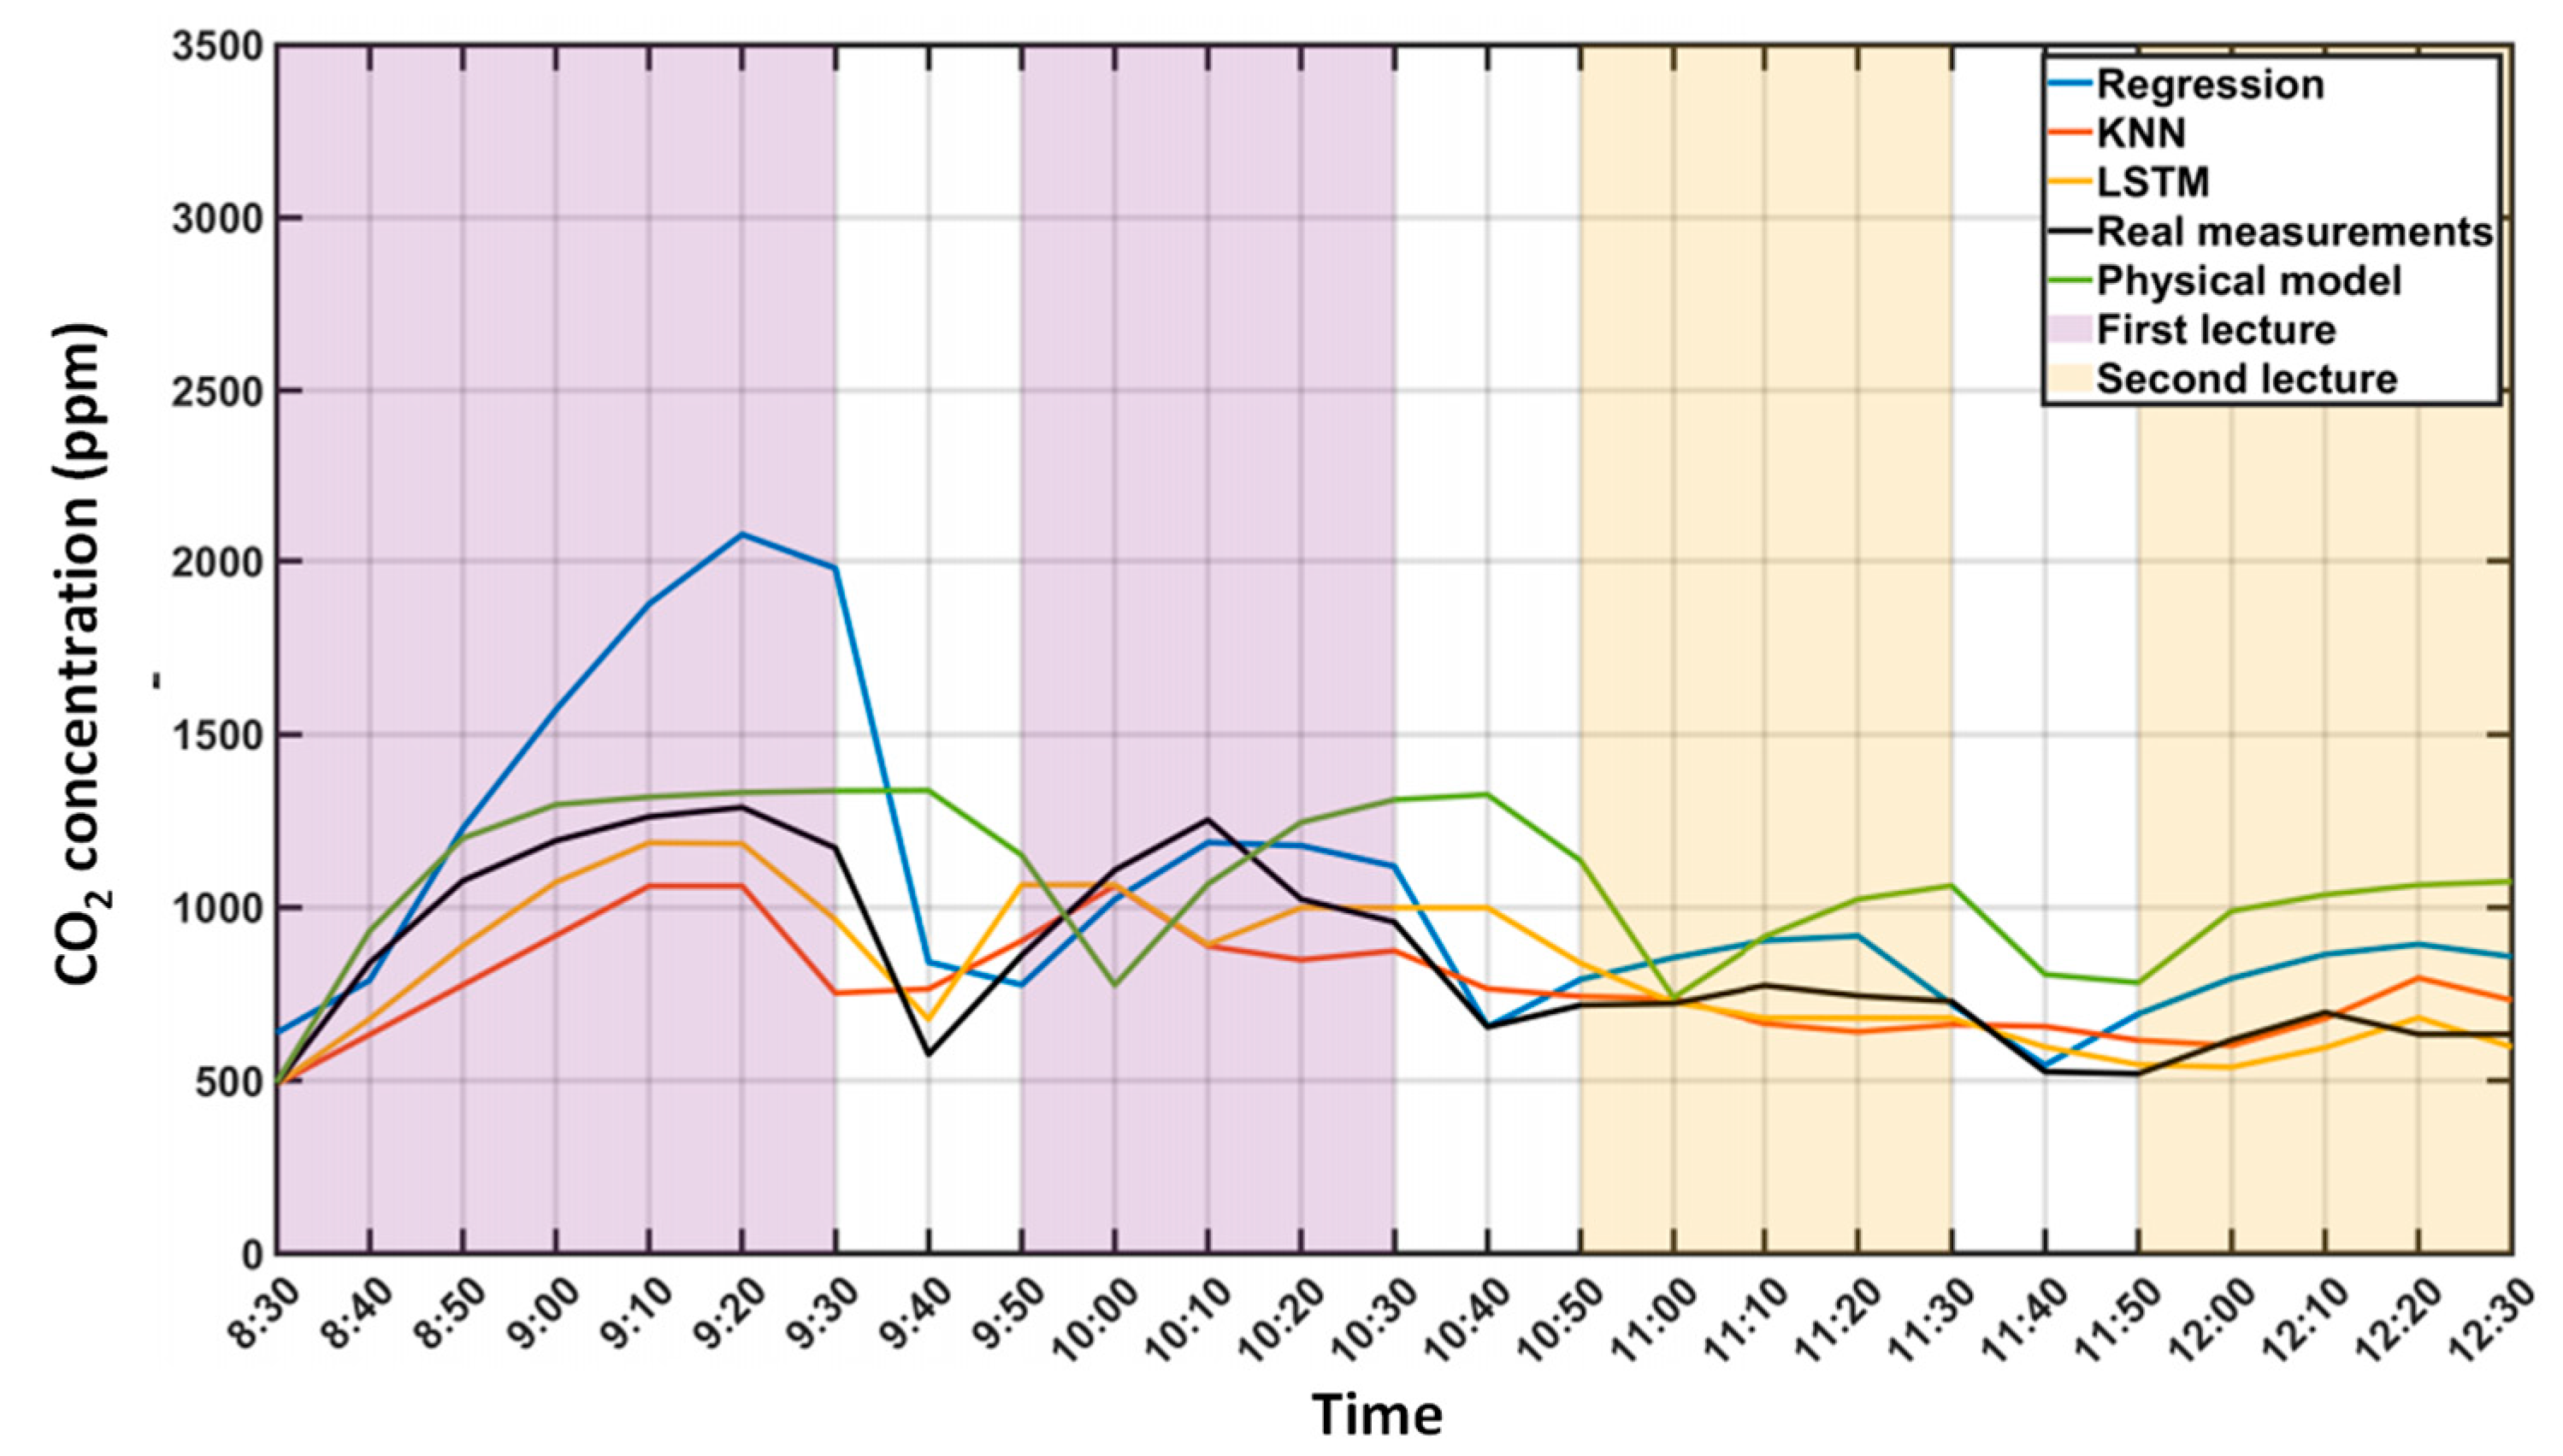
4. Utilization of Monitoring Data for Management Using Machine Learning Methods

The availability of environmental monitoring data is inherently valuable. Hypothetically, a facility manager equipped with such data could utilize them for control purposes and to regulate the operation of systems within the facility. Another avenue worth exploring is the development of machine learning models to forecast potential scenarios based on external data inputs. An intriguing aspect could involve clustering the acquired data to identify correlations between “external” variables and the facility’s operation (e.g., day of the week, time of day, external weather conditions). Essentially, this approach could empower the acquired data with predictive capabilities. While this approach may not be applicable to data concerning environmental safety, it can certainly be implemented to optimize the operation of energy systems. In addition to enhancing facility management strategies, the utilization of monitoring data coupled with machine learning methods offers significant potential for achieving energy savings and optimizing resource allocation.
By harnessing predictive analytics, facilities can develop sophisticated models that analyze historical monitoring data to identify energy consumption patterns and anticipate future trends. Through machine learning techniques such as regression analysis, decision trees, and neural networks, these models can accurately forecast energy demand and recommend proactive measures to minimize waste and optimize energy usage. For example, predictive models can identify peak usage times and suggest adjustments to HVAC systems or lighting schedules to coincide with periods of lower demand, thus reducing energy costs without compromising occupant comfort. Furthermore, by integrating real-time monitoring data with machine learning algorithms, facilities can implement dynamic energy management strategies that respond in real-time to changing environmental conditions and occupancy patterns. This data-driven approach not only reduces energy consumption and associated costs, but also contributes to sustainability goals by minimizing the facility’s environmental footprint. Ultimately, the integration of predictive analytics with real-time monitoring data empowers facilities to implement proactive and energy-efficient management strategies that enhance both operational efficiency and occupant comfort. The measurement of CO2 concentration serves as an effective indicator of human presence in a public space. In another article, the authors of this study analyzed the correlation of this value with occupancy [18,23,24]. However, managing a public space involves several variables that contribute to complicating the scenario. Within the same context, external elements can also intervene, altering the picture even with the same level of occupancy. These variables may include climatic conditions as well as external boundary conditions related to the presence of ventilation in the environment. Ventilation systems may be active, or the windows of a room or of a space may simply be open or partially open. If it is true that the analysis and clustering of monitored data can be valid as predictive tool, the case is valid to use in association with machine learning methods.
To understand this, we observed the same event over an extended period, involving a remarkably similar number of people occupying the same space at the usual times and on the usual days of a week. In ref. [24], a dataset formed by collecting measurements over ten different days, during the lectures of the same classes from 8:30 to 12:30, is described. The time step of the measurements is 10 min, resulting in a total of 40 h of records, and about 240 samples overall. The data were collected during classes of the same professors, with the objective of maintaining similar conditions (e.g., in terms of the number of students in the room, and their activity during the classes). During the first two hours, the number of students was in a range between 100 and 120, while in the following two hours it ranged from 40 to 80. The classroom is detailed in Figure 6b, and the data are presented in Table 5 (room 2). As evident from the data analysis in Figure 16, which illustrates CO2 concentration measurements across ten different events, there is significant variability in the collected data.
This leads to the consideration of developing a machine learning method capable of utilizing the data acquired over the ten days in different climatic conditions but with similar conditions of occupancy, to yield sufficient data for developing a predictive tool. The method has been explained in detail in a recent paper by two of the authors of the present paper in ref. [24]. As depicted in Figure 17, derived from ref. [24], the various predictive methods (four distinct types) calibrated on the 10 datasets prove to be more reliable than a method based solely on physical data. This underscores the potential of using machine learning methods in a predictive context. Developing a building behavior model based on machine learning algorithms can enable the creation of prediction methods that, in addition to monitoring data, can be highly beneficial in enhancing the management of these buildings.
Predictive analytics, powered by machine learning algorithms, enables one to anticipate and address issues before they escalate, leading to more proactive maintenance and cost savings. By analyzing previous data on energy consumption for the same structure, as well as equipment performance and occupancy patterns, predictive analytics can forecast future trends, ensure the correct management of HVAC plants and identify potential issues, such as equipment failures or energy inefficiencies.

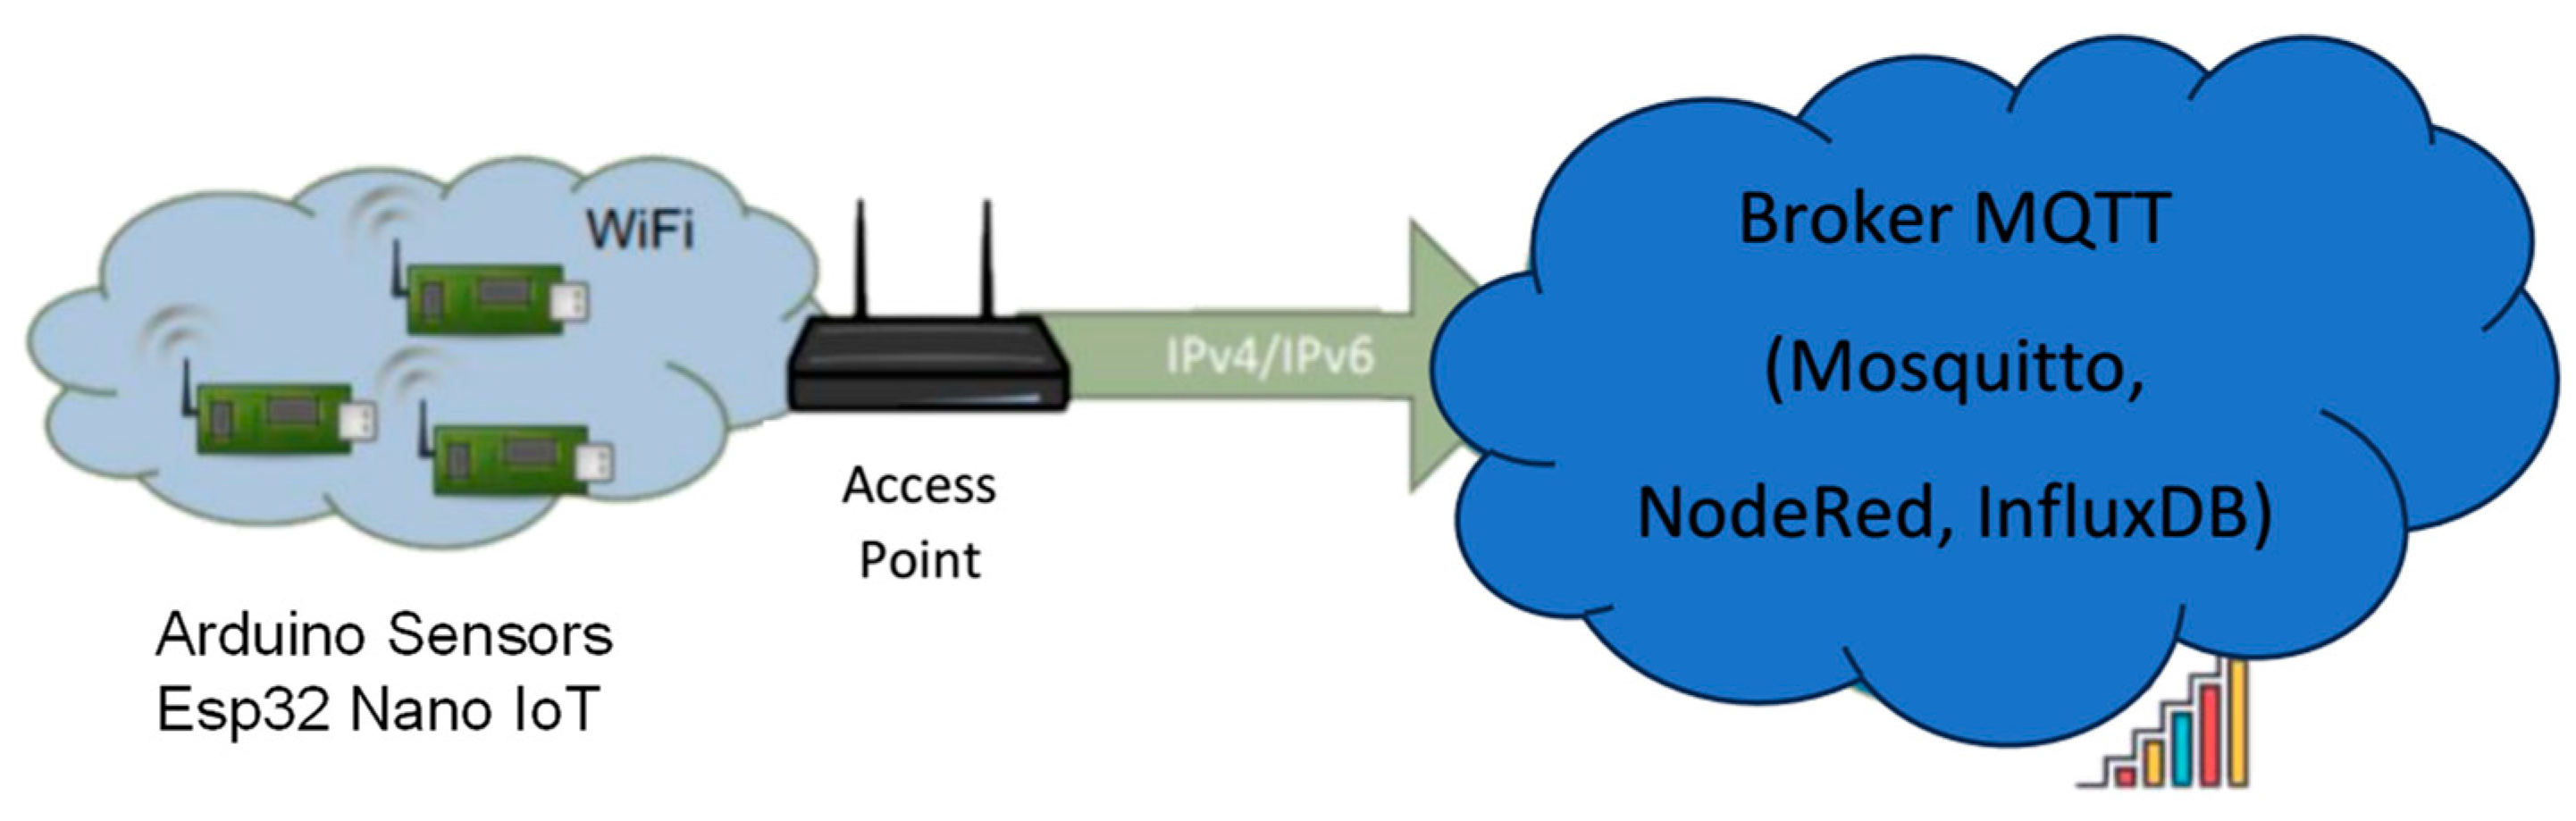
5. Internet of Things (IoT) Network Architecture for Innovative Sensor Management

In addition to monitoring activities and the development of methodologies for optimizing systems and defining protocols, our work has also involved the integration of monitoring data into a network. The role of Internet of Things technology (IoT) in distributed energy systems aiming to achieve energy efficiency, avoid energy wasting, and improve environmental conditions is largely discussed in the recent technical literature, as for example [25,26]. IoT technology includes utilizing smart sensors and renewable energy integration.
Both educational and healthcare facilities are geographically dispersed, and it would be highly beneficial to manage the data remotely.
To address this, we have developed the capability to interface the data through an internal IoT network. This allows the acquired data to be made available in real time. Sensors equipped with an IP address communicate with the IoT network, enabling all authorized users to access the data in real-time. An IoT network is an interconnected system of physical devices, appliances, and other objects embedded with sensors, software, and network connectivity, enabling data collection and exchange. These devices communicate with each other and with centralized systems via the Internet, allowing for remote control, monitoring, and automation. This approach maintains the highest level of network security. Furthermore, these data could be managed by an application, the data of which could be made available to all users with network access credentials. All network users, by logging in with their credentials, could access these data. Figure 18 provides the architecture of the IoT system, as developed in the present work. It consists of three tiers: field level, control, and cloud for the data. It has four essential components:
-
Sensors and Arduino ESP32 Nano IoT Microcontrollers for transmitting environmental data via the MQTT protocol (MQTT Client/Publisher);
-
Server (MQTT Broker) for managing, processing, and visualizing collected data;
-
Hidden WPA2-Personal Local WiFi network for communication between devices;
-
Remote PC for connecting to the central server to view and perform operations on data via VPN.
Within the server, a suite of software is installed for receiving, processing, and storing MQTT messages. The suite includes:
-
MQTT Broker (Mosquitto) for receiving and routing MQTT messages;
-
Node-RED for processing data retrieved from the broker;
-
InfluxDB for storing data in a local database and the real-time visualization of graphs and values on a suitable dashboard.
From a computational standpoint, the IoT network appears to be a reliable system for visualizing the acquired monitoring data within the facilities. However, the issue of reliability persists, particularly concerning self-built sensors, which still exhibit quantitative unreliability. The advantage of the IoT network is that all facility monitoring systems can be controlled centrally using an internal network of the facility, which is intrinsically safer from the point of view of possible cyber-attacks, and this is very relevant in the case of healthcare facilities, which carry a lot of sensitive data about patients. The advantage of using assembled sensors is also that of low cost, despite all the problems related to the reliability of the measurements, which we discussed in Section 2. The architecture proposed in this section is only one of the possible ones capable of being implemented in a system like the one described in Figure 1.

6. Conclusions

The paper has presented collaborative research between the University of Pisa and the Gabriele Monasterio Foundation, addressing different aspects of smart facility management. Through a complete analysis of the different aspects, the analysis developed in this work tries to clarify the importance of environmental monitoring, the reliability of sensors, and the possibilities of using internal IoT networks to optimize the use of shared public buildings, with different purposes. If for a healthcare facility the main issue is checking compliance with space-use protocols and safety regulations, in the case of educational facilities, the aim may also be to obtain significant energy savings. The main findings concern four specific fields of activity.
-
Effectiveness of Environmental Monitoring
The study examined the efficacy of environmental monitoring and data management, highlighting the importance of CO2 concentration measurements. These metrics are used to understand building occupancy levels and inform us about the effectiveness of building use protocols and energy system management strategies. Monitoring helps reduce energy consumption. In a didactic structure, using Demand-Controlled Ventilation (DCV) based on CO2 monitoring, it is possible to achieve over 30% annual energy savings in HVAC systems, compared to what can be achieved with a conventional method, using controlled demand ventilation based on CO2 monitoring. Energy savings reach over 60% if the scenario in which mechanical ventilation is active during the entire opening period is taken into consideration.
-
Sensor Technology Evaluation
Three types of sensors were evaluated, ranging from traditional electronic sensors for stand-alone monitoring to advanced network-compatible sensors. Although numerous latest-generation sensors are available, not all offer consistent quantitative reliability, particularly when it comes to CO2 concentration monitoring. Accurate calibration is essential for the use of this type of sensors, especially those that are marketed to be inserted into IoT-type networks.
-
Predictive Modeling
The data collected by environmental monitoring sensors constitute a precious resource for the creation of predictive models, which, using automatic learning algorithms, will allow predictive programming of flow management and plant operation, allowing the optimization of plant management operations. However, it should be noted that in any case, the predictive algorithms based on environmental monitoring data, although not capable of predicting unexpected dynamics, are still more reliable than physical models.
-
Potential of IoT Networks
The project assessed IoT network capabilities for centralized monitoring across peripheral facilities. Test cases demonstrated the viability of local IoT networks, though cybersecurity concerns necessitate careful consideration. External server-based data flow solutions are discouraged due to security risks. The testing of an IoT network architecture has shown promise in facilitating data monitoring and circulation, enhancing the overall efficiency of the environmental management systems. Prospects of the activity concern the development of a user-friendly app for environmental monitoring, allowing facility managers to access real-time data and optimize system performance remotely.
Another relevant element is the integration with Smart Building Technologies; further integration with smart building technologies could enhance the capabilities of environmental monitoring systems, enabling more sophisticated data analysis and system automation. The methodologies developed in this project can be extended to other sectors beyond education and healthcare, such as commercial buildings and residential complexes, contributing to broader sustainability initiatives.
From an energy analysis perspective, it is important to highlight that the methodology developed can be valuable in defining energy-saving strategies, provided they do not conflict with other regulations. Furthermore, it can be particularly useful in the context of creating facilities with renewable energy-based generation systems. This aligns with the aim of developing structures that will approach Zero Energy Buildings standards.

Author Contributions

Conceptualization, A.F. and E.C.; methodology, A.F. and E.C.; software, A.F., E.C. and S.D.; validation, A.F., E.C., S.D. and R.P.; formal analysis, A.F., E.C., S.D. and R.P.; investigation, A.F., E.C. and S.D.; resources, A.F., E.C. and S.D.; data curation, A.F. and E.C.; writing—original draft preparation, A.F.; writing—review and editing, A.F., E.C., S.D. and R.P.; supervision, A.F., E.C. and S.D.; project administration, A.F. and S.D.; funding acquisition, A.F. and S.D. All authors have read and agreed to the published version of the manuscript.

Funding

The authors gratefully acknowledge the financial support of the Tuscany Region, in the framework of the Research Project “Riaperture in Sicurezza post-COVID: monitoraggio Ambientale e modelli organizzativi innovativi integrati nel sistema TOSCANA” financed in the program RE-START TOSCANA (BANDO RICERCA COVID 19 TOSCANA, Bando pubblico regionale per progetti di ricerca e sviluppo) CUP. I55F21002530002.

Data Availability Statement

This work is based on extensive data collected during experiments conducted in various facilities, both academic and healthcare-related. In addition to the data presented graphically in this article, there are many others that the authors are committed to sharing, subject to compliance with regulations, upon specific request.

Acknowledgments

The authors of this work extend their gratitude to all those who contributed to the referenced activities, particularly Claudio Passino from the Gabriele Monasterio Foundation, for the availability during the experimental analysis of the FGTM structure, Davide Della Vista from the Department of Energy, Systems, Territory, and Constructions for the invaluable support during the assessment and procurement of the measurement devices, Antonio Mugnani of Greeen Data Center of the University of Pisa for the support in structuring the IoT network, and Ekaterina Dudkina, Matilde Hammoud, Giulia Lamberti, Maurizio Notargiacomo, Giuseppe Russo and Andrea Sodini for their collaboration in the development of some of the procedures outlined in this article and in collecting the data.

Conflicts of Interest

The authors declare no conflicts of interest. The funders had no role in the design of the study; in the collection, analyses, or interpretation of data; in the writing of the manuscript; or in the decision to publish the results.

References

  1. Settimo, G.; Manigrasso, M.; Avino, P. Indoor air quality: A focus on the European legislation and state-of-the-art research in Italy. Atmosphere 2020, 11, 370. [Google Scholar] [CrossRef]
  2. Fokaides, P.A.; Apanaviciene, R.; Černeckiene, J.; Jurelionis, A.; Klumbyte, E.; Kriauciunaite-Neklejonoviene, V.; Pupeikis, D.; Rekus, D.; Sadauskiene, J.; Seduikyte, L.; et al. Research Challenges and Advancements in the field of Sustainable Energy Technologies in the Built Environment. Sustainability 2020, 12, 8417. [Google Scholar] [CrossRef]
  3. Baqer, N.S.; Mohammed, H.A.; Albahri, A.; Zaidan, A.; Al-Qaysi, Z.; Albahri, O. Development of the Internet of Things sensory technology for ensuring proper indoor air quality in hospital facilities: Taxonomy analysis, challenges, motivations, open issues and recommended solution. Measurement 2022, 192, 110920. [Google Scholar] [CrossRef]
  4. Alonso, M.J.; Wolf, S.; Jørgensen, R.B.; Madsen, H.; Mathisen, H.M. A methodology for the selection of pollutants for ensuring good indoor air quality using the de-trended cross-correlation function. J. Affect. Disord. 2022, 209, 108668. [Google Scholar]
  5. Shen, X.; Zhang, H.; Li, Y.; Qu, K.; Zhao, L.; Kong, G.; Jia, W. Building a satisfactory indoor environment for healthcare facility occupants: A literature review. J. Affect. Disord. 2023, 228, 109861. [Google Scholar] [CrossRef]
  6. Butt, M.A.; Voronkov, G.S.; Grakhova, E.P.; Kutluyarov, R.V.; Kazanskiy, N.L.; Khonina, S.N. Environmental monitoring: A comprehensive review on optical waveguide and fiber-based sensors. Biosensors 2022, 12, 1038. [Google Scholar] [CrossRef]
  7. Broday, E.E.; Gameiro da Silva, M.C. The role of internet of things (IoT) in the assessment and communication of indoor environmental quality (IEQ) in buildings: A review. Smart Sustain. Built Environ. 2023, 12, 584–606. [Google Scholar] [CrossRef]
  8. Anik, S.M.H.; Gao, X.; Meng, N.; Agee, P.R.; McCoy, A.P. A cost-effective, scalable, and portable IoT data infra-structure for indoor environment sensing. J. Build. Eng. 2022, 49, 104027. [Google Scholar] [CrossRef]
  9. Soheli, S.J.; Jahan, N.; Hossain, B.; Adhikary, A.; Khan, A.R.; Wahiduzzaman, M. Smart greenhouse monitoring system using internet of things and artificial intelligence. Wirel. Pers. Commun. 2022, 124, 3603–3634. [Google Scholar] [CrossRef]
  10. Tien, P.W.; Wei, S.; Darkwa, J.; Wood, C.; Calautit, J.K. Machine learning and deep learning methods for enhancing building energy efficiency and indoor environmental quality—A review. Energy AI 2022, 10, 100198. [Google Scholar] [CrossRef]
  11. Marzouk, M.; Atef, M. Assessment of Indoor Air Quality in Academic Buildings Using IoT and Deep Learning. Sustainability 2022, 14, 7015. [Google Scholar] [CrossRef]
  12. Wang, J.; Jiang, L.; Yu, H.; Feng, Z.; Castaño-Rosa, R.; Cao, S.-J. Computer vision to advance the sensing and control of built environment towards occupant-centric sustainable development: A critical review. Renew. Sustain. Energy Rev. 2024, 192, 114165. [Google Scholar] [CrossRef]
  13. Karatzas, S.; Papageorgiou, G.; Lazari, V.; Bersimis, S.; Fousteris, A.; Economou, P.; Chassiakos, A. A text analytic framework for gaining insights on the integration of digital twins and machine learning for optimizing indoor building environmental performance. Dev. Built Environ. 2024, 2024, 100386. [Google Scholar] [CrossRef]
  14. Deng, X.; Zhang, Y.; Qi, H. Toward Smart Multizone HVAC Control by Combining Context-Aware System and Deep Reinforcement Learning. IEEE Internet Things J. 2022, 9, 21010–21024. [Google Scholar] [CrossRef]
  15. Farzaneh, H.; Malehmirchegini, L.; Bejan, A.; Afolabi, T.; Mulumba, A.; Daka, P.P. Artificial intelligence evolution in smart buildings for energy efficiency. Appl. Sci. 2021, 11, 763. [Google Scholar] [CrossRef]
  16. Bottino-Leone, D.; Balest, J.; Cittati, V.M.; Pezzutto, S.; Fraboni, R.; Beltrami, F. Review of Existing Tools for the Assessment of European Building Stock Energy Demand for Space Heating and Cooling. Sustainability 2024, 16, 2462. [Google Scholar] [CrossRef]
  17. Amanowicz, Ł.; Ratajczak, K.; Dudkiewicz, E. Recent advancements in ventilation systems used to decrease energy consumption in buildings—Literature review. Energies 2023, 16, 1853. [Google Scholar] [CrossRef]
  18. Franco, A.; Leccese, F. Measurement of CO2 concentration for occupancy estimation in educational buildings with energy efficiency purposes. J. Build. Eng. 2020, 32, 101714. [Google Scholar] [CrossRef]
  19. Franco, A. Balancing User Comfort and Energy Efficiency in Public Buildings through Social Interaction by ICT Systems. Systems 2020, 8, 29. [Google Scholar] [CrossRef]
  20. Anastasi, G.; Bartoli, C.; Conti, P.; Crisostomi, E.; Franco, A.; Saponara, S.; Testi, D.; Thomopulos, D.; Vallati, C. Optimized energy and air quality management of shared smart buildings in the COVID-19 scenario. Energies 2021, 14, 2124. [Google Scholar] [CrossRef]
  21. Rashid, S.J.; Alkababji, A.; Khidhir, A.M. Communication and network technologies of IoT in smart building: A survey. NTU J. Eng. Technol. 2021, 1, 1–18. [Google Scholar] [CrossRef]
  22. Mobaraki, B.; Lozano-Galant, F.; Soriano, R.P.; Pascual, F.J.C. Application of low-cost sensors for building monitoring: A systematic literature review. Buildings 2021, 11, 336. [Google Scholar] [CrossRef]
  23. Franco, A.; Crisostomi, E.; Hammoud, M. Advanced Monitoring Techniques for Optimal Control of Building Management Systems for Reducing Energy Use in Public Buildings. Int. J. Sustain. Dev. Plan. 2023, 18, 2025–2035. [Google Scholar] [CrossRef]
  24. Dudkina, E.; Crisostomi, E.; Franco, A. Prediction of CO2 in Public Buildings. Energies 2023, 16, 7582. [Google Scholar] [CrossRef]
  25. Daissaoui, A.; Boulmakoul, A.; Karim, L.; Lbath, A. IoT and big data analytics for smart buildings: A survey. Procedia Comput. Sci. 2020, 170, 161–168. [Google Scholar] [CrossRef]
  26. Metallidou, C.K.; Psannis, K.E.; Egyptiadou, E.A. Energy efficiency in smart buildings: IoT approaches. IEEE Access 2020, 8, 63679–63699. [Google Scholar] [CrossRef]
Figure 1. Monitoring data and their possible use for the smart control of the structure.
Buildings 14 01077 g001
Figure 2. Typical commercial analogic sensors for simultaneous measurement of T, RH and CO2.
Buildings 14 01077 g002
Figure 3. Typical commercial analogic sensors based on Z-Wave Communication protocol.
Buildings 14 01077 g003
Figure 4. Multicomposed sensor obtained with Arduino ESP connected with specific sensors.
Buildings 14 01077 g004
Figure 5. Comparison of temperature measurement in the same position: data from a typical analogic sensor (a) and a modern sensor for an IoT network (b).
Buildings 14 01077 g005
Figure 6. One of the didactic structures of the University of Pisa object of the analysis: an aerial vision in (a) and an indoor picture of a specific classroom in (b).
Buildings 14 01077 g006
Figure 7. The two medical structures of the FTGM object of analysis, in Pisa (a) and Massa (b).
Buildings 14 01077 g007
Figure 8. Indicative level of CO2 concentration in indoor environment.
Buildings 14 01077 g008
Figure 9. CO2 concentration in two different parts of “hospital wards” of the structure in Figure 7b (hospital ward (a) and nurses’ room (b)).
Buildings 14 01077 g009
Figure 10. Data from the monitoring analysis (temperature (a) and CO2 (b)) of the room 8 in Table 5 in the situation described as Case 1 in Table 6.
Buildings 14 01077 g010
Figure 11. Data from the monitoring analysis (temperature and CO2) of the room 8 in Table 5 in the situations described as Case 2 in Table 6.
Buildings 14 01077 g011
Figure 12. Temperature trend for long-period analysis (12 days) of the medical structure of Figure 7a.
Buildings 14 01077 g012
Figure 13. CO2 concentration from a 12-day analysis of the medical structure shown in Figure 7a.
Buildings 14 01077 g013
Figure 14. A possible scheme for the control of HVAC plants based on use of monitoring data.
Buildings 14 01077 g014
Figure 15. Normalized energy consumption with DCV strategies (CS3) with respect to a normal strategy (CS2) based on time operation and COVID-19 (CS1) in the structure of Figure 6a.
Buildings 14 01077 g015
Figure 16. Monitoring data obtained in the ten-day analysis (from 18 April to 23 May) in a classroom of the University of Pisa, defined as room 2 in Table 5.
Buildings 14 01077 g016
Figure 17. Predictive profile of the CO2 concentration for the situation described in Figure 16, obtained with different machine learning methods and comparison with physical model.
Buildings 14 01077 g017
Figure 18. Scheme of the IoT network for data exchange.
Buildings 14 01077 g018
Table 1. Evolution of sensors for building automation purposes: from classic analogic sensors to modern IoT sensors.
Classic Analogic SensorsModern Sensors
Technology and MiniaturizationLarger and bulkier. The technology was less advanced, and sensors relied on analog signal processing.Due to miniaturization and advancements, microelectronics (MEMS) are smaller, more compact, and capable of higher precision
Integration and MultifunctionalityStand-alone devices with limited integration capabilities. Each sensor had a specific functionMultifunctional, capable of measuring multiple parameters simultaneously. Sensors are often integrated into complex systems and networks
Digital Signal ProcessingAnalog signal processing was predominant. The output from sensors was often analog and required additional processing for interpretationDigital signal processing is prevalent. Modern sensors often provide digital outputs, compatible with digital systems. This allows for easier integration, data storage, and analysis
Wireless ConnectivityCommunication between sensors and other devices often relied on wired connectionsSensors are equipped with wireless communication capabilities, allowing them to be part of the Internet of Things (IoT). This enables remote monitoring, real-time data transmission, and integration into smart systems
Accuracy and SensitivitySensor accuracy and sensitivity were good compared to today’s standardsAdvances in materials, manufacturing processes, and calibration techniques have led to sensors with good accuracy and sensitivity
Cost and AccessibilitySensor technology was often expensive, limiting widespread adoptionAdvances in manufacturing have led to reduced production costs, making sensors more affordable and accessible
Table 2. Specific characteristics of the sensors used for the measurements of CO2 concentration.
Feature/Sensor TechnologyCA 1510Smart D Home
9 in 1
Sensiron SGP30
Range0–5000 ppm0–5000 ppm 400–60,000 ppm ± 50 ppm
MethodNon-dispersive infrared (NDIR) technology Non declaredIndirect measurements of ethanol and hydrogen concentration
AccuracyHighAverageLow
FlexibilityLow (cannot be read from remote)Low (one gateway per building, data cannot be simply downloaded)High
Simplicity of useHighHighLow
(sensors need to be self-assembled and self-programmed)
Cyber-securityHighLow
(it is mainly intended for domestic applications)
High
Table 3. Some data about the relevance of the didactic buildings of the University of Pisa.
Number of ClassroomsTotal SeatsSurfaces of Structures for Didactic Activities (m2)Total Students
38625,00070,00045,800
Table 4. Some data about the activity of FTGM (Fondazione Toscana Gabriele Monasterio).
Number of
Structures
Hospital BedsHospitalized Patients
in One Year
Outpatient Visits
in a Year
2
Pisa
Massa
132
44 in Pisa
78 in Massa
7000120,000
Table 5. Specific characteristics of the classrooms of the University of Pisa tested in some activities.
RoomVolume
(m3)
Surface
(m2)
Max Occupancy
2428131140
81206224288
Table 6. Specific characteristics of the sensors used for the measurement of CO2 concentration.
CasePeriodMax OccupationSequencyVentilation
19:50–11:5025All the students are present in the room for the whole timeOFF
28:30–12:002800–10 (8:30–9:30)
270–280 (9:30–10:30)
0–10 (10:30–11:00)
220–230 (11:00–12:00)
OFF (8:30–10:30)
ON (10:30–12:00)
Disclaimer/Publisher’s Note: The statements, opinions and data contained in all publications are solely those of the individual author(s) and contributor(s) and not of MDPI and/or the editor(s). MDPI and/or the editor(s) disclaim responsibility for any injury to people or property resulting from any ideas, methods, instructions or products referred to in the content.

