Article

Comprehensive Analysis of Ferrocement-Strengthened Reinforced Concrete Beam

by
Darko Živković
1,
Predrag Blagojević
1,
Danijel Kukaras
2,*,
Radovan Cvetković
1 and
Slobodan Ranković
1
1
Faculty of Civil Engineering and Architecture, University of Niš, 18000 Niš, Serbia
2
Faculty of Technical Sciences, University of Novi Sad, 21000 Novi Sad, Serbia
*
Author to whom correspondence should be addressed.
Buildings 2024, 14(4), 1082; https://doi.org/10.3390/buildings14041082
Submission received: 1 March 2024 / Revised: 22 March 2024 / Accepted: 4 April 2024 / Published: 12 April 2024

Abstract

:
Starting with the premise that the choice of the optimal method for strengthening reinforced concrete (RC) structures is a complex task and that ferrocement strengthening is comparable to other advanced strengthening technologies due to its cost-effectiveness, ease of construction, and durability, this paper presents a comparative study of the flexural bearing capacity of RC beams strengthened with ferrocement strips applied by gluing. An overview of the life cycle assessment (LCA) based on embodied energy or CO2 is presented in the introduction, based on the existing literature review. The research includes tests of 15 RC beams of identical cross-sections (150/250 mm) and a span of 3000 mm. Strengthening was conducted by applying four types of ferrocement strips (different widths and wire mesh layers). Two factors were examined: the verification of the comprehensive FEM numerical model against the experimental results and the applicability of existing simplified calculation methods for sufficiently accurate results which could be used in regular practice. The results show that the failure forces obtained from numerical models and experimental models differ by no more than 3.94%. The increase in the bearing capacity of the strengthened models is up to 21.4%. The transformed area method for the cracked section showed good results when compared to the FEM and experimental models. The analytically calculated failure force is contingent upon the partial factor for variable action, which was explored within the 1.5–1.7 range.

1. Introduction

Reinforced concrete (RC) structures often require strengthening due to deficiencies or changes in their intended purpose. Increasing the durability of a structure leads to a longer service life, which is beneficial for sustainability. Similarly, building refurbishment and repurpose are preferable options as part of a strategy to reduce embodied carbon. Consequently, the strengthening of existing reinforced concrete structures has become a widespread practice, involving the application of both conventional and advanced methods. The most commonly strengthened structural components include girders, piers, building beams, columns, and slabs. To enhance strength, there are various materials and techniques that can be utilized, including cross-section enlargement with RC jacketing or fiber-reinforced concrete (FRC), steel plates, fiber-reinforced polymer (FRP), external post-tensioning, or ferrocement jacketing or laminating. Ferrocement strengthening can be seen as comparable to other advanced technologies when innovative materials are used and various aspects are considered during the selection process, and it is characterized by its cost-effectiveness, ease of construction, and durability. Ferrocement, with its distinctive properties, is constructed using a mortar matrix based on cement and with tightly spaced layers of small-diameter wire mesh.
Different factors affect which strengthening technique is optimal. Sometimes the conditions (e.g., chemical resistance or weather conditions) can narrow the choice significantly, yet in most cases, there is a possible choice to consider the most suitable method of strengthening. The most often used traditional and advanced techniques are summarized in Table 1.
Although it is expected to use the structural best fit solution, some conditions (e.g., the budget, lack of adequate labor force or material) can mean a serious drawback which will eventually divert the choice. Strengthening with ferrocement can be considered as a universal solution that can be tailored to needs or possibilities. They have a higher ductility, higher shear strength capacity, and higher moment capacity than FRP sheets but also a considerably better fire and corrosion resistance than steel. Cast-in-place or precast ferrocement composites are cost-effective solutions, and they do not require a special material or highly skilled labor force.
The environmental impact analysis is also important to consider. The life cycle assessment (LCA) based on embodied energy or CO2 emission calculations are significant and valuable tools for comprehensive and thorough analysis. Nonetheless, the variety in possible materials and methods used in RC structural strengthening makes it very difficult to consider a full-scale LCA study. Alternatively, a simple insight can be given by comparing the data from existing literature reviews [1,2,3,4,5,6,7,8,9]. In Figure 1, the equivalent CO2 of raw materials is given in CO2/kg of used materials considering a case of a 50% bending capacity increase of a given RC beam, considering steel plates with the mechanical anchorage strengthening technique (SA), carbon FRP sheets with epoxy resin (CFRP), and ferrocement strip type IV (FC):
In addition to its outstanding properties including durability, strength, toughness, water resistance, resilience to harsh environments, ease of shaping, and construction, this material is also compatible with all other cement-based composites. The theoretical design approach permits the application of conventional reinforced concrete design principles. Like with other traditional methods, ensuring the quality of the connection between conventional reinforced concrete and micro-reinforced concrete remains the paramount issue influencing the stress–strain behavior of reinforced concrete beams undergoing strengthening.
Numerous methods for reinforcing various RC structural components with ferrocement have been proposed. These include the use of ferrocement wrapping to confine RC columns [10,11,12,13], strengthening RC slabs in tensioned zones [14,15], reinforcing rigid RC column and beam joints [16,17], and the improvement in the compressive strength behavior of RC walls reinforced with [18]. High-strength cement matrices [19,20] and ferrocement with combined continuous and discontinuous micro-reinforcement, subjected to flexure, have been investigated [21,22]. There have been several proposals of ferrocement strengthening for shear [23,24] and torsion [25]. Some researchers have examined the behavior of RC beams strengthened with ferrocement through the direct application of micro-reinforcement mesh and cement matrix onto prepared concrete surfaces [26,27,28,29,30], utilizing steel connectors. Additionally, RC beams made of lightweight or low-strength concrete have been strengthened by complete confinement using ferrocement [28,31,32]. Certain authors have employed an approach of “gluing” ferrocement onto reinforced concrete surfaces [33,34,35]. Furthermore, research has explored the ferrocement strengthening of predamaged RC beams [36,37,38,39].
The results from the previously mentioned literature which are related to the ferrocement strengthening of RC beams loaded with flexure exhibit the increased beam properties. The bearing capacity, total rigidity to flexure, and energy absorption capacity increase. The value of deformations and the development of cracks of the strengthened beams decrease. In an effort to reduce deformations and cracks, one should mention the approach to the improvement of the characteristics of RC beams by applying concrete mixtures with materials that enhance its strength and durability. Micro-silica is commonly used for these purposes; however, the high cost and significant carbon footprint often discourage its use. Recent research suggests that a significant part of micro-silica can be replaced by natural pozzolans thus reducing the costs and carbon footprint while maintaining the desired strength and durability [40]. The use of these concrete admixtures requires an increased attention to be devoted to concrete production, casting, and curing since they decrease workability and increase the possibility of temperature cracks. These challenges can be addressed through the implementation of low-cost monitoring systems [41].
This study explores the reinforcement of RC beams predominantly subjected to bending by utilizing prefabricated ferrocement elements of minimal thickness. The selected bonding agent is an epoxy mortar adhesive, applied thinly on both the RC beam and the ferrocement element just before joining. This method requires no special treatment of the concrete or ferrocement, except ensuring that all surfaces are dry, clean, and undamaged prior to application. The objective was to replicate the reinforcement process of existing RC beams, particularly those that are challenging to access. To achieve this, Section 2 presents theoretical principles and analytical methods suitable for calculating the strengthened beams. Section 3 outlines the experimental models, the chosen procedure for reinforcing RC beams with ferrocement, and the mechanical properties of the materials used in the process. Section 4 details the numerical simulation, while Section 5 encompasses the presentation of results pertaining to the nominal bending moment and failure of both the strengthened and control beams. The analytical, experimental, and numerical findings are juxtaposed, facilitating an assessment of the numerical model’s accuracy to the beam’s experimental behavior and the potential reliability of analytical methods in calculating composite beams. Additionally, the examination of the partial factor for variable actions of composite beams is conducted, particularly in cases where analytical calculations yield the service bending moment.
Given the relatively limited number of papers addressing this topic, this research was undertaken with the aim of further advancing the technique for strengthening RC beams. There is a particularly modest number of papers which employed the technique of the gluing of previously prepared ferrocement elements to the tensioned surface of RC beams exposed to bending, in contrast to the techniques of RC beams’ reinforcement using steel plates or FRP strips, which were discussed in a considerably greater number of research studies. The gluing technique represented a very simple and usable solution in practical situations. The gluing means were selected with great care, because it was assessed that this factor was not sufficiently dealt with in the research up to date. One of the goals of this study was the proof that the chosen means for joining guarantees the joint interaction of the reinforced concrete and ferrocement up to the bearing capacity failure of strengthened beams. Considering the fact that ferrocement obeys the same mechanical laws and theories as the reinforced concrete, it was the aim of this study to show the level of the reliability of analytical methods in the process of the calculation of the nominal load bearing capacity of beams exposed to bending.

2. The Foundational Principles of the Calculation of RC Beams Strengthened with Ferrocement

Understanding the stress–strain relationships among the various materials involved—concrete, conventional reinforcement, mortar, micro-reinforcement, and adhesive epoxy mortar—is essential for analyzing strengthened composite beams. This task is intricate due to the multitude of parameters involved, which can complicate calculations. However, certain analytical methods, with appropriate simplifications, can be applied.
When analyzing a composite cross-section subjected to service loads during the phase of the linear elastic behavior up to the first matrix cracking, it is convenient to use the flexure formula for the un-cracked section. Conversely, for cracked sections, the transformed area method for the cracked section is more appropriate [42]. The calculation of the nominal bending resistance yields the value of the bending moment at failure (nominal bending moment). Additionally, methods such as the compatibility method, simplified method based on all tensile reinforcement yielding, and simplified method using the plastic moment [42] can be utilized.

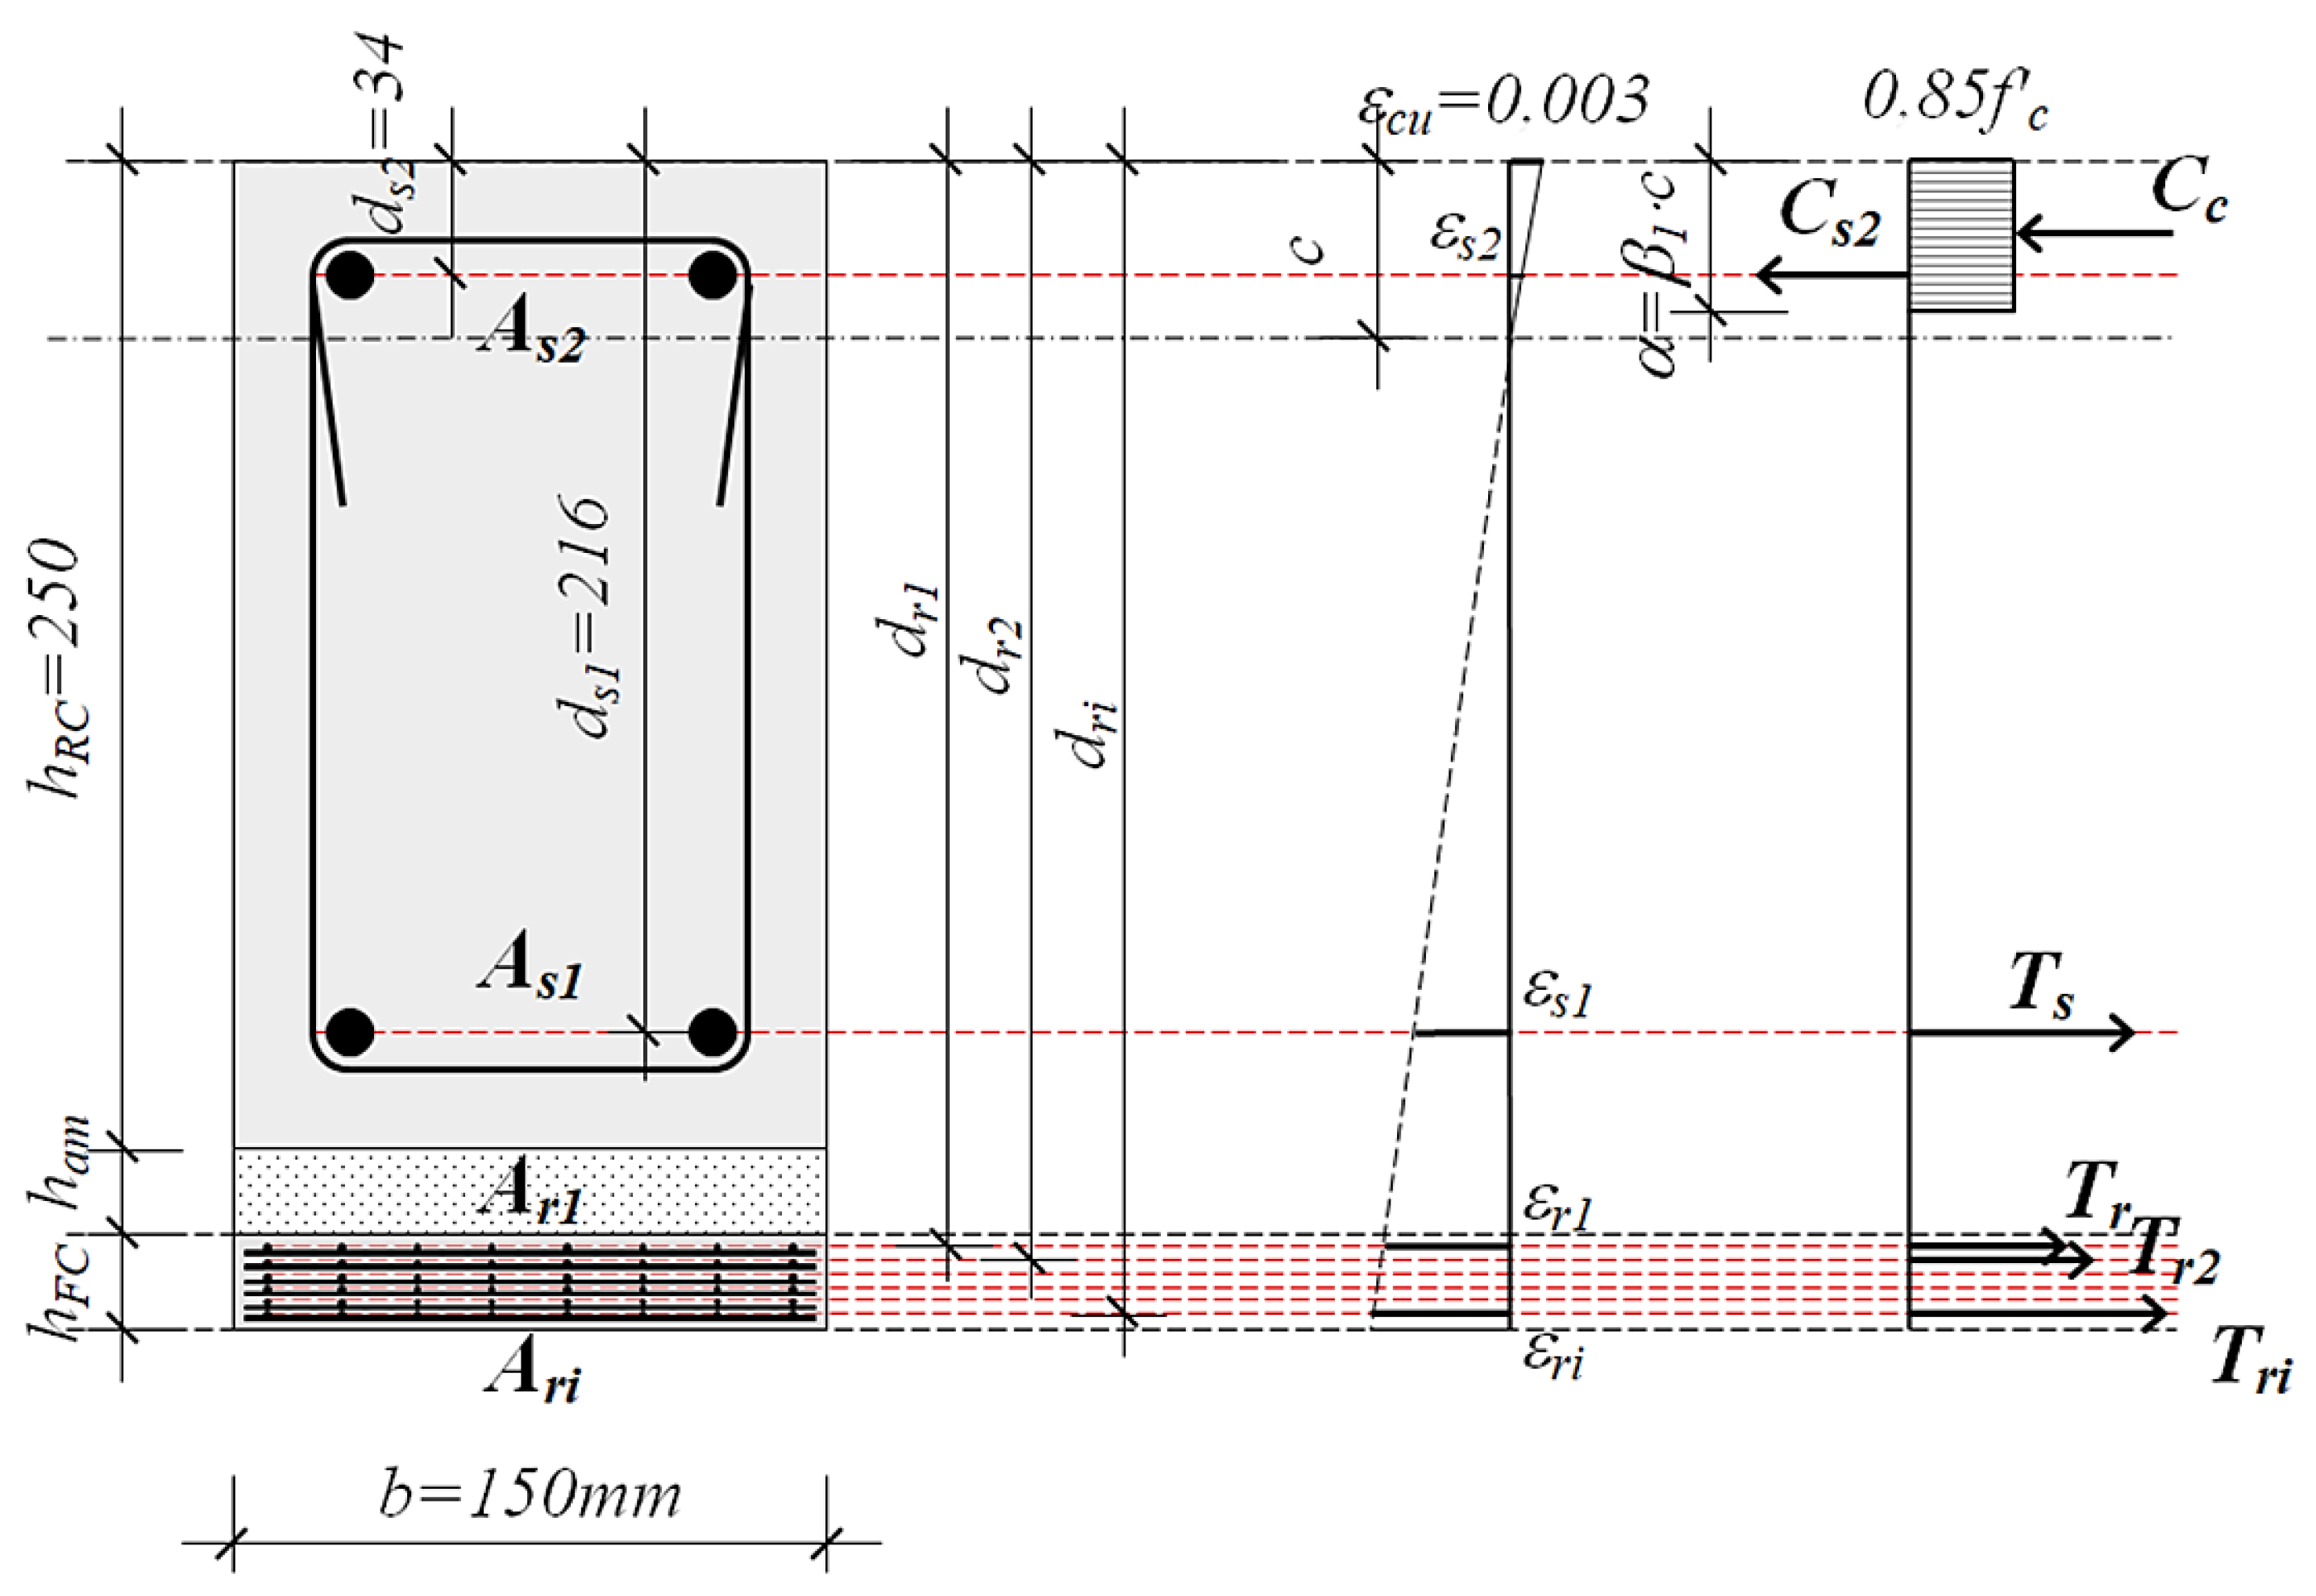
2.1. The Transformed Area Method for the Cracked Section

To fulfill the needs of comparing the experimental model results, the transformed area method is utilized for the cracked section, as illustrated in Figure 2. Linear theory is employed to ascertain the flexural tensile stress induced by service loads.
The ratio of elastic moduli is expressed through the following equations:
n 1 = E s E c , n 2 = E a m E c , n 3 = E m E c , n 4 = E r E c
Once the position of the neutral axis (c) is determined, the moment of inertia of the transformed cracked section (Figure 2) can be computed:
I t r , c r a c k e d = b c 3 3 + n 1 1 A s i c d i 2 + n 1 A s j d j c 2 + n 3 n 4 A r j d j c 2
Once the characteristics of the observed cross-section are established, the stresses in any fiber can be computed using the flexure formula:
σ m , t o p = M c I t r , c r a c k e d , σ s i = n 1 M d i c I t r , c r a c k e d , σ r i = n 3 n 4 M d i c I t r , c r a c k e d
Based on Naaman [42] and the Ferrocement Model Code, as well as the Building Code Recommendations for Ferrocement [43], the maximum allowable service moment can be calculated from the flexure, as follows:
  • The tensile stress in reinforcement resulting from service loads induced by tension, bending, or their combination must not surpass 0.60 times the yield strength of the reinforcement (fy) nor exceed 400 MPa. However, in cases where high-strength reinforcement meshes are employed and their efficacy is empirically verified, the 400 MPa limit can be increased.
  • The upper limit for the compressive stress in the mortar matrix under bending should not surpass 0.45 times the specified design’s compressive strength (fc′), derived from testing the concrete cylinders.

2.2. Compatibility Method

In addition to the previously outlined approach, which determines the maximum service bending moment, the nominal bending moment was also computed using the compatibility method and a simplified method based on the yielding of all tensile reinforcement, as depicted in Figure 3, as given by Naaman [42].
In this calculation, the position of the neutral axis (c) is adjusted until an equilibrium between compression and tension forces is achieved:
T C = 0
When this condition is met, a nominal bending capacity is as follows:
M n = i = j N C , T s i , r i d s i , r i β 1 c 2
The results obtained by all the aforementioned methods are outlined in Section 5.1, which summarizes analytical assessments of the flexural strength of RC beams.

2.3. Simplified Method Based on Yielding of All Tensile Reinforcement

A simplified method, based on the sufficient compression capacity of concrete and reinforcement yielding, can also be used for the design with the following assumptions:
  • The presence of compressed reinforcement is ignored.
  • All other reinforcement layers are in tension that reaches the level of the yielding limit.
The equilibrium of internal forces (Figure 3) yields the following expression:
0.85 f c b a = i = j N A s , r i σ s , r y i
The nominal bending capacity is then as follows:
M n = i = j N A s , r i σ s , r y i d s , r i a 2

3. Experimental Investigations

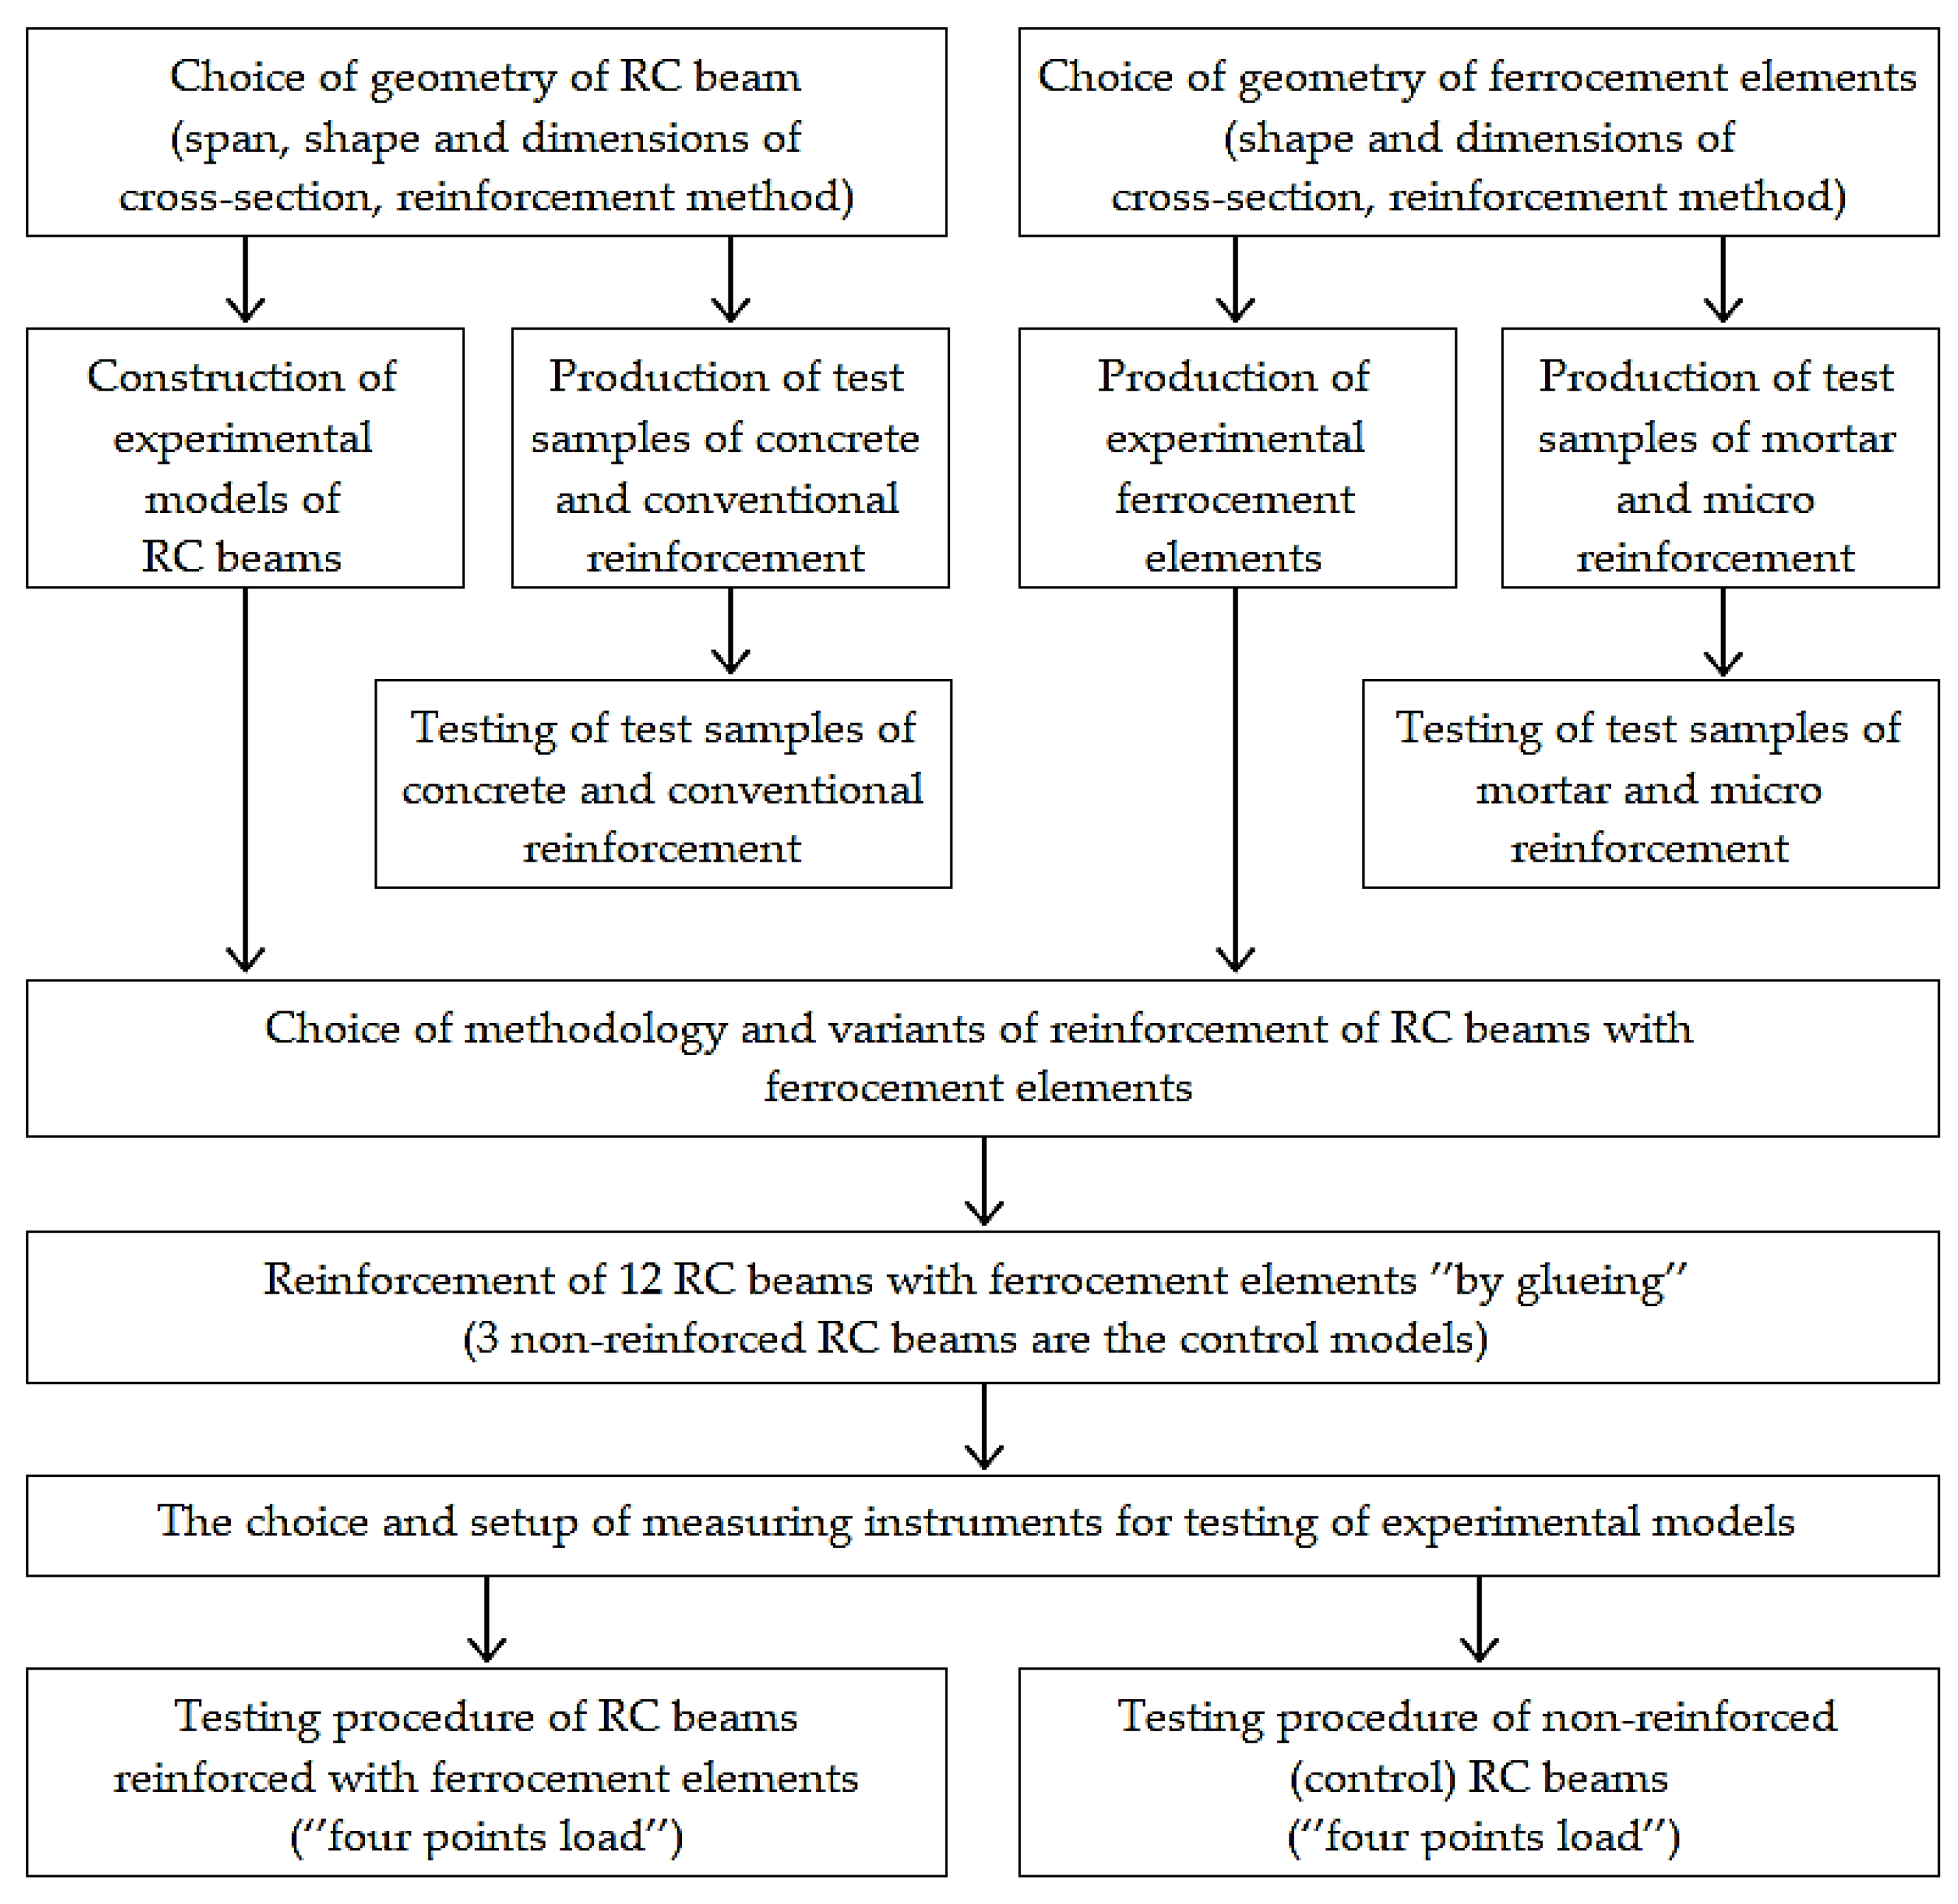
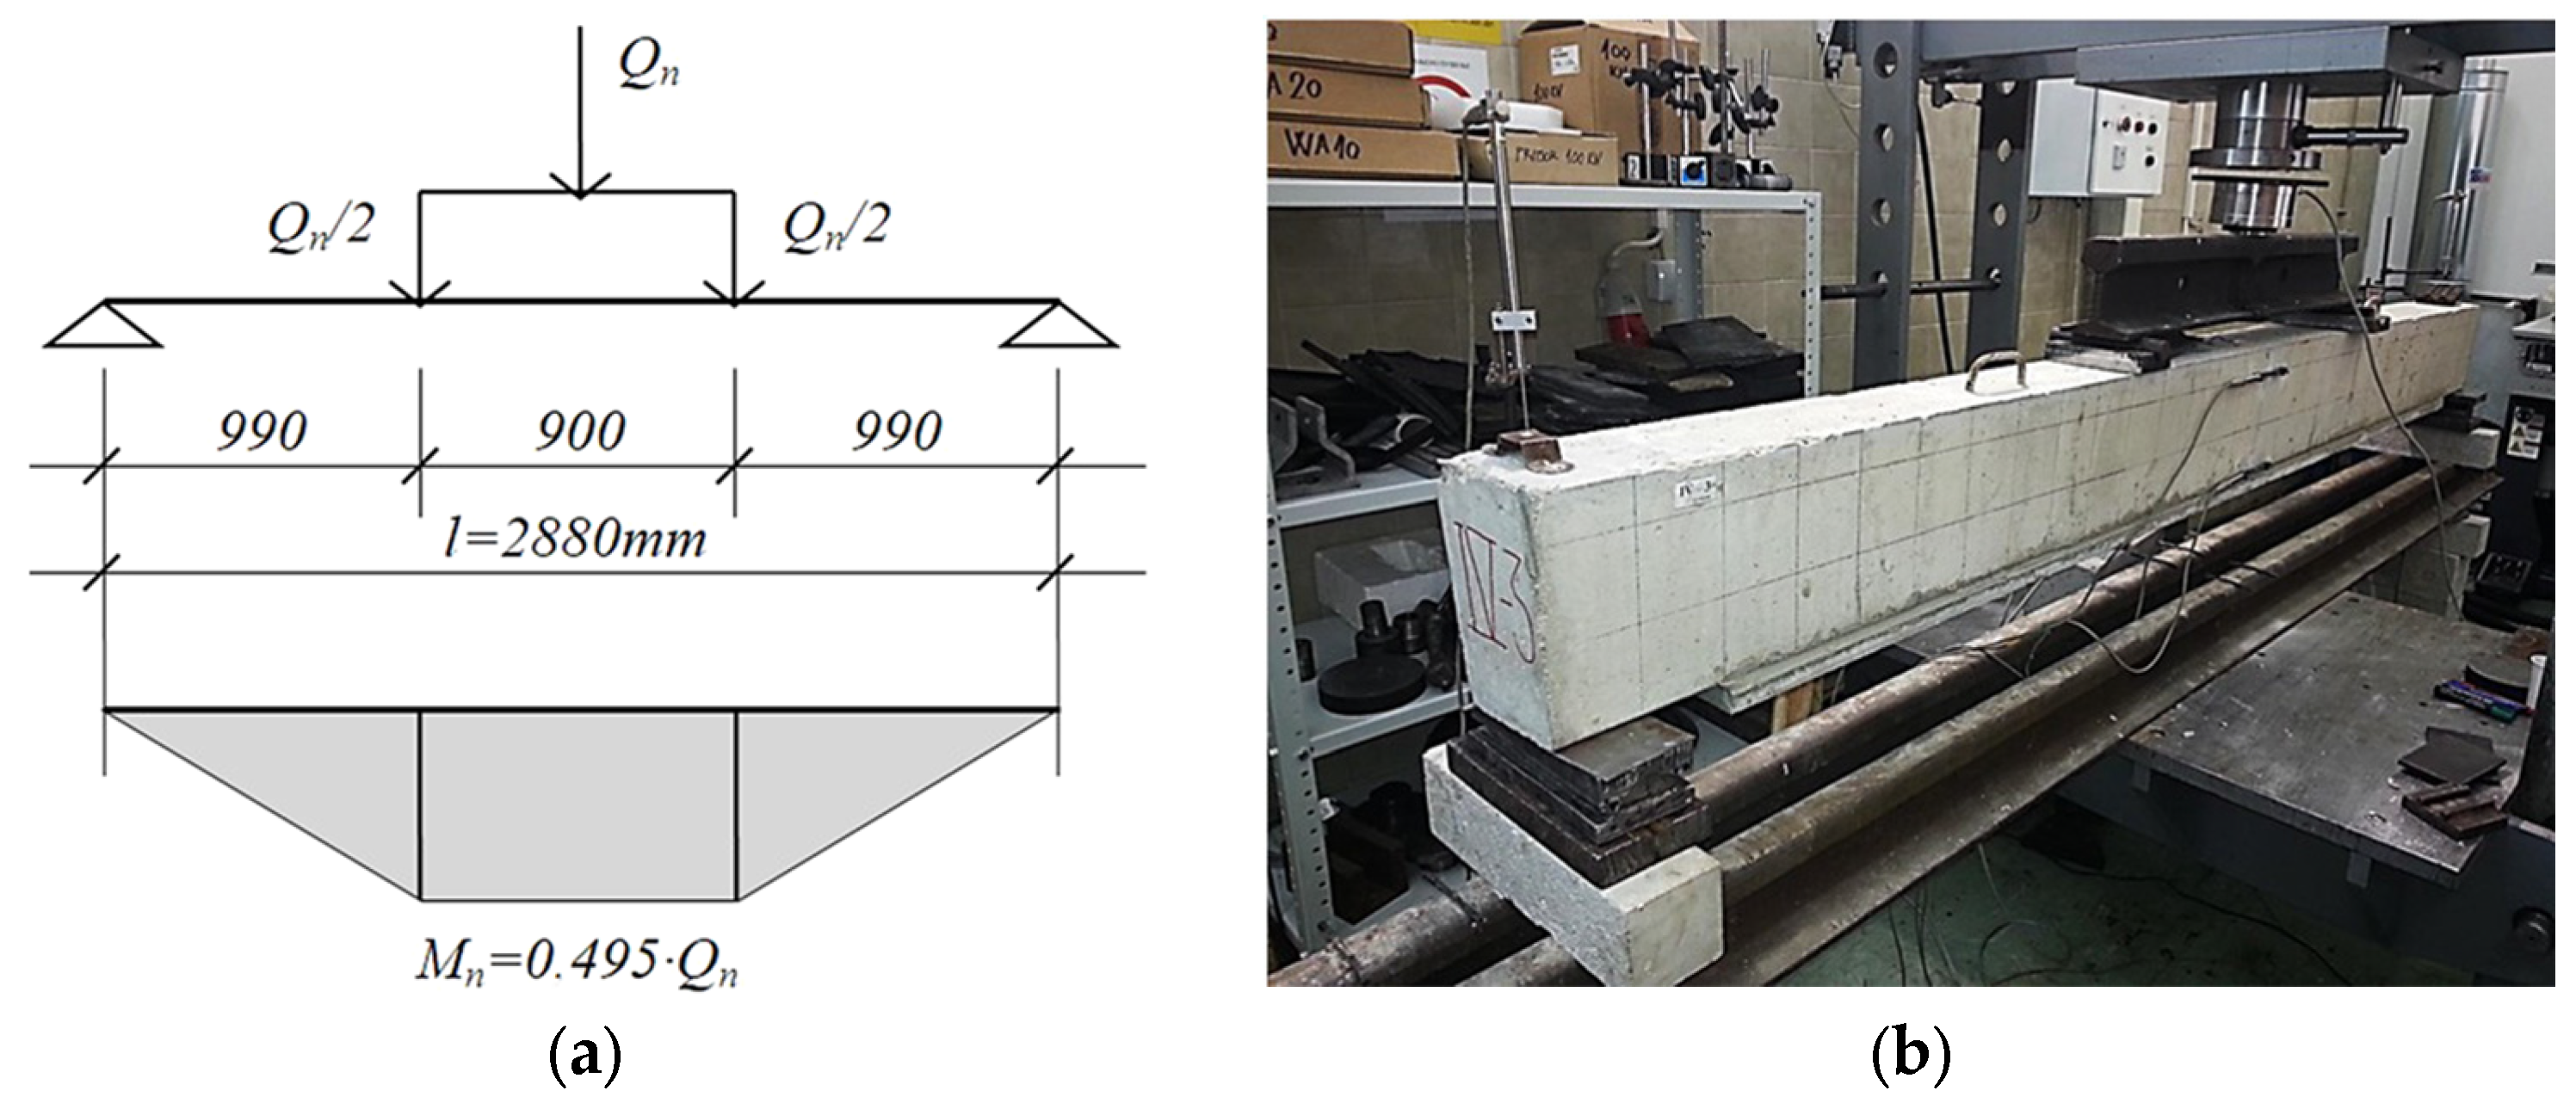
3.1. Experimental Research Program

Figure 4 shows the program of experimental tests. The experimental tests on the specimens were conducted in laboratory conditions.

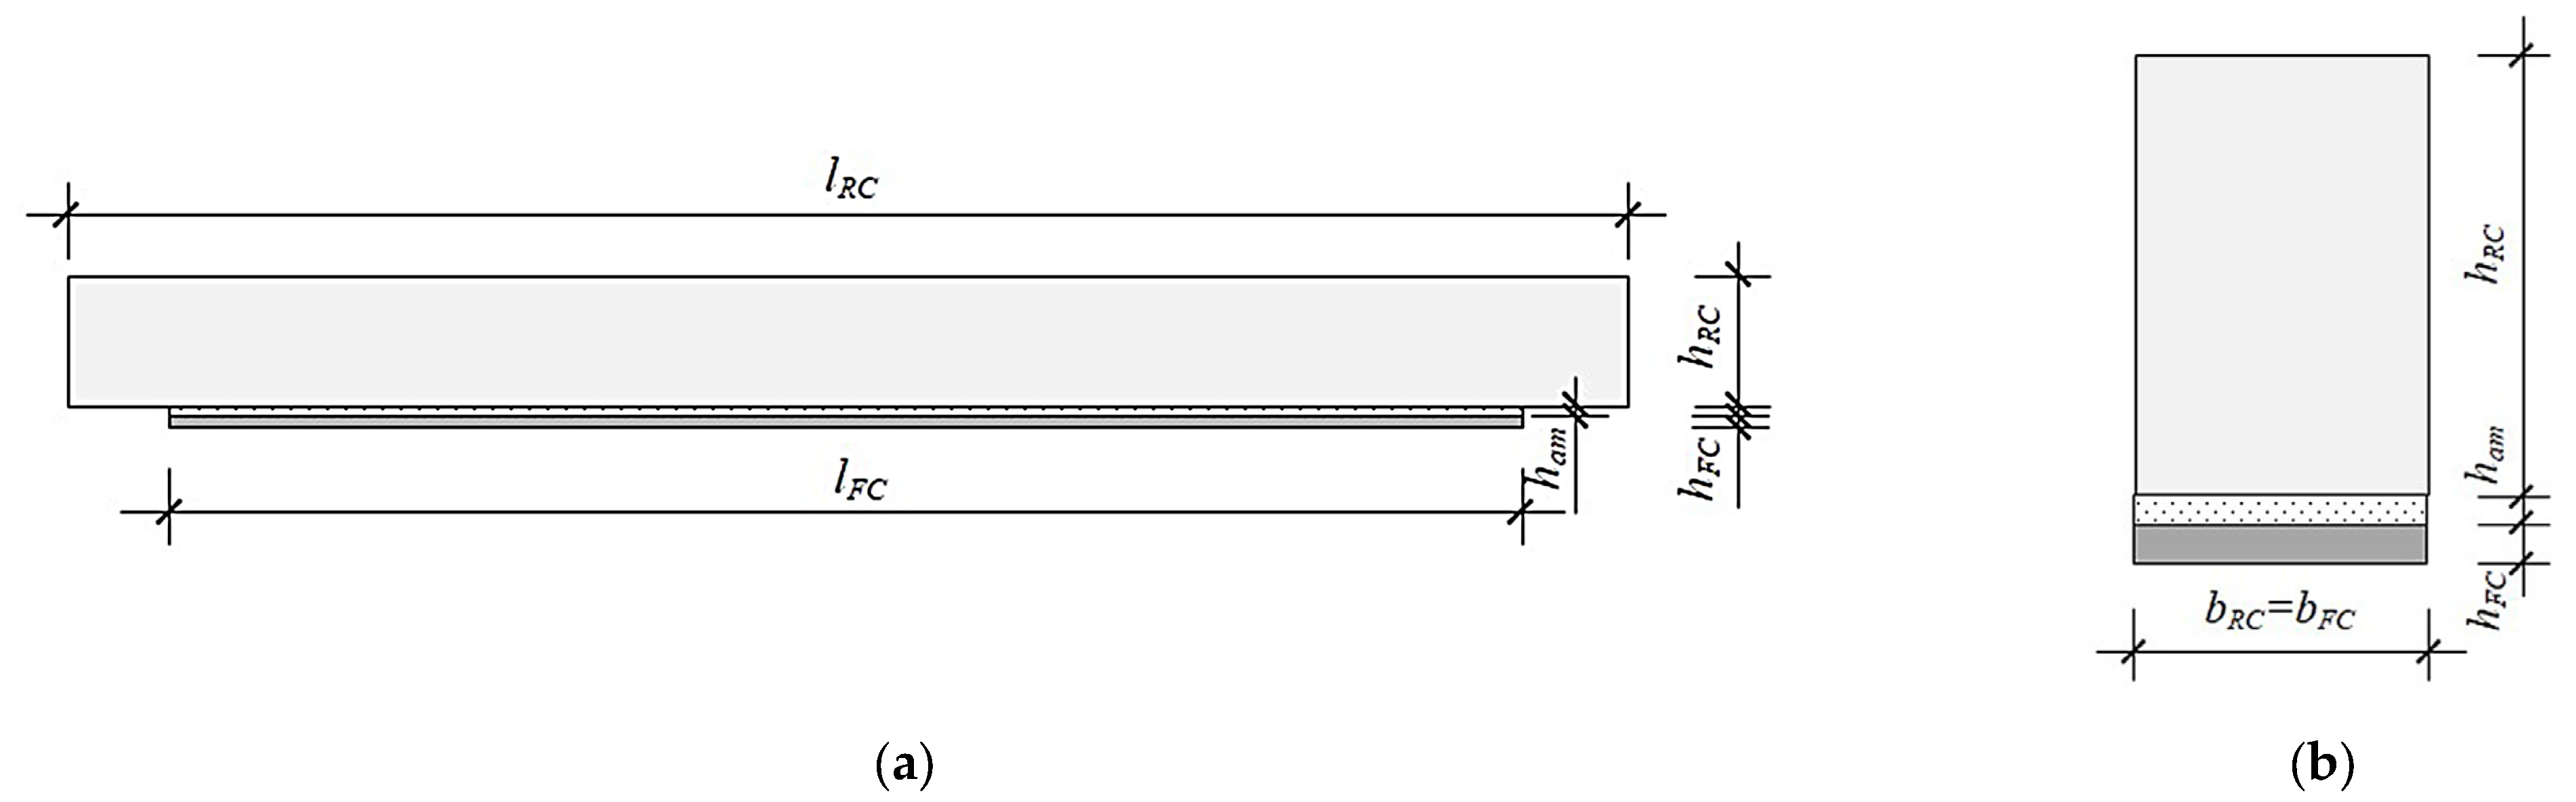
3.2. Experimental Models

Figure 5 illustrates the selection of the referent (non-strengthened) RC beam’s geometry.
The process selected for reinforcing an RC beam with prefabricated ferrocement elements involves applying them to the bottom (tensioned) zone, as depicted in Figure 6. This method ensures a straightforward and efficient procedure for integrating the strengthening elements. The adhesive, applied to both the concrete and ferrocement surfaces, facilitates their connection. This method offers significant advantages for beam reinforcement, particularly in situations where accessing RC beams is challenging. The bonding of reinforced concrete and ferrocement was achieved using the adhesive epoxy mortar “SX 481 E” from the well-known German manufacturer “MC-Bauchemie” [44].
The micro-reinforcement utilized consists of electro-welded galvanized steel wire mesh with a diameter of Ø0.6 mm and mesh openings of 12.5/12.5 mm. The thickness of ferrocement elements and the number of layers of the micro-reinforcement were varied, as detailed in Table 2.

3.3. Specimen Properties

The compressive strength of the concrete was assessed in accordance with standard EN 12390-3 [45], using cubes tested at the ages of 2, 7, 28, and 90 days. The flexural strength of the concrete was evaluated per standard EN 12350-5 [46], employing two-point forces applied at one-third of the span length. The testing involved three samples of 10 × 10 × 40 cm prisms at 28 days of age. The determination of the secant modulus of elasticity in compression was conducted on cylindrical specimens with a diameter of Ø15 cm and a length of 30 cm, following EN 12390-13 [47], at 28 days of age.
For mortar in the hardened state, mechanical properties were initially examined at 3, 7, 28, and 210 days in line with standard EN 196-1 [48]. The flexural strength test of mortar was performed on three 4 × 4 × 16 cm prisms, followed by compressive strength testing on the halves of the mortar prisms after the flexural strength test.
The testing of the reinforcement bars and micro-reinforcement for tension, to determine the yield point and tensile strength, was carried out on three samples according to standard EN ISO 6892-1:2020 [49].
The tensile strength of the strengthened beams was evaluated using the “Pull-off” method, following the EN 1542:2010 [50] standard, on the beams themselves at 90 days of age.
The compressive strength and modulus of elasticity of the adhesive epoxy mortar were obtained from the technical data provided by the manufacturer.

3.4. Material Properties

Table 3 displays the mechanical properties of the concrete, conventional reinforcement, adhesive epoxy mortar, cement matrix, and micro-reinforcement. The mean values obtained from the test results of the specimens were utilized for subsequent analysis. Using these values, the bending of RC beams reinforced with ferrocement strips was calculated.

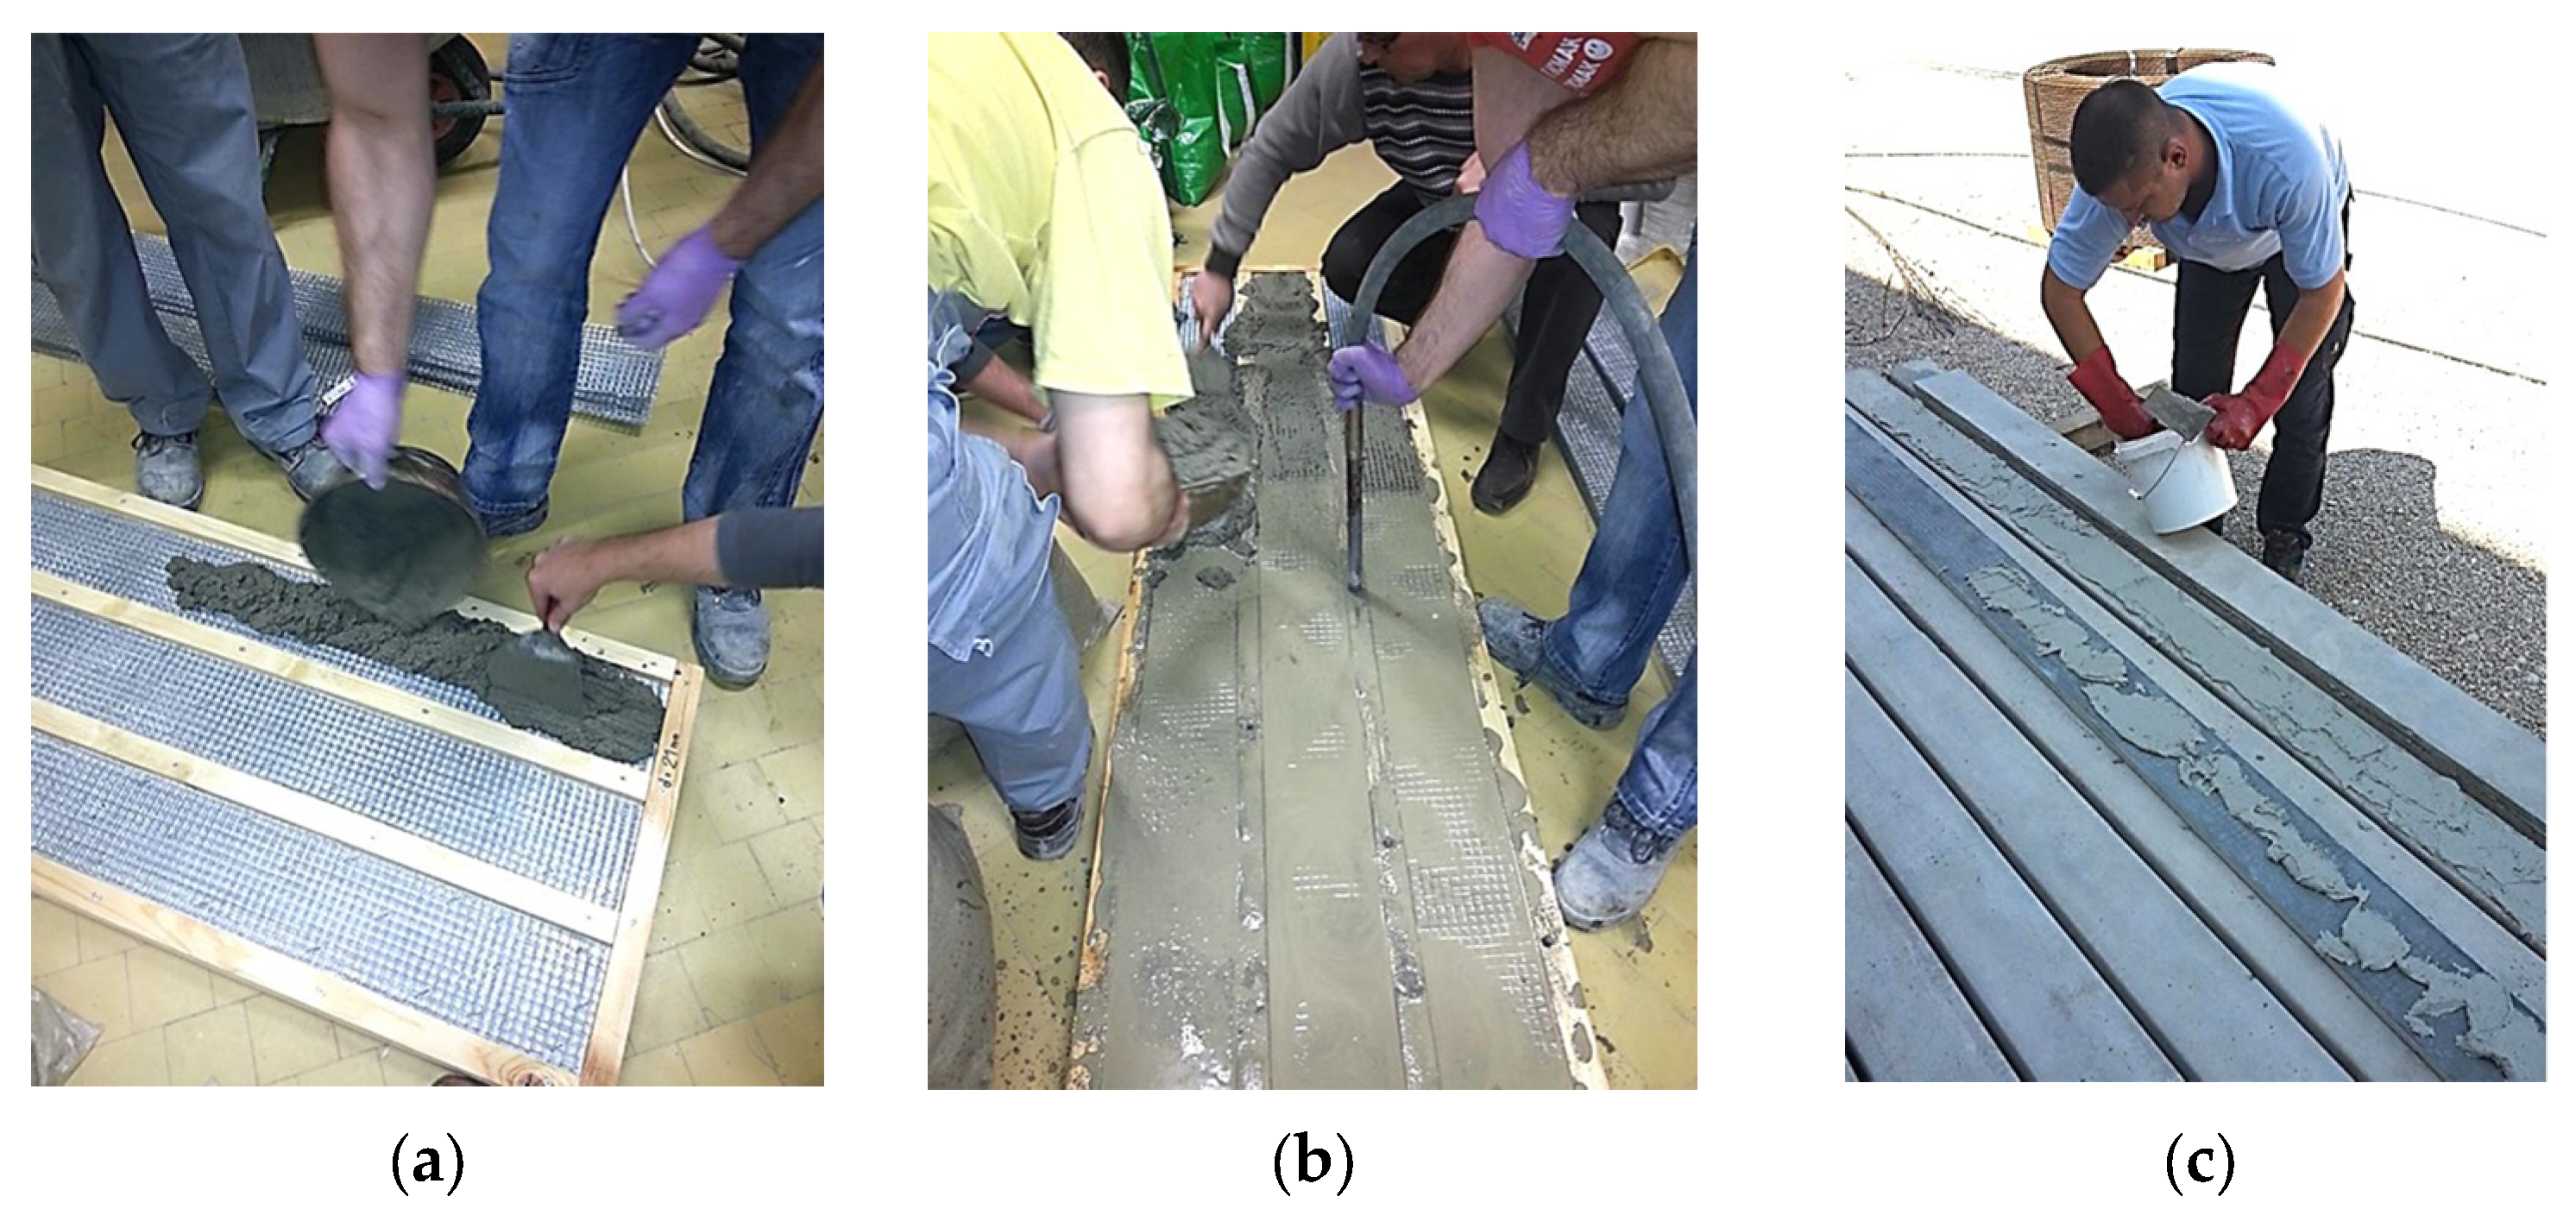
3.5. Experimental Models

The experimental investigation of beam models subjected to bending was conducted under laboratory conditions. The RC beam variants reinforced with ferrocement strips, as well as referent (non-strengthened) beams, were constructed in accordance with the specifications detailed in Figure 5 and Figure 6, utilizing mechanical properties outlined in Table 3. The RC beams were fabricated using standard procedures within metal formwork, and the process of preparing ferrocement elements and applying them onto the RC beams is illustrated in Figure 7.
The schematic diagram of an RC beam subjected to two concentrated forces (“Four Points Load”) is depicted in Figure 8a, while Figure 8b illustrates the layout of one of the tested experimental models.

4. Numerical Analysis of RC Beams Strengthened with Ferrocement

Analyzing structural elements constructed from composite materials, particularly cement-based composites, demands a comprehensive and dependable approach due to the multitude of factors impacting beam behavior. Variations in the physical and mechanical properties of constituent materials, the effectiveness of component interconnections, and the linearity or nonlinearity of component behavior under a load contribute to the challenge of accurately representing all load bearing and serviceability states through analytical expressions. To address this issue effectively, specific numerical procedures must be employed.
The numerical analysis of both non-strengthened and strengthened experimental models was conducted utilizing the finite element method (FEM) with the ANSYS software R14.5. package. Examining the structural response to loading through numerical modeling, particularly to validate it against experimental findings, presents a highly intricate endeavor in FEM application, given the diverse properties inherent in composite materials.
Concrete, being a structural material, demonstrates distinct behaviors under compression and tension, rendering numerical modeling challenging. To facilitate the numerical simulation of experimentally tested models, specific parameters were adopted to define concrete within the ANSYS software package [51]:
  • Ec modulus of elasticity of concrete
  • fc’ ultimate strength at uniaxial compression
  • fr ultimate strength at uniaxial tension
  • ν Poisson’s ratio
  • βt shear transfer coefficient
An additional multilinear (polygonal) stress–strain curve [52] was introduced as a simplified representation of the nonlinear stress–strain relationship in uniaxial compression. This curve, constructed with six points, ensured the adequate numerical stability and convergence of the nonlinear solution for this problem. The characteristic points of the multilinear curve were calculated, as provided in Table 4.
The numerical values utilized to construct the multilinear curve were derived from experimental data obtained from test specimens. This procedure aimed to simulate the quasi-brittle behavior of the concrete in the experimental beam models. The steel reinforcement was modeled as an elastic–ideally plastic isotropic material, with properties in compression and tension treated as identical. In RC beams reinforced with ferrocement, the ferrocement layers in the tensioned zone of the cross-section are located relatively far from the neutral axis and have a small thickness compared to the dimensions of the RC beam. The cement matrix is considered brittle-elastic, exhibiting linear elastic behavior under tension until it reaches the maximum tension stress, causing the formation of cracks (discontinuations) [42]. Upon surpassing the maximum tensile stress, the matrix loses its load bearing capacity entirely. The micro-reinforcement (steel mesh) embedded in the ferrocement is modeled as an elastic–ideally plastic isotropic material and is subjected to tension in all load phases. The adhesive epoxy mortar in the numerical model was treated similarly to the cement matrix of ferrocement due to its position in the beam’s cross-section and its minimal thickness. The bond between the RC beam and ferrocement strip was assumed to be fully bonded.
The characteristic values necessary for the models of constituent materials (Table 3) were determined based on experimental data obtained from test specimens and information provided by the manufacturer. For the simulation of experimental beam models, a finite element (FE) division was selected, ensuring that the maximum dimension of each element (depending on the type of finite element) does not exceed 25 mm. The optimal dimensions of the FE for constituent materials were determined through a convergence study and are given in Table 5.

5. Results and Discussion

5.1. Calculated Values for Flexural Strength

Consistent with the preceding descriptions, an analytical calculation was conducted for the designated types of RC beams, including those reinforced with ferrocement elements applied to the tensioned side, as well as for the referent (non-strengthened) RC beam. The application of the transformed area method (TAM) for the cracked section yielded the maximum service bending moment. Table 6 displays the corresponding values for all beam types, with the designation “K” representing the non-strengthened (control) RC beam.
Based on the service bending moment (derived from the condition σs,max = 0.6·fsy), the ultimate bending moment can be determined using the partial factor γ (Mu = γ·Mservice). For reinforced concrete, the recommended partial factor for variable actions as per Eurocode 2—Part 1-1 [53] is 1.5. According to ACI 318.R-95 [54], the recommended value for ferrocement is 1.7, while the IFS Committee [43] suggests a value of 2. To further assess the nominal bending moment, two variants of the partial factor were adopted: 1.5 and 1.7. The nominal bending moment, representing the maximum flexural strength of the structure, is defined by the relation Mu ≤ ɸ·Mn. The strength coefficient (ɸ) recommended by ACI 318.R-95 [54] for reinforced concrete is also applicable to the ferrocement structural elements and is set at ɸ = 0.90 (for cases of bending and axial tension). Consequently, using this methodology, the ultimate bending moments for all beam types were calculated, and the values are presented in Table 7.
An additional calculation of the nominal bending strength was performed using the compatibility method (CM) and a simplified method (SM) based on all tensile reinforcement yielding [42]. The nominal bending moment values for all types of beams are presented in Table 8.

5.2. Experimentally Obtained Results

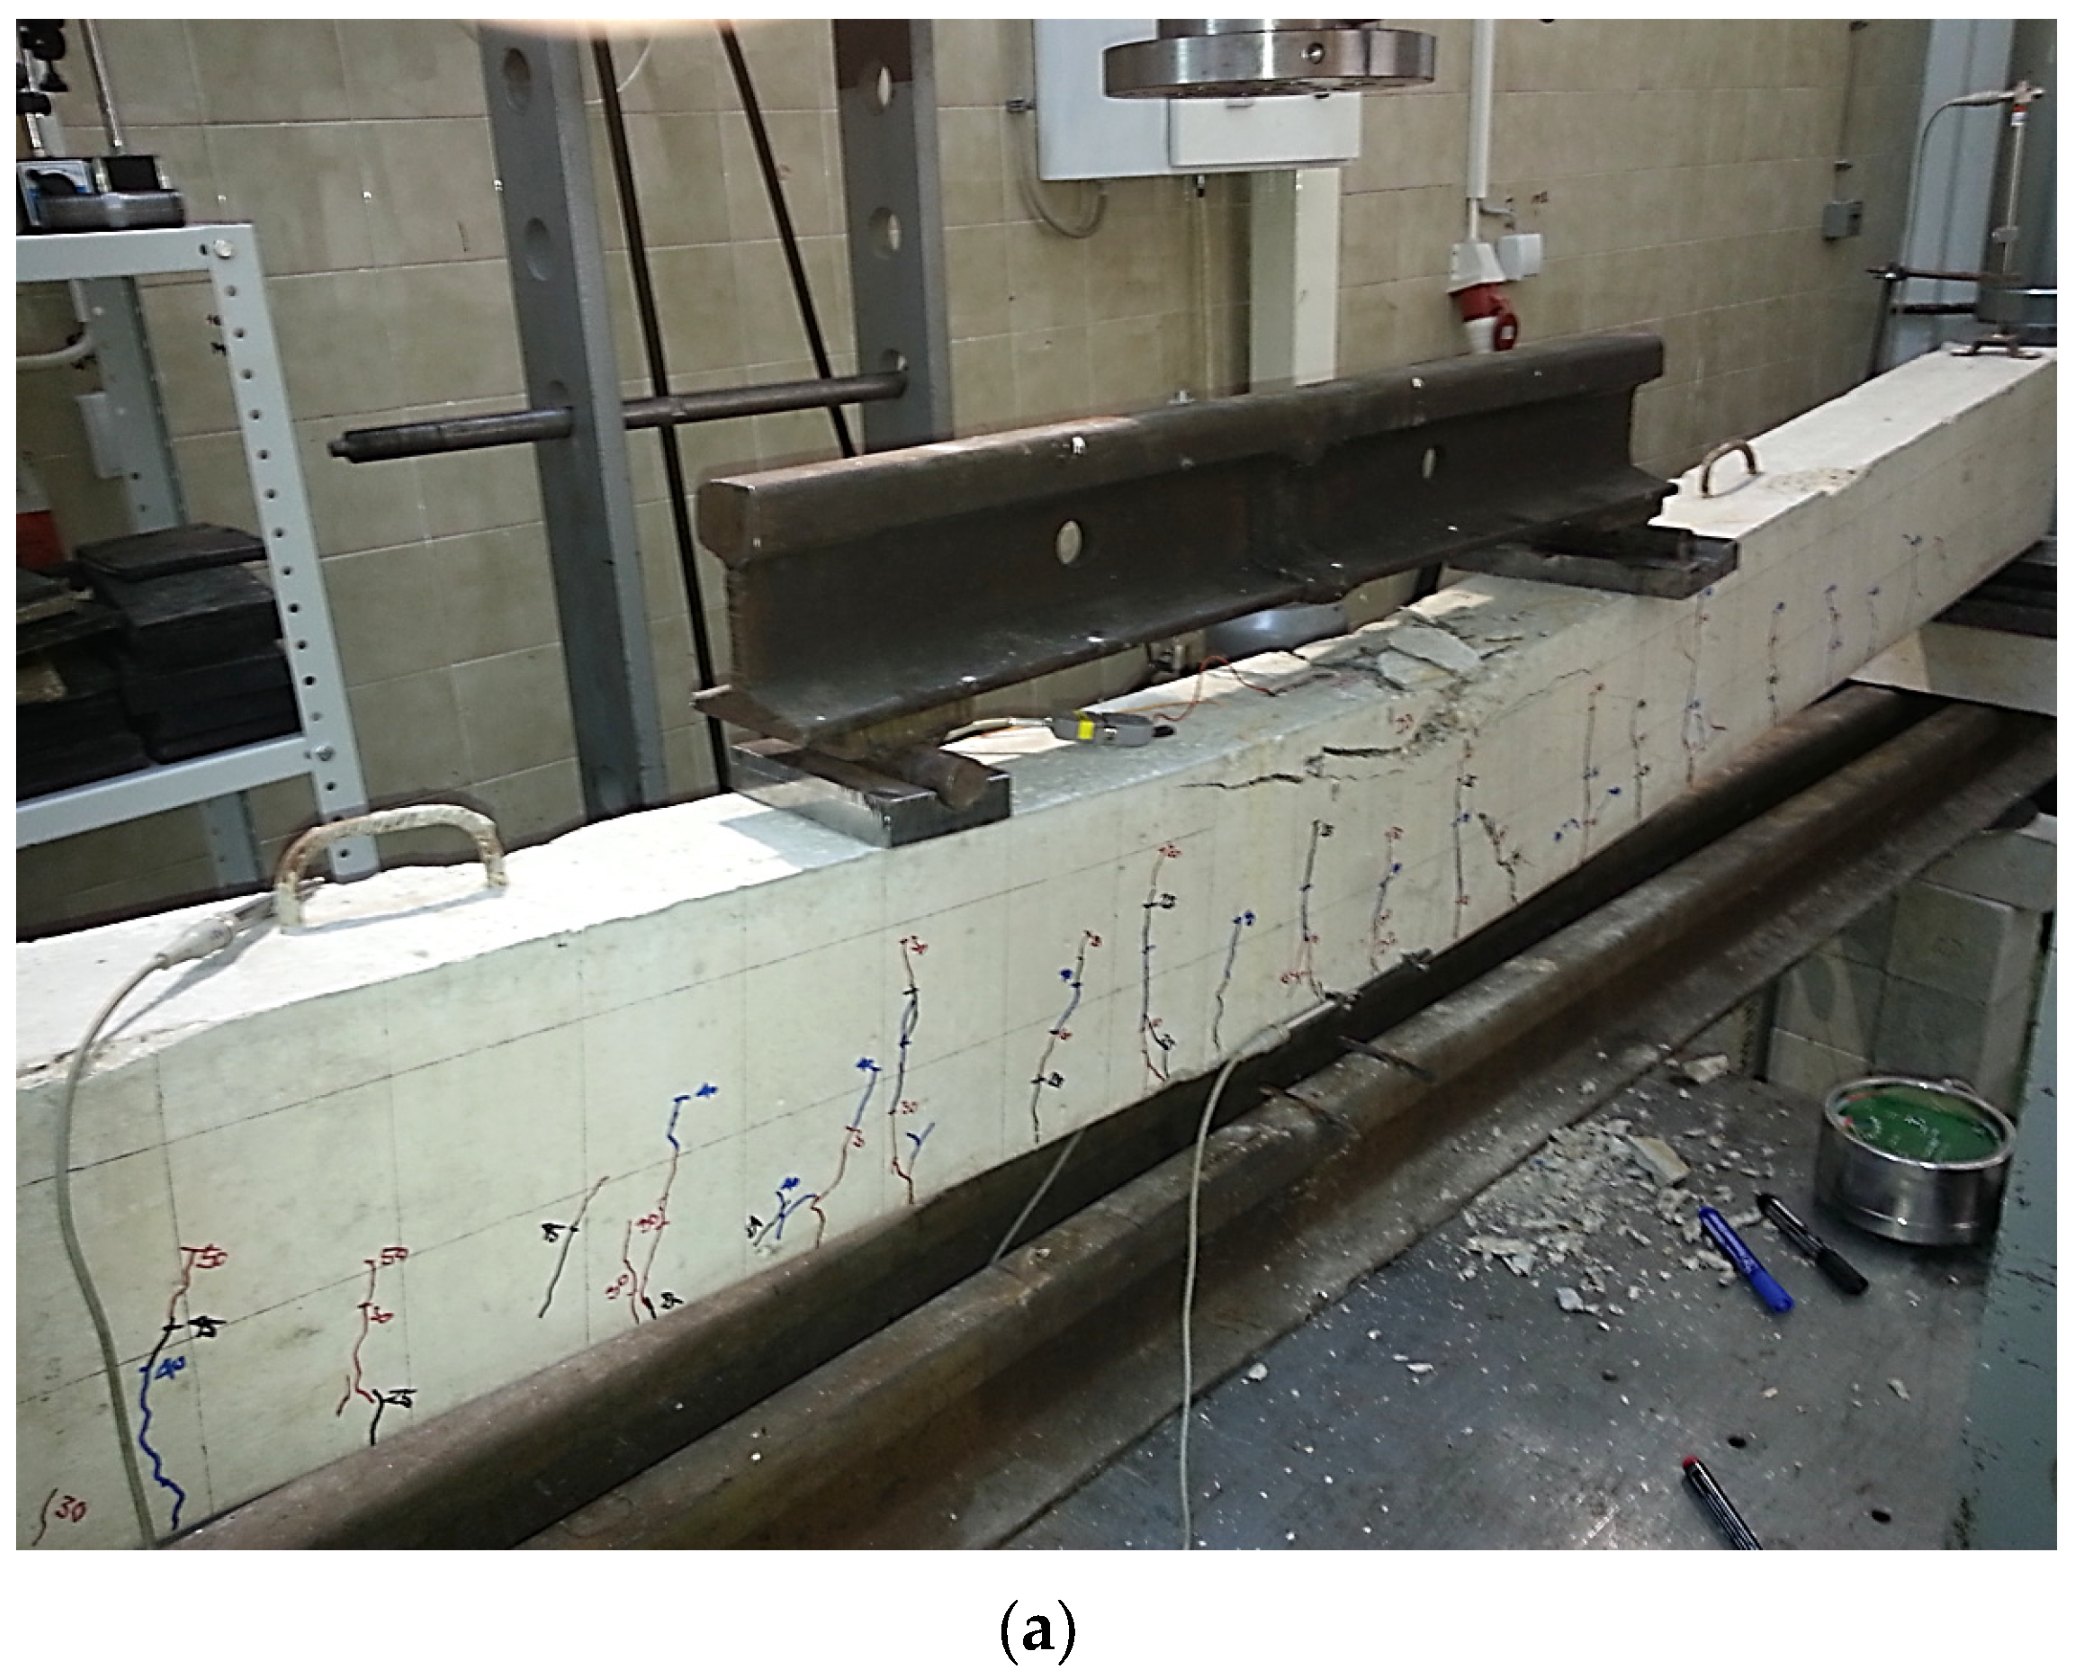
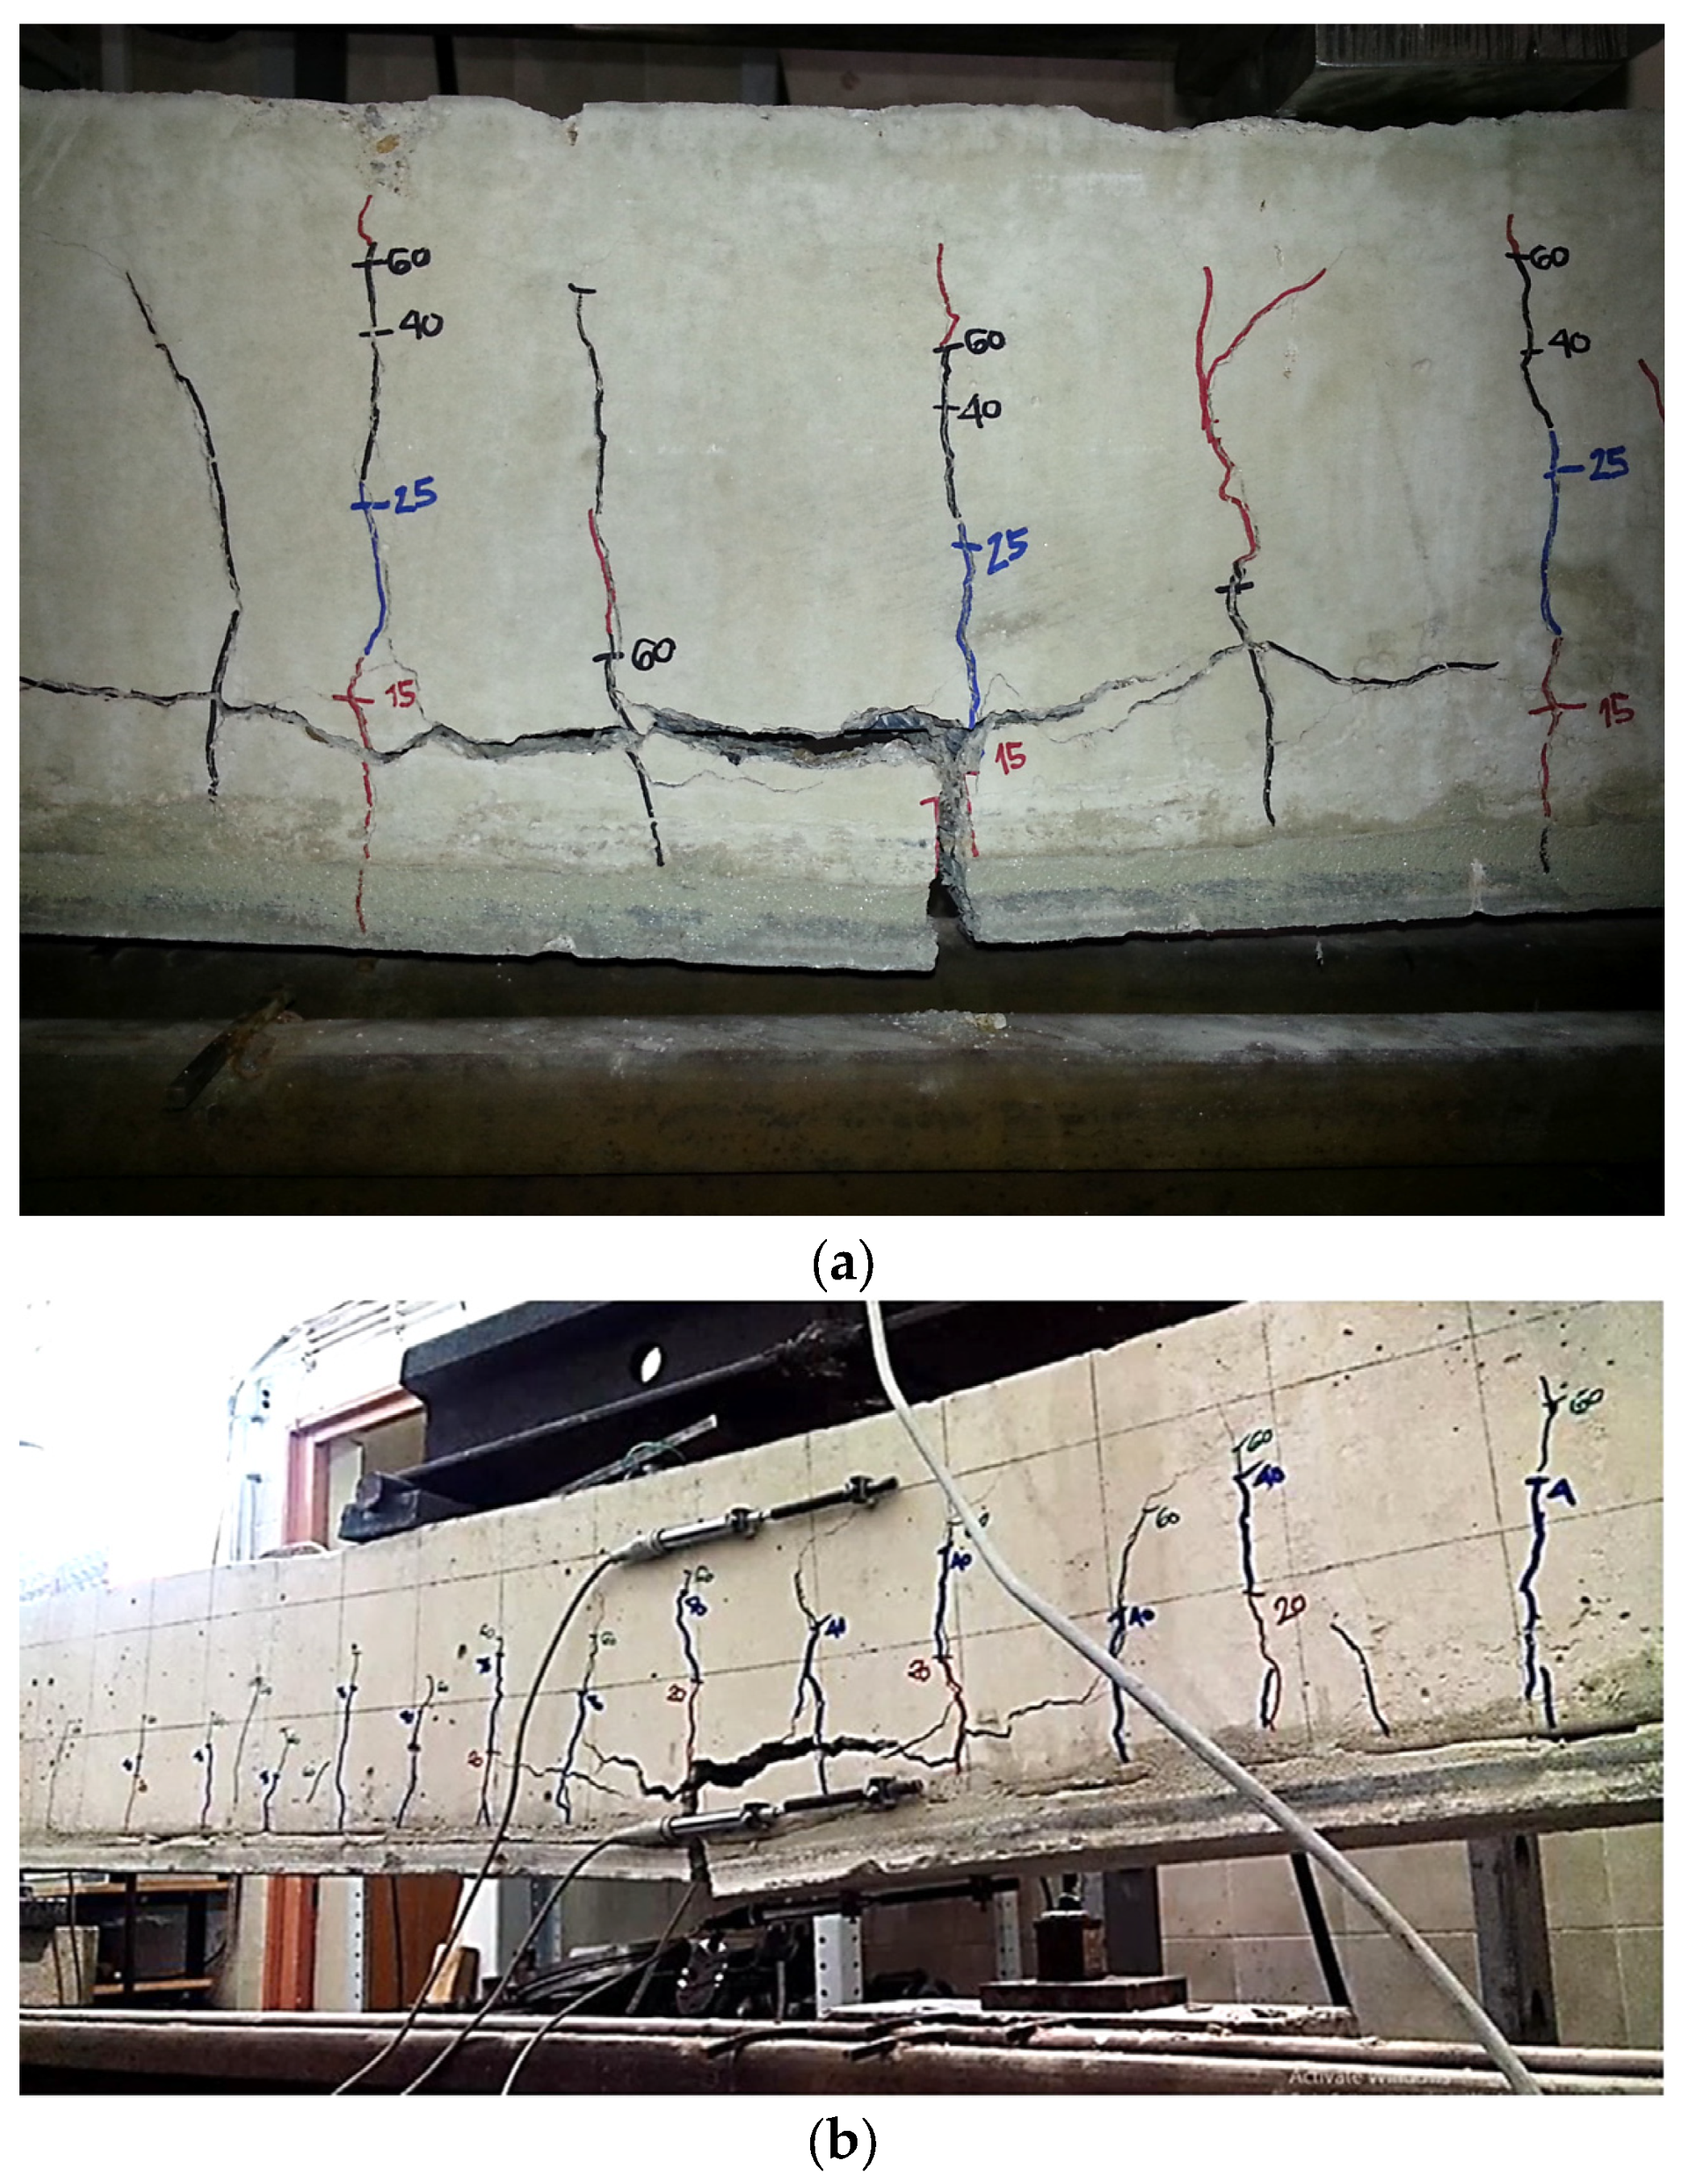
5.2.1. Description of Observed Failure Mechanism of Referent (Non-Strengthened) RC Beams

All of the tested K-type beams (non-strengthened RC beams) exhibited a consistent failure pattern. Following the elastic behavior phase and strain compatibility between the tensioned concrete and reinforcement, the beams developed cracks (with an average spacing of 15 cm), particularly in the middle third of the span where the maximum bending moment occurs. Further load application causes the cracks to become denser, as they continue to propagate along the entire height of the tensioned part of the beam. Type K beams, from the onset of the first cracks to the onset of the yield in the tensioned reinforcement, demonstrated an average maximum deflection of 20 mm and average crack widths of 0 and 0.25 mm. The force causing the yielding of the reinforcement (average 53 kN) induced an extreme nonlinear behavior in the experimental models, characterized by a sudden increase in cracks and deflections, surpassing stress levels in the compression zone, and eventual concrete crushing. Upon reaching the nominal force, deflection increased uncontrollably, dominant cracks evolved into fissures, and concrete crushing spread in the compressed zone, culminating in beam failure (see Figure 9). The failure of the control beams was characterized by evenly distributed cracks and exhibited ductile behavior.

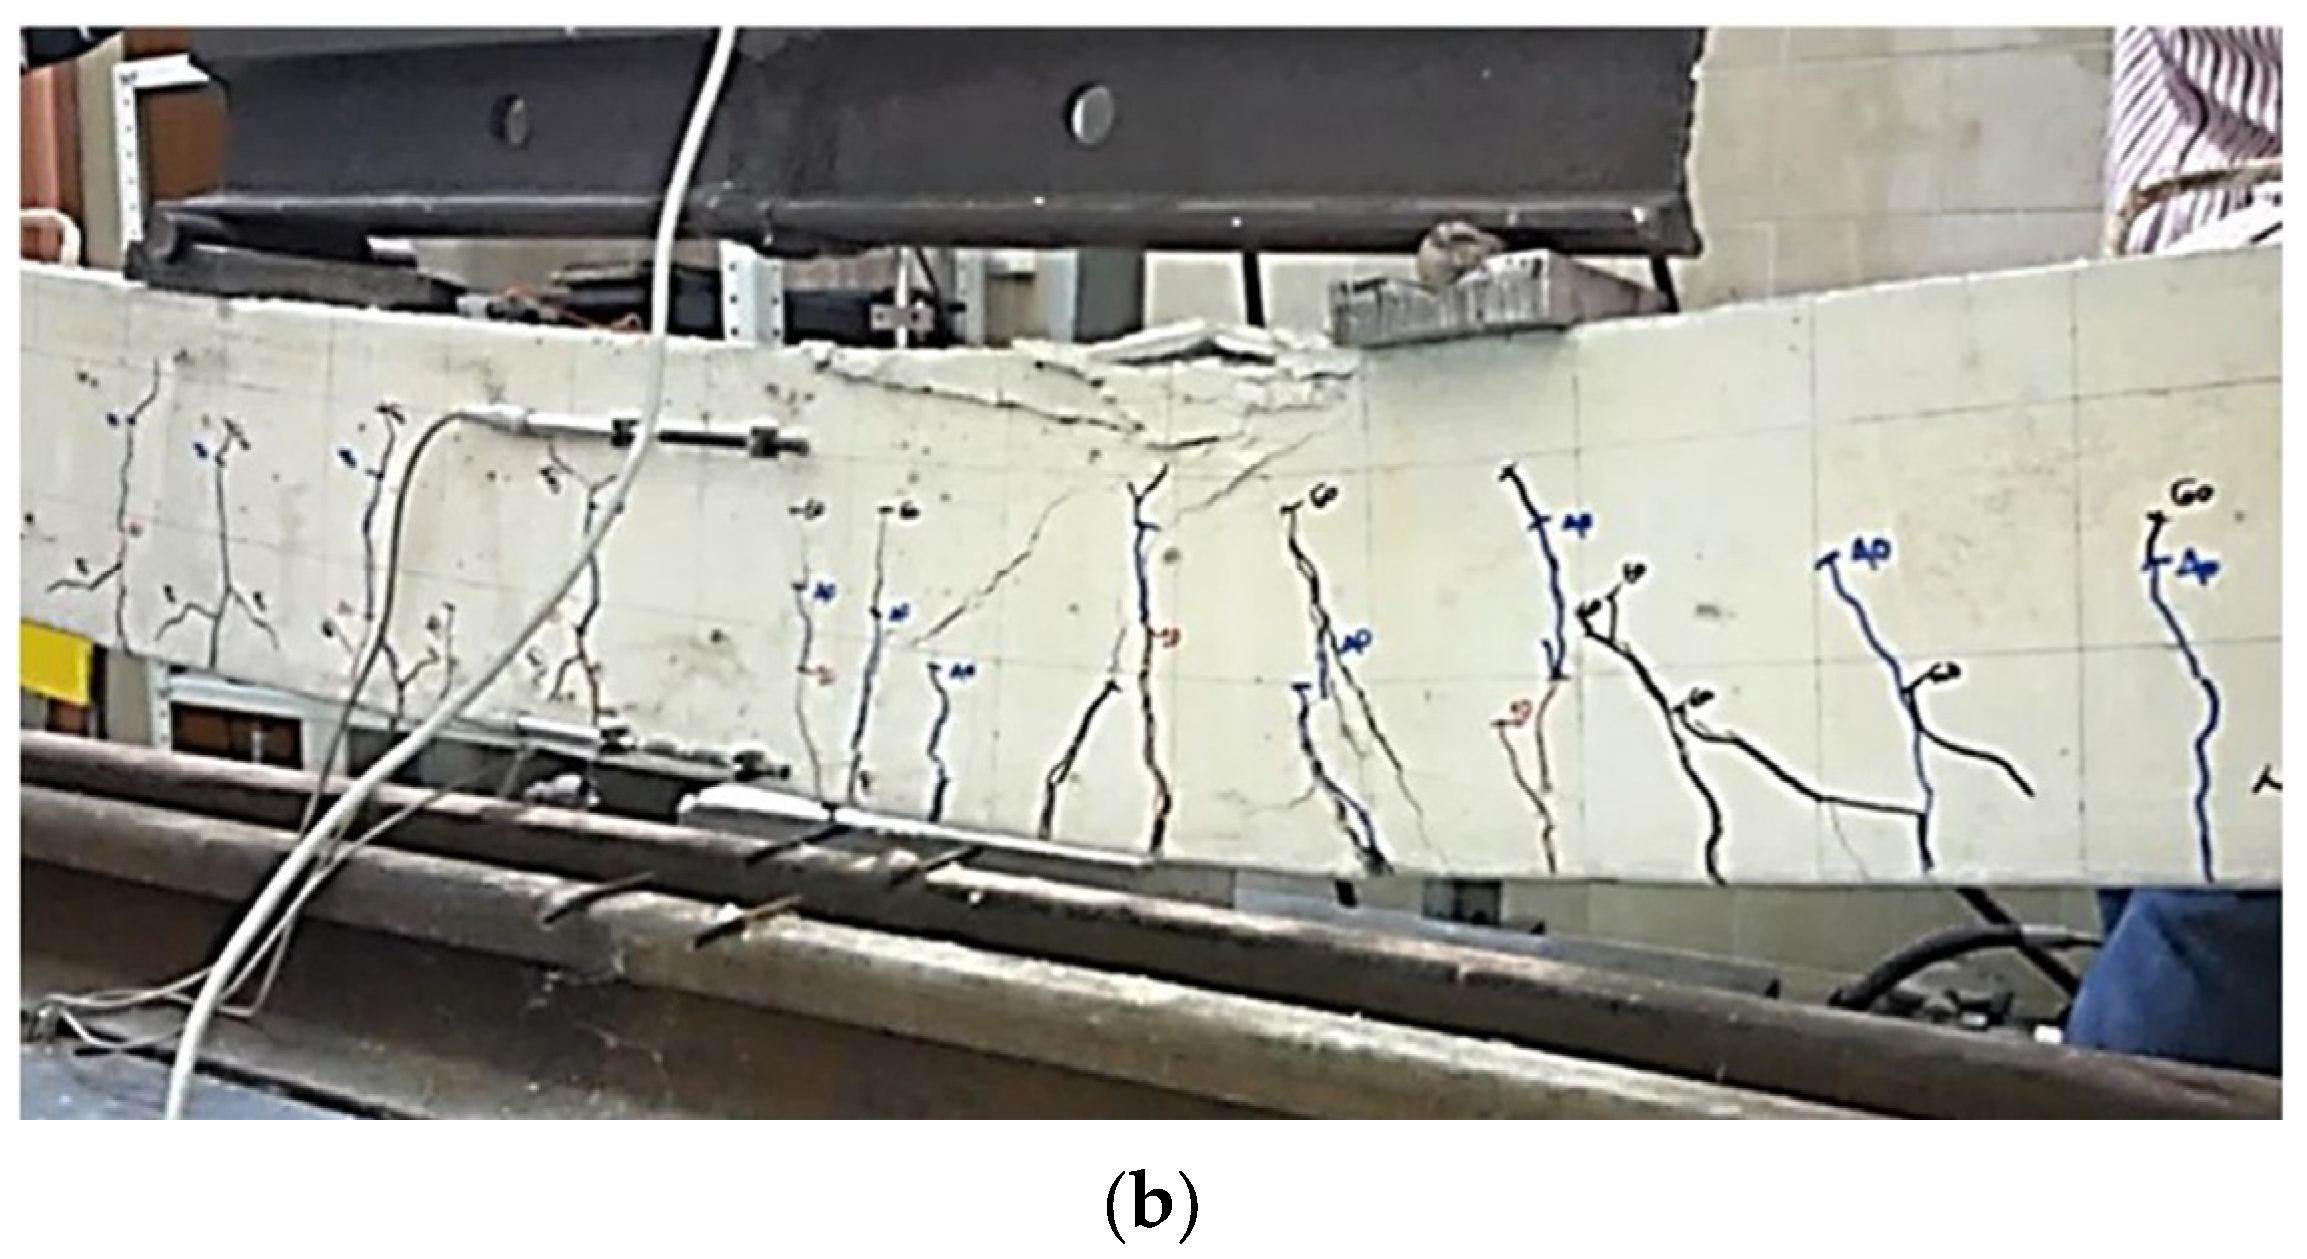
5.2.2. Description of Observed Failure Mechanism of Strengthened RC Beams

All strengthened experimental models initially exhibited elastic behavior under loading, with cracks in the concrete primarily forming in the middle third of the span. The initial cracks formed at an average spacing of 20 cm, in contrast to the initial cracks of the control beams, which were denser (average 15 cm). As the load increased, the cracks became denser and developed along the height of reinforced beams. Since the onset of the first cracks to the onset of the yield in the tensioned reinforcement, the strengthened beams demonstrated average deflections from 20 m to 23 mm and average concrete crack widths of 0.26 mm to 0.30 mm (depending on the type of ferrocement reinforcement). The force causing reinforcement yielding (an average of 60 kN for type I, to 74 kN for type IV) induced an extreme nonlinear behavior in the models. Simultaneously, the ferrocement reinforcement, acting in conjunction with the RC beams as a fully composite section, transitioned out of the elastic behavior zone earlier than the reinforced concrete portion of the beam. The onset of nonlinear behavior in the ferrocement strips manifested as the formation of micro-cracks with a web pattern. During this phase, several visible cracks formed on the ferrocement in the zone of the maximum bending (middle third of the span) of the beam. One of these cracks became dominant, leading to the failure of the micro-reinforcement layers. Following the yielding of the micro-reinforcement, there was an accelerated propagation of the dominant crack into a fissure, resulting in the complete failure of the strengthened experimental models. In contrast to the referent non-strengthened RC beams, the compression stresses in the strengthened models were not exceeded, and no cracking or crushing of concrete in the compressed zone was observed. The failure moment of the micro-reinforcement layers was considered the failure moment, i.e., the loss of the load bearing capacity of the model. Without a further increase in the load, the deflections of strengthened beams increase, i.e., the behavior in this phase is very similar to the non-strengthened control beams. There is concrete separation from the tensioned reinforcement at the level of the cover layer. All tested strengthened beams exhibited the failure of the load bearing capacity in the same manner (see Figure 10), always occurring in the zone of maximum bending moments (middle third of the span). The assumed full bond between the RC beam and ferrocement strip proved to be correct, as at the moment of bearing capacity failure, the ferrocement strips remained bonded to the reinforced concrete, regardless of their longitudinal breaking and loss of strengthening function.

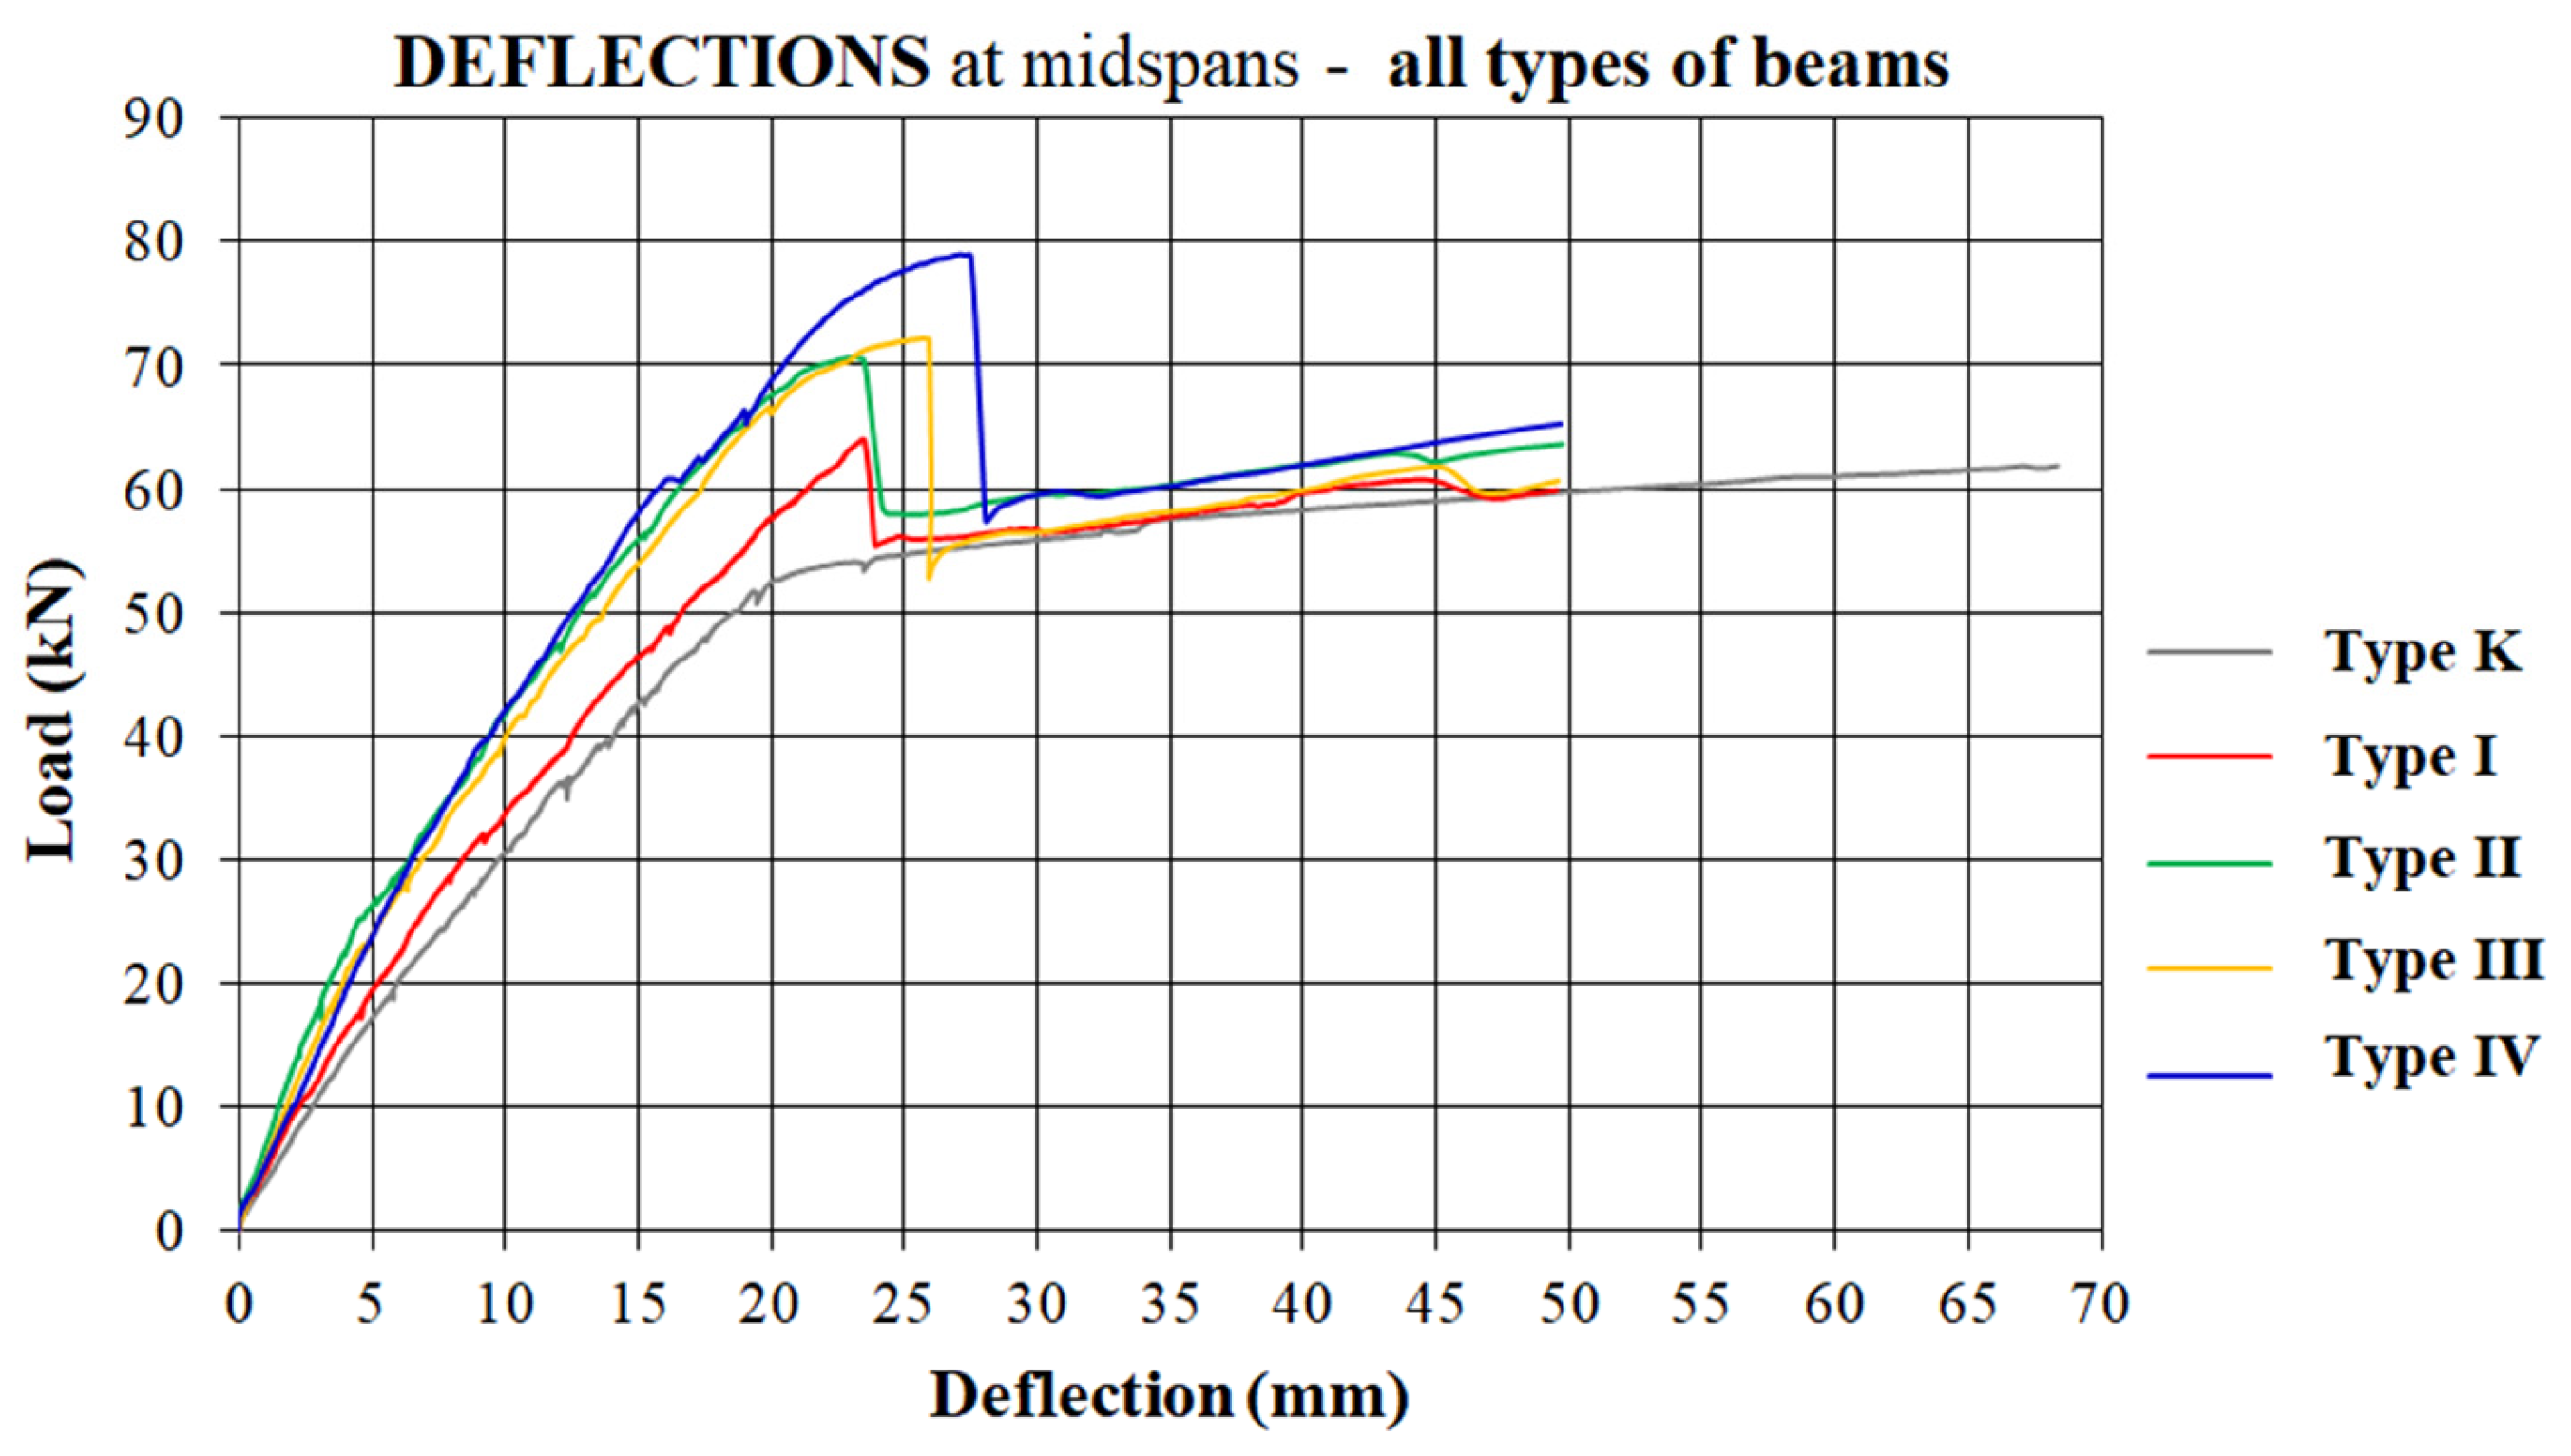
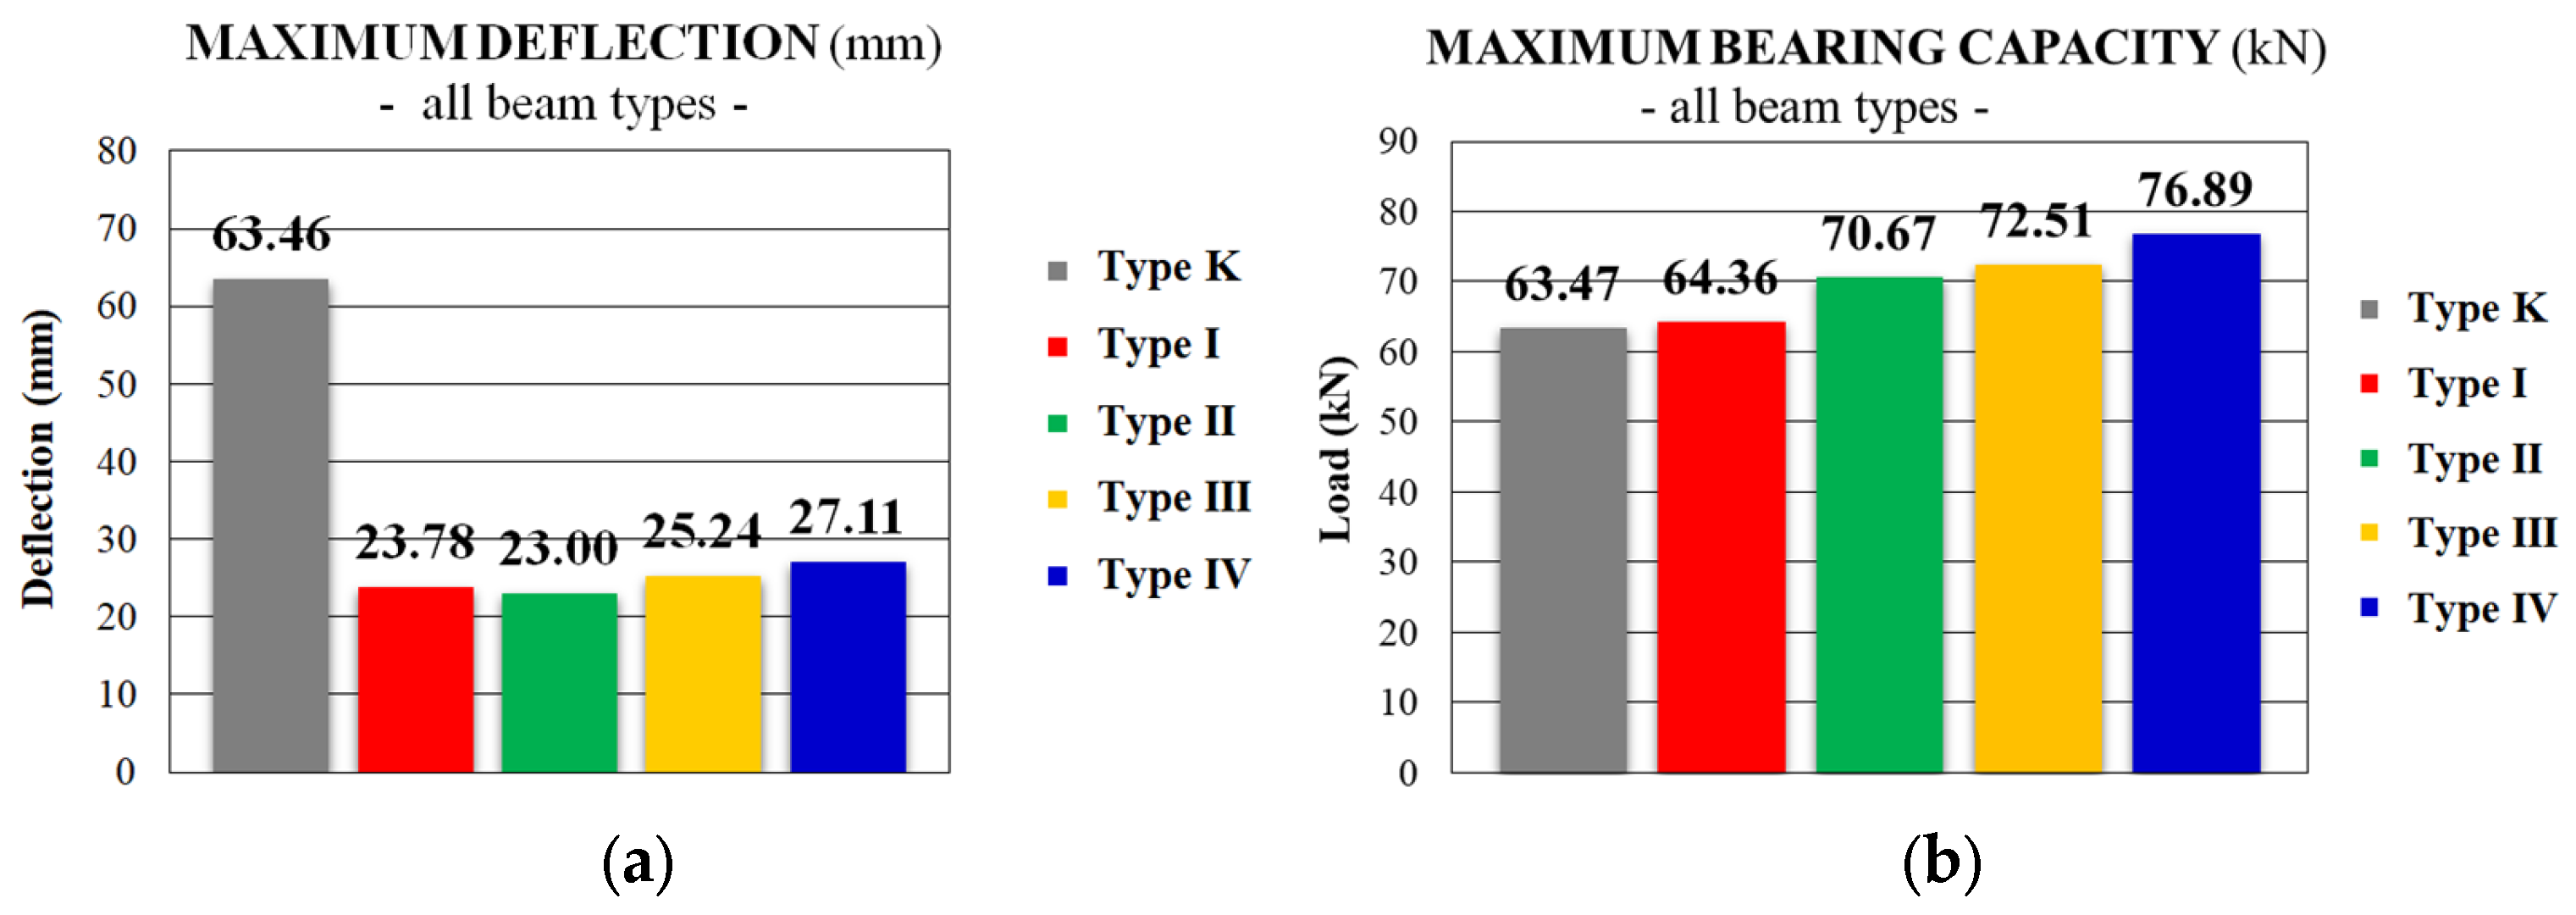
5.2.3. Description of Test Results Obtained for Deflections

A special focus on the analysis of the experimental results is placed on deflections. Monitoring deflections provides a clear insight into the behavior of beams under a load, capturing the combined influence of load, geometry, and material stiffness. Figure 11 illustrates characteristic deflection diagrams measured at the mid-span points of all experimental models.
In the linear behavior zone, the impact of the stiffness of different types of beams to deflection can be observed, which is expected considering the fact that the increase in beam rigidity is followed by the type of reinforcement. After the onset of the first cracks, one can clearly observe the increase in the load bearing capacity of strengthened models in correlation to the increase in the thickness of ferrocement and the number of micro-reinforcement layers. There is a pronounced nonlinear behavior of strengthened models in a short interval up to the failure of ferrocement, i.e., fracture, after which the deformations increase without the increase in load bearing capacity. In this zone, the beams strengthened with ferrocement exhibit a higher ultimate load bearing capacity in comparison to non-strengthened beams, proportionately to the coefficient of additional ferrocement reinforcement. In all the strengthened models, there is a characteristic decrease in the load bearing capacity after the failure of ferrocement reinforcement, i.e., reverting to the load bearing capacity of a non-strengthened beam, until the final failure.
Figure 12a presents a comparative diagram illustrating the characteristic maximum deflections until failure of all types of strengthened beams, juxtaposed with the deflection of control beams. At the load that induces failure in non-strengthened beams, the maximum deflections of strengthened beams are half as much as those of non-strengthened control beams.

5.2.4. Description of Test Results Obtained for Ultimate Load Capacity

The ultimate load capacities of all types of beams are depicted in Figure 12b based on the experimental results. The load bearing capacity increases with the increase in the percentage of additional reinforcement (strengthening) with ferrocement elements and completely follows the theoretical approach. There is not a single case when the beam and reinforcement separate, i.e., the composite cross-sections behave as a single material up to the failure to bending in the zone of maximum moments. A short interval of extremely nonlinear behavior of strengthened beams until the failure phase shows their relatively low ductility. The load bearing capacity of the tested strengthened RC beams was observed to be 21.14% higher (type IV) than that of the non-strengthened beams (type K).

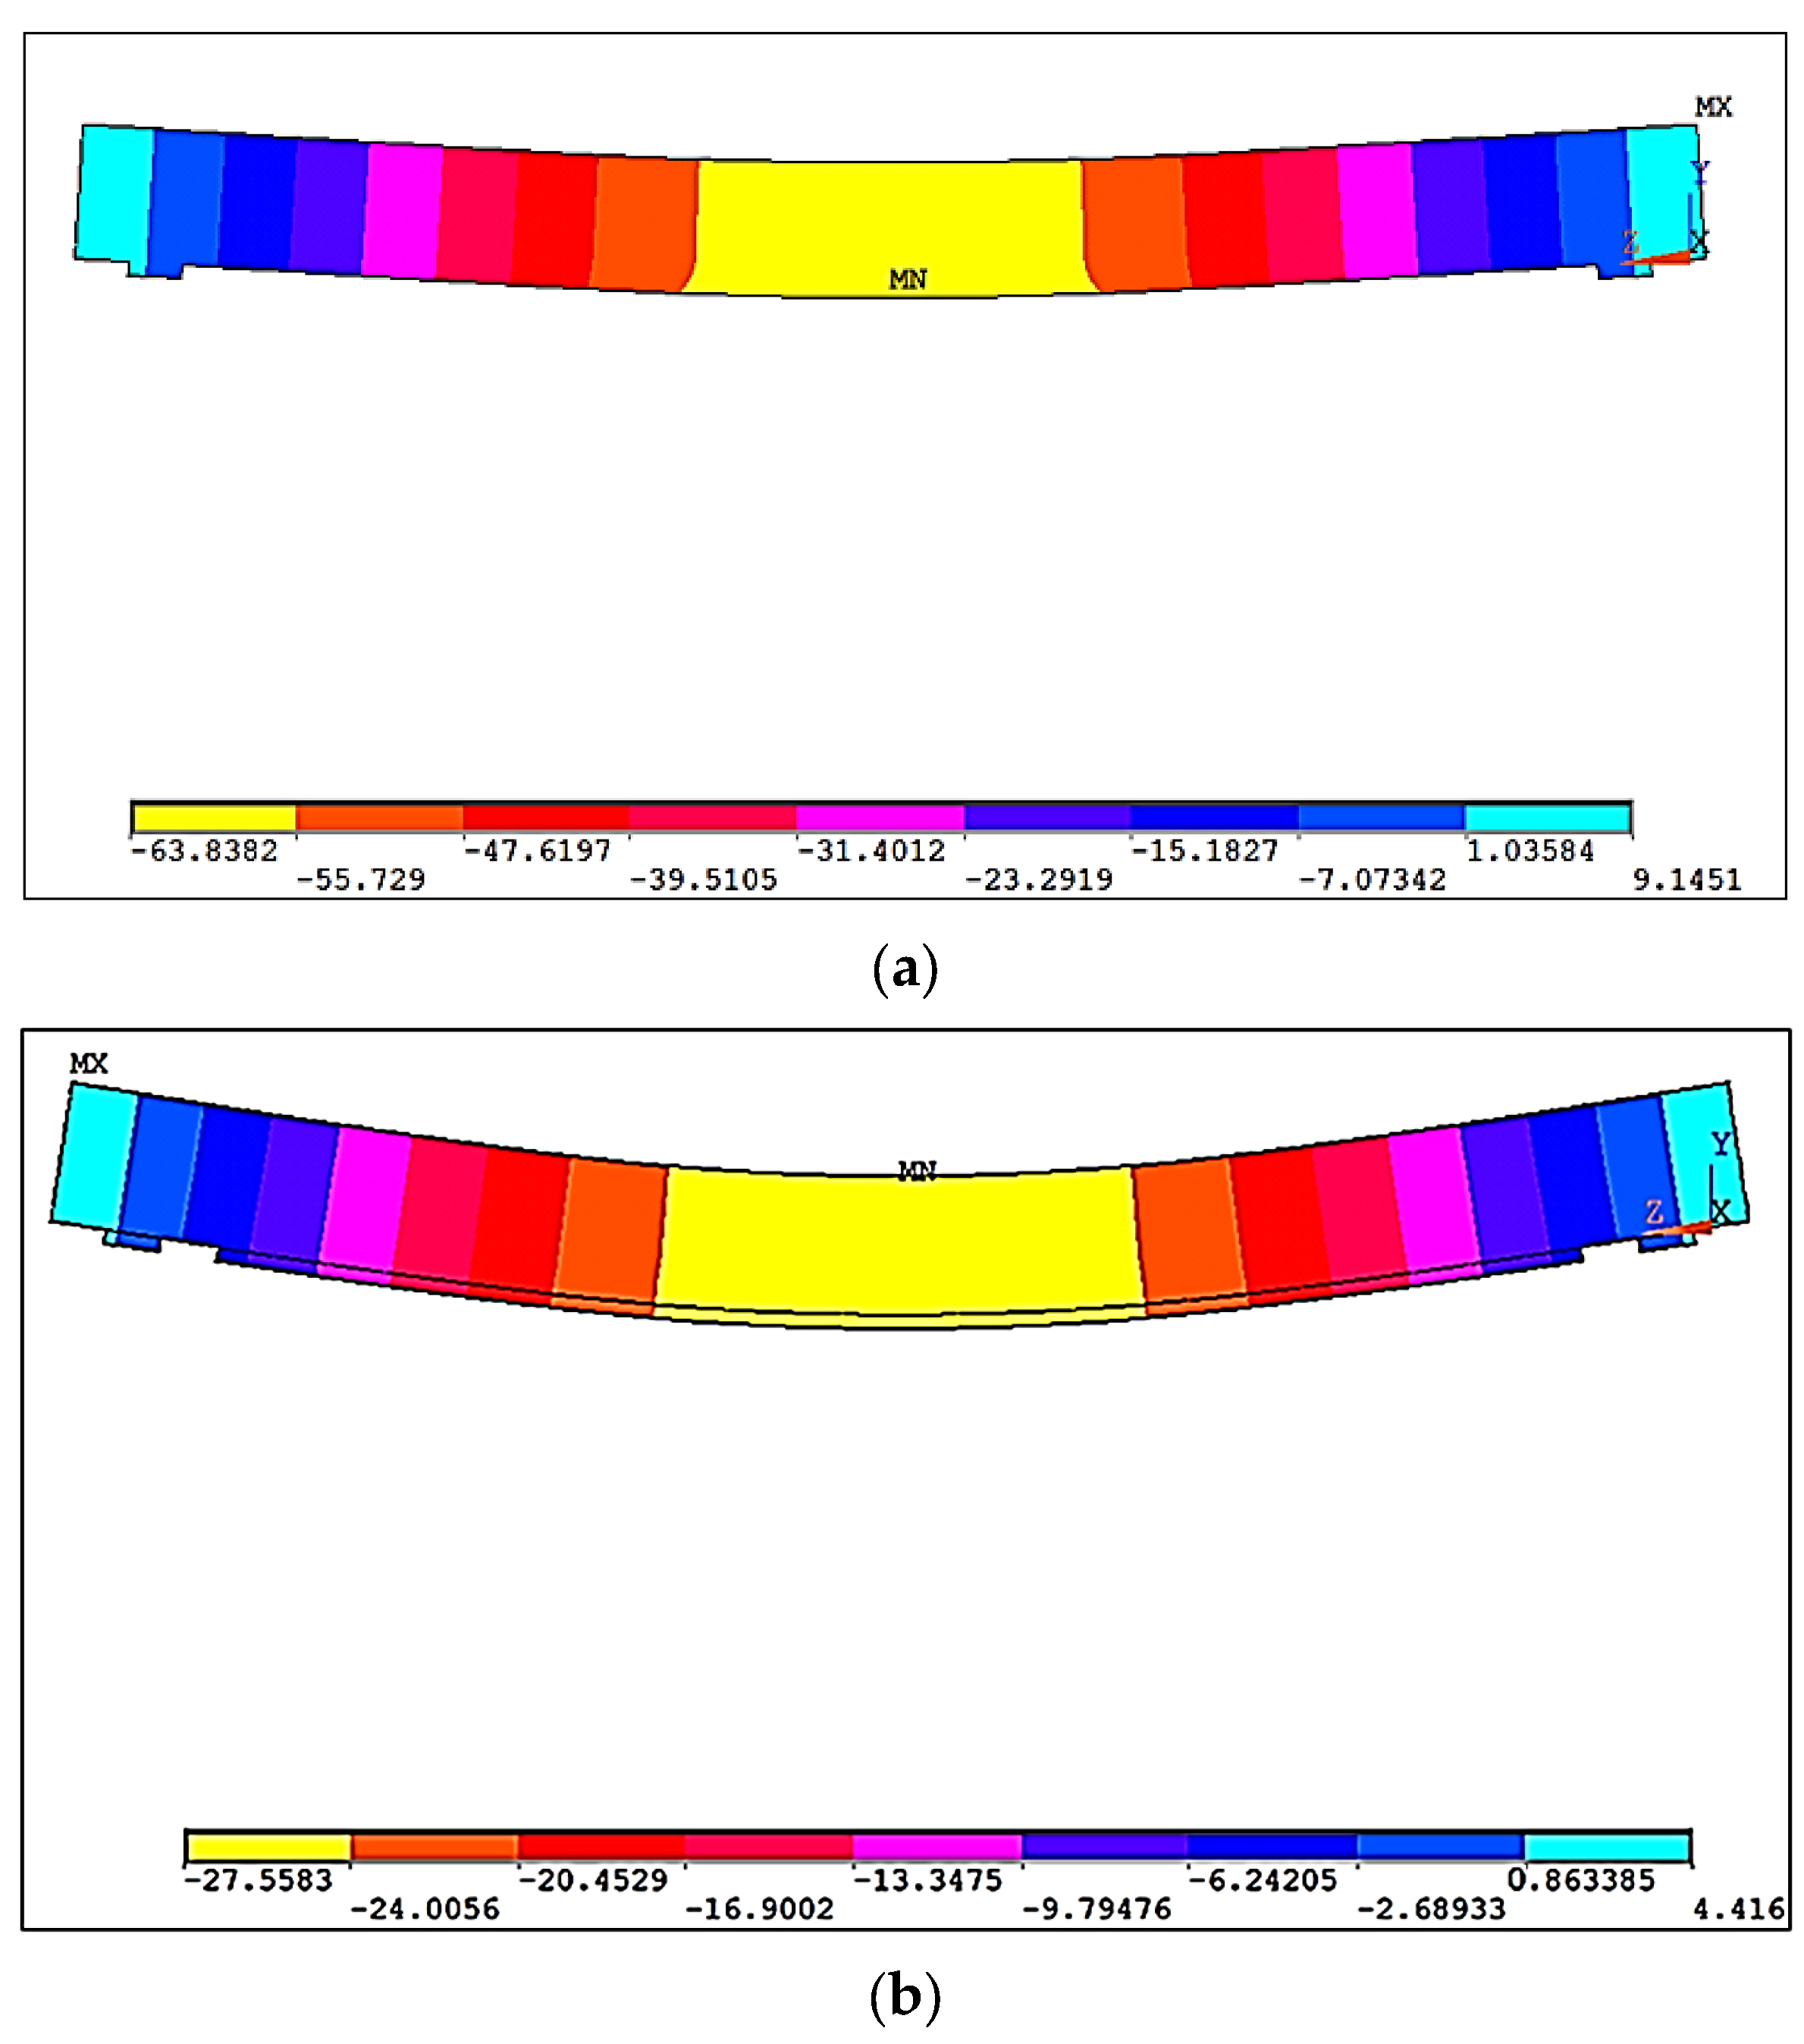
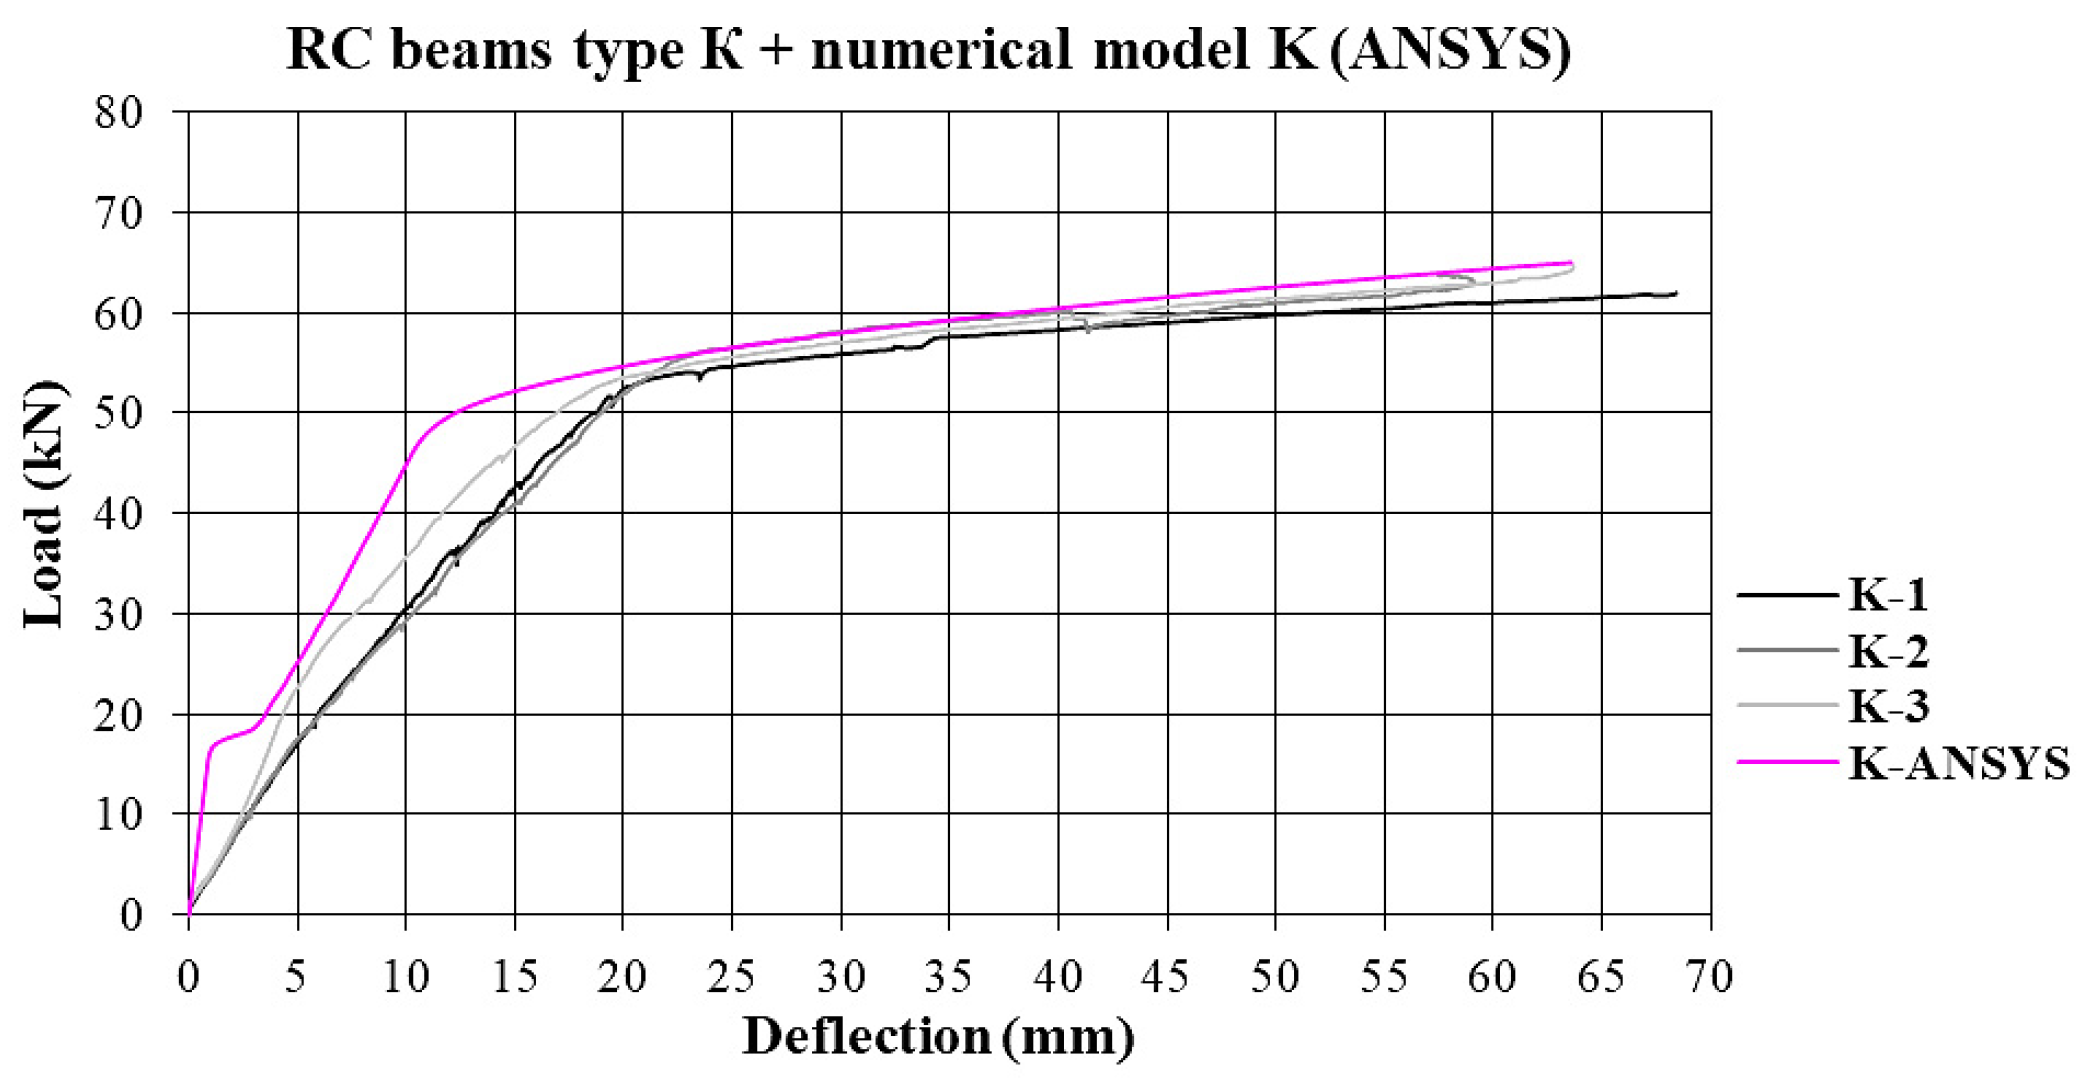
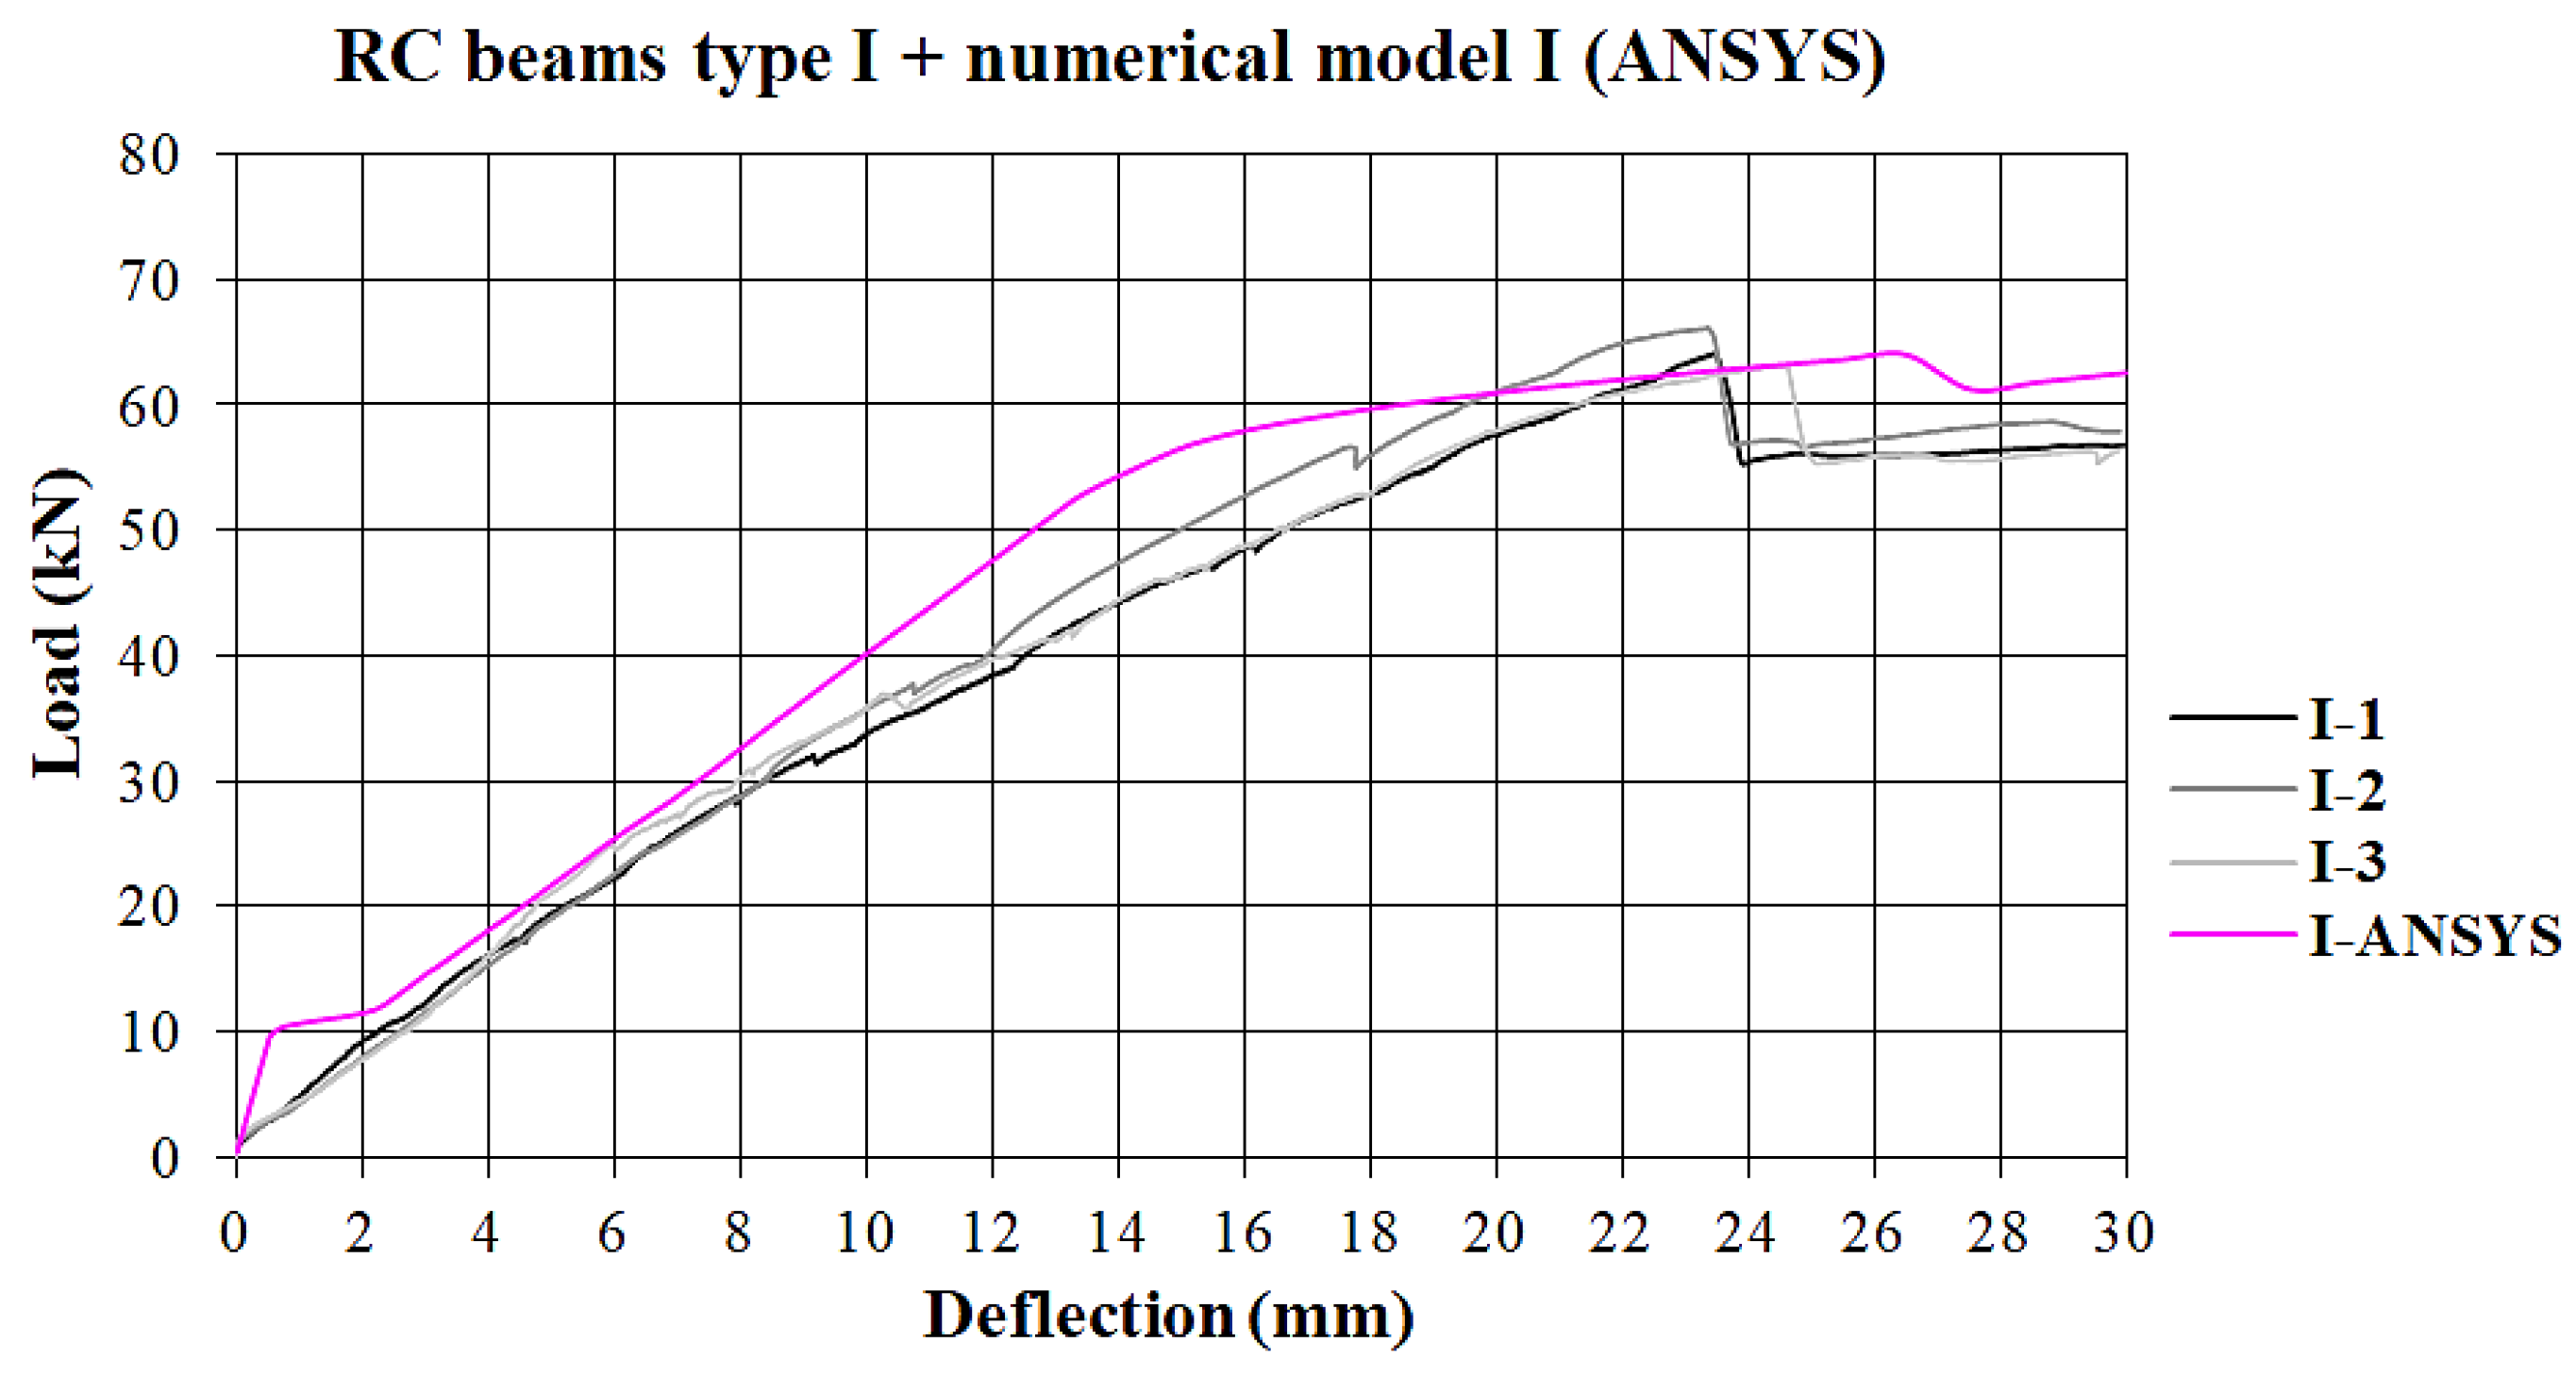
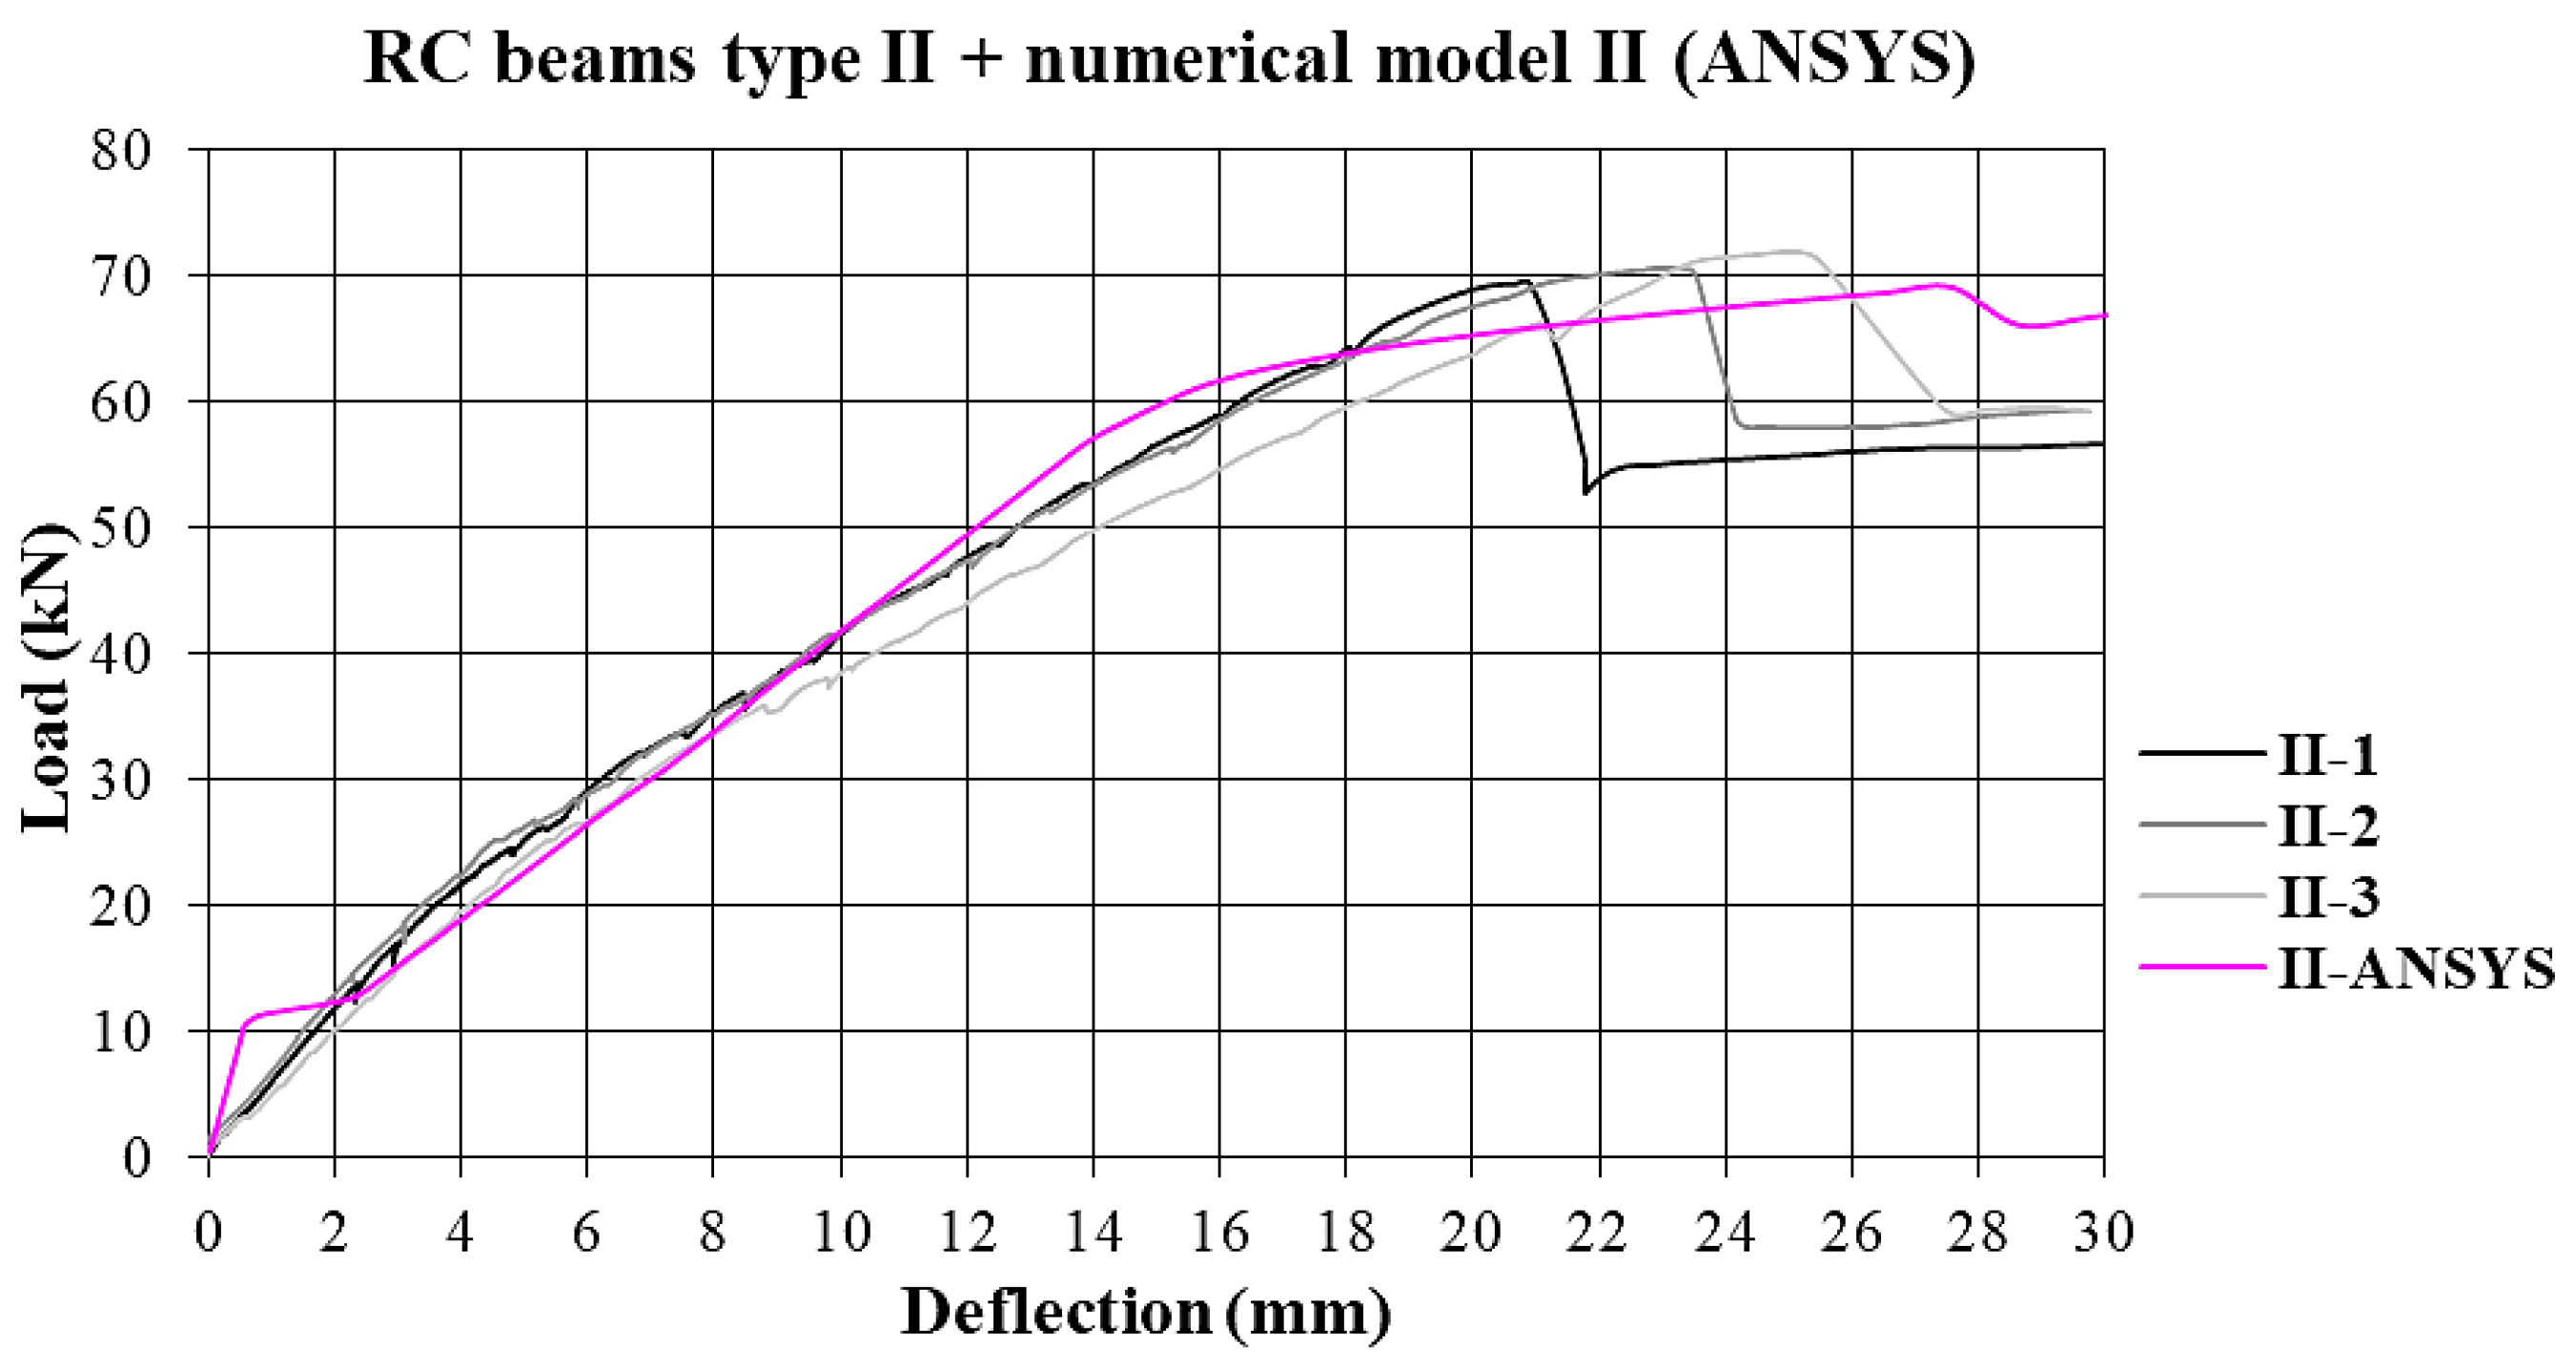
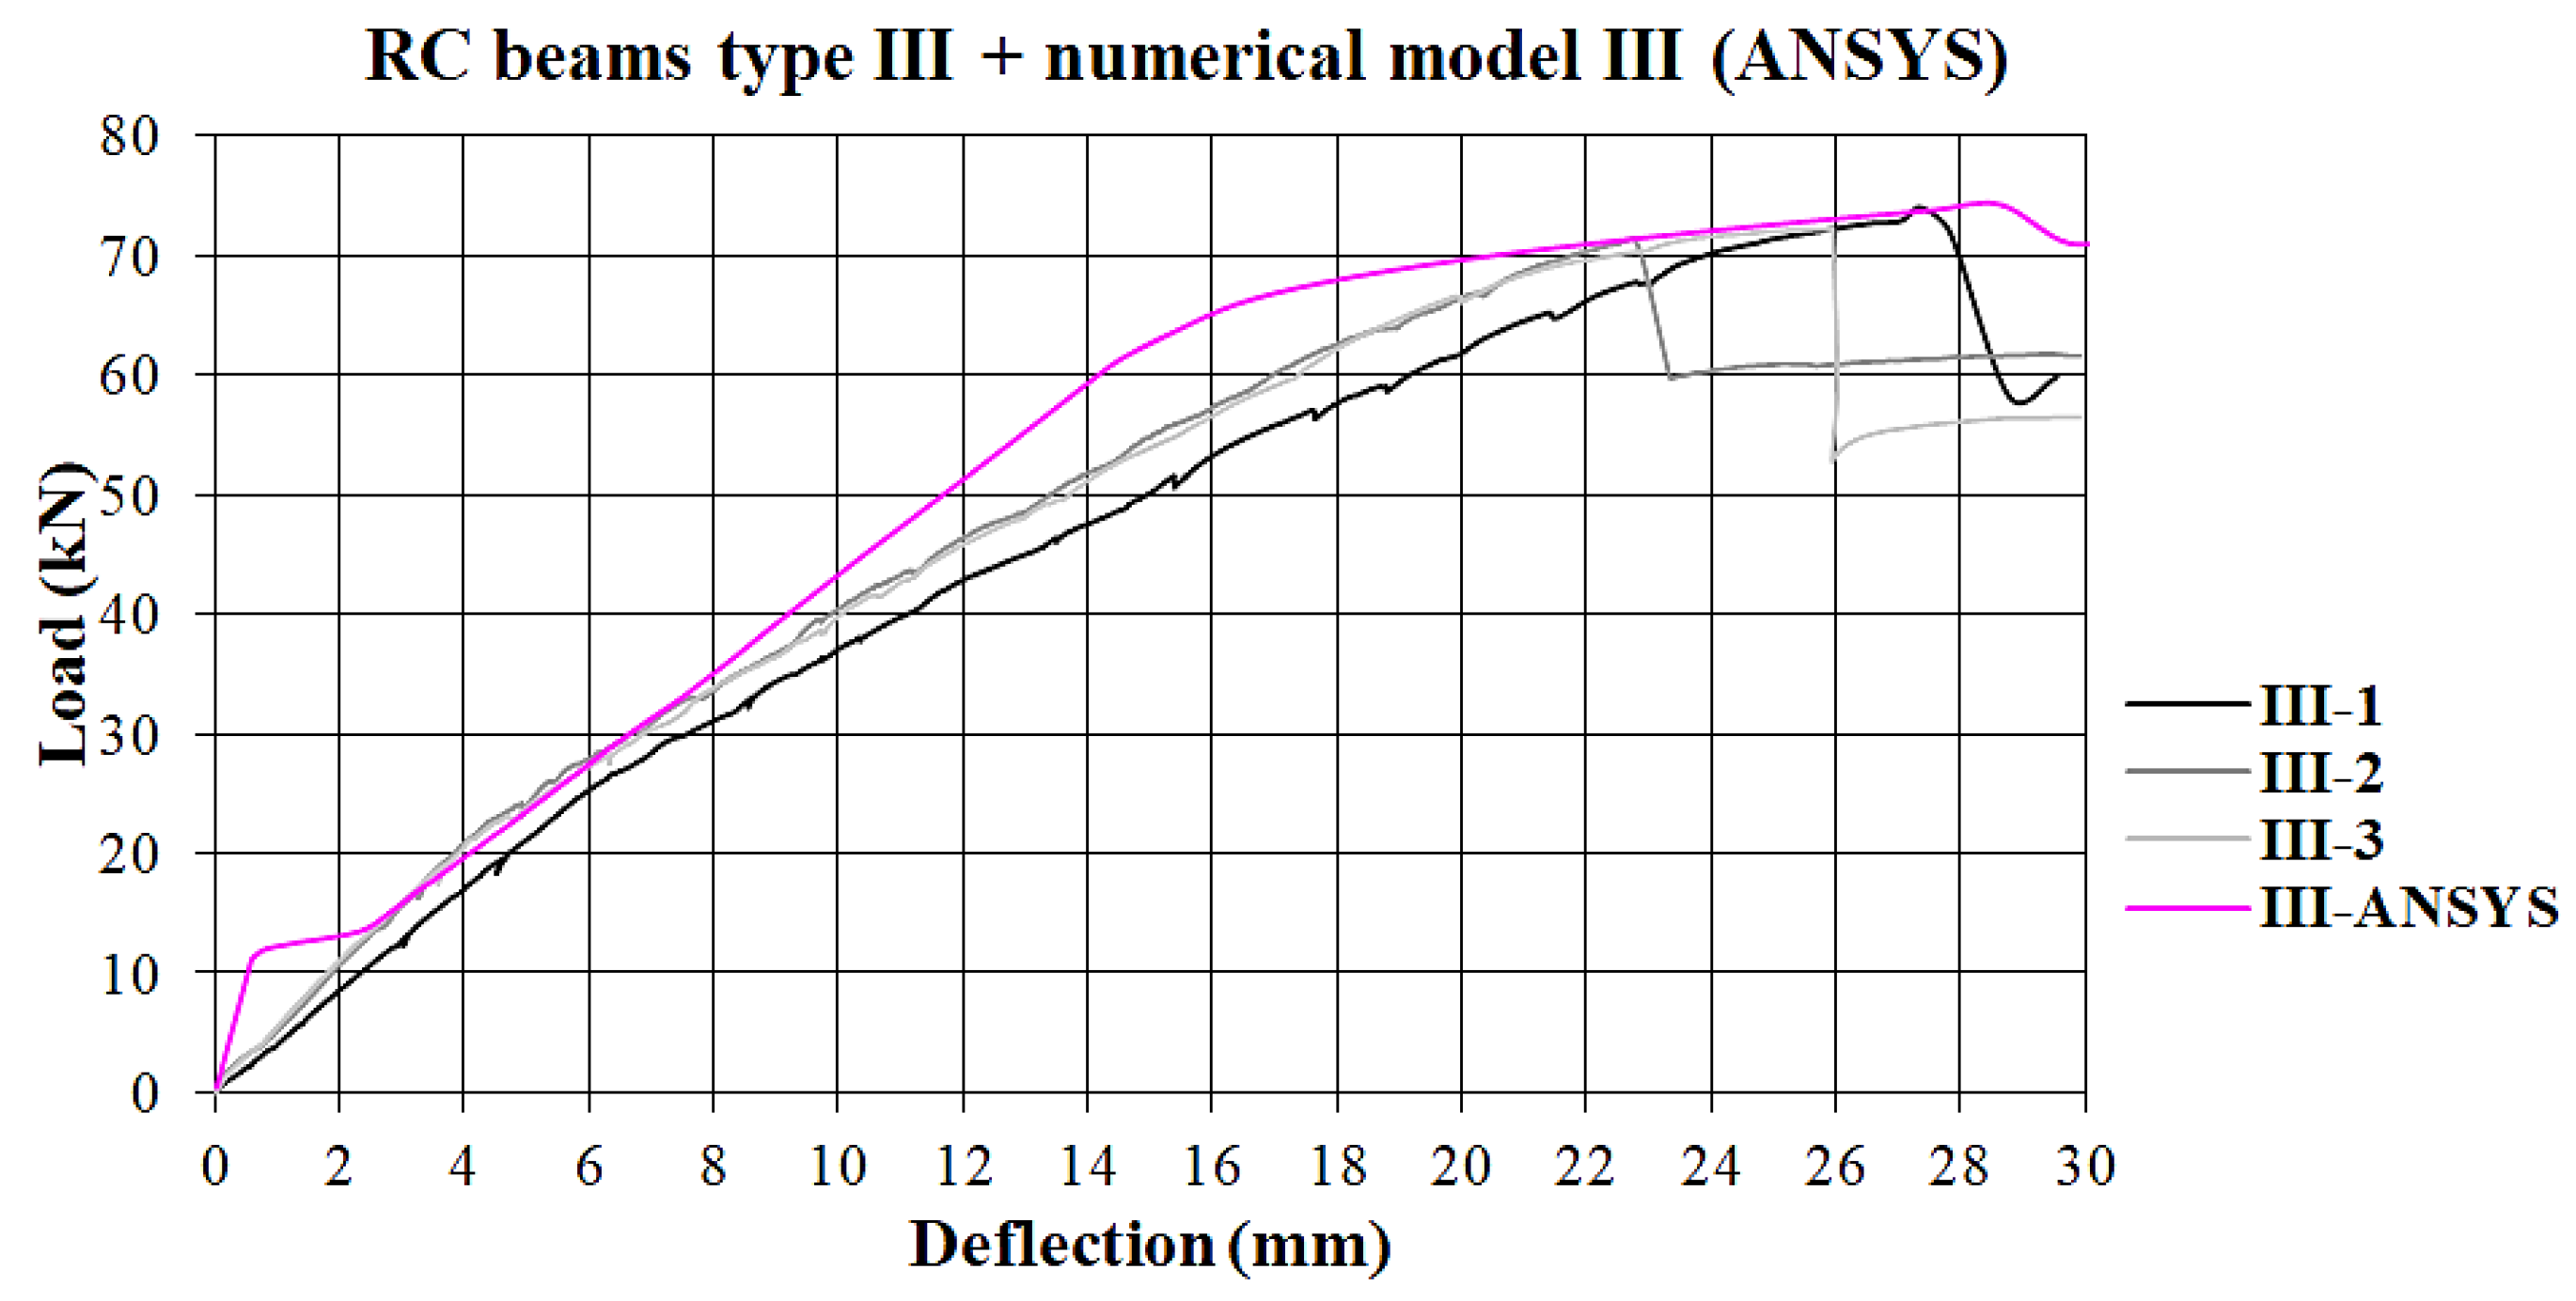
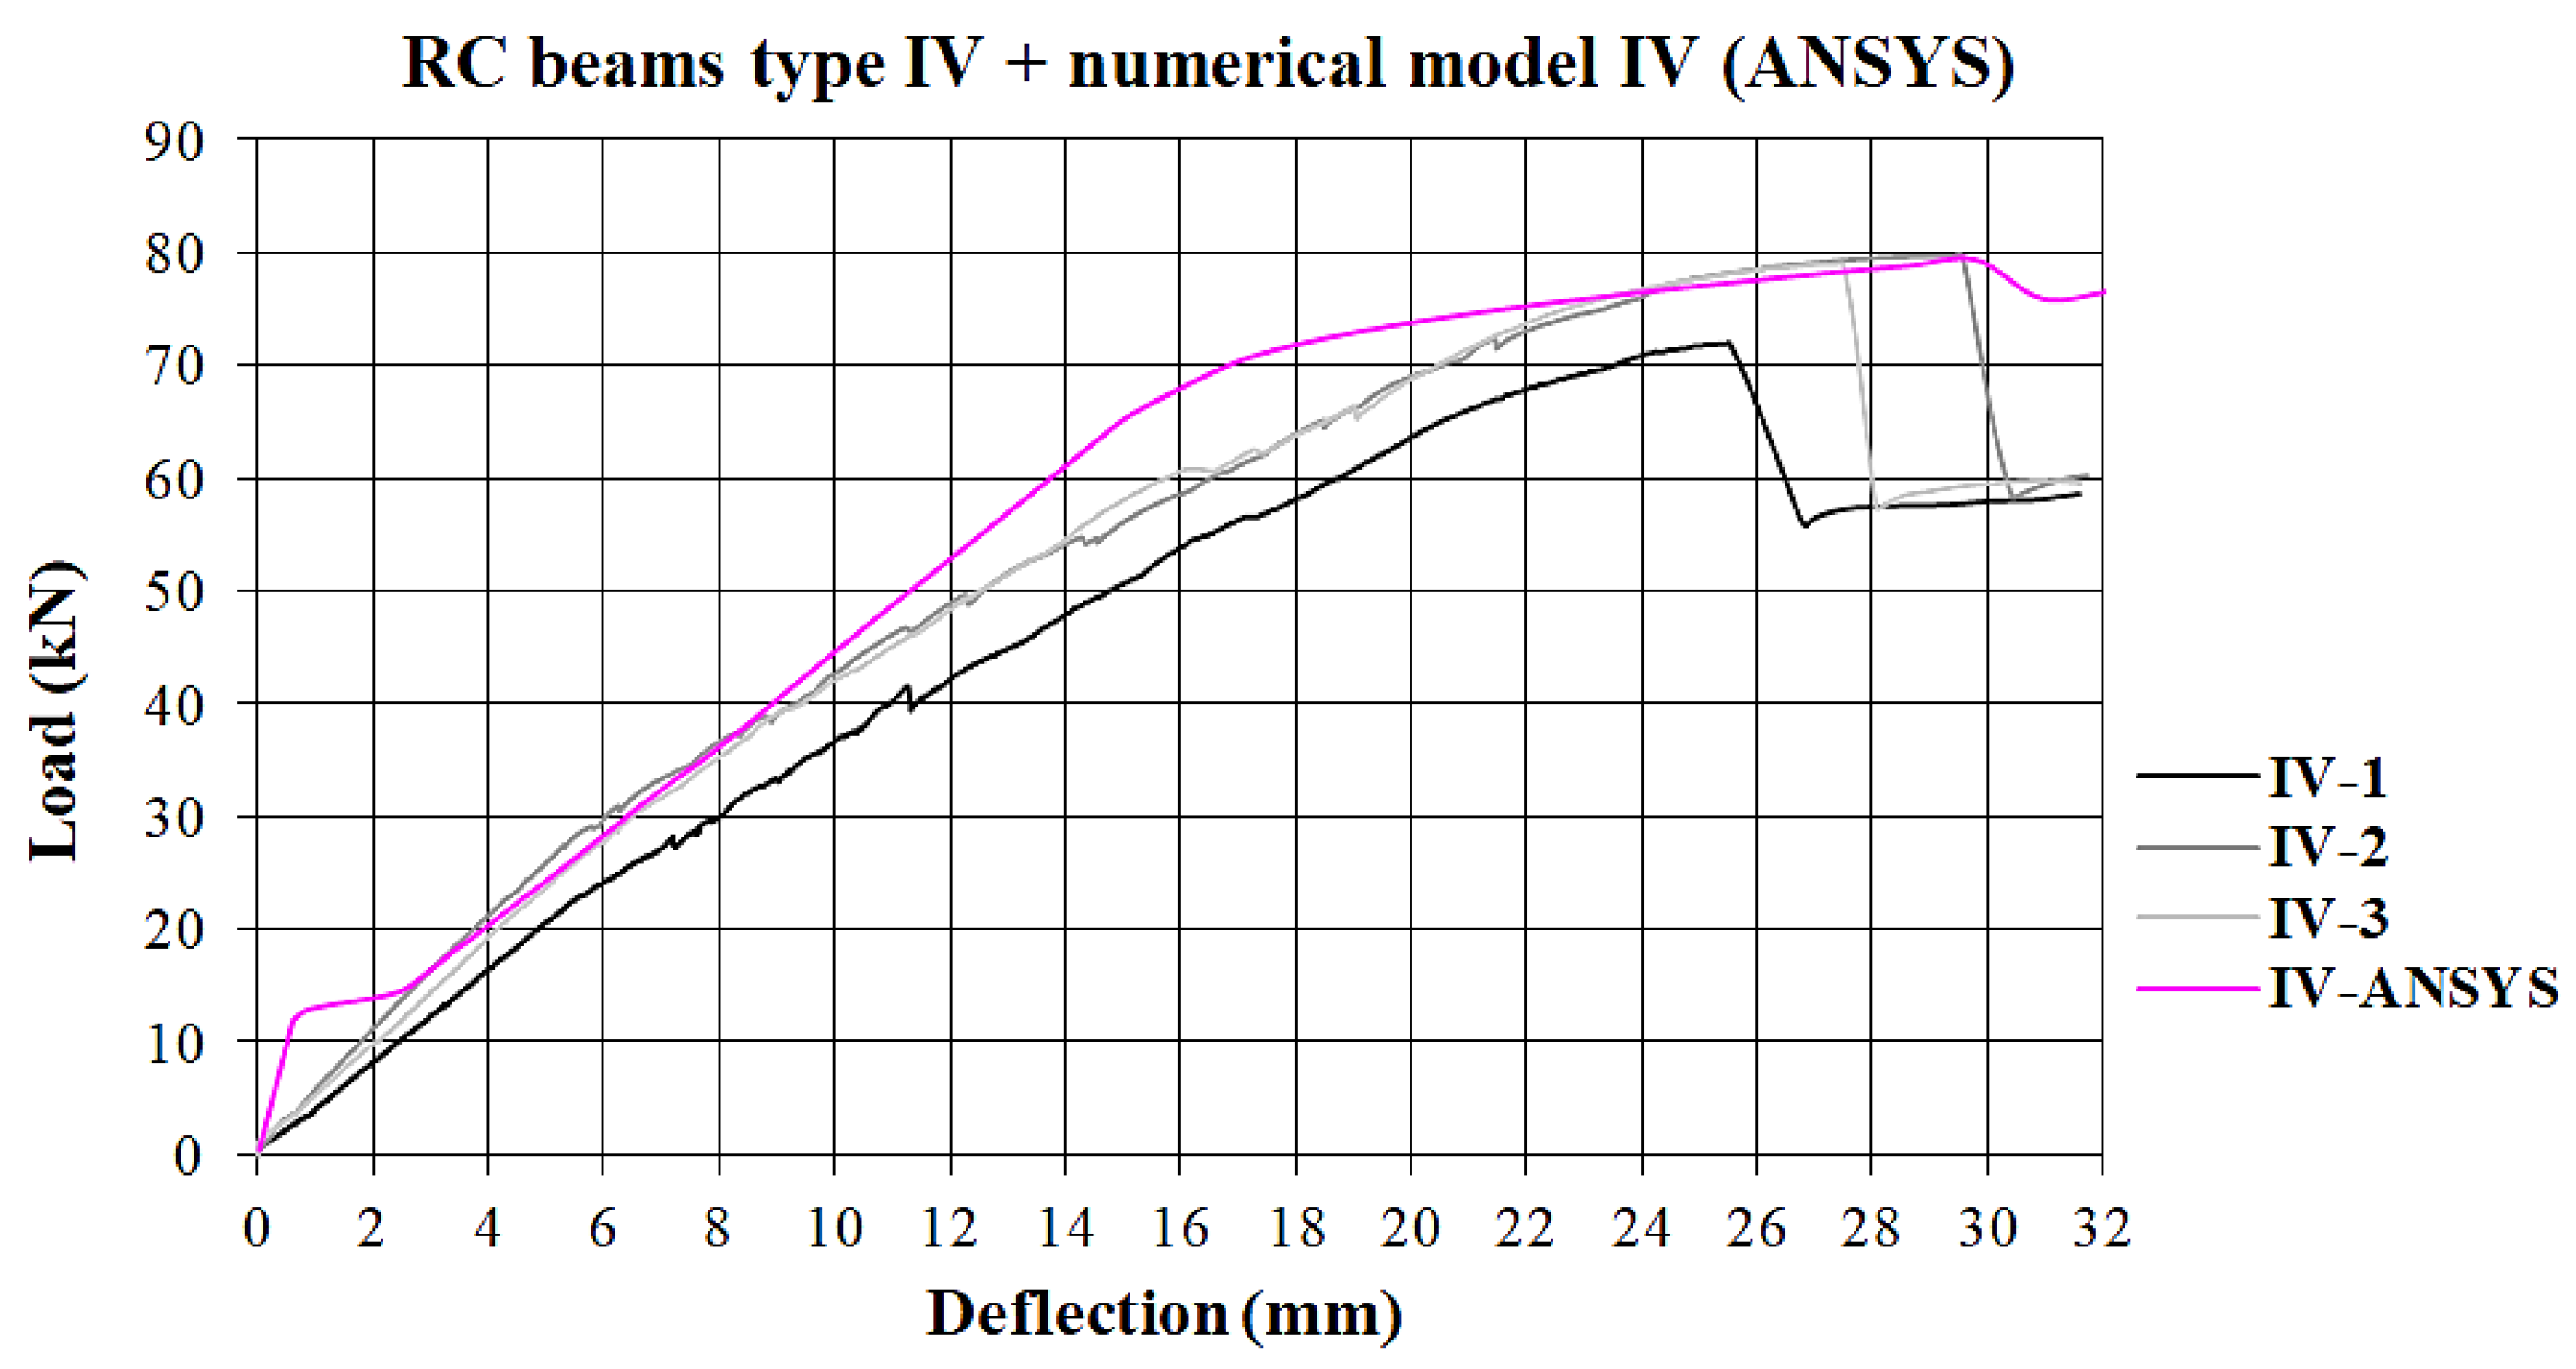
5.3. An Analysis of the Obtained Numerical Results

Figure 13 shows the deformed shape of the RC beams obtained from the FE analysis.
Figure 14, Figure 15, Figure 16, Figure 17 and Figure 18 display diagrams of deflections measured at the mid-spans of all tested models, along with the calculated deflections obtained through numerical analysis.
The diagrams of the experimentally measured and numerically calculated deflection of the non-strengthened beam, shown in Figure 14, have a similar qualitative flow. A higher stiffness of the numerical model in the initial phase of loading (elastic deformation zone) can be interpreted by assuming the ideal bonds between the constitutive materials. The imperfection of experimental beam models, i.e., the onset of micro-cracks at the interface of cement and aggregate, is certainly one of the reasons of the low stiffness in respect to the numerical model. A very good agreement of the results occurs in the phase after the onset of the yield of the conventional reinforcement, until failure.
The diagrams of measured deflections and numerically calculated deflections at the mid-spans of strengthened beam models of all types are presented in Figure 15, Figure 16, Figure 17 and Figure 18. Irrespective of the type of strengthening, the diagrams of experimental (measured) deflections and the design values of deflections, obtained through the numerical analysis, show a similar quantitative flow. The comparison of experimentally measured deflections with the results of the numerical analysis for the strengthened models of all types shows disagreement in the zone of elastic deformations. With the onset of micro-cracks in concrete, the presence of ferrocement increases the imperfection of experimental beams in relation to the numerical model. In the process, the ferrocement reinforcement exits the zone of elastic deformations faster than the reinforced concrete and provides its main contribution in the post-crack phase. The agreement of the results until and after the onset of the yield in the conventional reinforcement is good for all types of strengthening. In the experimental models, the moment of the onset of the yield in the reinforcement is more difficult to detect, as opposed to the numerical model where the boundary is more clearly pronounced. It can be concluded that the numerical models, with the assumption of ideal bonds between all the constitutive materials, provide satisfactorily accurate results, except in the first phase (elastic deformation phase).

5.4. Comparison of Bending Failure Forces of RC Beams Strengthened with Ferrocement

Table 9 presents the concentrated forces required to induce the nominal bending moment, obtained via both calculation and experimental methods. These forces can be achieved using the values depicted in Figure 8a. The table juxtaposes these values with the mean failure force of experimental models of all types, as well as with the failure force derived from numerical simulation.

6. Conclusions

Utilizing the method of reinforcing RC beams with prefabricated ferrocement elements and considering the analytical, experimental, and numerical investigations presented, the following conclusions can be drawn:
The selected method of bonding reinforced concrete and ferrocement through adhesive epoxy mortar has demonstrated effectiveness, simplicity, and ease of application in strengthening RC beams against bending. The adhesive epoxy mortar creates a robust bond within the cross-section, ensuring an enhanced resistance of both reinforced concrete and ferrocement. Even upon reaching the failure of the load bearing capacity and the development of significant cracks in all tested strengthened RC beams, the ferrocement strips remained firmly attached to the reinforced concrete, despite longitudinal failure and the loss of their strengthening function.
The addition of ferrocement strips significantly enhanced the load bearing capacity of RC beams. The load bearing capacity of the tested strengthened RC beams was observed to be 21.14% higher than that of the non-strengthened beams (Figure 12b), with variations depending on the reinforcement type (such as the thickness of the ferrocement strip and the number of micro-reinforcement mesh layers).
The incorporation of ferrocement strips in strengthening the RC beams had a highly beneficial impact on the serviceability limit state. For the failure load of non-strengthened beams, the maximum deflections of the tested strengthened beams ranged from 36% to 43% of the maximum deflection of non-strengthened beams (Figure 12a).
The numerical results of the strengthened and control beams correspond closely with the measured experimental values. The failure force calculated by the numerical analysis deviates by up to 3.94% from the average failure force of experimental models (Table 9).
The transformed area method for the cracked section, serving as an analytical approach to simulate the composite cross-section of the strengthened beam, demonstrated reliability and applicability. The analytically calculated failure force is contingent upon the partial factor for variable action, which was explored within the 1.5–1.7 range in this research (Table 7 and Table 8).
When compared to widely applied SA and CFRP strengthening techniques (Table 1), the utilization of ferrocement strengthening also yields a positive environmental impact, as evidenced by the lowest amount of CO2/kg of materials used in its application.
This study concludes that ferrocement strengthening is comparable to other advanced strengthening technologies. It provides very good results in terms of durability, strength, toughness, water resistance, resilience to harsh environments, ease of shaping, and construction. Furthermore, it is accompanied by relatively straightforward and well-established calculation principles.
The analogy of results related to the force of failure obtained with various procedures (Table 9) is particularly visible here. Very small differences in the obtained values of the failure force confirm a sound approach to the analysis of this strengthening method.
As opposed to the conventionally reinforced concrete, which has discretely arranged reinforcement for the resisting of the tension force and ballast of concrete in the tensioned zone, ferrocement has a much more natural composition, of improved characteristics for resisting the tension, which provides considerable advantages to this composite, being the increases in the nominal load bearing capacity or the rehabilitation of the damage of RC beams exposed to bending. Numerical beam models provide a realistic display of the state of the beam in service, so they are practically applicable. This study confirms the potential for the implementation of the mentioned analytical models, which considerably improves the availability of this type of designing to the wide circle of designers. Further research will be focused on the flexural stiffness, toughness, and ductility of RC strengthened beams, but one should pay attention to the behavior of the beams exposed to the dynamic action, in order to update the base of usable data related to the wider practical application. The limitations of this study are in the type of load which was examined (only flexure) and the type and geometrical characteristics (beam).

Author Contributions

Conceptualization, D.Ž. and P.B.; methodology, D.Ž.; software, D.K.; validation, R.C., P.B. and D.Ž.; formal analysis, S.R. and D.Ž.; investigation, S.R.; data curation, S.R.; writing—original draft preparation, D.Ž.; writing—review and editing, D.Ž.; supervision, P.B. and D.K. All authors have read and agreed to the published version of the manuscript.

Funding

This research received no external funding.

Data Availability Statement

All relevant data is included in the article. More detailed data can be obtained upon request from the corresponding author.

Conflicts of Interest

The authors declare no conflict of interest.

References

  1. Arguillarena, A.; Margallo, M.; Urtiaga, A. Carbon footprint of the hot-dip galvanisation process using a life cycle assessment approach. Clean. Eng. Technol. 2021, 2, 100041. [Google Scholar] [CrossRef]
  2. Dixit, M.K. Life cycle embodied energy analysis of residential buildings: A review of literature to investigate embodied energy parameters. Renew. Sustain. Energy Rev. 2017, 79, 390–413. [Google Scholar] [CrossRef]
  3. Ashraf, M.; Iqbal, M.F.; Rauf, M.; Ashraf, M.U.; Ulhaq, A.; Muhammad, H.; Liu, Q.F. Developing a sustainable concrete incorporating bentonite clay and silica fume: Mechanical and durability performance. J. Clean. Prod. 2022, 337, 130315. [Google Scholar] [CrossRef]
  4. Bajpai, R.; Choudhary, K.; Srivastava, A.; Sangwan, K.S.; Singh, M. Environmental impact assessment of fly ash and silica fume based geopolymer concrete. J. Clean. Prod. 2020, 254, 120147. [Google Scholar] [CrossRef]
  5. Palacios-Munoz, B.; Gracia-Villa, L.; Zabalza-Bribián, I.; López-Mesa, B. Simplified structural design and LCA of reinforced concrete beams strengthening techniques. Eng. Struct. 2018, 174, 418–432. [Google Scholar] [CrossRef]
  6. Chang, P.C.M.; Hossain, A. Life-Cycle Cost Analysis of Ultra High-Performance Concrete (UHPC) in Retrofitting Techniques for ABC Projects; Accelerated Bridge Construction University Transportation Center Florida International University: Miami, FL, USA, 2021; pp. 3–5. [Google Scholar]
  7. Stoiber, N.; Hammerl, M.; Kromoser, B. Cradle-to-gate life cycle assessment of CFRP reinforcement for concrete structures: Calculation basis and exemplary application. J. Clean. Prod. 2021, 280, 124300. [Google Scholar] [CrossRef]
  8. Miller, D.; Doh, J.H.; Guan, H.; Mulvey, M.; Fragomeni, S.; McCarthy, T.; Peters, T. Environmental impact assessment of post tensioned and reinforced concrete slab construction. In Proceedings of the 22nd Australasian Conference on the Mechanics of Structures and Materials, ACMSM 22, Sydney, Australia, 11–14 December 2012; Taylor & Francis Group: London, UK, 2013. [Google Scholar]
  9. Pang, B.; Yang, P.; Wang, Y.; Kendall, A.; Xie, H.; Zhang, Y. Life cycle environmental impact assessment of a bridge with different strengthening schemes. Int. J. Life Cycle Assess. 2015, 20, 1300–1311. [Google Scholar] [CrossRef]
  10. Xiong, G.J.; Wu, X.Y.; Li, F.F.; Yan, Z. Load Carrying Capacity and Ductility of Circular Concrete Columns Confined by Fer-rocement Including Steel Bars. Constr. Build. Mater. 2011, 25, 2263–2268. [Google Scholar] [CrossRef]
  11. Mourad, S.M.; Shannag, M.J. Repair and Strengthening of Reinforced Concrete Square Columns using Ferrocement Jackets. Cem. Concr. Compos. 2012, 34, 288–294. [Google Scholar] [CrossRef]
  12. Kaish, A.B.M.A.; Jamil, M.; Raman, S.N.; Zain, M.F.M. Axial Behavior of Ferrocement Confined Cylindrical Concrete Speci-mens with Different Sizes. Constr. Build. Mater. 2015, 78, 50–59. [Google Scholar] [CrossRef]
  13. Mabrouk, R.; Awad, M.; Abdelkader, N.; Kassem, M. Strengthening of Reinforced Concrete Short Columns Using Ferrocement Under Axial Loading. J. Eng. Res. 2022, 6, 32–48. [Google Scholar] [CrossRef]
  14. Al-Kubaisy, M.A.; Jumaat, M.Z. Flexural Behaviour of Reinforced Concrete Slabs with Ferrocement Tension Zone Cover. Constr. Build. Mater. 2000, 14, 245–252. [Google Scholar] [CrossRef]
  15. Shaheen, Y.B.; Mahmoud, A.M. Structural behavior of RC channel slabs strengthened with ferrocement. Struct. Eng. Mech. 2023, 86, 793–815. [Google Scholar]
  16. Li, B.; Lam, E.S.; Wu, B.; Wang, Y. Experimental Investigation on Reinforced Concrete Interior Beam–Column Joints Rehabili-tated by Ferrocement Jackets. Eng. Struct. 2013, 56, 897–909. [Google Scholar] [CrossRef]
  17. Araby, M.Z.; Rizal, S.; Abdullah Afifuddin, M.; Hasan, M. Deformation capacity of RC beam-column joints strengthened with ferrocement. Sustainability 2022, 14, 4398. [Google Scholar] [CrossRef]
  18. Erfan, A.M.; Abd Elnaby, R.M.; Elhawary, A.; El-Sayed, T.A. Improving the compressive behavior of RC walls reinforced with ferrocement composites under centric and eccentric loading. Case Stud. Constr. Mater. 2021, 14, e00541. [Google Scholar] [CrossRef]
  19. Shannag, M.J.; Mourad, S.M. Flowable High Strength Cementitious Matrices for Ferrocement Applications. Constr. Build. Mater. 2012, 36, 933–939. [Google Scholar] [CrossRef]
  20. Do, T.D.D.; Yen, K.-J.; Yen, C.-H.; Hung, C.-C. Impact of tension stiffening on the tensile and flexural behavior of ECC ferrocement. Constr. Build. Mater. 2022, 329, 127201. [Google Scholar] [CrossRef]
  21. Shannag, M.J.; Ziyyad, T.B. Flexural response of ferrocement with fibrous cementitious matrices. Constr. Build. Mater. 2007, 21, 1198–1205. [Google Scholar] [CrossRef]
  22. Saeed, H.Z.; Saleem, M.S.; Chua, Y.S.; Vatin, N.I. Research on structural performance of hybrid ferro fiber reinforced concrete slabs. Materials 2022, 15, 6748. [Google Scholar] [CrossRef]
  23. Hameed, S.H.; Jaafer, A.A. Shear behavior of strengthened ferrocement RC beams by steel wire mesh. Civ. Eng. J. 2022, 8, 895–909. [Google Scholar] [CrossRef]
  24. Erfan, A.M.; El-Sayed, T.A. Shear strength of ferrocement composite box section concrete beams. Int. J. Sci. Eng. Res. 2019, 10, 260–279. [Google Scholar]
  25. Alzabidi, S.M.; Diaa, G.; Abadel, A.A.; Sennah, K.; Abdalla, H. Rehabilitation of reinforced concrete beams subjected to torsional load using ferrocement. Case Stud. Constr. Mater. 2023, 19, e02433. [Google Scholar] [CrossRef]
  26. Shang, S.P.; Zeng, L.O.; Peng, H. Flexural Strengthening of Reinforced Concrete Beam with Ferrocement. In Proceedings of the 28th Conference on Our World in Concrete & Structures, Singapore, 28–29 August 2003. [Google Scholar]
  27. Makki, R.F. Response of Reinforced Concrete Beams Retrofitted by Ferrocement. Int. J. Sci. Technol. Res. 2014, 3, 27–34. [Google Scholar]
  28. Zisan, B.; Biswas, B.K.; Hasan, A.; Chanda, M.; Dhar, A. Flexural Performance of Reinforced Concrete Beams Retrofitted Using Ferrocement Wire Mesh. Archit. Eng. 2023, 8, 71–81. [Google Scholar] [CrossRef]
  29. Bui, L.V.H.; Saiwimarn, S.; Sirimontree, S.; Thongchom, C.; Keawsawasvong, S.; Nguyen, P.T.; Nguyen, Y.T.H.; Lawongkerd, J.; Ngamkhanong, C.; Nguyen, T.-T. Experimental analysis on reinforced concrete beams enlarged with ferrocement retrofit system. Innov. Infrastruct. Solut. 2022, 7, 356. [Google Scholar]
  30. Sirimontree, S.; Witchayangkoon, B.; Leartpocasombut, K.; Thongchom, C. Flexural behavior of reinforced concrete beams strengthened with ferrocement. Int. Trans. J. Eng. Manag. Appl. Sci. Technol. 2019, 10, 2228–9860. [Google Scholar]
  31. El-Wafa, M.A.; Fukuzawa, K. Flexural Behavior of Lightweight Ferrocement Sandwich Composite Beams. J. Sci. Technol. 2010, 15, JST3–JST16. [Google Scholar]
  32. Miah, M.J.; Miah, M.S.; Alam, W.B.; Lo Monte, F.; Lie, Y. Strengthening of RC beams by ferrocement made with unconventional concrete. Mag. Civ. Eng. 2019, 89, 94–105. [Google Scholar]
  33. Bashandy, A.A. Experiments on Flexural Strengthening of Reinforced Concrete Beams using Valid Strengthening Techniques. Acta Tech. Napoc. Civ. Eng. Archit. 2013, 56, 1–5. [Google Scholar]
  34. Sridhar, J.; Malathy, R.; Sangeetha, R.K. Flexural Strengthening of Reinforced Concrete Beams using Ferrocement Laminates with Partial Replacement of Fine Aggregate by Steel Slag. J. Eng. Technol. 2014, 4, 123–126. [Google Scholar] [CrossRef]
  35. Balamuralikrishnan, R.; Al-Mawaali, A.S.H.; Al-Yaarubi, M.Y.Y.; Al-Mukhaini, B.B.; Kaleem, A. Seismic upgradation of RC beams strengthened with externally bonded spent catalyst based ferrocement laminates. HighTech Innov. J. 2023, 4, 189–209. [Google Scholar] [CrossRef]
  36. Reddy, M.V.; Reddy, E.M. Rehabilitation of Shear Deficient RC Beams. Int. J. Earth Sci. Eng. 2011, 04, 1125–1128. [Google Scholar]
  37. Sivagurunathan, B.; Vidivelli, B. Strengthening of Predamaged Reinforced Concrete Beams by Ferrocement Plates. Int. J. Curr. Eng. Technol. 2012, 2, 340–344. [Google Scholar]
  38. Soundararajan, M.; Balaji, S.; Sridhar, J.; Ravindran, G. Sustainable Retrofitting and Moment Evaluation of Damaged RC Beams Using Ferrocement Composites for Vulnerable Structures. Sustainability 2022, 14, 9220. [Google Scholar] [CrossRef]
  39. Amin, A.; Tamal, S.; Bari, A.K.M.F.; Mazumder, M.; Hasan, A. Strengthening of Fire Damaged Reinforced Beams by using Ferrocement. Turk. J. Eng. 2022, 6, 206–210. [Google Scholar] [CrossRef]
  40. Hosseinzadehfard, E.; Mobaraki, B. Investigating concrete durability: The impact of natural pozzolan as a partial substitute for microsilica in concrete mixtures. Constr. Build. Mater. 2024, 419, 135491. [Google Scholar] [CrossRef]
  41. Mobaraki, B.; Komarizadehasl, S.; Castilla Pascual, F.J.; Lozano-Galant, J.A. Application of Low-Cost Sensors for Accurate Ambient Temperature Monitoring. Buildings 2022, 12, 1411. [Google Scholar] [CrossRef]
  42. Naaman, A.E. Ferrocement & Laminated Cementitious Composites; Techno Press 3000: Ann Arbor, MI, USA, 2000. [Google Scholar]
  43. IFS Committee 10. Ferrocement Model Code, Building Code Recommendations for Ferrocement (IFS 10-01); Reported by IFS Committee 10; International Ferrocement Society: Pathumthani, Thailand, 2001. [Google Scholar]
  44. Available online: https://www.mc-bauchemie.sg/products/concrete-cosmetics/speciality-mortars/sx-481-e.html (accessed on 2 April 2023.).
  45. SRPS EN 12390-3:2019; Testing Hardened Concrete—Part 3: Compressive Strength of Test Specimens. Institute for Standardization: Belgrade, Serbia, 2019.
  46. SRPS EN 12350-5:2019; Testing Fresh Concrete—Part 5: Flow Table Test. Institute for Standardization: Belgrade, Serbia, 2019.
  47. SRPS EN 12390-13:2021; Testing Hardened Concrete—Part 13: Determination of Secant Modulus of Elasticity in Compression. Institute for Standardization: Belgrade, Serbia, 2021.
  48. SRPS EN 196-1:2017; Methods of Testing Cement—Part 1: Determination of Strength. Institute for Standardization: Belgrade, Serbia, 2017.
  49. SRPS EN ISO 6892-1:2020; Metallic Materials—Tensile testing—Part 1: Method of Test at Room Temperature. Institute for Standardization: Belgrade, Serbia, 2020.
  50. SRPS EN 1542:2010; Products and Systems for the Protection and Repair of Concrete Structures—Test Methods—Measurement of Bond Strength by Pull-Off. Institute for Standardization: Belgrade, Serbia, 2010.
  51. ANSYS, Inc. ANSYS User’s Manual Revision 5.5; ANSYS, Inc.: Canonsburg, PA, USA, 2006. [Google Scholar]
  52. Kachlakev, D.; Miller, T. FE Modeling of Reinforced Concrete Structures Strengthened with FRP Lamiates; Final Report SPR 316; Oregon State University: Corvallis, OR, USA, 2001. [Google Scholar]
  53. EN 1992-1-1:2004; Eurocode 2: Design of Concrete Structures—Part 1-1: General Rules and Rules for Buildings. European Committee for Standardization: Brussel, Belgium, 2004.
  54. ACI 318.R-95; Building Code Requirements for Reinforced Concrete and Commentary, ACI Committee 318. American Concrete Institute: Detroit, MI, USA, 1995.
Figure 1. The equivalent CO2/kg of used materials for a 50% increase in bending capacity.
Buildings 14 01082 g001
Figure 2. Cracked section under bending (linear elastic composite).
Buildings 14 01082 g002
Figure 3. Strain and stress distribution applied to determine nominal bending capacity of strengthened RC beam.
Buildings 14 01082 g003
Figure 4. Experimental research program.
Buildings 14 01082 g004
Figure 5. Selection of geometry for referent (non-strengthened) RC beam: (a) longitudinal section; (b) cross-section.
Buildings 14 01082 g005
Figure 6. The strengthening methodology of RC beams with ferrocement elements: (a) longitudinal section; (b) cross-section.
Buildings 14 01082 g006
Figure 7. Preparation of ferrocement elements involved following steps: (a) application of cement mortar in formwork; (b) pouring of matrix through “injection” while vibrating formwork; and (c) application of epoxy mortar on both RC beam and ferrocement strip.
Buildings 14 01082 g007
Figure 8. RC beam subjected to two concentrated forces: (a) schematic diagram; (b) configuration of one of tested experimental models.
Buildings 14 01082 g008
Figure 9. (a,b): Failure of non-strengthened experimental beam models.
Buildings 14 01082 g009aBuildings 14 01082 g009b
Figure 10. (a,b): Failure of strengthened experimental beam models.
Buildings 14 01082 g010
Figure 11. Typical load–deflection diagrams, observed at the mid-span points of all types of models.
Buildings 14 01082 g011
Figure 12. (a) Maximum deflections (mean value at middle of spans) of different model types; (b) maximum load bearing capacity (mean failure force) of all model types.
Buildings 14 01082 g012
Figure 13. Deflection from FE model: (a) non-strengthened beam model; (b) strengthened beam model.
Buildings 14 01082 g013
Figure 14. Comparison of deflection diagrams at mid-spans of non-strengthened beam (K-type) models.
Buildings 14 01082 g014
Figure 15. Comparison of deflection diagrams at mid-spans of strengthened beam (type I) models.
Buildings 14 01082 g015
Figure 16. Comparison of deflection diagrams at mid-spans of strengthened beam (type II) models.
Buildings 14 01082 g016
Figure 17. Comparison of deflection diagrams at mid-spans of strengthened beam (type III) models.
Buildings 14 01082 g017
Figure 18. Comparison of deflection diagrams at mid-spans of strengthened beam (type IV) models.
Buildings 14 01082 g018
Table 1. Comparative analysis of different strengthening techniques.
CharacteristicFRCSteel PlateFRPExternal Post-TensioningFerrocement
Compressive strength (MPa)30–300 1250–500200–1000 2n.a.30–150
Tensile (yield) strength (MPa)3–14 1250–690500–4500 2195010
Young’s Modulus (GPa)20–45190–21035–784 22005–30
Elongation (%)35–120.5–5 21 (8)1.5–2.5
Fire resistanceMediumLowLow to medium 2LowMedium
Chemical resistanceMedium to high 1LowHighLowMedium to high
CostLowMediumMedium-High 2HighMedium
1 Maximum values referring to ultra-high-strength fiber-reinforced concrete. 2 Depending on material properties of fibers and matrix.
Table 2. The thickness of ferrocement elements and the quantity of micro-reinforcement layers.
Element (Strip) TypeElement Thickness (mm)Number of Layers
I178
II1910
III2112
IV2314
Table 3. Mechanical properties of applied materials.
MaterialPropertiesValue
ConcreteCompressive strengthfc,c = 47.92 MPa
Modulus of elasticityEc = 28.05 GPa
ReinforcementYield strengthfsy = 580.30 MPa
Ultimate tensile strengthfsu = 730.93 MPa
Modulus of elasticityEs = 200.0 GPa
Epoxy mortarCompressive strengthfam,c = 45.0 MPa
Modulus of elasticityEam = 5.20 GPa
Cement-based mortarCompressive strengthfm,c = 43.0 MPa
Modulus of elasticityEm = 20.0 GPa
Micro-reinforcement (mesh)Yield strengthfry = 562.27 MPa
Ultimate tensile strengthfru = 670.43 MPa
Modulus of elasticityEr = 200.0 GPa
Table 4. Determining the characteristic points of the compressive uniaxial stress–strain curve for concrete.
PointValue
0Initial point (zero state of stress and strain)
1Based on Hooke’s law and the expression  E c = f ε ,
the result is  0.30 f c
2, 3, 4Based on the expression  f = E c ε 1 + ε ε 0 2
with strain  ε 0  calculated from the expression  ε 0 = 2 f c E c
5Data’s maximum compression stress  f c  at strain  ε 0 = 3
Table 5. Applied properties of FE of constitutive materials of beam models.
Material of Experimental
Beam Models
Finite Element TypeElement Dimensions
(mm)
ConcreteSOLID 6525 × 25 × 25
hexagonal
Conventional
steel reinforcement
LINK 180l = 25
linear
Ferrocement
(cement-based matrix +
steel micro-reinforcement)
SOLID 6525 × 25 × 17 (type I)
25 × 25 × 19 (type II)
25 × 25 × 21 (type III)
25 × 25 × 23 (type IV)
hexagonal
Adhesive epoxy mortarSOLID 18525 × 25 × 10
hexagonal
Table 6. Calculated values of flexural strength for service load (Mservice) (TAM for cracked section).
Type of RC BeamMservice 1Mservice 2
(kNm)(kNm)
I18.3721.80
II19.1522.30
III19.9422.80
IV20.7523.29
K15.4019.77
1 When σs,max = 0.6·fsy. 2 When σc,max = 0.45·fc,c.
Table 7. Ultimate value of flexural strength (Mu) with two variants of partial factor (1.5 and 1.7).
Type of RC BeamMservice 1Mu = 1.5·MserviceMu = 1.7·Mservice
(kNm)(kNm)(kNm)
I18.3727.5631.23
II19.1528.7332.56
III19.9429.9133.90
IV20.7531.1335.28
K15.4023.1026.18
1 see Table 6.
Table 8. Comparison of calculated values of nominal flexural strengths (Mn).
Type of RC BeamTransformed Area Method for
Cracked Section
(γ = 1.5)
Transformed Area Method for
Cracked Section
(γ = 1.7)
Compatibility MethodSimplified Method Based on All Tensile Reinforcement Yielding
Mn (kNm)
I30.6234.7030.4530.46
II31.9236.1731.4331.43
III33.2337.6632.4032.40
IV34.5839.1933.3833.38
K25.6729.0926.6526.63
Table 9. Comparison between analytically calculated failure force (Qn), mean failure force of experimental models, and failure force of numerical models.
Type of RC BeamTransformed Area Method for
Cracked Section
(γ = 1.5)
Transformed Area Method for
Cracked Section
(γ = 1.7)
Compatibility MethodSimplified Method Based on All Tensile Reinforcement YieldingMean Failure Force of Experimental ModelsFailure Force of Numerical Models
Figure 8aFigure 8aFigure 8aFigure 8aFigure 12bFigure 14, Figure 15, Figure 16, Figure 17 and Figure 18
Qn (kN)
I61.8670.1061.5261.5464.3664.42
II64.4973.0763.5063.5070.6769.88
III67.1376.0865.4665.4672.5174.36
IV69.8679.1767.4367.4376.8979.92
K51.8558.7753.8453.8063.4765.21
Disclaimer/Publisher’s Note: The statements, opinions and data contained in all publications are solely those of the individual author(s) and contributor(s) and not of MDPI and/or the editor(s). MDPI and/or the editor(s) disclaim responsibility for any injury to people or property resulting from any ideas, methods, instructions or products referred to in the content.

