Article

Enhancing Human Reliability Prediction in Smart Tower Crane Interfaces: A Refined Approach Using Simplified Plant Analysis Risk–Human Reliability Assessment and the Decision Making Trial and Evaluation Laboratory–Analytic Network Process

School of Business Administration, Liaoning Technical University, No.188 Longwan South Street, Xingcheng City 125105, China
*
Author to whom correspondence should be addressed.
Buildings 2024, 14(4), 1083; https://doi.org/10.3390/buildings14041083
Submission received: 3 February 2024 / Revised: 28 March 2024 / Accepted: 3 April 2024 / Published: 12 April 2024
(This article belongs to the Section Construction Management, and Computers & Digitization)

Abstract

:
With the advent of Industry 4.0, the prevalence of tower cranes equipped with hook visualization is increasing. However, the introduction of new interface management tasks has led to novel patterns of human errors for operators. The Simplified Plant Analysis Risk–Human Reliability Assessment (SPAR-H) method has emerged as a relevant approach for the prediction of human reliability in smart construction tower crane operations. However, the current SPAR-H method is only partially applicable and does not fully meet the requirements of this study. Initially, a text mining approach (TF-IDF-TruncatedSVD-ComplementNB) was employed to identify operator error-specific terms in tower crane operations. These terms were then correlated with the eight Performance Shaping Factors (PSFs) of the SPAR-H method, and corresponding failure modes and potential causes were determined from the literature. This ensured a more objective selection of influencing factors and PSFs during the stratification process, which was validated through questionnaire surveys. Furthermore, standards for SPAR-H PSF levels were established based on the characteristics of tower crane operators. Given the inherent complexity of relationships among SPAR-H PSFs, the DEMATEL-ANP method was applied. This involved analyzing logical interactions and causal relationships between first-level and second-level indicators of PSFs, obtaining weights, and integrating these with the SPAR-H method to determine human reliability. Finally, an analysis and validation were conducted using a case study of an accident involving a smart construction tower crane, confirming the subsequent reliability of operator actions. The result of the accident case study yielded a reliability measure of 4.2 × 10⁻⁵. These findings indicate that the evaluation process of this method aligns with scenarios encountered in smart construction tower crane operations.

1. Introduction

The comprehensive integration of modern information technology in smart construction sites has facilitated extensive connectivity between individuals, objects, and their interactions, embedding safety principles throughout the production process. This approach concurrently enhances productivity and advances safety management objectives, as highlighted in a previous study [1]. Presently, many tower cranes are equipped with hook visualization devices, effectively reducing the probability of incidents such as mis-hooking and collisions [2]. Compared to traditional construction sites, the widespread adoption of tower crane hook visualization in smart construction sites imposes higher situational awareness demands on operators [3]. Statistics reveal that from 2016 to 2020, China witnessed a total of 605 tower crane accidents, averaging approximately 121 incidents per year [4]. Research identifies distraction as a prevalent cause, constituting 19% of tower crane accidents [5]. Hook visualization may contribute to increased driver distraction [6]. Despite the reduction in unsafe object states with the advancement of tower crane informatization and automation, unsafe human behavior is a primary factor in accidents [7]. Construction personnel’s unsafe actions not only directly cause accidents but may also indirectly trigger incidents by altering object states [8]. The introduction of additional interface management tasks imposes cognitive and operational burdens on operators, elevating the likelihood of human errors such as mode confusion and loss of situational awareness [9]. As a result, the reliability and safety of human–machine interaction systems with hook visualization-equipped tower cranes increasingly depend on human factors [10]. Timely analysis of the causes behind accidents involving smart tower cranes is crucial for strengthening safety management in the construction industry and emphasizing the importance of human factors in ensuring reliability [11].
The academic community has conducted research on predicting human reliability in the context of traditional construction site tower cranes. Specifically, previous studies have primarily focused on exploring the factors influencing safety incidents. However, there has been limited attention given to investigating the interactions between the safety impact factors of tower cranes equipped with visually enhanced hooks and the prediction of human reliability. Some studies have adopted Rasmussen’s risk management theory, identifying 56 factors related to tower crane safety. Utilizing AcciMap technology, a universal model was constructed for tower crane safety, illustrating causal paths between system levels and influencing factors [12]. Additionally, scholars employed a framework approach to systematically analyze the causes and influencing factors of crane safety incidents in the Australian construction industry. A total of 77 contributing factors were identified, operating across multiple levels of work systems associated with crane usage [13]. Another study developed a fuzzy-set integrated risk analysis framework (ERAFF) to provide an overview of key causal factors, critical risks, and control measures within the overall framework, aiming to enhance the safety of tower crane operations [14]. Furthermore, some researchers treated the causes of tower crane accidents as a system, employing network analysis methods to divide the system into six subsystems and 34 factors. They determined seven key factors and three critical paths for tower crane accidents by calculating statistical indicators such as degree, strength, and shortest path in the network model [15]. From a behavioral safety perspective, most researchers believe that human errors are related to a multitude of Performance Shaping Factors (PSFs). Efforts related to human factors in tower crane safety have successfully established the relationship between human errors and PSFs. Researchers have identified workload as a crucial factor influencing human performance. In the tower crane industry, workload is considered a factor contributing to risky behavior and accident probability [12]. Researchers have pointed out that additional workload can reduce job performance [16]. Situation Awareness (SA) is also considered a factor influencing human performance [17]. In tower crane applications, SA is a factor that can predict and evaluate human performance [18]. Other relevant factors, such as job pressure and task complexity, may also be related to safety. Job pressure [19] has a negative impact on the safety of tower crane personnel. Task complexity has been recognized as one of the Performance Shaping Factors (PSFs) in Human Reliability Analysis (HRA) methods [20]. The human–machine environment is also considered to affect the safety of tower crane operators [21]. However, as mentioned earlier, human errors are determined by a series of mistakes when considered together [22]. The human factors exhibit interrelationships among different Performance Shaping Factors (PSFs). The term “interrelationships” broadly encompasses all possible interactions between PSFS states and the influences generated by PSFS on human performance, such as correlations, dependencies, overlaps, or combined effects, including causal relationships, indicating the direction of influence [23]. Park and Jung noted a relationship between the task complexity of emergency operating procedures and the workload of operators in Nuclear Power Plant Simulators (NPPSs) [24]. Relationships between experience and workload have been reported in various domains, including driving, aviation [25], and nuclear power stations. However, most Human Reliability Analysis (HRA) methods treat PSFs independently and do not consider these characteristics of PSFs [26]. If HRA neglects the interrelationships of PSFs, the Human Error Probability (HEP) may be either overestimated or underestimated [27]. For instance, in cases where a complex task imposes a high workload on operators, considering only the complexity and workload may lead to a redundant calculation of the impact of complexity, resulting in an overestimation of HEPS, and vice versa. However, many HRA methods handle PSFs independently and generally do not account for the integrated effects of PSFs on human performance when estimating HEP [28]. This paper aims to provide a prediction of human reliability. Therefore, to determine the Human Error Probability (HEP) using all relevant PSFs, we chose the HRA method as the primary approach in this study.
Human reliability is defined as the probability of successfully executing a task, while human error refers to human behavior exceeding the system’s tolerance range. Human reliability and human error are closely intertwined concepts, where human reliability is quantified by assessing the probability of human errors occurring during task execution [9]. Typically, the HRA process includes five stages: problem definition or analysis scope specification, task modeling, human error analysis, human error quantification, and error management recommendations [29]. Numerous studies have been utilized to quantify human reliability. The techniques in the field of Human Reliability Assessment (HRA) can be categorized into two generations. The typical first-generation HRA methods include techniques like the Technique for Human Error Rate Prediction (THERP), the Human Error Assessment and Reduction Technique (HEART), the Simplified Plant Analysis Risk–Human Reliability Assessment (SPAR-H), and the Success Likelihood Index Method (SLIM). THERP, a well-established HRA technique, employs task decomposition, nominal Human Error Probabilities (HEPs), the impact of Performance Shaping Factors (PSFs), dependencies between different HEPs, and HRA event trees to compute the final HEP [30] HEART represents a user-friendly approach [31]. A widely known HRA method, SLIM, relies on a small set of PSFs to estimate HEP data, primarily based on the influences of certain error-promoting conditions [26]). SPAR-H, akin to a simplified version of THERP, employs eight PSFs to determine the ultimate HEP value. In second-generation HRA methods, representative approaches include the Assessment Technique for Human Error Rates (ATHENA) and the Cognitive Reliability and Error Analysis Method (CREAM) [32]. Athena is time-consuming and provides limited quantitative analysis. Over the past two decades, Human Reliability Analysis (HRA) has been used as a systematic technique to mitigate the risks associated with various industries, including nuclear energy [33], oil [34], healthcare [35], and other safety-critical industries [36]. The SPAR-H method, compared to other methods, encompasses a more comprehensive set of PSFs. SPAR-H is characterized by its flexibility, clear hierarchy, and consideration of the digital environment. When using SPAR-H, minimizing overlaps and maintaining the hierarchical structure should be taken into account [37].
The eight PSFs in SPAR-H encompass three fundamental components: the individual, system, and environment. SPAR-H categorizes task types into “Diagnosis” and “Action.” “Diagnosis” tasks involve relying on knowledge and experience to understand existing conditions, prioritize activities, and determine suitable courses of action. “Action” tasks encompass planning, team communication, resource allocation during task execution, and subsequent activities [38]. SPAR-H calculates the contextual influences related to human error events using PSFs and adjusts HEP through dependency assignments. Once the PSF level is determined, the final HEP is obtained by multiplying the Basic Human Error Probability (BHEP) by the PSF [23]. This represents a prediction of human reliability. Eight factors impacting human performance were further researched: the available time for task completion, pressure, experience and training, task complexity, ergonomics, procedures, adaptability, and workflow [39]. To address the needs of multi-unit HRA processing, Park et al. identified and classified human and organizational factors for six types of multi-unit tasks [37]. In refining SPAR-H, Elidolu systematically expanded the method for predicting human reliability by using evidential reasoning, taking into account dependencies between Performance Shaping Factors [40]. S. Chen developed a method for predicting human reliability based on SPAR-H and applied Bayesian Networks (BNs) to validate the usability of the method [41]. Additionally, Yan et al. developed a reliability model using SPAR-H, establishing Performance Shaping Factors for human reliability and employing fuzzy IF-THEN rules to determine prior probability distributions of intermediate nodes, aligning with results from the Cognitive Reliability and Error Analysis Method (CREAM) [42]. The introduction of interface management tasks represents the most significant change in the way operators interact with the system. On the one hand, it makes the handling of information by operators more convenient and flexible. This shift in interaction poses the greatest challenge to traditional human reliability analysis, as noted by Porthin [9]. To a certain extent, it alters the cognitive behavioral characteristics of drivers, and the analysis of these characteristics is inseparable from the task analysis of operators. In comparison to drivers who are not accustomed to hook visualization, those who adapt to it tend to engage in more individual operations or overly rely on the information conveyed by the interface [43]. Furthermore, the development of hook visualization poses a challenge to organizational management in enterprises [44]. Therefore, studying the characteristics of operators performing interface management tasks is particularly necessary for human reliability analysis in a digital environment. However, the SPAR-H method does not address content related to interface management tasks. Considering the systemic, structural, and complex nature of behavioral safety characteristics in tower crane operators [45], this study primarily adopts DEMATEL-ANP to refine the SPAR-H method for accurate human factor reliability assessment in tower crane operators.
Due to the limited availability of empirical data on accidents involving intelligent construction site tower cranes, this study heavily relies on expert assessments of crane operational reliability. Despite the contested nature of expert evaluation methods, they continue to play a crucial role in human reliability research [46]. Intelligent tower cranes in smart construction sites differ from failure modes in nuclear power plants. Therefore, the SPAR-H method, known for its flexibility, clear hierarchical structure, and suitability for digital environments, was employed [37]. This method primarily focuses on the interaction between intelligent crane operators and the machinery. To minimize overlap and maintain a hierarchical structure, the study initially used text mining techniques to analyze 229 accident reports from both traditional and intelligent tower crane incidents between 2018 and 2023. The SPAR-H model, commonly employed in nuclear power plant safety, was then applied to categorize the human–machine elements within the crane’s cabin. These elements include available time, pressure, complexity, training/experience level, procedures, human–machine environment, job applicability, and procedures. The relationships between performance shaping factors (PSFs) in SPAR-H exhibit complexity, with previous research indicating potential causal or correlational connections between different PSFs [23]. This complexity highlights the dynamic nature of PSF interrelationships. Subsequently, a novel approach combining the Decision-Making Trial and Evaluation Laboratory (DE-MATEL) and Analytic Network Process (ANP) was employed to assess human errors in intelligent construction site tower crane operations. This approach enables the modeling of causal relationships and processing of complex connections [47]. Through expert surveys and the DE-MATEL method, a comprehensive influence matrix among the indicators was computed. The ANP method was then utilized to analyze the network structure of these indicators and determine their weighted significance. Finally, the weights obtained from the DEMATEL-ANP method were integrated with the SPAR-H method and validated through case analysis to predict the human reliability in intelligent construction site tower crane operations. The aim of this study is to address the limitations of previous research on the prediction of human reliability in tower crane operations. However, it is important to note that expert assessments play a key role in this study due to the constraints of accident data involving intelligent construction site tower cranes. Further research and practical applications will contribute to a more comprehensive and accurate prediction of human reliability in intelligent construction site tower cranes. This, in turn, will provide targeted measures and solutions to effectively mitigate human errors.

2. Research Process

This study involves six steps to evaluate the human reliability analysis of tower crane operators:
  • Text Mining (TF-IDF-TruncatedSVD-ComplementNB): Analyzing 229 Chinese tower crane reports using text mining techniques to extract information about accident causation. The aim is to precisely categorize characteristic terms associated with the causes of accidents.
  • Identification of Tower Crane Human Error Types: Classifying the terms obtained from text mining and aligning them with the Performance Shaping Factors (PSFs) in the SPAR-H model. This step involves finding corresponding failure modes and potential causes in the existing literature to refine the understanding of PSFs.
  • Determination of PSF Levels in Tower Crane Cabs: The SPAR-H method simplifies human cognitive processes into diagnostic and executive elements. Each PSF’s level is established through comparisons with prior research to define standardized levels.
  • Quantification of Human Error Probability (HEP): Due to the intricate relationships between PSFs in SPAR-H involving both causal and correlational aspects, the DEMATEL-ANP method is employed here for quantitative assessment.
  • Demonstration of Method Feasibility through Practical Cases: The viability of the methodology is showcased through practical case studies.

3. Research Methodology

3.1. SPAR-H Methodology

The SPAR-H method, developed by the U.S. Nuclear Regulatory Commission, has found extensive application in the management of human resources and risk within nuclear regulatory bodies and power plants in countries like the United States and China. This method classifies tasks into “Diagnosis” and “Action.” “Diagnosis” involves leveraging knowledge and experience to understand existing conditions, plan activities, establish priorities, and determine appropriate courses of action. “Action” includes planning, team communication, resource allocation during task execution, and subsequent operational activities [38]. The SPAR-H method employs Performance Shaping Factors (PSFs) to calculate contextual conditions related to human error events. Adjustment of Human Error Probability (HEP) is achieved through dependency allocation. Eight factors influencing human performance have been identified through further research: available time for task completion, pressure, experience and training, task complexity, ergonomics, procedures, adaptability, and workflow [23]. Once the PSF levels are assigned, the final HEP is the product of the Basic Human Error Probability (BHEP) and the PSFs [23].
H E P = N H E P × i = 1 8 P S F i
H E P i = H E P i d i a g n o s i s + H E P i a c t i o n
where NHEP represents the basic human error probability, and PSFi stands for the i-th level of the performance shaping factor, where i ranges from 1 to 8.
SPAR-H incorporates eight PSFs, which consist of three common basic components: the individual, system, and environment. When using SPAR-H, it is important to minimize overlap, maintain hierarchy and flexibility, and consider the digital environment [37].
(1)
Reducing Overlap: Excessive overlap between PSFs can hinder experts in reducing the uncertainty of specific human error events. Therefore, it is crucial to clearly define the scope of each PSF to avoid redundancy with others.
(2)
Hierarchical Structure: Describing each PSF should adhere to a hierarchical framework, such as components, factors, and indicators. Given the multitude of factors influencing the HRA process, a hierarchical framework for PSFs provides clear guidance in minimizing their impact.
(3)
Flexibility: The work environments of personnel in different industries vary, necessitating adaptability in Human Reliability Analysis methods. The states of PSFs should be flexible to address different events based on the characteristics of each PSF.
(4)
Digitization: Considering the trend toward digitization, especially in industries like crane operations, with visualized hook technology, it is essential to factor in the impact of digital environments on operators. Digitalization is becoming increasingly prevalent, making it necessary to account for its influence.

3.2. Text Mining for Tower Crane Accidents

Due to the different characteristics of accidents involving tower cranes in smart construction sites compared to nuclear power plant accidents, the SPAR-H method offers flexibility. By employing text mining techniques to understand the accident features of tower cranes in smart construction sites, we can enhance the hierarchy of indicators and reduce overlap, thereby facilitating subsequent accurate calculations. The development of smart construction sites in China started relatively late, with large-scale construction beginning around 2016. However, the practical application and promotion of smart construction sites have gradually matured in recent years. Currently, the development of smart construction sites in China is rapidly progressing and has become a new trend in construction site management. According to data released by the Ministry of Industry and Information Technology, as of the end of 2020, there were 1023 smart construction sites in China, with Shanghai, Guangdong, Tianjin, Zhejiang, and Jiangsu having the highest number of smart construction sites. Currently, most tower cranes in smart construction sites are equipped with hook visualization systems, resulting in lower accident rates and fewer accident reports. A total of 229 tower crane accident reports (including both traditional and smart tower cranes) from 2018 to 2023 were collected from the website of the State Administration of Work Safety and the Crane Engineer website. These reports were used as the data source to ensure the authority, accuracy, and timeliness of the data. However, tower crane accident reports often lack standardization and consistency, leading to redundant information. Given the semantic complexity and sparsity of long texts in text mining, text preprocessing was initially performed to address these characteristics. Irrelevant information, such as details about the accident unit, improvement suggestions, and the accident investigation process, was removed to focus specifically on unsafe behaviors and their causes. Only the accident process, accident causes, and accident liability attribution were retained and integrated for subsequent text mining.
After cleaning and denoising text data, the first step in text mining typically involves representing the text using appropriate models. Common text representation models describe documents as feature vectors, which include frequent words or phrases as well as the syntactic structure of sentences [48]. Most simple text vector representations treat text as a bag of words (BOW) or a combination of BOW and character n-grams. Considering the length and semantic complexity of text, the choice of feature vector extraction often involves the term frequency–inverse document frequency (TF-IDF) model [49]. BOW models tend to overly emphasize frequency in text mining, potentially overlooking less frequent but more meaningful vocabulary [50]. Logistic regression is a binary classification algorithm that uses a logistic function as a hypothesis. The model then optimizes the algorithm to minimize the associated cost function J, determining the separation curve between two classes [51]. Truncated-SVD is a matrix decomposition technique used for tasks such as dimensionality reduction, feature extraction, and data compression. It helps in understanding the underlying structure in data, identifying patterns and correlations, thereby achieving data dimensionality reduction or extracting important features [52]. LLM is commonly used to estimate parameters of probability distributions to maximize the likelihood of observed data. It is widely used in statistical modeling and machine learning to fit model parameters [53]. Unlike SVD, LLM focuses more on describing the probability process that generates observed data rather than data dimensionality reduction. In the context of feature extraction, SVD helps identify the most important features in data, reducing them to a lower-dimensional space while preserving the main structure and helping to eliminate noise and redundancy. Additionally, Truncated-SVD may perform well in handling sparse data, capturing main patterns, and demonstrating tolerance to missing values [54]. TF-IDF is better suited for handling structurally complex long texts compared to BOW and similar lexical processing methods and can capture less frequent vocabulary. Truncated-SVD is commonly used for dimensionality reduction and feature extraction. It helps remove noise and redundant information from data, extracting the most important features, thereby reducing data dimensionality and improving model performance. It has wide application in natural language processing (NLP), image processing, and recommendation systems, among other fields. Furthermore, in validating the TF-IDF-Truncated SVD model using the COMPLETMENT-NB algorithm, a result of 1 indicates good adaptability of this model to long texts.
First, the tower crane accident text corpus was preprocessed using python3.0 by removing non-Chinese characters, tokenizing, and eliminating stop words. This step involved constructing a tower crane safety feature dictionary. Next, the inverse document frequency (IDF) value of each word was calculated to build a custom IDF dictionary, enhancing the accuracy of keyword extraction. The TF-IDF algorithm was then applied to extract keywords from all the tower crane safety texts collected [55]. Using the constructed tower crane safety domain feature dictionary, feature matching was performed on the extracted keywords, obtaining the feature attributes of each tower crane safety accident text. Since the text contains nearly 600,000 words and yields a large number of feature words through TF-IDF, TruncatedSVD was selected to reduce dimensionality, resulting in 127 representative feature words [52]. Finally, the ComplementNB class was used to train the Naive Bayes classifier with the obtained features and target variables. The model parameters of the classifier were fitted, and predictions were made, producing an accuracy output of 1. This preliminary result indicates that the model possesses accuracy and generalization capabilities on the training set [56]. Due to the abundance of feature words, 97 representative features were selected through sorting after manually excluding irrelevant items such as “construction” and “safety management.” Expert opinions from the construction industry were sought, suggestions were considered and discussed, and the relevant literature was reviewed [57]. The 97 feature values were chosen based on their representativeness and weight, and the encoding results are summarized in the Table 1.

3.3. Types of Human Error in Tower Crane Operations

In order to minimize overlap among Performance Shaping Factors (PSFs) and enhance their hierarchical structure, an alignment was established between feature words extracted through text mining and the PSFs in SPAR-H. However, the complete avoidance of fuzzy and overlapping issues in term classification is currently a formidable challenge [23]. This challenge arises because, despite the apparent quantification of accidents, SPAR-H fundamentally quantifies the rationality of human behavior. Consequently, previous attempts by researchers to deconflict Performance Shaping Factors (PSFs) have yielded diverse outcomes. The underlying reasons for this variability can be attributed to two factors: (1) the multifaceted and diverse content encapsulated within each Performance Shaping Factor (PSF), and (2) cognitive biases among some experts and scholars in their understanding of Performance Shaping Factors (PSFs) [58]. Therefore, achieving a suitable classification is complex, and the perspectives of experts are particularly crucial in this endeavor [57]. This alignment involves appropriate categorization while identifying corresponding failure modes and potential causes from the literature. PSFs refer to background factors in the work environment that influence human performance behaviors. These factors can either positively reduce error probability or negatively increase it [59]. During the development of the fundamental SPAR-H model, an assessment was made of task availability, task complexity, and pressure (during task handling). These three factors focus on the impact of task attributes themselves on the likelihood of human errors occurring. In various application domains, there were no significant differences observed in the standardization of PSF levels. As the scope of SPAR-H application expanded, the remaining five PSFs (experience/training, procedures, human factors engineering and human–machine interface, applicability, and work process) were generally evaluated as nominal values. This evaluation was due to their event-specific, factory-specific, or personnel-specific nature [39].

3.4. Standard for Determining the Level of PSFs in the Cab of Tower Cranes

The SPAR-H method operates on the principle of treating the human–machine–environment system as an integrated system. Initially designed for calculating human-induced accidents in nuclear power plants, the SPAR-H method, when applied to smart construction site tower cranes, maintains its applicability [26]. The conceptual framework of each PSF (Performance Shaping Factor) remains consistent across different applications, with the understanding that the extension of each PSF’s concept may vary to suit the system under consideration. For instance, in the context of tower crane incidents on smart construction sites, the extension of the human–machine–environment concept encompasses the technical and physical environment within which the crane operator operates. The SPAR-H method simplifies the cognitive processes of humans into diagnostic and executive components. In the context of tower crane incidents in intelligent building construction sites, digital systems have the potential to provide enhanced support to operators. The behaviors of operators in these digitized environments exhibit characteristics akin to cognitive behaviors [43], emphasizing the critical role of diagnostic actions.
(1)
Diagnostic Component: This involves personnel understanding the current conditions and operational status of the system based on their knowledge and experience. They then formulate appropriate plans accordingly.
(2)
Executive Component: Personnel operate the equipment based on specified procedures, plans, and operational instructions.
According to Gertman, the concept of task complexity involves “how difficult it is to perform a task in a given environment. Complexity takes into account both the task itself and the environment in which the task is executed” [26]. Studying human complexity should consider various aspects of integrated systems. Liu described the objective complexity and subjective complexity of human integrated systems in his research, considering factors like task goal clarity, task information quantity and complexity, required cognitive processes, task time constraints and pressures, prerequisite knowledge and experience, task environment, and conditions for task execution. Factors such as interference, noise, time pressure, and multitasking in task execution increase complexity [60]. Task complexity is intricate and intertwined with other nominal values. Here, based on previous research, text mining results, and the actual situation of smart construction site tower crane operations, task complexity is divided into situational complexity and operational complexity [22]. The complexity of the work environment for tower crane operators implies that they are dealing with intricate work situations. For instance, they may encounter the simultaneous operation of multiple machines, requiring them to manage various tasks concurrently, such as material handling, lifting, and placement. Therefore, in SPAR-H, there are four criteria for assessing the complexity of the situation: (1) the need to monitor three or more changing targets; (2) the requirement to calculate/estimate/convert observed parameters; (3) the necessity to recall relevant experiences/knowledge for judgment; and (4) the need to differentiate between different alarm signals. On the other hand, operational complexity focuses more on whether the operational skills are intricate, for example, whether a specific operation is routine and if the crane operator can cleverly apply their own experienced skills to solve challenges. In SPAR-H, the assessment criteria for operational complexity include four aspects: (1) can be accomplished with common sense; (2) operational actions are simple/require observation of 1–2 objects; (3) operational actions are complex/require simultaneous observation of multiple objects; and (4) tasks exceed the cognitive and skill level of the operator. There exists a certain degree of correlation and causation between situational complexity and operational complexity. In practical applications, it is not feasible to completely separate these factors. Therefore, when applying the SPAR-H method, expert discussions based on actual situations and incident details are necessary.
Task processing time refers to the time available to operators or personnel to diagnose and take action during abnormal events [28]. This Performance Shaping Factor (PSF) shows independence from other PSFs, considering the ratio of available time to required time in the cabin. Personnel operation time availability varies with specific operational steps, requiring judgment based on engineering practice experience in real applications. For instance, consider a crane operator tasked with moving an item. The estimated time for the crane operator to complete the task is one hour, yet the actual time it takes the operator to accomplish the job is only forty minutes. In this case, the ratio of available time to required time is 3/2.
The pressure used in SPAR-H refers to the level at which adverse conditions hinder operators from easily completing tasks. Pressure may include mental stress, excessive workload, or physical stress (e.g., from difficult environmental factors). It encompasses narrowed attention and muscle tension, including anxiety. Environmental factors, known as pressure sources, such as heat, noise, poor ventilation, or radiation, can induce stress and affect operator mental or physical performance [28]. This PSF intersects with task complexity, responsibility, adaptability, and human–environment factors [26]. Determining how performance is influenced by complexity, pressure/stress, or human–environment at specific stress and complexity levels is challenging due to their subjective nature. Pressure is categorized into daily pressure and non-daily pressure [61]. To facilitate diagnosis and implementation differentiation, pressure is further classified into context severity-based pressure and decision severity-based pressure [62]. Context severity-based pressure aligns with daily pressure and is intricately linked with the intensity of work demands [63], emphasizing the prominent role of workload intensity as a primary risk factor in everyday workplace stress. On the other hand, decision severity-based pressure corresponds to non-daily pressure, primarily manifesting in the decision-making pressure faced by drivers in emergency scenarios [64].
Experience/training refers to the experience of drivers involved in the task and the safety training received [26]. Time is a crucial metric for assessing experience/training [65]. Additionally, it should be correlated and evaluated in conjunction with the safety skill proficiency of crane operators. Often, the driver’s own perception and the opinions of colleagues hold significant relevance in this regard [66]. Factors influencing experience/training levels include whether the driver has years of operational experience and has received sufficient safety training. Based on previous research, text mining results, and the actual situation of smart construction site tower crane operations, experience/training is divided into safety education/emergency drills and plans and working hours per month [67].
Operating procedures refer to the formal operating procedures present and used during the operation process. The purpose of these procedures is to guide human actions during task execution, increasing the likelihood of safely achieving task goals [26]. The assessment of operational procedures primarily revolves around their alignment with real-world situations. Therefore, field research methods are predominantly employed to validate the integrity of operational procedures, encompassing key steps such as document review, expert evaluation, and on-site verification [68]. Therefore, the judgment of operating procedures mainly considers their alignment with real situations. Based on previous research, text mining results, and the actual situation of smart construction site tower crane operations, operating procedures are divided into completeness of operational regulations and completeness of tower crane operation procedures [69].
In the SPAR-H method, initially defined human factors/human–machine interface refers to the devices, displays and controls, layout, and quality and quantity provided by instruments, as well as the interaction between operators and equipment [26]. In the tower crane cab, the human–machine environment is constituted by the driver, equipment, workbench, and internal environment, forming a specific human–machine environment. Hence, a comprehensive consideration of the human–machine environment can be derived from both the physical and technical aspects. Initially, an assessment of the physical and technical environment is conducted by five experts in the field of human factors engineering [70]. Subsequently, relying on the assessment outcomes, inquiries are made regarding the driver’s comfort and level of concentration during work [71]. Therefore, the human–machine environment level can be comprehensively considered from the physical environment and technical environment. Based on previous research, text mining results, and the actual situation of smart construction site tower crane operations, the human–machine environment is divided into physical environment and technical environment [72].
Occupational suitability refers to whether a person’s physiological and psychological state is suitable when performing tasks. It lacks specific quantitative analysis standards in all analyses [26]. Therefore, a comprehensive consideration can be made from the aspects of individual capability and individual state, with normality generally determined for occupational suitability. Firstly, an assessment is conducted regarding the driver’s professional proficiency, examining whether operational skills are reasonably mastered and if there is a sufficient level of safety awareness [73]. Secondly, the driver’s professional evaluation is sought from colleagues and supervisors [74]. Additionally, reviewing relevant work logs and safety records is crucial to determining whether the driver consistently prioritizes safety [75].
Process definition refers to various aspects of work, including inter-organizational, safety culture, work planning communication, management, support, and policies [26]. In the cab, the process involves safety culture and team organization. Combining the above analysis, specific PSF level determination criteria for tower crane operations are shown in the Table 2 [37].

3.5. Verification of Human Error Classification in Tower Crane Operation

The reliability performance shaping factors (PSFs) of the human–machine interface in the operation of intelligent construction tower cranes, as presented in Table 3, were validated through a questionnaire survey. The survey targeted male participants with experience operating visualized tower cranes on intelligent construction sites, primarily in Shanghai, Shenzhen, and Hubei. Participants aged 26–55 constituted 72.86%, those with 3–10 years of work experience represented 63.57%, and 81.43% reported working daily. Participants with a bachelor’s degree were the minority, at 8.57%. The survey, distributed before the formal questionnaire, encompassed 55 identified items divided into 15 s-level PSFs across eight dimensions. Through data analysis of the survey responses, this investigation provides robust support for the construction of the PSF system.
The questionnaire included basic information and an inquiry into PSFs affecting human reliability, rated on a Likert scale from 1 (“minimal impact”) to 5 (“significant impact”). A pilot survey was conducted before the formal distribution to ensure its effectiveness. A total of 140 questionnaires were collected, with 137 deemed valid. Rigorous testing was performed to ensure data validity.
Assessment of the reliability and validity of the survey:
Using SPSS 26.0 software, overall reliability was determined to be 0.992. Dimension-specific reliability coefficients were as follows: Task Time (0.854), Experience and Training (0.907), Human–Machine Environment (0.968), Task Complexity (0.940), Procedures (0.832), Processes (0.946), Occupational Adaptability (0.939), and Pressure (0.951). This indicates good consistency across dimensions.
Content validity, concurrent validity, and construct validity were examined. The Kaiser–Meyer–Olkin (KMO) test yielded a value of 0.976, and Bartlett’s sphericity test’s approximate chi-square value was 8739.554. Commonalities for all study items were above 0.4, indicating effective information extraction. The KMO value of 0.976, exceeding 0.6, suggests efficient information extraction from the data.
AVE (Average Variance Extracted) and CR (Composite Reliability) are utilized for assessing convergent validity. AVE is a metric that gauges the internal consistency of constructs, representing the average amount of variance explained by the observed variables for a construct. CR, on the other hand, measures the reliability of constructs, indicating the total amount of variance explained by the observed variables for a construct. Typically, when AVE exceeds 0.5 and CR surpasses 0.7, it suggests a high level of convergent validity, as presented in Table 4.
In terms of discriminant validity, Pearson correlation coefficients and the square roots of AVE are commonly used to assess the correlation and distinctiveness between constructs. If the correlation between two constructs is low while their respective AVE values are high, this indicates that they are, to some extent, distinct. Typically, when the correlation coefficient is below 0.7, it can be considered that there is a relatively low correlation between constructs, as presented in Table 5.
The variances of the eight factors—task complexity, task time, pressure, experience and training, operating procedures, human–machine environment, occupational adaptability, and processes—are, respectively, 73.564%, 87.469%, 71.765%, 73.861%, 78.240%, 74.879%, 73.861%, 70.056%, and 70.487%. The cumulative explained variances after rotation are also consistent, indicating effective information extraction. Principal component analysis filtered out items with scores below 0.5; all items in this study exceeded this threshold, demonstrating the validity of subdividing the eight primary PSFs into 15 secondary PSFs. This study lays a solid foundation for the development of PSF systems and provides insights into understanding the human reliability factors in smart building tower crane interfaces.

4. Quantification of Human Error Probability (HEP)

4.1. Determining Interrelationships of Factors Based on DEMATEL

A framework for assessing human errors in smart construction site tower crane operations, based on the SPAR-H method, is established. This framework involves analyzing the causal relationships and logical connections among indicators using the DEMATEL-ANP methodology, thereby determining their respective weights. Subsequently, these weights are integrated with the multipliers assigned by the SPAR-H method. This comprehensive approach not only enhances our understanding of the human factors leading to errors but also provides valuable insights for improving safety measures at construction sites. The DEMATEL-ANP (Decision Making Trial and Evaluation Laboratory–Analytic Network Process) method is a modeling approach used to address complex real-world problems [78]. It employs graph theory and matrix tools to analyze the relationships among various factors within a system. This method has been applied in the decision experimentation and evaluation laboratory for tracing and analyzing the erroneous behaviors of intelligent tower cranes. The reason for choosing the DEMATEL-ANP method to analyze the complex relationships between the SPAR-H framework and Performance Shaping Factors (PSFs) lies in its ability to effectively reveal the interactions, causal relationships, and importance among factors [79]. This method can handle intricate relationships, identify dominant factors, allocate weights, and provide a structured analytical framework, aiding in the systematic management and improvement of human error aspects. Ultimately, it offers valuable support for decision-making processes.
The DEMATEL method simplifies the structure of complex systems, analyzing the logical interactions and causal relationships among the elements in the system. This allows for determining the functional relationships and importance of these factors within the system [80]. In comparison to Multiple Criteria Decision Making (MCDM) [81], DEMATEL-ANP places greater emphasis on the causal and associative relationships between indicators, while MCDM focuses more on the ranking and evaluation of different choices [82].
In the DEMATEL method, the six steps involved are described as follows.
Step 1: Calculate the average direct relationship matrix. Initially, experts conduct pairwise comparisons based on the direct impact between criteria. We use impact levels of 0 (no impact), 1 (low impact), 2 (moderate impact), 3 (high impact), and 4 (very high impact) for comparison. If K experts are involved, the results formed by each expert correspond to an n × n matrix, representing the direct impact of criterion i on criterion j. The main diagonal of the matrix is set to zero because in DEMATEL, the self-impact of criteria is not considered.
X = [ 0 x 12 x 1 n x 21 0 x 2 n x n 1 x n 2 0 ]
Incorporate all options from each expert to obtain Z = [aij], and calculate the average score for each respondent using Equation (3).
a i j = 1 k k = 1 k x i j k
Step 2: Normalize the average matrix. The normalized representation of matrix M reflects the relative strength of direct relationships. This can be obtained from Equations (4) and (5).
S = m a i x = j = 1 n a i j
N = Z S
Step 3: Compute the total relationship matrix. The above matrices display all relationships between factors, including both direct and indirect relationships. The total relationship matrix, T, can be calculated using Equation (6), where i is the identity matrix.
T = lim k ( N + N 2 + + N K ) = N ( 1 N ) 1
Step 4: Calculate the levels of impact and effect. Vectors c and r represent the sums of columns and rows of matrix T, respectively, as shown in Equations (7) and (8). In essence, both c and r indicate the ratios of direct and indirect interactions and influences among elements in the system.
c j = i = 1 n t i j
r i = j = 1 n t i j
Step 5: Compute impact and relationship vectors. The value of rc defines the power-effect vector, which is a vertical vector. Positive values of rc indicate causality, while negative values signify a consequential relationship. In contrast, the value of r + c indicates that the relationship vector is a horizontal vector, indicating the importance of each criterion with respect to others. Higher levels of r + c represent greater mutual relationships between any given factors.

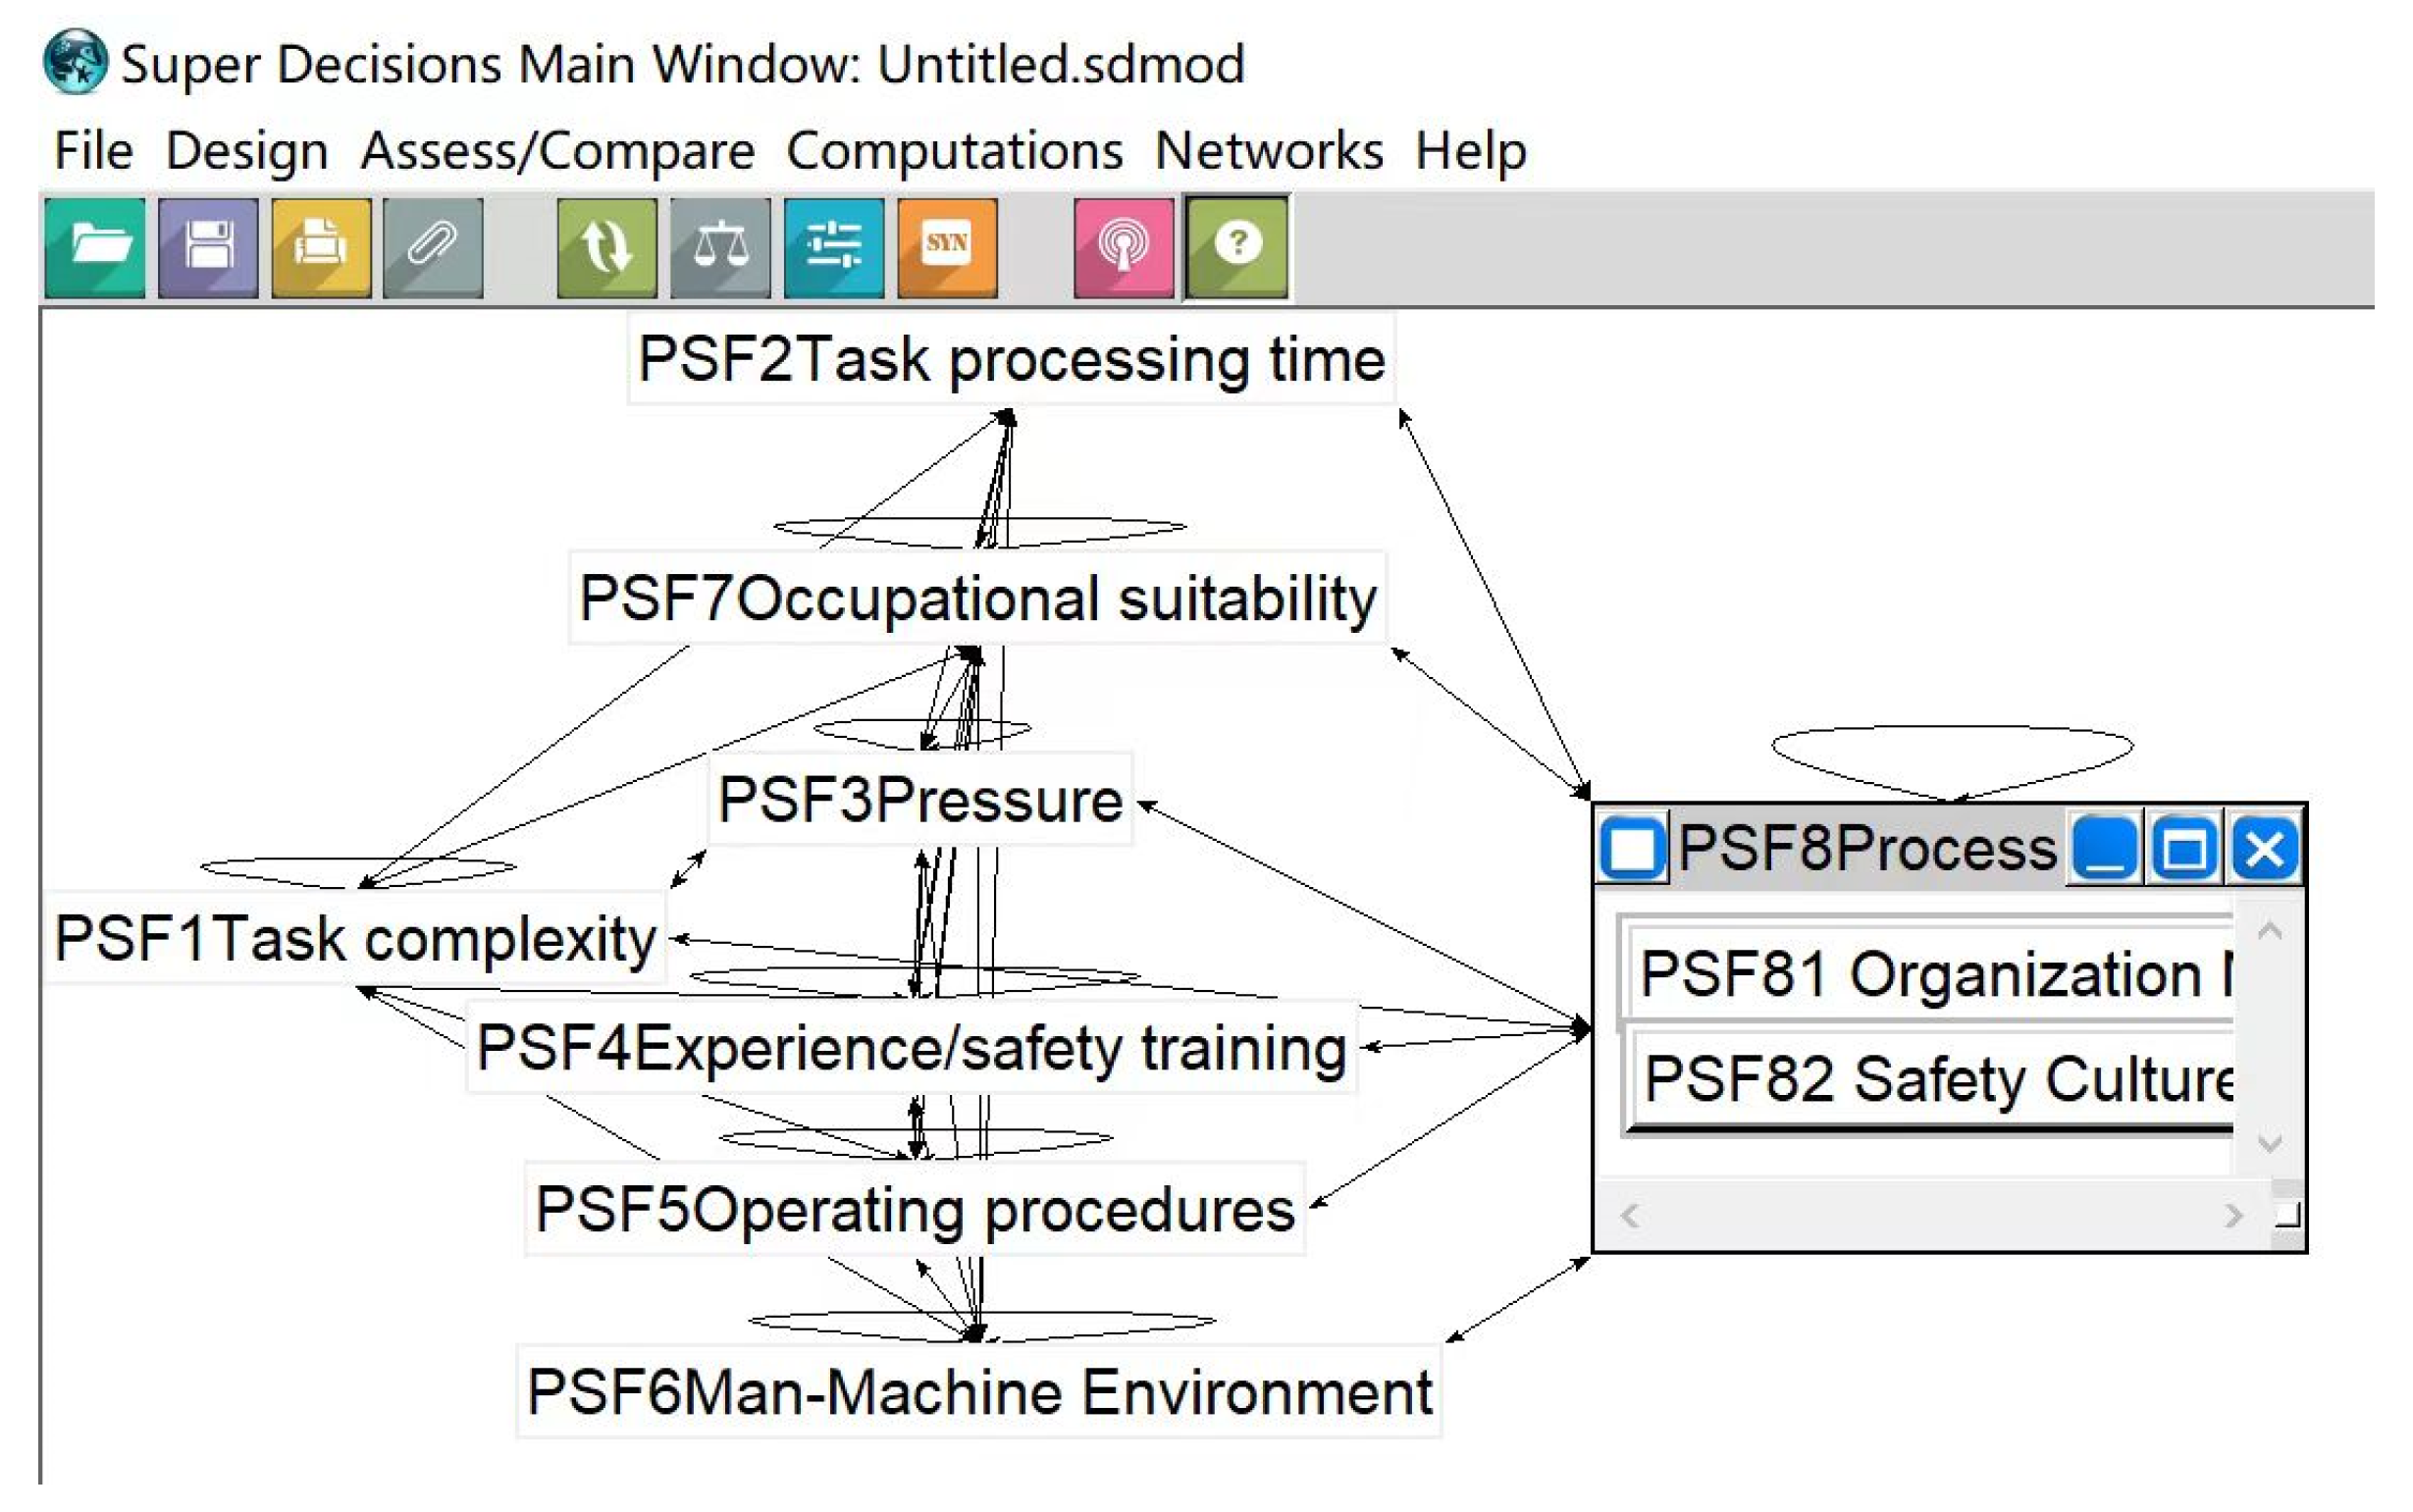
4.2. ANP Analysis Procedure

ANP, or the Analytic Network Process, is a Multi-Criteria Decision Making (MCDM) technique designed to overcome the limitations of hierarchical structures [16]. ANP extends the Analytic Hierarchy Process (AHP) developed by Saaty in 2009, serving as a valuable tool for addressing complex decision problems. Unlike AHP, which establishes one-way hierarchical relationships between criteria at decision levels, ANP employs a network system among elements at each decision level. Therefore, ANP is an enhanced version of AHP, addressing dependency issues among criteria in a system divided into different decision clusters, each containing several criteria [83]. In ANP, network connections between clusters and criteria represent dependencies, categorized as either internal or external dependencies. Dependencies among elements within a cluster are internal, while dependencies between criteria in the same cluster and criteria in different clusters are external [70]. The ANP model allows for complex relationships between criteria but does not construct a hierarchical structure for decision problems involving dependencies and interactions between higher- and lower-level elements [70]. Next, we describe the steps associated with the ANP method. The technique consists of four steps.
  • Step 1: Pairwise Comparisons.
This involves comparing elements pairwise, accomplished through surveys that assess interactions between elements. The questionnaire employs a nine-point scale ranging from equal importance to extremely important. Experts determine the relative importance of each series of comparisons.
  • Step 2: Forming the Supermatrix.
In this step, the results from the previous step are used to construct an unweighted supermatrix. This matrix includes priorities derived from various pairwise comparisons. The supermatrix can be described in a general form, as shown in Equation (9), where cm represents the mth cluster, emn indicates the nth element in cluster m, and wij is the principal eigenvector of the elements’ influence on clusters i and j [47].
W = c 1 c 2 c m c 1 e 11 e 1 n i e 21 e 2 n 2 e m 1 e 2 m n n c 2 c m e 11 e 12 e 1 n i e 21 e 22 e 2 n 2 e m 1 e m 2 e m m [ w 11 w 12 w 1 m w 21 w 22 w 2 m w m 1 w m 2 w m m ]
  • Step 3: Obtaining the Weighted Supermatrix.
Initially, the matrix should be normalized by the sum of each column, since clusters in the network are usually interdependent, and elements in a column are separated by the number of clusters. Normalization ensures equal weights for clusters. Subsequently, the unweighted supermatrix is multiplied by the corresponding cluster priorities to obtain the weighted supermatrix.
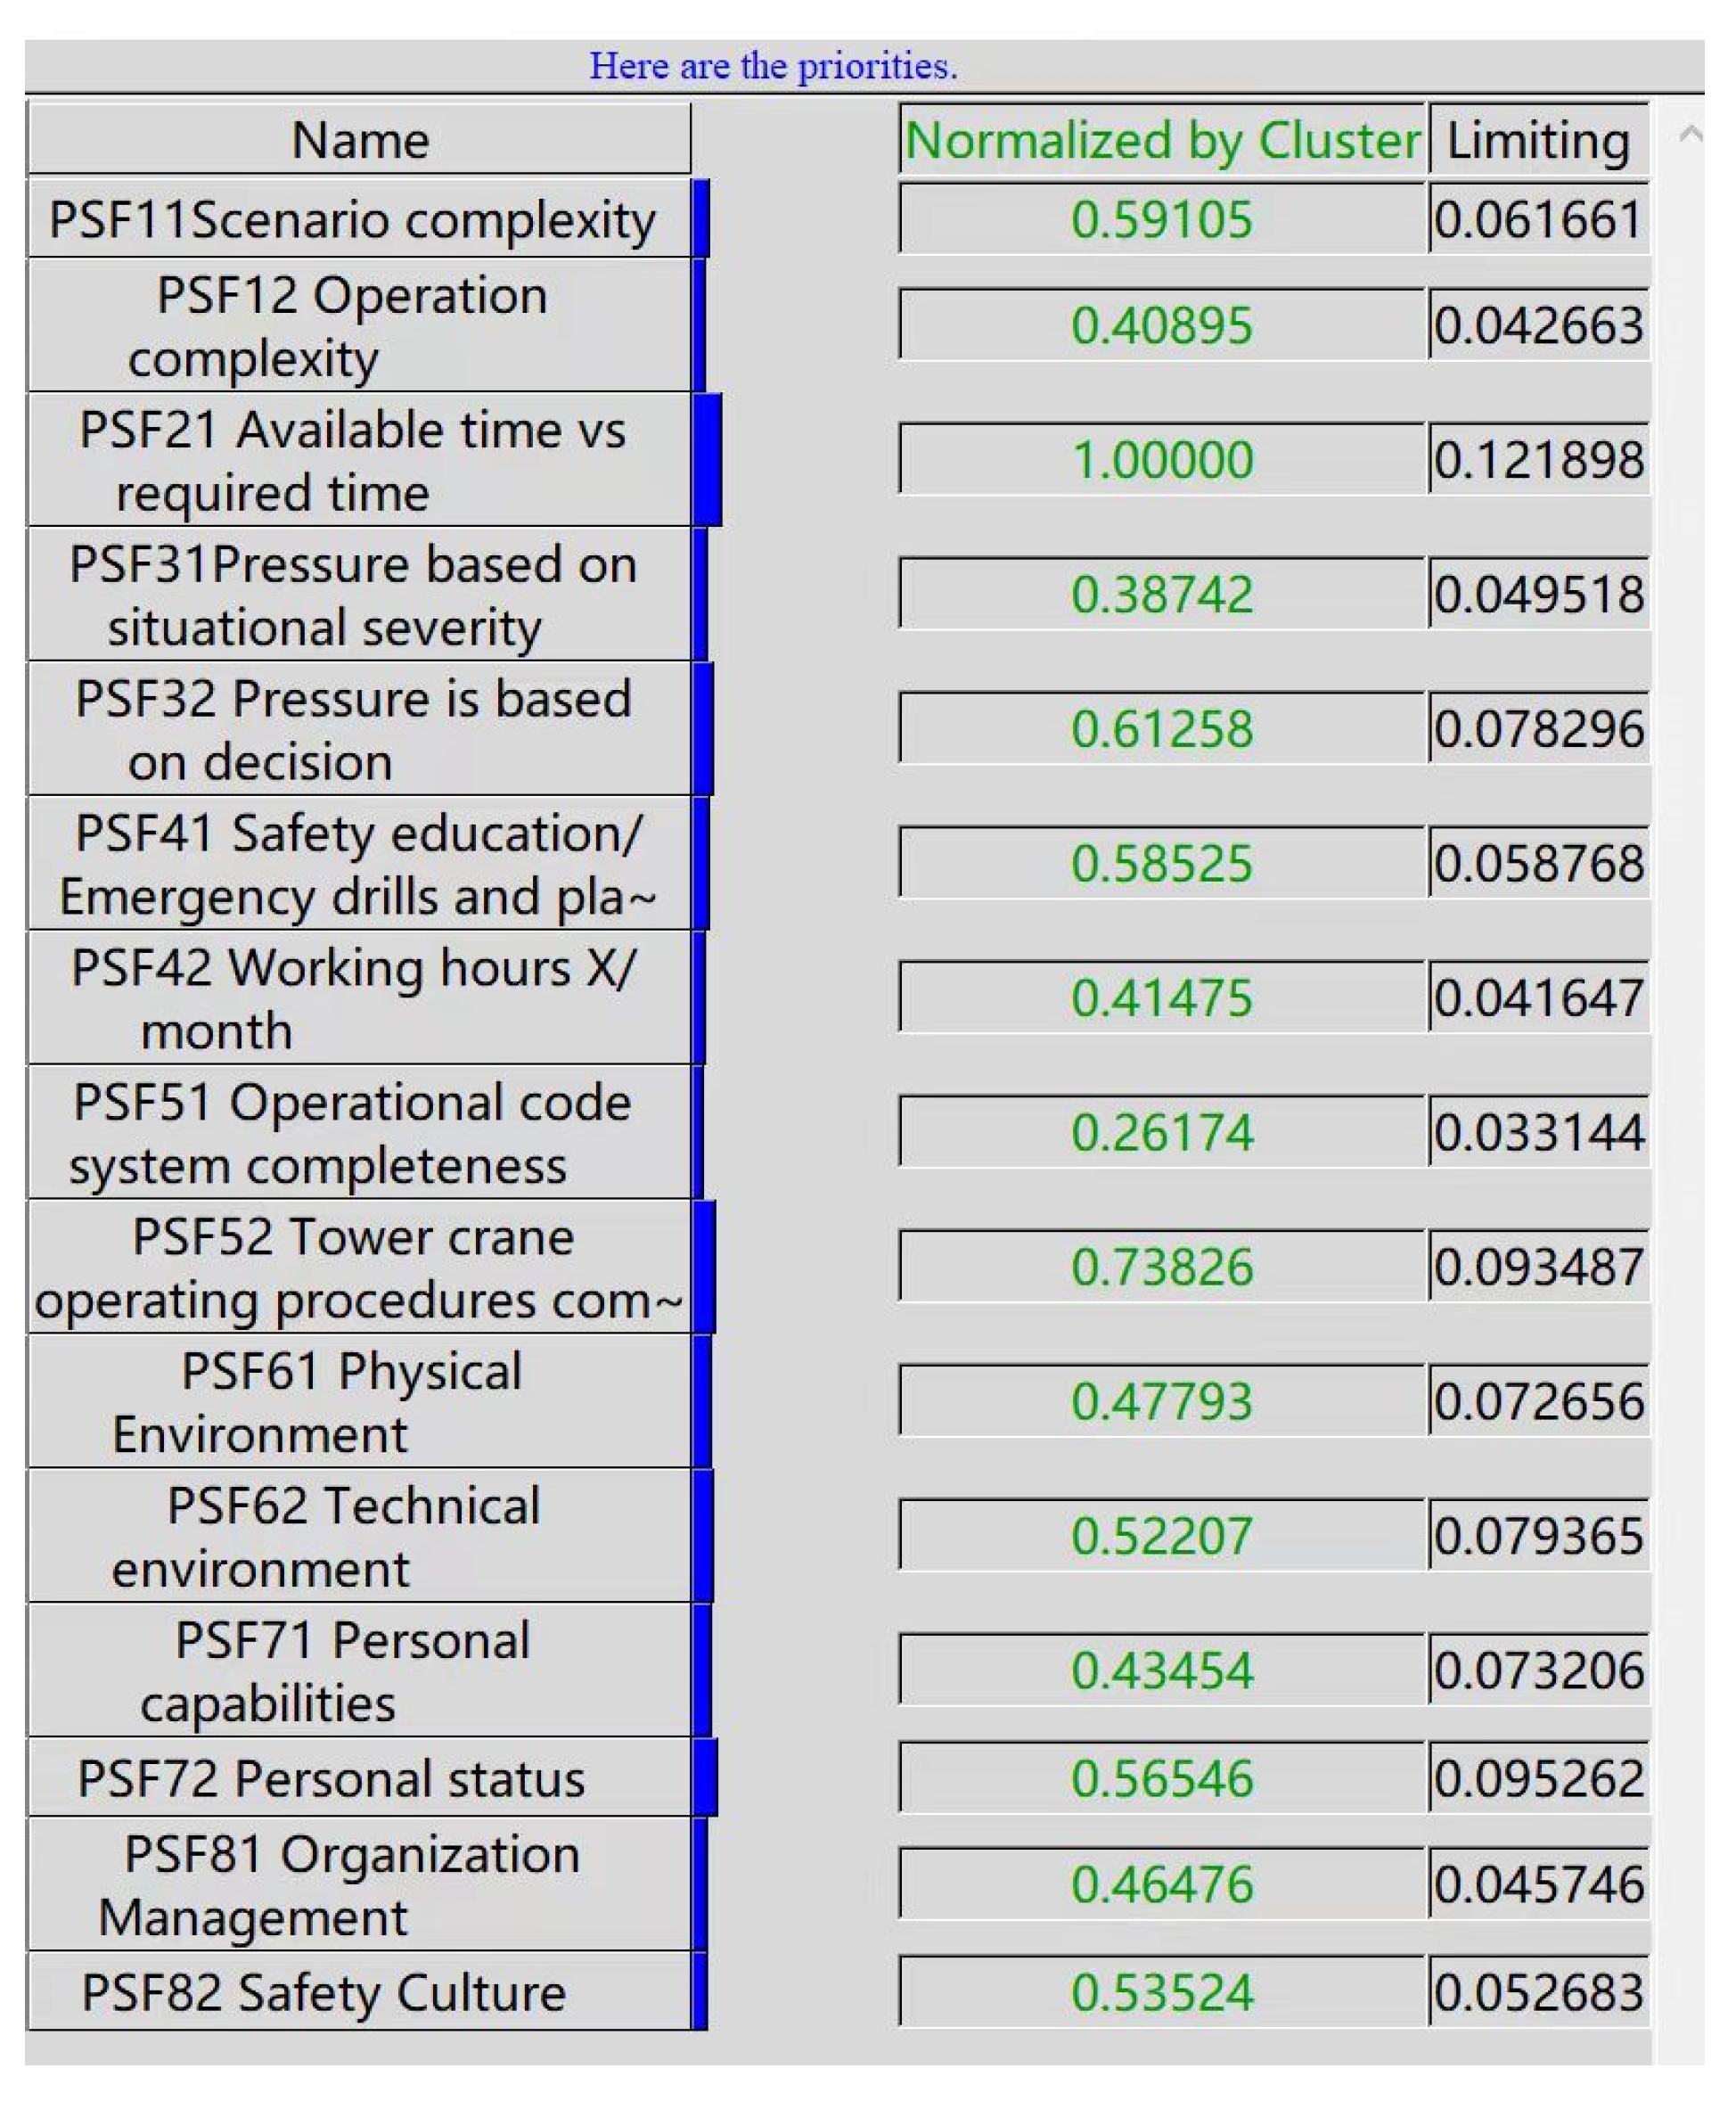
  • Step 4: Limiting the Supermatrix.
In this final step, the weighted supermatrix is raised to a sufficient power k using Equation (10) until it stabilizes enough to obtain overall priorities or the contributed weights of the ANP.
limk→∞wk

4.3. DEMATEL-ANP Analysis Process

4.3.1. Intelligent Tower Crane Operator Misbehavior Traceability Analysis and Evaluation System

Based on the previous content, we initially employ text mining techniques to extract 229 accident causation feature words. Combining this with the SPAR-H model and complemented by literature review methods, the evaluation system for tracing and analyzing human errors in intelligent tower crane operations is categorized into 8 primary criteria layers and 15 secondary indicator layers.

4.3.2. Data Collection

According to Pourahmad et al. [84], the number of questionnaires for the DEMATEL technique should range between five and fifteen respondents. The profile of respondents is illustrated in Table 6. As seen in the table, the majority of respondents hold key positions and have over ten years of experience in the construction industry. The questionnaire was administered to collect expert opinions, including those of four safety supervisors, two equipment maintenance technicians, three tower crane operators, and one quality control personnel.

4.3.3. DEMATEL Analysis

In the first step, fifteen experts were tasked with indicating the degree of direct influence between the defined criteria, using a range from zero to four. To analyze the interrelationships among the eight dimensions By using python3.0, the DEMATEL method is used to analyze the source of human error in the operation of intelligent tower crane and calculate the causal influence of each dimension in the system. Initially, a direct relation matrix was developed based on pairwise comparisons of individual expert opinions, considering the direction and impact of factors. Equation (1) was then utilized to create an average direct relation matrix, combining all ratings from the experts. Subsequently, Equations (2)–(4) were applied to compute the total relation matrix, representing the overall influence among factors, based on the normalized direct influence matrix. The resulting comprehensive relation matrix is presented in Table 7, derived from expert surveys using DEMATEL in the analysis of the tracing system for human errors in smart tower crane operations.
As seen in Table 8, factors such as F11 Scenario Complexity, F21 Available Time vs. Required Time, F41 Safety Education/Emergency Drills and Plans, F62 Technical Environment, F71 Personal Skills, and F82 Safety Culture exhibit positive values. Consequently, these factors influence other dimensions, with F12 Operation Complexity being the most influenced by all other factors. To calculate the impact vector and relation vector, Equations (5) and (6) were employed. For the 15 dimensions, the impact vector and relation vector are presented in Table 9, denoted by (rc) and (r + c), respectively. F51 Completeness of Operational Standards and F81 Organizational Management interact significantly with other factors, as they have the highest levels of r + c. In contrast, the interaction of F12 Operation Complexity with other factors is minimal.

4.3.4. ANP Analysis

In this section, following the determination of mutual dependencies among criteria using DEMATEL, the ANP technique is applied to obtain the final weights of fifteen factors influencing human errors. Utilizing Saaty’s nine-point scale for pairwise comparisons, a survey was distributed to fifteen construction experts in a first-tier city in China. The questionnaire survey was conducted based on the relationship network structure between the ANP model and criteria. Participants were asked questions such as, “How much do you consider ‘Physical Environment’ to be more important than ‘Technical Environment’?”.
The first step of the analysis involves constructing the ANP model based on the relationship structure developed using DEMATEL, as illustrated in Figure 1. This process generates the ANP network structure diagram (Figure 1) used to assess human errors in intelligent tower crane operator behavior on smart construction sites. In the diagram, the arrows pointing to the element sets represent the interdependencies among elements within each set. Bidirectional arrows between element sets indicate mutual influencing factors between the two sets, while circular arrows represent mutual dependencies within element sets. To build the decision model and solve the supermatrix, Super Decisions 3.2 software was employed. This professional software facilitates the construction of decision models, assisting in establishing pairwise comparison matrices, calculating the results defining the supermatrix, and determining the finite supermatrix and weights for each factor. Throughout the calculation process, consistency testing was conducted using the software. Consistency Ratio (C.R.) serves as a measure of consistency, confirming that the original ratings by experts are upheld. It is recommended that the consistency ratio be less than or equal to 0.10.
Based on the network structure diagram, it is evident that there are interconnections and mutual influences among the evaluation factors for human error in tower crane operators on smart construction sites. Therefore, based on the relationships between the 8 primary indicators and the 15 secondary indicators, 10 experts (4 managers and 6 technical personnel) were invited to conduct pairwise comparisons of importance using a nine-point scale. The experts’ evaluation scores were entered into the Super Decisions 3.2 software, and a consistency test was performed. If the consistency requirements were not met, further input from the experts was sought.
The process involved sequentially selecting criteria from the secondary indicators to create judgment matrices for assessing the primary and secondary indicator items. Once all the judgment matrices were constructed, the software automatically calculated and generated the unweighted supermatrix, weighted supermatrix, and limit supermatrix. Additionally, it computed the priorities of each indicator, i.e., the weights of the secondary indicators, as depicted in Figure 2.
The DEMATEL method can calculate the interrelations between elements, but it assumes equal weights for all elements, which does not align with the actual situation. Therefore, the ANP method is employed to compensate for this limitation. Based on the following formula, the mixed weights of each secondary indicator can be calculated:
h = w × T + w
where “h” denotes the vector of mixed weights for the indicators, while “w” denotes the vector composed of absolute weights of each element calculated using the ANP method. After normalizing the calculated mixed weights, we can obtain the weights of each secondary indicator in the evaluation system, as illustrated in Table 10.

5. Case Calculation

5.1. Accident Background

An accident involving a tower crane occurred at a smart construction site in Guangxi. It was reported that the tower cranes at this site were equipped with visual hooks. On the morning of 19 December 2022, at 8:00 a.m., the team leader of the carpentry group, along with eight employees, went to the construction site of the Yuan’an Tang project.
At around 8:30 a.m., due to maintenance work being carried out on 18th December, the tower crane operator climbed up the tower crane to inspect the maintenance situation. After about ten minutes, the construction supervisor and safety officer from a subcontracting company responsible for the project contacted the tower crane operator via intercom, instructing them to utilize the tower crane to unload steel pipes from a trailer to the open ground near the base of the tower crane, with a smaller portion being unloaded at the location where the support scaffolding was being erected.
At around 9:40 a.m., the safety officer asked the carpentry team leader to assign personnel to assist in unloading the steel pipes from the trailer. The team leader then assigned a scaffolding worker to help. The scaffolding worker used the tower crane’s hoisting rope to secure the steel pipes (each weighing approximately 30 kg, measuring about 5.2 m in length, with a diameter of around 50 mm). They were bundled and fastened with steel wire ropes and U-shaped clamps. A substitute signalman directed the tower crane operator to lift and transport the steel pipes. At the time, there were over ten workers involved in erecting the support scaffolding within the range of the tower crane’s swing arm.
At around 11:00 a.m., after multiple lifts, the tower crane lifted the steel pipes again to a height of approximately 20 m. As the swing arm moved horizontally by about 10 m, the U-shaped clamps securing the bundled steel pipes became loose (in this particular lift, the steel pipes were not directly secured at both ends with the hoisting rope but were suspended by passing the hoisting rope through the bundled steel wire ropes). The detached steel pipes fell and struck employee A, who was working beneath the crane’s jib, causing them to sustain injuries and lose consciousness. Simultaneously, scattered steel bars also hit employee B’s foot. The on-site personnel immediately dialed emergency numbers 120 (Emergency Medical Services) and 110 (police) and reported the incident to the project manager. Within a short time, medical personnel from the EMS and police officers arrived at the scene and initiated rescue measures. After more than 20 min of treatment, the on-site medical staff pronounced employee A deceased and transferred the mildly injured employee B to People’s Hospital for medical treatment.

5.2. Analysis and Calculation

Reliability analysis for post-incident personnel focuses on diagnosis and execution. In the smart construction site accident involving a tower crane, the digitalized system provides more support to the driver, whose behavior is primarily cognitive [43]. Therefore, the diagnostic behavior is crucial.
(1)
Diagnosis: Personnel rely on their knowledge and experience to understand the current system conditions and operating status, and based on that, develop an appropriate plan.
(2)
Action: Personnel operate the equipment according to the corresponding procedures, instructions, and operational guidelines.
In evaluating the smart construction site’s tower crane accident, we combine the weights determined by DEMATEL-ANP and the Performance Shaping Factors (PSFs) of SPAR-H to calculate the probability of the incident occurring.
  • Task Complexity: At the time of the accident, the driver had to handle the tower crane, requiring relevant experience/knowledge to make reasonable judgments. Multiple targets needed to be lifted, and they might not have the same weight or shape. There are two target paths, from point A to point B and from point A to point C. Additionally, the internal environment needed to be observed for issues. Therefore, the complexity of the diagnostic scenario during the accident is high (PSF11 Diagnosis = 5, PSF11 Action = 5). The operational part follows corresponding procedures, with discrete control actions such as pulling control levers. The diagnostic operational behavior is relatively clear, but in emergency situations, comprehensive scenario consideration is required. Thus, the diagnostic operational complexity is moderate (PSF12 Diagnosis = 5, PSF12Action = 2).
  • Task Processing Time: Given the accident background, it is evident that the tower crane operator does not have sufficient time to react in the event of an emergency. Therefore, the diagnosis of PSF21 task processing time is inadequate, with PSF21 Diagnosis = 10. The accident occurs as a sudden event, and during crisis management, the operator’s task processing time for executing PSF21 is insufficient, with PSF21 Action = 10.
  • Pressure: The direct cause of the accident was the loosening of the U-shaped buckle of the wire rope binding the steel pipes, constituting a sudden event. In tower crane lifting operations, operators face significant pressure during sudden events, and this incident posed a threat to life safety. There is stress based on the severity of the situation and decision-making pressure. Therefore, PSFs31 Action = 5, PSFs31 Diagnosis = 5, PSFs32 Action = 5, and PSFs32 Diagnosis = 5.
  • Experience/Safety Training: The company provides minimal safety training, graded safety training, and specialized safety training for tower crane operators. Hence, safety education/emergency drills and plans (PSF41 Diagnosis/Action = 10) are lacking. Tower crane operators have over 6 months of experience or training, are familiar with basic operational knowledge, and have experience in handling emergencies. Therefore, diagnostic/action PSF42 Diagnosis/Action = 1.
  • Operating Procedures System: The tower crane involved in the accident has a comprehensive sign-oriented procedure, equipped with appropriate monitoring and detection systems for visualizing the hook. It monitors parameters such as the crane’s operational status, load conditions, tilt, and vibration, to promptly detect anomalies. This supports the operator in correctly diagnosing events and effectively reduces negative outcomes due to human error. Therefore, in the diagnostic/execution completeness of the operating procedure system, PSF51 Diagnosis/Action = 0.5. Regarding this accident, the construction company has well-established operating procedures for reference and compliance. In the diagnostic availability of tower crane operation sub-procedures, PSFs52 Diagnosis = 0.5, and the execution availability and quality level are moderate (PSFs52 Action = 1).
  • Human–Machine Environment: The environment where the tower crane accident occurred was relatively cold, the construction site had obstacles, and the management of construction site noise was not strict. Therefore, the physical environment for diagnosis/action (PSF61 Diagnosis/Action) = 10. The digital interface was not properly designed and somewhat chaotic, resulting in a technical environment for diagnosis/execution (PSF62 diagnosis/Action) = 1.
  • Occupational Suitability: The tower crane driver had a moderate level of teamwork, knowledge, skills, and job capabilities (PSF71 Diagnosis/Action = 5). It was understood that work at the construction site often continued until late at night, and the driver had a moderate individual state during the accident (PSF72 Diagnosis/Action = 5).
  • Process: The company’s organizational management had one or two areas that were not satisfactory, such as poor communication between the substitute drivers and the usual drivers as well as low reliability and level of automation. Therefore, the diagnostic/execution PSF81 Diagnosis/Action = 1. The company’s safety culture was somewhat lacking. Periodic safety production months were not regularly held to encourage employee safety commitments. There were fewer organizational safety culture promotion and education activities (PSF82 Diagnosis/Action = 5).
The quantification process for human error probability involves multiplying the nominal error probability by the composite behavior formation factor, Here, NHEP represents the nominal error probability. The nominal error probability for diagnosis is 0.01, and for execution, it is 0.001.
To visually demonstrate the impact of each PSF on the final outcome, the results for each PSF are calculated according to Formula (1) and presented in Table 11. For instance, the calculation method for PSF11, “PSF11 Scenario Complexity,” involves multiplying the weight by the adjustment factor, resulting in 0.355.
In this incident, key factors during the diagnostic phase include safety education/emergency drills and plans, task processing time, and physical environment, all of which play important roles in cognitive psychology. The diagnostic phase involves individuals receiving, processing, and assessing environmental and task information to make decisions. Safety education/emergency drills and plans are the most probable, indicating that individuals have deeply processed and evaluated existing safety knowledge and training experiences, considering them as the primary considerations for decision making. The importance of task processing time highlights individuals’ cognition of time urgency and task efficiency, reflecting the critical roles of time perception and task planning in cognitive psychology. During the execution phase, the importance of safety education/emergency drills and plans is again emphasized, alongside task processing time and the physical environment. The execution phase involves translating decisions into practical actions while considering previously acquired knowledge and experience. Therefore, these factors are incorporated into the behavioral execution process, reflecting the complexity of behavioral execution and decision implementation processes in cognitive psychology [61]. Insufficient task processing time can lead to time pressure, which may negatively impact individuals’ decision-making processes. In the diagnostic phase, it may result in increased cognitive load, reducing diagnostic capabilities and increasing the risk of erroneous decisions. In the execution phase, time pressure may cause anxiety and stress, affecting individuals’ behavioral execution efficiency and accuracy, and even leading to physiological stress responses, further impacting cognitive and behavioral performance. Unfavorable physical environments may also affect individuals’ cognition and behavior. In the diagnostic phase, a noisy work environment may interfere with individuals’ attention and thinking, while high temperatures or crowded conditions may increase discomfort and affect behavioral execution efficiency. Therefore, measures such as advanced training and emergency drills to enhance individuals’ coping abilities, optimize task allocation and time management, and improve the comfort and safety of the work environment can help reduce time pressure and mitigate the negative effects of the physical environment on individuals. This, in turn, improves individuals’ decision-making and behavioral execution efficiency during emergencies, reducing the occurrence of accidents [61]. Upon observing SPAR-H results, it is evident that intelligent construction site tower cranes demand high levels of job skills, safety skills, psychological qualities, and stress resilience from drivers, along with a requirement for advanced organizational management capabilities within companies. This aligns well with the characteristics of enterprise transformation during the 5G era.
HEP i = NHEP × i = 1 8 PSF composite
HEP = HEP diagnosis + HEP action
H E P i = N H E P × P S F composite   N H E P × ( P S F composite   1 ) + 1
HEP dia = 0.01 × 0.07 PSF 21 dia ( 0.071 PSF 11 dia + 0.025 PSF 12 dia ) × × ( 0.082 PSF 81 dia + 0.072 PSF 82 dia ) 0.01 [ 0.07 PSF 21 dia ( 0.071 PSF 11 dia + 0.025 PSF 12 dia ) × × ( 0.082 PSF 81 dia + 0.072 PSF 82 dia ) 1 ] + 1
HEPdia = 3.9 × 10⁻⁵
HEP act = 0.001 × 0.07 PSF 21 act ( 0.071 PSF 11 act + 0.025 PSF 12 act ) × × ( 0.082 PSF 81 act + 0.072 PSF 82 act ) 0.001 [ 0.07 PSF 21 act ( 0.071 PSF 21 act + 0.025 PSF 22 act ) × × ( 0.082 PSF 81 act + 0.072 PSF 82 act ) 1 ] + 1
HEPact = 3.1 × 10⁻⁶
HEP = HEPdia + HEPact = 4.2 × 10⁻⁵

6. Discussion

In the analysis of human errors by crane operators on smart construction sites, the researchers successfully identified patterns of human errors through the text mining of 229 accident reports. This method provides a more objective selection of influencing factors compared to the traditional SPAR-H method. The identified factors were compared with the Performance Shaping Factors (PSFs) of the SPAR-H model to determine relevant failure modes and potential causes.
Additionally, based on on-site investigations and literature reviews, the researchers considered the characteristics of crane operators and established standards for the levels of PSFs in the SPAR-H model. This approach provides a more detailed and context-specific selection of human error indicators for crane operators.
However, the original SPAR-H method lacked emphasis on causal and logical relationships between PSFs and did not provide detailed explanations for the content of each PSF. This could lead to overestimation or underestimation issues when calculating the Human Error Probability (HEP).
To address this limitation, the researchers applied the DEMATEL-ANP method, building upon text mining and a literature review, to divide the 8 PSFs into 15 secondary indicators and obtain their weights. This approach successfully revealed the relationships between the indicators and established a comprehensive framework for assessing human errors by crane operators in smart construction sites. This refined SPAR-H method better aligns with the specific research context and improves the accuracy of calculating human error probabilities.
It is worth noting that the safety of intelligent construction site tower cranes, equipped with visualized hooks, relies heavily on the personal behavior of crane operators. There exists a significant interdependence and impact among various indicators. Therefore, researchers applied the DEMATEL-ANP method, identifying the “human–machine environment” and “work adaptability” as advanced Performance Shaping Factors (PSFs). During the SPAR-H calculation, it was found that safety education/emergency drills and the probability of contingency plans and task processing time significantly influence the drivers. In-depth study of these key indicators can effectively enhance the safety level of tower crane operations.
In summary, this study successfully identified fault patterns and human errors of intelligent construction site tower crane operators through text mining and the application of the DEMATEL-ANP method. Improvements were made to the SPAR-H model, optimizing the selection of PSFs and the calculation of human error probabilities. This research holds significant importance for ensuring the safety of crane operators and improving the overall safety level of intelligent construction sites.

7. Conclusions

In conclusion, this study has made contributions to the analysis of human errors by crane operators on smart construction sites. By utilizing text mining and the DEMATEL-ANP method, the study successfully identified failure modes and potential causes, refined the SPAR-H model, and improved the selection of Performance Shaping Factors (PSFs) and the calculation of human error probabilities. This research is crucial for enhancing the safety of crane operators and improving overall safety standards in smart construction sites.
However, there are some limitations to consider. Firstly, the analysis was based on a sample of 229 accident reports, which may not fully represent the entire population of accidents. Future research could aim to collect a larger and more diverse dataset to further strengthen the findings. Additionally, while the identified PSFs provide valuable insights, there may be other factors not considered in this study that contribute to human errors by crane operators. Exploring these additional factors can enrich our understanding of the phenomena.
Furthermore, the application of the DEMATEL-ANP method in this study provided a structured approach to analyze and prioritize the relationships between PSFs. However, it is important to note that this method relies on expert judgments, which may introduce subjectivity. Exploring alternative methods or incorporating data-driven approaches can enhance the objectivity of the analysis.
For future research, it would be beneficial to conduct longitudinal studies to assess the effectiveness of implementing the refined SPAR-H model and the identified human error indicators in real-world crane operator training and safety management initiatives. Additionally, investigating the impact of technological advancements, such as automation and artificial intelligence, on human errors in crane operations would be valuable in designing interventions and strategies to improve safety.
Overall, this study provides valuable insights into understanding and addressing human errors by crane operators on smart construction sites. It lays the foundation for further research and offers recommendations for improving safety practices in the industry.

Author Contributions

W.S.: Data curation, Formal analysis, Writing—original draft, Writing—review & editing L.N.: Conceptualization. All authors have read and agreed to the published version of the manuscript.

Funding

This study was supported by the national Natural Science foundation of China: No. 52174184.

Data Availability Statement

Data are available from the authors upon reasonable request.

Conflicts of Interest

The authors declare no conflict of interest.

References

  1. Chen, B.; Wan, J.; Shu, L.; Li, P.; Mukherjee, M.; Yin, B. Smart Factory of Industry 4.0: Key Technologies, Application Case, and Challenges. IEEE Access 2018, 6, 6505–6519. [Google Scholar] [CrossRef]
  2. Wang, J.; Guo, F.; Song, Y.; Liu, Y.; Hu, X.; Yuan, C. Safety Risk Assessment of Prefabricated Buildings Hoisting Construction: Based on IHFACS-ISAM-BN. Buildings 2022, 12, 811. [Google Scholar] [CrossRef]
  3. Fang, Y.; Cho, Y.K.; Durso, F.; Seo, J. Assessment of operator’s situation awareness for smart operation of mobile cranes. Autom. Constr. 2018, 85, 65–75. [Google Scholar] [CrossRef]
  4. Chen, L.; Shimei, S.; Yinjie, Z.; Mingrui, D. Statistical Analysis of Accidents Involving Tower Cranes in Construction from 2016 to 2020. Ind. Saf. Environ. Prot. 2022, 48, 53–55+63. [Google Scholar]
  5. Raviv, G.; Fishbain, B.; Shapira, A. Analyzing risk factors in crane-related near-miss and accident reports. Saf. Sci. 2017, 91, 192–205. [Google Scholar] [CrossRef]
  6. Fang, Y.; Cho, Y.K.; Chen, J. A framework for real-time pro-active safety assistance for mobile crane lifting operations. Autom. Constr. 2016, 72, 367–379. [Google Scholar] [CrossRef]
  7. Jiang, W.; Ding, L.; Zhou, C. Cyber physical system for safety management in smart construction site. Eng. Constr. Archit. Manag. 2020, 28, 788–808. [Google Scholar] [CrossRef]
  8. Stone, R.W. Industrial Accident Prevention, H. W. Heinrich; Service Review; The University of Chicago Press Books: Chicago, IL, USA, 1931; Volume 5, pp. 323–324. [Google Scholar] [CrossRef]
  9. Porthin, M.; Liinasuo, M.; Kling, T. Effects of digitalization of nuclear power plant control rooms on human reliability analysis—A review. Reliab. Eng. Syst. Saf. 2020, 194, 106415. [Google Scholar] [CrossRef]
  10. Jeon, M. Chapter 1—Emotions and Affect in Human Factors and Human–Computer Interaction: Taxonomy, Theories, Approaches, and Methods. In Emotions and Affect in Human Factors and Human-Computer Interaction; Jeon, M., Ed.; Academic Press: San Diego, CA, USA, 2017; pp. 3–26. ISBN 978-0-12-801851-4. [Google Scholar]
  11. Chandrasegaran, D.; Ghazilla, R.A.R.; Rich, K. Human factors engineering integration in the offshore O&G industry: A review of current state of practice. Saf. Sci. 2020, 125, 104627. [Google Scholar] [CrossRef]
  12. Zhou, W.; Zhao, T.; Liu, W.; Tang, J. Tower crane safety on construction sites: A complex sociotechnical system perspective. Saf. Sci. 2018, 109, 95–108. [Google Scholar] [CrossRef]
  13. Lingard, H.; Cooke, T.; Zelic, G.; Harley, J. A qualitative analysis of crane safety incident causation in the Australian construction industry. Saf. Sci. 2021, 133, 105028. [Google Scholar] [CrossRef]
  14. Sadeghi, H.; Zhang, X.; Mohandes, S.R. Developing an ensemble risk analysis framework for improving the safety of tower crane operations under coupled Fuzzy-based environment. Saf. Sci. 2023, 158, 105957. [Google Scholar] [CrossRef]
  15. Zhang, X.; Zhang, W.; Jiang, L.; Zhao, T. Identification of Critical Causes of Tower-Crane Accidents through System Thinking and Case Analysis. J. Constr. Eng. Manag. 2020, 146, 04020071. [Google Scholar] [CrossRef]
  16. Shin, I.J. Factors that affect safety of tower crane installation/dismantling in construction industry. Saf. Sci. 2015, 72, 379–390. [Google Scholar] [CrossRef]
  17. Kaber, D.B.; Endsley, M.R. The effects of level of automation and adaptive automation on human performance, situation awareness and workload in a dynamic control task. Theor. Issues Ergon. Sci. 2004, 5, 113–153. [Google Scholar] [CrossRef]
  18. Cheng, T.; Teizer, J. Modeling Tower Crane Operator Visibility to Minimize the Risk of Limited Situational Awareness. J. Comput. Civ. Eng. 2014, 28, 04014004. [Google Scholar] [CrossRef]
  19. Jiang, T. Safety risk analysis and control of tower crane. IOP Conf. Ser. Earth Environ. Sci. 2020, 546, 042070. [Google Scholar] [CrossRef]
  20. Zhang, W.; Xue, N.; Zhang, J.; Zhang, X. Identification of Critical Causal Factors and Paths of Tower-Crane Accidents in China through System Thinking and Complex Networks. J. Constr. Eng. Manag. 2021, 147, 04021174. [Google Scholar] [CrossRef]
  21. Ramalan, M.A.H.; Fikri, M. A Study on Human Factor That Lead to Tower Crane Accident at Construction Site in Malaysia. Recent Trends Civ. Eng. Built Environ. 2021, 2, 852–861. [Google Scholar]
  22. Rasmussen, M.; Standal, M.I.; Laumann, K. Task complexity as a performance shaping factor: A review and recommendations in Standardized Plant Analysis Risk-Human Reliability Analysis (SPAR-H) adaption. Saf. Sci. 2015, 76, 228–238. [Google Scholar] [CrossRef]
  23. Liu, J.; Zou, Y.; Wang, W.; Zhang, L.; Qing, T.; Zheng, T.; Ding, Q. A study on assigning performance shaping factors of the SPAR-H method for adequacy human reliability analysis of nuclear power plants. Int. J. Ind. Ergon. 2021, 81, 103051. [Google Scholar] [CrossRef]
  24. Park, J.; Jung, W. A Study on the Validity of a Task Complexity Measure for Emergency Operating Procedures of Nuclear Power Plants—Comparing with a Subjective Workload. IEEE Trans. Nucl. Sci. 2006, 53, 2962–2970. [Google Scholar] [CrossRef]
  25. Hoogeboom, P.; Joosse, M.; Hodgetts, H.; Straussberger, S.; Schaefer, D. Does the “silent cockpit” reduce pilot workload? In Proceedings of the 23rd Digital Avionics Systems Conference (IEEE Cat. No.04CH37576), Salt Lake City, UT, USA, 28 October 2004; Volume 1, pp. 5.D.5/1–5.D.5/9. [Google Scholar]
  26. Gertman, D.; Blackman, H.; Marble, J.; Smith, C.; Boring, R. The SPAR-H human reliability analysis method. In Proceedings of the Fourth American Nuclear Society International Topical Meeting on Nuclear Plant Instrumentation, Controls and Human-Machine Interface Technologies (NPIC&HMIT 2004), Columbus, OH, USA, 19–22 September 2004. [Google Scholar]
  27. Moriyama, T.; Ohtani, H. Risk assessment tools incorporating human error probabilities in the Japanese small-sized establishment. Saf. Sci. 2009, 47, 1379–1397. [Google Scholar] [CrossRef]
  28. Barati, R.; Setayeshi, S. Human reliability analysis of the Tehran research reactor using the SPAR-H method. Nucl. Technol. Radiat. Prot. 2012, 27, 319–332. [Google Scholar] [CrossRef]
  29. Sujan, M.A.; Embrey, D.; Huang, H. On the application of Human Reliability Analysis in healthcare: Opportunities and challenges. Reliab. Eng. Syst. Saf. 2020, 194, 106189. [Google Scholar] [CrossRef]
  30. Ade, N.; Peres, S.C. A review of human reliability assessment methods for proposed application in quantitative risk analysis of offshore industries. Int. J. Ind. Ergon. 2022, 87, 103238. [Google Scholar] [CrossRef]
  31. Maniram Kumar, A.; Rajakarunakaran, S.; Arumuga Prabhu, V. Application of Fuzzy HEART and expert elicitation for quantifying human error probabilities in LPG refuelling station. J. Loss Prev. Process Ind. 2017, 48, 186–198. [Google Scholar] [CrossRef]
  32. Hollnagel, E. Cognitive Reliability and Error Analysis Method: CREAM, 1st ed.; Elsevier: Oxford, UK; New York, NY, USA, 1998; ISBN 978-0-08-042848-2. [Google Scholar]
  33. Kančev, D. A plant-specific HRA sensitivity analysis considering dynamic operator actions and accident management actions. Nucl. Eng. Technol. 2020, 52, 1983–1989. [Google Scholar] [CrossRef]
  34. Abílio Ramos, M.; López Droguett, E.; Mosleh, A.; Das Chagas Moura, M. A human reliability analysis methodology for oil refineries and petrochemical plants operation: Phoenix-PRO qualitative framework. Reliab. Eng. Syst. Saf. 2020, 193, 106672. [Google Scholar] [CrossRef]
  35. Pandya, D.; Podofillini, L.; Emert, F.; Lomax, A.J.; Dang, V.N.; Sansavini, G. Quantification of a human reliability analysis method for radiotherapy applications based on expert judgment aggregation. Reliab. Eng. Syst. Saf. 2020, 194, 106489. [Google Scholar] [CrossRef]
  36. Ung, S.-T. Evaluation of human error contribution to oil tanker collision using fault tree analysis and modified fuzzy Bayesian Network based CREAM. Ocean. Eng. 2019, 179, 159–172. [Google Scholar] [CrossRef]
  37. Park, J.; Arigi, A.M.; Kim, J. Treatment of human and organizational factors for multi-unit HRA: Application of SPAR-H method. Ann. Nucl. Energy 2019, 132, 656–678. [Google Scholar] [CrossRef]
  38. Xiao, T.; Yongping, Q.; Yucheng, Z.; Wenjing, L.; Juntao, H. Study of Application Optimization of SPAR-H Human Reliability Analysis Method. In Proceedings of the 23rd Pacific Basin Nuclear Conference, Volume 2, Beijing & Chengdu, China, 1–4 November 2022; Springer Proceedings in Physics. Liu, C., Ed.; Springer Nature Singapore: Singapore, 2023; Volume 284, pp. 91–102, ISBN 978-981-19877-9-3. [Google Scholar]
  39. Laumann, K.; Rasmussen, M. Suggested improvements to the definitions of Standardized Plant Analysis of Risk-Human Reliability Analysis (SPAR-H) performance shaping factors, their levels and multipliers and the nominal tasks. Reliab. Eng. Syst. Saf. 2016, 145, 287–300. [Google Scholar] [CrossRef]
  40. Elidolu, G.; Il Ahn, S.; Ilke Sezer, S.; Emek Kurt, R.; Akyuz, E.; Gardoni, P. Applying evidential reasoning extended SPAR-H modelling to analyse human reliability on crude oil tanker cargo operation. Saf. Sci. 2023, 164, 106169. [Google Scholar] [CrossRef]
  41. Chen, S.; Zhang, L.; Qing, T.; Liu, X. Use of Bayesian networks and improved SPAR-H for quantitative analysis of human reliability during severe accidents mitigation process in nuclear power plant. J. Nucl. Sci. Technol. 2021, 58, 1099–1112. [Google Scholar] [CrossRef]
  42. Yan, S.; Yao, K.; Li, F.; Wei, Y.; Tran, C.C. Application of a Bayesian network to quantify human reliability in nuclear power plants based on the SPAR-H method. Int. J. Occup. Saf. Ergon. 2022, 28, 2588–2598. [Google Scholar] [CrossRef]
  43. Yang, Y.; Karakaya, B.; Dominioni, G.C.; Kawabe, K.; Bengler, K. An HMI Concept to Improve Driver’s Visual Behavior and Situation Awareness in Automated Vehicle. In Proceedings of the 2018 21st International Conference on Intelligent Transportation Systems (ITSC), Maui, HI, USA, 4–7 November 2018; pp. 650–655. [Google Scholar]
  44. Jia, Y.; Shen, X.; Lin, X. Exploration of the Development Strategy of Building Industrialization Based on the Application of Smart Construction Technology. In Proceedings of the 2023 4th International Conference on Management Science and Engineering Management (ICMSEM 2023), Nanchang, China, 2–4 June 2023; Advances in Economics, Business and Management Research. Zailani, S.H.B.D.M., Yagapparaj, K., Zakuan, N., Eds.; Atlantis Press International BV: Dordrecht, Germany, 2024; Volume 259, pp. 1175–1185, ISBN 978-94-6463-255-2. [Google Scholar]
  45. Wu, H.-H.; Chen, H.-K.; Shieh, J.-I. Evaluating performance criteria of Employment Service Outreach Program personnel by DEMATEL method. Expert Syst. Appl. 2010, 37, 5219–5223. [Google Scholar] [CrossRef]
  46. Liu, P.; Qiu, Y.; Hu, J.; Tong, J.; Zhao, J.; Li, Z. Expert judgments for performance shaping Factors’ multiplier design in human reliability analysis. Reliab. Eng. Syst. Saf. 2020, 194, 106343. [Google Scholar] [CrossRef]
  47. Dehdasht, G.; Mohamad Zin, R.; Ferwati, M.; Mohammed Abdullahi, M.; Keyvanfar, A.; McCaffer, R. DEMATEL-ANP Risk Assessment in Oil and Gas Construction Projects. Sustainability 2017, 9, 1420. [Google Scholar] [CrossRef]
  48. Pourahmad, A.; Hosseini, A.; Banaitis, A.; Nasiri, H.; Banaitienė, N.; Tzeng, G.-H. Combination of fuzzy-ahp and dematel-anp with gis in a new hybrid mcdm model used for the selection of the best space for leisure in a blighted urban site. Technol. Econ. Dev. Econ. 2015, 21, 773–796. [Google Scholar] [CrossRef]
  49. Sebastiani, F. Machine learning in automated text categorization. ACM Comput. Surv. 2002, 34, 1–47. [Google Scholar] [CrossRef]
  50. Qaiser, S.; Ali, R. Text Mining: Use of TF-IDF to Examine the Relevance of Words to Documents. IJCA 2018, 181, 25–29. [Google Scholar] [CrossRef]
  51. Soumya, G.K.; Shibily, J.; Department of Computer Science and Engineering, Government Engineering College, Thrissur, India; George, K.S.; Joseph, S. Text Classification by Augmenting Bag of Words (BOW) Representation with Co-occurrence Feature. IOSR J. Comput. Eng. 2014, 16, 34–38. [Google Scholar] [CrossRef]
  52. Dzieciątko, M. Application of Text Analytics to Analyze Emotions in the Speeches. In Information Technology in Biomedicine; Advances in Intelligent Systems and Computing; Pietka, E., Badura, P., Kawa, J., Wieclawek, W., Eds.; Springer International Publishing: Cham, Switzerland, 2019; Volume 762, pp. 525–536. ISBN 978-3-319-91210-3. [Google Scholar]
  53. Falini, A. A review on the selection criteria for the truncated SVD in Data Science applications. J. Comput. Math. Data Sci. 2022, 5, 100064. [Google Scholar] [CrossRef]
  54. Niu, Y.; Fan, Y.; Ju, X. Critical review on data-driven approaches for learning from accidents: Comparative analysis and future research. Saf. Sci. 2024, 171, 106381. [Google Scholar] [CrossRef]
  55. Shishkin, S.L.; Shalaginov, A.; Bopardikar, S.D. Fast approximate truncated SVD. Numer. Linear Algebra Appl. 2019, 26, e2246. [Google Scholar] [CrossRef]
  56. Kim, S.-W.; Gil, J.-M. Research paper classification systems based on TF-IDF and LDA schemes. Hum. Cent. Comput. Inf. Sci. 2019, 9, 30. [Google Scholar] [CrossRef]
  57. Dewi, C.; Chen, R.-C. Complement Naive Bayes Classifier for Sentiment Analysis of Internet Movie Database. In Intelligent Information and Database Systems; Nguyen, N.T., Tran, T.K., Tukayev, U., Hong, T.-P., Trawiński, B., Szczerbicki, E., Eds.; Lecture Notes in Computer Science; Springer International Publishing: Cham, Switzerland, 2022; Volume 13757, pp. 81–93. ISBN 978-3-031-21742-5. [Google Scholar]
  58. Lukan, J.; Bolliger, L.; Pauwels, N.S.; Luštrek, M.; Bacquer, D.D.; Clays, E. Work environment risk factors causing day-to-day stress in occupational settings: A systematic review. BMC Public Health 2022, 22, 240. [Google Scholar] [CrossRef] [PubMed]
  59. Groth, K.M.; Mosleh, A. A data-informed PIF hierarchy for model-based Human Reliability Analysis. Reliab. Eng. Syst. Saf. 2012, 108, 154–174. [Google Scholar] [CrossRef]
  60. Parhizkar, T.; Utne, I.B.; Vinnem, J.-E. Human Factor Analysis and Quantification. In Online Probabilistic Risk Assessment of Complex Marine Systems; Springer Series in Reliability Engineering; Springer International Publishing: Cham, Switzerland, 2022; pp. 75–102. ISBN 978-3-030-88097-2. [Google Scholar]
  61. Ham, D.-H.; Park, J.; Jung, W. Model-based identification and use of task complexity factors of human integrated systems. Reliab. Eng. Syst. Saf. 2012, 100, 33–47. [Google Scholar] [CrossRef]
  62. Sandi, C. Stress and cognition. WIRES Cogn. Sci. 2013, 4, 245–261. [Google Scholar] [CrossRef]
  63. Pooladvand, S.; Hasanzadeh, S. Neurophysiological evaluation of workers’ decision dynamics under time pressure and increased mental demand. Autom. Constr. 2022, 141, 104437. [Google Scholar] [CrossRef]
  64. Gottschalk, M.G.; Domschke, K.; Schiele, M.A. Epigenetics Underlying Susceptibility and Resilience Relating to Daily Life Stress, Work Stress, and Socioeconomic Status. Front. Psychiatry 2020, 11, 163. [Google Scholar] [CrossRef] [PubMed]
  65. Kerautret, L.; Dabic, S.; Navarro, J. Exploration of driver stress when resuming control from highly automated driving in an emergency situation. Transp. Res. Part F Traffic Psychol. Behav. 2023, 93, 222–234. [Google Scholar] [CrossRef]
  66. Rivaldo, Y.; Nabella, S.D. Employee Performance: Education, Training, Experience and Work Discipline. QAS 2023, 24, 182–188. [Google Scholar] [CrossRef]
  67. Choudhry, R.M. Behavior-based safety on construction sites: A case study. Accid. Anal. Prev. 2014, 70, 14–23. [Google Scholar] [CrossRef] [PubMed]
  68. Dong, X.; Li, Z. A study on the effect of training interval on the use of computerized emergency operating procedures. Reliab. Eng. Syst. Saf. 2011, 96, 250–256. [Google Scholar] [CrossRef]
  69. O’Keefe, R.M.; O’Leary, D.E. Expert system verification and validation: A survey and tutorial. Artif. Intell. Rev. 1993, 7, 3–42. [Google Scholar] [CrossRef]
  70. Zou, Y.; Zhang, L.; Dai, L.; Li, P.; Qing, T. Human Reliability Analysis for Digitized Nuclear Power Plants: Case Study on the LingAo II Nuclear Power Plant. Nucl. Eng. Technol. 2017, 49, 335–341. [Google Scholar] [CrossRef]
  71. Chemweno, P.; Pintelon, L.; Van Horenbeek, A.; Muchiri, P. Development of a risk assessment selection methodology for asset maintenance decision making: An analytic network process (ANP) approach. Int. J. Prod. Econ. 2015, 170, 663–676. [Google Scholar] [CrossRef]
  72. Maynard, S.; Filtness, A.; Miller, K.; Pilkington-Cheney, F. Bus driver fatigue: A qualitative study of drivers in London. Appl. Ergon. 2021, 92, 103309. [Google Scholar] [CrossRef] [PubMed]
  73. Liao, C.-W.; Chiang, T.-L. Reducing occupational injuries attributed to inattentional blindness in the construction industry. Saf. Sci. 2016, 89, 129–137. [Google Scholar] [CrossRef]
  74. Chen, L.; Li, H.; Tian, S. Application of AHP and DEMATEL for Identifying Factors Influencing Coal Mine Practitioners’ Unsafe State. Sustainability 2022, 14, 14511. [Google Scholar] [CrossRef]
  75. Liu, Q.; Xu, N.; Jiang, H.; Wang, S.; Wang, W.; Wang, J. Psychological Driving Mechanism of Safety Citizenship Behaviors of Construction Workers: Application of the Theory of Planned Behavior and Norm Activation Model. J. Constr. Eng. Manag. 2020, 146, 04020027. [Google Scholar] [CrossRef]
  76. Stern, H.S.; Blower, D.; Cohen, M.L.; Czeisler, C.A.; Dinges, D.F.; Greenhouse, J.B.; Guo, F.; Hanowski, R.J.; Hartenbaum, N.P.; Krueger, G.P.; et al. Data and methods for studying commercial motor vehicle driver fatigue, highway safety and long-term driver health. Accid. Anal. Prev. 2019, 126, 37–42. [Google Scholar] [CrossRef] [PubMed]
  77. Osintsev, N.; Rakhmangulov, A.; Baginova, V. Evaluation of logistic flows in green supply chains based on the combined dematel-anp method. FU Mech. Eng. 2021, 19, 473. [Google Scholar] [CrossRef]
  78. Büyüközkan, G.; Güleryüz, S. An integrated DEMATEL-ANP approach for renewable energy resources selection in Turkey. Int. J. Prod. Econ. 2016, 182, 435–448. [Google Scholar] [CrossRef]
  79. Ghosh, S.; Das Chatterjee, N.; Dinda, S. Urban ecological security assessment and forecasting using integrated DEMATEL-ANP and CA-Markov models: A case study on Kolkata Metropolitan Area, India. Sustain. Cities Soc. 2021, 68, 102773. [Google Scholar] [CrossRef]
  80. Zaman, U.K.U.; Rivette, M.; Siadat, A.; Mousavi, S.M. Integrated product-process design: Material and manufacturing process selection for additive manufacturing using multi-criteria decision making. Robot. Comput. Integr. Manuf. 2018, 51, 169–180. [Google Scholar] [CrossRef]
  81. Der, O.; Başar, G.; Ordu, M. Statistical Investigation of the Effect of CO2 Laser Cutting Parameters on Kerf Width and Heat Affected Zone in Thermoplastic Materials. J. Mater. Mechatron. A 2023, 4, 459–474. [Google Scholar] [CrossRef]
  82. Saaty, T.L. Theory and Applications of the Analytic Network Process: Decision Making with Benefits, Opportunities, Costs, and Risks; RWS Publications: Pittsburgh, PA, USA, 2009; ISBN 978-1-888603-06-4. [Google Scholar]
  83. Lee, G.; Cho, J.; Ham, S.; Lee, T.; Lee, G.; Yun, S.-H.; Yang, H.-J. A BIM- and sensor-based tower crane navigation system for blind lifts. Autom. Constr. 2012, 26, 1–10. [Google Scholar] [CrossRef]
  84. Jannati, M.; Aghaei, H.; Askaripoor, T.; Khazaei, M.; Khalaji, E.B.; Kazemi, E. Ergonomic Assessment and Design of the Tower Crane Cabin Based on Anthropometric Dimensions of Iranian Operators. Iran J. Ergon. 2020, 8, 26–38. [Google Scholar] [CrossRef]
Figure 1. ANP network structure diagram.
Buildings 14 01083 g001
Figure 2. Indicator priority.
Buildings 14 01083 g002
Table 1. Dimension reduction results of the feature items of the intelligent site tower crane accident investigation report.
Impact FactorsFrequencyImpact FactorsFrequencyImpact FactorsFrequency
Feel unwell0.1273Teamwork0.0202Cockpit temperature0.0015
Physical state0.0079Teamwork0.0015Cockpit humidity0.0014
Illness0.0318Operating specification0.0099Illumination0.0028
Health0.0015Operating system0.0128Hue0.0014
Fatigued0.0012Rules and regulations0.0124Noise0.0014
Dispersion of attention0.0012Reward and punishment system0.0028Vibration0.0012
Distracted0.0020Management system0.0076Crossing condition0.0014
Inattention0.0021Job training0.0318Construction site0.0049
Emotional stability0.0014Safety education0.0341Site obstacle0.0330
Testiness0.0021Job management0.0012Weather0.0034
Safety awareness0.0069Operating procedure0.0180Digital interface display0.0049
Professional skill0.0861Technical specification0.0036Digital interface information delivery0.0055
Operational skill0.0359Regulation0.0031Information transmission0.0082
Defense0.0038Long working hours0.1220Safety sign0.0440
Safety belt0.0029Work schedule is not reasonable0.0012Display and control page layout0.0070
Safety Helmet 0.0015Cable worker communication0.0021Display and control operation mode0.0015
Safety measure0.0018Signalman0.0096Display and control device density0.0073
Protective device0.0015Untimely signal0.0055Drive-by-wire reliability0.0144
Working hours0.0021Improper command0.0250Space comfort0.0063
Staffing0.0023Emergency drill0.0507Cockpit seat comfort0.0011
Distribution of responsibilities0.0423Emergency plan0.0032Communication equipment0.0064
Time pressure0.0091Preventive measures0.0061System intelligence0.0076
Time shortage0.0334Working atmosphere0.0954System reliability0.0070
Table 2. Types of human error for tower cranes in smart construction sites based on SPAR-H method.
PSFsHuman Error FactorIndexDescriptionLiterature Reference
Task availability timeTime pressureTime pressure, time shortageThe time crunch and pressure that tower crane drivers feel at work[62]
Experience and trainingAdequacy of job trainingJob training, safety educationWhether the work training is similar to the actual working conditions of the tower crane, and whether it covers all working scenarios[18]
Emergency drills and plansEmergency drills, emergency plans, preventive measuresThe frequency and quality of emergency drills and the adequacy of safety plans for emergencies[18]
Human–machine environmentDigital interface information deliveryDevice interface information is poorly designed, device is over-used/fatigued, and device panel alarm is not clearThe prominence of important information display in the digital interface, the speed of obtaining information, text, icon symbols[76]
Mandatory signSafety signClarity, legibility, and reliability[17]
Crossing conditions, site obstaclesCrossing conditionThe accuracy and differentiation of relevant indicator symbols and marks in the display control panel[76]
Construction site, site road conditionsMultiple working conditions or conditions that exist at the construction site simultaneously and affect each other
Display and control device layoutDisplay and control page layout, display and control operation mode, display and control device density, display and control device reliabilityRoad and traffic conditions around the construction site[77]
Overall spatial layoutSpace comfort, vision, operating leverThe visibility of the display device, the position reachability of the control device, and the corresponding relation of the display and control combination layout[77]
Cockpit seatCockpit seatDepartment, function division in line with personnel experience and expectations[2]
Communication equipmentCommunication equipmentStructural dimensions of work areas, channels, and activity Spaces[18]
Abnormal climate changeWeather anomalyThe degree to which the structure of the seat matches the operation of the sitting position and the comfort of the human spine[77]
Lighting, colorLighting, colorThe good working condition of communication equipment, the stability and clarity of communication signals[77]
Noise and vibrationNoise and vibrationUnusual or abrupt weather conditions at the construction site will affect the work of the tower crane driver[77]
Completeness of operating system standardsOperation standard, operation systemWhether the lighting and color are conducive to the visual recognition function of personnel, visual information exchange, etc.[18]
Operating procedureCompleteness of operating procedures for tower cranesComplete operating procedures, technical procedures Whether noise and vibration are beneficial to people’s auditory sensitivity, manipulation accuracy, and emotional state[16]
Rationality of reward and punishment systemRules and regulations, reward and punishment system, management systemOrganization and management, operating standards and systems are scientific and accurate[18]
ProcessClear division of labor and responsibilitiesDivision of labor, staffing, responsibility distributionThe adequacy of procedures and specifications for the flight deck crew to perform operational tasks[18]
Degree of teamworkTeamworkWhether the reward and punishment system can effectively mobilize the enthusiasm of tower crane drivers[76]
Communicate properly with the operatorCable worker and signal worker communication, signal is not timely, improper commandThe positioning of the tower crane staff for their role and the clarity of their job responsibilities[16]
System automation levelSystem intelligence, system reliabilityThe quality of information exchange between staff and the quality of operation coordination[14]
Working atmosphereWorking atmosphereAble to communicate properly with the operator and ensure smooth work[20]
Safety atmosphereSafety culture, safety trainingAutomation system reliability, equipment complexity
Fatigue degreeFatiguedHarmonious working atmosphere[77]
Occupational suitabilityPhysical fitnessPhysical discomfort, physical condition, diseaseRelevant departments supervise building safety and publicize and educate around safety culture[77]
Knowledge skills and business abilitySafety awareness, professional skills, operational skillsAn individual’s subjective perception of physical fatigue[17]
Degree of teamworkTeamworkWhether the personal physical quality is good, such as eyesight, physical coordination, and other elements[12]
Concentration levelDistraction, inattentionThe reserve of personal knowledge of tower cranes, the mastery level of tower crane skills, and the cognition and decision-making levels of situational awareness[72]
Emotional stateEmotionally stable, irritableThe quality of information exchange and operation cooperation between team members[12]
Working time rationalityLong working hours and unreasonable working schedulePersonal focus on work[12]
Table 3. PSFs level determination criteria related to smart site tower cranes.
PSFsLevelAdjustment Factor
PSF11 Scenario
Complexity
More than three changing targets need to be monitoredMeeting three is very high5
PSF12 Operation
Complexity
The observed parameters need to be calculated/
estimated/transformed
Meeting two is high2
Need to recall relevant experience/knowledge to make judgmentSatisfying less than two is normal1
Different alarm signals need to be distinguished
PSF1 task complexity Common sense can accomplish thisEasy to diagnose0.1
The operation is simple/l to 2 objects need to be observedNormal1
The complexity of the operation requires that multiple objects be observed simultaneouslyMedium complexity2
Tasks are beyond the operator’s cognitive and skill levelHighly complex5
Insufficient information1
PSF2 task processing timePSF11 Available time vs. required time≥50 times the required timeTime affluence0.01
≥5 times the required timePlenty of time0.1
≈Required timeJust in time1
≈2/3 times the required timeHardly enough time10
Insufficient information1
PSF3 PressurePSF31Pressure based on the severity of the situationThe operator has no life-threatening pressureNormal1
Operator experiencing low life-threatening pressureHigh2
Operator experiencing high life-threatening pressureVery high5
Insufficient information1
PSF32 Pressure based on the severity of theThe operator has no life-threatening pressureNormal1
DecisionOperator experiencing low life-threatening pressureHigh2
Operator experiencing high life-threatening pressureVery high5
Insufficient information1
PSF4 Experience/safety trainingPSF41 Safety Education/Emergency Drills and plans1. Receive safety training before operationAll satisfied0.5
2. Regular safety trainingNormal: 1 or 2 items are not satisfied1
3. Classified safety trainingLow: More than 2 items are not satisfied10
4. Graded safety trainingInsufficient information1
5. Special safety training
PSF42 Working hours X/monthX ≥ 12High0.5
6 ≤ X ≤ 12Normal1
X ≤ 12Low10
Insufficient information1
PSF51 operating code system completeness1. Symptom-oriented procedureGood0.5
2. It matches with the current task and has a direct
guiding role
Normal1
PSF5 Operating procedures 3. The number of operating procedures is less than the
actual number of steps
Range5
4. No operating proceduresWorse20
Insufficient information1
1. Symptom oriented procedureGood0.5
PSF52 Tower crane
operating procedure completeness
2. It matches with the current task and has a direct
guiding role
Normal1
3. The number of operating procedures is less than the
actual number of steps
Range5
4. No operating proceduresWorse20
Insufficient information1
PSF6 Human–machine environmentPSF61 Physical
environment
1. Lighting, color suitableAll satisfied0.5
2. The noise is not more than 88 dbNormal: 1 or 2 items are not satisfied1
3. Clear indication markLow: More than 2 items are not satisfied10
4. Cross conditions are clear, no obstacles on the siteInsufficient information1
5. The overall layout of the cab space is suitable
6. The height of the cab seat and the operating table is suitable, and the seat is suitable
7. Suitable temperature and humidity
8. The climate is suitable
PSF62 Technical
environment
1. The digital interface is clearAll satisfied0.5
2. Excessive/fatigued use of equipmentNormal: 1 or 2 items are not satisfied1
3. Communication equipment functions normallyLow: More than 2 items are not satisfied10
4. The device panel alarm is not clearInsufficient information1
5. The density of display and control equipment is suitable
6. Display and control operation mode is suitable
7. Reliability of display and control device
PSF7 Occupational suitabilityPSF71 Personal
capabilities
1. Have sufficient team cooperation, knowledge, skills and business abilityGood1
2. General level of team cooperation, knowledge, skills, and business abilityNormal5
3. Less team cooperation, knowledge, skills, and business abilityIndispositionP (Failure) = 1.0
PSF72 Individual status1. Individual state (physical fitness, fatigue,
concentration) can complete the task with high quality
Good1
2. Individual state (physical fitness, fatigue,
concentration) can complete the task
Normal5
3. Individual state (physical fitness, fatigue,
concentration) cannot complete the task
IndispositionP(Failure) = 1.0
PSF8 ProcessPSF81 Organization Management1. Reasonable staffing and responsibility allocationAll satisfied0.8 (diagnosis)/0.5 (action)
2. Perfect reward and punishment systemNormal: 1 or 2 items are not satisfied1
3. High degree of teamworkLow: More than 2 items are not satisfied5
4. Unimpeded communication with the cable operator,
cable operator commands properly
Insufficient information1
5. Regular safety training
6. High reliability and intelligence of the system
PSF82 Safety Culture1. Incorporate safety culture construction into cultural construction planningAll satisfied0.8 (diagnosis)/0.5 (action)
2. Organize safety culture publicity and educational
activities in various forms
Normal: 1 or 2 items are not satisfied1
3. Disclose the contact information of safety complaintsLow: More than 2 items are not satisfied5
4. Hold safety production monthInsufficient information1
5. Carry out safety commitment activities
Table 4. Model AVE and CR indicator results.
FactorAVECR
PSF10.6910.94
PSF20.7530.859
PSF30.6820.951
PSF40.710.907
PSF50.6220.831
PSF60.7160.968
PSF70.6590.939
PSF80.6720.953
Table 5. Discriminant validity: Pearson correlation and square root of AVE.
PSF1PSF2PSF3PSF4PSF5PSF6PSF7PSF8
PSF10.831
PSF20.9340.868
PSF30.9440.930.826
PSF40.9260.9070.9310.843
PSF50.8910.8810.9140.8770.788
PSF60.9450.9290.9710.9430.9090.846
PSF70.9350.9030.9420.9230.9070.9490.812
PSF80.9470.9250.9560.9340.9020.9630.9490.82
Table 6. Index system for human error in tower cranes in smart construction site.
Target LayerCriterion LayerIndex Level
PSF1 task complexityPSF11 Scenario complexity
PSF12 Operation complexity
PSF2 task processing timePSF21 Available time vs. required time
F3 PressurePSF31 Pressure based on situational severity
Human error PSF32 Pressure based on situational severity in terms of decisions
PSF4 Experience/safety trainingPSF41 Safety education/Emergency drills and plans
PSF42 Working hours X/month
PSF5 Operating proceduresPSF51 Operational code system completeness
PSF52 Tower crane operating procedure completeness
PSF6 Human–Machine EnvironmentPSF61 Physical Environment
PSF62 Technical environment
PSF7 Occupational suitabilityPSF71 Personal capabilities
PSF72 Personal status
PSF8 ProcessPSF81 Organization Management
PSF82 Safety Culture
Table 7. Profile of experts surveyed in the study.
Years of Experience in ConstructionJob Position
DescriptionLess than 10 years10–20 yearsMore than 20 yearsSafety
supervisor
Equipment maintenance technicianTower crane operatorQuality control
personnel
Number of people2714231
Percent20%70%10%40%20%30%10%
Table 8. Total relationship matrix of expert survey.
F11F12F21F31F32F41F42F51F52F61F62F71F72F81F82
F110.00 0.79 1.10 1.21 1.31 0.95 1.05 1.26 1.00 1.21 0.84 0.68 0.74 0.95 0.79
F120.73 0.00 0.29 0.26 0.18 0.44 0.29 0.48 0.51 0.26 0.33 0.15 0.11 0.40 0.18
F210.36 1.07 0.00 1.07 0.87 1.17 0.77 1.23 1.12 1.17 1.33 0.61 0.77 1.17 0.97
F310.87 0.82 0.68 0.00 0.68 1.11 0.82 1.01 0.97 0.87 0.68 1.11 0.92 1.16 0.87
F320.98 0.33 0.84 0.75 0.00 0.75 0.65 1.07 0.98 0.84 0.89 0.61 0.51 1.03 0.89
F410.72 1.18 1.08 1.02 0.92 0.00 0.77 1.08 0.97 1.18 1.08 1.28 1.18 0.92 0.87
F420.63 0.83 0.53 0.88 1.02 0.49 0.00 0.97 1.07 0.78 0.83 0.97 0.92 0.83 0.97
F510.90 1.00 1.30 1.15 1.25 0.80 0.90 0.00 1.00 1.05 1.20 1.10 1.15 0.70 0.85
F521.00 0.95 0.90 1.05 1.09 0.81 0.95 0.71 0.00 0.67 0.86 0.71 0.62 0.52 0.33
F610.72 0.29 0.95 0.91 1.05 0.95 1.00 1.05 0.86 0.00 0.81 0.67 0.52 0.91 1.00
F620.92 0.56 1.17 0.92 1.12 1.12 1.02 1.27 0.97 1.02 0.00 0.92 1.02 0.87 0.82
F710.99 1.10 0.82 1.32 0.99 1.43 1.26 1.32 0.99 0.88 1.10 0.00 1.26 1.04 1.15
F721.08 0.70 0.91 1.08 0.75 1.35 1.18 1.29 1.24 1.40 0.91 0.81 0.00 1.02 1.18
F811.01 0.48 1.28 1.39 1.34 1.01 1.12 0.96 0.75 1.12 1.23 1.34 1.28 0.00 1.23
F820.89 1.00 1.05 1.15 1.26 0.95 1.10 0.79 0.53 1.21 0.95 0.84 1.05 1.15 0.00
Table 9. Overall impacts and relationships for each dimension.
rsr + sr − s
F1126.423.950.32.5
F1212.621.834.4−9.2
F2126.825.752.51.1
F312627.953.9−1.9
F3223.827.351.1−3.5
F4127.826.554.31.3
F4224.125.549.6−1.4
F5128.728.957.6−0.2
F5223.525.949.4−2.4
F6124.526.951.4−2.4
F6226.925.952.81
F7128.523.5525
F7227.723.851.53.9
F8129.125.454.53.7
F8226.52450.52.5
Table 10. Mixed-weights table.
Target LayerCriterion LayerIndex LevelMixed WeightsNormalized Weights
PSF1 Task complexityPSF11 Scenario complexity0.9860.071
PSF12 Operation complexity0.3470.025
PSF2 Task processing timePSF21 Available time vs. required time0.9710.070
F3 PressurePSF31 Pressure based on situational
severity
0.8810.064
Human error PSF32 Pressure based on situational
severity in terms of decisions
0.8080.058
PSF4 Experience/safety trainingPSF41 Safety education/Emergency drills and plans1.0310.075
PSF42 Working hours X/month0.8360.060
PSF5 Operating
procedures
PSF51 Operational code system
completeness
1.0580.077
PSF52 Tower crane operating procedure completeness0.8240.060
PSF6 Human–Machine EnvironmentPSF61 Physical Environment0.8430.061
PSF62 Technical environment0.9980.072
PSF7 Occupational suitabilityPSF71 Personal capabilities1.0760.078
PSF72 Personal status1.0450.076
PSF8 ProcessPSF81 Organization Management1.1310.082
PSF82 Safety Culture0.9890.072
Table 11. The results of each PSF.
PSFDiagnosisWeightAdjustment FactorResultActionWeightAdjustment FactorResult
PSF1 Task
complexity
PSF11 Scenario
complexity
0.07150.355PSF11 Scenario
complexity
0.07150.355
PSF12 Operation
complexity
0.02550.125PSF12 Operation complexity0.02520.05
PSF2 Task
processing time
PSF21 Available time vs.
required time
0.07100.7PSF21 Available time vs. required time0.07100.7
F3 PressurePSF31 Pressure based on situational severity0.06450.32PSF31 Pressure based on situational
severity
0.06450.32
PSF32 Pressure based on situational severity in terms of decisions0.05850.29PSF32 Pressure based on situational
severity in terms of decisions
0.05850.29
PSF4 Experience/safety trainingPSF41 Safety
education/Emergency drills and plans
0.075100.75PSF41 Safety
education/Emergency drills and plans
0.075100.75
PSF42 Working hours X/month0.0610.06PSF42 Working hours X/month0.0610.06
PSF5 Operating proceduresPSF51 Operational code system completeness0.0770.50.0385PSF51 Operational code system
completeness
0.0770.50.0385
PSF52 Tower crane
operating procedure
completeness
0.060.50.03PSF52 Tower crane operating procedures completeness0.0610.06
PSF6 Human–Machine
Environment
PSF61 Physical
Environment
0.061100.61PSF61 Physical
Environment
0.061100.61
PSF62 Technical
environment
0.07210.072PSF62 Technical
environment
0.07210.072
PSF7 Occupational suitabilityPSF71 Personal
capabilities
0.07850.39PSF71 Personal
capabilities
0.07850.39
PSF72 Personal status0.07650.38PSF72 Personal status0.07650.38
PSF8 ProcessPSF81 Organization
Management
0.08210.082PSF81 Organization Management0.08210.082
PSF82 Safety Culture0.07250.36PSF82 Safety Culture0.07250.36
Disclaimer/Publisher’s Note: The statements, opinions and data contained in all publications are solely those of the individual author(s) and contributor(s) and not of MDPI and/or the editor(s). MDPI and/or the editor(s) disclaim responsibility for any injury to people or property resulting from any ideas, methods, instructions or products referred to in the content.

