1. Introduction
With rapid urbanization, an increasing amount of space is being allocated for production and residential purposes, resulting in the proliferation of underutilized and functionally monotonous negative spaces within cities [
1]. These negative spaces often lack openness, have limited connectivity with surrounding structures, and generally exhibit low architectural vitality, leading to numerous negative impacts on individuals and the urban environment [
1,
2,
3]. Currently, the development of most Chinese cities is constrained by the urban environment, and there is a growing shift in urban development towards prioritizing “quality” over “quantity”. Therefore, exploring optimization and renewal strategies for urban negative spaces has become crucial [
4,
5,
6]. Simultaneously, many international competitions have begun to focus on various types of negative spaces within high-density cities, investigating the relationships between individuals, negative spaces, and urban development [
7]. Numerous award-winning projects combine parametric methods with the design of negative spaces, and this fusion of parametric design with genetic algorithms has sparked a transformation in the architectural design process, holding significant development potential in the early stages of architectural design [
8,
9].
There is a growing interest in negative spaces and their integration with digital and information technologies domestically and internationally. Currently, numerous competition entries employ parametric techniques to renovate and transform negative spaces (
Table 1). However, the majority of these initiatives primarily focus on the initial design phase, often needing more feasibility studies and a comprehensive examination of the entire process of parametric generative design for negative spaces [
10,
11].
This article aims to approach the subject from a parametric design perspective by establishing an architectural generative method suitable for various urban negative spaces. This method primarily comprises the selection of negative spaces, generating multiple solutions utilizing slime mould and the Wasp algorithms and multi-objective optimization performance simulations using the Wallacei plugin [
12,
13,
14,
15]. Additionally, the feasibility of this approach is validated through practical site-based design generation and simulations.
This study selected a negative space within the residential area in Guangzhou, China, for design generation and multi-objective optimization. It was observed that the parametric design process could generate multiple solutions. However, during the simulation of multi-objective optimization based on winter solstice sunlight duration and summer solar radiation, incomplete convergence results were obtained. Analysis of the experimental results revealed various factors that need attention in the parametric design process.
The primary contributions of this research are as follows: (1) Combining high-density urban negative spaces with parametric and information-based design, offering a novel perspective for the early stages of the design process. (2) Proposing a parametric generative design method for negative spaces based on the Grasshopper parametric platform. (3) Integrating parametric design and multi-objective optimization algorithms for performance simulations, establishing an architectural generative optimization design process based on the Grasshopper platform, and significantly enhancing various architectural performance aspects in subsequent phases.
2. Related Work
This study utilizes parametric design and multi-objective optimization methods to optimize negative spaces in high-density cities in China. Firstly, parametric design can generate and analyze multiple visual design schemes based on requirements and algorithms. Secondly, multi-objective optimization methods can combine parametric design optimization parameters with the proposal’s optimization performance objectives. This method filters and optimizes the design based on building performance, providing designers with multiple optimized and analyzed design options.
2.1. Urban Negative Space
Negative space refers to an overlooked or neglected aspect of architectural design characterized by an absence of defined function, organization, accessibility, and connectivity. The concept of negative space was initially introduced by Yoshinobu Ashihara [
16] in “The Design of External Space”, where he referred to the natural space surrounding an object as negative space. Hannah [
17] considers negative space a byproduct of the transition from traditional to modern in urban settings—an unordered, fluid space surrounding isolated, massive structures. Trancik [
18], in “Finding Lost Space”, defined the term “lost space” to vividly portray people’s dissatisfaction and aversion to negative spaces, asserting that these spaces can disrupt the overall cohesion and organic nature of a city [
19,
20].
In this study, the negative space under discussion pertains to the connecting spaces between buildings, often dominated by extensive, unproductive greenery lacking vibrancy [
21,
22]. Specifically, these include transitional spaces between buildings and negative green spaces within the city that remain underutilized and undeveloped.
With the acceleration of China’s urbanization process, issues related to negative space have become increasingly important in urban planning, spatial design, and renewal and transformation efforts [
23,
24,
25,
26,
27,
28,
29,
30]. Recently, research on negative space primarily employs data analysis and simulation software, proposing various renewal strategies [
10,
31]. Baldissara [
11] activated and constructed underutilized urban spaces using “plug-in design” and parametric design methods. Shi [
21], using residual spaces in Macau as an example, employed spatial syntax and SPSS regression fitting methods to analyze the relationship between pedestrians and space. They modularly transformed the remaining street spaces to enhance spatial utilization. The existing research reveals that studies on negative space often focus on planning and strategic aspects, lacking typified and systematic analyses.
However, in some international competitions, award-winning entries combine parametric and simulation technologies with negative space, offering new design perspectives for its transformation and utilization [
32,
33]. UIA-HYP Cup (International Student Competition in Architectural Design) and Evolo competitions have also started to address this topic. Awardees often employ parametric design, digitization, and performance simulation techniques in these competitions. Through processes involving data collection, design, and post-operation, they proposed architectural solutions characterized by parametric features. These solutions offer a new perspective and method for the initial design phase of buildings, providing innovative approaches to addressing negative space challenges in densely populated urban areas.
Table 2 shows competition works related to parametric design from 2020 to 2023. These solutions provide a new perspective and approach for the initial design phase of buildings. However, they still need to consider effectively integrating parametric design and performance simulation optimization systematically. This study aims to integrate various aspects, including parametric design, performance simulation, and multi-objective algorithm optimization, to establish an integrated process for generating architecture in negative spaces.
These solutions provide a new approach and method for the early design stages of architecture. However, no integrated parametric design and performance simulation optimization was proposed. This study aims to integrate various components, including parametric design, performance simulation, and multi-objective algorithm optimization, to establish an integrated process for generating design solutions in negative spaces.
2.2. Parametric Design
This paper adopts a simulation-based generative design approach to address the challenges of dealing with multiple parameters and multiple objectives and the inefficiency of manual optimization in the design process. We combine parametric design, architectural performance simulation, and genetic algorithm optimization to generate multiple preferred solutions [
34,
35,
36,
37,
38,
39].
The slime mould algorithm is a bio-inspired intelligent algorithm that simulates slime moulds’ foraging behavior and morphological changes. By incorporating adaptive weights, the algorithm emulates the propagation wave of the slime mould mechanism based on biological oscillators, generating positive and negative feedback, effectively exploring food locations, and forming optimal paths [
14]. In recent years, architects have increasingly applied the slime mould algorithm to the planning and design of urban road systems, demonstrating significant application potential [
40]. Adamatzky [
41] compared the transportation networks formed by slime moulds on flat and three-dimensional terrains with artificially designed solutions. They found that slime moulds could construct longer transportation paths on three-dimensional terrains, highly similar to the paths designed by humans.
The slime mould algorithm effectively generates optimized path selections in urban negative spaces, offering diverse possibilities for revitalizing and utilizing such spaces. Therefore, this study attempts to incorporate the slime mould algorithm into spatial path planning for urban negative spaces. It aims to generate multiple spatial paths based on actual requirements, providing a more scientifically grounded basis for activating and utilizing urban negative spaces.
The Wasp algorithm is a virtual architectural generation plugin developed by Rossi [
42] using Python. It facilitates the discretization and aggregation of units by setting parameters such as unit size, shape, direction, and connection rules. In the previous research on urban negative space, it was found that many researchers used modular design to update and transform the urban negative space [
21,
29]. Yu [
43] explored the relationship between variable parameters and spatial structure using parametric algorithms, generating digital models of varying scales, which aimed to validate the application of the Wasp plugin’s design algorithms across different spatial scales. Drude [
44] utilized the Wasp algorithm to define discrete architectural modules’ geometric shapes and connectivity logic, employing these rules for aggregating basic units to construct structures. Simultaneously, they integrated Wasp’s approach to discrete architectural modeling with intuitive design in virtual reality, using physical simulation as a form generation, allowing designers to aggregate architectural modules by applying forces through controller movement in a virtual reality environment, thus creating novel architectural forms.
This study aims to combine the rapid unit discretization and aggregation capabilities of the Wasp algorithm with modular design methods, providing new tools for diverse design and rapid construction in urban negative spaces.
2.3. Multi-Objective Optimization
Multi-objective optimization is a method that aids architects in performance-based design by searching for potential solutions that satisfy various performance requirements [
45]. Zhou et al. [
46] proposed a generative design process for Modular-integrated Construction (MiC) based on multi-objective optimization algorithms. Comparative experiments revealed that this generative design approach outperforms traditional methods in areas such as energy efficiency and sunlight exposure. Gagnon [
47] compared sequential and holistic design methods based on multi-objective optimization, demonstrating that holistic design methods can find more optimal solutions in a shorter time frame. Yu [
39], leveraging a multi-objective optimization plugin on the Grasshopper platform, introduced a simulation-based parametric approach, discussing different design parameter combinations under multiple optimization objectives. Hu et al. [
15] utilized Ladybug + Honeybee, a parametric building performance analysis tool on the Grasshopper platform, coupling parameters such as energy consumption, solar radiation, sunlight, and thermal comfort within the same parametric model. They employed genetic algorithms to achieve automatic form optimization for specific performance objectives.
The Wallacei plugin for the Grasshopper platform is an evolutionary engine based on the NSGA-II algorithm, capable of simulating and addressing multi-objective optimization problems through genetic algorithms [
48]. Jingjin Li et al. [
49], utilizing the Wallacei plugin, conducted multi-objective optimization on solar radiation, solar hours, and block capacity for urban block buildings. The research results provided new design strategies for renovating existing residential areas. Additionally, several researchers have proposed building generative design methods based on energy efficiency. They explored generative design methods based on parametric, deep learning, and multi-objective optimization design based on energy consumption simulation. These methods cover various environmental performance indicators related to lighting, comfort, and economy [
50,
51,
52,
53].
However, most existing parametric design studies focus on optimizing a specific type of building, primarily low-rise residential and public buildings with relatively regular floor plans. There is limited research on buildings with more complex floor plans. Regarding the optimization design process, collaboration between different software and tools is required to improve the efficiency of architectural generation and performance simulation. Additionally, these methods need more systematicity and seamless integration. Further efforts are needed to integrate and systematize these methods.
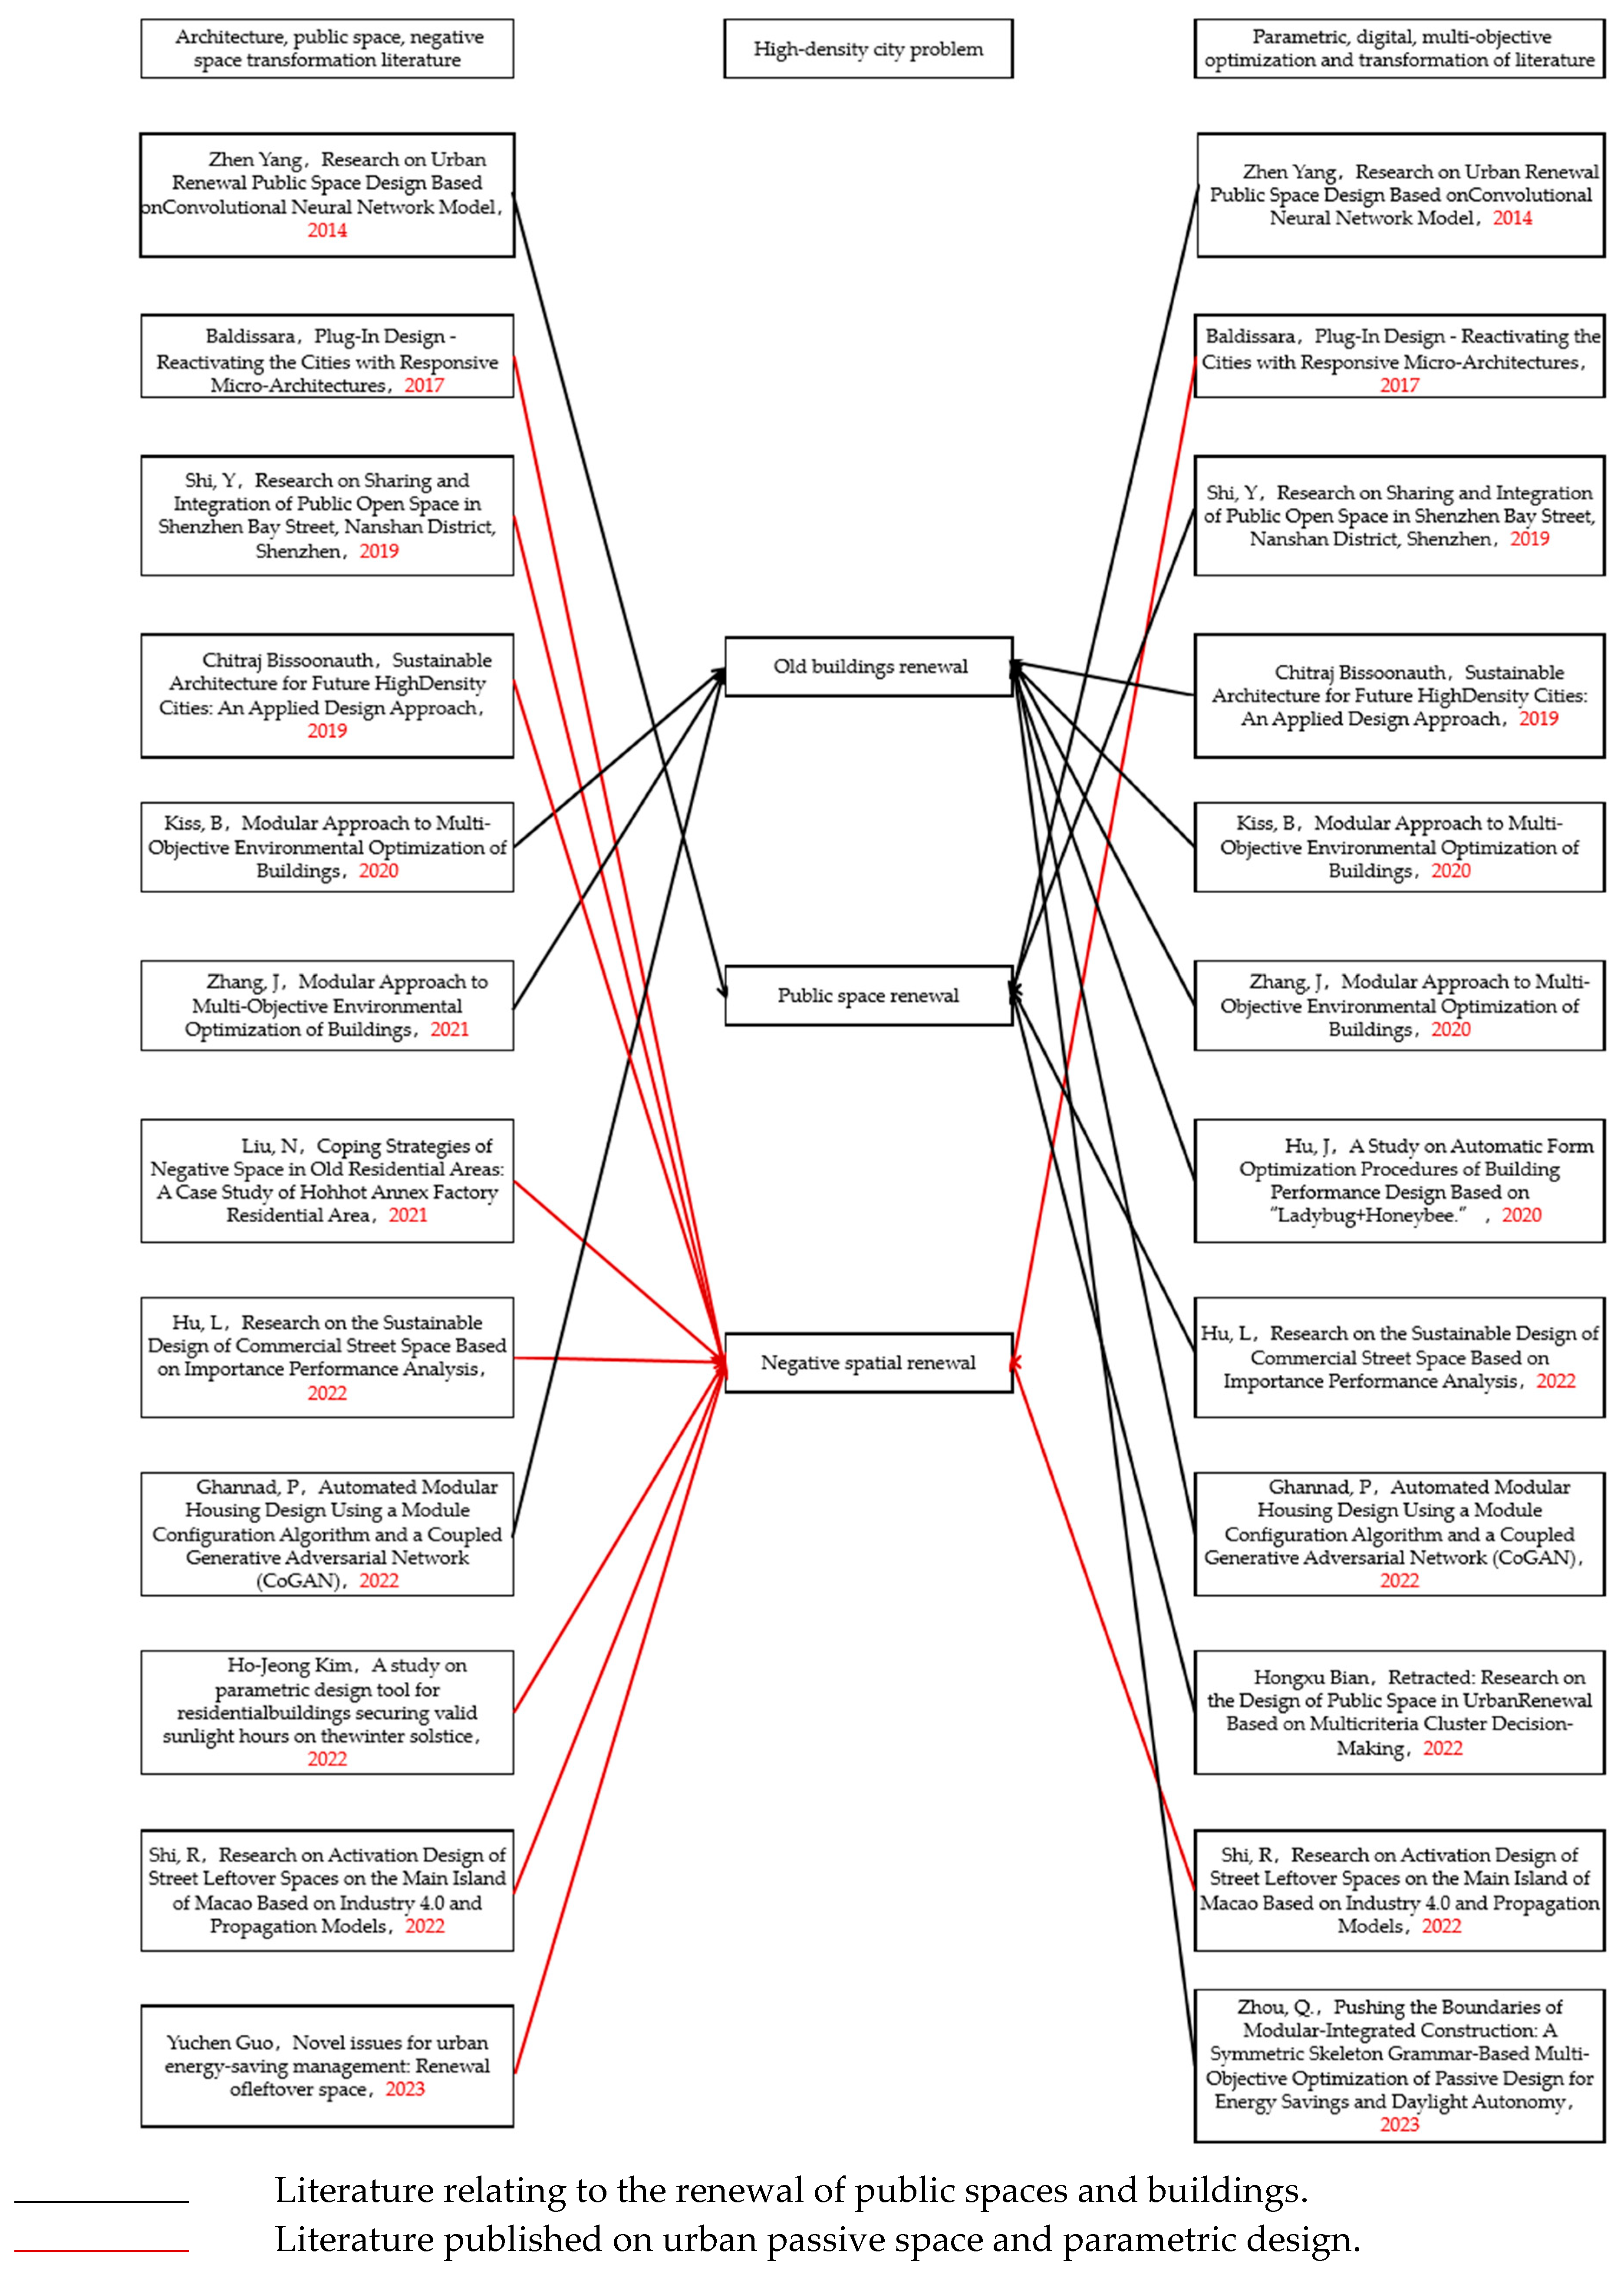
Figure 1 illustrates a literature analysis of the past decade regarding urban negative space and parametric design. Research on negative space is increasingly gaining attention, while studies on utilizing parametric techniques for negative space design are growing each year, which indicates broad prospects for the intersection of negative space and parametric design research and applications. Therefore, this paper aims to construct a methodological system that employs parametric design and multi-objective optimization to generate optimized solutions for urban negative spaces. The establishment, conditions, and considerations for using this system are discussed to provide a theoretical and practical foundation for subsequent related research.
3. Methodology
3.1. Technical Route
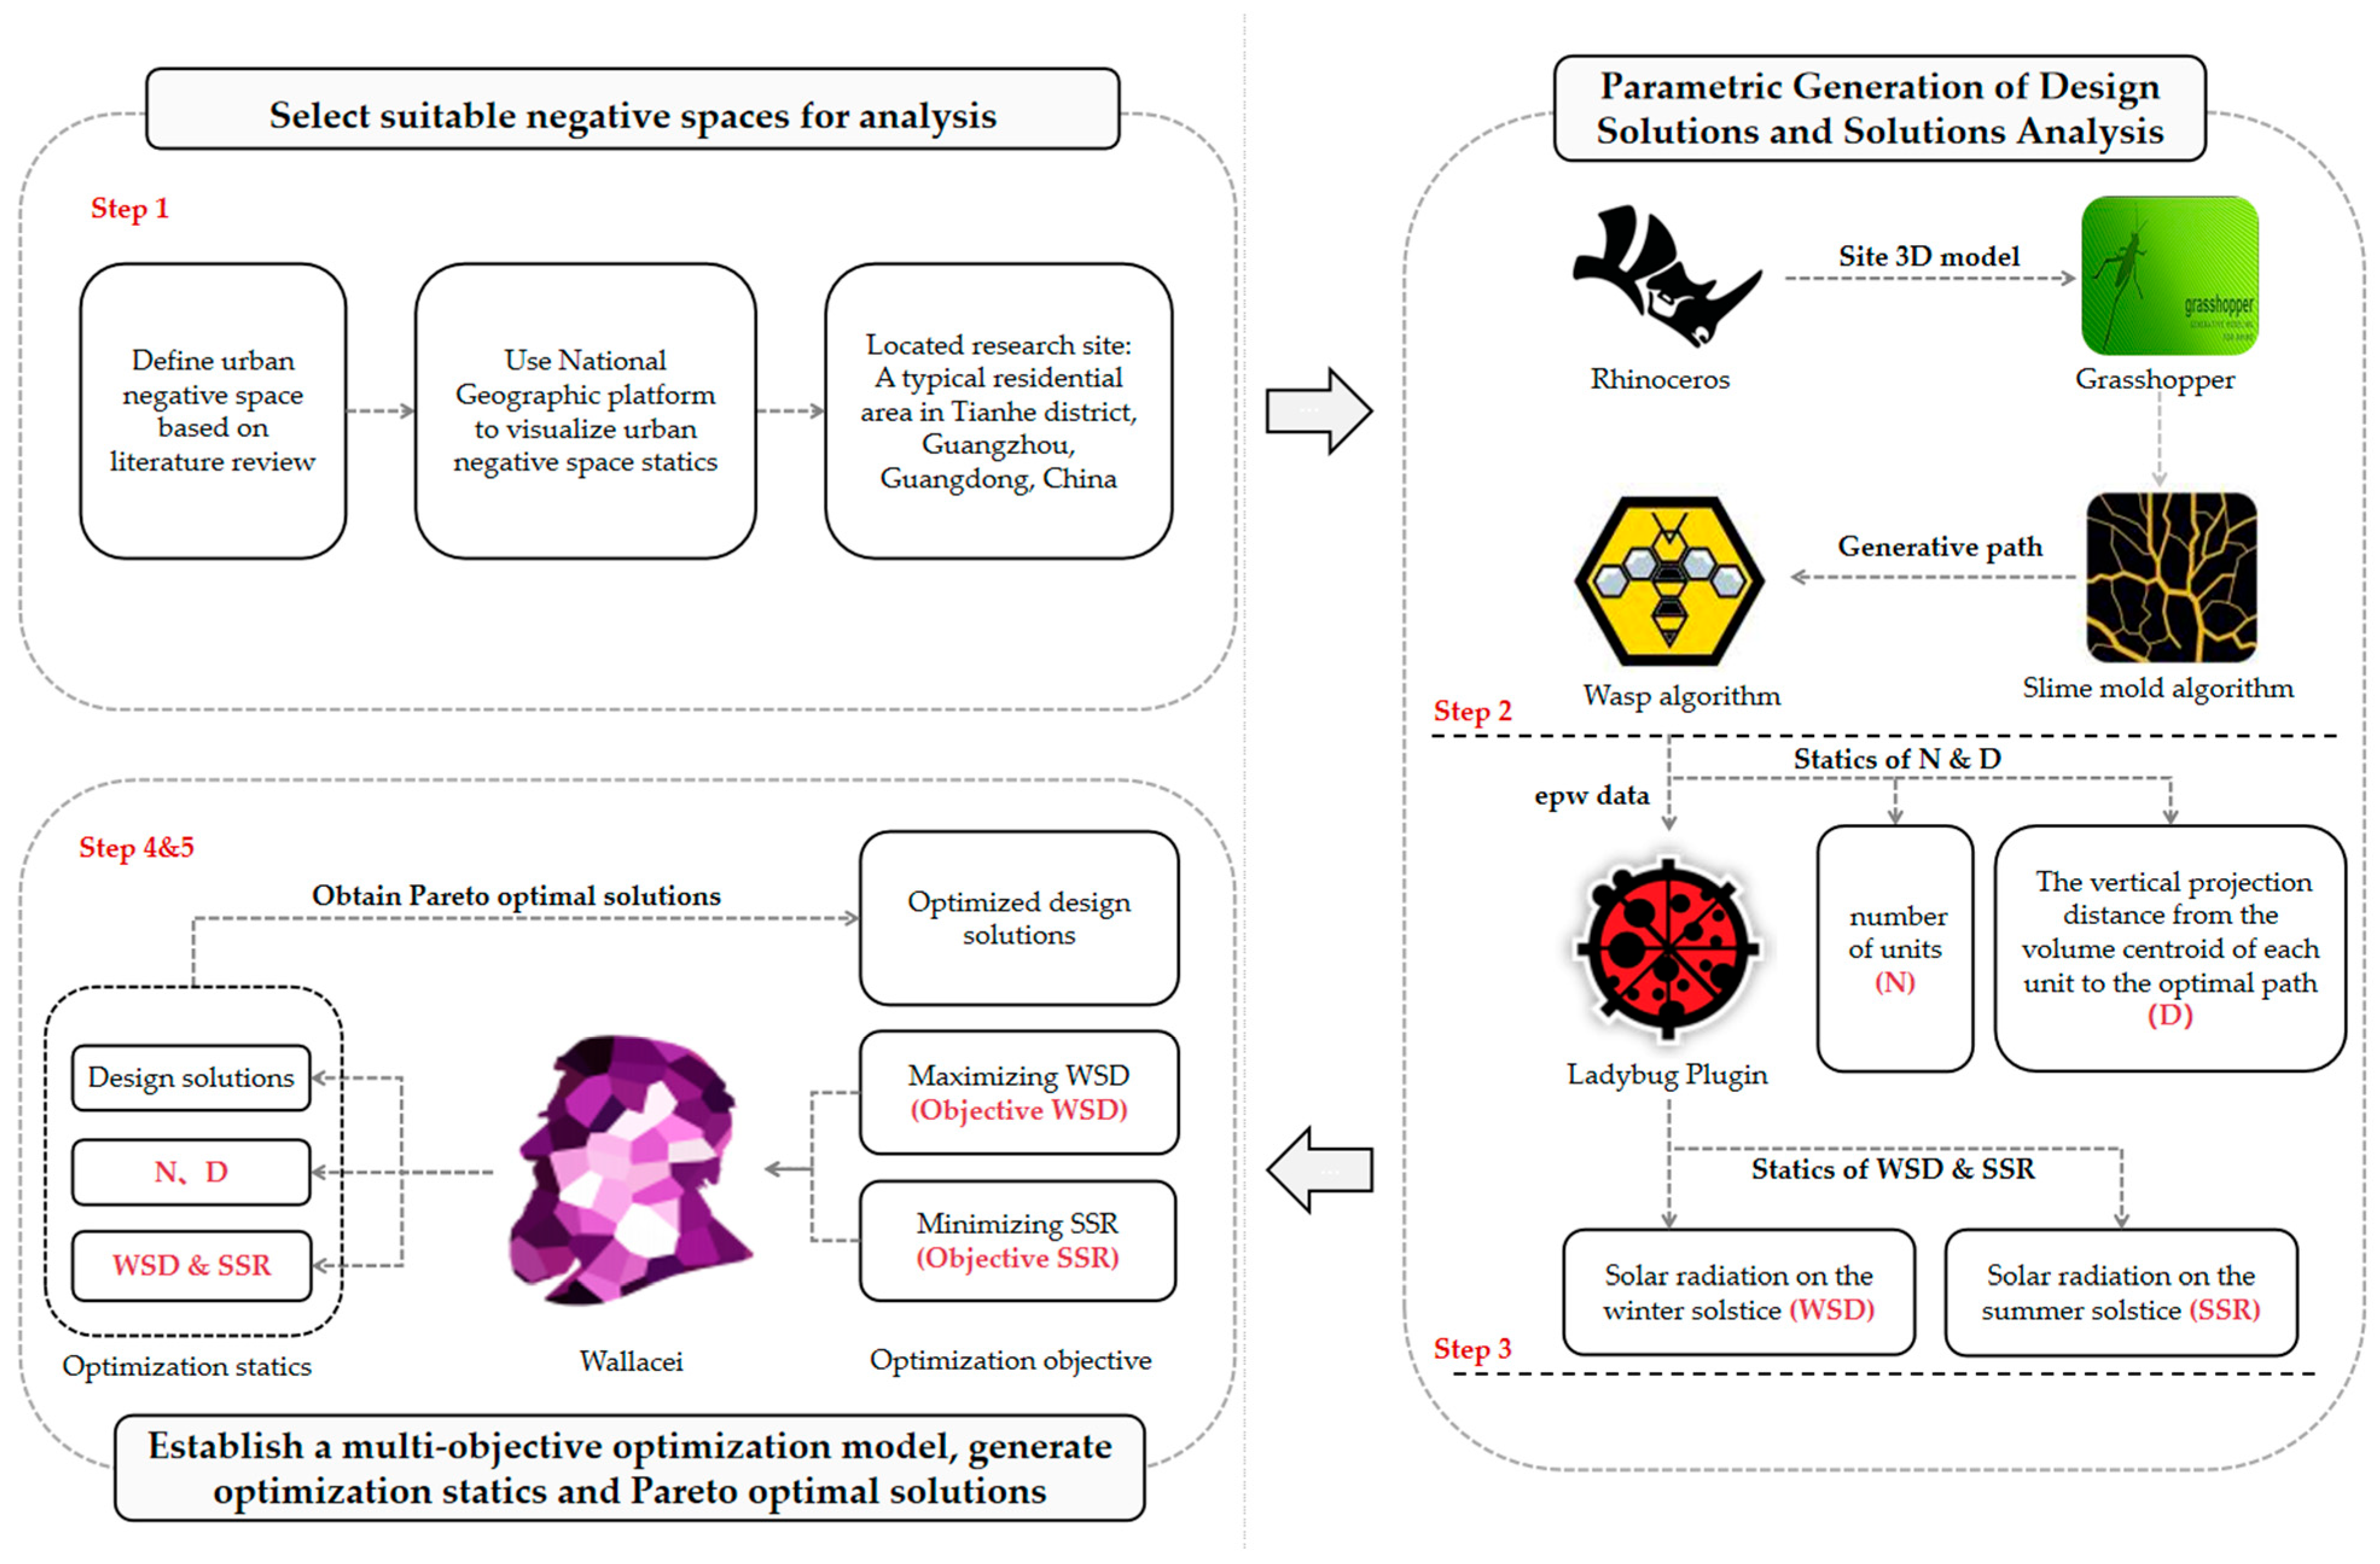
This study uses parametric design methods to optimize negative spaces in high-density urban areas. The specific steps are as follows (
Figure 2):
- (1)
Obtain the building distribution map of the target high-density city from National Geographic. Select suitable negative spaces for analysis based on varying building densities.
- (2)
Use the Slime mould and Wasp algorithms on the Grasshopper platform to generate multiple parametric model scenarios according to site requirements and constraints. The optimization parameters include the number of units (N) and the vertical projection distance from the volume centroid of each unit to the optimal path (D).
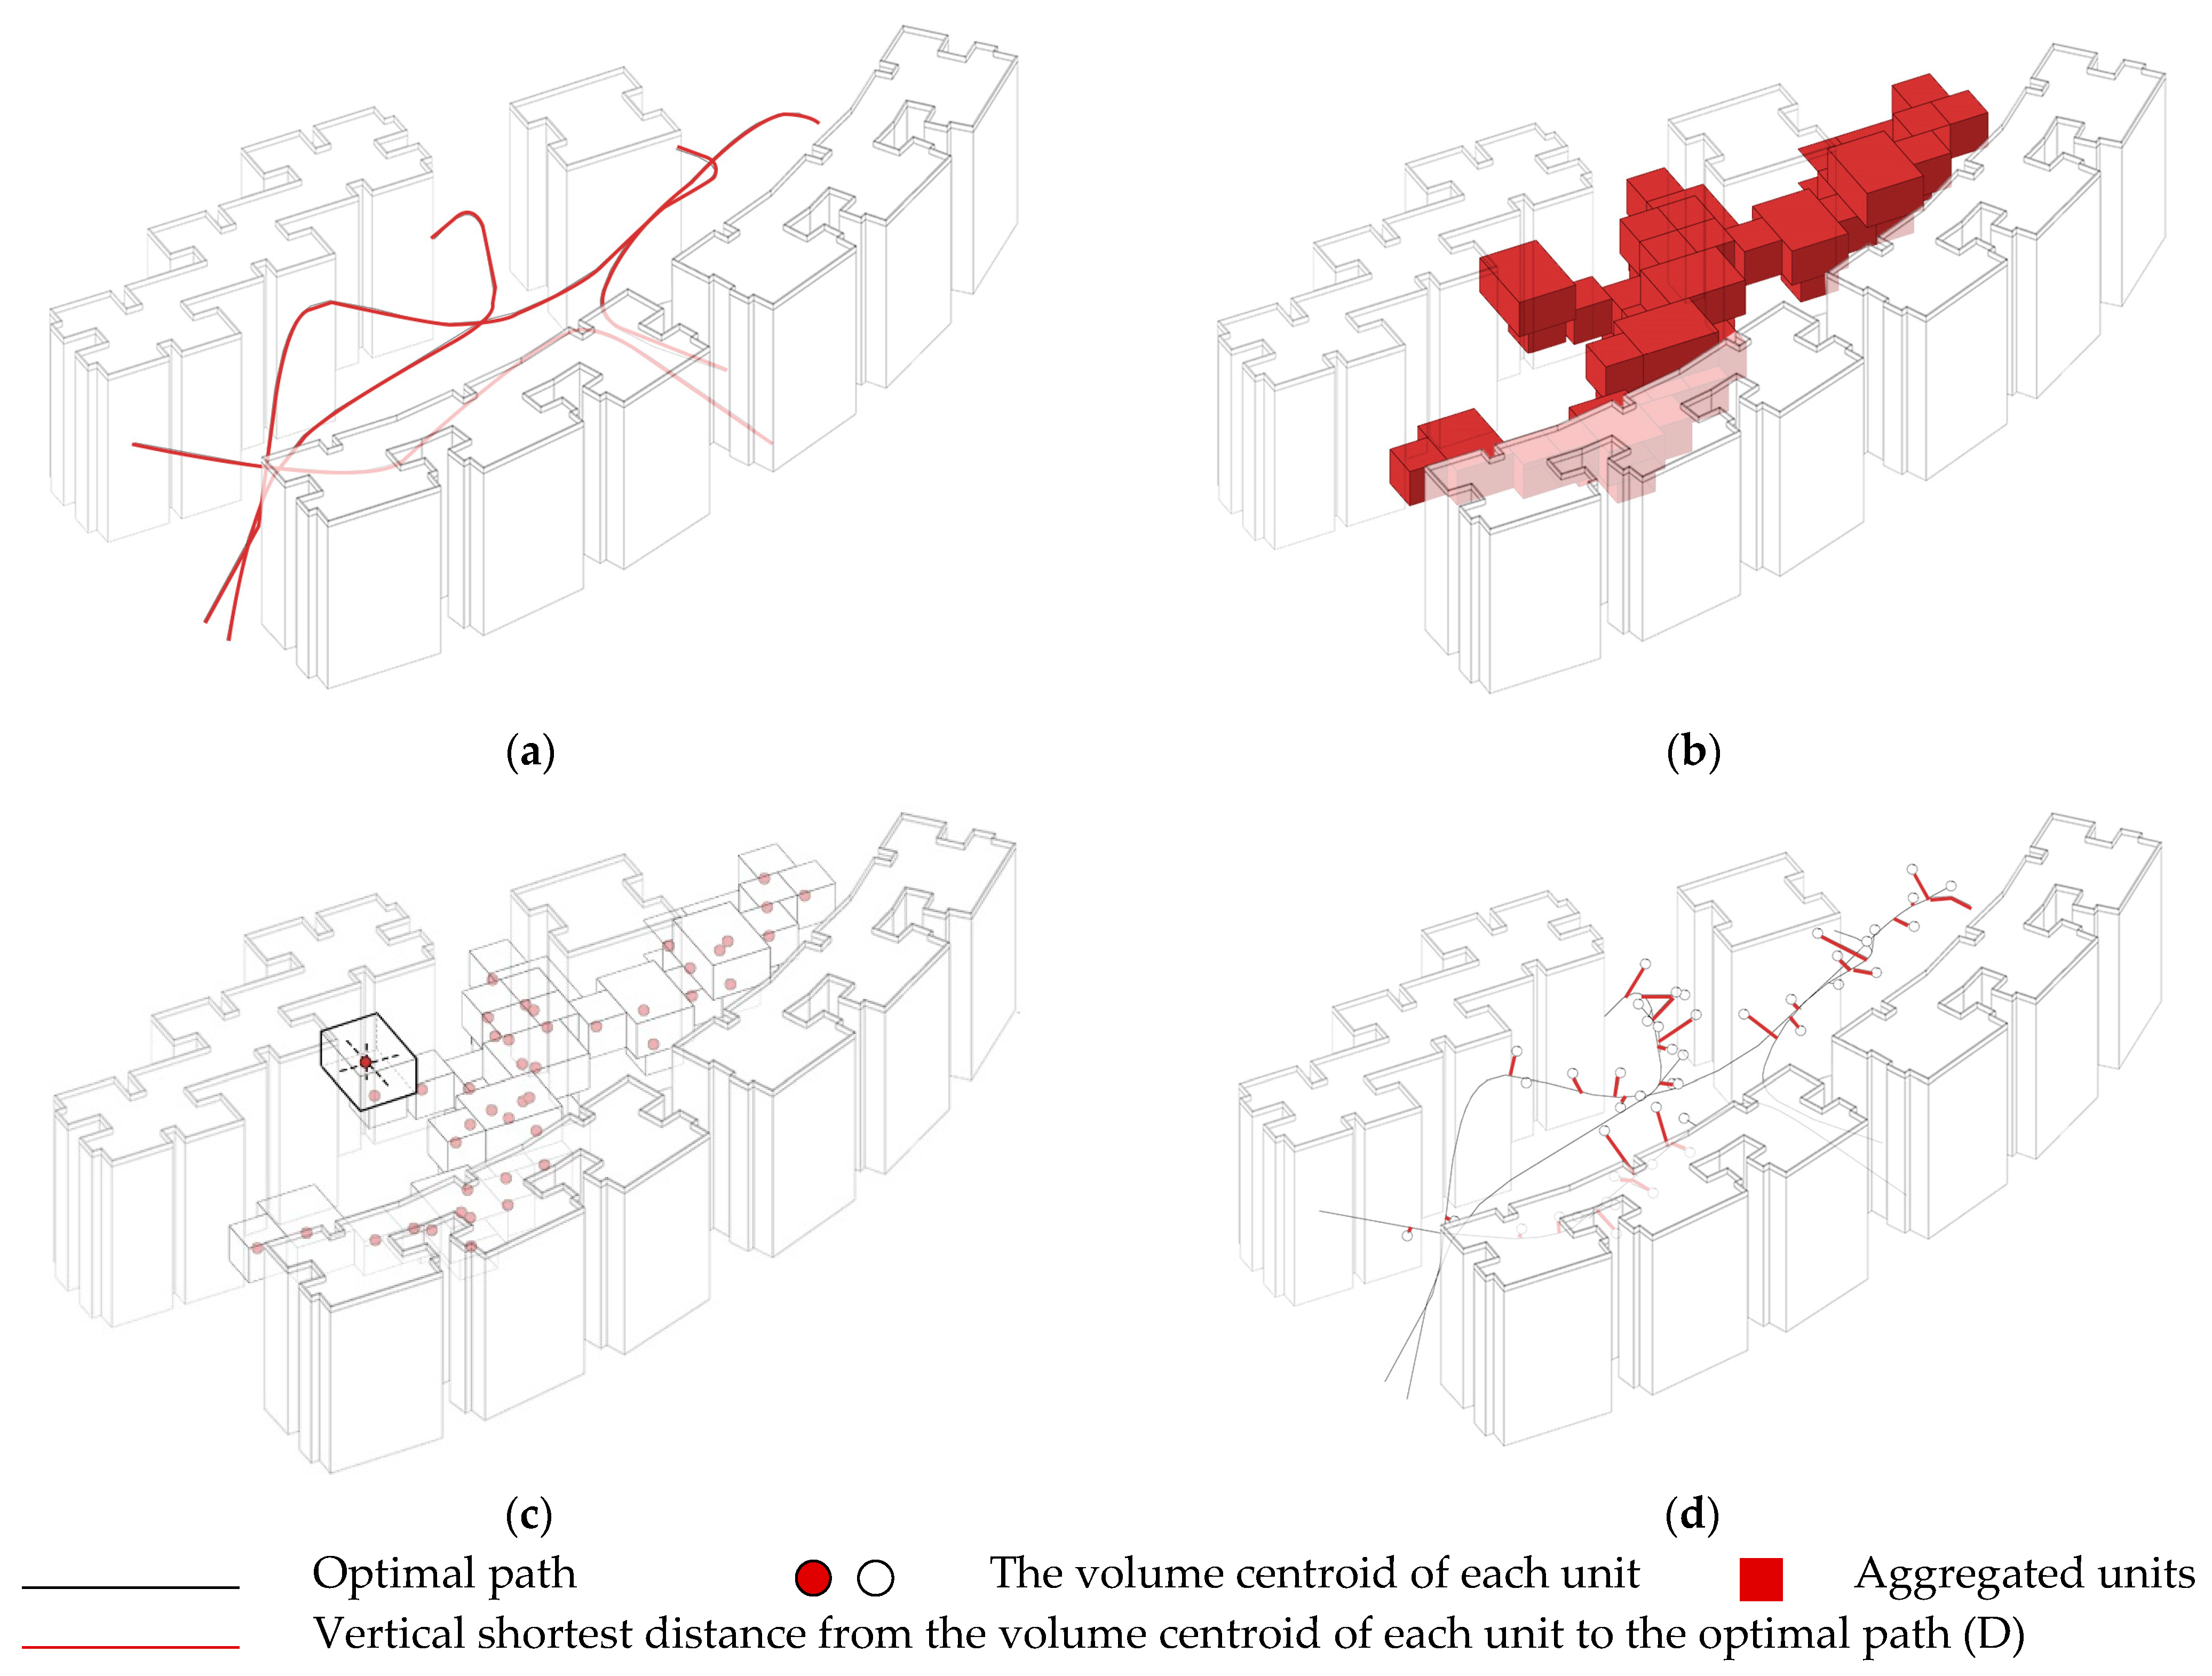
Figure 3a represents the optimal path generated by the slime mould algorithm;
Figure 3b illustrates the aggregated units generated by the Wasp algorithm;
Figure 3c illustrates the volume centroid of each unit;
Figure 3d depicts the vertical shortest distance from the volume center point of each unit to the optimal path.
- (3)
Define optimization performance metrics and parameters. This study’s optimization objective includes maximizing winter solstice sunlight duration (Objective-WSD) and minimizing summer solar radiation (Objective-SSR) for units.
- (4)
Build a model on the Wallacei plugin for two optimization objectives and establish a multi-objective optimization model.
- (5)
Employ a non-dominated sorting genetic algorithm on the Wallacei plugin, configure relevant parameters for multi-objective optimization, and conduct computational analysis. Output the Pareto optimal solution if the results tend towards convergence; otherwise, reconfigure the relevant parameters until a convergence trend appears, and output the Pareto optimal solution.
3.2. Research Scope
3.2.1. Information on Research Site
The assessment and definition of high-density cities typically rely on two indicators: population density and building density [
54]. In 2021, the National Geographic platform analyzed high-density urban areas worldwide (
Table 3). According to the analysis, cities in China such as Guangzhou, Shanghai, and Beijing are categorized as high-density cities.
Guangzhou is one of China’s largest high-density cities at approximately 23°08′ N and 113°19′ E. According to statistics from 2019, the total population of Guangzhou exceeded 14 million, with a population density reaching 19,000 people per square kilometer, second only to Shanghai [
55]. The development of high-density cities has brought about challenges in the inefficient utilization of negative space in buildings, adversely impacting the ecological environment, social harmony, and residents’ quality of life.
Therefore, as the economic hub in southern China, Guangzhou’s urban development model is representative. Studying the issue of negative space in high-density urban areas in Guangzhou can provide a reference for other rapidly developing cities worldwide. Moreover, as a hub of innovation in China, Guangzhou is home to numerous high-tech enterprises and research institutions. Through technological innovation and smart city development, new methods for efficiently utilizing negative space can be explored, driving sustainable development in other high-density cities in China. In conclusion, Guangzhou’s case serves as a demonstration of addressing urban negative space issues and can contribute essential experiences and wisdom to urban development both domestically and internationally.
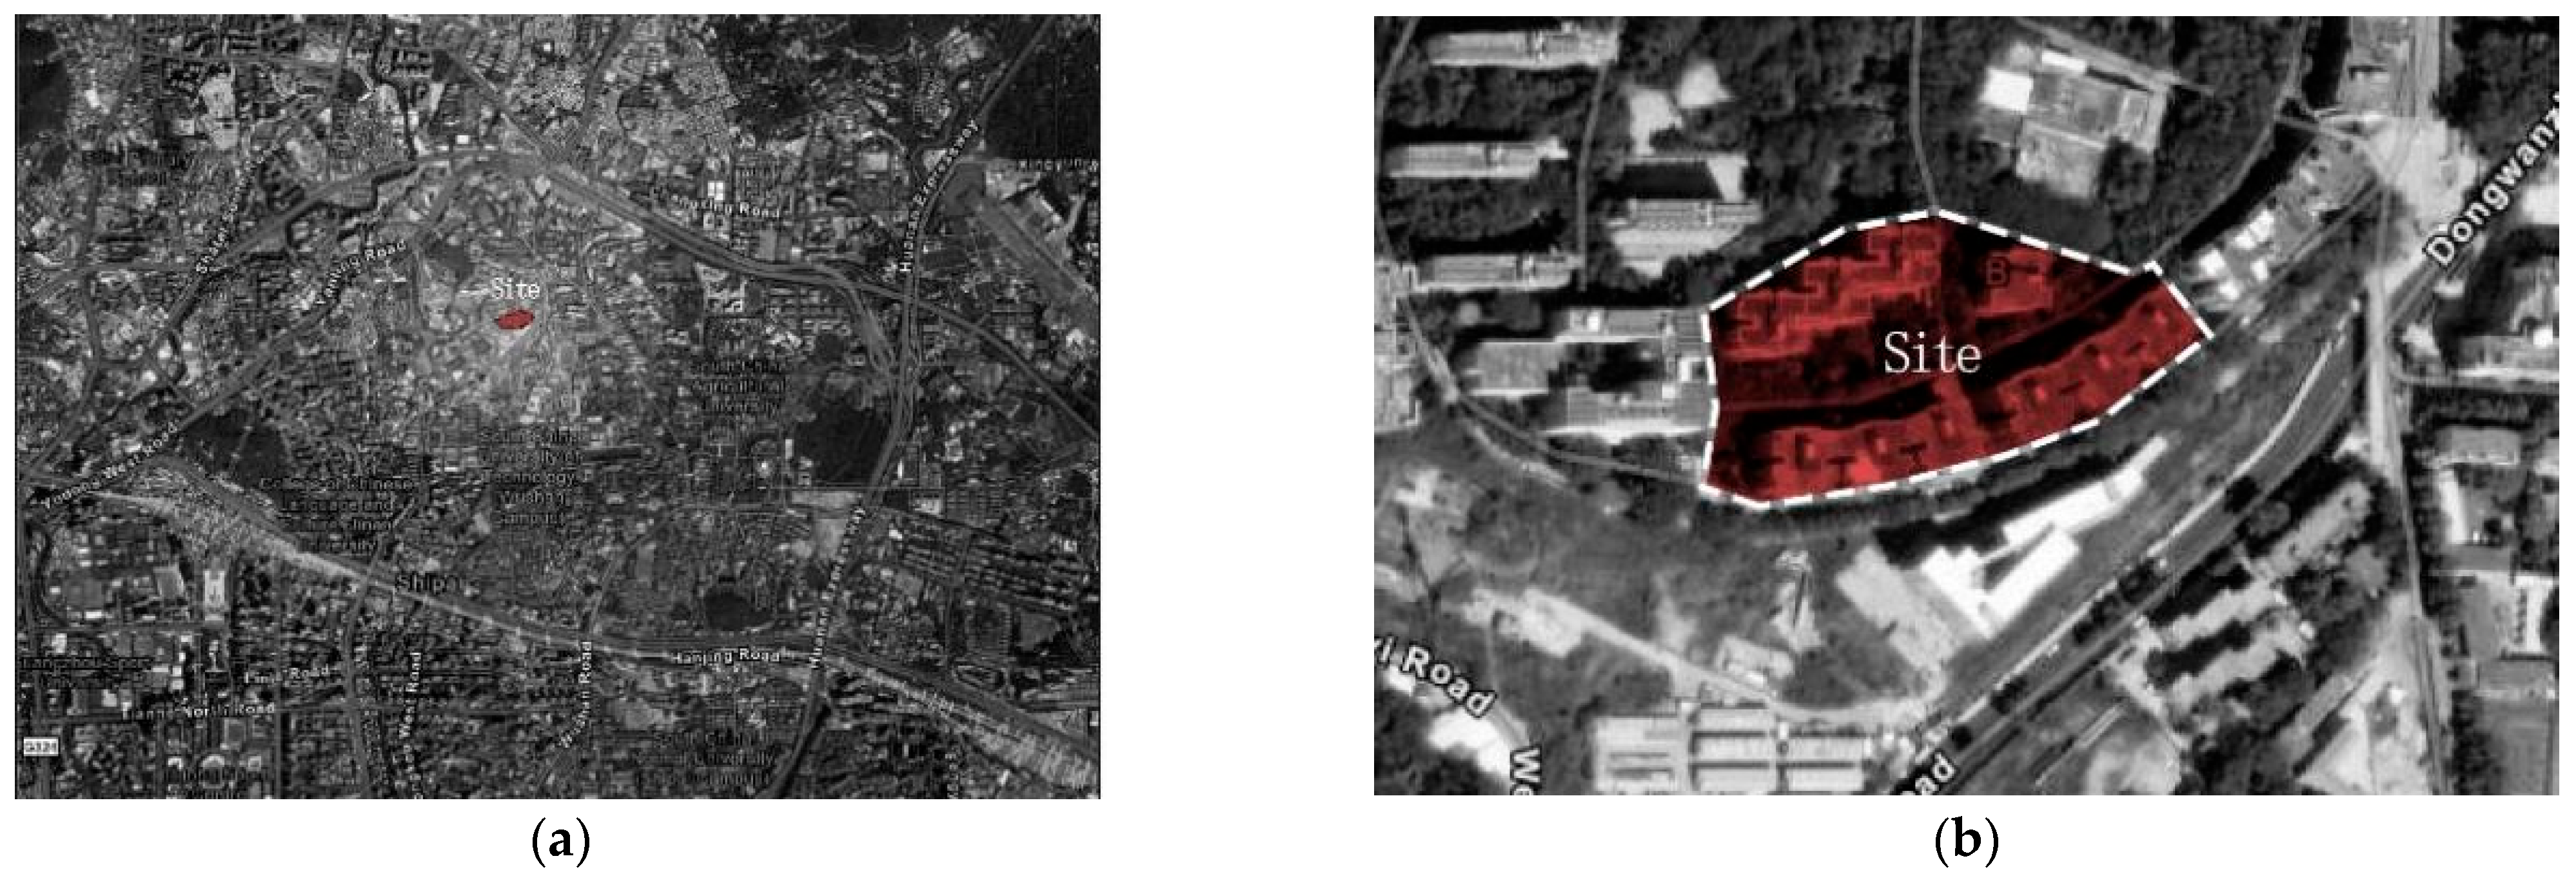
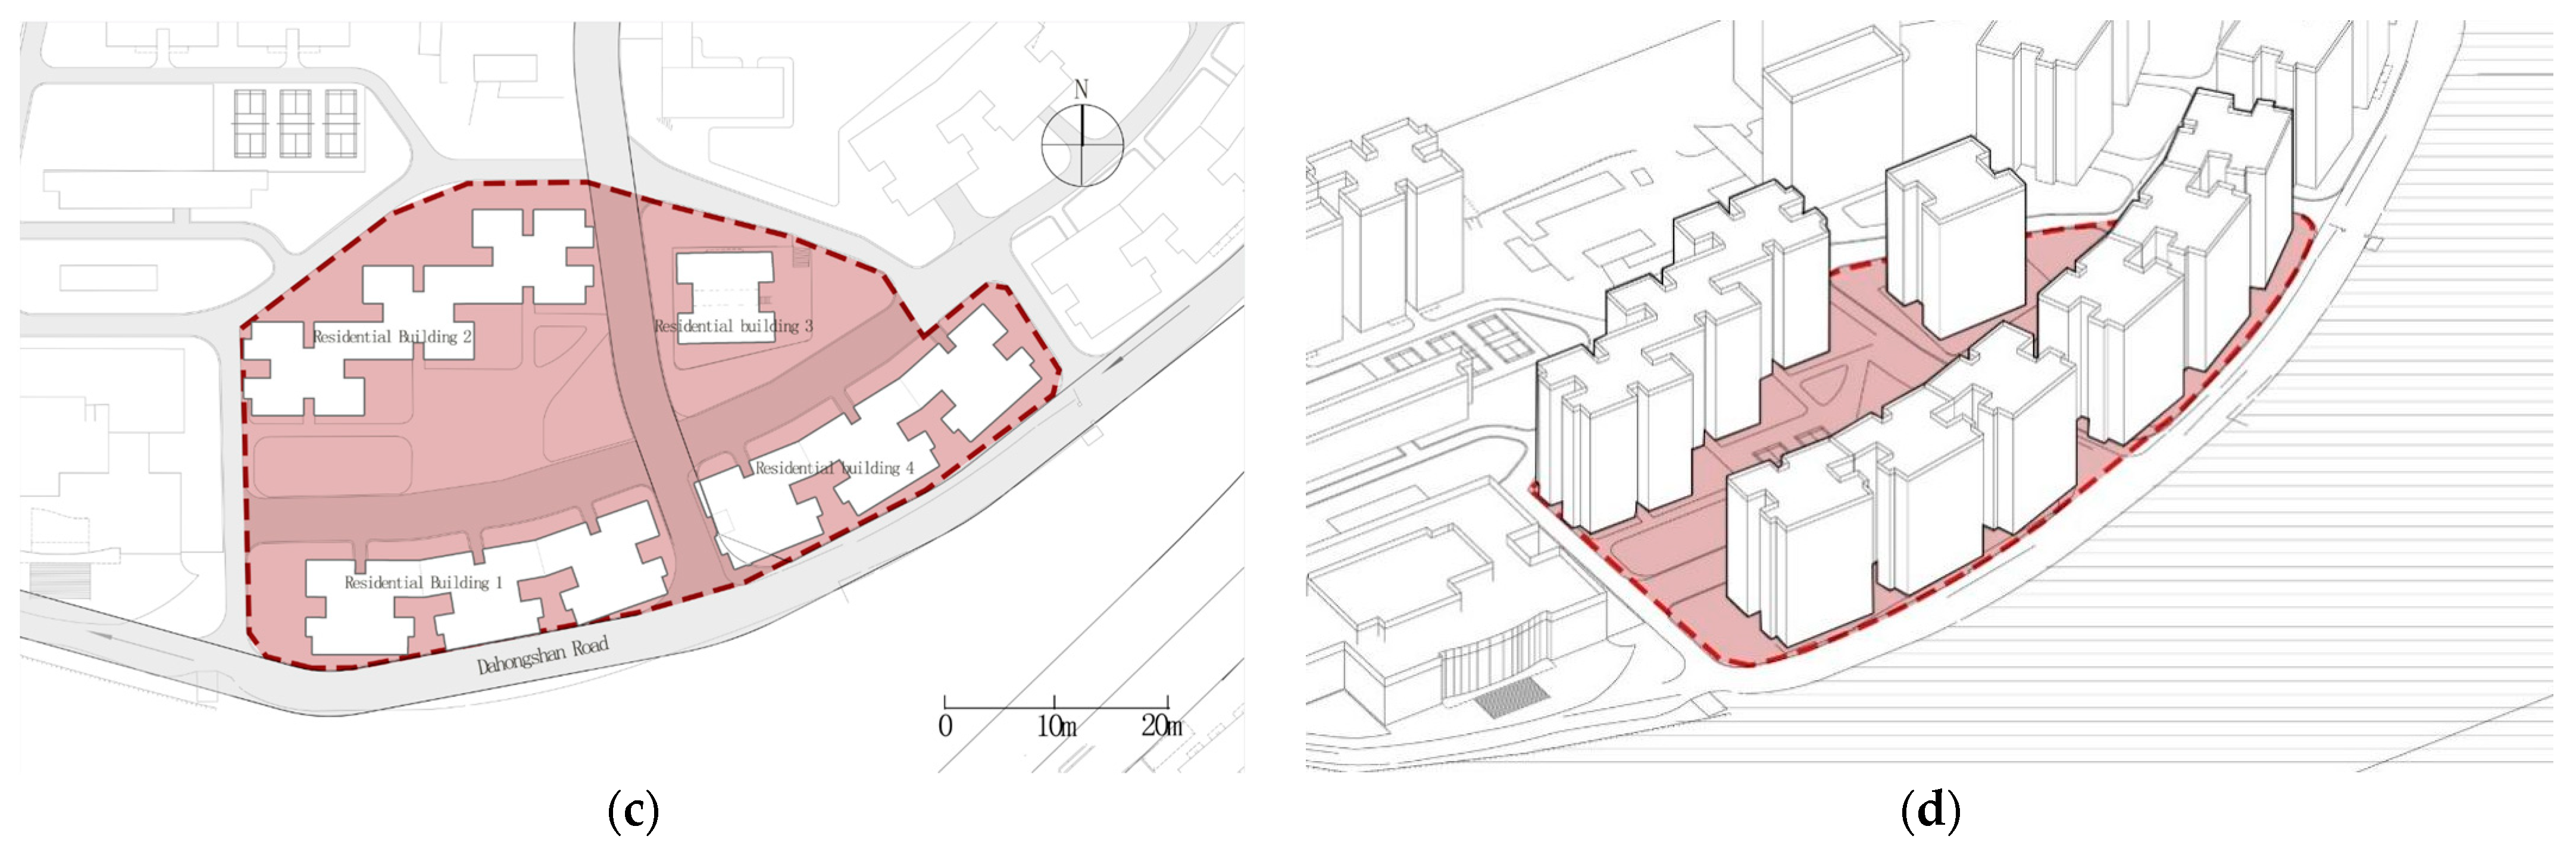
Tianhe District, located in the central area of Guangzhou (
Figure 4a), stands out as one of the city’s most representative high-density residential areas. Its population density reaches 24,000 people per square kilometer, ranking it as one of the highest nationwide. The residential areas in Tianhe District are predominantly high-rise buildings, highlighting prominent issues in the efficiency of negative space utilization in buildings. This study selects a typical residential area in Tianhe District as its research subject, aiming to analyze the current status and issues of optimizing the efficiency of negative space utilization in high-density urban buildings in Guangzhou.
The selected study site is an irregularly shaped area measuring 164 m in length and 98.3 m in width, which is predominantly covered with green vegetation but lacks accessibility and practicality. Surrounding the site are nine-story framed residential structures, with the ground floor serving as an elevated platform that can be utilized as a parking area or commercial space. The remaining eight floors consist of residential units, each with a height of 3 m per floor.
3.2.2. Weather Conditions and Selected Objectives
Guangzhou is in a subtropical monsoon climate zone, characterized by long-lasting summers and a mild yearly climate. The total annual radiation in Guangzhou ranges between 4400 and 5000 MJ/(m
2 × a) [
56].
Excessive solar radiation significantly increases building energy consumption and affects human thermal comfort and health. Therefore, reducing summer solar radiation and building energy consumption should be one of the optimization objectives in Guangzhou. Additionally, negative spaces are often located in the connecting spaces of buildings, which are prone to insufficient sunlight due to shading from surrounding buildings. Inadequate sunlight exposure can lead to mood disorders and weakened immunity in humans. Ensuring adequate sunlight exposure is crucial for maintaining human health and psychological balance. Therefore, increasing sunlight duration in winter should also be an essential optimization objective. Considering these factors, this study selected the minimization of Summer Solar Radiation (SSR) from 1 May to 31 August and the maximization of Winter Solstice Duration (WSD) as two performance objectives for optimization.
3.3. Parameter Preparation before Multi-Objective Optimization
3.3.1. The Optimized Path Generated by the Slime Mould Algorithm
This study used the slime mould algorithm to plan the optimal path between residential buildings in the research site. The slime mould algorithm on the Grasshopper platform contains four core control parameters: environment, path start point, path endpoint, and path travel time. The specific generation steps are as follows: first, based on the site conditions, a 164 m × 98.3 m × 36 m box was established as the simulation environment. Second, the starting and ending points of the path were determined based on the main flow of people and their destination. Finally, the core parameters for the processor were set. The visualized results of the four slime mould paths are shown in
Table 4. Factors considered in selecting the optimal path included the coverage of the path start point and path endpoint, the distance between the optimal path and existing buildings, and the location of concentrated slime mould areas. Path 01 was chosen as the optimal path (
Table 4a).
3.3.2. Multiple Schemes Generated by the Wasp Algorithm
This study refers to Rossi’s research logic, exploring the connection rules and aggregation forms of units in negative spaces [
42]. The core control parameters of the Wasp algorithm include defining units, establishing rules, and conducting aggregation. The steps for generating multiple architectural schemes are as follows: firstly, design spatial units based on the site’s requirements to create basic unit forms. Secondly, formulate connection rules for units of different specifications based on connectivity requirements. Finally, using the optimal path that the slime mould algorithm generates as a foundation facilitates the growth of units to generate multiple parametric schemes.
Define Unit Component
This study adopted a 3 m modular system for the unit dimensions, which coordinates well with the existing buildings and allows various units to self-aggregate. Three types of units labeled A, B, and C were selected, with their dimensions shown in
Table 5.
Setting Connection Rules
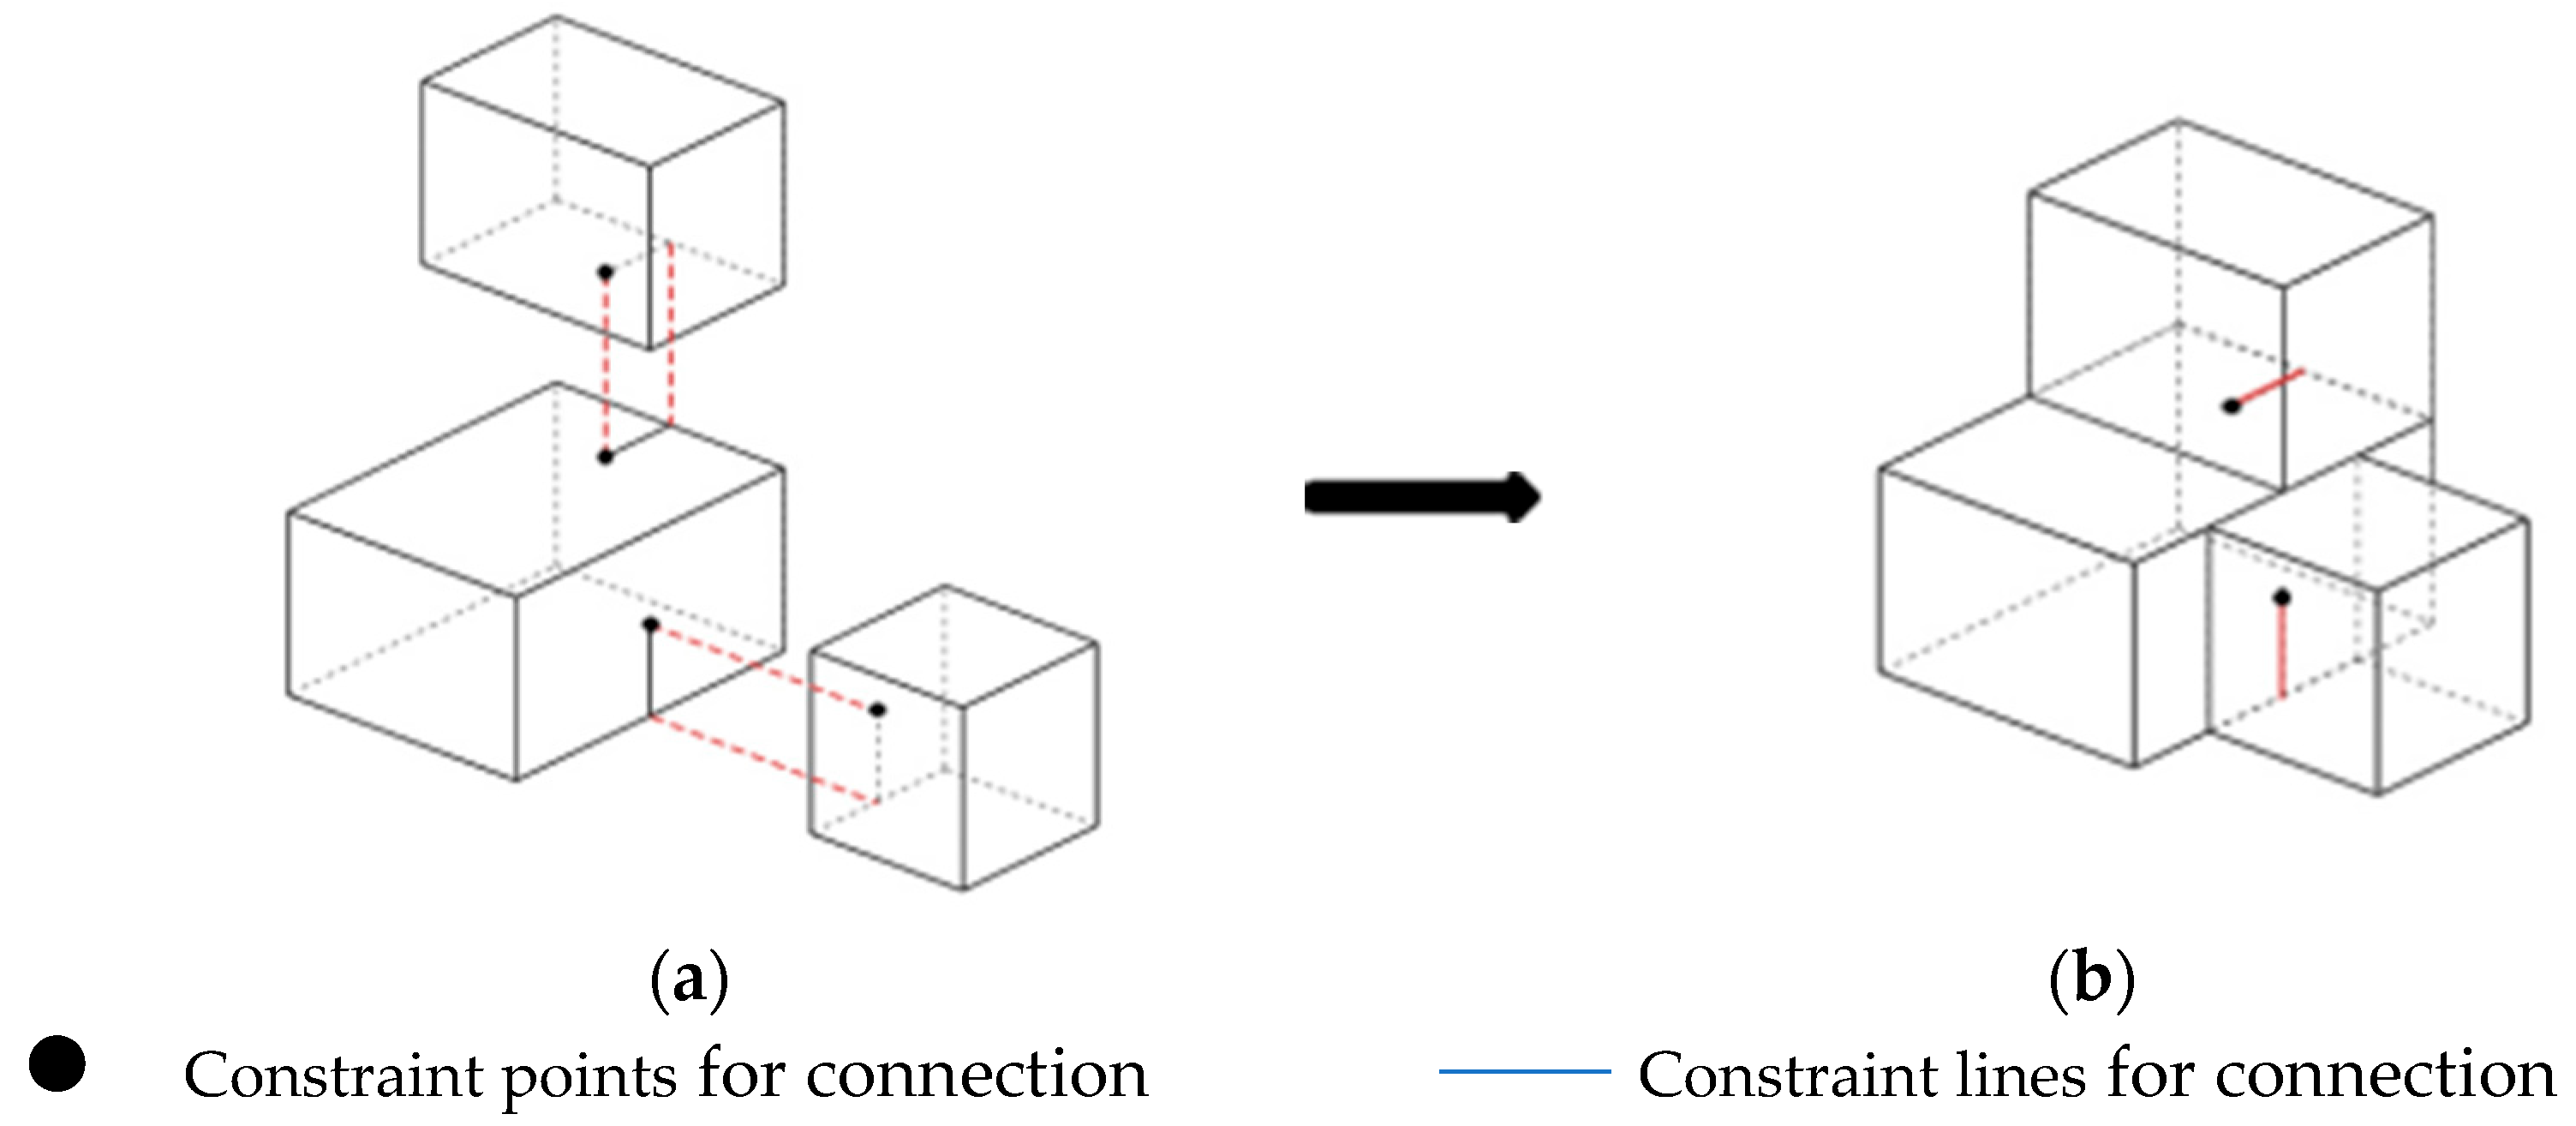
The Wasp plugin requires defining connection rules for units to achieve ordered growth. These rules are primarily established using a line on the unit surface in conjunction with a point as a constraint [
44].
Figure 5 illustrates the point-to-point and line-to-line connection rules between units. These rules ensure that there are no inversions or rotations during the connection of units. The rules for connecting units can be mainly categorized into six types of unit connections (A&A, B&B, C&C, A&B, A&C, B&C).
Table 6 illustrates the possible connections between Unit A and B using the combination of Unit A and Unit B as examples.
Table 6 presents the distribution possibilities of points and lines in Units A and B. For both units, there are four possible distributions labeled as Option 1–8.
Table 7 illustrates the six possibilities of combinations for the eight options between Units A and B. Therefore, following these rules, there are 54 combinations for the A&A, B&B, C&C, A&B, A&C, and B&C pairing solutions.
Units Aggregation
After establishing unit and connection rules, the units will aggregate within the site space (constrained in 164 m × 98.3 m × 36 m) [
43]. Subsequently, the volume centroid of each generated unit is computed, and unit D values in the range of 0.2 to 0.8 are selected. Finally, based on the goals of design optimization, multiple optimized solutions are generated by adjusting the N and D values.
3.3.3. Multi-Objective Optimization Based on the Aggregation Result
Similar to the work of Li et al., this paper also takes sunlight duration and solar radiation as optimization objectives and refers to the relevant parameter settings of the Wallace plugin [
48,
49]. After the aggregation of units, multiple parametrically controlled design solutions can be generated.
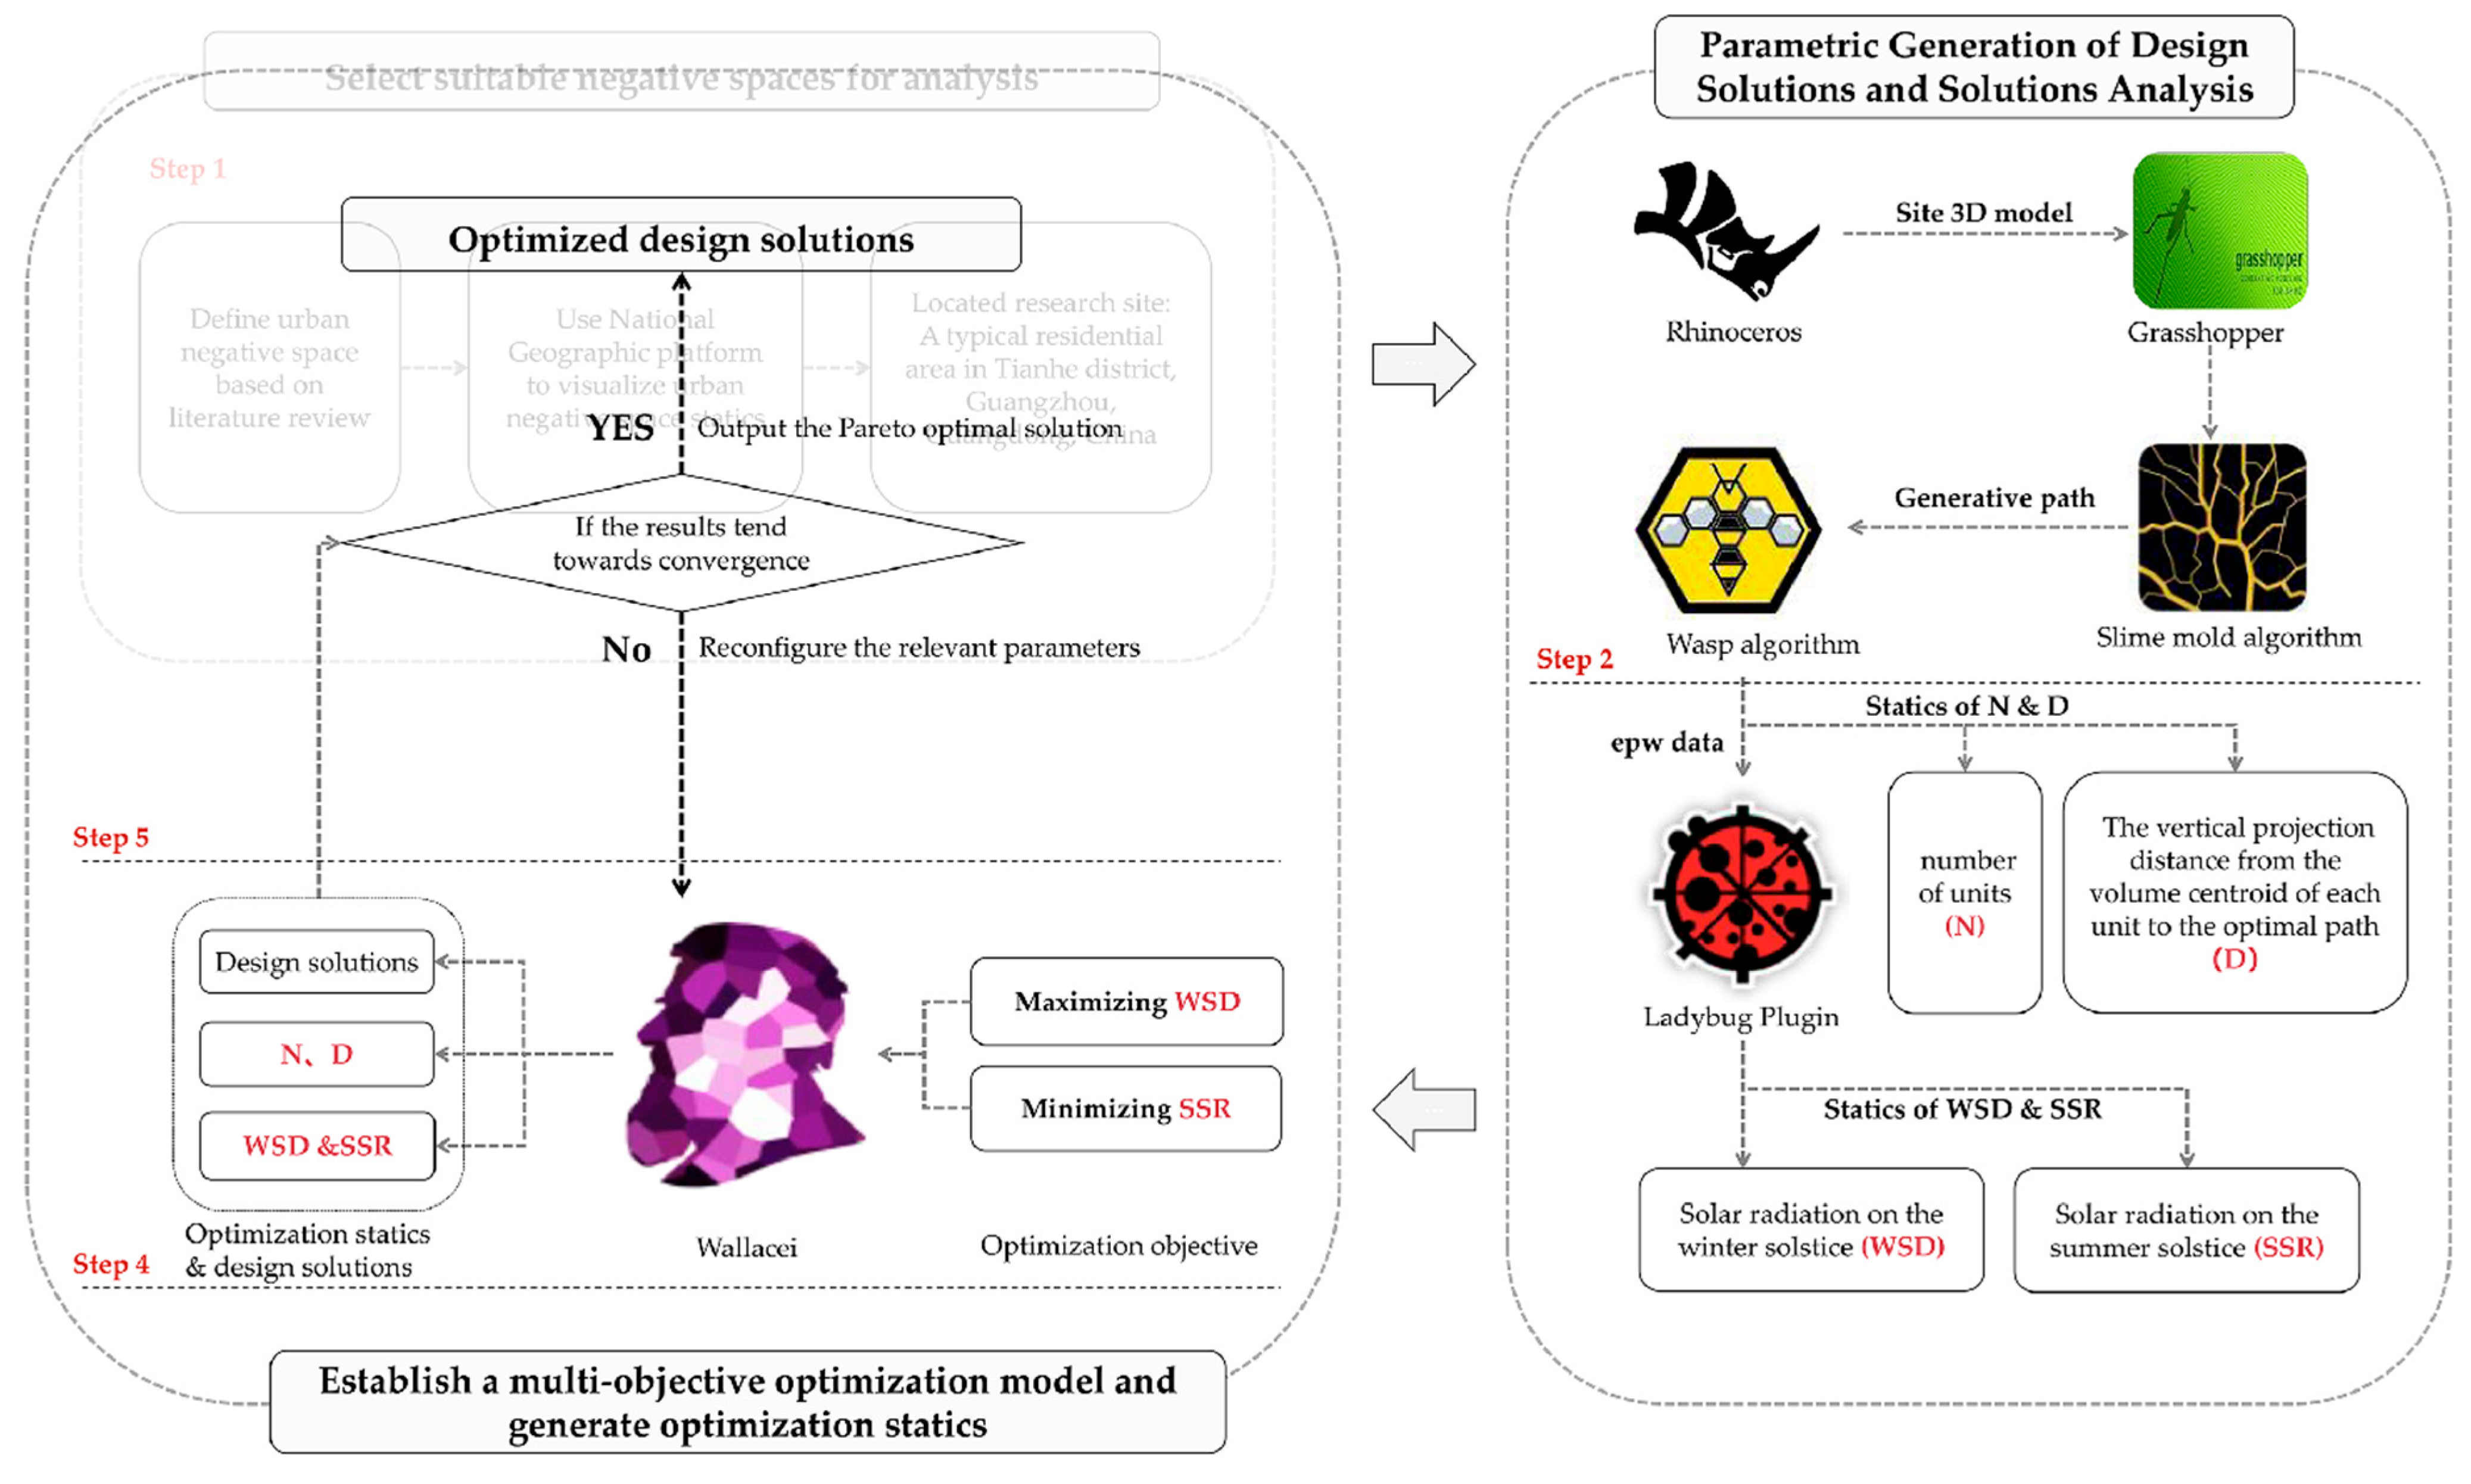
Figure 6 illustrates the steps and tools involved in multi-objective optimization. This article introduces a method for optimizing architectural performance generated in urban negative space based on parametric design, consisting of three main steps.
Firstly, diverse design alternatives are generated through preliminary parameter control logic. The Ladybug plugin is then employed to perform meteorological analysis on each design alternative, obtaining quantified metrics for architectural performance. Secondly, the Wallacei plugin establishes a closed-loop model correlating building form parameters with architectural performance metrics. Lastly, within the Wallacei plugin, optimization objectives and parameters are input, and optimization algorithm parameters such as iteration count, population size, and crossover probability are configured. The multi-objective optimization process is initiated, yielding the optimal design solutions (
Figure 6).
The parametric schemes employ the slime mould algorithm to generate building routes that best meet the residents’ needs, enhancing the efficiency of residents’ transportation. Moreover, the optimization schemes selected based on the Wasp algorithm, combined with prefabricated construction methods, can improve the efficiency of building construction and renovation, restoring vitality to urban negative spaces. Lastly, using the Wallacei plugin, the optimization parameters are integrated with the optimization performance objectives to iteratively select optimal solutions that meet residents’ needs, invigorate negative spaces, and promote green, sustainable, and healthy environments.
4. Simulation Result Analysis
4.1. Multi-Objective Optimization (The First Simulation)
This article employs a Windows computer with an AMD Ryzen 5 5600X 6-Core@3.70 GHz processor (produced by AMD Company in Shanghai, China) and 16 GB RAM for multi-objective optimization. The initial optimization analysis utilized settings of 30 individuals and 60 iterations, generating 1800 solutions and requiring 12 h for completion.
Table 8 provides the parameter settings for the first optimization analysis.
Table 9 analyzes the iterative trends of two optimization objectives.
Table 9a,b depict the trends in the standard deviation (SD) of each objective, respectively. The curves represent the SD of objective values obtained in each iteration, reflecting the dispersion of optimization objective values. A wider curve indicates a larger SD, while a narrower curve indicates a smaller SD.
Table 9c,d illustrate the trends in the average values of optimization objectives throughout the optimization process.
Table 9a shows that the duration of winter solstice solar radiation exhibits a rightward shift as the iterations progress. The blue curve in the graph has a broader range and a flatter slope, indicating an increased dispersion of the winter solstice solar radiation duration with the optimization process. Furthermore,
Table 9c reveals a rapid decrease in the WSD from the 1st to the 10th generation, reaching a minimum. Between the 10th and 60th generations, the WSD experiences fluctuating increases. In
Table 9b, the SSR shows a rightward shift with the progression of iterations. The curve’s width gradually increases, suggesting an increasing dispersion of the objective values.
Table 9d indicates a rapid decrease in SSR from the 1st to the 10th generation, reaching a minimum. Between the 10th and 60th generations, the summer solar radiation undergoes fluctuating increases.
During multi-objective optimization, improvements were achieved for both investigated optimization objectives. However, significant fluctuations were observed in the later iterations. To enhance the reliability and rigor of the experimental results, we will increase the number of iterations and adjust the crossover genetic probability in the next phase of simulation, ensuring the accuracy of the experimental outcomes.
4.2. Multi-Objective Optimization (The Second Simulation)
In the second round of multi-objective optimization experiments, we configured 100 iterations, with 40 individuals participating in each iteration, which resulted in 4000 solutions and took 23 h to complete.
Table 10 provides the parameter settings for the first optimization analysis.
As shown in
Table 11a, with the increase in the number of iterations, the standard deviation of WSD gradually increases, indicating an expanding distribution range of WSD.
Table 11b shows that with the increase in the number of iterations, the curve distribution shifts to the left, the values gradually decrease and approach stability, and the curve width gradually widens, which suggests an expanding distribution range of SSR.
Table 11c shows that the WSD sharply declines to 480 h within the first 15 generations of iterations. Subsequently, from the 15th to the 100th generation, it stabilizes within 433.69 to 577.69 h.
Table 11d shows that the summer solar radiation decreases throughout the iterative process, ultimately fluctuating between 609,218.18 and 712,840.51 kWh/m
2.
The fitness value chart illustrates the variation in optimization objective values for the top ten individuals in each generation. Different-colored lines in the chart represent a different number of iterations, ranging from blue to red in increasing order. From
Table 11e, it can be observed that, concerning the winter solstice solar radiation duration, the variation ranges between 243.38 and 3787.88 h.
Table 11f shows that, in the case of SSR, the optimization objective values exhibit significant fluctuations with increasing iteration numbers, and the variation range is broad.
As depicted in the parallel coordinate plot (
Table 11g), each vertical axis represents the range of variation for an optimization objective, and each line segment represents a solution. The color of the line segments transitions from blue to red, indicating the progression of iterations. The graph shows WSD values are primarily distributed between 1968.78 and 3181.38 h. As the iterations progress, the values continuously increase, trending towards convergence. The values for SSR are evenly distributed across the entire range, and with the progression of iterations, the values fluctuate throughout the range without fully converging.
The first and second simulations changed three parameters: generation size, generation count, and crossover probability. These changes resulted in greater diversity in solutions, better convergence, and reduced computational complexity of the optimization process. The results of the first and second simulations show that WSD initially decreases and then increases with the number of iterations, while SSR gradually decreases. Finally, both values oscillate within a certain range until complete convergence.
5. Discussion
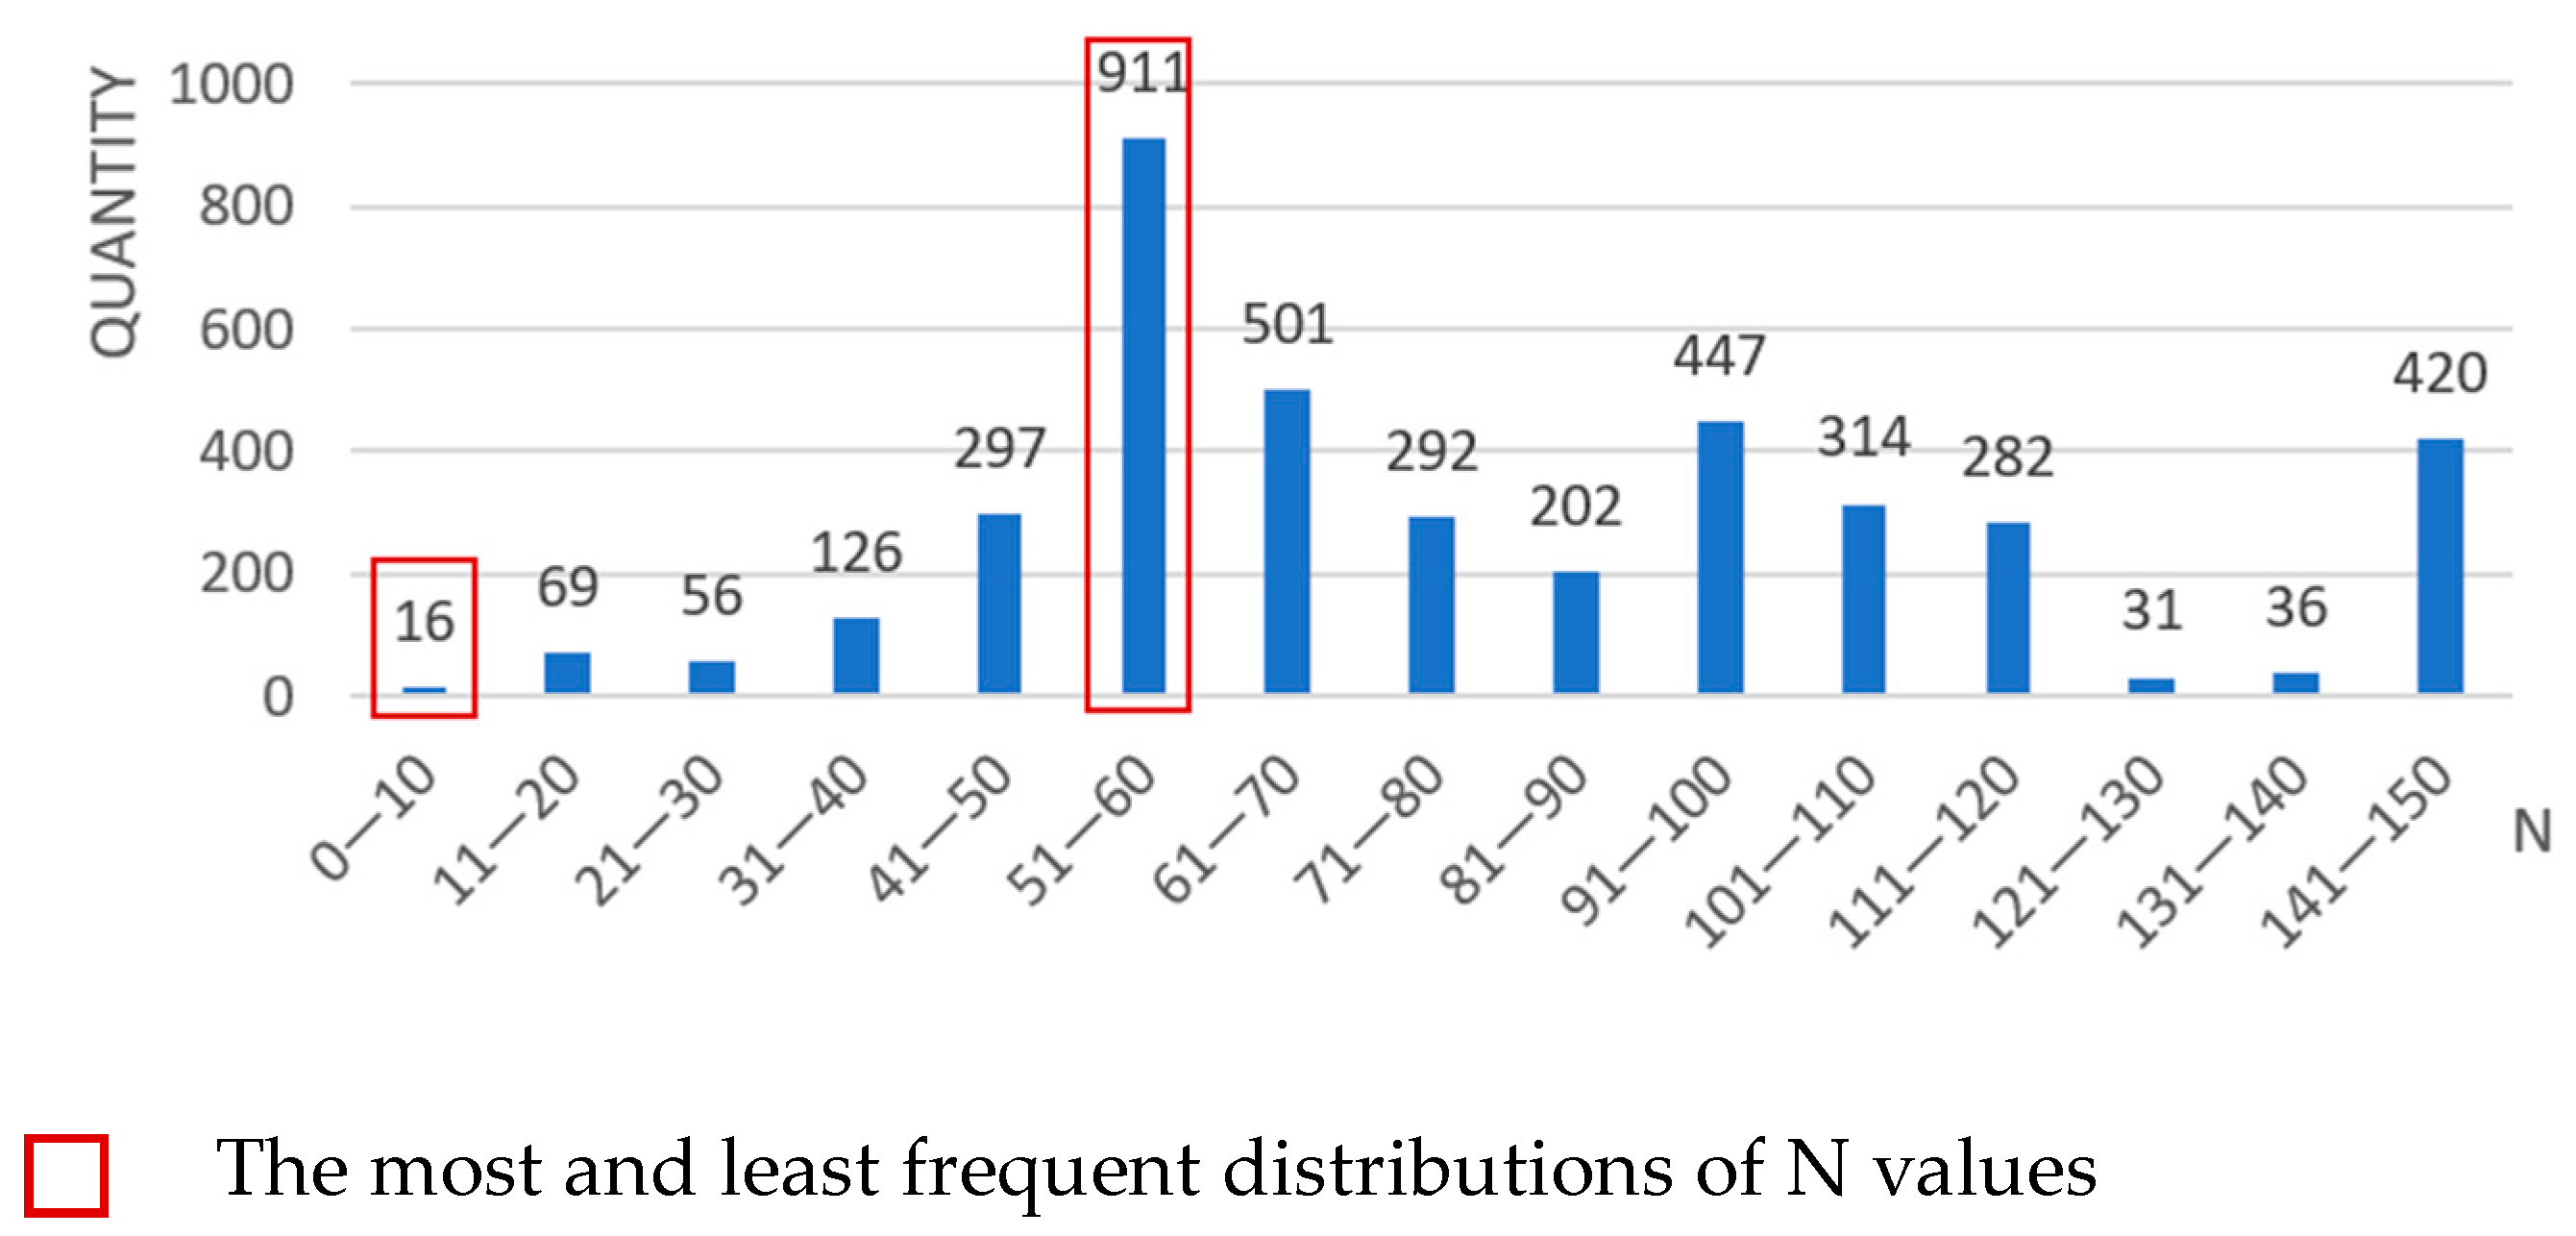
Figure 7 illustrates the numerical distribution of the unit quantity (N) for all solutions during the optimization process. The graph shows that the distribution of N is highest in the range of 50–60, totaling 911 occurrences. The following most frequent distributions are observed in 61–70, 91–100 and 141–150, exceeding 400 solutions. The least frequent distribution is in the range of 0–10, with only 16 solutions.
Figure 8 illustrates the spatial distribution of all optimized solutions during the optimization process. It reflects the relationship between the N and the D values along the optimal path. Firstly, when the D value is small (0.2–0.4), the N value is concentrated between 40 and 110, indicating that the optimal path has a significant impact on the distribution of N values. When the D value is significant (0.6–0.8), N is uniformly distributed within the variable range, indicating that the optimal path minimally impacts the N value distribution.
Figure 9 depicts the D value distribution of the unit cell center point from the optimal path for all solutions during the optimization process. It can be observed that solutions with a D value between 0.2–0.3 and 0.61–0.8 are concentrated, with the most occurrences in the 0.2–0.3 range, totaling 1577 occurrences. Solutions with a D value between 0.41 and 0.6 are less frequent, indicating suboptimal performance of the optimization algorithm for distances within this range.
Pareto to Optimal Solution Analysis
Fifteen Pareto optimal solutions were selected from the 100th generation among the 4000 optimization results for the statistical analysis to investigate the solutions’ morphological evolution and performance variations (
Table 12).
Statistical analysis was conducted on the optimization objectives and variables data for the 15 Pareto optimal solutions from the 100th generation. The scatter plot in
Figure 10a shows a positive correlation between the optimization objectives WSD and SSR among the 15 Pareto optimal solutions.
Figure 10b reveals variations in WSD statics for different optimal solutions with the same N value. Therefore, one can filter based on the relationship between WSD and N to select Pareto optimal solutions that meet the requirements. In the 40 < N < 80 range, the 3997th solution is chosen as the optimal solution. For 81 < N < 120, the 3977th solution is selected as the optimal solution, and for 121 < N < 150, the 3968th solution is chosen as the optimal solution.
Table 13 illustrates optimal solutions for the three intervals (40 < N < 80, 81 < N < 120, and 121 < N < 150) that meet the optimization objective WSD and objective SSR. From the numerical values of the optimization parameters and objectives, it can be observed that as N increases, both WSD and SSR increase, though the rate of increase varies. The axonometric view indicates a high similarity in the distribution characteristics of units in the upper regions of the three proposed solutions, suggesting that the optimization algorithm has identified building layouts that satisfy performance goals, providing architects with valuable references.
For different design proposals, there are two main criteria for selecting the best solution: (1) when the values of N and D are close, designers can prioritize solutions with larger WSD and smaller SSR to optimize the building’s performance and human comfort; (2) when the values of WSD and SSR are close, designers can prioritize solutions with larger N and smaller D to provide more public spaces for residents, enhancing the vitality of negative spaces. Additionally, the criteria for selecting the best solution and its impact on architectural design decisions may vary in different climatic regions. For example, in cold regions, increasing winter solar radiation appropriately plays an important role in the comfort of indoor spaces and human beings, and the optimization objective should be to increase winter solar radiation.
6. Conclusions and Future Work
This study focuses on the negative spaces within urban environments, employing parametric design on the Grasshopper platform and Wallacei multi-objective optimization analysis. It establishes an integrated process for generating designs and simulating performance in negative spaces, providing designers with references for optimizing urban negative spaces through architectural design and performance analysis.
The case study was conducted in a high-density residential area in Guangzhou, using WSD and SSR as optimization objectives for multi-objective design. A total of 4000 solutions were generated, and the analysis is based on the 15 Pareto optimal solutions from the 100th generation. The results indicate a significant influence of the quantity of unit cells on WSD and SSR. Within a certain range of N value, the study demonstrates the potential to achieve a balance between the optimization objectives of WSD and SSR through the generation of different design alternatives, resulting in preferred solutions. Additionally, this study focused on the hot-summer and warm-winter regions, with the optimization objectives of reducing SSR and increasing WSD. When the study area is in a cold region, the optimization objectives will change to increase winter solar radiation and the duration of sunlight on the winter solstice. The change in optimization objectives will lead to changes in the criteria for selecting the best solution and the architectural form. In the future, architects can choose corresponding solutions based on the needs of different regions and user groups.
While this study has achieved certain results, it also has limitations that need improvement in future work. Specifically, the limitations include the selection of only N and D values as optimization parameters without considering other variables that may affect the architectural design, such as the proportion and orientation of units. The study only addresses multi-objective optimization analysis for the light environment without considering other performance indicators such as thermal and wind environments, limiting the adaptability of the optimization results. Future research should focus on the interaction between solutions and existing buildings. Through on-site measurements and data analysis, the post-implementation effects of solutions should be continuously evaluated, and areas for improvement should be identified to establish an effective feedback mechanism. Continuously adjusting and improving design solutions based on collected feedback will create a dynamic iterative improvement process. Such a mechanism will help ensure that design solutions can adapt to constantly changing environmental and functional requirements, achieving more efficient and sustainable urban space utilization.
Author Contributions
Conceptualization, W.B.; Methodology, W.B.; Software, W.B.; Validation, W.B.; Formal analysis, W.B., Y.H. and Y.Y.; Investigation, W.B., L.W. and Y.Y.; Resources, L.W.; Data curation, Y.W. and Z.Q.; Writing—original draft, W.B.; Writing—review & editing, W.B. and Y.H.; Visualization, W.B., Y.W. and Y.H.; Supervision, Z.Q. All authors have read and agreed to the published version of the manuscript.
Funding
This research received no external funding.
Data Availability Statement
Data is contained within the article.
Conflicts of Interest
The authors declare no conflict of interest.
References
- Meng, L.; Zhu, C.; Wen, K.-H. Research on Constructing a Healing Environment for the Street Spaces of a High-Density City: Using Street Spaces in Macao’s Old City Area. Int. J. Environ. Res. Public Health 2020, 17, 4767. [Google Scholar] [CrossRef]
- Thilakaratne, R. Designing Liveable Urban Open Spaces in High Density Cities. IOP Conf. Ser. Earth Environ. Sci. 2019, 297, 012049. [Google Scholar] [CrossRef]
- Wang, Q.; Li, L. Research on the Remedying Strategy of Negative Space under the Concept of “Urban Double Repairs”: A Case Study of the Central Downtown Linear Negative Space of Kunming. Urban Archit. 2018, 89–92. [Google Scholar] [CrossRef]
- Liu, S.; Huang, G. Hong Kong New Town Sustainability Analysis from the Perspective of Low-Carbon Eco-City—Taking Tseung Kwan O New Town as an Example. IOP Conf. Ser. Earth Environ. Sci. 2018, 108, 042007. [Google Scholar] [CrossRef]
- Zhao, L. Research on the Strategy of Negative Space Optimization of University Campus Based on POE. Master’s Thesis, Dalian University of Technology, Dalian, China, 2021. [Google Scholar]
- Bissoonauth, C.; Herr, C.M.; Fischer, T. Sustainable Architecture for Future High Density Cities: An Applied Design Approach. KnE Soc. Sci. 2019, 559–571. [Google Scholar] [CrossRef]
- Available online: http://Hypcup.Uedmagazine.Net/ (accessed on 17 October 2023).
- Available online: http://Hypcup.Uedmagazine.Net/HYPCUP/2019/Result.Html (accessed on 18 October 2023).
- Available online: http://Www.Archcollege.Com/Archcollege/2021/01/48804.Html (accessed on 16 October 2023).
- Hu, L.; Yan, J.; Zhu, Y.; Deng, J.; Chen, L.; Lu, S. Research on the Sustainable Design of Commercial Street Space Based on Importance Performance Analysis. Buildings 2022, 12, 2096. [Google Scholar] [CrossRef]
- Baldissara, M.; Perna, V.; Saggio, A.; Stancato, G. Plug-In Design—Reactivating the Cities with Responsive Micro-Architectures. The Reciprocal Experience. In ShoCK! Sharing of Computable Knowledge! Vol. I & II. Proceedings of the 35th International Conference on Education and Research in Computer Aided Architectural Design in Europe-eCAADe 2017; Gangemi Editore: Rome, Italy, 2017; pp. 571–580. [Google Scholar]
- Feng, D.; Tu, L.; Sun, Z. Research on Population Spatiotemporal Aggregation Characteristics of a Small City: A Case Study on Shehong County Based on Baidu Heat Maps. Sustainability 2019, 11, 6276. [Google Scholar] [CrossRef]
- Lv, G.; Zheng, S.; Hu, W. Exploring the Relationship between the Built Environment and Block Vitality Based on Multi-Source Big Data: An Analysis in Shenzhen, China. Geomat. Nat. Hazards Risk 2022, 13, 1593–1613. [Google Scholar] [CrossRef]
- Li, S.; Chen, H.; Wang, M.; Heidari, A.A.; Mirjalili, S. Slime Mould Algorithm: A New Method for Stochastic Optimization. Future Gener. Comput. Syst. 2020, 111, 300–323. [Google Scholar] [CrossRef]
- Hu, J.; Wang, Z.; Chen, W. A Study on Automatic Form Optimization Procedures of Building Performance Design Based on “Ladybug+Honeybee”. IOP Conf. Ser. Earth Environ. Sci. 2020, 531, 012020. [Google Scholar] [CrossRef]
- Yoshinobu, A. Exterior Space Design; China Building Industry Press: Beijing, China, 1985. [Google Scholar]
- Jones, H. Exploring the Creative Possibilities of Awkward Space in the City. Landsc. Urban Plan. 2007, 83, 70–76. [Google Scholar] [CrossRef]
- Roger, T. Search of Lost Spaces: A Theory of Urban Design; China Architecture and Architecture Press: Beijing, China, 2008. [Google Scholar]
- Liu, X.; Zhang, Y. The Revitalization of Urban Negative Space. Urban Archit. 2011, 6, 90–96. [Google Scholar]
- Sheng, J.; Xu, H.; Zheng, J.; Luo, M.; Zhou, X. Commercial Value Assessment of “Grey Space” under Overpasses: Analytic Hierarchy Process. Adv. Civ. Eng. 2018, 2018, 4970697. [Google Scholar] [CrossRef]
- Shi, R.; Wang, X.; Huang, C.; Liang, S. Research on Activation Design of Street Leftover Spaces on the Main Island of Macao Based on Industry 4.0 and Propagation Models. Wirel. Commun. Mob. Comput. 2022, 2022, 2128679. [Google Scholar] [CrossRef]
- Qin, L. Types and Countermeasures of “Negative Space” in Modern Cities. Chongqing Archit. 2014, 13, 12–15. [Google Scholar]
- Liu, N.; Wang, J. Coping Strategies of Negative Space in Old Residential Areas: A Case Study of Hohhot Annex Factory Residential Area. Urban Archit. 2021, 18, 7–9. [Google Scholar] [CrossRef]
- Dan Tai, L. Regeneration Design of Negative Public Space in Old Campus of University. Master’s Thesis, Guizhou Normal University, Guizhou, China, 2022. [Google Scholar]
- Wu, L.; Fang, K.; Zhang, Y. From the Perspective of Urban Cultural Development, the Protection and Development of Historical and Cultural Sites with the Means of Urban Design—Taking the Renovation and Reconstruction of Baitasi Block in Beijing as an Example. Cent. China Archit. 1998, 3, 94–99. [Google Scholar]
- Cheng, L. Organic Renewal of Historic Blocks in the Process of Urbanization: A Case Study of the Renovation of Blocks around Dongguan Mosque in Xining. Urban Archit. 2014, 30, 78–82. [Google Scholar]
- Huang, Z. A Preliminary Study on the Development Strategy of “Green Corridor” under the Process of Urbanization in China. Urban Archit. 2021, 18, 38–45. [Google Scholar] [CrossRef]
- Zhang, Y. Research on Urban Fringe Village Public Space Renewal Design Based on Generative Design Method. Master’s Thesis, Guangzhou University, Guangzhou, China, 2022. [Google Scholar]
- Yuan, H.; Chen, S.; Pan, K. Modular Transformation Design of High-Density Urban Negative Space Based on System Theory—Analysis of Hopp Cup Bronze Award “City Chain” Design. New Build. 2018, 3, 102–106. [Google Scholar]
- Huang, C.; Jiang, B.; Liu, S. “Vertical Slice”—An Exploration of the Renewal Method of Negative Space in the Old District of High-Density Multi-Storey Residential Buildings. J. Hunan Univ. 2017, 3, 155–160. [Google Scholar]
- Shi, Y.; Ren, D. Research on Sharing and Integration of Public Open Space in Shenzhen Bay Street, Nanshan District, Shenzhen. IOP Conf. Ser. Earth Environ. Sci. 2019, 330, 022045. [Google Scholar] [CrossRef]
- Available online: Https://Mp.Weixin.Qq.Com/s/9GK0s3jH0V2Mu8KGGRX-Ug (accessed on 29 February 2024).
- Available online: Https://Www.Sohu.Com/a/436110385_167180 (accessed on 29 February 2024).
- Stevanović, S. Optimization of Passive Solar Design Strategies: A Review. Renew. Sustain. Energy Rev. 2013, 25, 177–196. [Google Scholar] [CrossRef]
- Kim, H.; Clayton, M.J. A Multi-Objective Optimization Approach for Climate-Adaptive Building Envelope Design Using Parametric Behavior Maps. Build. Environ. 2020, 185, 107292. [Google Scholar] [CrossRef]
- Brownlee, A.E.I.; Wright, J.A. Constrained, Mixed-Integer and Multi-Objective Optimisation of Building Designs by NSGA-II with Fitness Approximation. Appl. Soft Comput. 2015, 33, 114–126. [Google Scholar] [CrossRef]
- Attia, S.; Hamdy, M.; O’Brien, W.; Carlucci, S. Assessing Gaps and Needs for Integrating Building Performance Optimization Tools in Net Zero Energy Buildings Design. Energy Build. 2013, 60, 110–124. [Google Scholar] [CrossRef]
- Turrin, M.; Von Buelow, P.; Stouffs, R. Design Explorations of Performance Driven Geometry in Architectural Design Using Parametric Modeling and Genetic Algorithms. Adv. Eng. Inform. 2011, 25, 656–675. [Google Scholar] [CrossRef]
- Yu, H.; Yang, W.; Li, Q. Multi-Objective Optimization of Building’s Life Cycle Performance in Early Design Stages. IOP Conf. Ser. Earth Environ. Sci. 2019, 323, 012116. [Google Scholar] [CrossRef]
- Dincer, I.; Colpan, C.O.; Ezan, M.A. (Eds.) Environmentally-Benign Energy Solutions; Green Energy and Technology; Springer International Publishing: Cham, Switzerland, 2020; ISBN 978-3-030-20636-9. [Google Scholar]
- Adamatzky, A. Route 20, Autobahn 7 and Physarum Polycephalum: Approximating Longest Roads in USA and Germany with Slime Mould on 3D Terrains. IEEE Trans. Cybern. 2014, 44, 126–136. [Google Scholar] [CrossRef]
- Rossi, A.; Tessmann, O. Designing with Digital Materials: A Computational Framework for Discrete Assembly Design. 2017. Available online: https://www.researchgate.net/publication/358906176 (accessed on 29 February 2024).
- Yu, B.; Zhang, L. A Virtual Model Generation Based on Grasshopper-Wasp. In Proceedings of the 2021 2nd International Conference on Intelligent Design (ICID), Xi’an, China, 19 October 2021; pp. 230–233. [Google Scholar]
- Drude, J.P.; Rossi, A.; Becker, M. Project DisCo: Choreographing Discrete Building Blocks in Virtual Reality. In Impact: Design with All Senses; Gengnagel, C., Baverel, O., Burry, J., Ramsgaard Thomsen, M., Weinzierl, S., Eds.; Springer International Publishing: Cham, Switzerland, 2020; pp. 288–299. ISBN 978-3-030-29828-9. [Google Scholar]
- Lin, B.; Chen, H.; Liu, Y.; He, Q.; Li, Z. A Preference-Based Multi-Objective Building Performance Optimization Method for Early Design Stage. Build. Simul. 2021, 14, 477–494. [Google Scholar] [CrossRef]
- Zhou, Q.; Xue, F. Pushing the Boundaries of Modular-Integrated Construction: A Symmetric Skeleton Grammar-Based Multi-Objective Optimization of Passive Design for Energy Savings and Daylight Autonomy. Energy Build. 2023, 296, 113417. [Google Scholar] [CrossRef]
- Gagnon, R.; Gosselin, L.; Armand Decker, S. Performance of a Sequential versus Holistic Building Design Approach Using Multi-Objective Optimization. J. Build. Eng. 2019, 26, 100883. [Google Scholar] [CrossRef]
- Liu, K.; Xu, X.; Huang, W.; Zhang, R.; Kong, L.; Wang, X. A Multi-Objective Optimization Framework for Designing Urban Block Forms Considering Daylight, Energy Consumption, and Photovoltaic Energy Potential. Build. Environ. 2023, 242, 110585. [Google Scholar] [CrossRef]
- Li, J.; Wang, Y.; Xia, Y.; Song, Y.; Xie, H. Optimization of Urban Block Form by Adding New Volumes for Capacity Improvement and Solar Performance Using A Multi-Objective Genetic Algorithm: A Case Study of Nanjing. Buildings 2022, 12, 1710. [Google Scholar] [CrossRef]
- Ghannad, P.; Lee, Y.-C. Automated Modular Housing Design Using a Module Configuration Algorithm and a Coupled Generative Adversarial Network (CoGAN). Autom. Constr. 2022, 139, 104234. [Google Scholar] [CrossRef]
- Zhang, J.; Liu, N.; Wang, S. Generative Design and Performance Optimization of Residential Buildings Based on Parametric Algorithm. Energy Build. 2021, 244, 111033. [Google Scholar] [CrossRef]
- Lu, Y.; Wu, W.; Geng, X.; Liu, Y.; Zheng, H.; Hou, M. Multi-Objective Optimization of Building Environmental Performance: An Integrated Parametric Design Method Based on Machine Learning Approaches. Energies 2022, 15, 7031. [Google Scholar] [CrossRef]
- Kiss, B.; Szalay, Z. Modular Approach to Multi-Objective Environmental Optimization of Buildings. Autom. Constr. 2020, 111, 103044. [Google Scholar] [CrossRef]
- Glaeser, E.L.; Ward, B.A. The Causes and Consequences of Land Use Regulation: Evidence from Greater Boston. J. Urban Econ. 2009, 65, 265–278. [Google Scholar] [CrossRef]
- Shi, Y.; Xiang, Y.; Zhang, Y. Urban Design Factors Influencing Surface Urban Heat Island in the High-Density City of Guangzhou Based on the Local Climate Zone. Sensors 2019, 19, 3459. [Google Scholar] [CrossRef]
- Sheng, H.; Zeng, Z.Q. Solar Energy Photovoltaic Technology; Chemical Industry Press: Beijing, China, 2005. [Google Scholar]
Figure 1.
The relationship between research on negative space and parametric design.
Figure 1.
The relationship between research on negative space and parametric design.
Figure 2.
Methodological approach.
Figure 2.
Methodological approach.
Figure 3.
Diagrams illustrate the content of step 3. (a) Optimal path generated by the slime mould algorithm; (b) aggregated units generated by the Wasp algorithm; (c) volume centroid of each unit; (d) vertical shortest distance from the volume centroid of each unit to the optimal path (D).
Figure 3.
Diagrams illustrate the content of step 3. (a) Optimal path generated by the slime mould algorithm; (b) aggregated units generated by the Wasp algorithm; (c) volume centroid of each unit; (d) vertical shortest distance from the volume centroid of each unit to the optimal path (D).
Figure 4.
Research site information; (a) the satellite map of the Tianhe district; (b) selected site location; (c) the related parameters of the research site; (d) the 3D model of the research site.
Figure 4.
Research site information; (a) the satellite map of the Tianhe district; (b) selected site location; (c) the related parameters of the research site; (d) the 3D model of the research site.
Figure 5.
Connection rules between units. (a) Constraint points for connection; (b) Constraint lines for connection.
Figure 5.
Connection rules between units. (a) Constraint points for connection; (b) Constraint lines for connection.
Figure 6.
The multi-objective optimization process.
Figure 6.
The multi-objective optimization process.
Figure 7.
Unit quantity (N) statistics plot.
Figure 7.
Unit quantity (N) statistics plot.
Figure 8.
Spatial distribution plot of all solutions during optimization.
Figure 8.
Spatial distribution plot of all solutions during optimization.
Figure 9.
D value statistics plot.
Figure 9.
D value statistics plot.
Figure 10.
Statical analysis. (a) The relation between Pareto solutions and statics of WSD and SSR; (b) The relationship between Pareto solutions and statics of WSD and N value.
Figure 10.
Statical analysis. (a) The relation between Pareto solutions and statics of WSD and SSR; (b) The relationship between Pareto solutions and statics of WSD and N value.
Table 1.
Competition works related to the negative spaces (2019–2023).
Table 1.
Competition works related to the negative spaces (2019–2023).
| Competition | Time | Title | Theme |
|---|
| UIA-HYP CUP | 2023 | Living Your Best Life: Designing for Mental Health in High Density Sprawl | Pay attention to the mental health problems of people in high-density cities;
Pay attention to promote coordinated development between people and cities |
| UIA-HYP CUP | 2022 | Folding Landscapes: Prototypes for an Urban-Rural Union | pay attention to the development of areas connecting urban and rural area |
| UIA-HYP CUP | 2020 | City puzzle & Puzzle city | pay attention to the transformation of urban unused space into effective space |
| UIA-HYP CUP | 2019 | Happy spaces: Integrating architecture and landscape | Pay attention to the development of marginal urban areas. |
The Architect
Teamzero Award | 2022 | Architectures in Linking Area | Focus on the design of the connecting area building |
Table 2.
Competition works related to parametric design from 2020 to 2023.
Table 2.
Competition works related to parametric design from 2020 to 2023.
| Competition | Time | Title | Method |
|---|
| UIA-HYP CUP | 2020 | Old City pacemaker | Parametric design, Ant colony optimization, Wasp algorithm |
| 2022 | Ploughing on the clouds | Parametric design, Multi-objective optimization, Simulate, Wasp algorithm |
| 2022 | Herd | Parametric design, Multi-objective optimization, Simulate |
| Evolo | 2023 | Urban paper clip | Parametric design, Wasp algorithm, Information technology |
| 2023 | The Gate of Cairo | Parametric design, Wasp algorithm, Kangaroo |
| 2022 | Super mask skyscraper | Parametric design, Simulate, Ladybug tools, Kangaroo |
| 2022 | Urban links | Parametric design, Wasp algorithm |
| 2021 | Urban Parasitic System | Parametric design, Wasp algorithm, Slime Mould Algorithm, Ladybug tools, Information design |
| 2021 | Smokestack Symbiosis Skyscraper Purifies Air | Parametric design, 3D printing, Information design |
| 2020 | Epidemic Babel | Parametric design, Modularization, Information design |
Table 3.
High-density urban information captured from the National Geographic platform.
Table 3.
High-density urban information captured from the National Geographic platform.
| Share of People Living in Urban Agglomerations of More than 1 Million 1960 to 2021 | Distribution Map of High-Density Cities in China |
|---|
![Buildings 14 01081 i001]() | ![Buildings 14 01081 i002]() |
Table 4.
Selected optimized paths generated by the slime mould algorithm. (a) the generated results of path 01; (b) the generated results of path 02; (c) the generated results of path 03; (d) the generated results of path 04.
Table 5.
Size of different types of units.
Table 5.
Size of different types of units.
Table 6.
Distribution possibilities of points and lines in Units A and B.
Table 7.
Six possibilities of combinations for the eight options between Units A and B.
Table 8.
Parameter settings for the first optimization analysis.
Table 8.
Parameter settings for the first optimization analysis.
| Generation Size | Generation Count | Crossover Probability | Mutation Probability | Random Seed |
|---|
| 30 | 60 | 0.9 | 0.5 | 1 |
Table 9.
Optimization result (the first simulation). (a) Standard deviation graph for Objective-WSD rules; (b) Standard deviation graph for Objective-SSR; (c) Mean values trendline graph for Objective-WSD; (d) Mean values trendline graph for Objective-SSR.
Table 10.
Parameter settings for the second optimization analysis.
Table 10.
Parameter settings for the second optimization analysis.
| Generation Size | Generation Count | Crossover Probability | Mutation Probability | Random Seed |
|---|
| 40 | 100 | 0.7 | 0.5 | 1 |
Table 11.
Optimization result (the second simulation). (a) Standard deviation graph for Objective-WSD rules; (b) Standard deviation graph for Objective-SSR; (c) Mean values trendline graph for Objective-WSD; (d) Mean values trendline graph for Objective-SSR; (e) Fitness value chart for Objective-WSD; (f) Fitness value chart for Objective-SSR; (g) Parallel Coordinate Plot.
Table 12.
The selected 15 Pareto optimal solutions from the 100th generation.
Table 12.
The selected 15 Pareto optimal solutions from the 100th generation.
| | NO.3961 | NO.3967 | NO.3968 |
![Buildings 14 01081 i052]() | ![Buildings 14 01081 i053]() | ![Buildings 14 01081 i054]() |
| WSD | 3787.87 h | 2610.96 h | 3257.32 h |
| SSR | 1,550,000 kwh/m2 | 1,280,000 kwh/m2 | 1,400,000 kwh/m2 |
| | NO.3970 | NO.3972 | NO.3973 |
![Buildings 14 01081 i055]() | ![Buildings 14 01081 i056]() | ![Buildings 14 01081 i057]() |
| WSD | 2512.56 h | 1964.63 h | 1533.74 h |
| SSR | 1,190,000 kwh/m2 | 996,713 kwh/m2 | 843,924 kwh/m2 |
| | NO.3975 | NO.3977 | NO.3982 |
![Buildings 14 01081 i058]() | ![Buildings 14 01081 i059]() | ![Buildings 14 01081 i060]() |
| WSD | 1055.96 h | 2469.13 h | 1751.31 h |
| SSR | 668,880 kwh/m2 | 1,110,000 kwh/m2 | 938,170 kwh/m2 |
| | NO.3986 | NO.3988 | NO.3991 |
![Buildings 14 01081 i061]() | ![Buildings 14 01081 i062]() | ![Buildings 14 01081 i063]() |
| WSD | 3267.97 h | 2298.85 h | 1158.75 h |
| SSR | 1,480,000 kwh/m2 | 1,080,000 kwh/m2 | 698,349 kwh/m2 |
| | NO.3993 | NO.3997 | NO.4000 |
![Buildings 14 01081 i064]() | ![Buildings 14 01081 i065]() | ![Buildings 14 01081 i066]() |
| WSD | 894.45 h | 1414.42 h | 1233.04 h |
| SSR | 636,594 kwh/m2 | 785,963 kwh/m2 | 724,334 kwh/m2 |
Table 13.
Axonometric views of selected solutions.
| Disclaimer/Publisher’s Note: The statements, opinions and data contained in all publications are solely those of the individual author(s) and contributor(s) and not of MDPI and/or the editor(s). MDPI and/or the editor(s) disclaim responsibility for any injury to people or property resulting from any ideas, methods, instructions or products referred to in the content. |
© 2024 by the authors. Licensee MDPI, Basel, Switzerland. This article is an open access article distributed under the terms and conditions of the Creative Commons Attribution (CC BY) license (https://creativecommons.org/licenses/by/4.0/).


 Ending points
  Starting points


 Constraint faces for connection
  Constraint points for connection
 Constraint lines for connection


 Face to face connection
  Line to line connection

 Fitness value generated from first generation to the last generation

 Variation curve of the average values of optimization objectives for each generation
 The overall fitted trend line
 The average values of 30 sets of objectives in each iteration process

 Fitness Value generated from first generation to the last generation

 Variation curve of the average values of optimization objectives for each generation
 The overall fitted trend line
 The average values of 30 sets of objectives in each iteration process

 Fitness Value generated from first generation to the last generation
 Fitness Value generated from first generation to the last generation


