1. Introduction
In contemporary architecture, the façade has more than just a decorative or protective function. It plays a significant role in influencing the view from the interior to the exterior of a building and, as such, affects the experiences and perceptions of the building’s occupants. However, achieving the optimal design for a building façade that balances both aesthetic appeal and functional performance presents a complex challenge for architects [
1]. In addition, the geometric pattern design and support positions in the façade structure significantly affect the overall performance and visual disturbance experienced by occupants. Thus, there is a need for comprehensive strategies that can facilitate more efficient façade design.
Façade design is one of the items that affect indoor visual comfort, significantly influencing user satisfaction [
2]. A well-designed façade can enhance daylight, thermal comfort, and energy efficiency and reduce reliance on artificial lighting, thereby improving overall building performance [
3]. Also, contrary to what we may think, how we design façade elements such as window patterns, support positioning, and façade geometry can cause visual disturbances. Daylight can cause visual discomfort like glare and unwanted reflections and affect the thermal balance of rooms through overheating [
4]. Therefore, the main challenge for designers in an effective daylighting design is to keep the balance between maximizing daylight harvesting and controlling the risk of potential discomfort [
5]. Tabadkani et al. (2018) [
6] developed an innovative approach for the parametric analysis of daylighting and visual comfort using a sun-responsive shading system. The results of the study showed that the proposed approach was capable of significantly improving the shading’s flexibility in controlling daylight metrics and glare via a full potential adaptive pattern to achieve the maximum visual comfort level. Abboushi (2018) [
7] investigated the positive geometrical attributes of sunlight’s effects on visual comfort that should be examined through fractal patterns, striped patterns, and clear patterns of daylight in an office building. Attia (2017) [
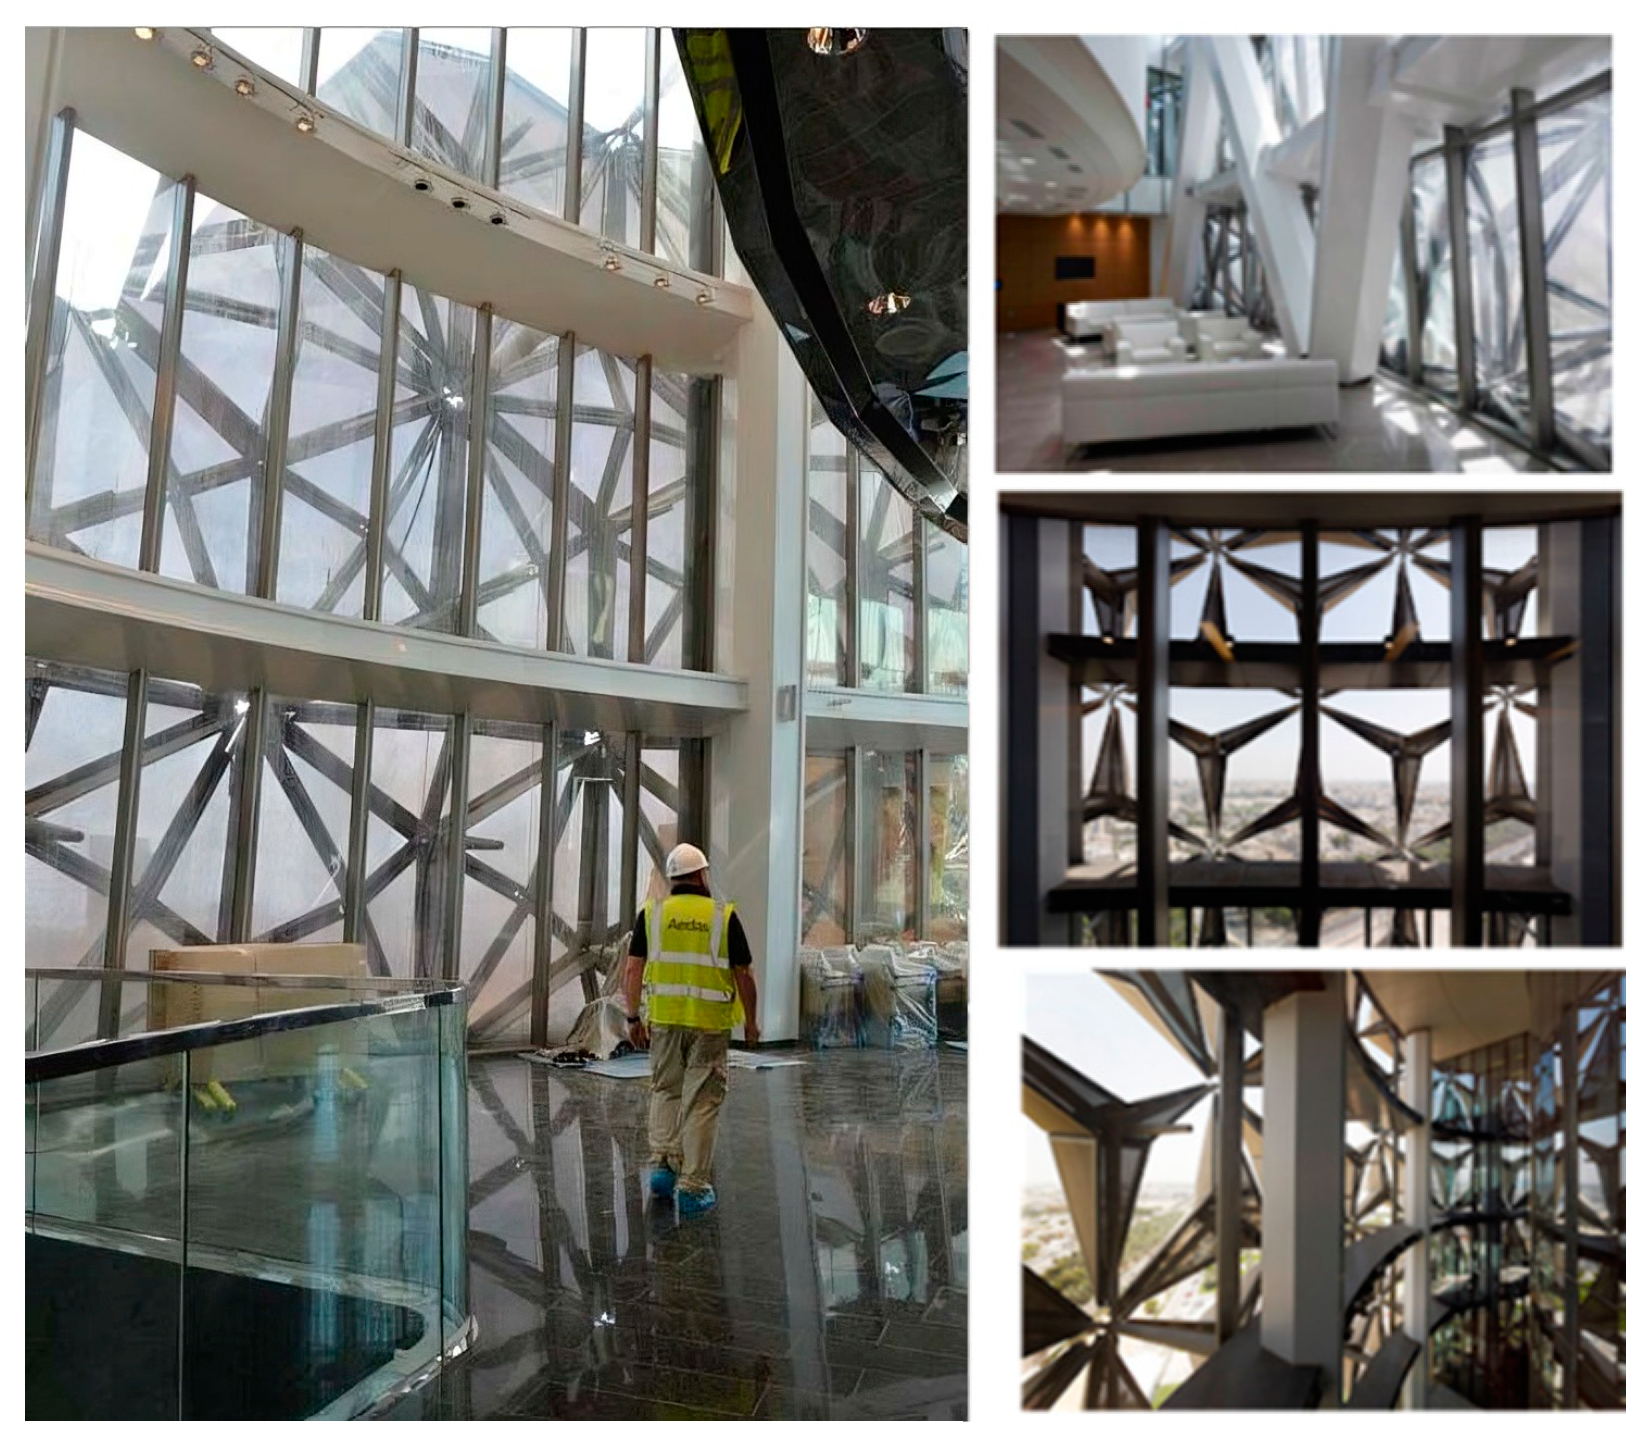
8] demonstrated that although the Al Bahar Tower has a creative design, inspired by various motifs and being covered by a honeycomb structure and having an automated dynamic solar screen responds to the sun’s movement (
Figure 1) [
9,
10]. feedback from a significant portion of the occupants suggested that the adaptive façade system resulted in discomfort. This discomfort primarily stemmed from the system’s limitations on manual adjustments to natural lighting and ventilation. It remains unclear whether visibility from the windows of this tower is an issue. The complaints received about insufficient natural light suggested that visibility, and consequently the quality of indoor spaces, is also adversely affected. Future studies specifically investigating visibility aspects could provide valuable insights into this matter.
1.1. Genetic Algorithms for Parametric Facades
In the context of design solutions, conventional, intuitive, and experience-based decision making plays an important role [
11]. In determining the indoor conditions and the visual identity of a building, façade design not only plays a crucial role but also represents the main interface between a building and its external environment [
12]. Optimizing facade design for visual comfort, energy efficiency, and esthetic quality is a research aim that has seen a surge in recent years. One of the areas that has been investigated is the role of the façade in providing an effective view of the exterior from the inside of the building.
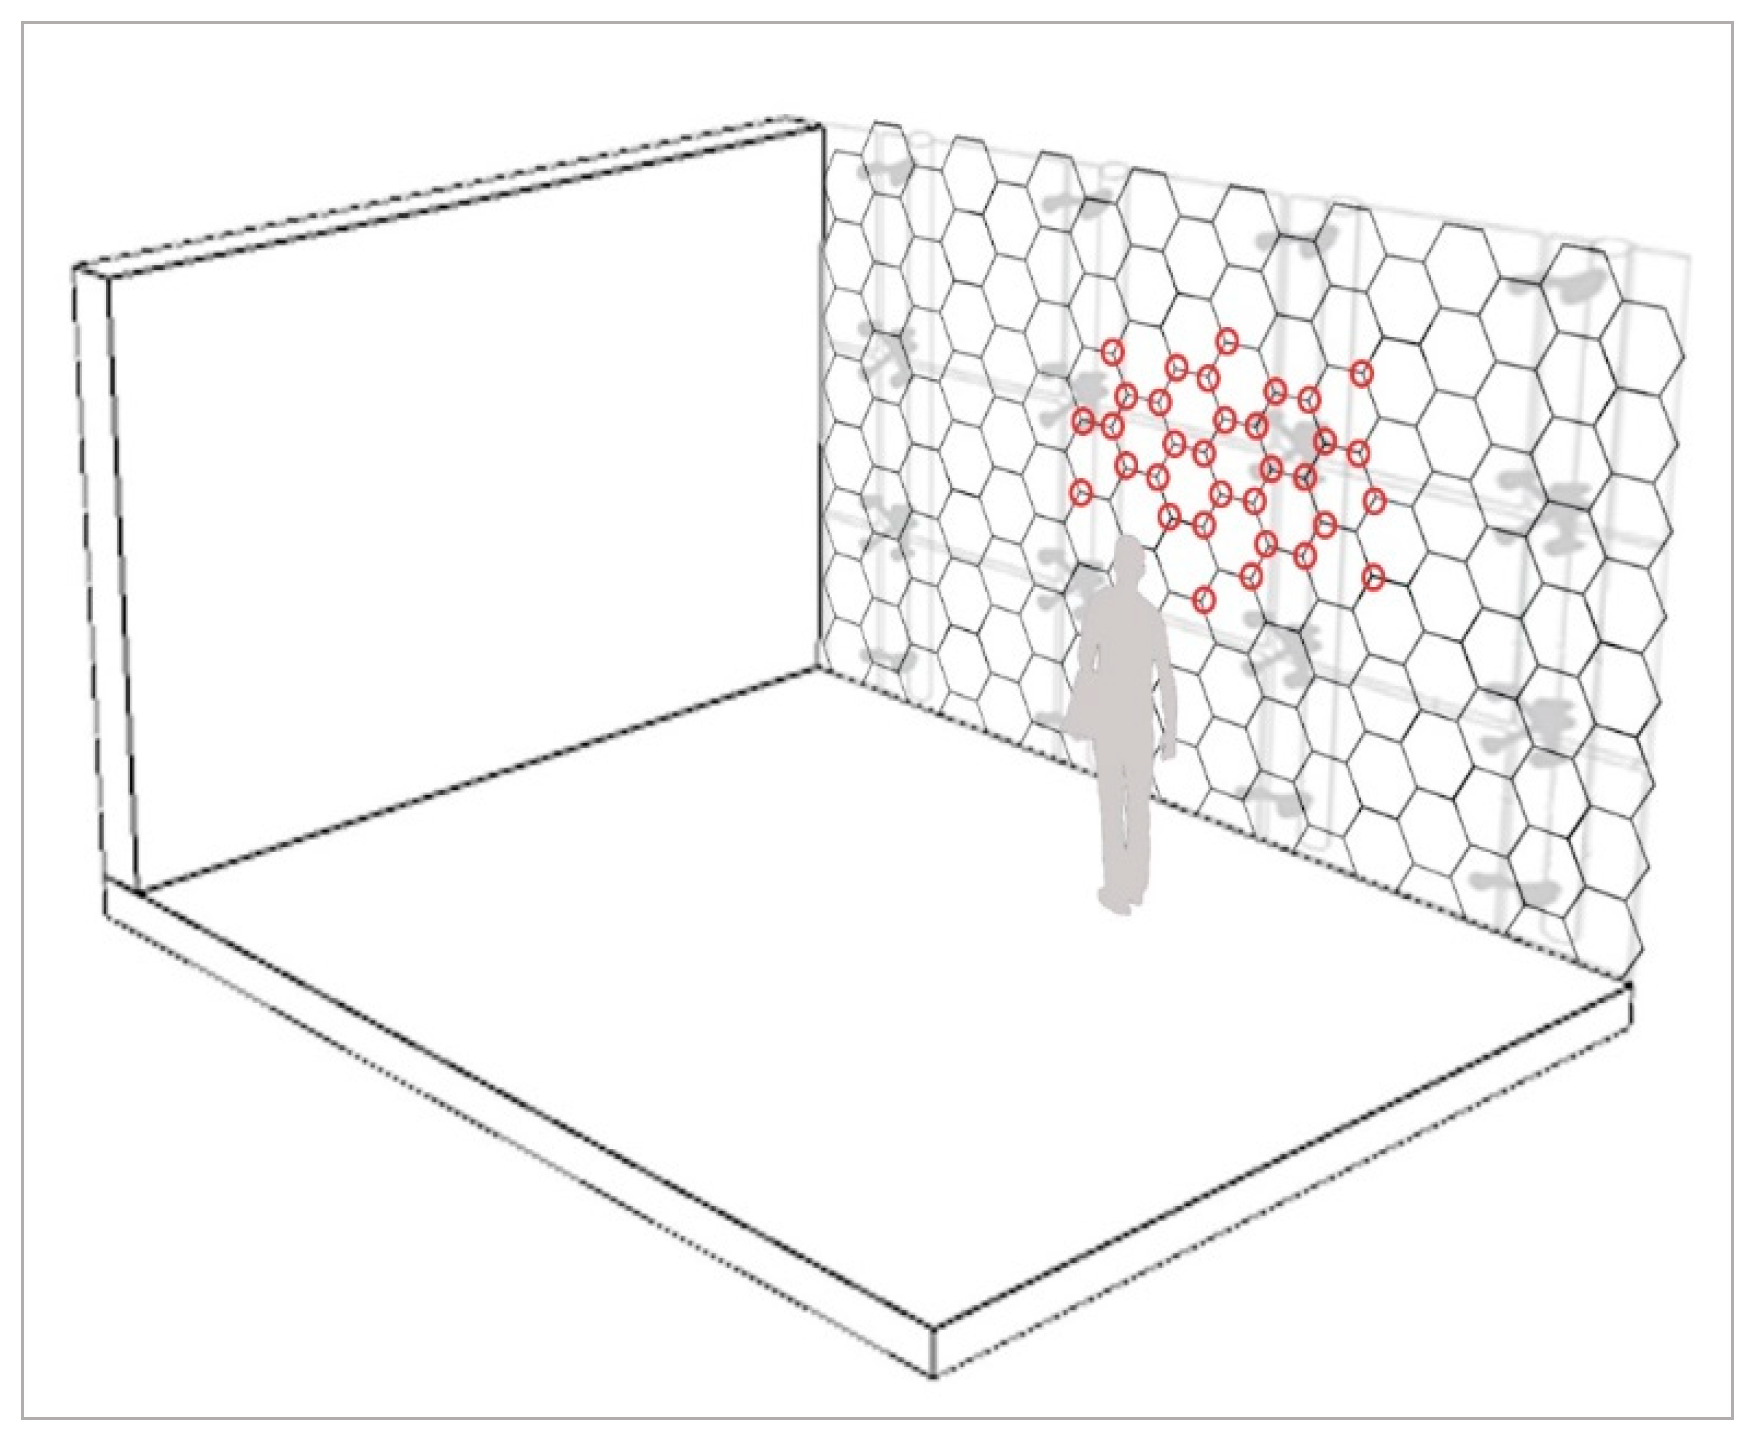
Figure 2 shows the visual disturbance of occupants experienced from indoors. An aspect that has been less explored in the architectural discourse is the increasing complexity of facade design by considering the effect of geometric patterns and support positions. The use of optimization techniques has become increasingly prevalent in architectural design. Generative design refers to an iterative design process used to formulate patterns and create multiple solutions in building facades by utilizing parametric modeling and simulation tools. Wright (2009) [
13] optimized window size and placement while considering both daylighting and energy. To explore how generative design can be utilized to analyze and model a rhythmic facade, Wardhani (2020) [
14] focused on identifying formal elements of the dominant structures in the area to serve as references for new façade designs, aiming to preserve historical characteristics. To utilize genetic algorithms to optimize facade design based on daylighting performance goals, a range of facade design options can be explored by varying parameters such as materials, geometry of apertures, and shading devices [
15]. The exploration of generative design’s potential in enhancing façade functionality could provide an approach that is a subset of the evolutionary algorithms used in computing to solve optimization problems in architectural innovation.
Despite being relatively new within the field of architectural design optimization, the application of genetic algorithms (GAs) is rapidly developing. GAs could solve complex design problems in architecture early on [
16]. Mahmoud et al. (2016) [
17] summarized kinetic structure simulation results in a daylight environment, focusing on the impact of hexagonal patterns on south-facing office spaces and indicated that all of them helped improve the visual environment. Although research on façade optimization using GAs is growing, there is gap in the research on the optimization of façade patterns based on support position data, which would be practical for some kind of parametric façade that uses panels, such as kinetic façades, responsive façades, and so on. Most studies researched optimizing façade design for energy performance and visual comfort, but few studies have considered the effect of different geometric patterns and support positions of the structure on visual disturbances based on real data and case studies.
Genetic algorithms (GAs) are examples of metaheuristic algorithms, which are a class of algorithms used for solving complex optimization problems on the basis of natural selection and genetics within multiple domains; they include iterative processes of mutation, crossover, and selection in large and complex design spaces [
18]. Since traditional methods could not efficiently address the complexity of design problems, GAs balance various objectives of multifactorial nature in architectural design to achieve optimization. Several studies have explored the application of GAs in architectural design for a variety of purposes. Gero et al. (2001) [
19] successfully applied GAs in the generation and evaluation of architectural design alternatives, considering parameters like solar exposure, views, and spatial arrangement. Similarly, Jo et al. (1998) [
20] utilized a GA for the spatial configuration of architectural layouts. GAs have been used by several researchers in the context of façade design optimization, thermal performance, and visual comfort to determine optimal window/wall area ratios, enhance energy efficiency, and improve indoor environmental quality. Kim et al. (2019) [
21] proposed a novel hybrid optimization algorithm called tabu-based adaptive pattern search simulated annealing (T-APSSA) for optimizing the design of responsive building façades. T-APSSA is more efficient in calculations (two to four times faster than other algorithms). So, for the sensor-triggered optimization of responsively operational patterns in a façade form, metaheuristic algorithms have been hybridized to shorten the iterative solution search. Reki et al. (2021) [
22] explored the design of kinetic Jali façades using parametric patterns by using Grasshopper to explore two-pattern tessellations using a hexagon. They suggested potential areas for future research on window shape and kinetic façades.
Table 1 presents some research on the use of GAs in façade design.
1.2. Visual Quality and Façade s
The evaluation of visual quality and performance in the indoor environment depends on multiple factors including the conditions surrounding the building, aperture size, and the optical properties of the window, which all affect view quality and create complex problems for design [
23]. Window view quality depends on window design, which affects occupant health, well-being, and work performance. Also, the view direction and percentage of window view (PWV) area in the visual field are two items that could be used to calculate occupants’ satisfaction with the view access. This view access depends on the geometric relationships between the window(s) and the occupant, which are determined by window size and shape, viewing distance, and direction. The view calculation methods used for assessing view access are based on solid-angle or view vectors. However, all factors that affect visual access cannot be easily assessed without empirical findings obtained using a controlled environment [
24].
The design and composition of façade patterns play a crucial role in shaping occupants’ impressions of the building exterior. Chamilothori et al. (2022) [
25] evaluated four façade pattern variations with equal aperture ratios (horizontal stripes, vertical stripes irregularly distributed, rectangular openings, irregular lines). Irregular lines received higher ratings for complexity, interest, and excitement than the others.
Generally, we have insufficient knowledge on how façade geometry and the resulting sunlight patterns affect perception. Ko et al. (2023) [
24] investigated how geometric variables influence occupants’ perception of window views and their overall satisfaction with the visual environment. Chamilothori (2018) [
26] presented the architect’s intuition on how façade geometry can impact occupant perception and also evaluated this intuition with different façade geometries. Different façade patterns and designs impact human perception and physiological responses in architectural spaces. These patterns represent variations in the design of building façades, which can influence the distribution of natural light, visual aesthetics, and the overall spatial experience for occupants. Therefore, the “best” kind of pattern may depend on the specific context and desired outcome.
As a result, this study focused on using GAs in conjunction with geometric patterns and the position of the supports in façade design, which previously has not been explored. This research utilized GAs for the optimization of parametric façade, targeting a reduction in visual disturbance while enhancing building aesthetics and performance. The primary objective of this study was to decrease the visual disturbance around window for indoor occupants. Recognizing geometric patterns that have the potential to minimize the numbers of nodes and supports by leveraging a dataset of GAs leads to a stretched pattern shape and an increased view area. The scope of the research extended to the examination of three specific geometric grid patterns, i.e., triangular, square, and hexagonal, focusing on the positioning of nodes. These façade patterns were evaluated by analyzing cross-section optimization using a GA-driven tool called Galapagos, which aided in generating the requisite data for the study. The results of this work not only contribute to the computation and optimization of parametric façades but also provide users with a psychological visual connection to the outdoors. This study is, therefore, expected to open avenues for future research, and it is hoped that it will inspire further investigation into the application of algorithmic tools in architectural design optimization.
2. Research Methodology
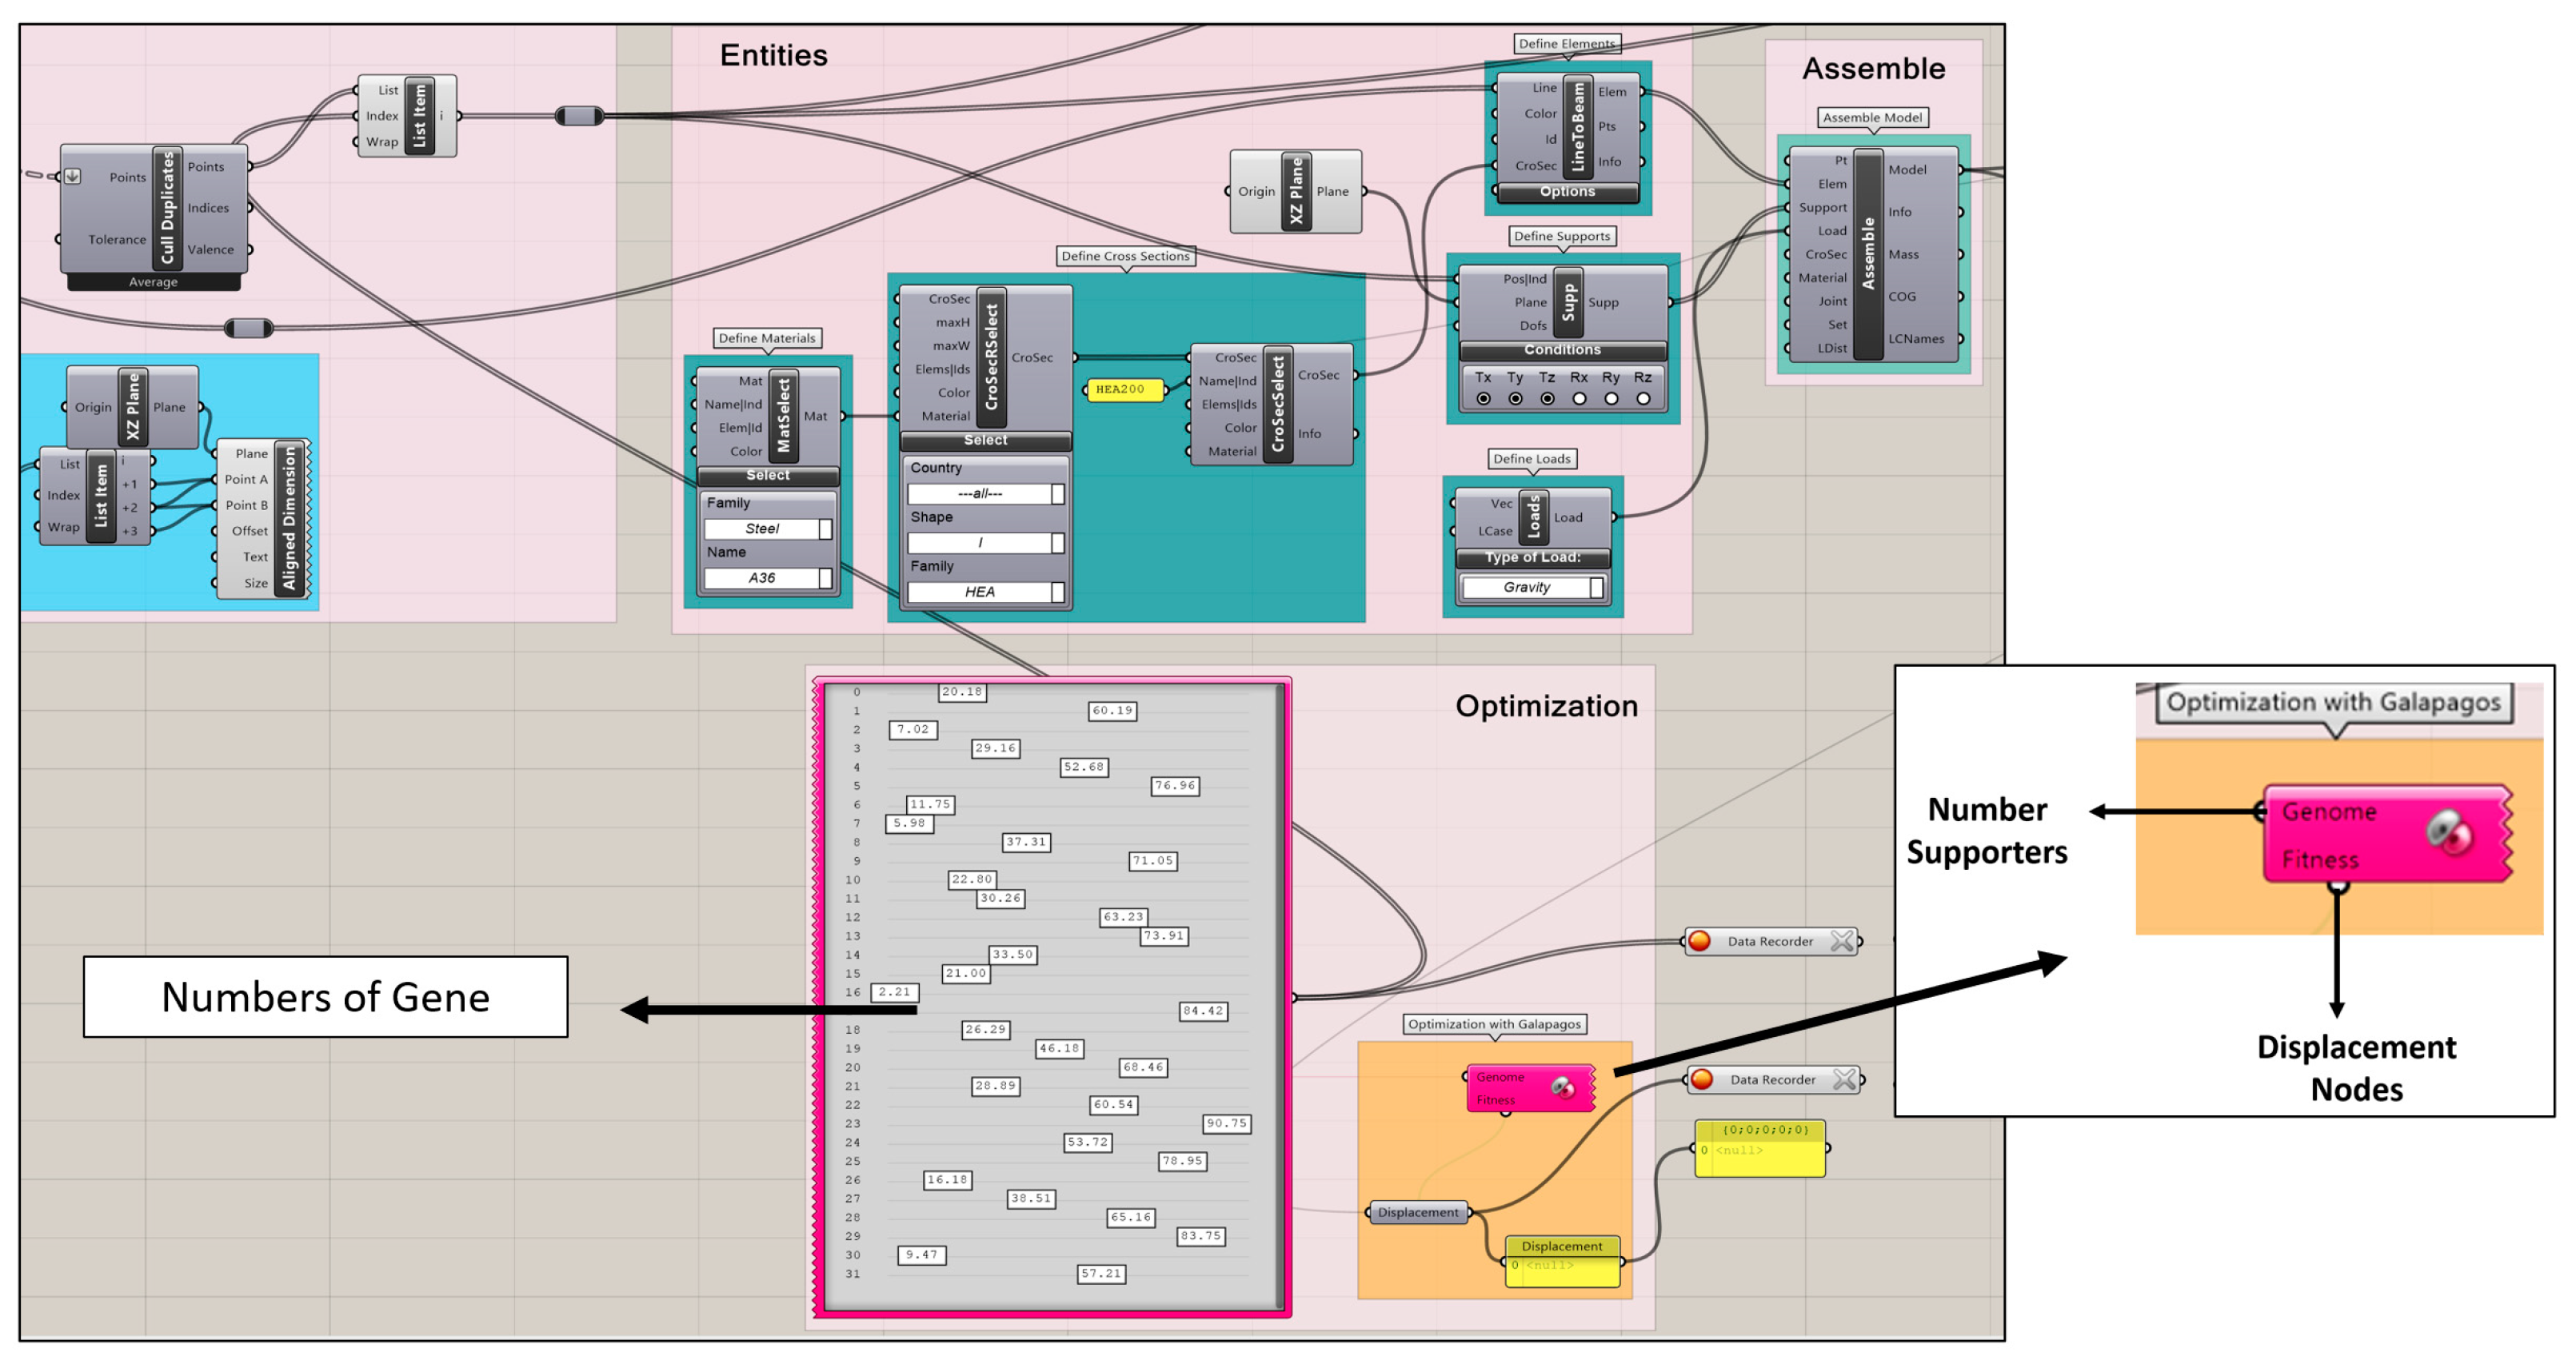
The pursuit of optimized façade design through genetic algorithms, as mentioned in this paper, can be demystified through systematic methodology. Our research approach was structured in a progressive manner, ensuring clarity, repeatability, and precision. The structural design of the joints connecting the optimized façade system to the building’s main bearing structure was not included in the algorithms or analysis presented in this study. Using genetic algorithms (GAs) for façade pattern optimization leads to identifying efficient patterns and recommending manipulations for irregular extensions. Also, it has the potential to enable innovative pattern exploration by flexibility exploring vast design spaces and customizing solutions. In this research, a visual programming language-based software package, named “Grasshopper” (Version 1.0) (Scott Davidson, n.d.), was used for the analysis and optimization of different grid patterns, owing to its ease of use for creating parametric designs and its widespread popularity among architects. This program offers the advantage of optimization capabilities in conjunction with a plugin called “Galapagos”, which utilizes a genetic algorithm-based approach. Galapagos includes two parts for setting up a simulation: the gene pool and the fitness through which this plugin can optimize a shape and search a parameter space to find designs to optimize a “fitness” function. For this to work, it needs a series of options or genes to try out and a defined goal or fitness value. The fitness function is some code that produces a numeric value that Galapagos tries to maximize.
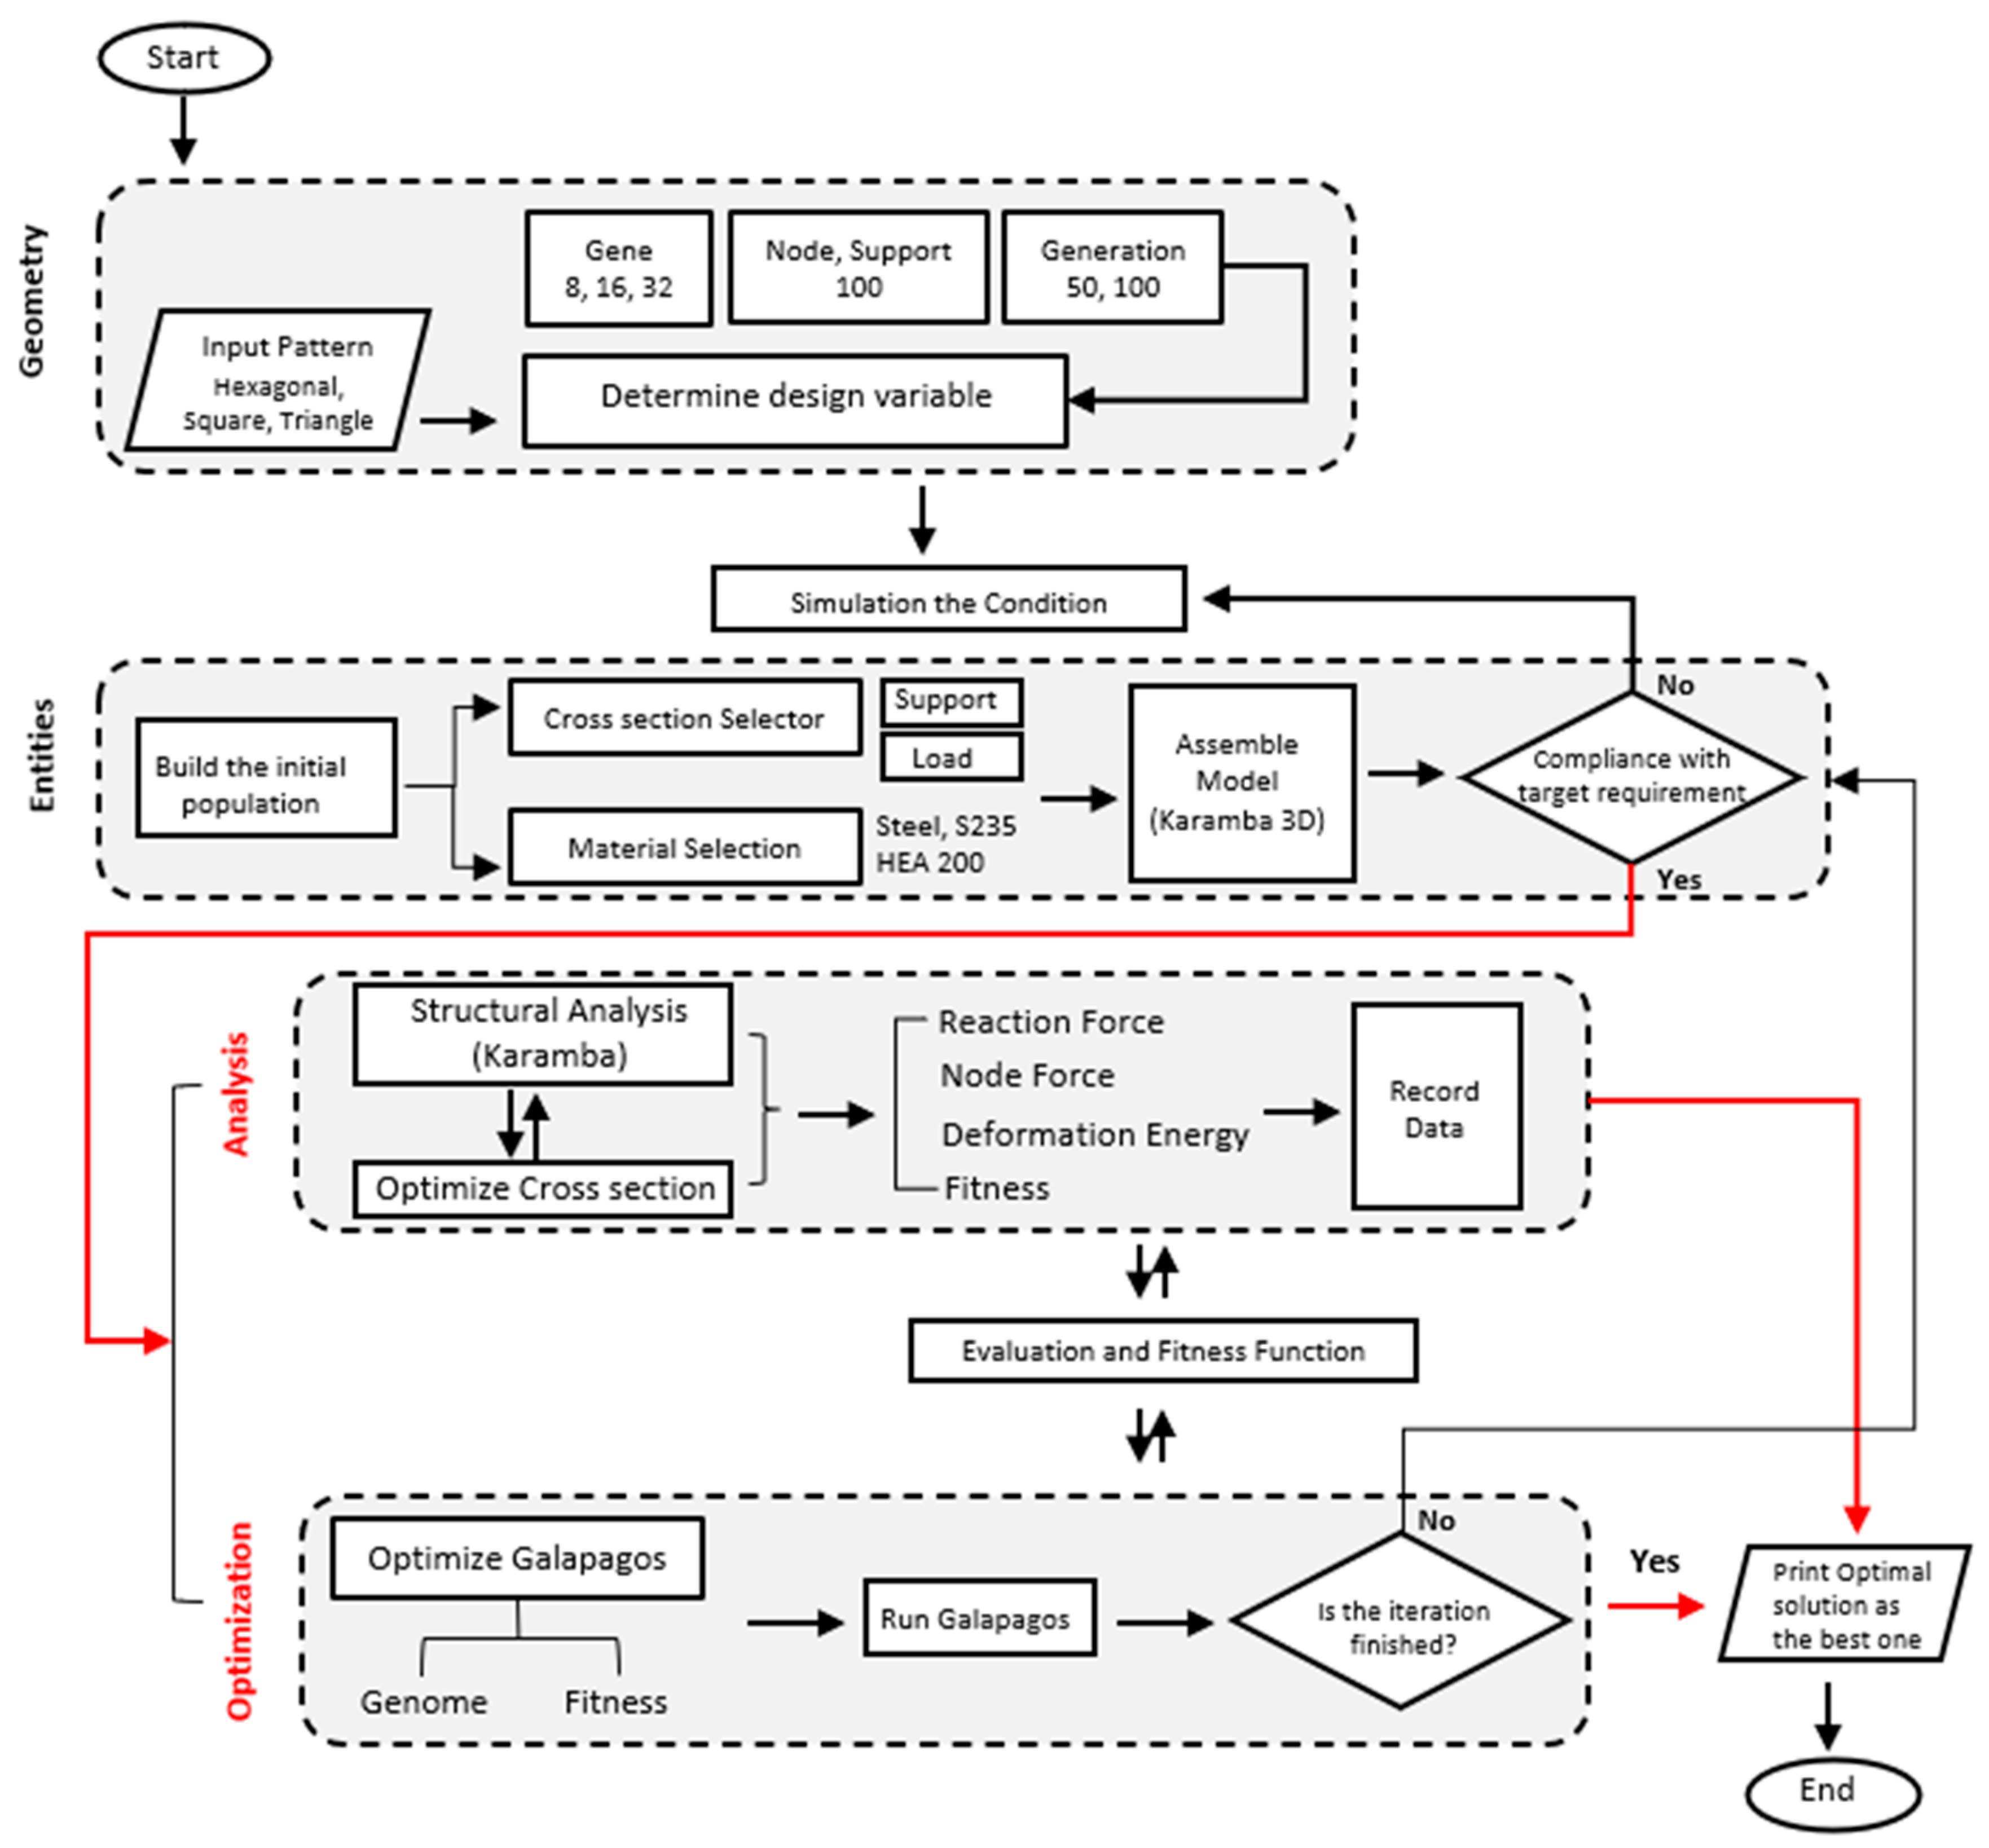
Figure 3 presents a flowchart of the research methodology adopted in this study. The process of analysis and optimization can be categorized into three stages. Firstly, the geometric shapes of the grid were chosen, and number of genes, nodes, and generations were determined. In the second stage, the initial population was built by selecting the cross-sectional, material, and boundary conditions of the façade grids. Finally, once the initial population was set, the model was assembled to check if compliance with the target requirements was made. For the case where it was a “No”, the initial conditions were revised, and the process was repeated again. In the case of a “Yes”, the processes of analysis and optimization were carried out in the next stage. During the analysis and optimization, the reaction, nodal forces, and deformation energy were evaluated and compared with the fitness function values. For the cases where the iteration process did not converge, the initial conditions were revised, and the process was repeated until the desired convergence was achieved. Once the iterations reached convergence, the corresponding values of reaction forces, node forces, and deformation energy were considered optimum.
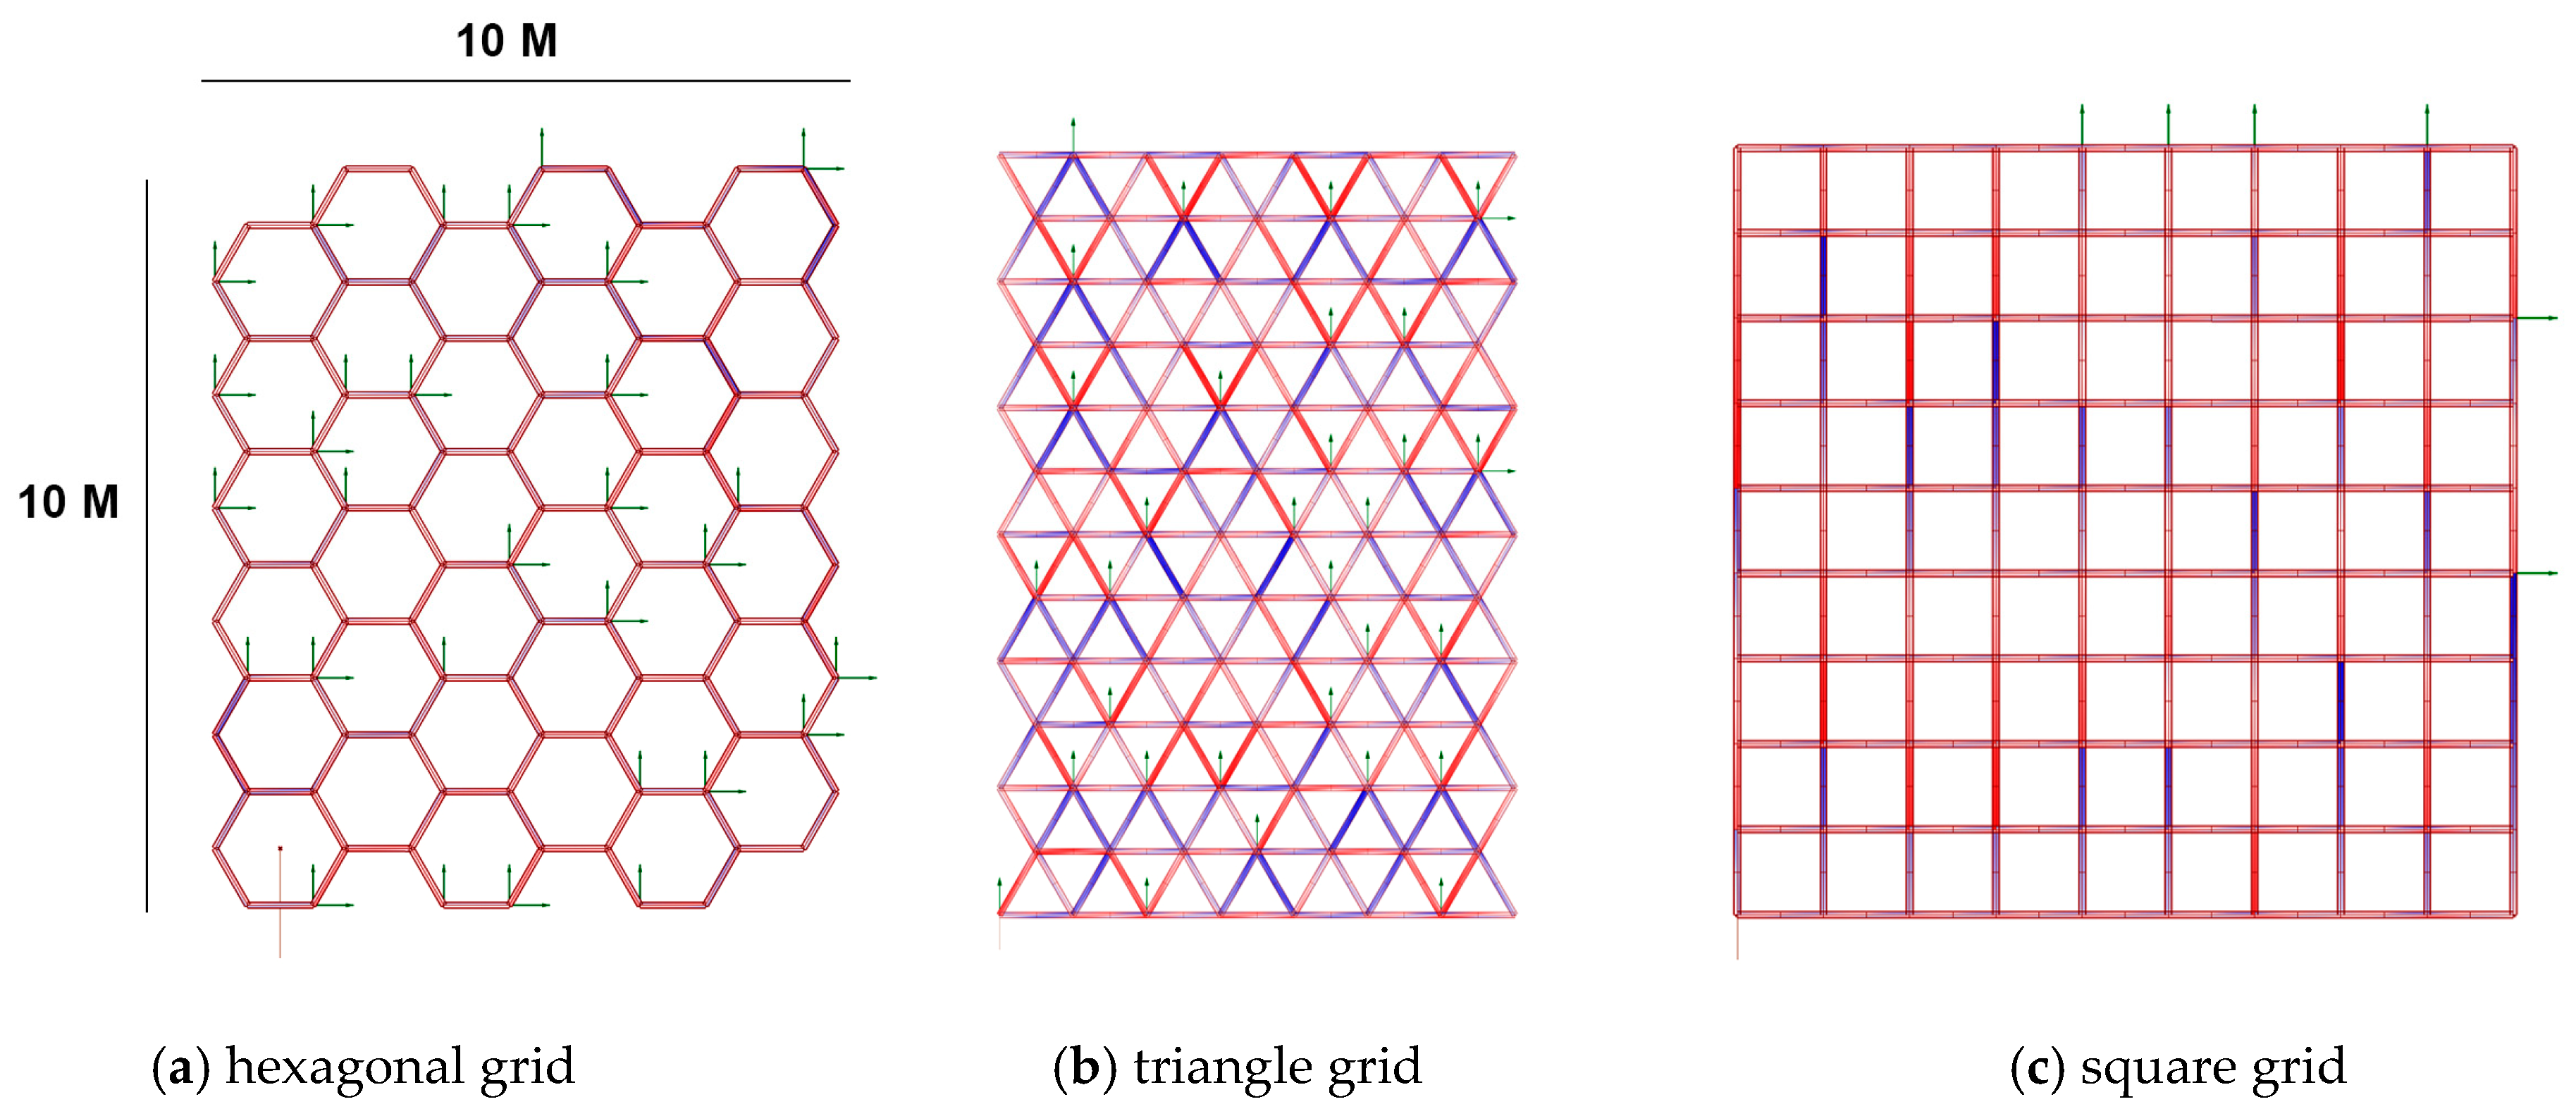
In this research, the three most widely used grid pattern models in façade design were used for analysis and comparison in almost equal conditions, i.e., the number of nodes in which the supports are likely to be placed. The selected grid patterns are presented in
Figure 4. As shown, the three patterns had hexagonal, triangular, and square grid shapes.
Table 2 shows the number of genes, nodal supports, and maximum distance of the selected grid shapes. A square surface (10 × 10 m
2) was assumed for all three patterns, which included a total of about 100 nodes, but, according to the form of the pattern, the number could not be exactly 100. For example, the triangle form had 98 nodes, the hexagonal form had 96 nodes, and the square form had 100 nodes, since the façade supports were not placed on all nodes.
We assumed the number of maintenance supports was 1/3 of 100 nodes for all three patterns, so 1/3 of them was considered to be about 32 genes, and the number of remaining genes was divided into two parts so that the factors being analyzed could be well checked, which were considered to be 16 and 8, respectively. Finally, the factors considered for optimization included node force, deformation energy, and reaction force. Three distinct geometric grid patterns were designed to serve as the foundational blueprint for façade optimization. Each pattern varied in complexity and layout, ensuring a diverse dataset for evaluation. The fitness factor was assumed to be in 2, 50, and 100 generations. The optimization factors and an illustration of random gene selection are summarized in
Table 3.
Table 3 illustrates a comparison of the hexagonal pattern, featuring 8 randomly distributed genes (indicated by red circles) in two distinct areas: the periphery and the center. The outcome of the optimization process revealed a tendency for the genes to gravitate toward the center.
2.1. Genetic Algorithm Framework
For the genetic algorithm, the parameters, such as population size, mutation rate, and selection criteria, were set in accordance with this study’s objectives. The algorithm aimed to determine the optimal position and count of nodes and supports that would lead to an efficient façade pattern, minimizing visual disturbance.
Figure 5 presents a screenshot of the interface of the Grasshopper program, giving details on genes, nodes, and optimization factors.
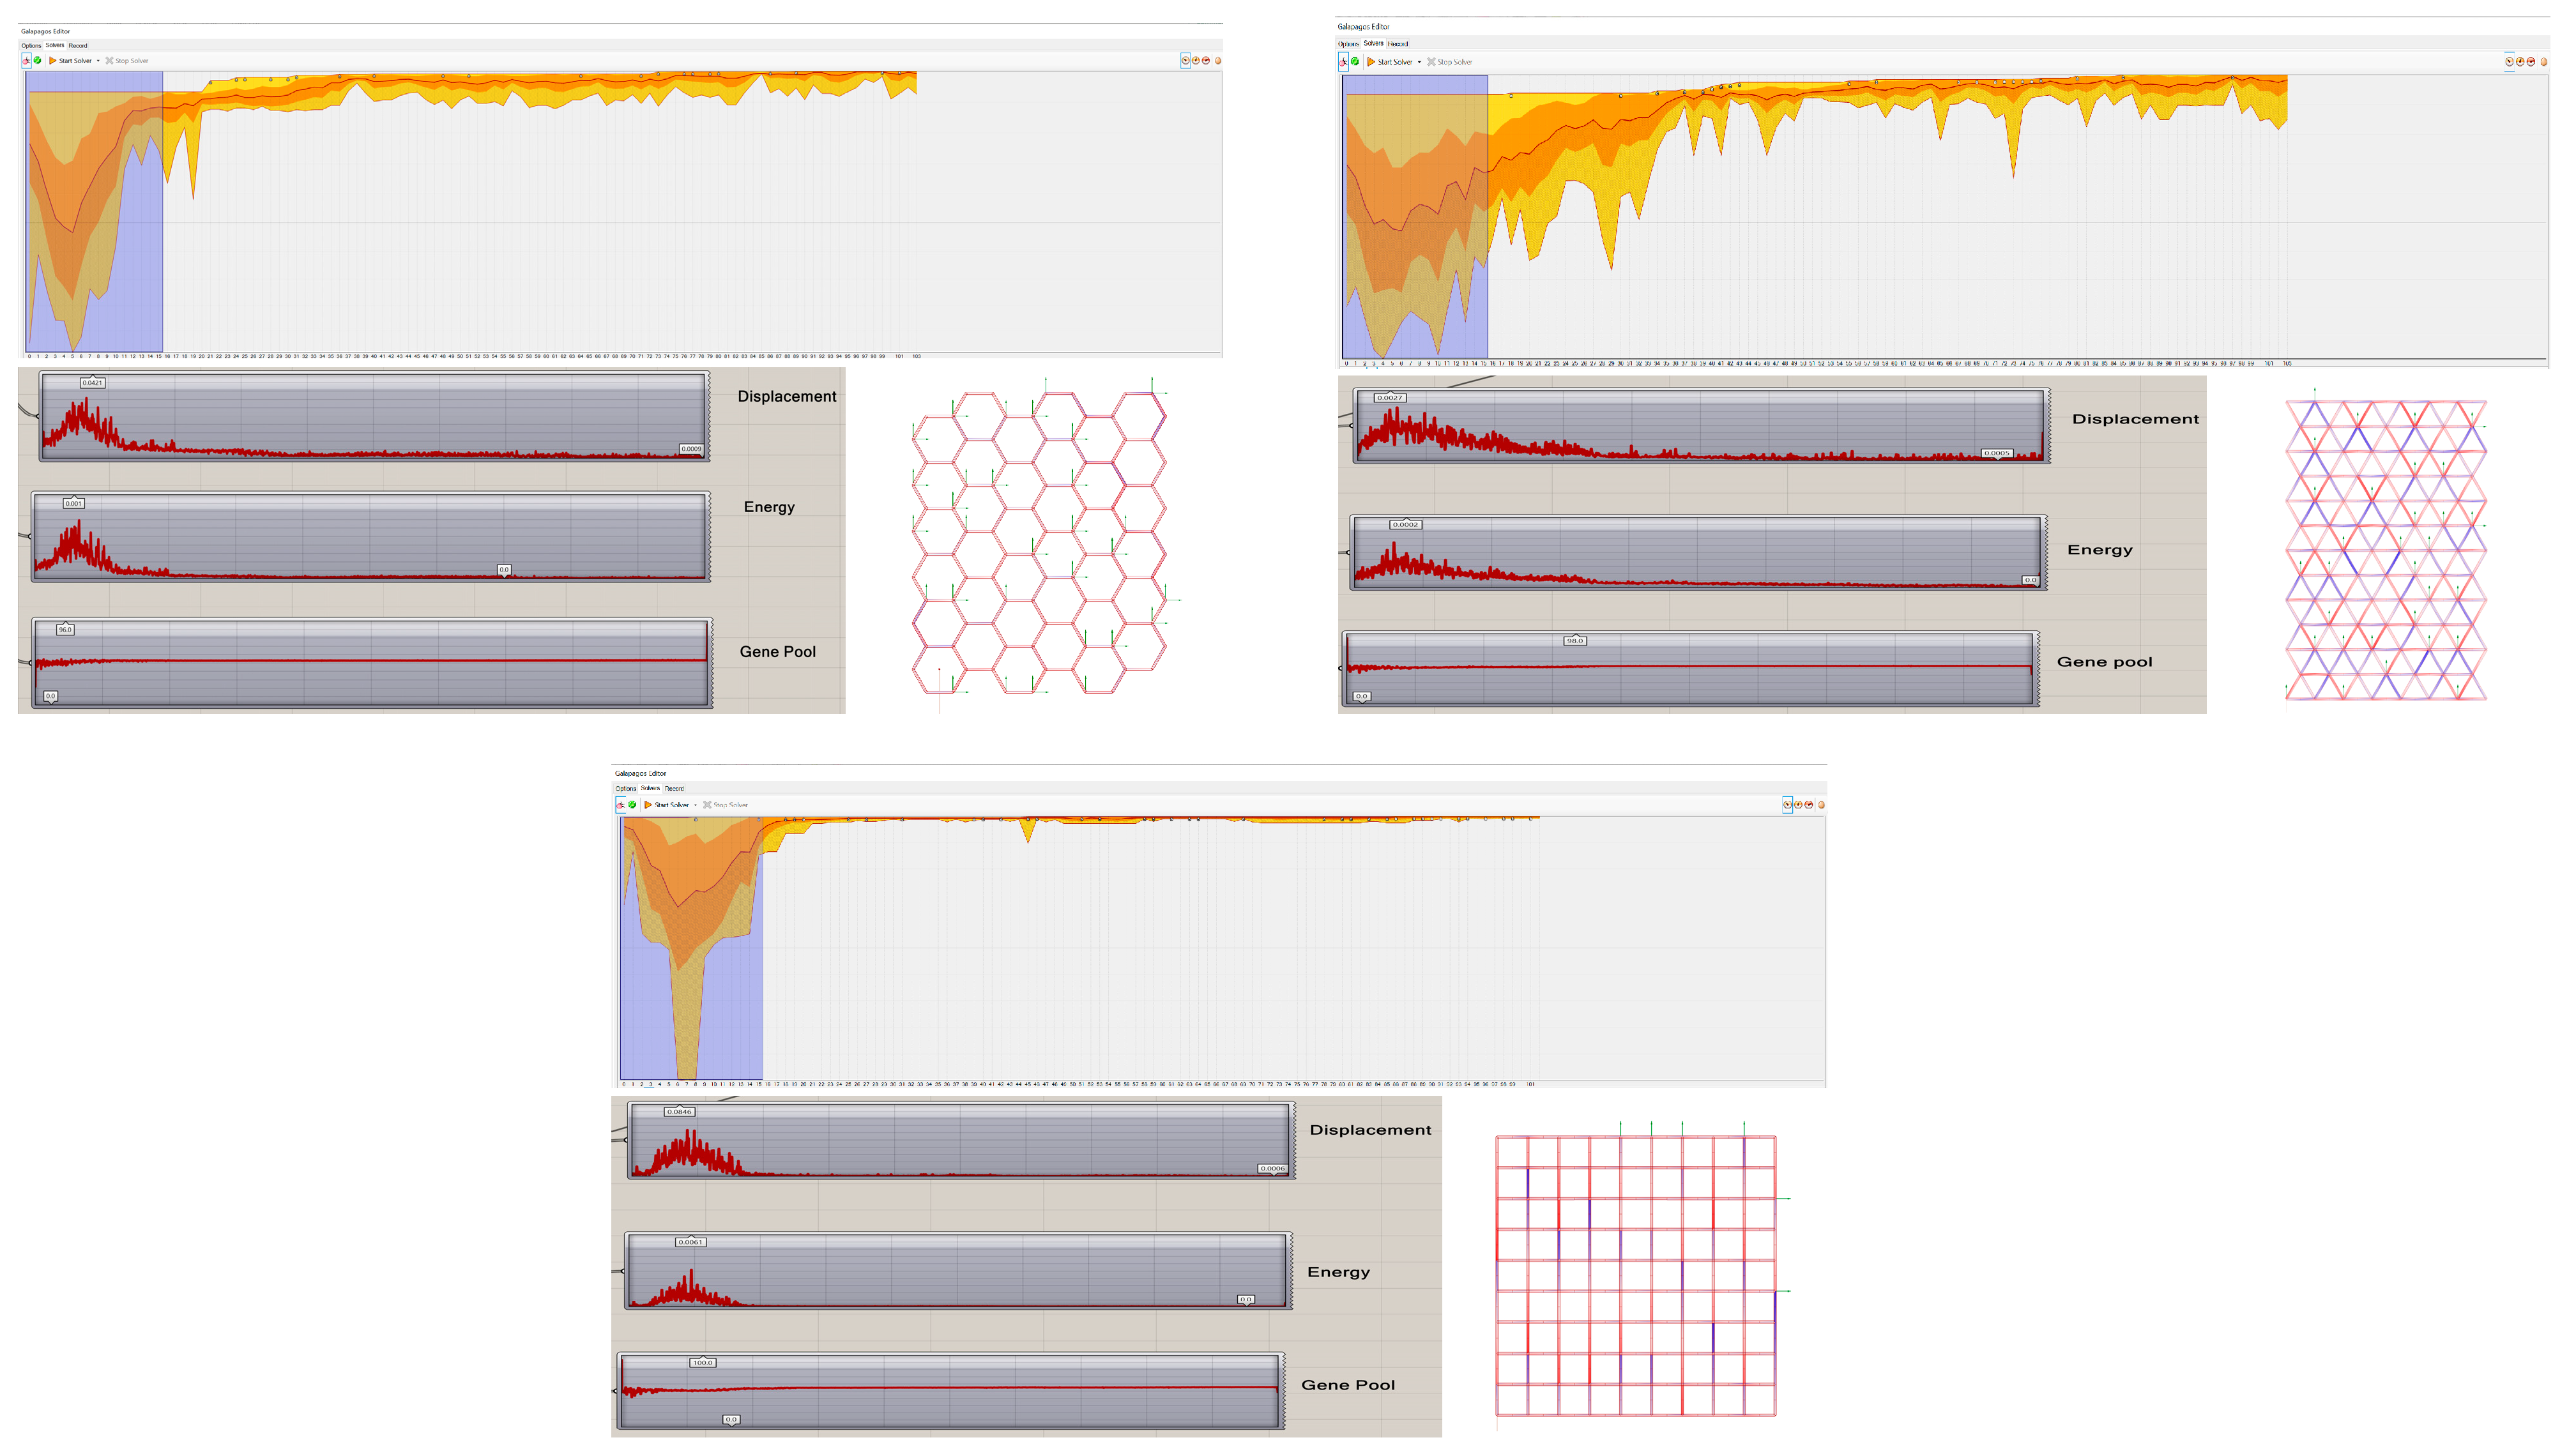
Figure 6 shows the Galapagos editor interface, which is an evolutionary solver component of Grasshopper. The solver progress chart indicates the convergence of solutions over multiple generations, indicated by the color bands and lines. The solid line at the top of the bands represents the “best” fitness score found in each generation. In all three patterns, each color band represents a range of fitness scores, with darker bands likely representing a higher density of solutions. The overall shape of the graph, with the bands narrowing, suggests that as the generations progress, the spread of fitness scores decreases. The sharp peaks and troughs in the early generations indicate significant variation in fitness. We selected 100 generations that were represented on the x-axis. Fitness is a measure of how well a solution meets the set criteria or objectives, which were labeled on the y-axis. The convergence graph of the hexagonal pattern shows a wide range of fitness at the beginning (left side of the graph), indicating high diversity in the initial population. Mutation started from the 21st generation. The triangle pattern is similar to the hexagonal pattern but shows a more volatile progression with larger jumps in fitness values. This could indicate a more aggressive mutation strategy starting 18 on the y-axis or a different parameter. The color bands in the triangle pattern seem to represent a higher density of solutions with a larger spread in fitness, suggesting less convergence than for the hexagonal pattern.
The square pattern started with a very narrow fitness range, indicating that either the initial population was already highly optimized, or the diversity of the population was low. After that the fitness values improved quickly and then leveled off, showing very little variance. The top smooth line indicates consistent performance across generations. The hexagonal and triangle patterns presented initial rapid improvements in the evolutionary progression that slowed down as the algorithm refined the solutions, compared to the square pattern, which showed rapid early improvement but then almost no further progress. In the case of a displacement item, the square pattern included the highest initial peak, indicating a lot of initial movement. The triangle pattern began with a moderate peak that dropped and then leveled out, which could mean less initial movement compared to the hexagonal pattern, which exhibited a high initial peak and then stabilized to a low value, indicating a steady optimization process. For the energy item, the hexagon’s energy peaks were high and quickly stabilized; the triangle pattern showed a moderate, steady decline to stability, while the square’s energy, being between that of the other two, dropped to zero, indicating a successful optimization. In the gene pool, the hexagonal pattern was quickly optimized with low diversity, the triangle pattern optimized more slowly, and the square pattern showed a consistent, smooth optimization process.
2.2. Cross-Section Optimization through Galapagos
Galapagos, known for its design exploration capability, was harnessed to analyze the cross-section of the façade patterns. By inputting the patterns and the genetic algorithm’s findings into Galapagos, a comprehensive analysis of the nodes in terms of structural support and visual obstruction was carried out. Three items were considered for analysis: Displacement that shows how the design responds to external forces; minimizing displacement is important. Another item was related to assessing the structural efficiency provided through deformation energy. Lastly, the gene pool in the genetic algorithm led to a more robust search for an optimal solution.
2.3. Data Acquisition and Analysis
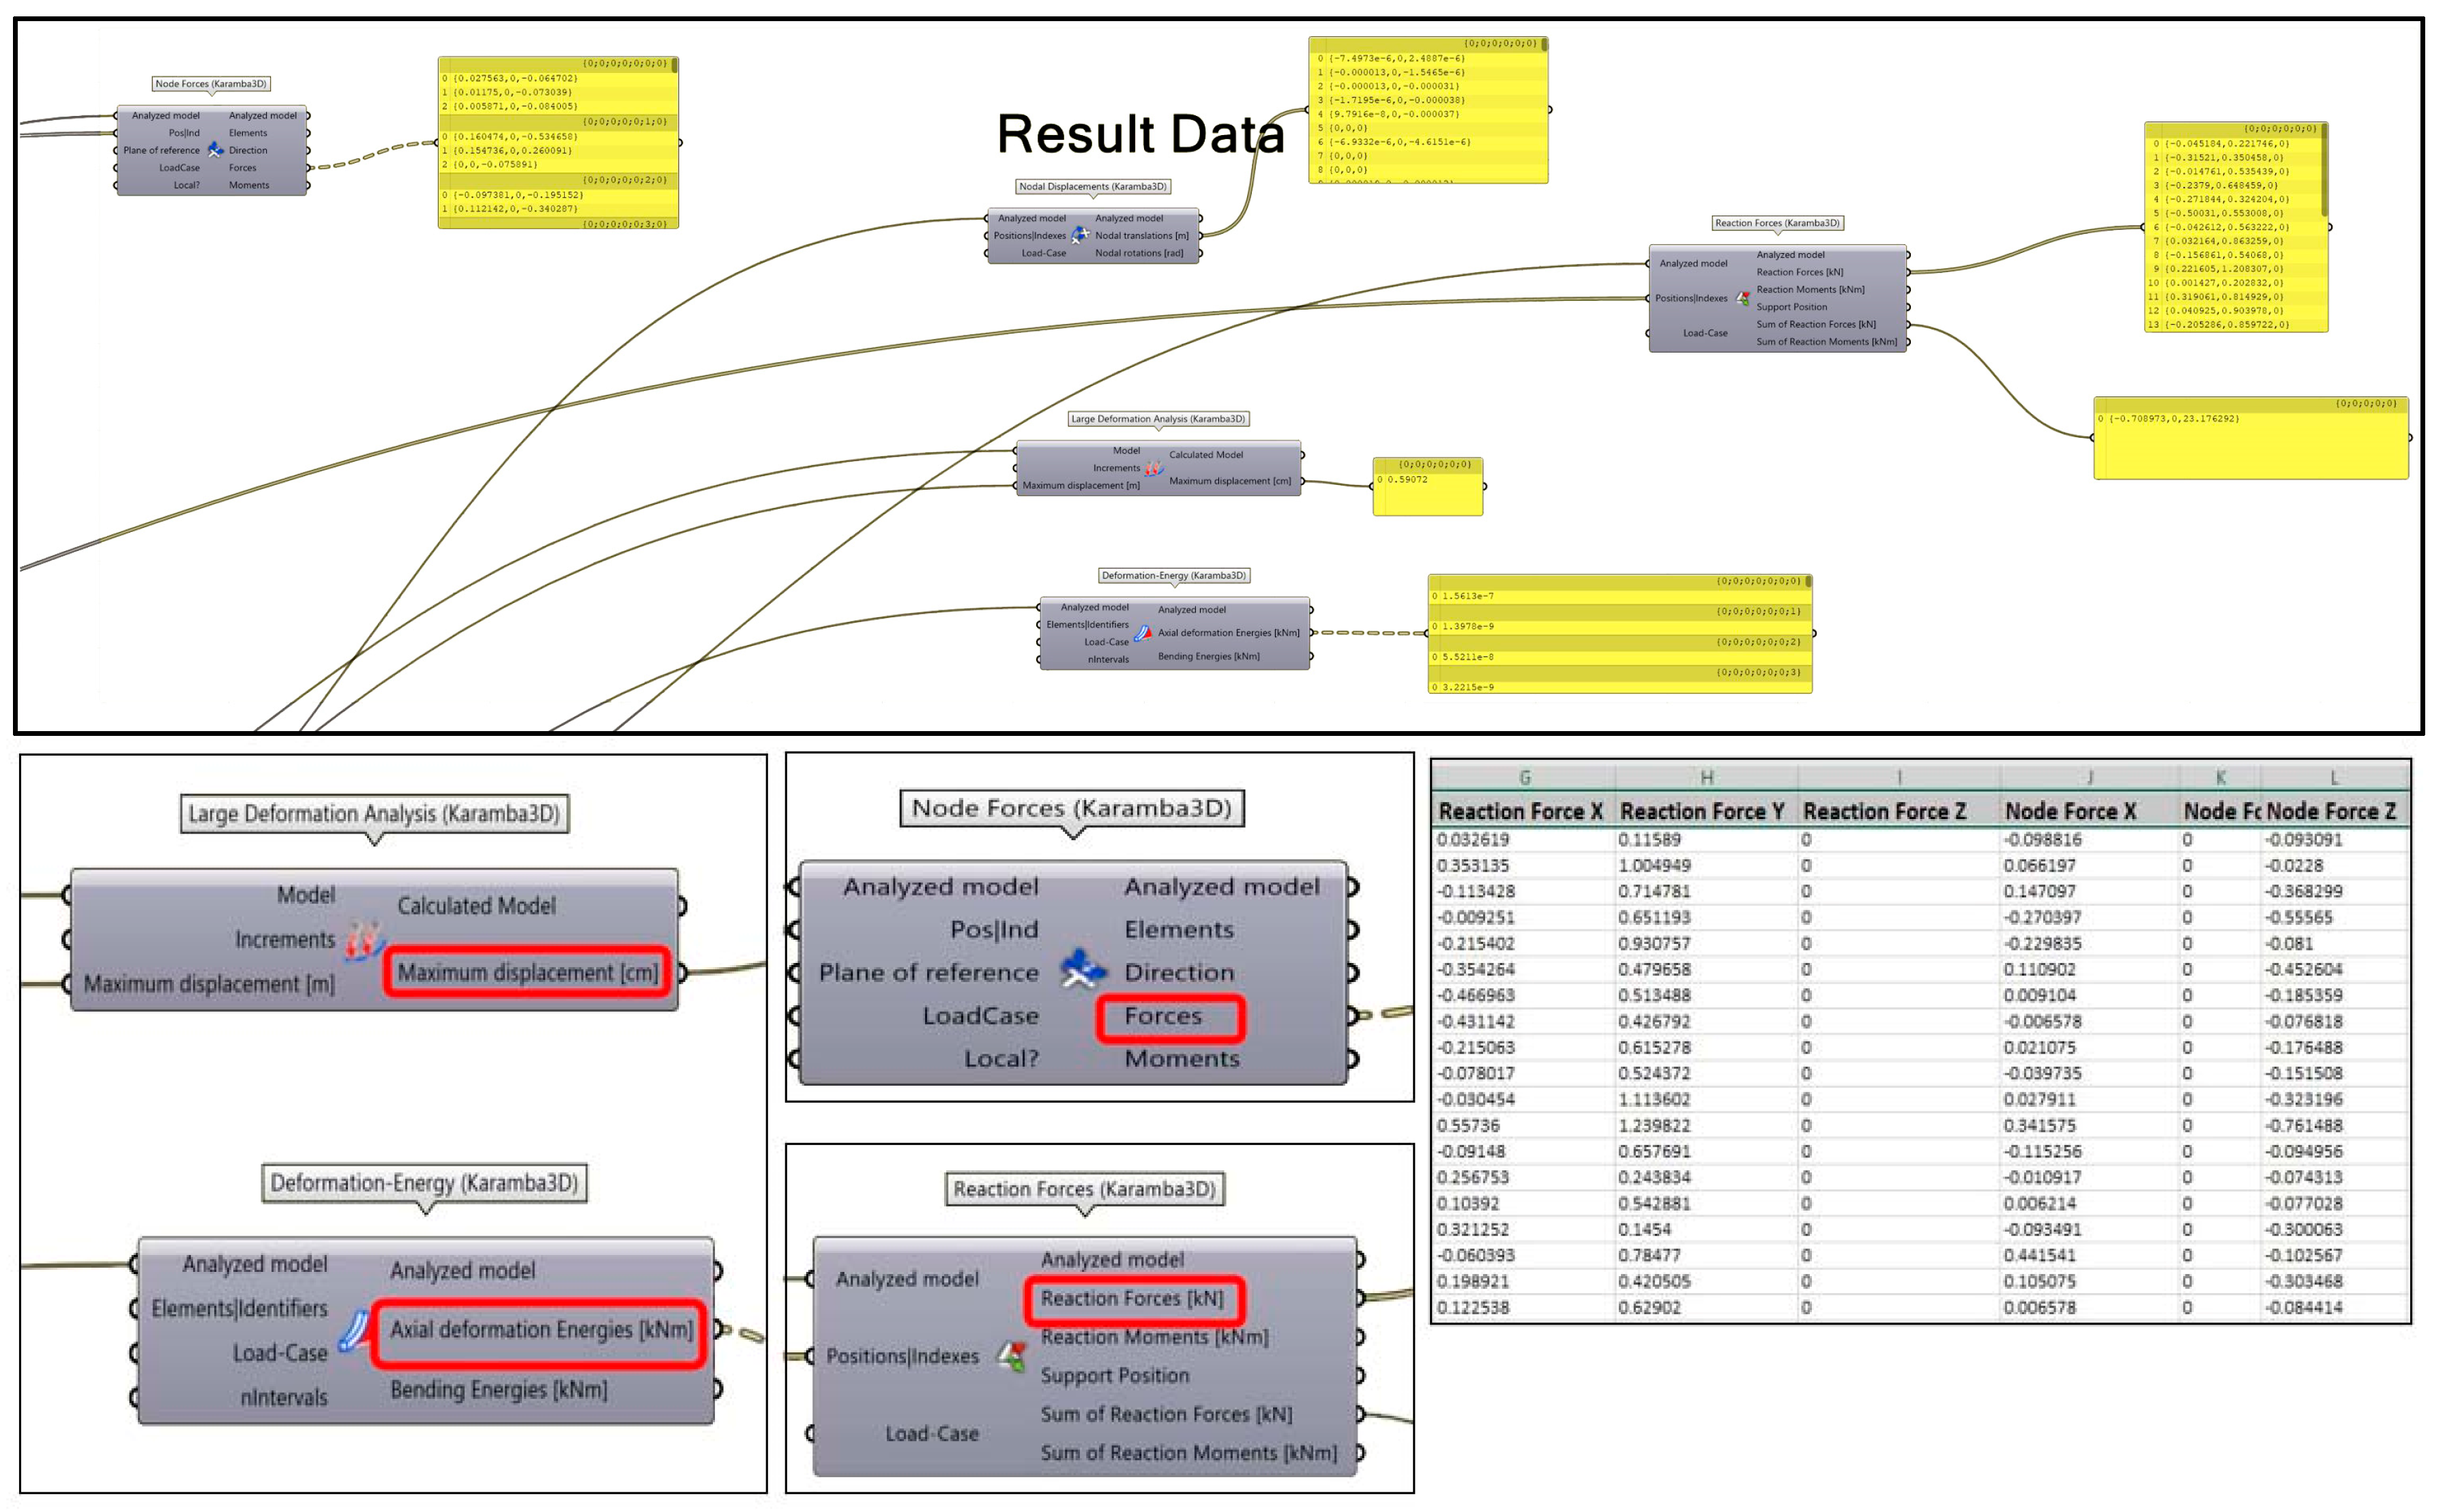
Postoptimization, the data, including node positions and their respective visual impact scores, were extracted. These data were then systematically categorized based on the three geometric grid patterns. Statistical tools and visual diagrams aided in comparing the performance of each pattern. One of the fundamental concepts in structural mechanics is related to maintaining equilibrium in a structure under loads by forces, which is called “reaction forces”. The reaction forces were analyzed for each support to find how different geometries transfer and respond to the applied loads. The corresponding node forces and deformation energy were also analyzed to evaluate the structural mechanism of all grid patterns.
Figure 7 presents the screenshot of the program, illustrating the data acquisition process.
3. Analysis of Results
3.1. Reaction Forces
As discussed above, the performance of the different façade patterns was compared in terms of reaction forces, node force, and deformation energy. Based on these parameters, the grid pattern with its nodes and supports could easily be identified to improve visibility from indoors. The results of the analyses indicated that the hexagonal pattern consistently showed the maximum variation and range across all optimization levels. The square pattern consistently occupied an intermediate position, while the triangle patterns showed the minimum variation and range for all optimization levels.
The reaction forces of three grid patterns are shown in
Figure 8. The x-axis, with the label “Gene”, presents gene values of 8, 16, and 32, and the corresponding reaction forces are presented on the y-axis. The reaction force values of three grid patterns are represented with three different colors. In general, the reaction forces decreased with the increasing number of genes. This was expected because a larger number of genes, which was equal to the number of supports in this case, provide more load distribution and hence reduced reaction force at the single gene level. The reaction forces seemed to be affected by the shape of the grid as well as the direction of the measurements. Lower reaction forces were observed for the hexagonal pattern, while the square pattern showed a considerable spread in values, especially at gene counts of 8 and16, where it reached the highest reaction force values. A moderate level of reaction forces was noticed for the triangular pattern. Some outliers stand out from the main clusters, particularly within the square pattern.
Table 4 presents the maximum and minimum reaction force values in the X and Y directions for the three selected grid patterns corresponding to 32, 16, and 8 genes. The reaction forces were higher in the Y direction than in the X direction. The reaction forces were higher for fewer gene counts, while the values were lower for the hexagonal pattern in general. The maximum values of the reaction forces in the X direction for the hexagonal, triangular, and square patterns were 0.814, 2.53, and 2.41 for gene counts of 8, 16, and 16, respectively. In the Y direction, the maximum reaction force values of the three patterns were measured as 3.93, 7.72, and 20.78 for 8, 16, and 8 genes, respectively.
The results of this research showed a strong relationship amongst the reaction force, grid shape, and gene count. However, more research may be needed to fully understand this relationship.
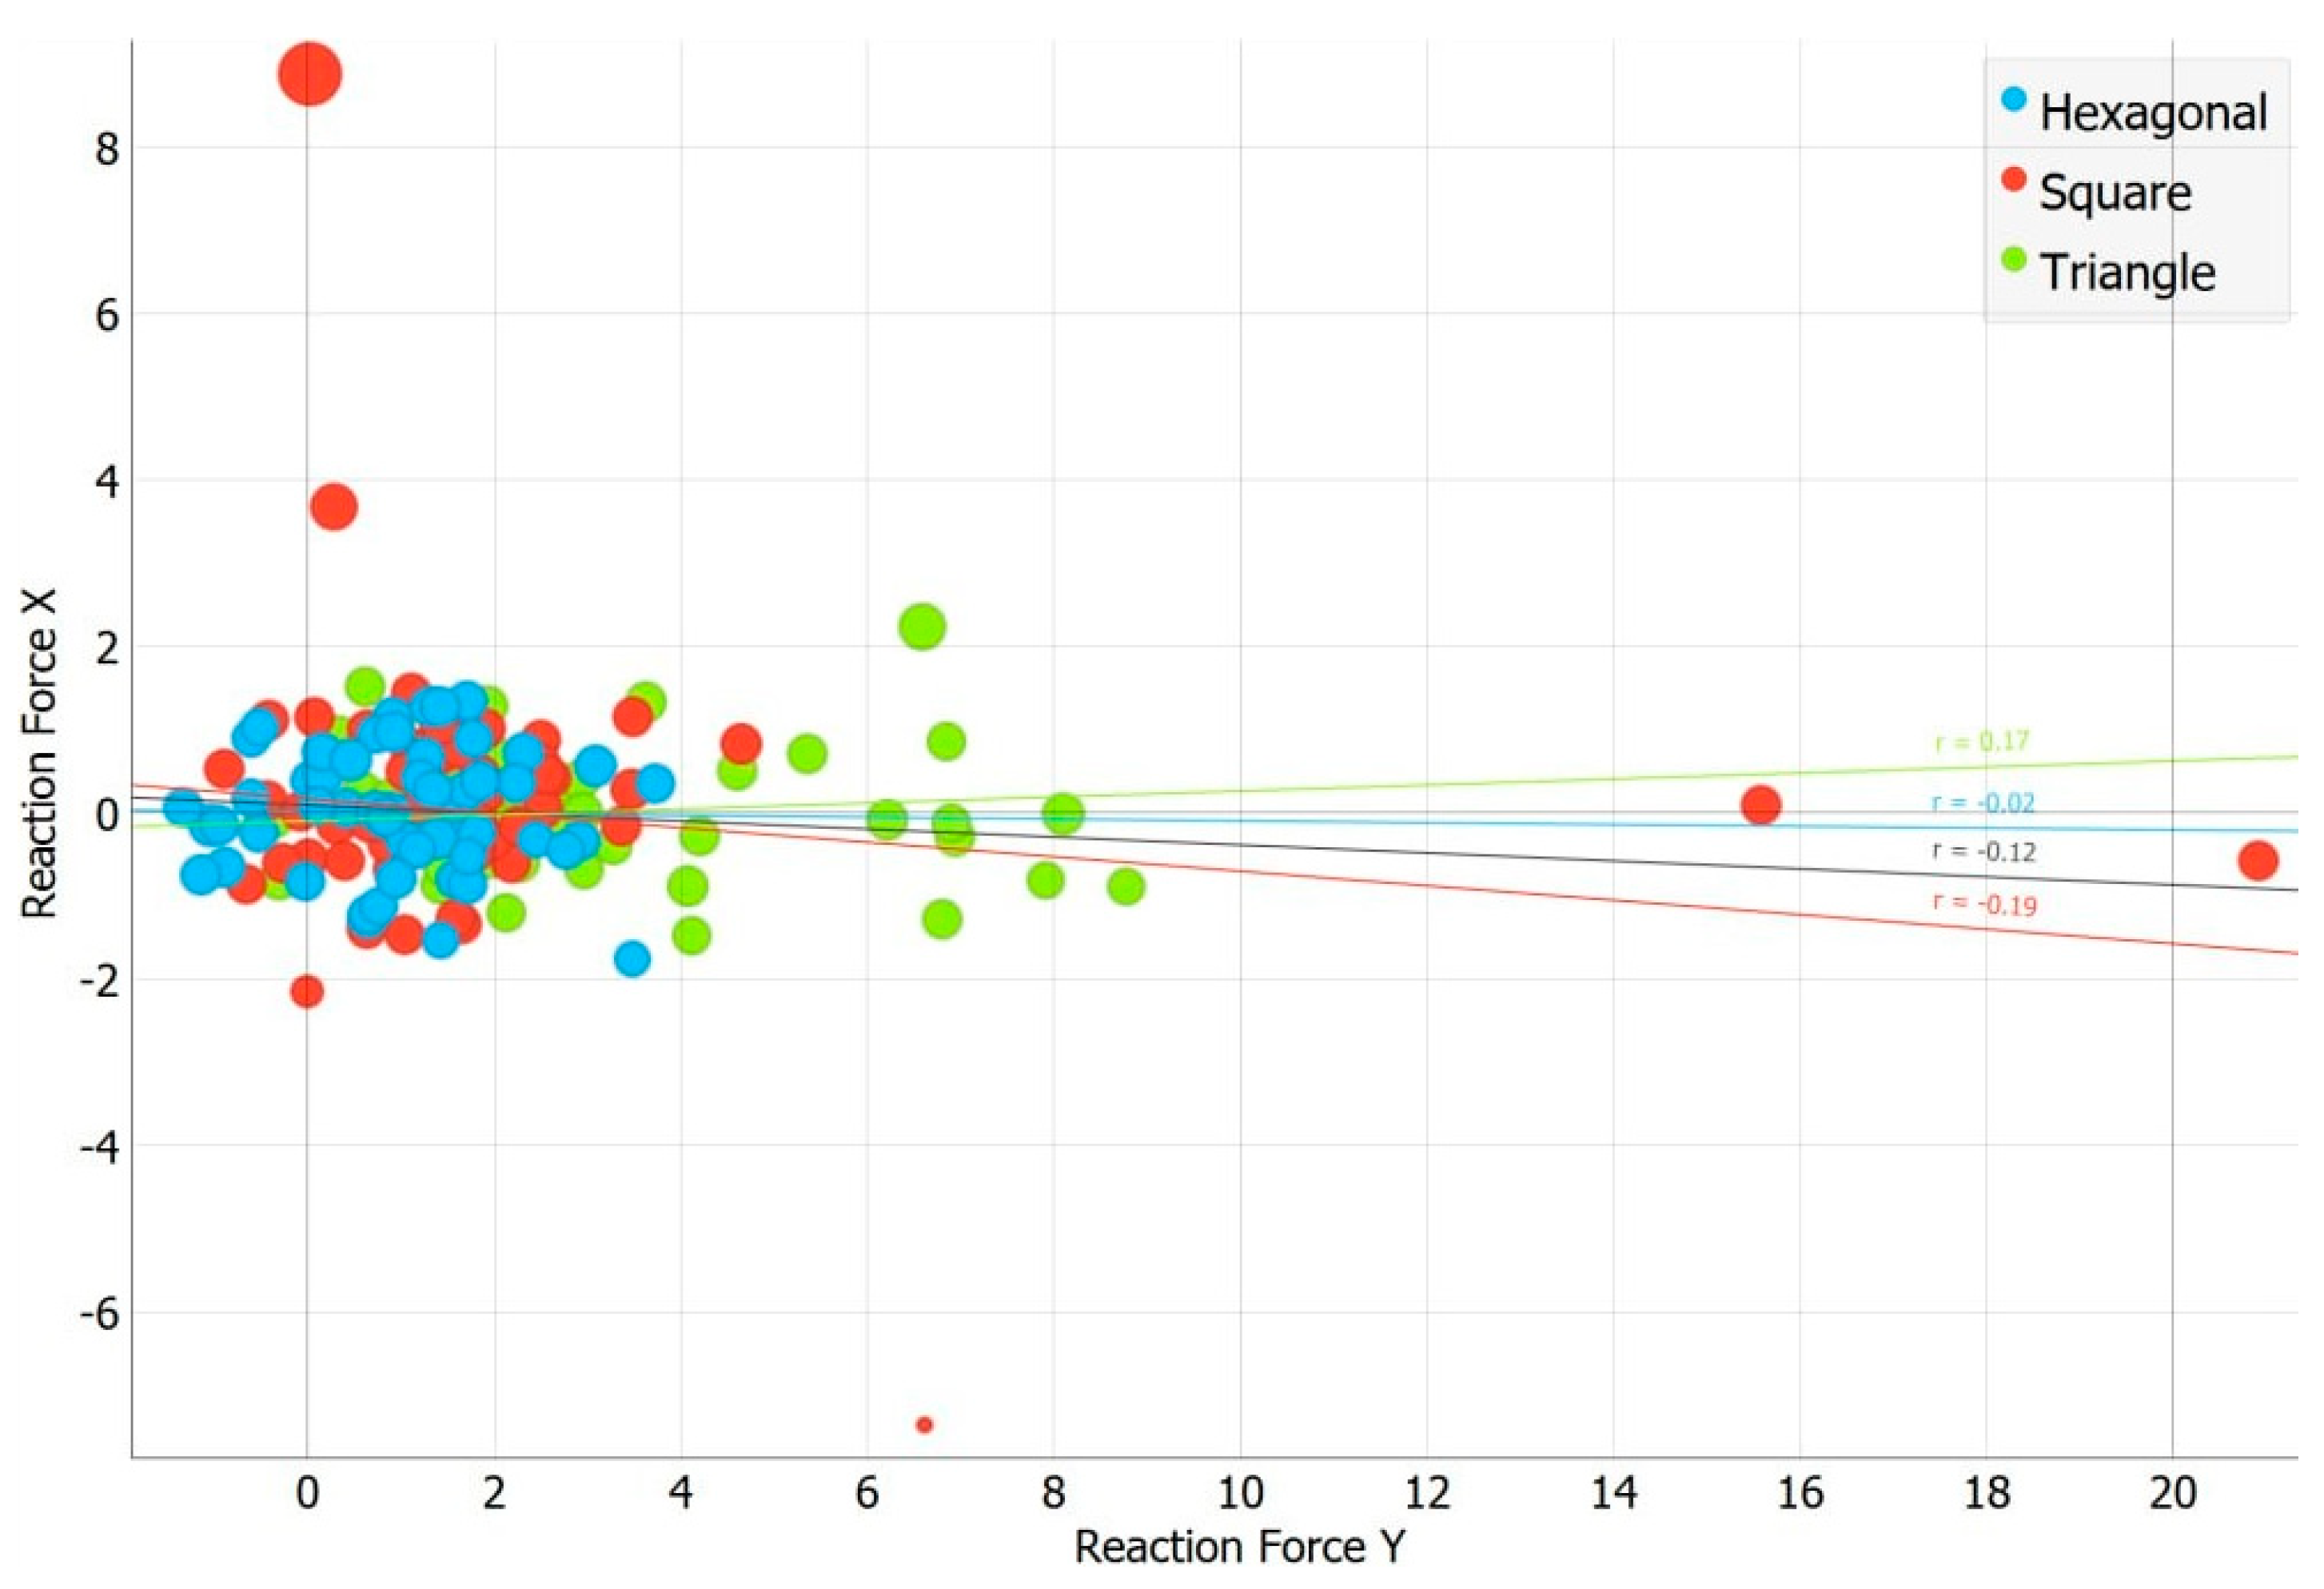
Figure 9 shows the relationship between reaction forces in the X and Y directions for all pattern shapes, i.e., hexagon, square, and triangle. The figure also presents the corresponding logistic regression lines and correlation coefficients (r), indicating weak linear relationships across the categories. Notably, the plot includes scaled data point sizes representing various reaction force values in X direction and potential outliers that deviate significantly from the main data cluster. The shaded areas around the logistic regression lines indicate confidence intervals, adding a statistical inference dimension to the analysis.
To demonstrate potential trends or patterns within the data, we used logistic regression lines, which here suggest a very weak linear relationship between the reaction forces in the X and Y directions. The correlation coefficient r = 0.17 for the hexagonal patterns suggests a slight positive trend in the reaction force in the Y and X directions. The negative correlation coefficients (r = − 0.02 for square and r = − 0.19 for triangular patterns) indicate no real and a very weak correlation, respectively. There is a visible spread of data points for the hexagonal and triangular patterns, while that of the square pattern is less spread out.
3.2. Node Forces
The forces at the grid node may be a crucial index in the structural analysis and optimization of grid patterns. An individual node experiences different forces in a geometric pattern under given loading and boundary conditions.
Table 5 presents the variation in node forces at various optimization levels. The results showed that the square patterns generally exhibited the highest values, especially for node force in the Z direction. The triangle grid patterns typically had intermediate values, while the hexagonal patterns demonstrated the lowest values of node forces.
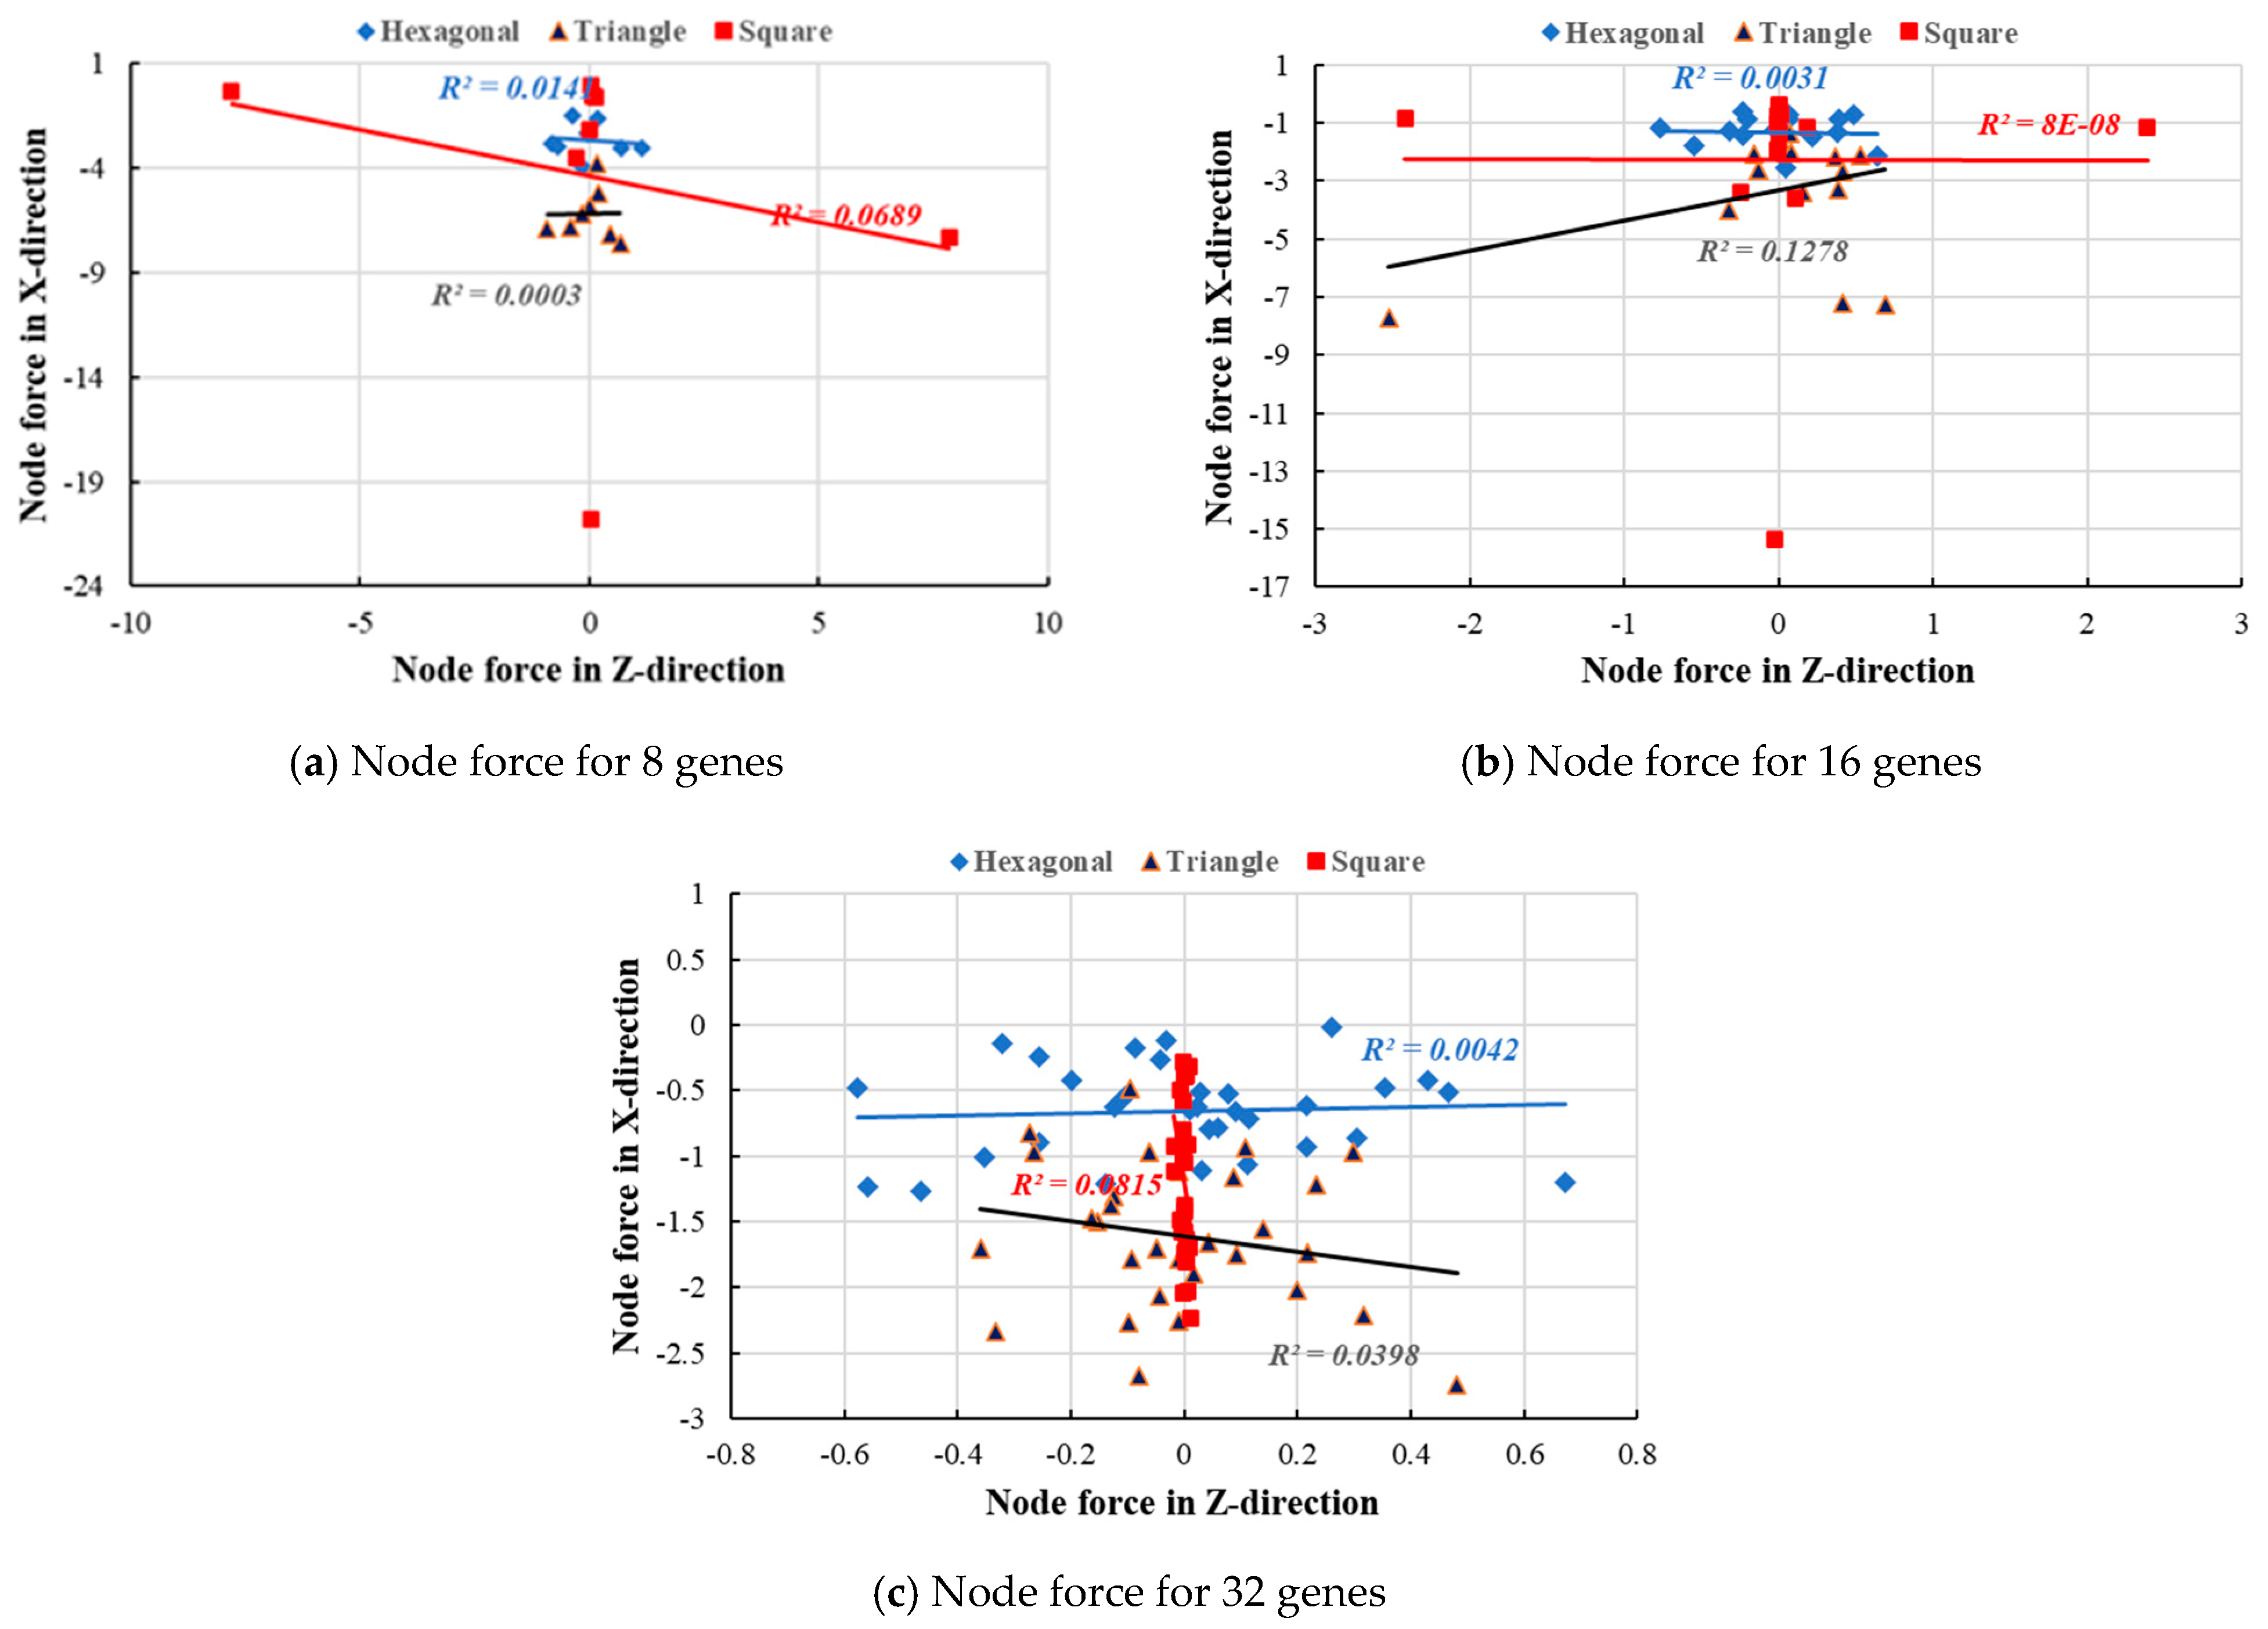
The node forces due to the installed patterns on the façade were analyzed in the X and Z directions.
Figure 10 illustrates the relationship between the node forces for both directions for different gene optimization levels for the three grid patterns. The results showed that the hexagonal pattern’s data points in the eight-gene group were scattered across the entire plot, with values spanning from almost −1 to 1 on the x-axis. For eight genes, the hexagonal pattern is marginally better, but still weak, showing predictive relationship between the two forces. The triangular pattern with 16 genes had a lower R-squared value (nearly zero), indicating almost no linear relationship between the nodal forces at this gene level. The data points for the hexagonal and triangular patterns with 32 genes were more scattered than those in the 8- and 16-gene plots; also, the R-squared value was very low, suggesting no meaningful relationship.
3.3. Deformation Energy
Generally, deformation energy refers to the energy absorbed by a material or a structure when subjected to forces as it deforms under load. In the context of Galapagos, a genetic algorithm plugin for Grasshopper in Rhino 3D, the deformation energy is not a standard or built-in parameter, but it can be a term used in a specific context or project. For instance, one might want to minimize the deformation energy in a structural component to ensure it efficiently resists loads without undergoing excessive deformation or failure. The deformation can be elastic (temporary) or plastic (permanent).
Table 6 shows the variation in the deformation energy measured in this study for different gene optimization levels. The results showed that the rankings of deformation energy varied across optimization levels. The hexagonal pattern often appeared at the top or in the middle of the rankings, while the triangle and square patterns switched places depending on the optimization level.
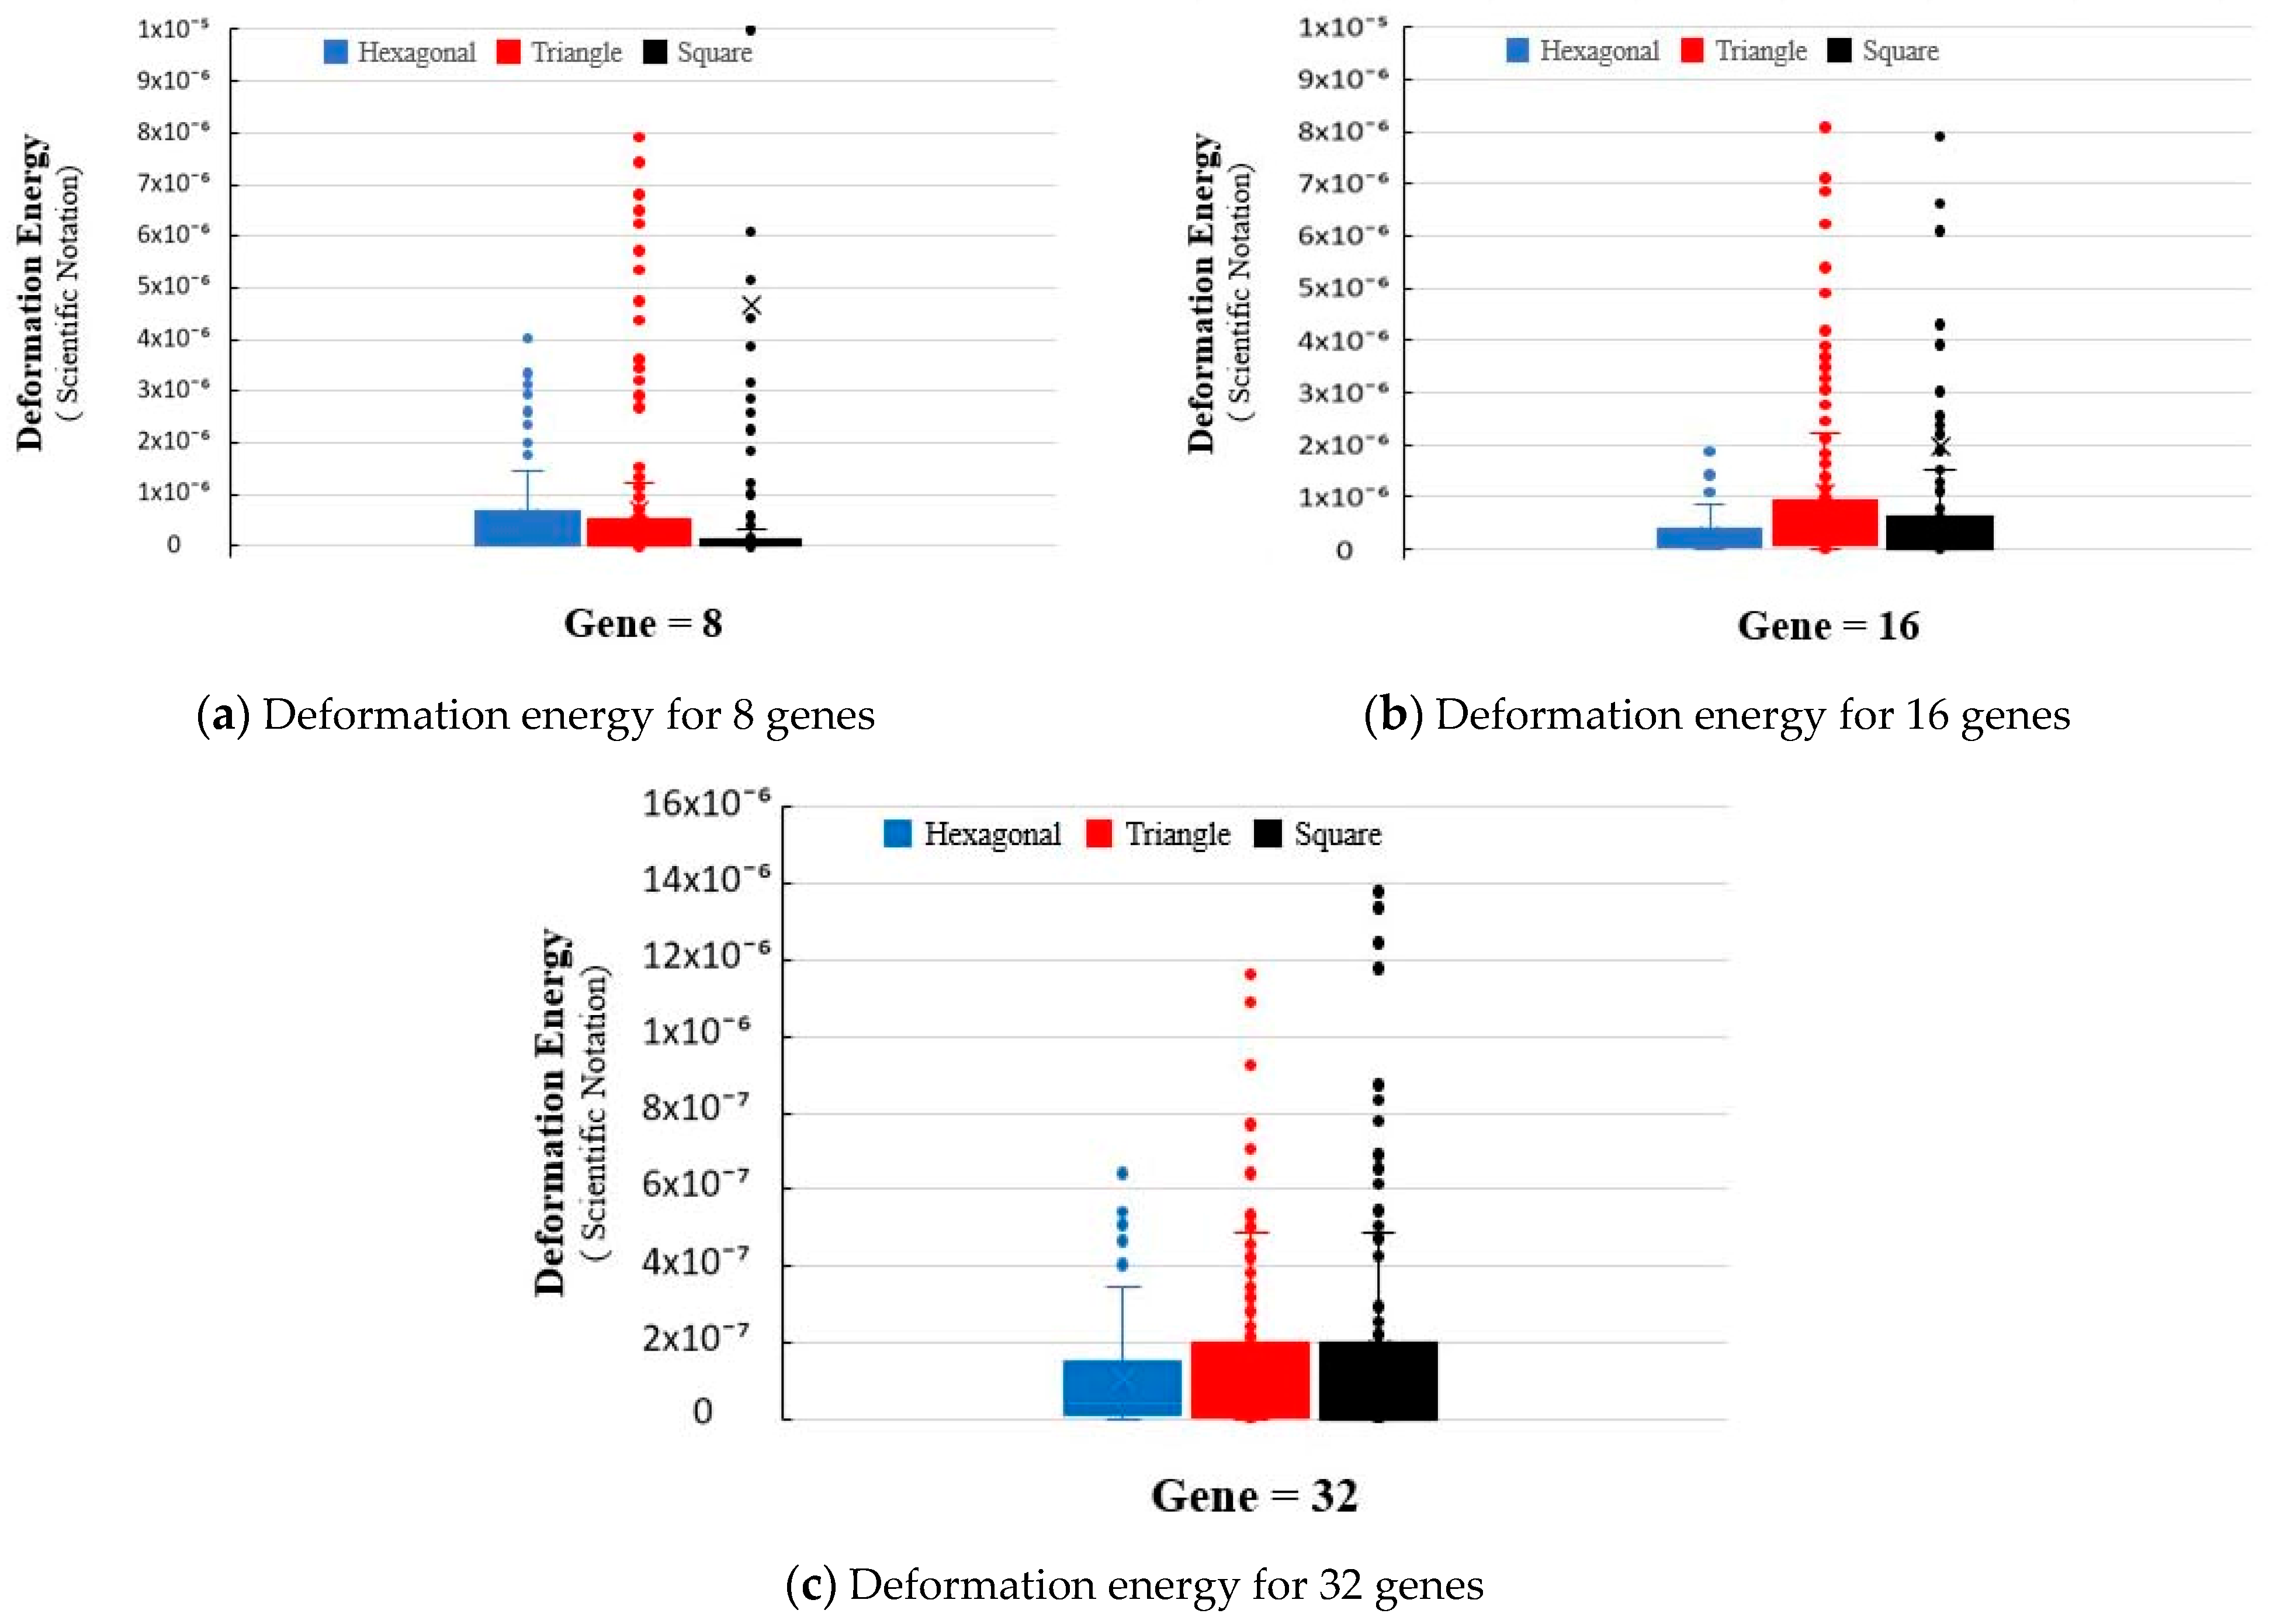
Figure 11 presents the deformation energy distribution according to grid pattern shape for gene optimization levels of 8, 16 and 32. The deformation energy was affected by the number of genes. For the gene optimization level of 32, it was clear that all grid patterns required more energy to deform than for the other gene levels. The gene optimization levels of 8 and 16 showed intermediate or higher values of deformation energy. The maximum energy dissipation values were 7.91 × 10
−6, 1.90 × 10
−5, 1.16 × 10
−6, and 4.02 × 10
−6, 1.87 × 10
−6, and 6.41 × 10
−7 for the triangle and hexagonal grid shapes for the 8, 16, and 32 gene levels, respectively. The maximum energy dissipation of all grid shapes for the different gene levels is reported in
Table 7. For structural mechanisms considering deformation energy, the hexagonal and triangular patterns appear to be the most efficient.
4. Discussion and Recommendations
Through the results obtained from this study, numerous important observations can be made on the optimization of façade patterns utilizing genetic algorithms. For optimizing façade design, GAs showed potential by manipulating the node and support positions of grid patterns. Our research results indicated that, from the evaluation of the reaction forces, node forces, and deformation energy, the hexagonal grid pattern was the most efficient amongst the three chosen grid patterns. In hexagonal grid patterns, a higher number of genes provided a more uniform force distribution, along with low deformation energy values. Similar observations were reported by Gagne and Andersen (2012) [
15]. The grid pattern had a significant influence on the visual performance of façade. The analyses of three different patterns for a façade grid showed that pattern selection could be an important aspect in façade optimization. Abboushi (2021) [
7] also emphasized the importance of grid geometry in façade pattern optimization. The cross-sectional optimization approach used in this study with Galapagos was shown to be effective for data acquisition by providing efficient way to consider several important factors and constraints in façade optimization. Petrovski et al. (2014) [
27] reported similar conclusions about the potential usefulness of Galapagos in architectural design.
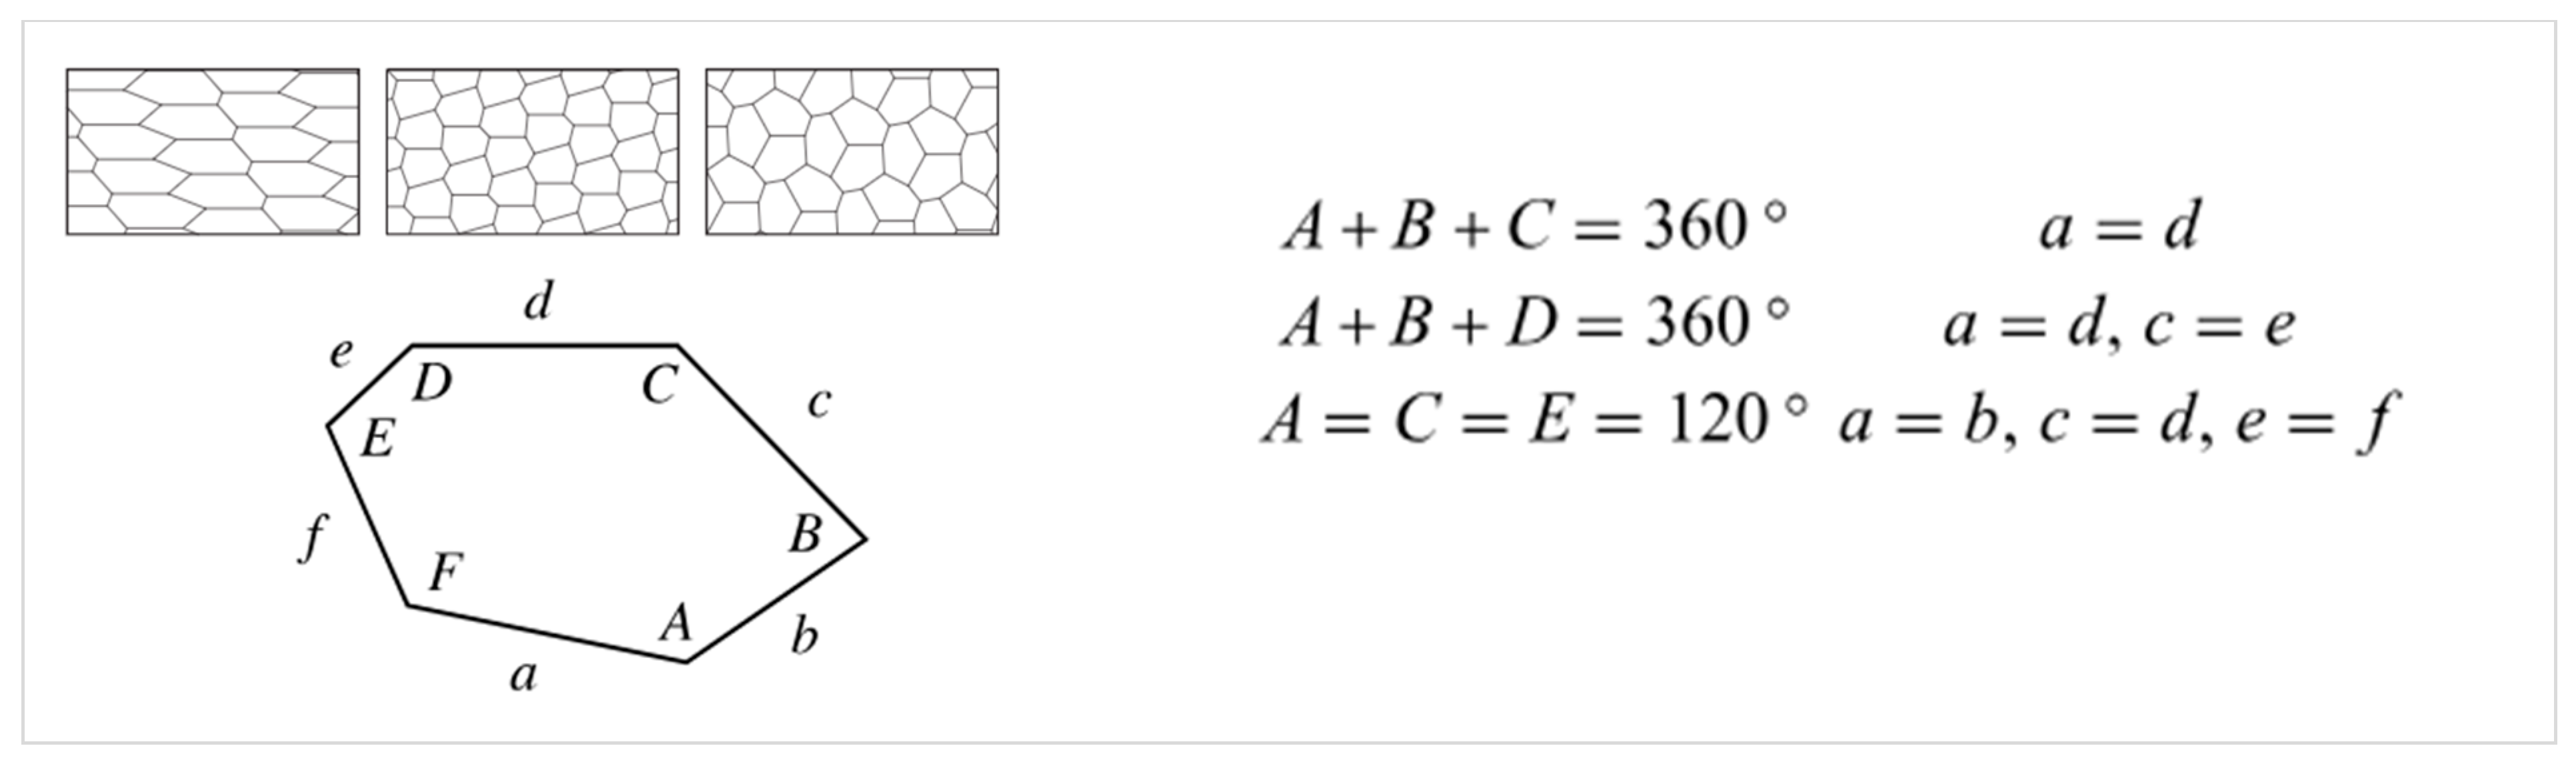
Based on the results of this study, it is recommended that regular and nonregular patterns be used on the designed façade at the same time. This can be achieved by manipulating hexagonal grid patterns, where nonregular patterns can be used in places with larger openings, such as windows. By using nonregular patterns where windows are placed, the patterns can be extended to increase the view from the windows and having no design for windows on the façade.
Figure 12 shows that, generally, in the case of irregular patterns, there are at least three tiling of irregular hexagons, according to hand-calculated formulas, which helped us to understand the pattern [
28].
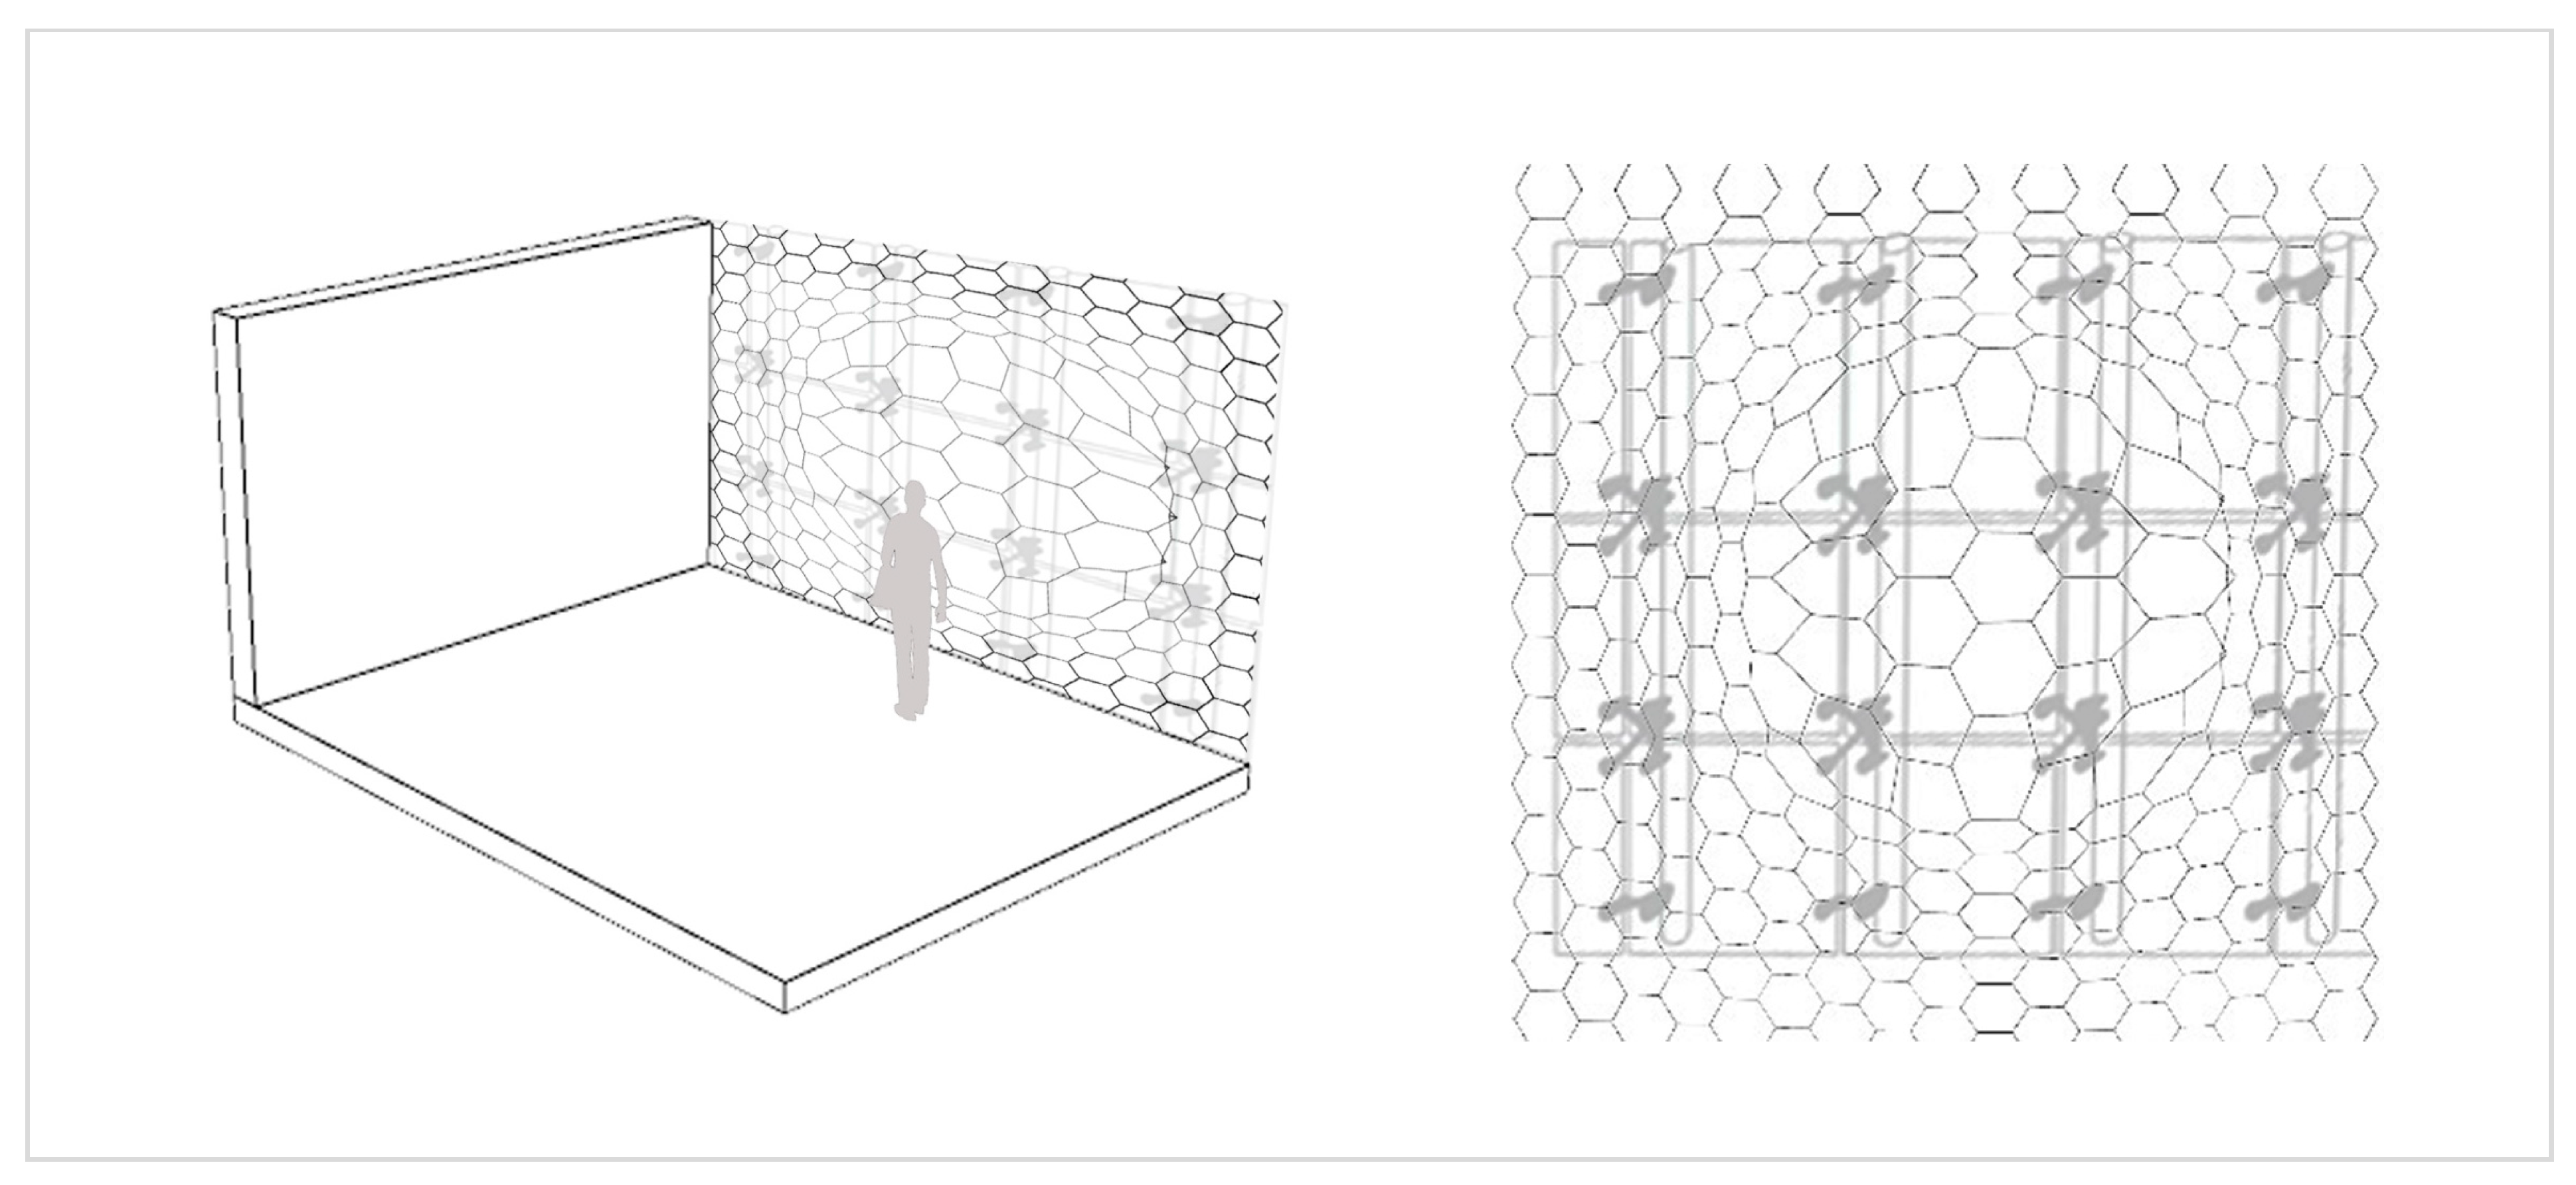
Figure 13 presents the concept of the suggested manipulation with a hexagonal grid. The key criteria considered in this pattern are the uninterrupted visual connection between the indoor and outdoor environments and the optimal utilization of supporters in the façade’s design.
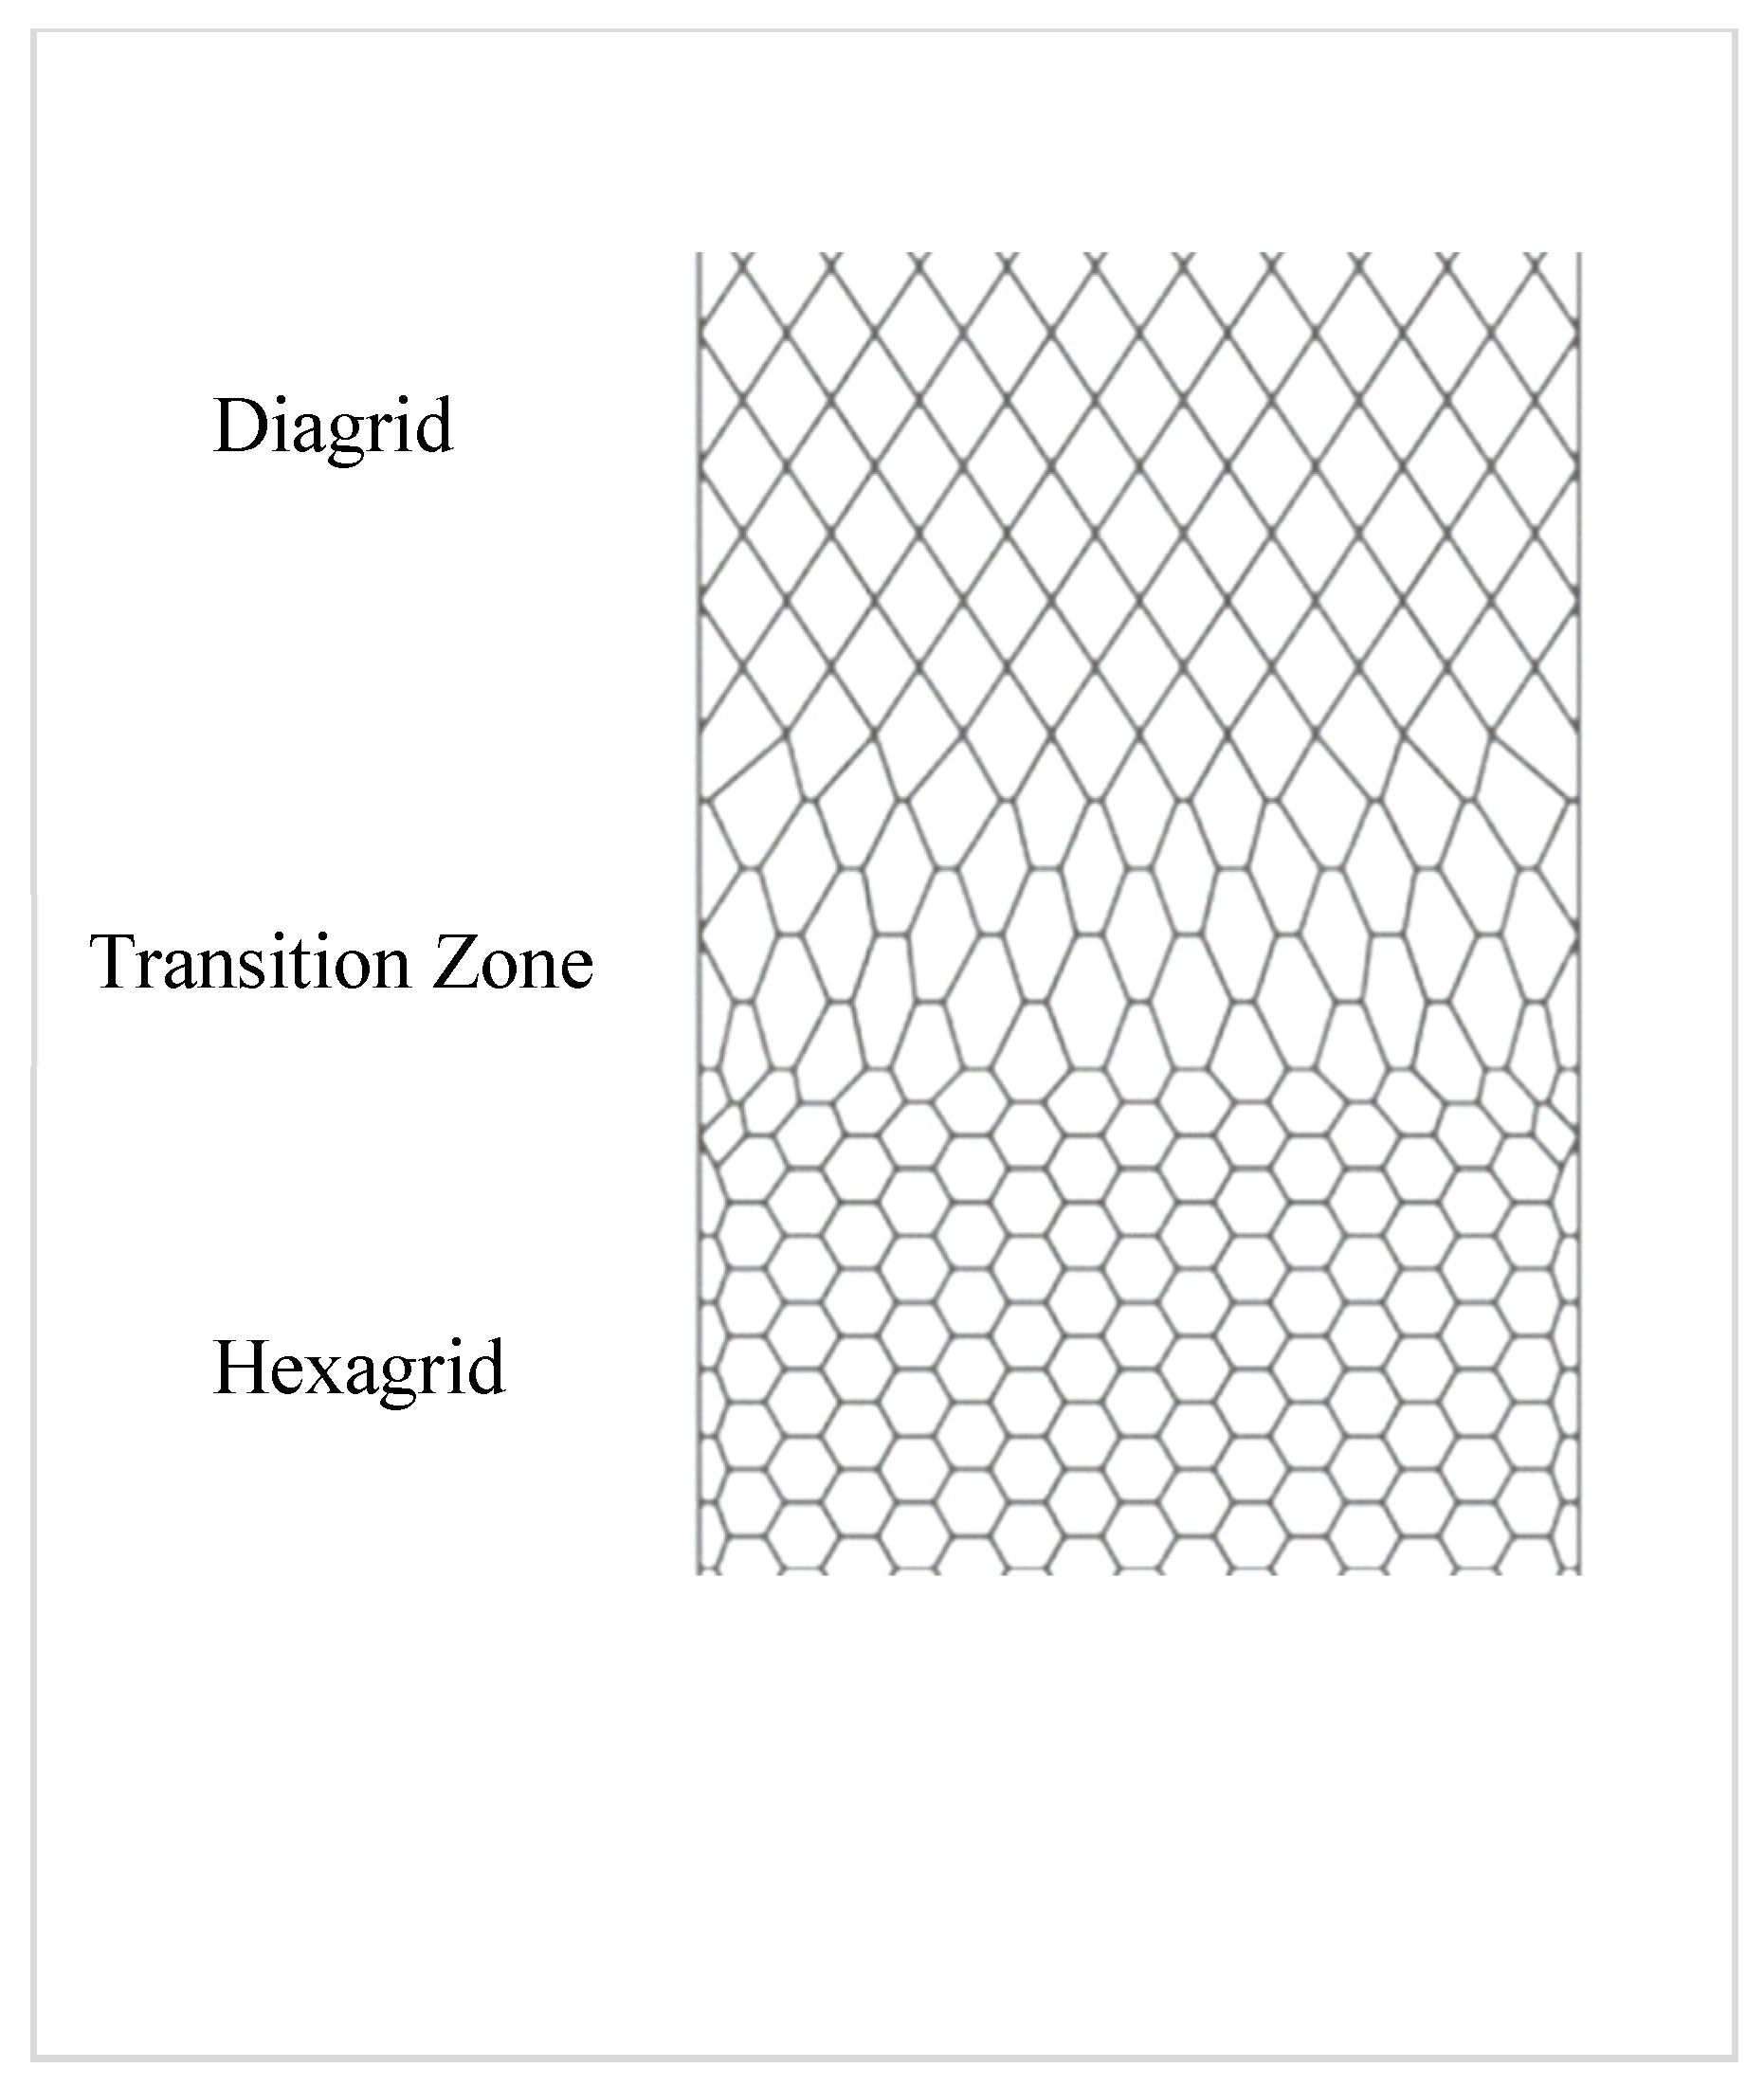
In the following, methods and techniques are mentioned that can be used to change patterns and provide dynamic patterns. These techniques are often used in computer graphics, computational design, and surface meshing for the analysis of different elements and surfaces. A homogenization technique is commonly used in the analysis of composite materials and heterogeneous structures to characterize structural patterns from a mechanical perspective. Montuori et al. introduced a general homogenization approach to characterize structural patterns from a mechanical perspective, focusing on hexagrids and diagrids. They proposed a design procedure based on a simple stiffness criterion and applied it to a tall building case study, evaluating various structural solutions by varying the geometric parameters of the patterns [
29]. The Sinosteel building, designed by MAD Architects and China Construction Design International, was the first tall building that utilized the hexagonal grid pattern for the tube structure. Using the homogenization technique in the design of the façade provided a transition zone between the lower hexagrid and the upper diagrid (43rd–49th floors) as an irregular grid to connect two different kinds of patterns [
30].
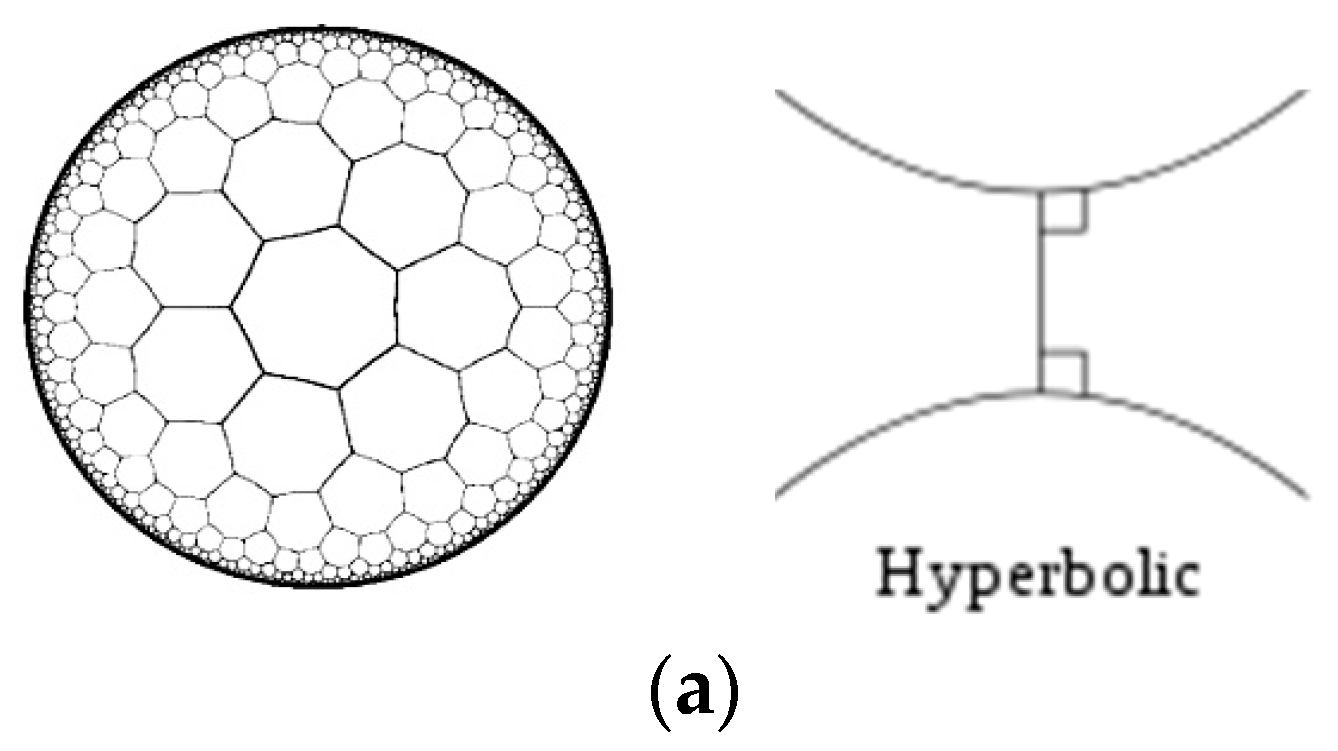
Another approach, hyperbolic tiling, is based on non-Euclidean geometry; distances are not measured using standard methods in hyperbolic geometry. The shortest path between two points in the hyperbolic metric is no longer along a straight line but rather a distinct type of curve (
Figure 14). The sides of every tile are all the same length. This also holds for any two different tiles. Each tile’s sides appear slightly curved, but in the hyperbolic metric, they are straight.
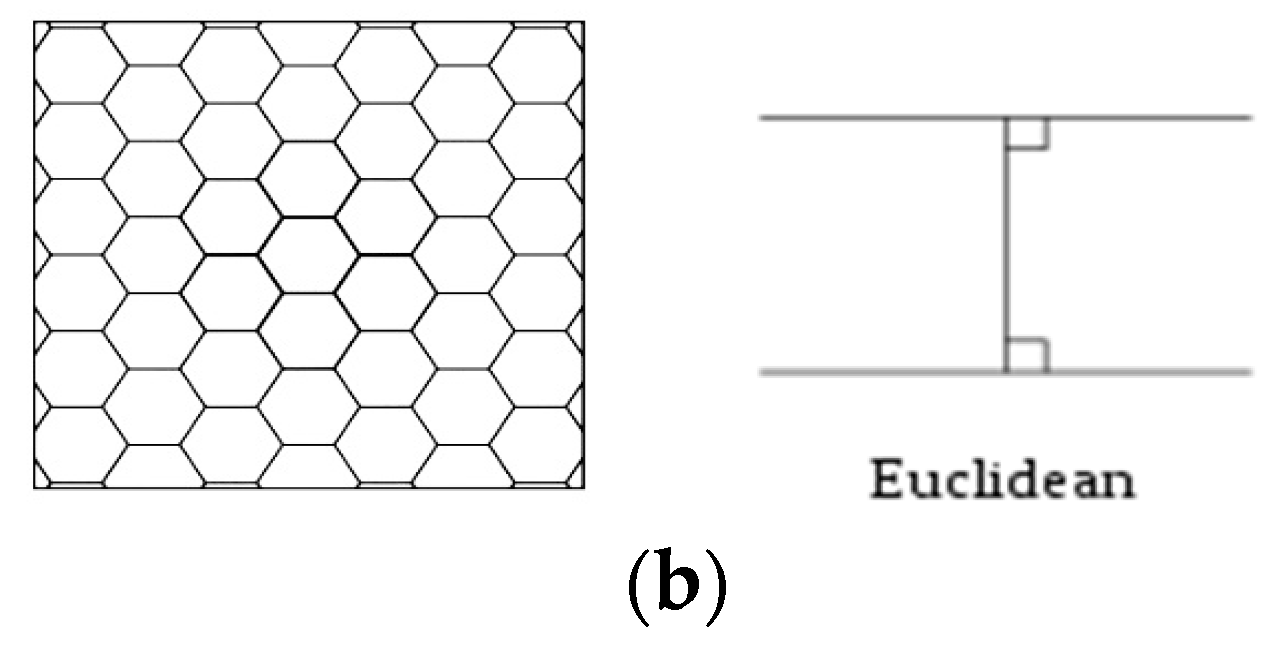
To describe a tiling, all you need is a description of the initial tile together with a list of symmetries that generate the tiling. Although there are infinite numbers of tiles, the list of symmetries is finite, because it may be possible to use all the tiles by applying the same symmetries repeatedly. To create a two-dimensional tiling, whether Euclidean like the one in
Figure 15a,b or hyperbolic, a method of creating identical copies of an initial tile and placing them alongside each other is needed. Mathematically, this job is performed by reflections, rotations, and translations in sequence, which is collectively known as
rigid motions or
symmetries. Each tile is obtained by shifting the initial tile into a given direction by a given distance.
In conclusion, the integration of regular and nonregular hexagonal patterns, informed by advanced computational techniques as mentioned above, allows for the generation of patterns through methods such as anisotropic parameterization, optimality criterion (OC), and pattern search function parameterization. Each of these methods or theories can be applied to transition patterns, which architects can integrate with parametric façade design depending on the specific requirements of the project to improve the indoor environment for building occupants. Furthermore, reductions in the number of nodes and supports not only enhance the visual performance of the façade but also potentially contribute to resource efficiency and cost savings. Future research should explore different geometric pattern designs by using genetic algorithms and other computational design methodologies to create a combined regular and nonregular pattern.
5. Conclusions
This study investigated the potential of using genetic algorithms (GAs) in determining efficient patterns for façade design, aiming to identify patterns that could be extended by reductions in nodes and supports. This optimization crucially diminishes visual disturbances, a fundamental objective for architects aiming to seamlessly integrate indoor and outdoor views, thereby enriching the experience of the building’s occupants.
Three grid patterns, i.e., hexagonal, triangular, and square, were investigated through GAs to achieve an optimized façade. The important parameters for this optimization process were the reaction force, node force, and deformation energy. A programing language-based software “Grasshopper”, along with a plugin “Galapagos”, and “Karamba” (Version 2.2.0) were used in this study. The reaction forces were found to be higher for lower gene levels, while the values were lower for the hexagonal pattern in general. The maximum values of the reaction forces in the X direction for hexagonal, triangular, and square patterns were 0.814, 2.53, and 2.41 for gene counts of 8, 16, and 16, respectively. In the Y direction, the maximum reaction force values of the three patterns were measured to be 3.93, 7.72, and 20.78 for 8, 16, and 8 genes, respectively. The results showed that the square grid shape exhibited the highest levels of deformation energy, with maximum energy dissipation values of 2.23 × 10⁻⁴, 9.8 × 10⁻⁵, and 1.39 × 10⁻⁶ for 8, 16, and 32 genes, respectively. The maximum energy dissipation values for the triangular and hexagonal grid shapes were 7.91 × 10⁻⁶, 1.90 × 10⁻⁵, and 1.16 × 10⁻⁶, and 4.02 × 10⁻⁶, 1.87 × 10⁻⁶, and 6.41 × 10⁻⁷ for 8, 16, and 32 genes, respectively.
The analysis of the results showed that, with its low deformation energy, low node force, and reduced reaction force, the hexagonal pattern is more efficient than the two other patterns. This efficiency provides an opportunity for adaptation and transformation into an irregular pattern around window placements, increasing the field of view for building occupants. Based on the result of this study, it is recommended that, with manipulation, a hexagonal pattern with a combination of regular and irregular patterns can be created. Such an approach may facilitate a better façade design with higher visibility for those indoors. Through this methodical approach, this research conclusively demonstrated that with the right tools and strategies, optimizing façade designs can lead to superior visual experiences for occupants, harmoniously blending the indoor and outdoor environments.
Further research can be carried out utilizing more patterns and/or more variables to explore the potential of genetic algorithms and other computational design methodologies to further push the boundaries of architectural design, particularly in the domain of façade optimization.


