Abstract
The seismic behavior of the end-plate connections between a steel beam and the weak axis of the H-shaped steel column using a U-shaped connector was investigated using numerical analysis. Finite element (FE) models were established using ABAQUS 6.14 software, and the applicability of the modeling approach was verified by comparing the numerical results with the relevant experimental results. This parametric study of the joint was carried out to analyze the effects of the thickness of the U-shaped connectors, the thickness of the end-plates, the axial compression ratio of the columns, and the linear stiffness ratio of the beam to the column. The results show that the U-shaped connector set in the weak axis of the H-shaped column can form a box-shaped panel zone with the column flange and web. The volume of the panel zone and its resistance to shear deformation are increased through this connection. Finally, the recommended reasonable ranges for the thickness of the U-shaped connector, the thickness of the end-plates, the axial compression ratio of the columns, and the linear stiffness ratio of the beam to the column are proposed in this paper.
1. Introduction
The semi-rigid connection behavior is between the rigid and hinge connections, which can effectively transfer the shear force and bending moment. A relative rotational angle will exist between the beam and the column, which has a certain rotational ability [1]. As a classic semi-rigid connection, the high-strength bolted end-plate connection has excellent ductility and energy dissipation capacity [2,3], which can reduce damage in an earthquake.
There is much research on the high-strength bolted end-plate connection behavior in the strong-axis direction of H-shaped steel columns. Shi et al. [4] applied cyclic loads to eight end-plate connections with different structures for experimental investigation. The results showed that excellent ductility and energy dissipation capacity were applied to the semi-rigid end-plate connection of beam to column and could be applied in multi-story steel frame structures. Shi et al. [5] used the finite element (FE) method to investigate the mechanical behavior of two types of semi-rigid connections: flush end-plate joints and extended end-plate joints. The results showed that setting the stiffener on the extended end-plate could give the joint better mechanical behavior. Zhao [6] conducted a series of experimental studies on the stiffness of the extended end-plate strong-axis connection and obtained the effect of the end-plate on the stiffness of the strong-axis joint. Ghobarah et al. [7] conducted an experimental investigation on the panel zone mechanical behavior of the strong-axis end-plate connection. The results showed that the panel zone was an important member of structural energy dissipation, ductility, and bearing capacity stability. Sumner et al. [8] performed a quasi-static loading test on the extended beam-to-column end-plate connection with end-plate stiffener. The test results showed that the joint’s strength, stiffness, and ductility could be improved effectively by adding the end-plate stiffener.
In the weak-axis connection of the H-shaped steel column, the steel beam is connected by a wedge-shaped stiffened plate in the traditional weak-axis direction. However, the plastic hinge formation position of the beam end is generally near the butt welding of the beam, making it easy to cause welding damage. Cabrero et al. [9] proposed a joint with two separate additional plates welded to the beam flange as an end-plate in the weak-axis direction and carried out a monotonic loading test. The results showed that the bearing capacity and rotation stiffness of the weak axis of the column were improved by increasing the thickness of the end-plate. Nie et al. [10] carried out seismic research on the end-plate edge connection of a steel beam to the weak axis of an H-shaped column with a U-shaped connector and proposed the end-plate’s thickness and the stiffener’s structural value. Lu and Wang [11,12,13] proposed the box-shaped panel zone end-plate connection for the weak-axis column, and the seismic performance of the joints with stiffener at the beam end was analyzed. The results showed that the stiffness and bearing capacity of the joint could be improved effectively by setting a stiffener in the joint. Tagawa et al. [14] carried out experimental research and numerical analysis on the mechanical behavior of bolted end-plate connections with channels and discussed the mechanical behavior of the panel zone. The results showed that the joint’s bearing capacity and shear capacity could be improved by setting a stiffener in the channel.
Conventional weak-axis connections use brackets that require four connections, complex construction, and inconvenient transportation [15]. Kim [16] conducted the experimental and theoretical analysis of the beam–column connection of the H-shaped column’s weak axis, which was used to connect the steel beam and column web. The connections were designed with T-shaped connectors, specifically split-tee, welded split-tee, end-plate, and conventional bracket. These T-shaped connectors and end-plates were connected directly to the column web, which would induce large deformation and lower stiffness of the column web. The results showed that the tensile-connected bolt determines the maximum strength and ductility of the connection. Shim [17] proposed a beam-to-column connection, in which an H-shaped steel beam is joined to an H-shaped steel column by bolted splices at the top flange without a scallop at the web.
For other reinforcing methods on joints, Nassiraei et al. [18] evaluated the effect of the ring, the plate, and the joint geometry on the failure mechanisms of tubular X joints subjected to axial compression in different fire conditions. The results showed that both the external ring and plate could increase the joints’ initial stiffness and ultimate capacity in fire conditions. Rahgpzar et al. [19] adopted the Fiber-Reinforced Plastic (FRP) plate to improve the flexural strengthening of precast beam–column joints. Experimentation and finite element analyses led to the conclusion that longitudinal beam reinforcement ratios directly influenced the load-bearing capacity. Nie et al. [20] proposed a weak-axis connection form of a steel tube-reinforced beam with an opening in the web. The results showed that the opening distance greatly affected the position of the plastic hinge. The numerical analysis of the seismic behavior of square steel tube confined steel-reinforced concrete column-RC ring beam joint was conducted by Nie et al. [21]. The results showed that the ring beam played a good role in protecting the core area of the joint.
The stiffness and strength of conventional weak-axis connections using brackets or other T-shaped connectors were lower than those of the strong-axis connections. The traditional connection method weakened the column and decreased the stiffness of the panel zone in the weak-axis direction. Therefore, meeting the seismic needs of the ‘strong joint with weak member’ is problematic. This paper proposes the end-plate connection of a steel beam to the weak axis of an H-shaped column using a U-shaped connector. A strong box-shaped panel zone of this kind of joint is formed in the weak-axis direction so that the joint stiffnesses in the strong-axis and weak-axis directions are proximal. It is easy to satisfy the anti-seismic demand of ‘strong joint, weak members’. In addition, the U-shaped connector and end-plate could be connected easily with high-strength bolts. The assembly efficiency, ductility, and energy dissipation capacity of the panel zone could be improved.
This paper used ABAQUS 6.14 software to conduct in-depth research on the seismic behavior of the novel end-plate joint. The effect of the thickness of the U-shaped connector, the stiffener’s length and height, the beam end-plate’s thickness on the failure mode, and the seismic behavior of the joint are analyzed in detail, and design methods are proposed.
2. Design of Specimen
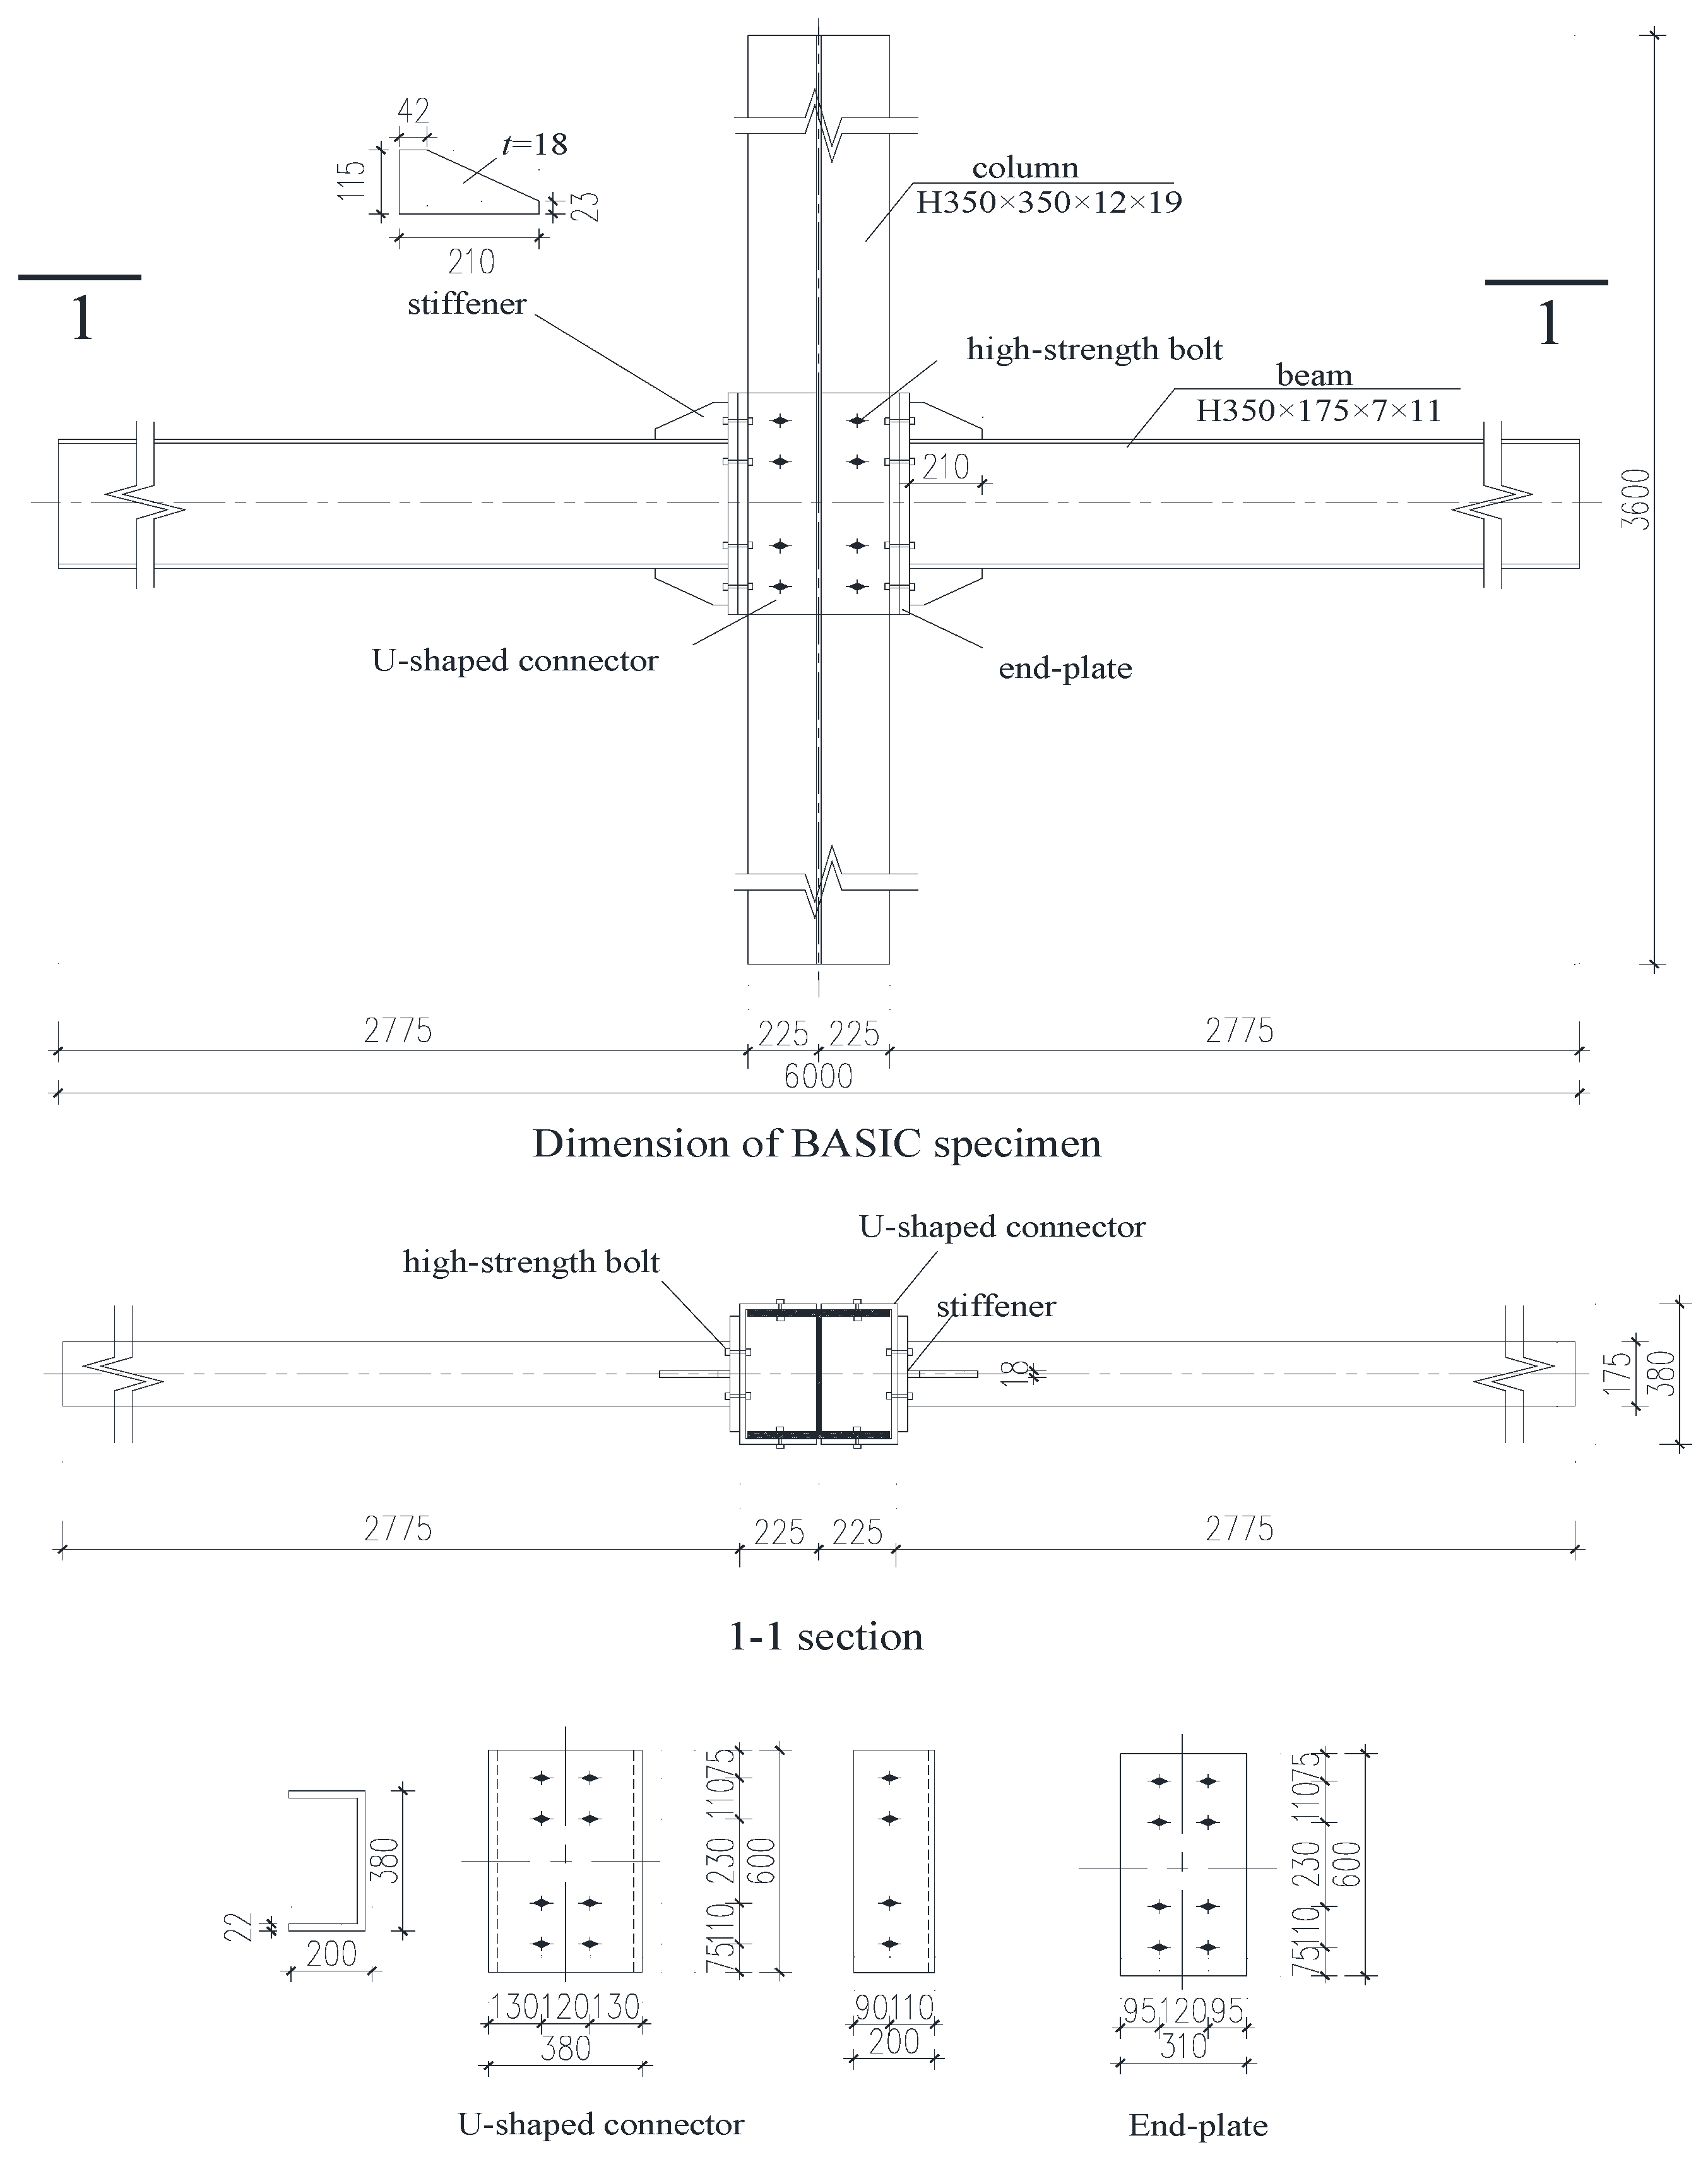
The BASIC specimen was designed according to the ‘Standard for Design of Steel Structures’ (GB 50017-2017) [22] and references [23,24]. The stiffener length of the beam was 90 mm, the height was 40 mm, and the thickness was 10 mm. The M24 high-strength bolts were grade 10.9, and the steel grade was Q235B. The pre-tension force of 225 kN was applied to the high-strength bolt. The configuration and dimensions of the BASIC specimen are shown in Figure 1.
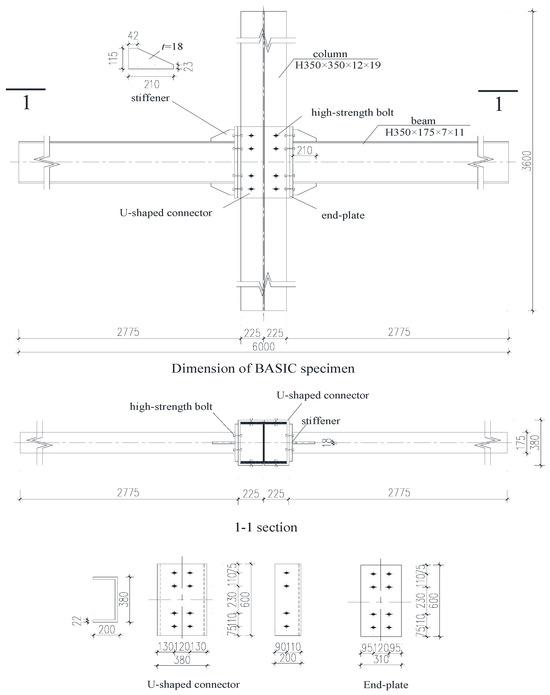
Figure 1.
Detail of the BASIC specimen (Unit: mm).
3. Establishment and Verification of Finite Element Model
3.1. Constitutive Relationship Setting and Element Selection
A double-broken line model simulated the stress–strain relationships of steel and high-strength bolts. The elastic modulus of steel was 206,000 MPa, and the Poisson’s ratio was 0.3. The yielding strength, the ultimate strength, and the ultimate strain of the steel were 235 MPa, 420 MPa, and 0.15, respectively. The yielding strength, the ultimate strength, and the ultimate strain of the high-strength bolts were 940 MPa, 1130 MPa, and 0.10, respectively.
The solid elements (C3D8R) were used for all parts of the finite element (FE) model. A mesh-sensitivity study was conducted in the FEM analysis for the specimens to investigate the effect of the mesh size on the behavior of the specimens. By calculating and comparing different mesh sizes for the specimen, the model adopted the following sizes: 40 mm × 40 mm for steel beam and column, 10 mm × 10 mm for U-shaped connector, and 6 mm × 6 mm for high-strength bolts. The mesh at the panel zone and the bolt hole were encrypted.
3.2. Boundary Conditions and İnteractions
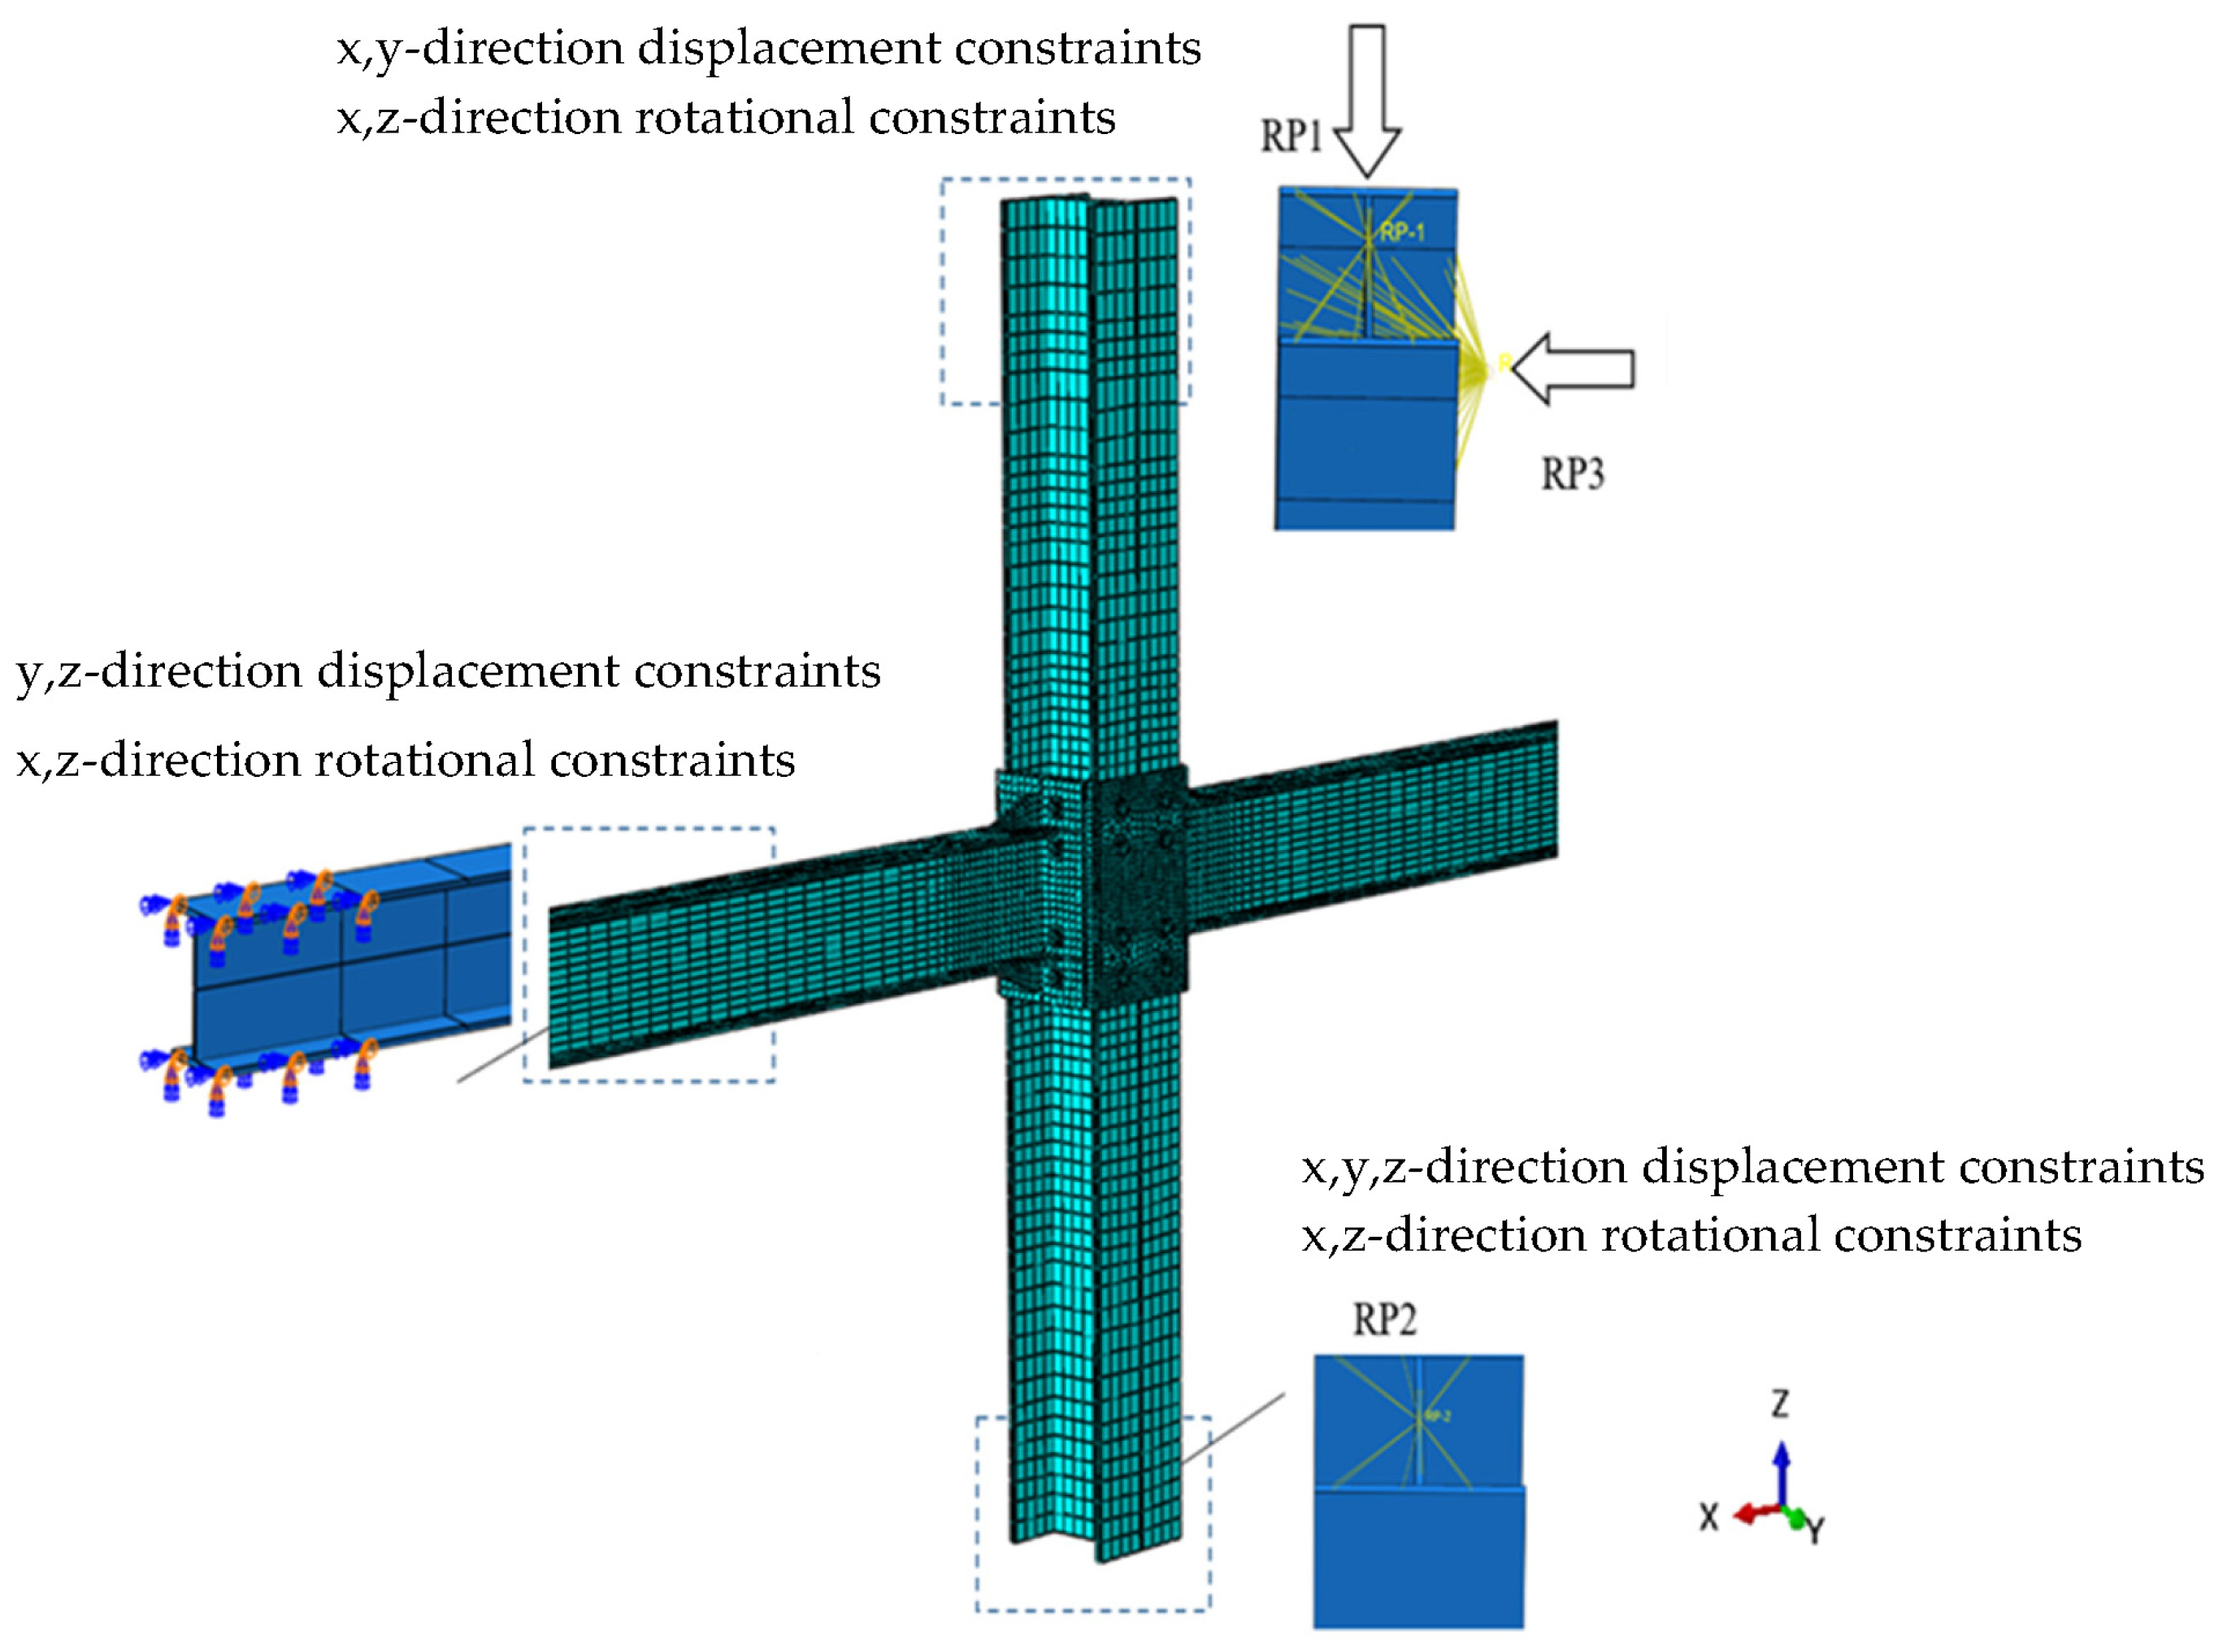
For the BASIC specimen, the beam-to-column connection panel zone grids were encrypted. Reference points RP1 and RP3 were established at the top and bottom of the column, respectively. All the freedom degrees on the top and bottom surfaces of the column were coupled with RP1 and RP3, respectively. In addition, the freedom degrees on the side flange surface of the top column with a length of 50 mm were coupled with RP2. The displacement constraints were imposed on the side surface of the beam flange within 50 mm from the loading point to prevent the instability of the lateral displacement of the model during the loading process. The loadings were applied to the corresponding reference points to make sure the loading conditions and constraints of the BASIC specimen were consistent with the experimental conditions.
Regarding the interaction setting, the tangential contact was defined as Coulomb friction, and the value of the frictional coefficient was 0.45 [22]. In addition, the normal direction was set as hard contact. The U-shaped connector was connected to the steel column by the ‘Tie’ command in ABAQUS, and the ‘Tie’ interaction was also used to connect the beam to the end-plate. The boundary conditions and grid division are shown in Figure 2.

Figure 2.
Boundary conditions and grid division of the BASIC specimen.
3.3. Loading Process
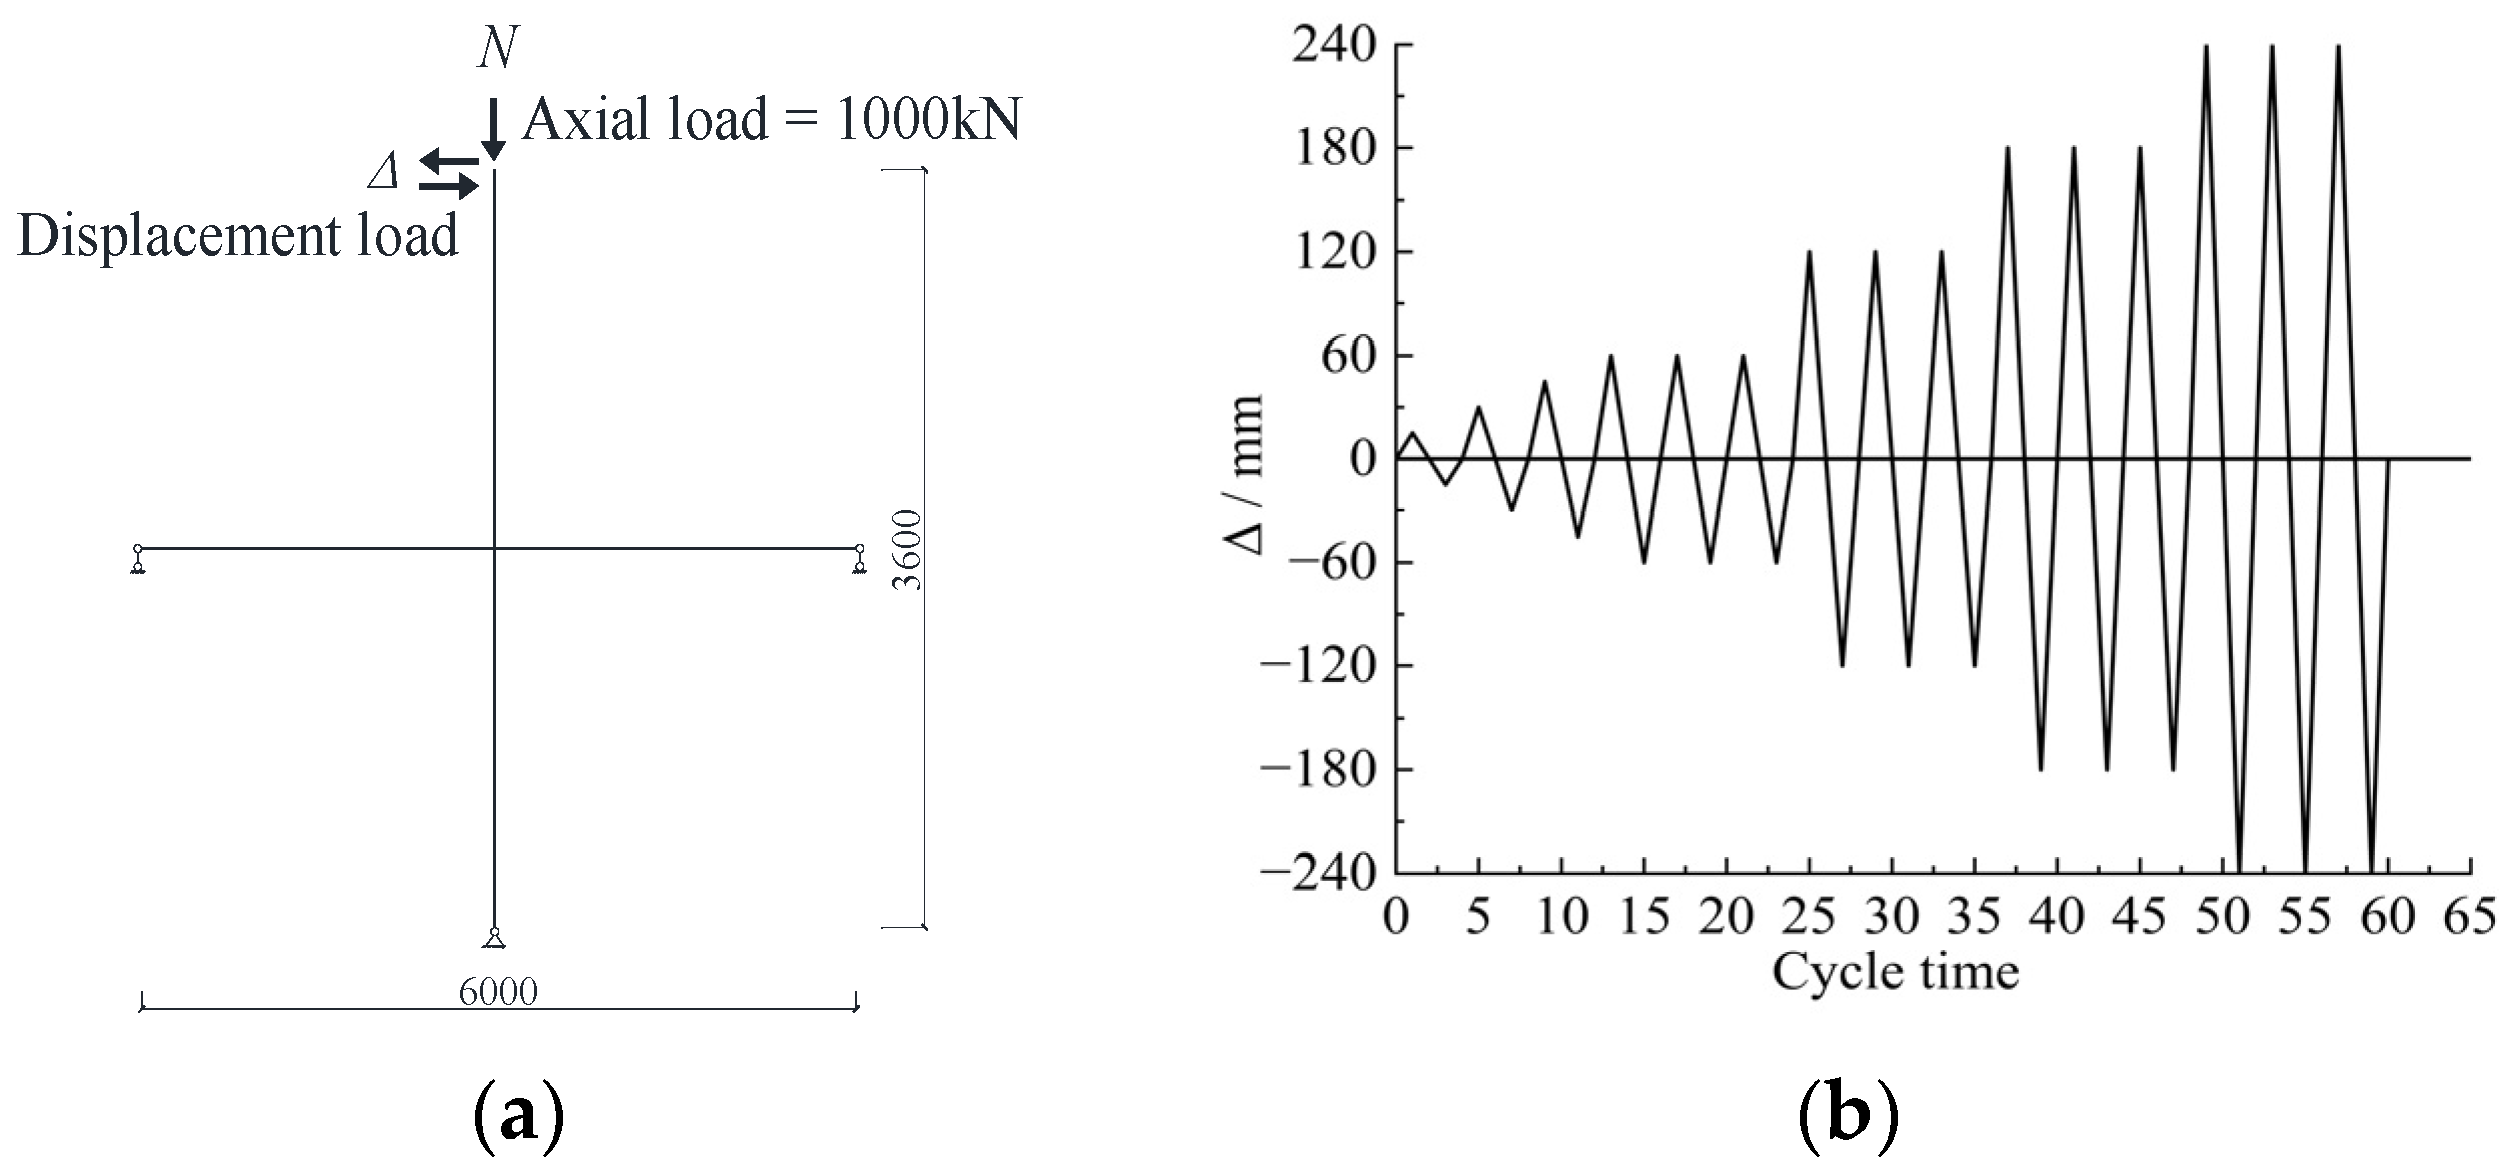
The loading scheme and loading process are illustrated in Figure 3, which were carried out by following the reference [25].
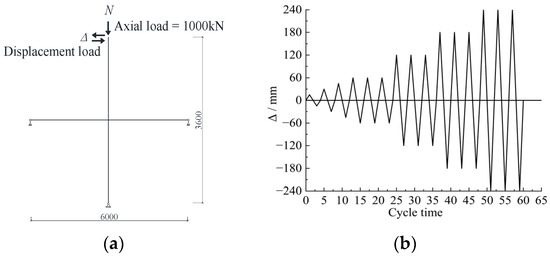
Figure 3.
Loading method: (a) loading scheme (unit: mm); (b) loading process.
The constant axial compression of 1000 kN was applied on the top of the column first, and then the cyclic loading was applied on the point RP2. Firstly, a monotonic load was applied to the loading point, and then the yielding load was defined according to the load-to-displacement curve. The yielding displacement corresponding to the yielding load was 60 mm. In the cyclic loading process, 20% of the yielding displacement was taken for displacement loading before the yield of the specimen with one cycle. After yielding, the loading displacement was increased by 60 mm per stage, using a three-time cycle. The loading was stopped after the load decreased by approximately 85% of the ultimate load or the specimen was destroyed.
3.4. Verification of FEM
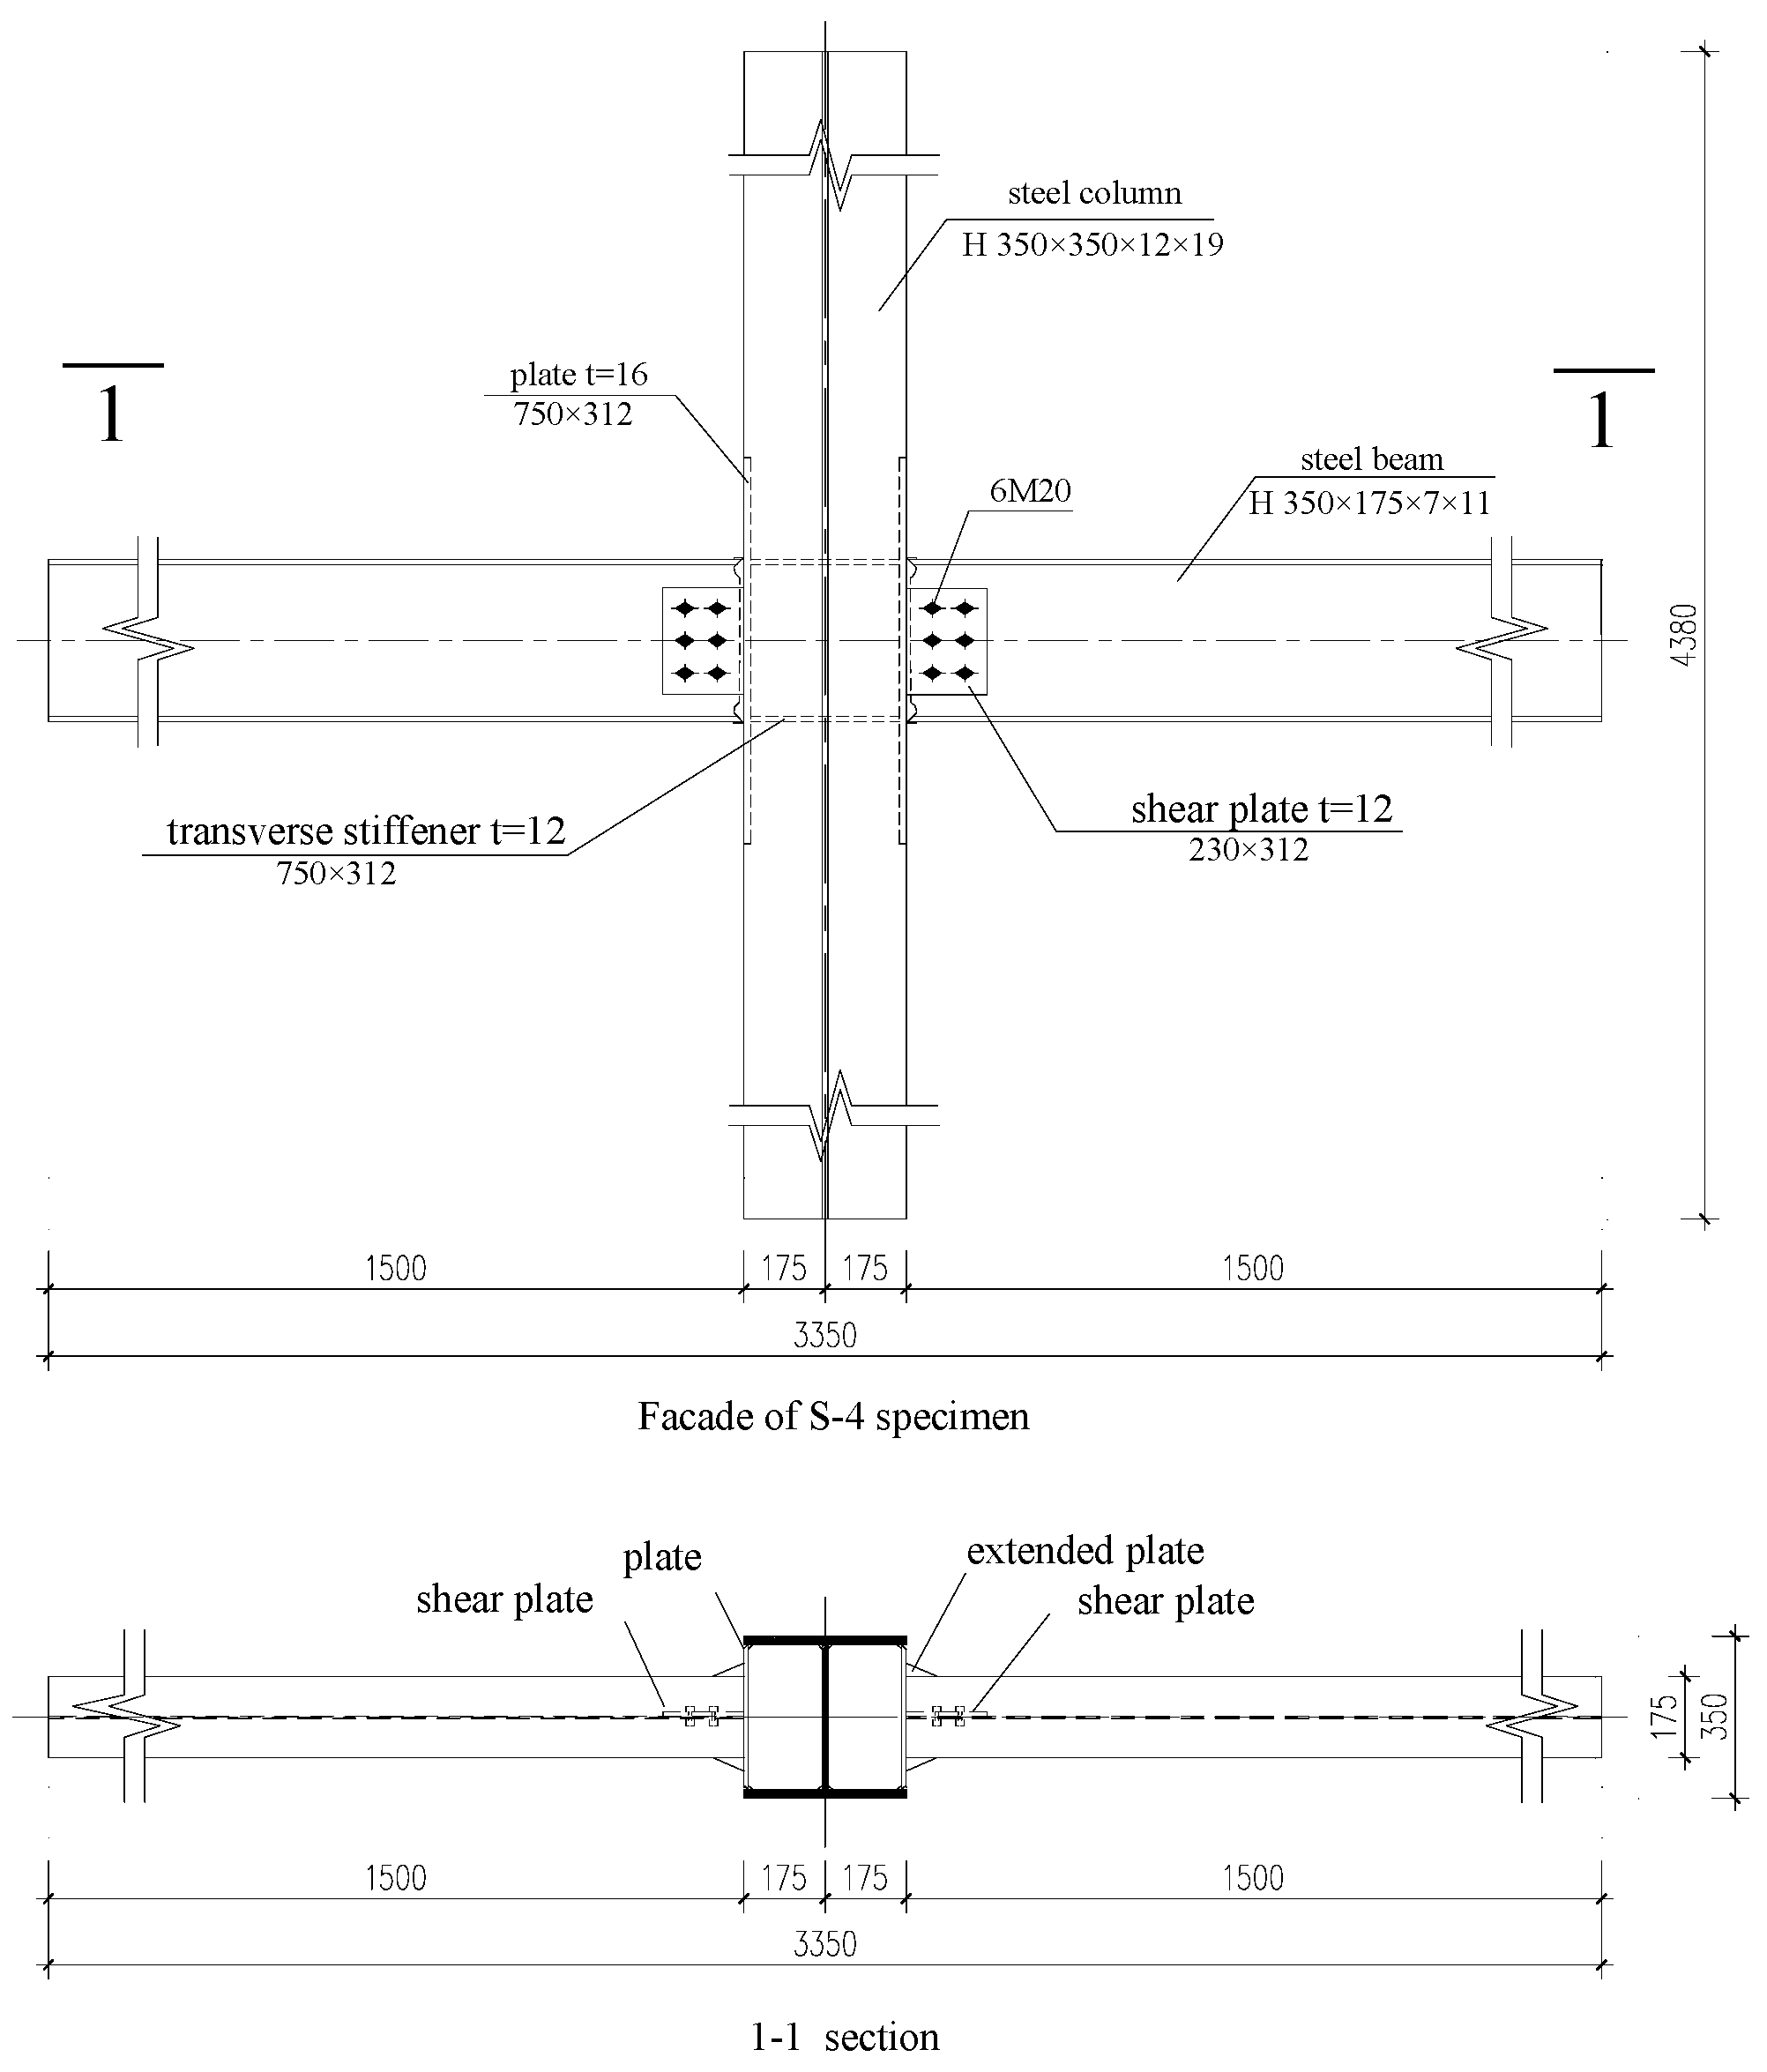
A similar joint about the weak-axis column with a box-shaped panel zone was proposed by Lu [12,13]. The S-4 specimen in the test was selected just for FEM validation. The finite element model analysis (FEM analysis) results were compared with the experimental results. The details of the S-4 specimen are shown in Figure 4.
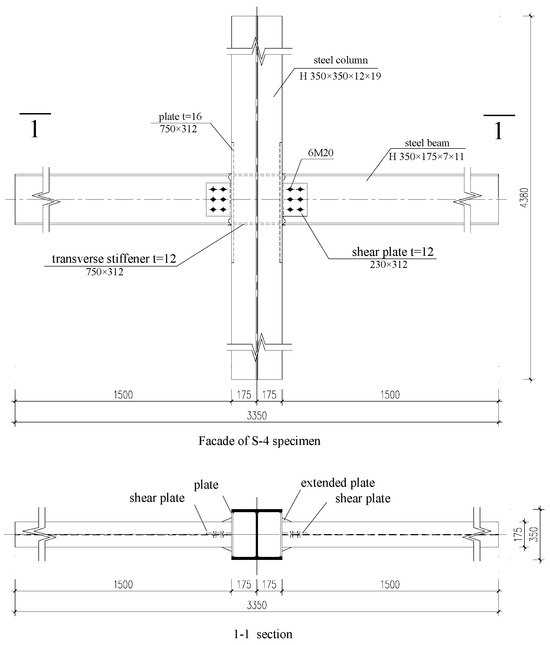
Figure 4.
Details of the S-4 specimen (unit: mm).
The comparison of the failure mode, moment-rotation hysteresis curves, and skeleton curves obtained by FEM analysis and experiment are shown in Figure 5 and Figure 6. The comparative studies of the results are illustrated in Table 1.
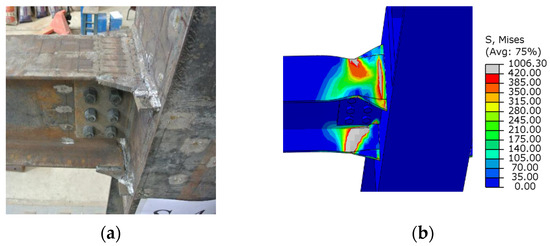
Figure 5.
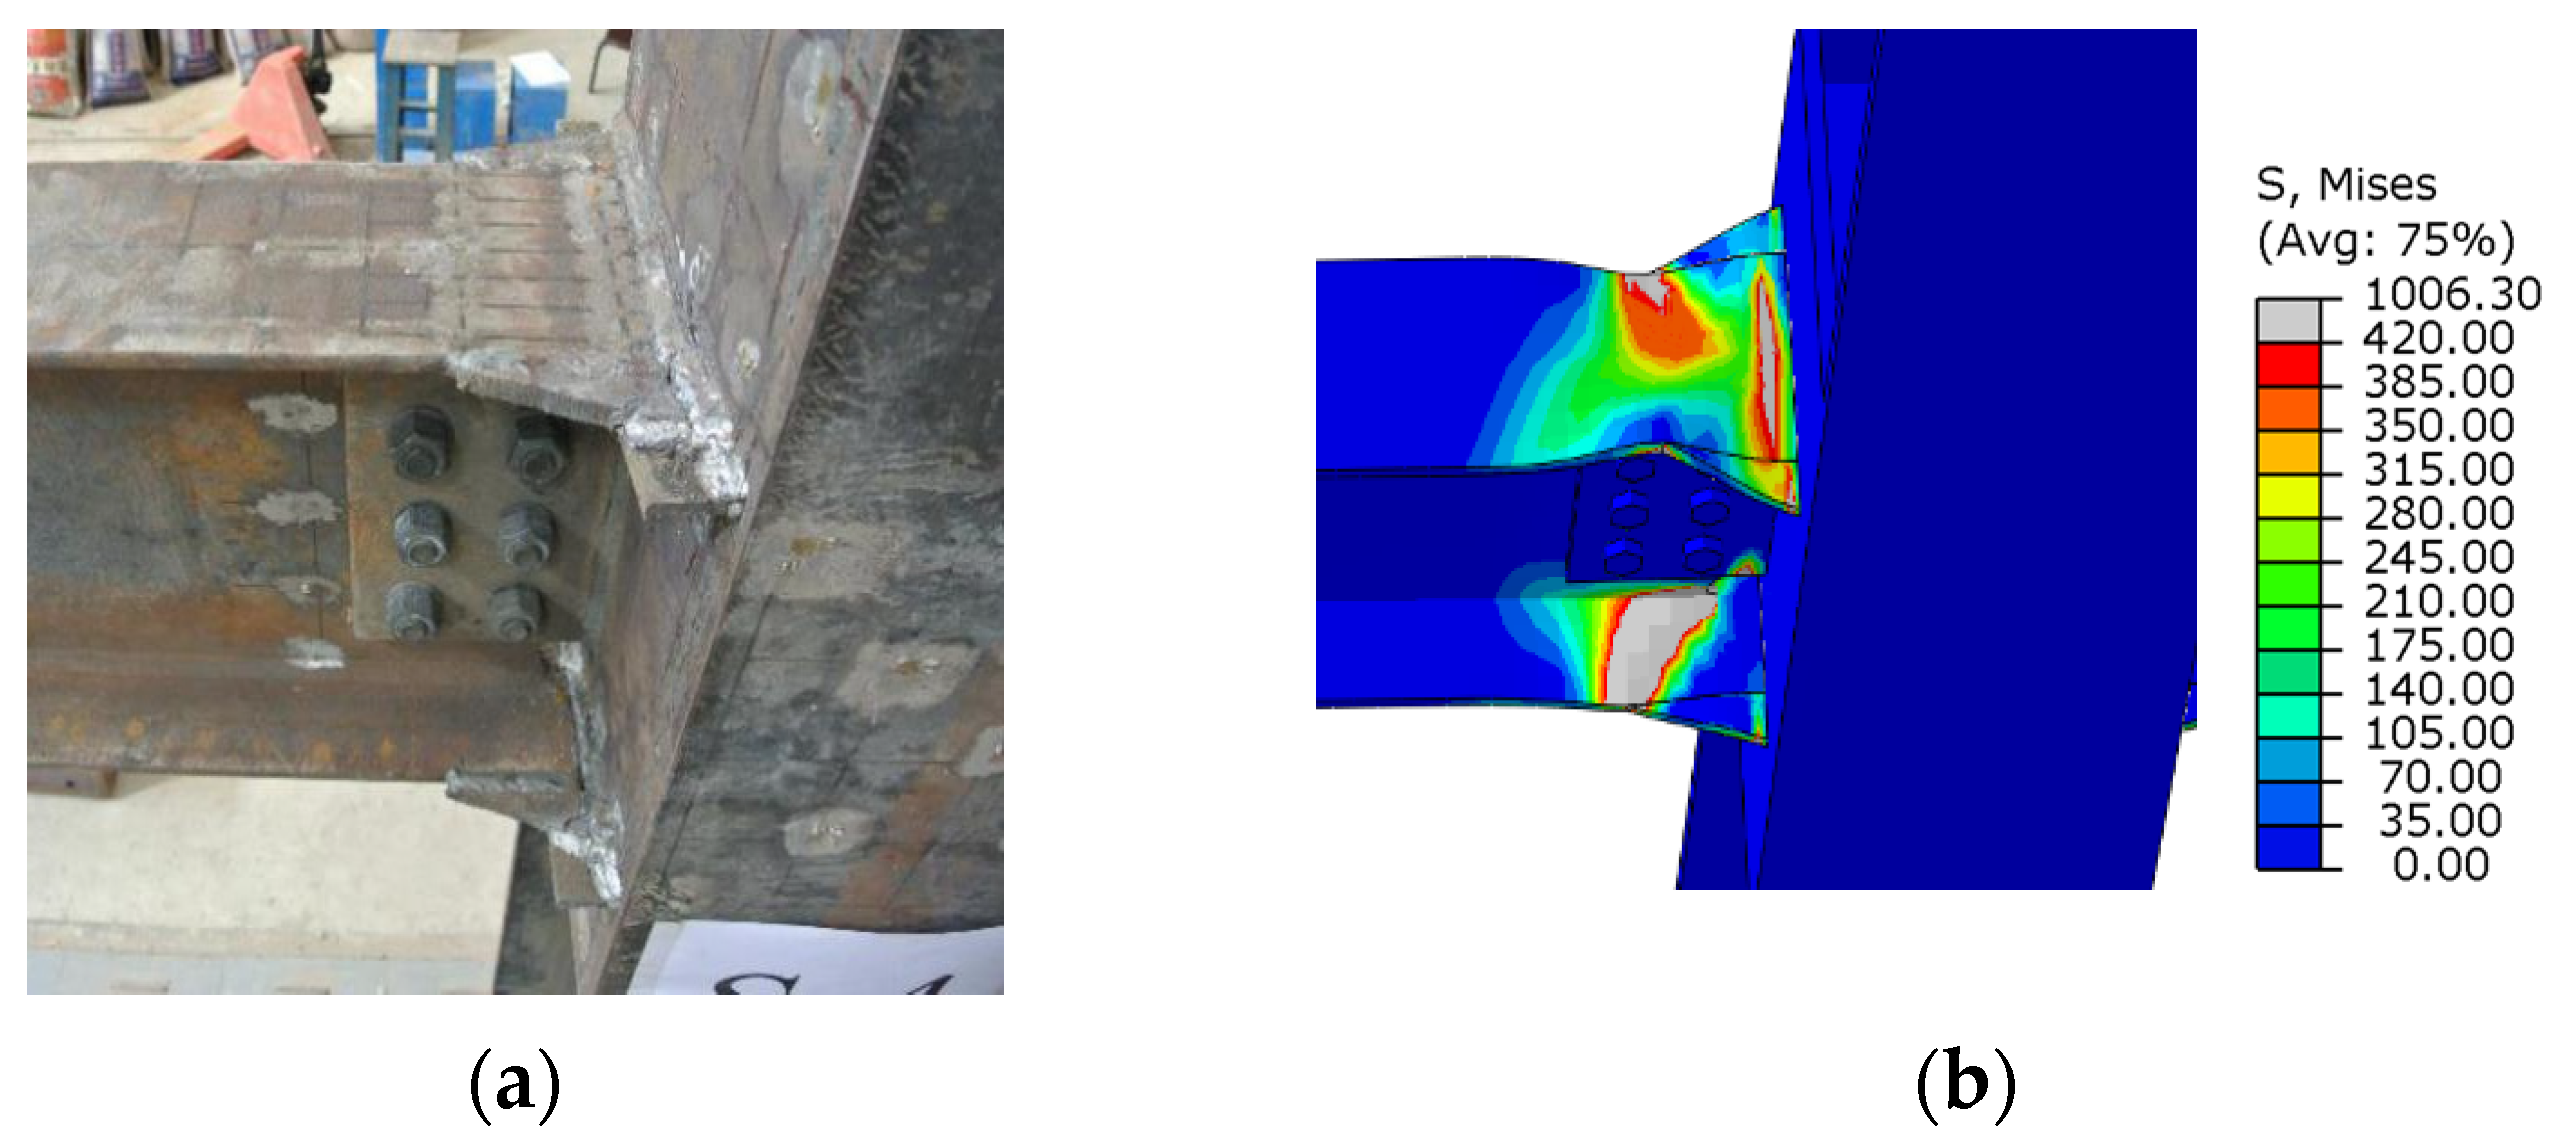
Comparison of failure mode: (a) failure mode in the test result; (b) failure mode in the FEM analysis result.
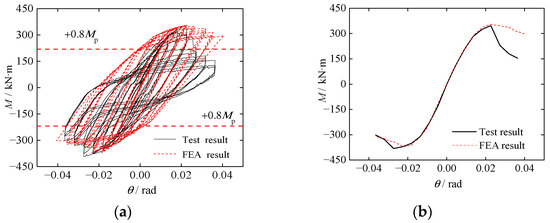
Figure 6.
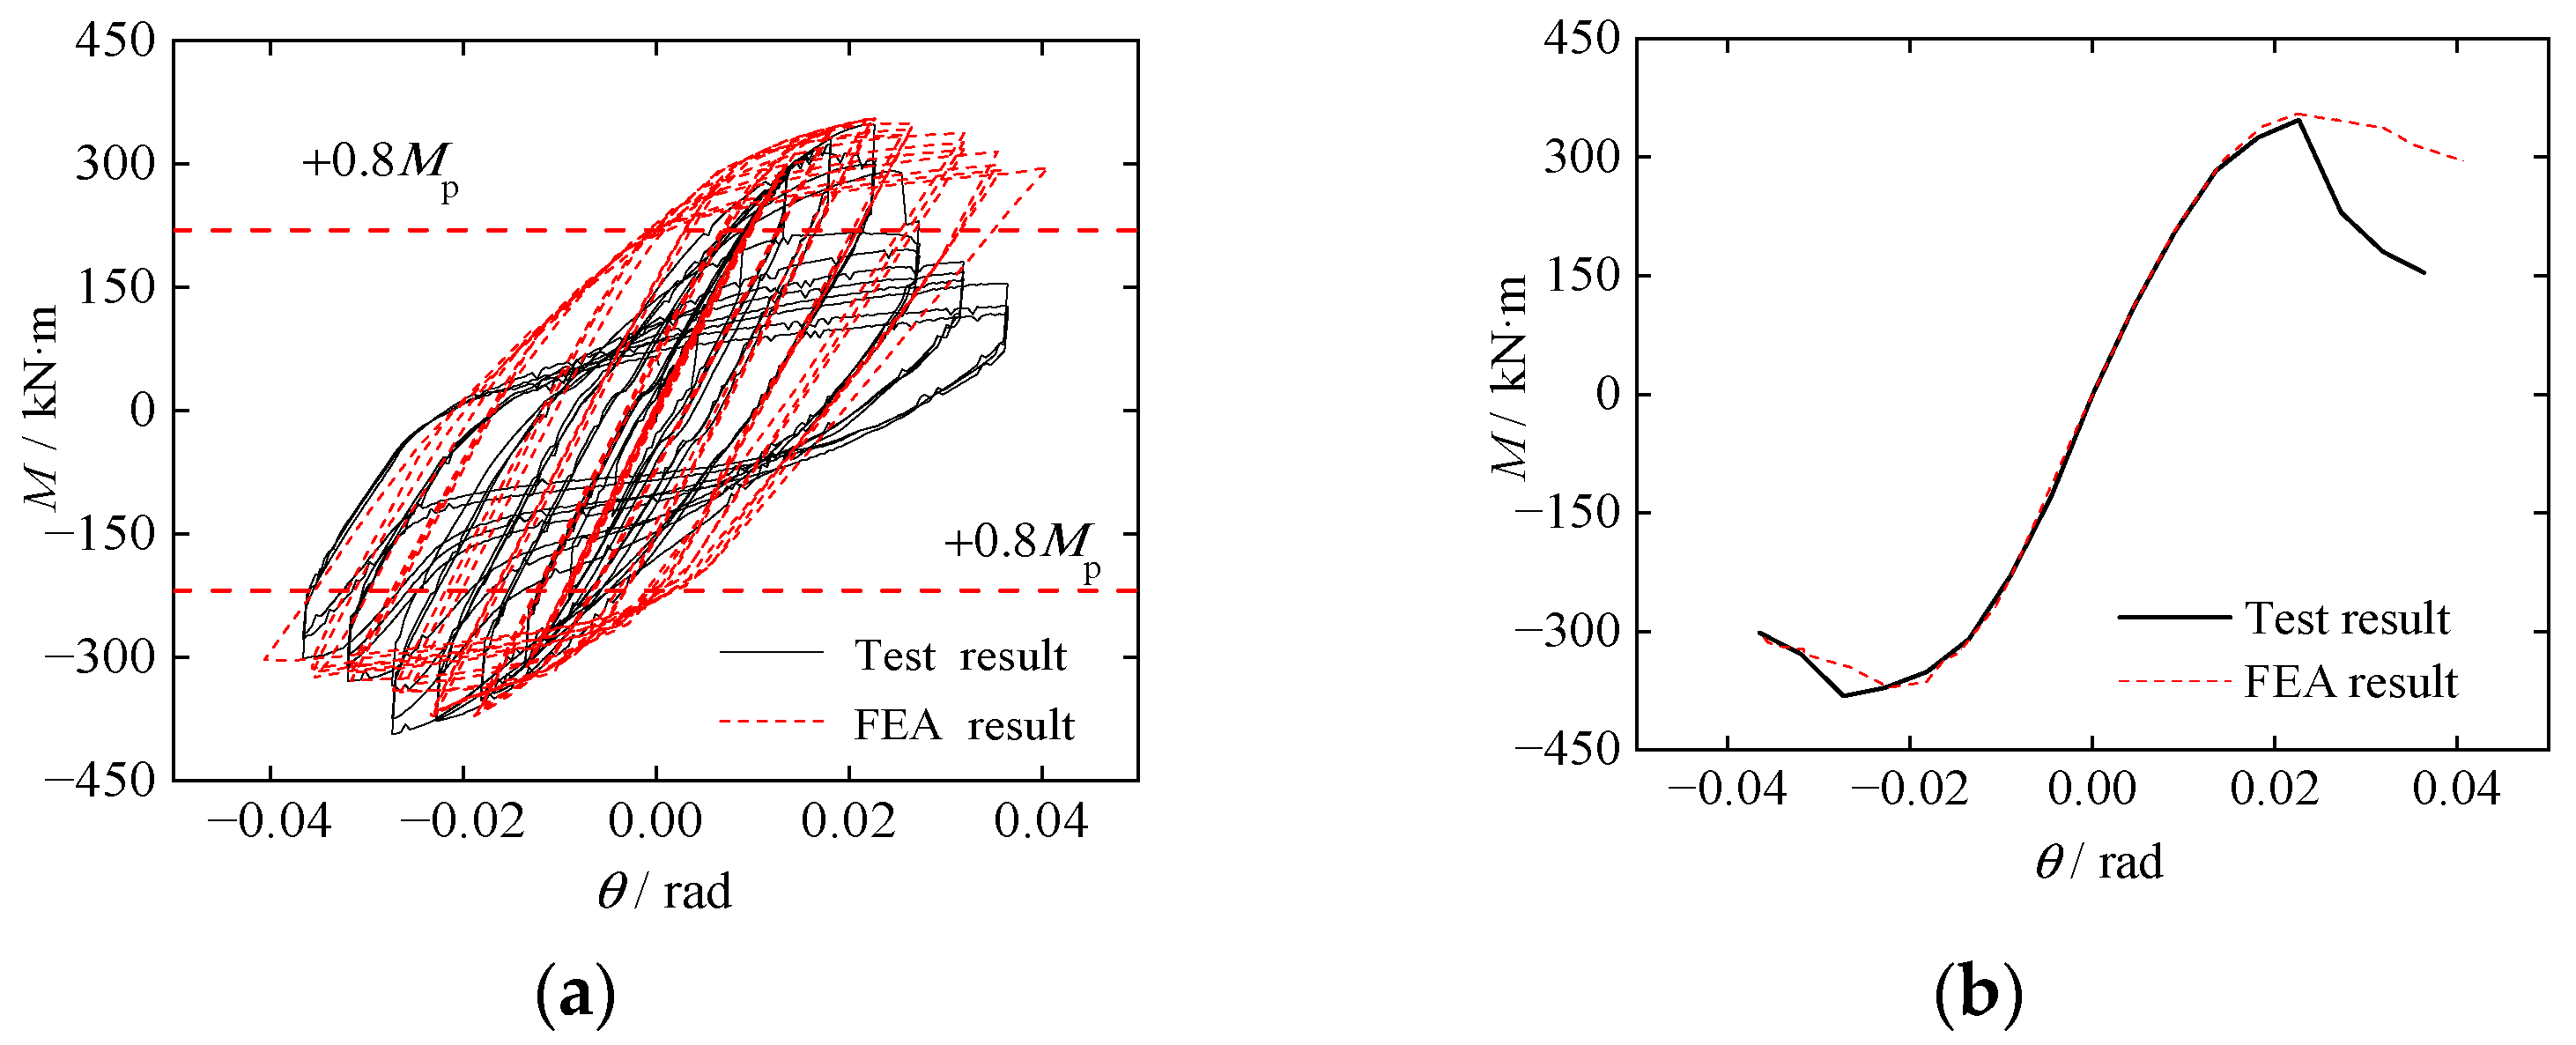
Comparison of hysteric curves and skeleton curves: (a) hysteresis curves of the test result and FEM analysis result; (b) skeleton curves of the test result and FEM analysis result.

Table 1.
Comparison of FEM analysis and test results.
The hysteresis curves of moment vs. rotation are used to investigate the joint’s rotational capacity and seismic behavior. The inter-story drift θ and moment of the beam end M of the joint are calculated by Equations (1) and (2), respectively [26,27]. When the joint reached 0.04 rad inter-story drift, the joint bearing capacity should be above 0.8Mp [28].
where Δ represents the horizontal displacement; H represents the height from the loading point to the bottom of the column; R1 represents the reaction force of the end of the left beam; l represents the distance from the beam end to the surface of the U-shaped connector; Mp represents the plastic moment of the whole section of the beam.
The comparisons of failure mode between the test and FEM analysis are shown in Figure 5. During the test, severe cracks appeared in the welding near the connection between the beam and the cover-skin plate. In the FEM analysis, the high-stress region was concentrated near the welding between the beam and the cover-skin plate, where the stress values reached the ultimate stress.
The comparisons of hysteric curves and skeleton curves between the test and FEM analysis are shown in Figure 6. The hysteretic curves obtained from the FEM analysis and the test had the same law. The test curve pinch was mainly due to the significant relief to the beam flange weld on the other side after the cracking of one side of the beam flange welding. While the model in the FEM was idealized, there was no such pinch phenomenon in the hysteretic loops. The load versus displacement curves of the test showed an apparent drop, while the curves were smoother in the FEM. This is attributed to the fact that the beam flange welds cracking occurred in the test, which was hard to simulate in the FEM because the welding damage was not considered to overcome the convergence problem. The skeleton curves obtained from the FEM analysis are well in agreement with those obtained from the experiment. The stiffness of the curve obtained from the test is the same as the stiffness obtained from the FEM. The difference between the test result and FEM results of Mmax was less than 2%, which validated the correctness of the FEM.
4. Seismic Behavior of BASIC and UR Specimens
The UR specimen without end-plate stiffeners was established. The rest of the parameters of the UR specimen were the same as those of the BASIC specimen. In the FEM analysis, when the load dropped to 85% of the maximum load, the specimen was considered destroyed. In terms of data processing, the secant stiffness was used to represent the stiffness degradation of the joint [25], and the general yielding moment method was used to determine the yielding moment and yielding rotation [29].
4.1. Moment-Rotation Hysteresis Curve and Skeleton Curve
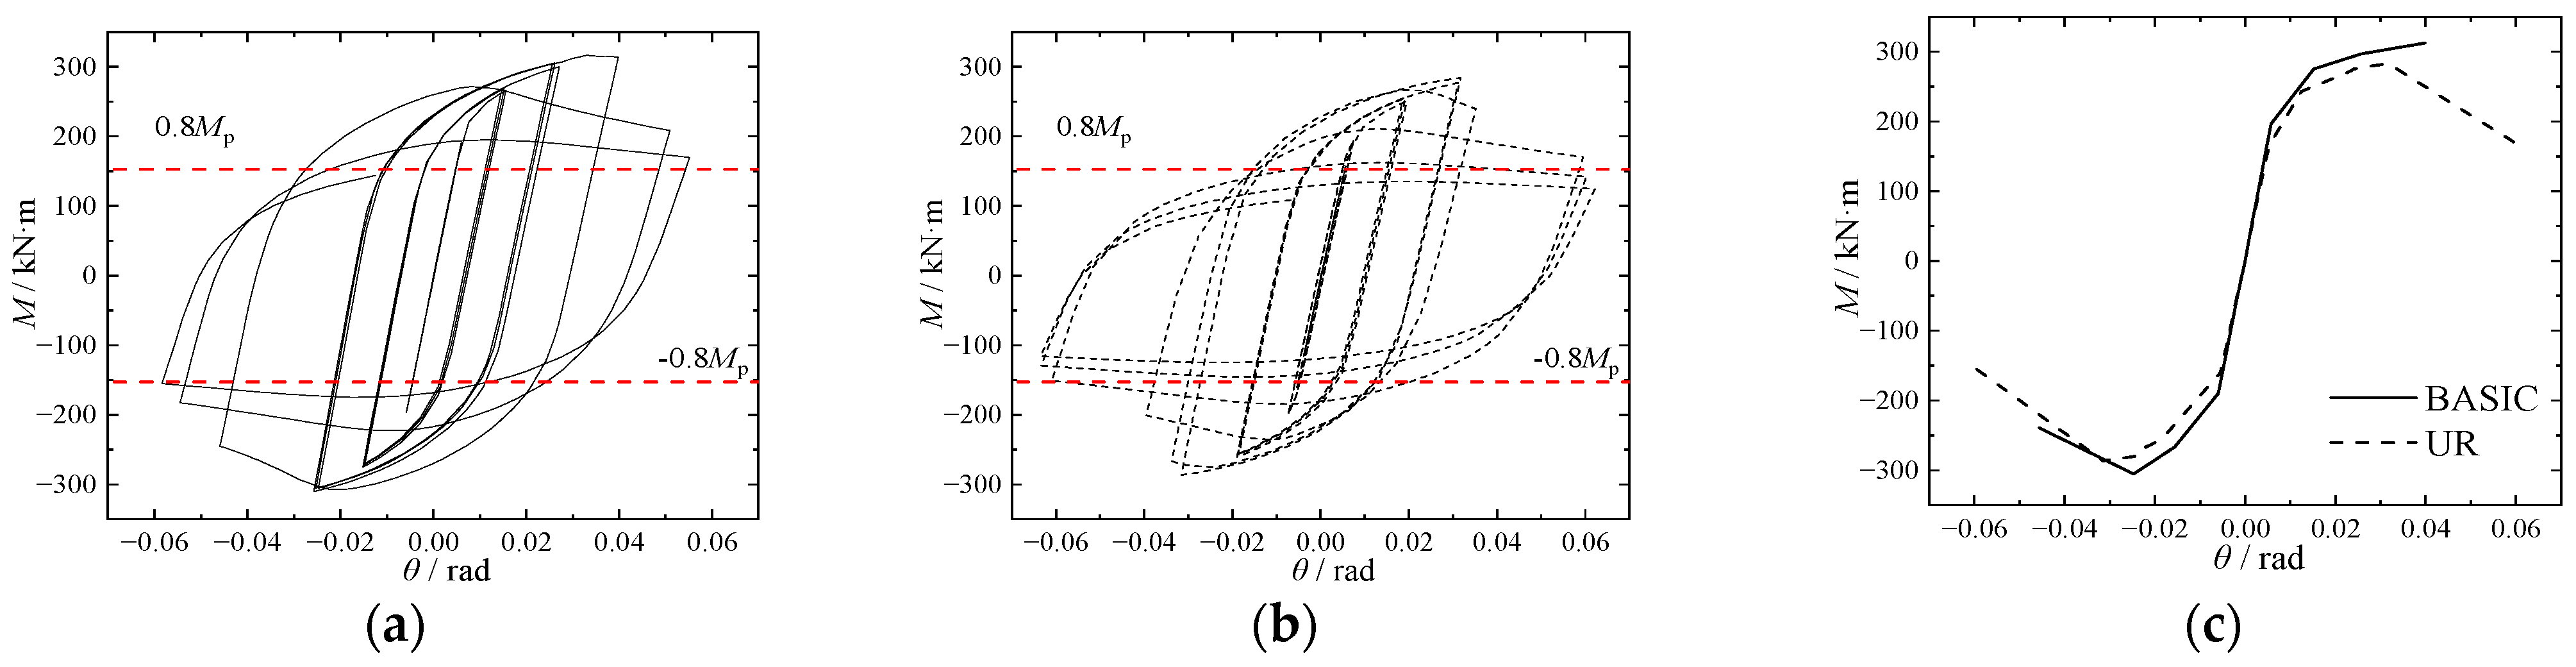
The moment–rotation hysteresis and skeleton curves of the BASIC and UR specimens are shown in Figure 7, respectively. The stiffness of the joint within the elastic phase is defined as the initial stiffness Rki, which is calculated by Equation (3). The comparison of FEM analysis results of UR and BASIC specimens under cyclic loading is illustrated in Table 2.
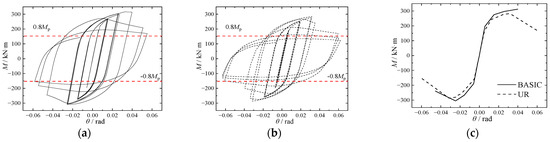
Figure 7.
Comparison of hysteresis curves and skeleton curves of specimens: (a) hysteresis curve of BASIC specimen; (b) hysteresis curve of UR specimen; (c) skeleton curves of BASIC and UR specimens.
Table 2.
Comparison of FEM analysis results.
As shown in Figure 7, the curves of the BASIC and UR specimens were relatively full. At the initial stage of loading, the skeleton curves of the two specimens coincide with each other. The moment of the two specimens decreased slowly after reaching the maximum value.
As indicated in Table 2, the yielding moment My, the maximum moment Mmax, and the initial stiffness of the joint Rki of the BASIC specimen were 2.7%, 10.6%, and 5.4% higher than those of the UR specimen, respectively. The stiffeners were set between the beam and the U-shaped connector, which could improve the seismic behavior of the specimen.
4.2. Comparative Analysis of Failure Mode


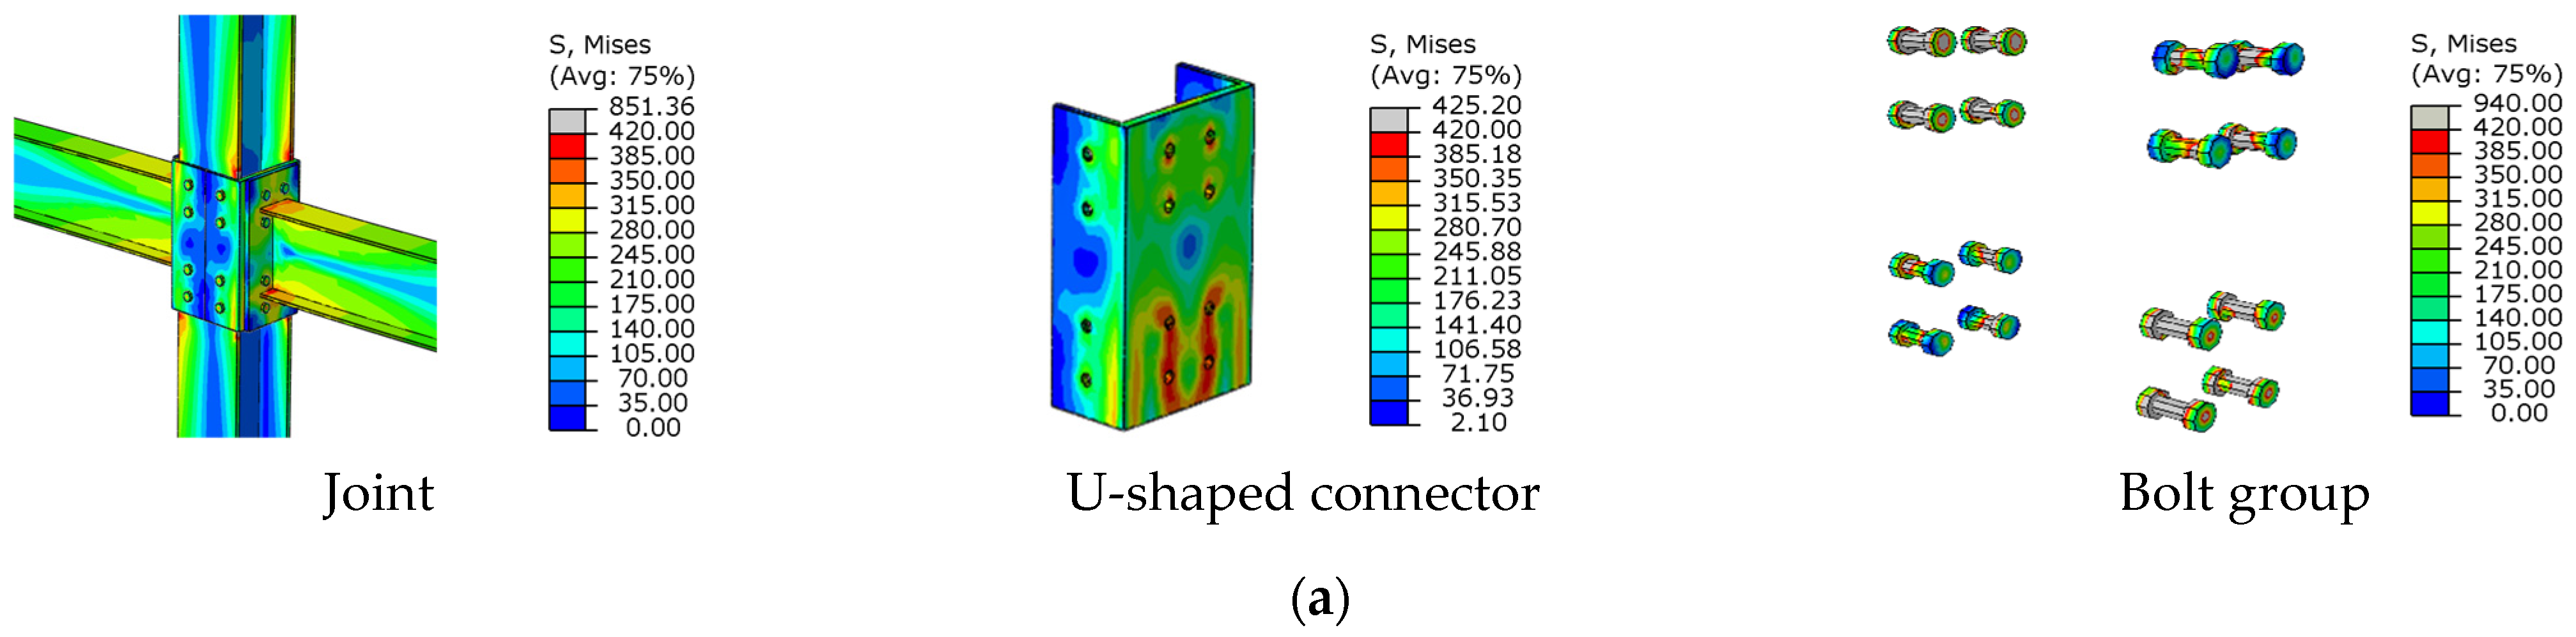
Figure 8.
The contour of the Von Mises stress of the UR specimen: (a) yielding load; (b) failure load.
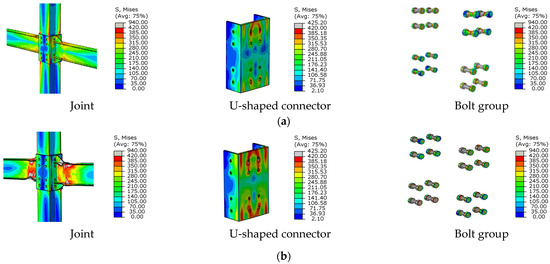
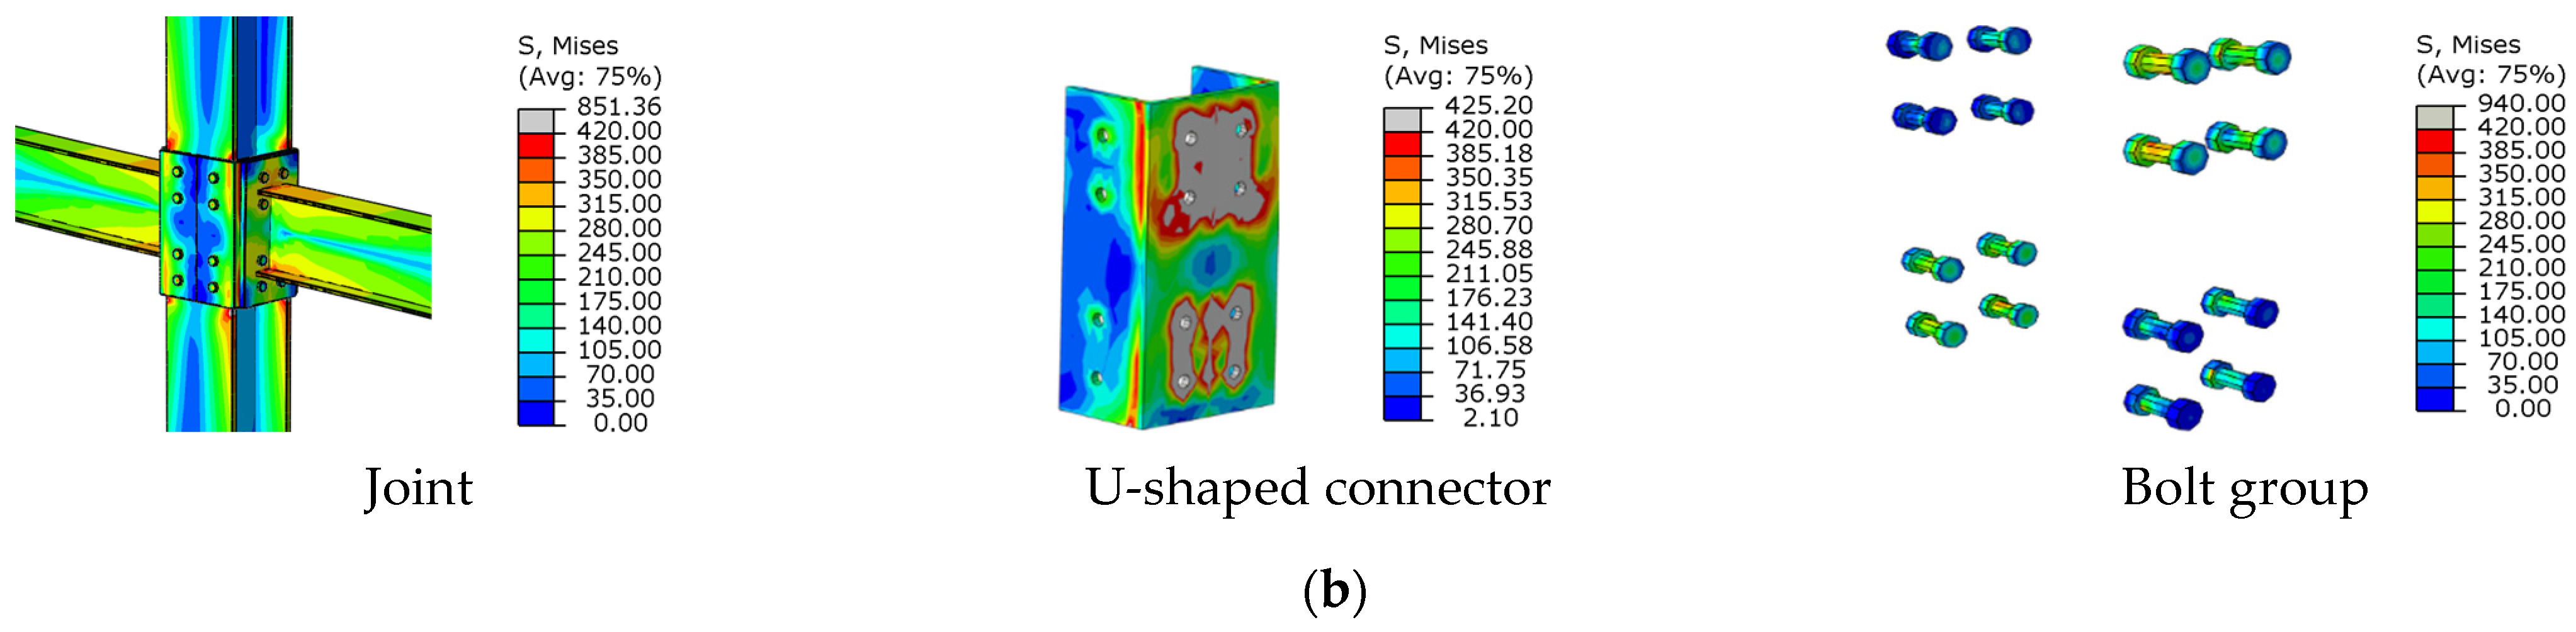
Figure 9.
The contour of the Von Mises stress of the BASIC specimen: (a) yielding load; (b) failure load.
For the UR specimen, the yielding and failure modes were significantly different from the BASIC specimens. In the yielding stage, the stress in some regions of the U-shaped connector flange surpassed the ultimate stress value, and the failure at the bolt hole on the web was more serious. In the failure stage, the ultimate stress at the bolt holes of the U-shaped connector spread to most of the web region. In the process of cyclic loading, the stress of the high-strength bolts was lower than their ultimate capacity, indicating that the high-strength bolts of this type of joint satisfied the bearing capacity requirements. The failure position of the UR specimen was in the panel zone, which did not satisfy the anti-seismic demand of ‘strong joint, weak members.
For the BASIC specimen, the two outermost bolt holes on the U-shaped connector web had the highest stresses at the yielding load. At the failure load, although the stress in some regions of the U-shaped connector web reached the ultimate stress, the whole seismic behavior of the specimen was excellent. In addition, the maximum stress at the beam was near the lateral region of the stiffener, so the beam produced obvious buckling deformation on the outer side of the stiffener. In summary, the final failure mode of the BASIC specimen was that the plastic hinge was formed far away from the end-plate of the beam, which could better protect the panel zone, improve the seismic behavior of the U-shaped connector, and avoid the welding fracture which caused by the stress concentration of the beam and the end-plate welding.
5. Parametric Study
The influence of the thickness of the U-shaped connector, the end-plate thickness, the axial compression ratio of the column, and the linear stiffness ratio of the beam to the column on the seismic behavior of the joint were analyzed. The parameters and results of specimens are illustrated in Table 3.
Table 3.
The parameters and results of specimens.
5.1. The Thickness of the U-Shaped Connector
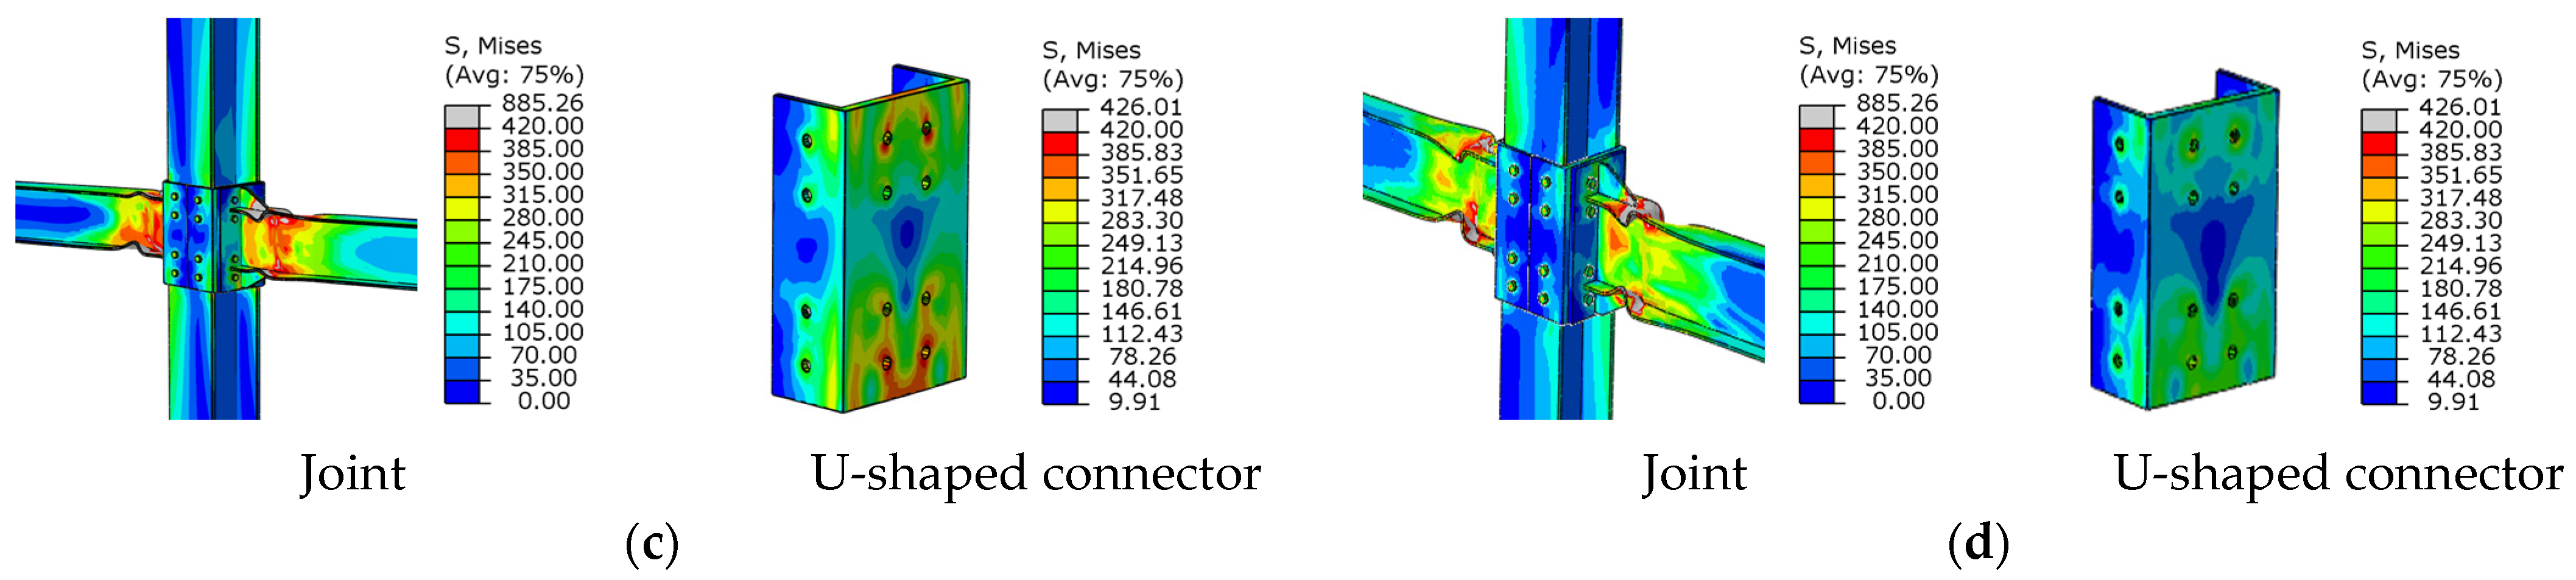
The thickness of the U-shaped connector was varied with values of 18 mm (0.95tf), 20 mm (1.0tf), 24 mm (1.26tf), and 26 mm (1.37tf), and tf represented the thickness of the column flange. UT-1, UT-2, UT-3 and UT-4 specimens were established, respectively. The contours of the Von Mises stress of UT series specimens under failure modes are shown in Figure 10, and hysteresis curves and skeleton curves are shown in Figure 11 and Figure 12, respectively.
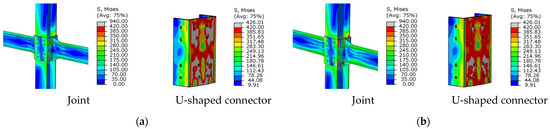

Figure 10.
The contour of the Von Mises stress of UT specimens under failure modes: (a) UT-1; (b) UT-2; (c) UT-3; (d) UT-4.
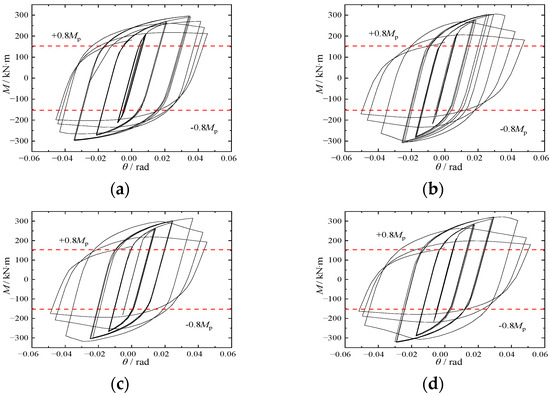
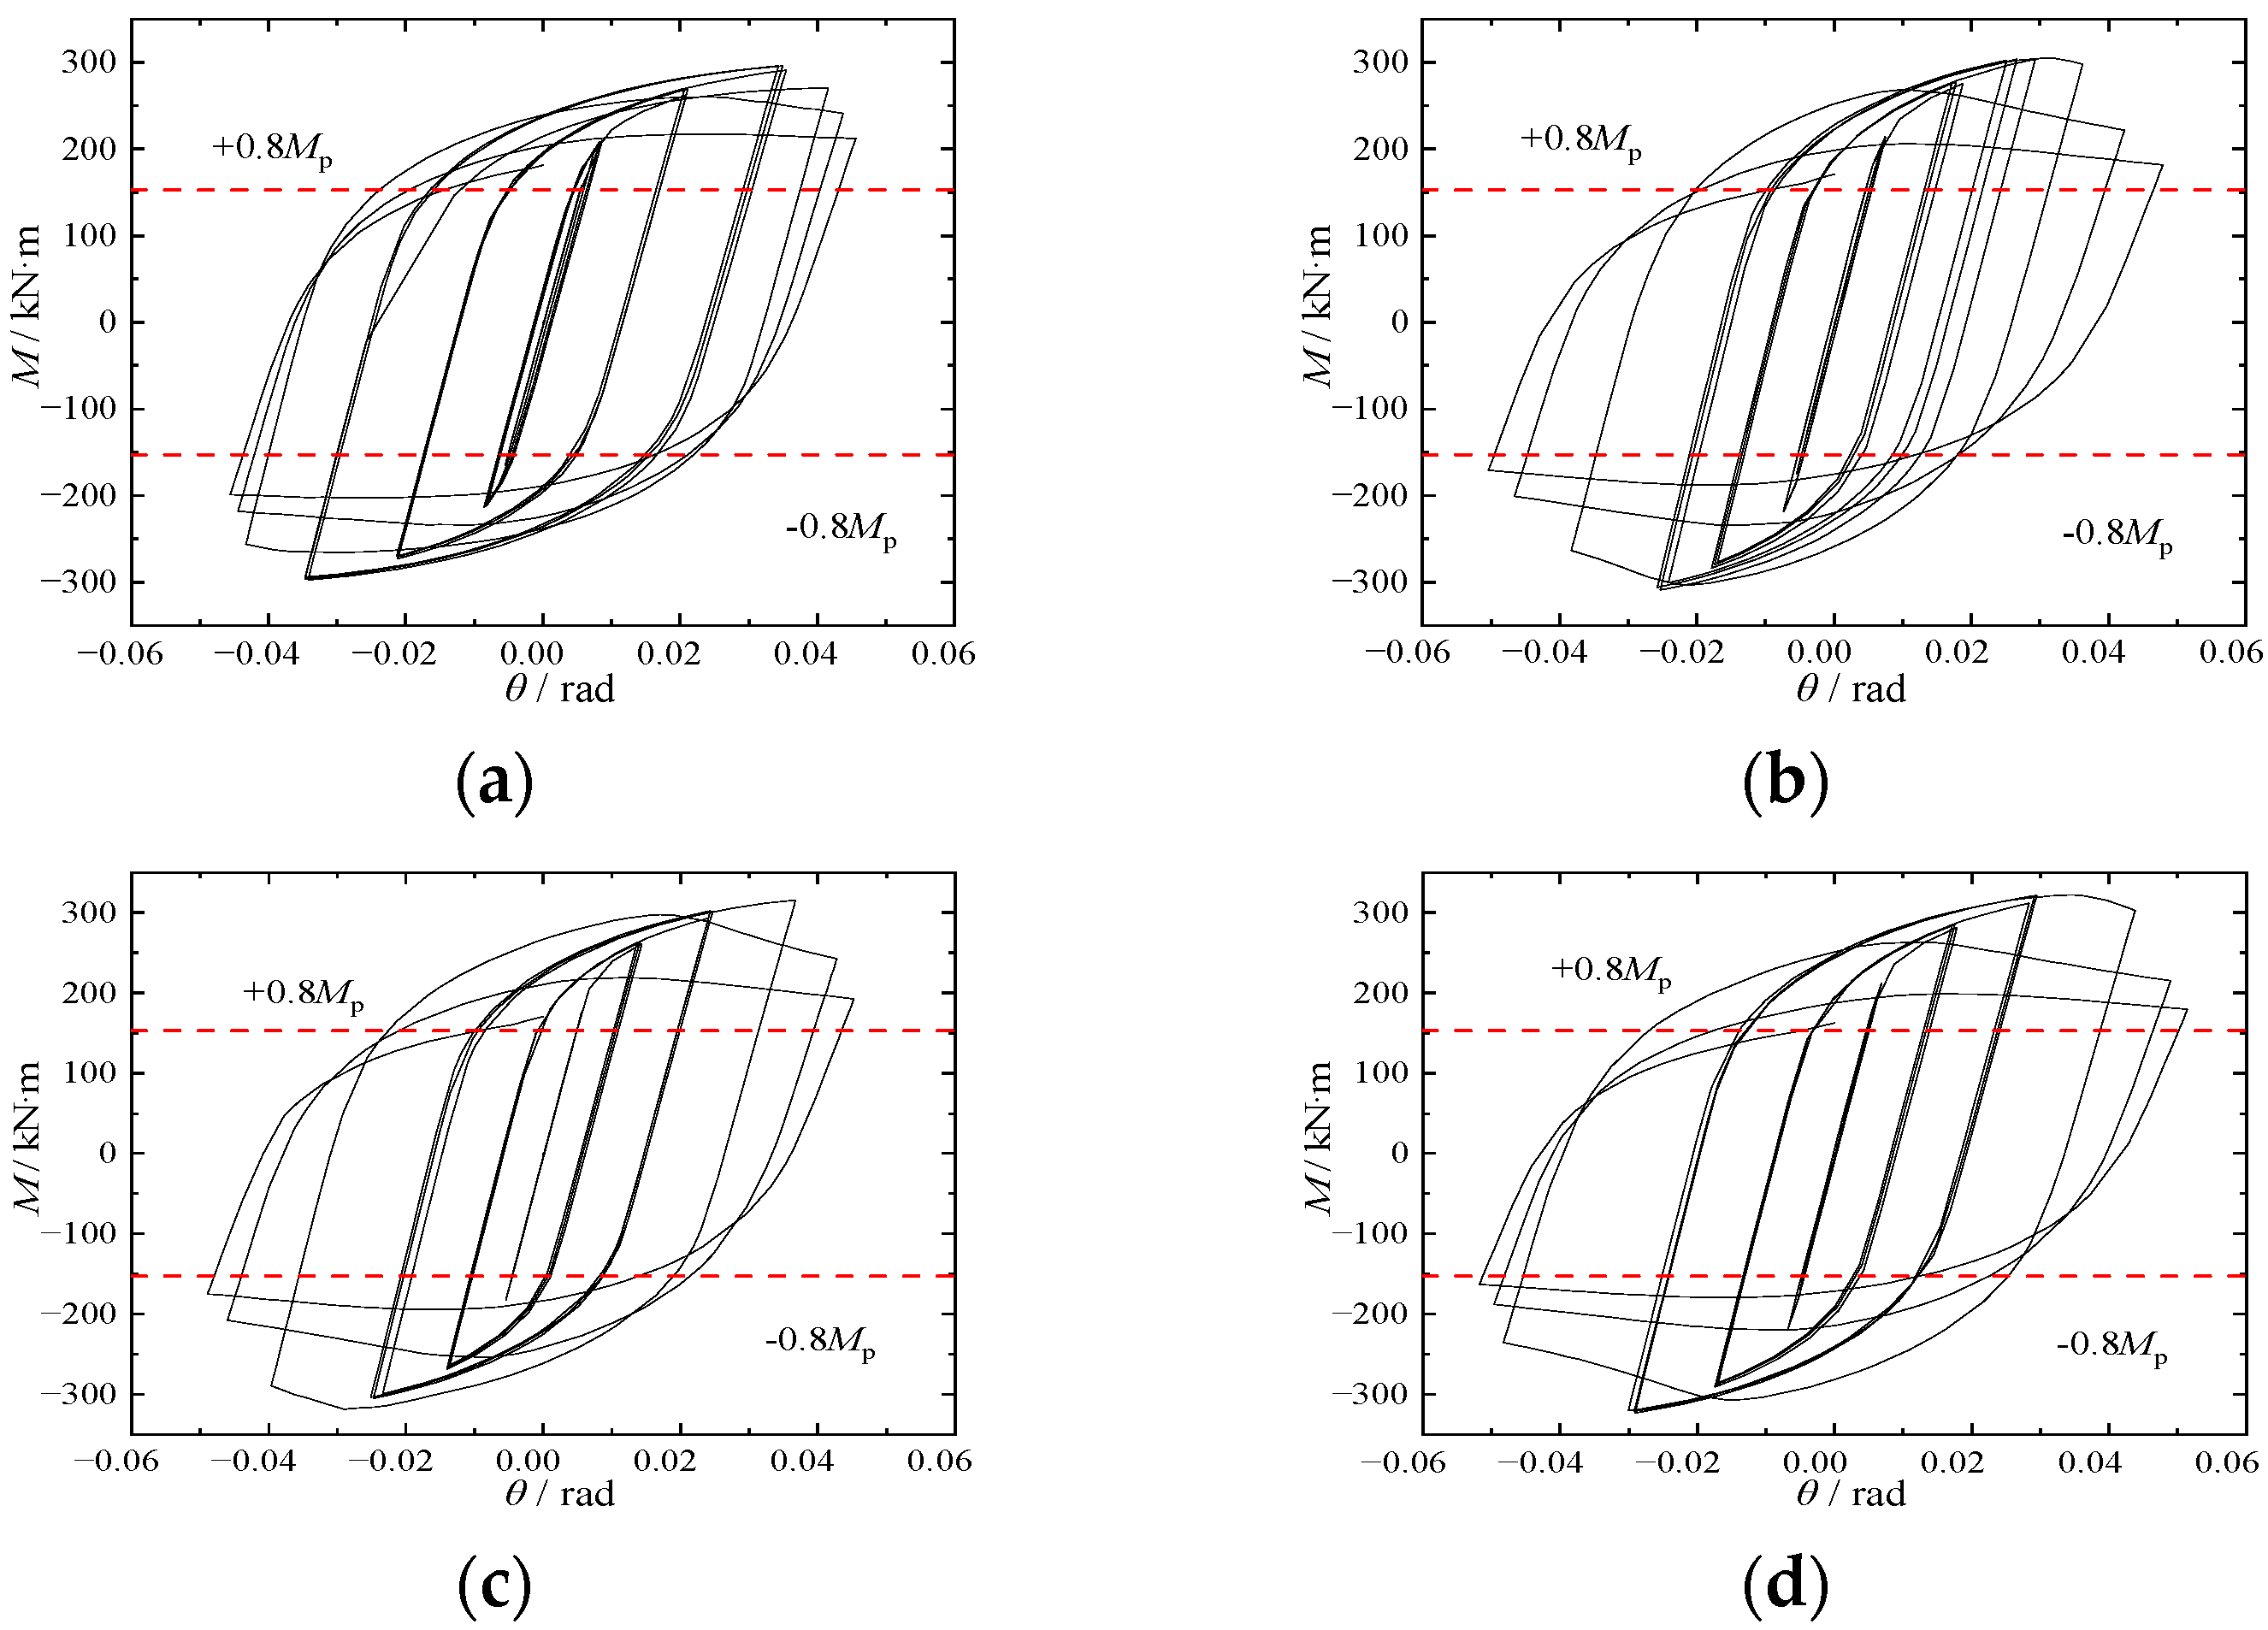
Figure 11.
Hysteresis curves of UT series specimens: (a) UT-1; (b) UT-2; (c) UT-3; (d) UT-4.
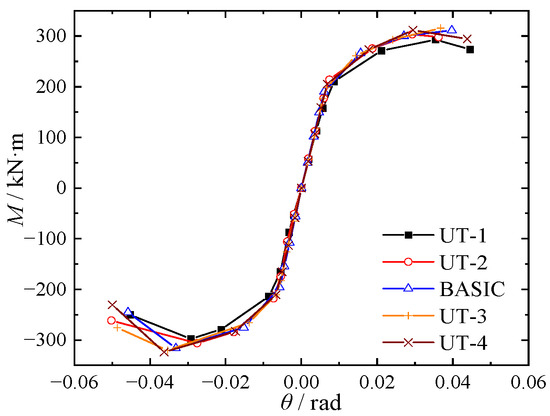
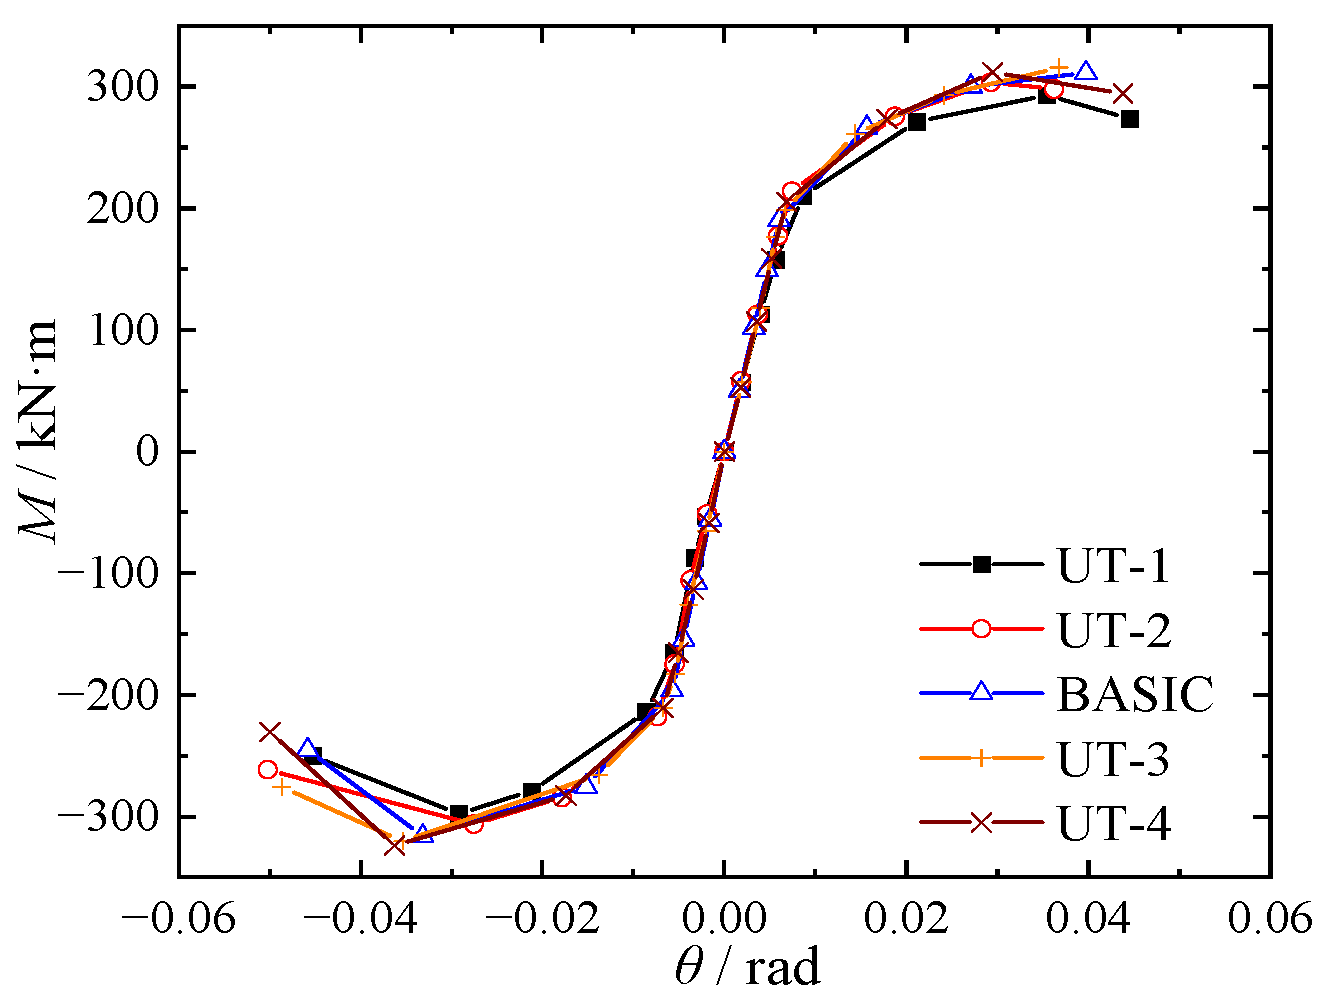
Figure 12.
Skeleton curves of UT specimens.
It could be seen that the failure modes of UT-3 and UT-4 specimens were similar to the BASIC specimen. The buckling occurred at the beam flange and web far from the joint. The stress value of the U-shaped connector was low, and the joint deformation was small. For UT-1 and UT-2 specimens, the bearing capacity of the U-shaped connector was poor because of its thinner thickness and lower stiffness. A significant plastic deformation occurred in most regions of the U-shaped connector web, which caused the failure of the U-shaped connector first.
As shown in Figure 12 and Figure 13, the hysteresis curves of UT series specimens were relatively full. At the initial load stage, the skeleton curves of each specimen were the same, and the maximum load increased slightly with the increase in the thickness of the U-shaped connector.
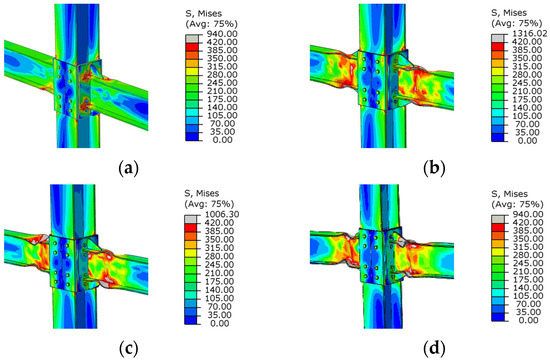
Figure 13.
The contour of the Von Mises stress of DB specimens under failure modes: (a) DB-1; (b) DB-2; (c) DB-3; (d) DB-4.
When the thickness of the U-shaped connector was varied from 18 to 20 mm, 18 to 22 mm, 18 to 24 mm, and 18 to 26 mm, the maximum moment was increased by 4.0%, 6.5%, 7.2%, and 8.7%, respectively and the ductility coefficient of specimens was reduced by 5.6%, 11.7%, 12.5%, and 15.9%, respectively. It could be seen that the ductility and maximum moment of the beam end were significantly affected by the thickness of the U-shaped connector.
To ensure the plastic hinge forms within a reasonable range of the beam, tu, the U-shaped connector’s thickness should be in the range of 1.15tf to 1.30tf.
5.2. The Thickness of the End-Plate
The end-plate thickness of the joint could be calculated according to the [29] by Equation (4). The calculated result showed that the end-plate thickness should not be less than 22 mm.
where Nt represented the design value of the tensile force of a high-strength bolt; ew and ef represented the distance from the center of the bolt to the web and the flange plate, respectively; b represented the width of the end-plate; f represented the design strength of the end-plate.
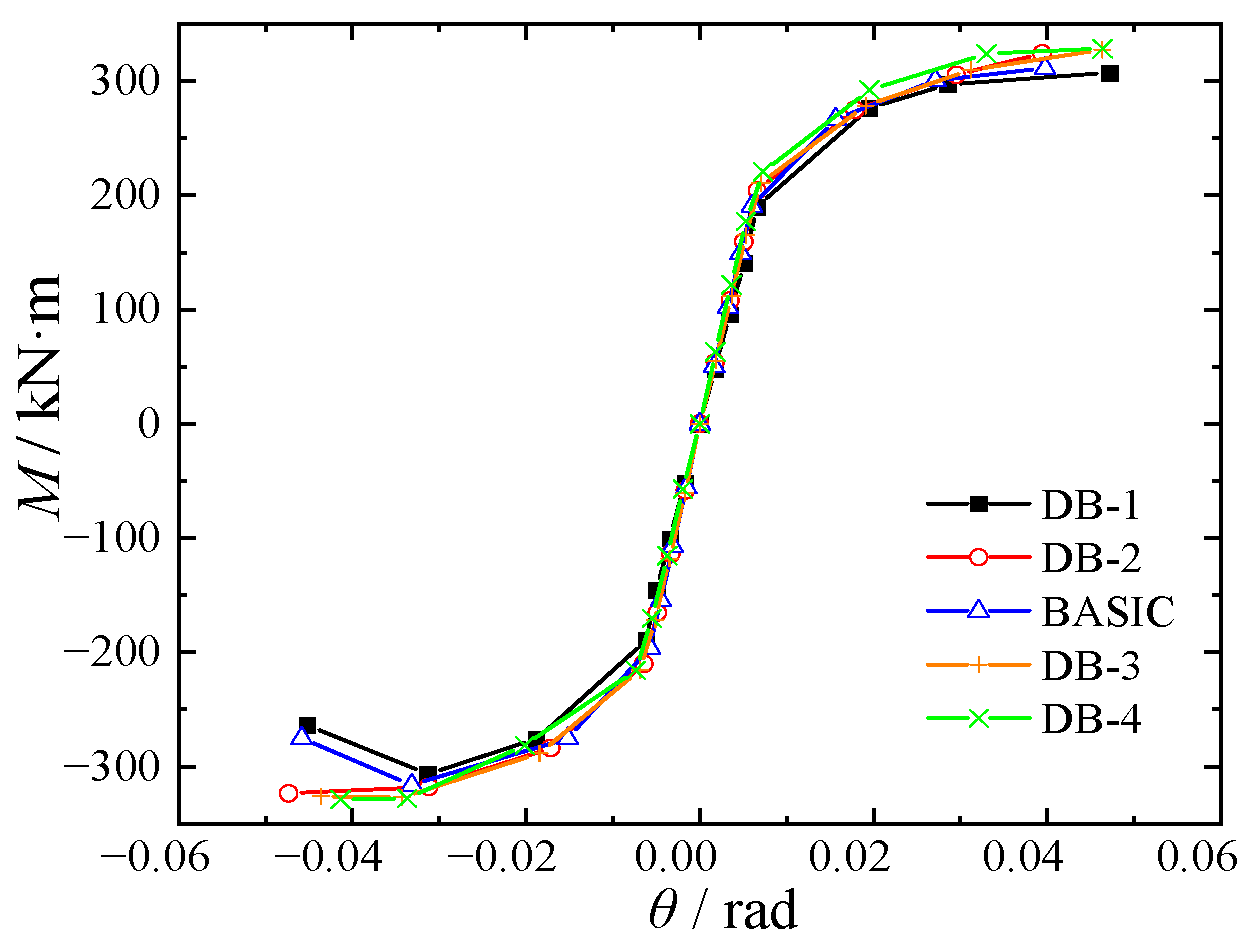
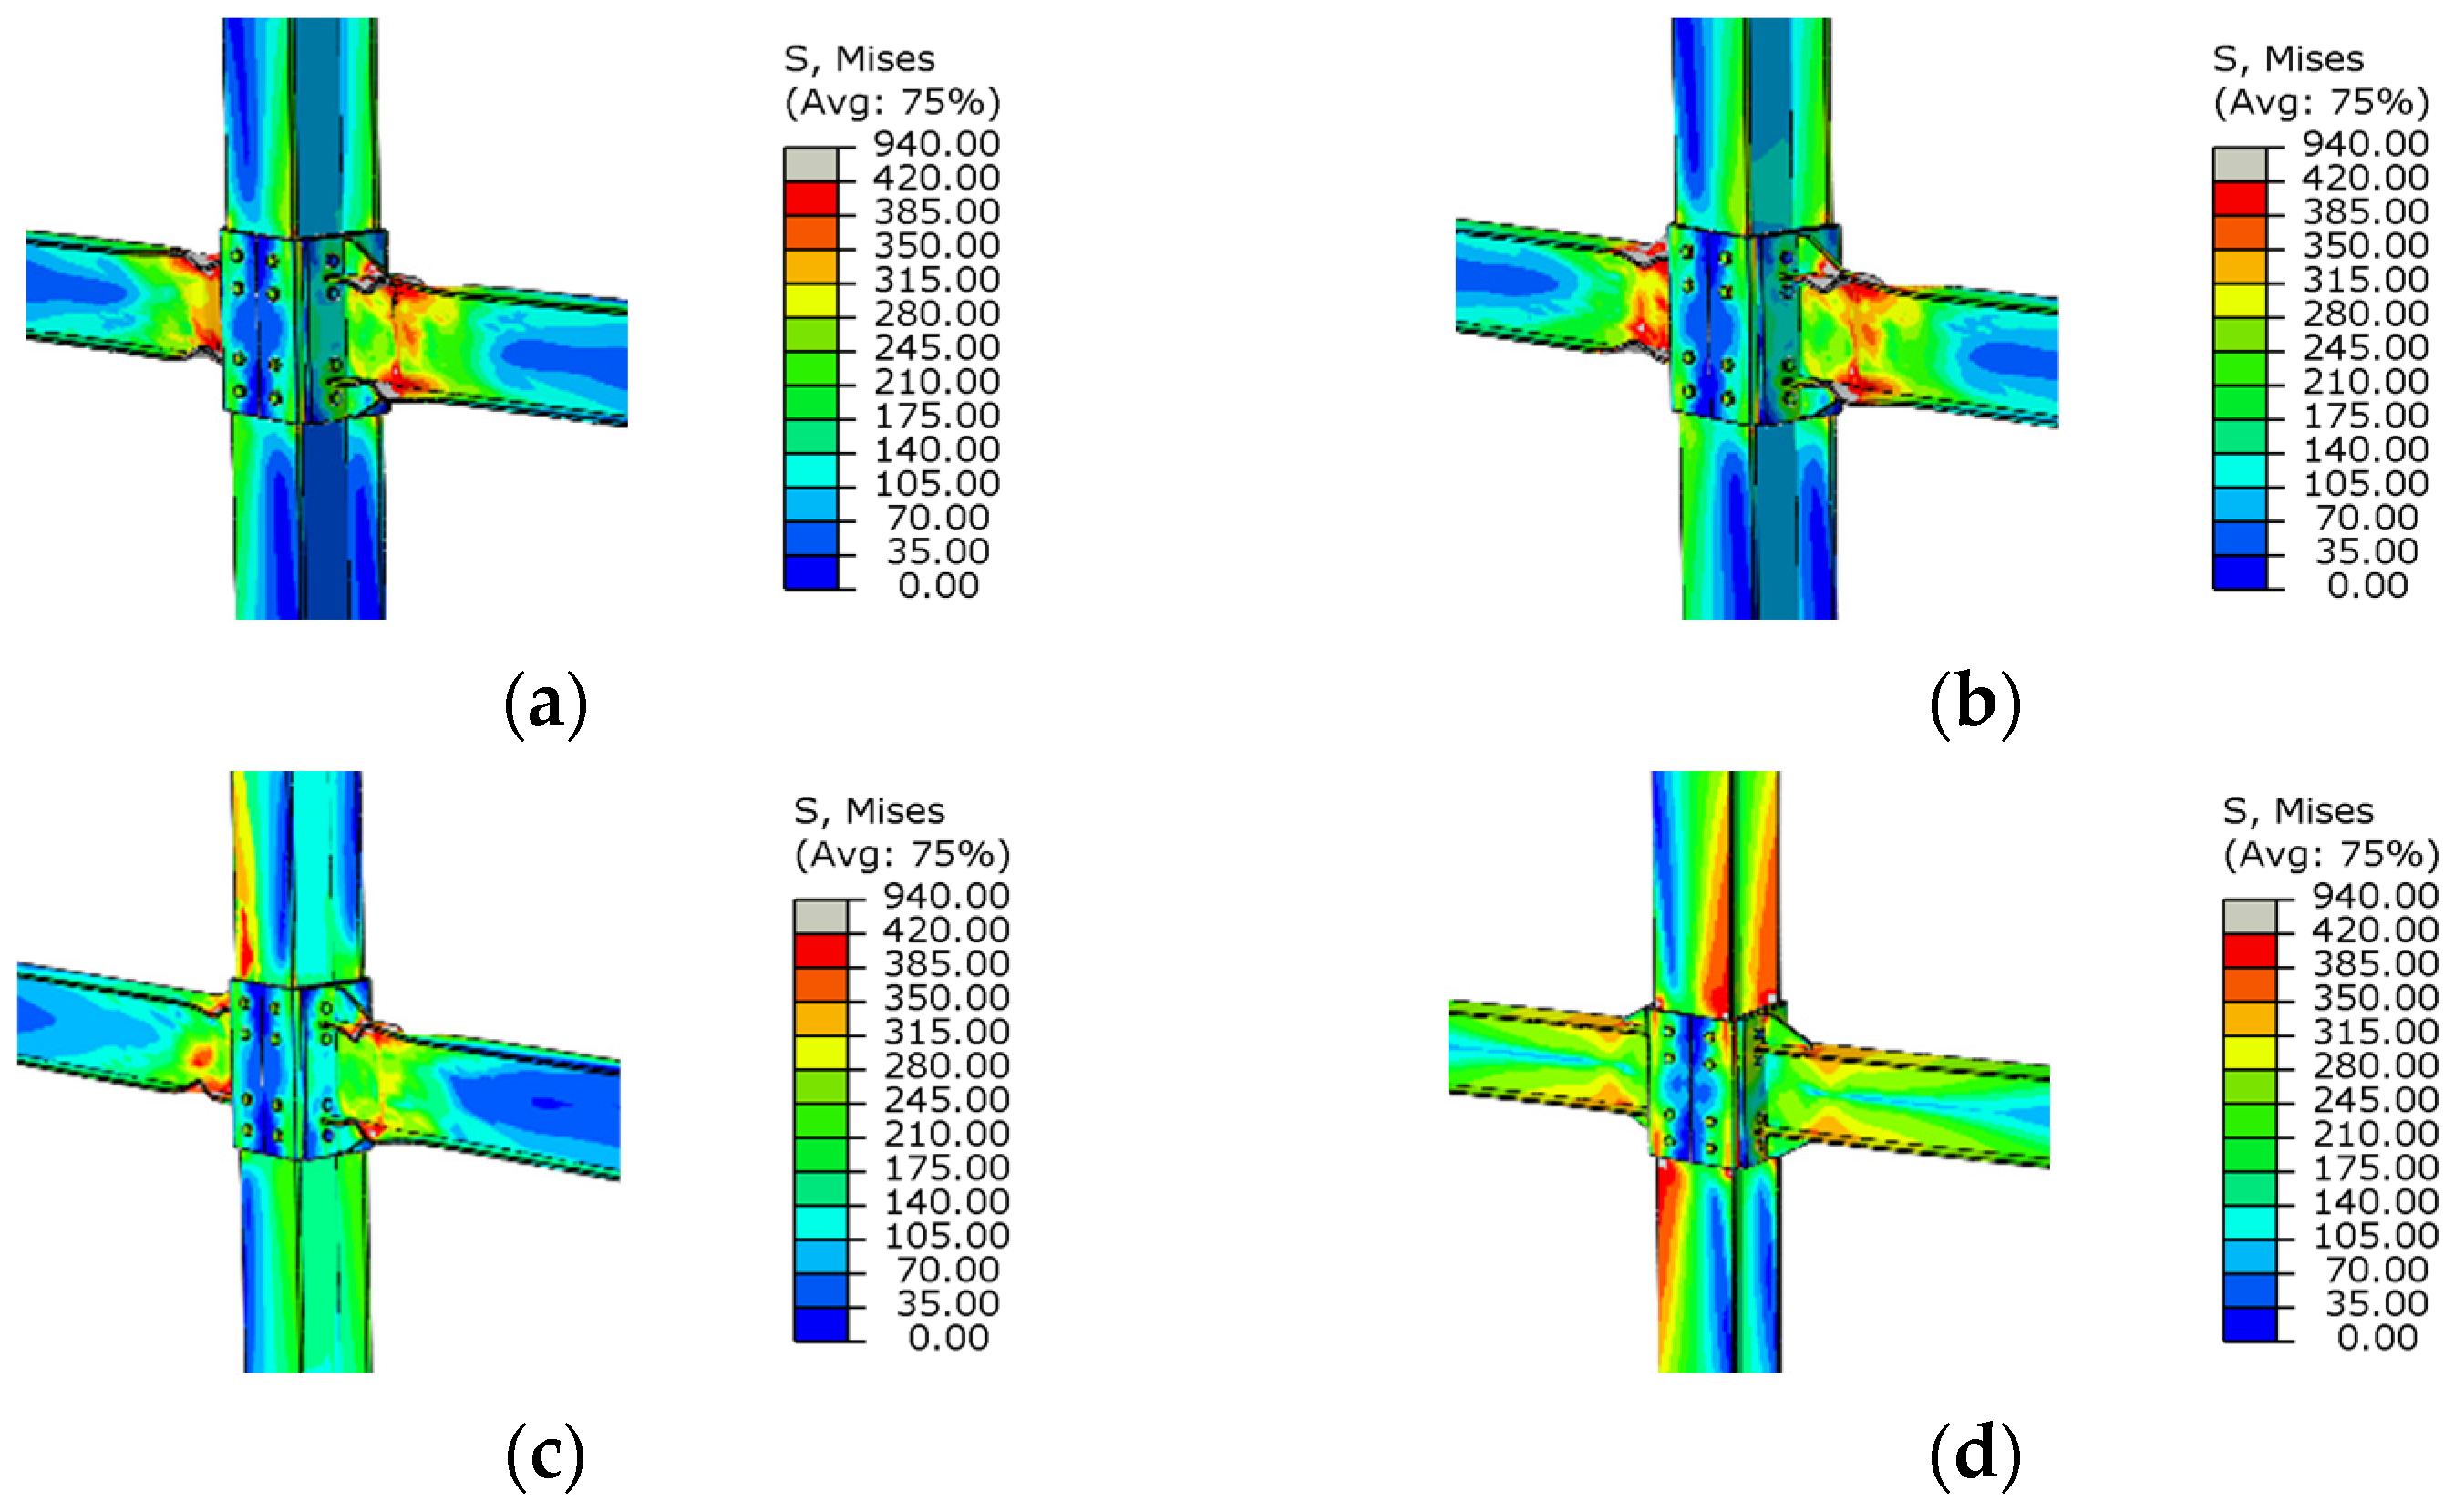
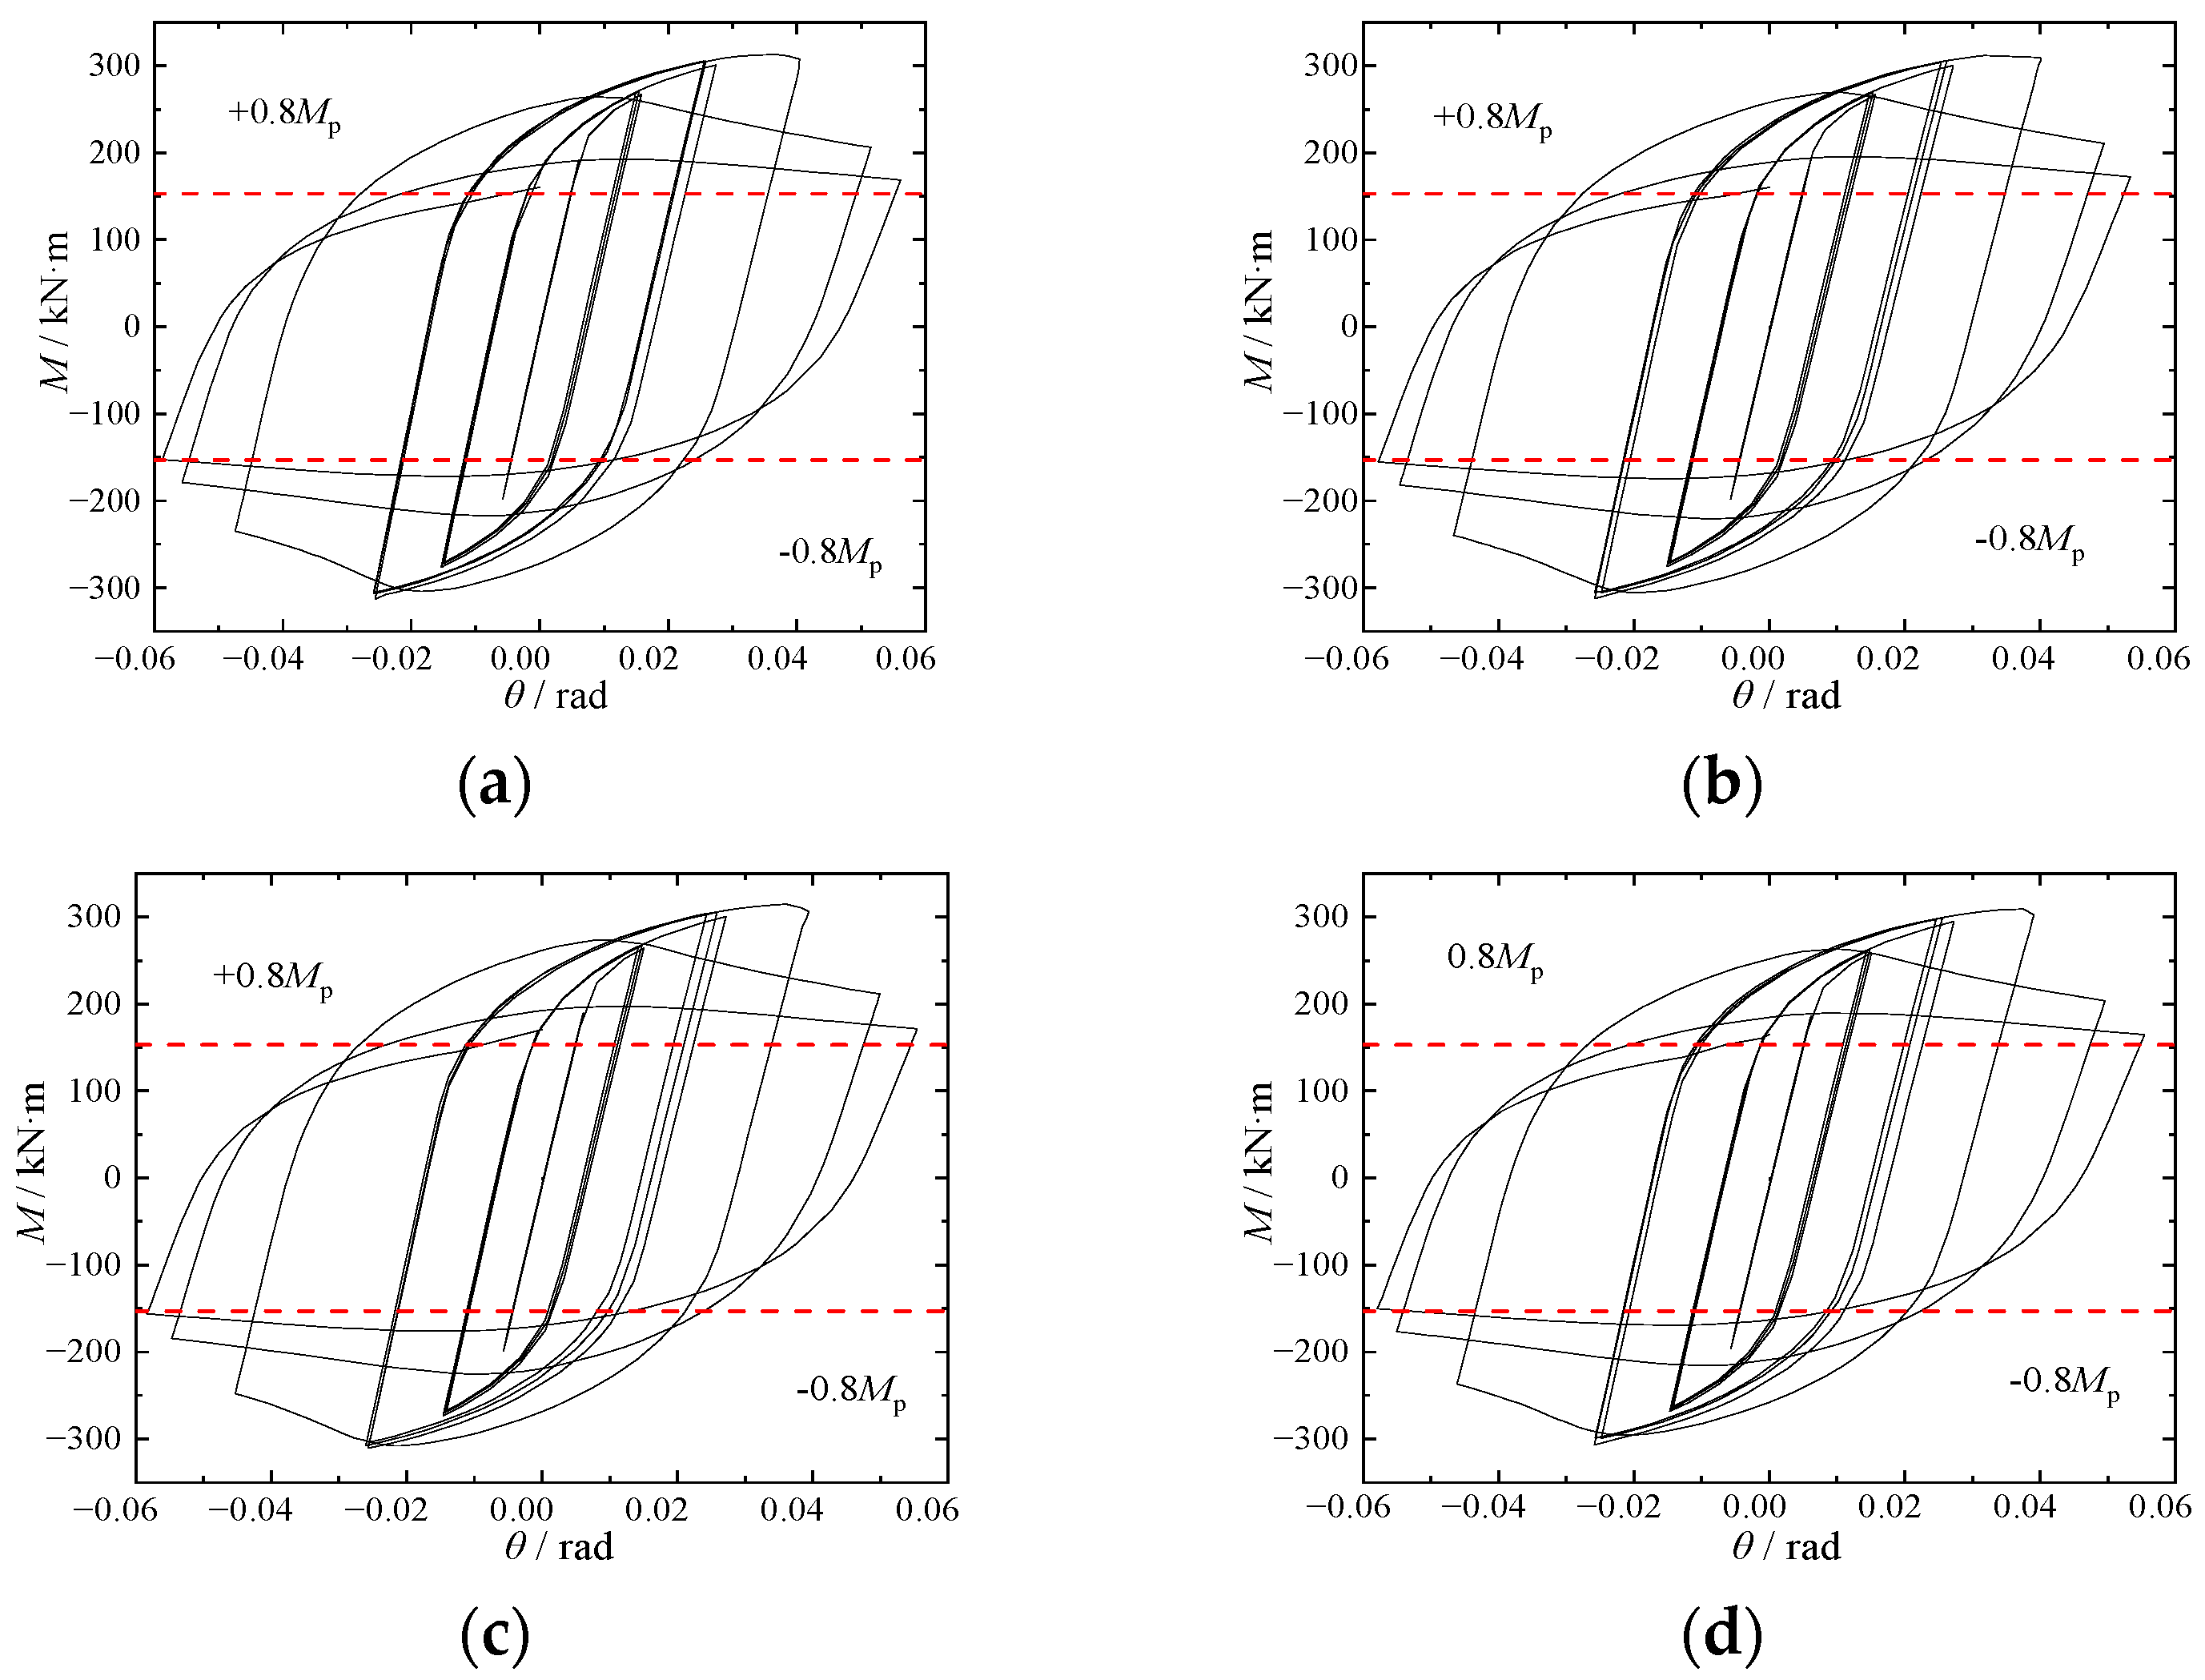
The end-plate thickness was varied, with values of 18 mm, 22 mm, 26 mm, and 30 mm. DB-1, DB-2, DB-3, and DB-4 specimens were established, respectively. The contours of the Von Mises stress of DB series specimens under failure modes are shown in Figure 13, and hysteresis curves and skeleton curves are shown in Figure 14 and Figure 15, respectively.
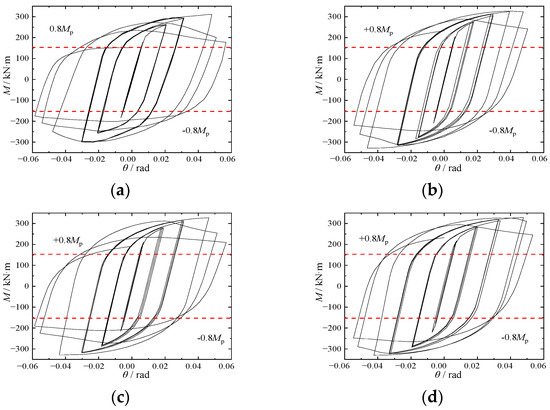
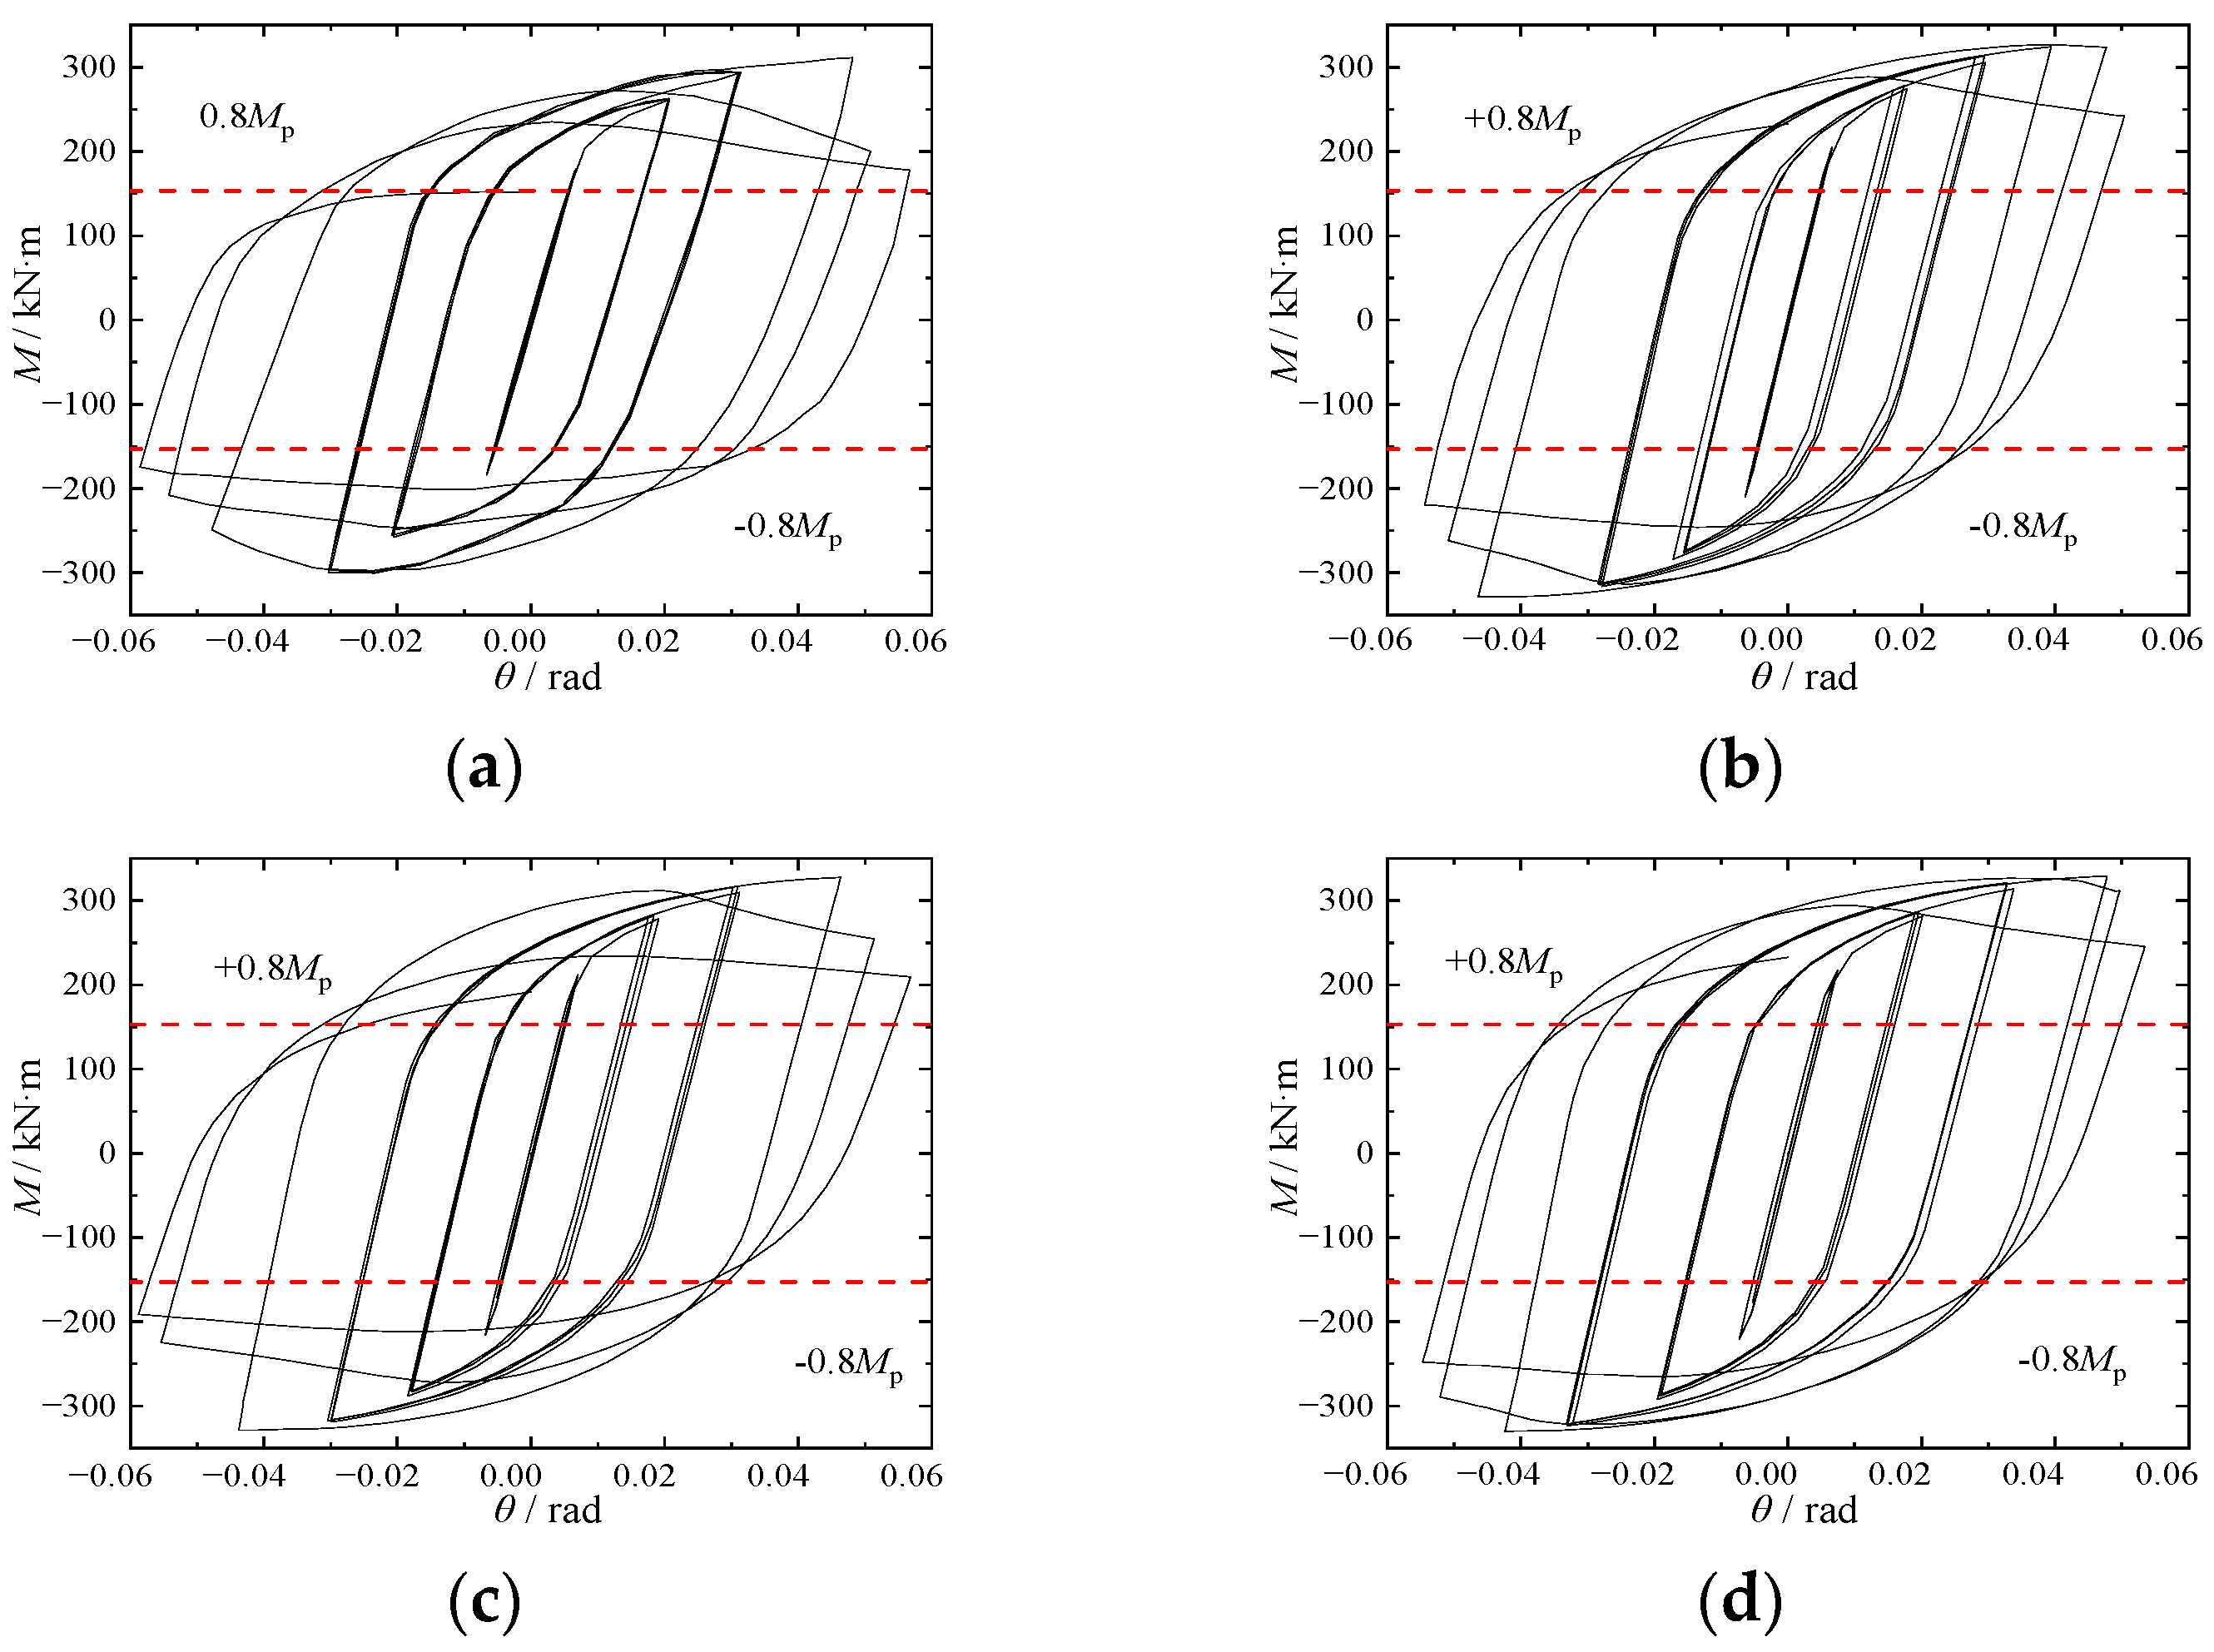
Figure 14.
Hysteresis curves of DB series specimens: (a) DB-1; (b) DB-2; (c) DB-3; (d) DB-4.
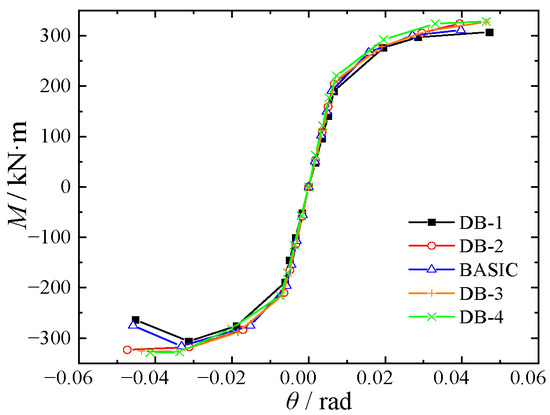
Figure 15.
Skeleton curves of DB specimens.
For the DB-1 specimen, larger stress was concentrated at the welding of the beam flange and the end-plate because the thinner end-plate exceeded the maximum stress that the end-plate could suffer. The DB-1 specimen was destroyed earlier than the other three specimens. The plastic strain was mainly concentrated on the U-shaped connector and the column flange at the end of loading. The failure modes of DB-2 to DB-4 specimens were similar to the BASIC specimen, and significant buckling deformation occurred on the beam flange and web at the end of the stiffener. The hysteresis curves of the DB-2 to DB-4 specimens were relatively full, and the plastic deformation and energy dissipation capacity were better.
When the end-plate thickness was varied from 18 to 22 mm, 18 to 24 mm, 18 to 26 mm, and 18 to 30 mm, the maximum moment was increased by 4.0%, 4.2%, 8.3%, and 8.7%, respectively, and the ductility coefficient of specimens was reduced by 1.9%, 2.2%, 8.4%, and 14.7%, respectively. It could be seen that the ductility of the beam end was significantly affected by the end-plate thickness.
Under the same load, the relative rotation of the beam and column would be inhibited by the thicker end-plate, and tensile failure would occur at the bolt. The plastic hinge would arise in the joint because of the thinner end-plate and the joint would fail before the beam. The calculated results of the end-plate thickness could satisfy the seismic demands.
5.3. The Axial Compression Ratio of the Column
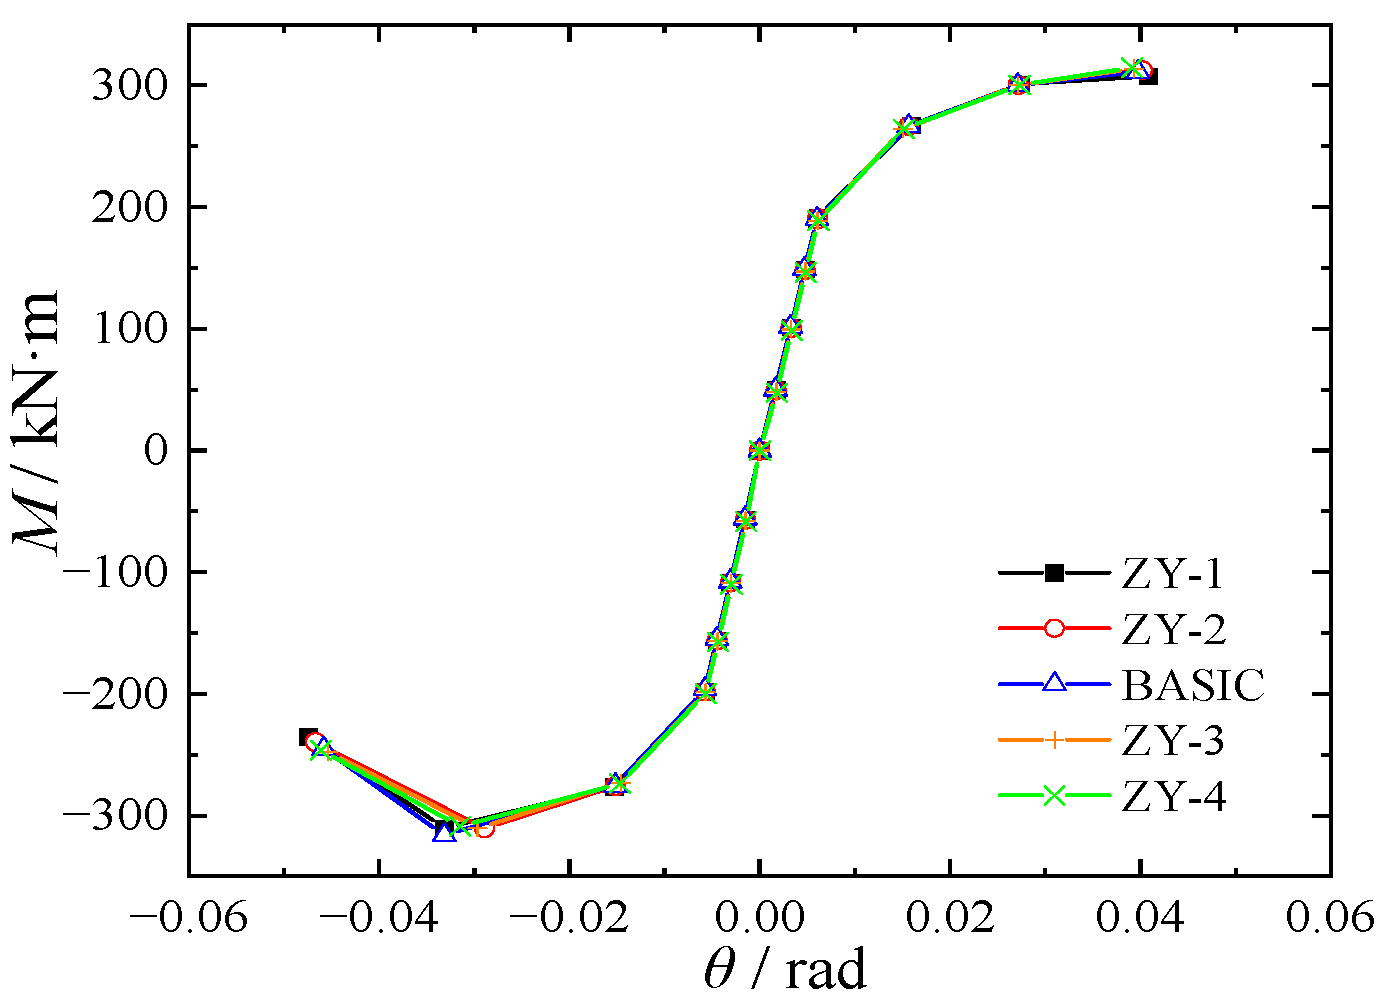
The axial compression ratio varied with values of 0.3, 0.4, 0.6 and 0.8. ZY-1, ZY-2, ZY-3 and ZY-4 specimens were established, respectively. The contours of the Von Mises stress of ZY series specimens under failure modes are shown in Figure 16, and hysteresis curves and skeleton curves are shown in Figure 17 and Figure 18, respectively.
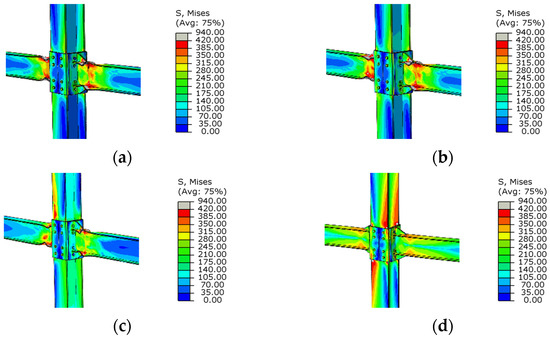
Figure 16.
The contour of the Von Mises stress of ZY specimens under failure modes: (a) ZY-1; (b) ZY-2; (c) ZY-3; (d) ZY-4.
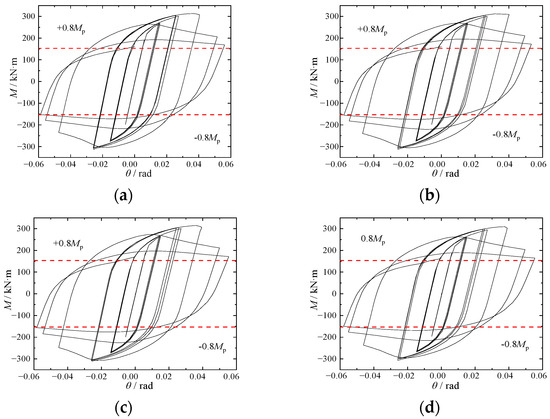
Figure 17.
Hysteresis curves of ZY series specimens: (a) ZY-1; (b) ZY-2; (c) ZY-3; (d) ZY-4.

Figure 18.
Skeleton curves of ZY specimens.
When the axial compression ratio increased from 0.3 to 0.8, the failure modes of ZY series specimens vastly differed with growth in the axial compression. When the axial compression ratio was less than 0.6, the failure mode of the specimen was consistent with the BASIC specimen.
The high-stress region and the severe buckling deformation appeared at the beam far from the panel zone. No obvious deformation occurred in the panel zone, and the ‘strong joint’ characteristic was shown in these specimens. When the axial compression ratio was greater than 0.6, the high-stress region was shifted from the beam flange to the column flange, and the failure mode of these joints was changed from beam failure to joint and column failure.
The maximum moment was reduced by 1.1%, 1.4%, 2.1%, and 2.5%, respectively, and the ductility coefficient of specimens was decreased by 0.4%, 4.4%, 4.4%, and 6.5%, respectively, when the axial compression ratio was varied from 0.25 to 0.3, 0.25 to 0.4, 0.25 to 0.6 and 0.25 to 0.8. It could be seen that the axial compression ratio of the column is negatively correlated with the ductility. However, it had little effect on the specimen’s yielding moment and maximum moment.
The seismic behavior of the joint would be reduced with the increase in the axial compression ratio. When the axial compression ratio of the column of the specimen exceeded 0.6, the local buckling deformation of the column flange occurred before the beam flange. Therefore, the axial compression ratio should not exceed 0.6.
5.4. The Linear Stiffness Ratio of the Beam to Column
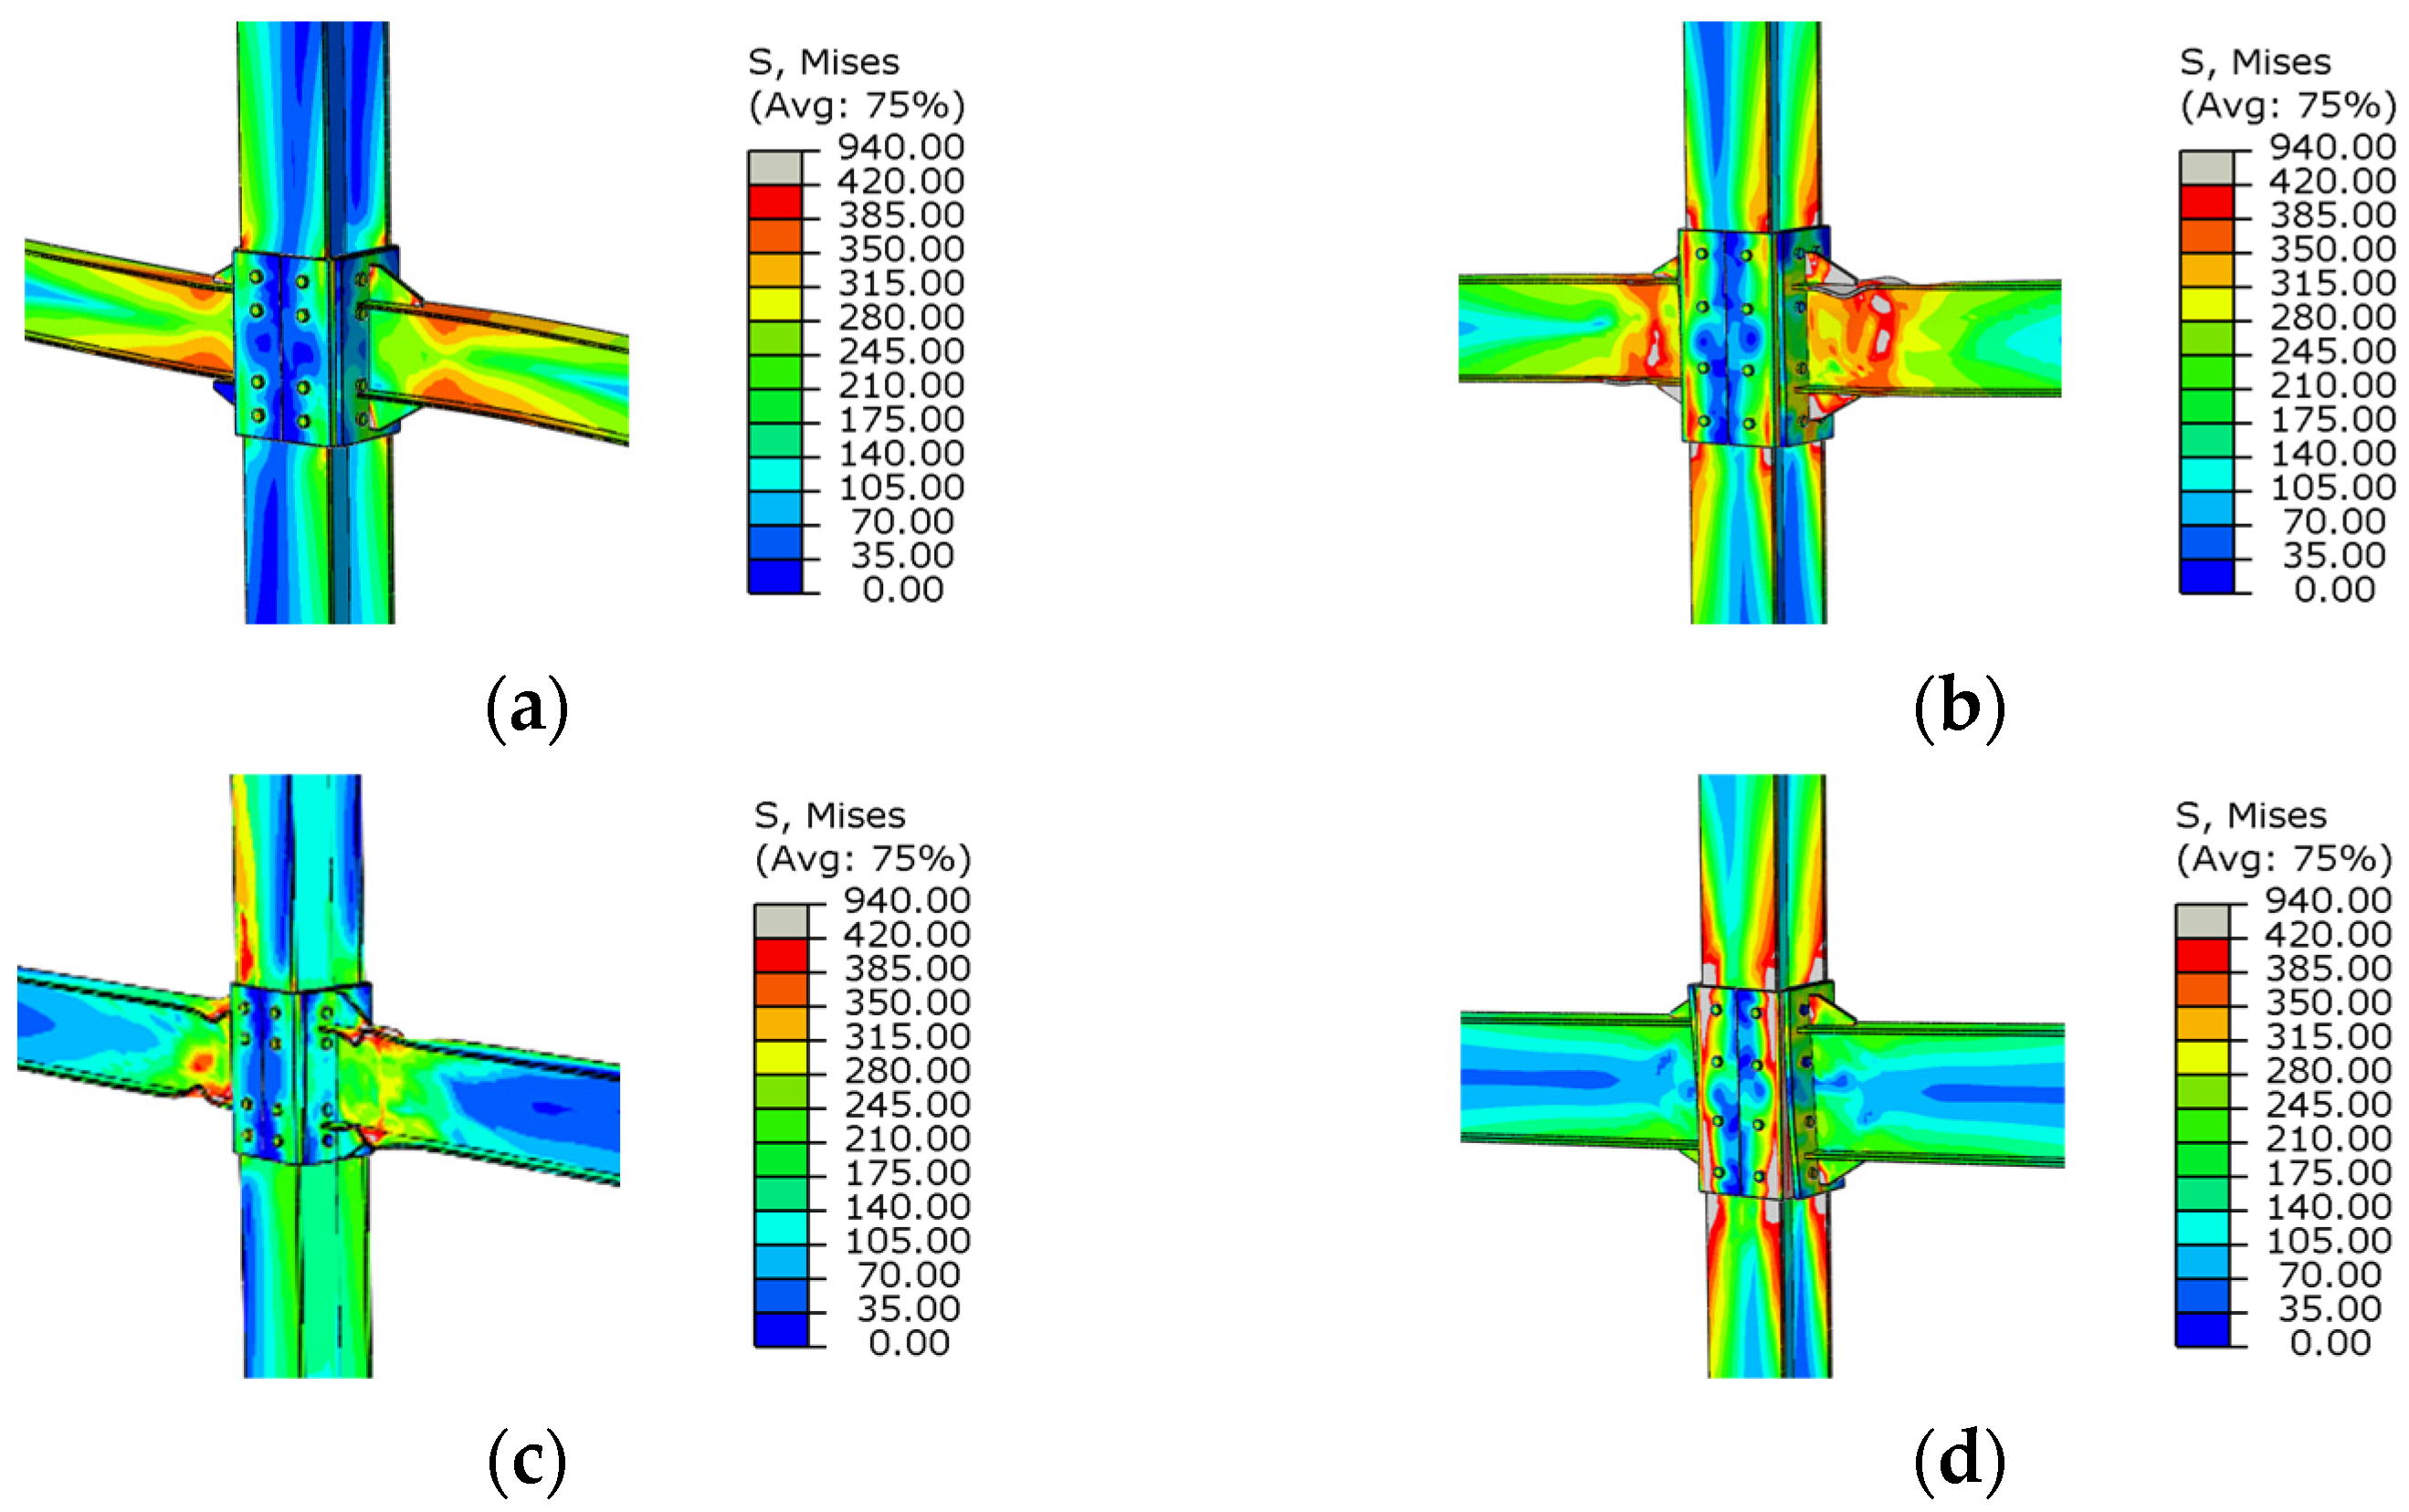
The beam section size was changed to HN300 × 150 × 6.5 × 9, HN400 × 200 × 8 × 13, HN450 × 200 × 9 × 14, and HN500 × 200 × 10 × 16. BLS-1, BLS-2, BLS-3, and BLS-4 specimens were established, respectively. The linear stiffness ratio of the beam to the column varied with values of 0.32, 1.09, 1.45, and 2.10. The contours of the Von Mises stress of BLS series specimens under failure modes are shown in Figure 19, and the hysteresis and skeleton curves are shown in Figure 20 and Figure 21, respectively.

Figure 19.
The contour of the Von Mises stress of BLS specimens under failure modes: (a) BLS-1; (b) BLS-2; (c) BLS-3; (d) BLS-4.
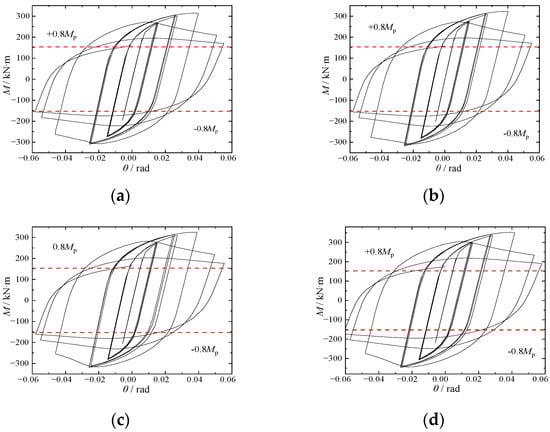
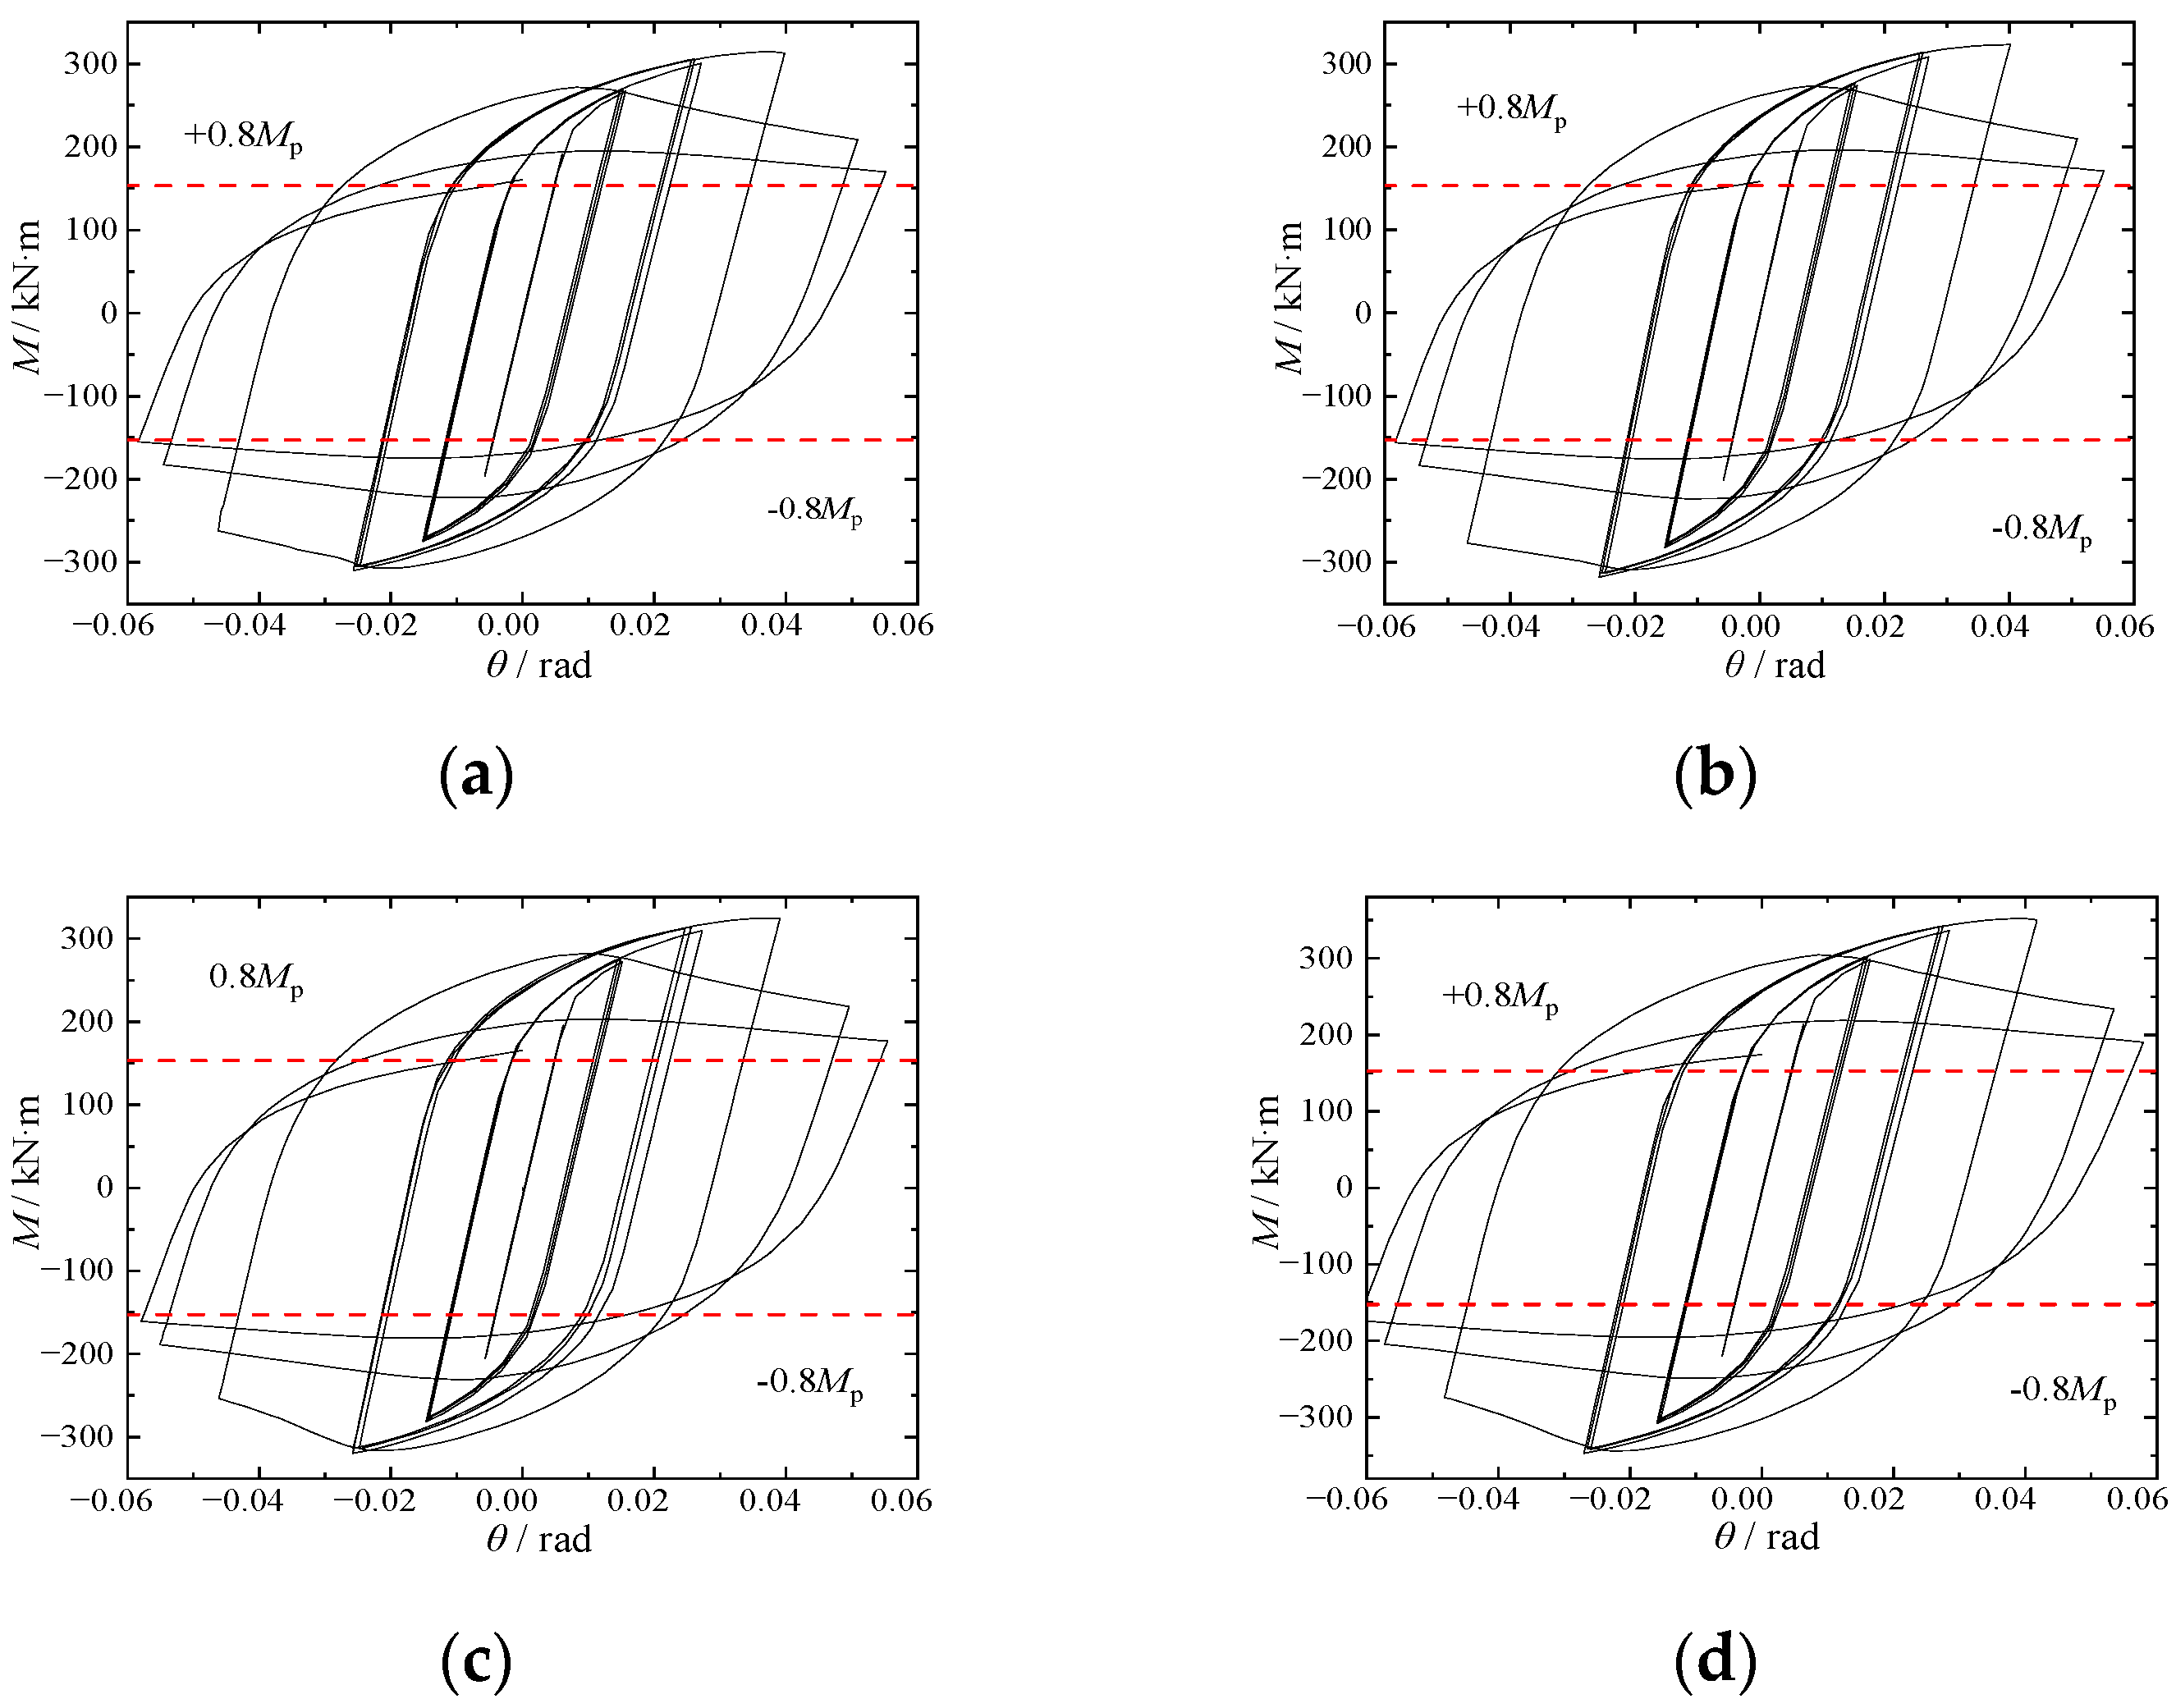
Figure 20.
Hysteresis curves of BLS series specimens: (a) BLS-1; (b) BLS-2; (c) BLS-3; (d) BLS-4.
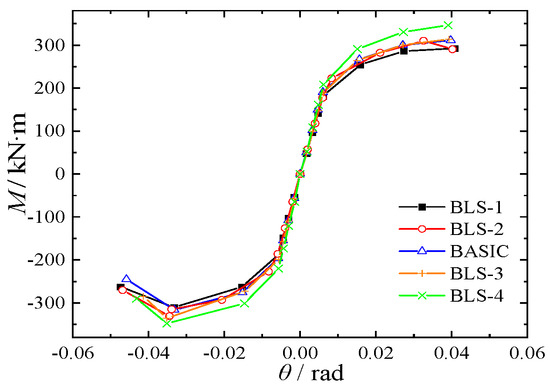
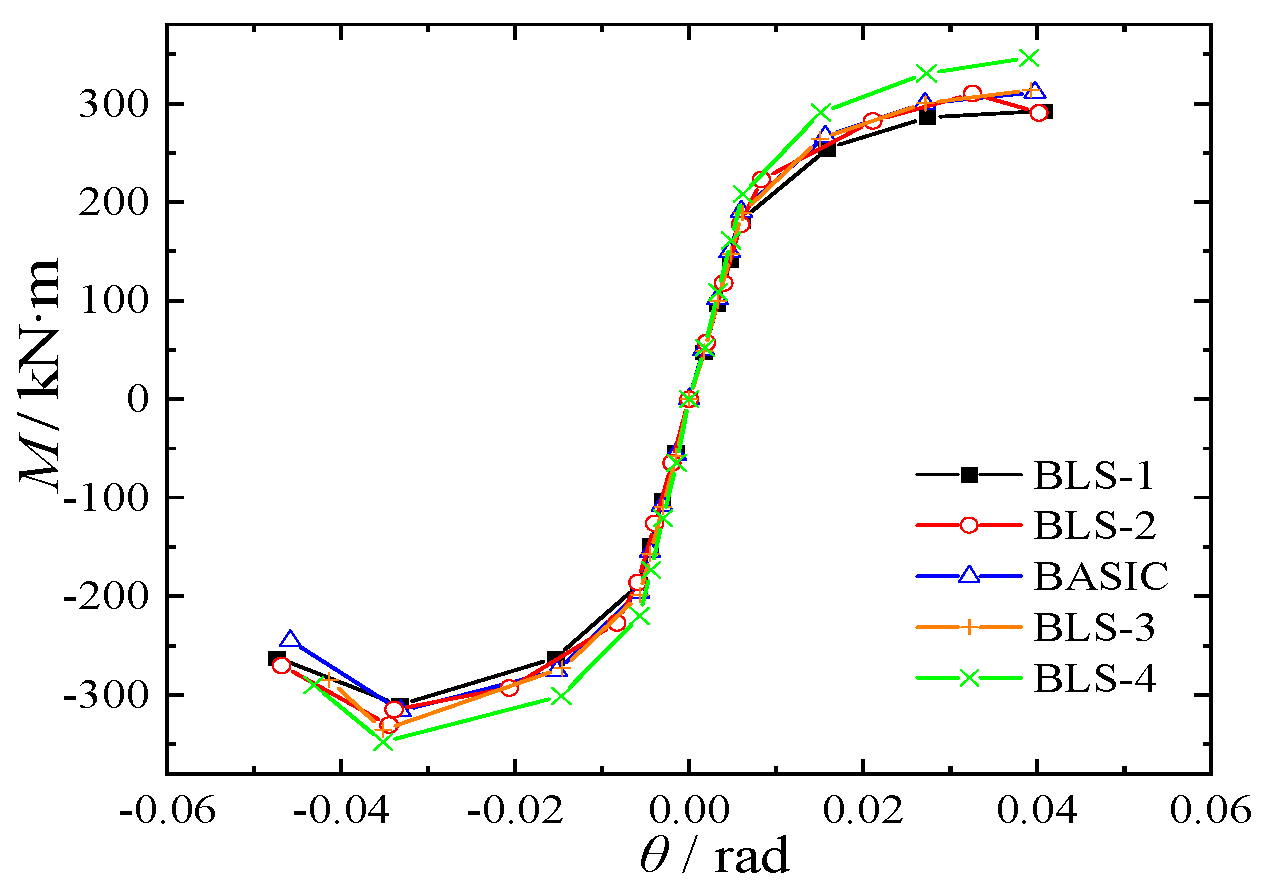
Figure 21.
Skeleton curves of BLS specimens.
When the linear stiffness ratio of the beam to column increased from 0.32 to 2.10, failure modes with significant differences appeared on the BLS series specimens. The failure mode was consistent with the BASIC specimen when the linear stiffness ratio of the beam to the column was less than 1.5. When the linear stiffness ratio of the beam to the column was greater than 1.5, the high-stress region was transferred from the beam flange to the vicinity of the column flange in the panel zone. In addition, the failure was concentrated on the column and the U-shaped connector web. The stress value reached the maximum stress value, and the plastic deformation was more significant in these regions.
The maximum moment was increased by 6.3%, 8.0%, and 11.9%, respectively, and the ductility coefficient of specimens was reduced by 4.4%, 14.9%, and 21.1%, respectively, when the linear stiffness ratio of the beam to the column was varied from 0.32 to 1.05, 0.32 to 1.49 and 0.32 to 2.10. It could be seen that the maximum moment of the beam was significantly affected by the linear stiffness ratio of the beam to column, and the linear stiffness ratio of the beam to column was negatively correlated with the ductility behavior.
The failure mode of the specimen was ideal when the linear stiffness ratio of the beam to the column was less than 1.5. Considering the inevitable defects in practical engineering, the linear stiffness ratio of the beam to the column was limited to 1.5.
5.5. Classification of Beam-to-Column Joints
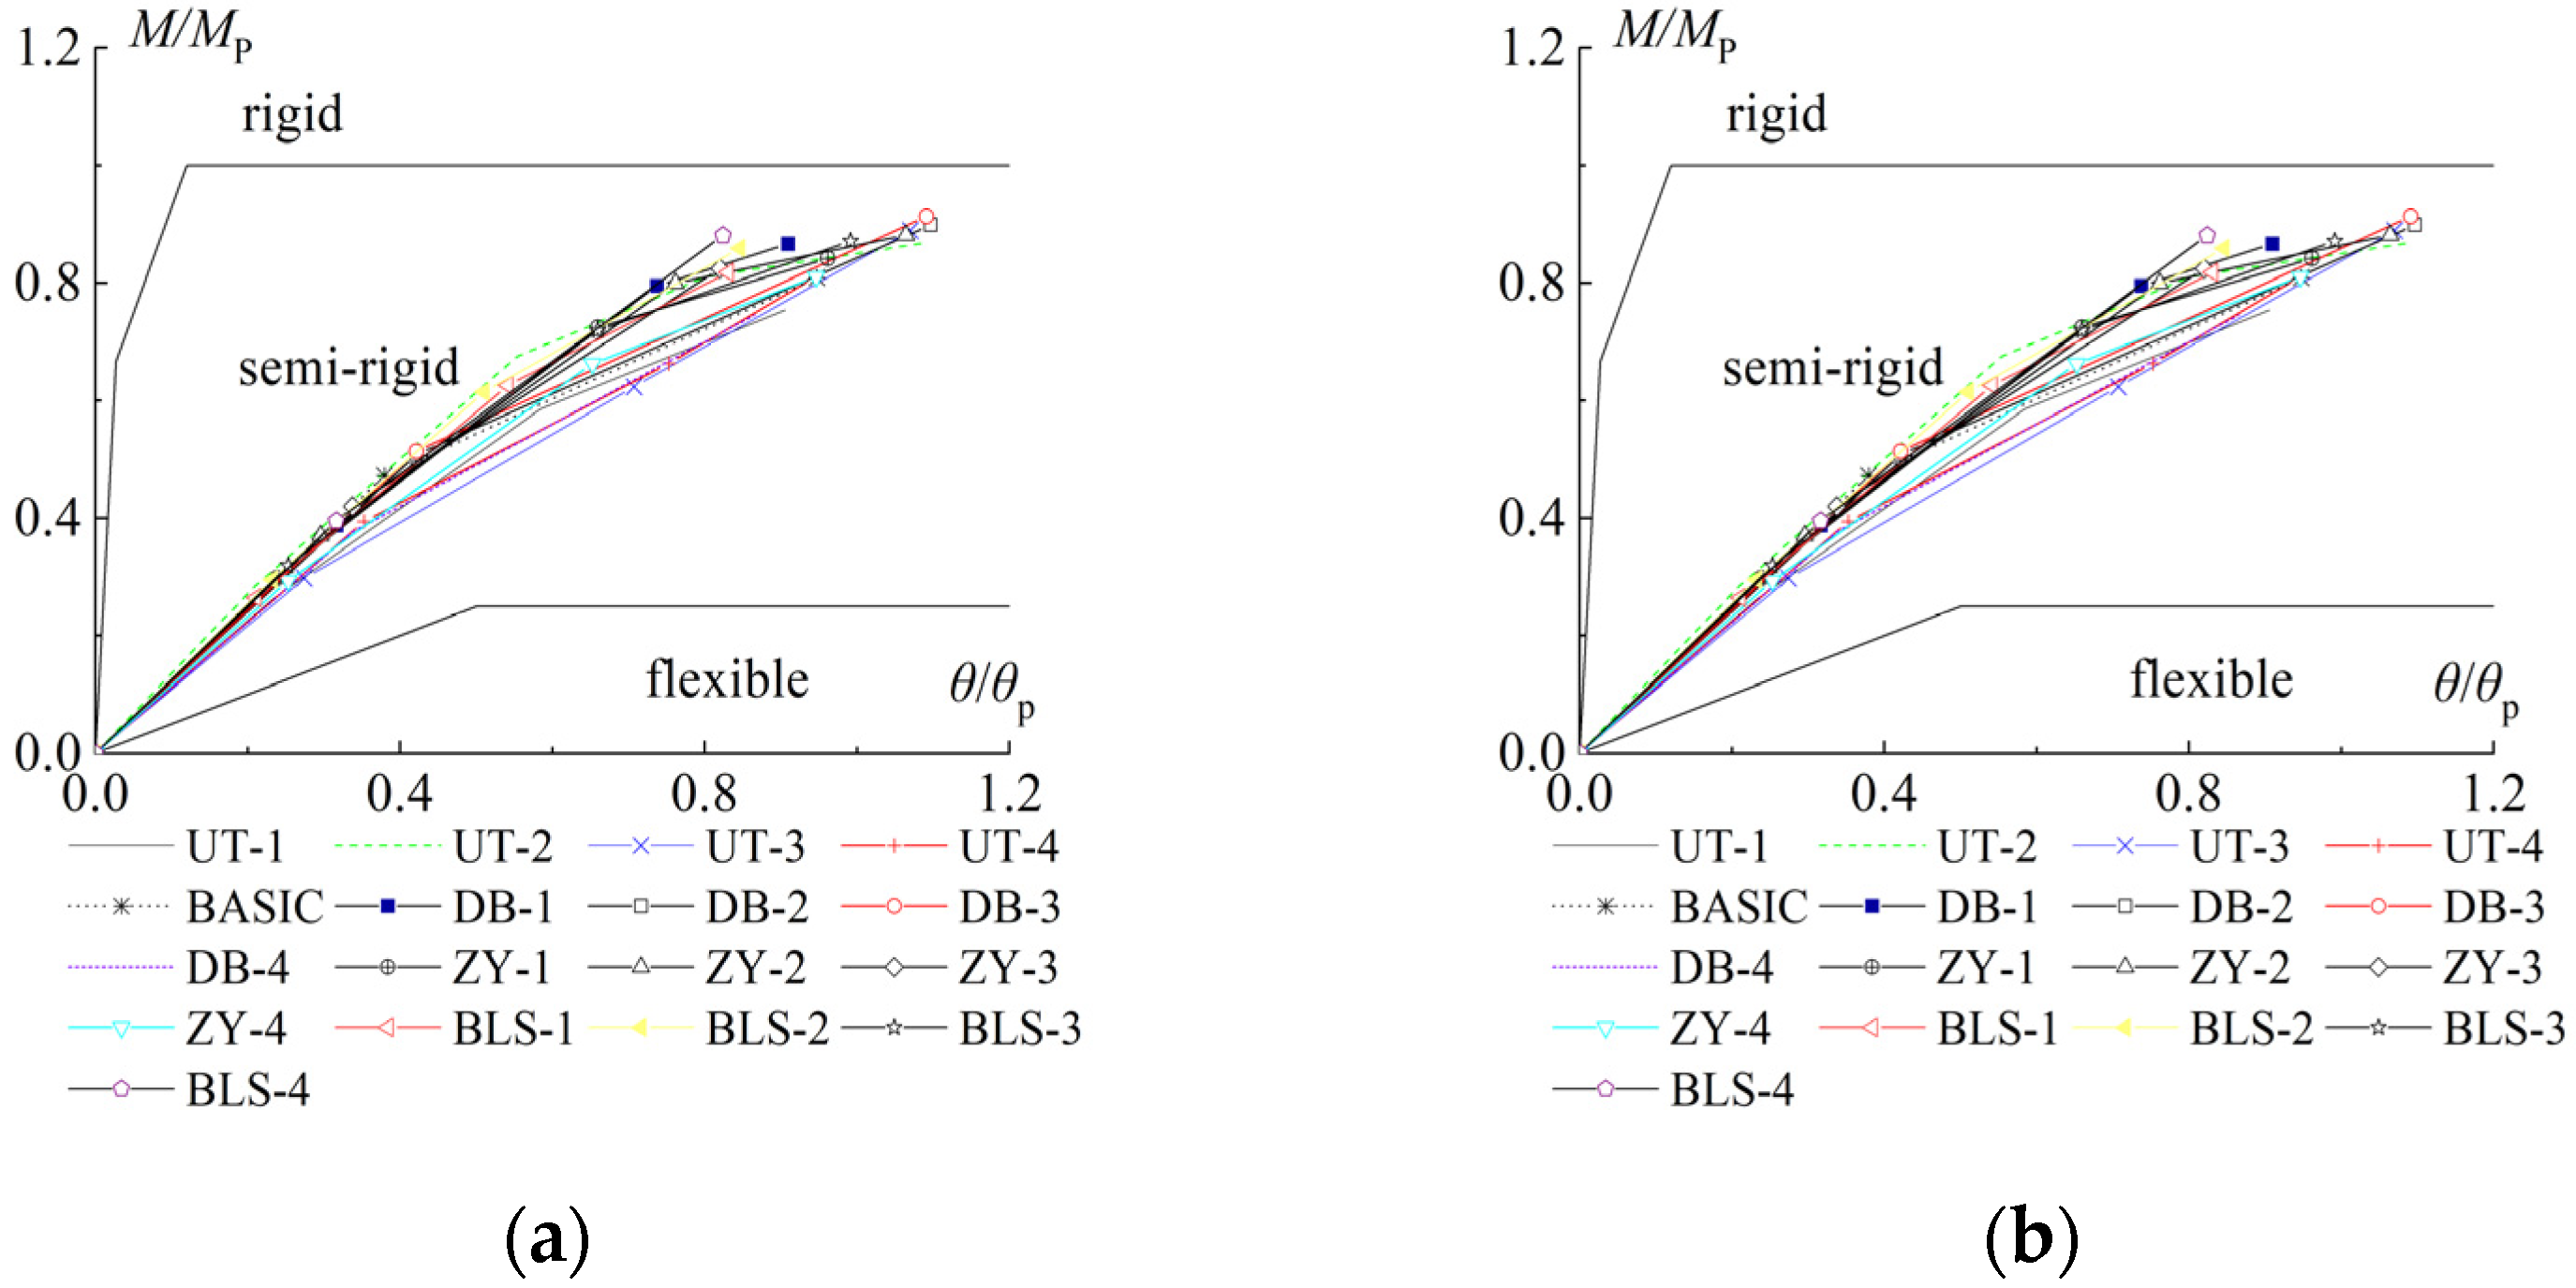
According to the definition of stiffness classification in EC3 [1], the types of joints of each specimen are classified by the calculation of the skeleton curves, as shown in Figure 22.
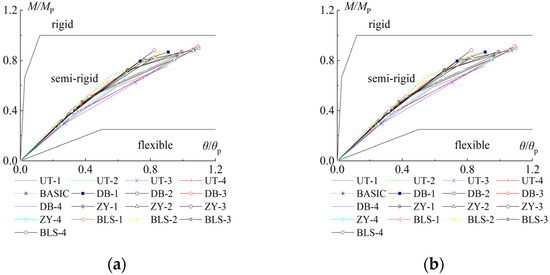
Figure 22.
Joint classification: (a) non-sway frame; (b) sway frame.
The value of the maximum plastic rotation θp is calculated by Equation (5).
where θp represents the value of the maximum plastic rotation; lb represents the span of the beam; Es represents elastic modulus; Ib represents the moment of inertia of the beam section.
As shown in Figure 22, each joint is a typical semi-rigid connection based on the stiffness classification, whether in the frame with or without lateral displacement. According to the classification of connection strength, each joint’s M/MP value is between 0.25 and 1.0, which means that the type of each joint is an under-strong connection [30], and sufficient rotation capacity is available on each joint. The calculated results demonstrated that the novel kind of joints exhibit better stiffness, ductility, and bearing capacity when compared to rigid and hinged joints, thereby showing superior seismic behavior.
6. Conclusions
Based on the study of the seismic behavior of the BASIC specimen by FEM analysis, the effects of parameters are further analyzed in detail. Based on the results, the following conclusions have been drawn.
(1) The end-plate connection of the steel beam to the weak axis of an H-shaped column with a U-shaped connector is a typical semi-rigid joint with excellent rotation and deformation capacity. Setting the stiffener in the panel zone can keep the plastic hinge far away from the panel zone and avoid the stress concentration of the beam flange and the end-plate welding. The failure mode of the BASIC specimen satisfies the requirements of ‘strong joint and weak member’.
(2) The seismic behavior of the joint is affected by the thickness of the U-shaped connector. Plastic deformation occurs in the panel zone if the U-shaped connector is too thin. Conversely, if the U-shaped connector is overly thick, it results in a reduction in joint ductility. The appropriate end-plate thickness can not only make full use of the bearing capacity of bolts and the end-plate but also ensure that ductility in the joint is superior. The ductility of the joint decreases with the increase in the axial compression ratio. When the linear stiffness ratio of the beam to the column is less than 1.5, plastic deformation is formed at the beam flange and web away from the panel zone, which is an ideal failure mode.
(3) The parameter values are proposed as follows: the thickness of the U-shaped connector tu should be in the range of 1.15tf to 1.30tf; the thickness of the end-plate of the joint can be calculated according to the corresponding specification [28]; the axial compression ratio should not exceed 0.6; the linear stiffness ratio of the beam to the column is limited to 1.5.
Author Contributions
Conceptualization, S.N. and S.W.; methodology, S.N.; software, S.N., S.W. and S.C.; validation, S.N., S.C., W.W., X.J., Y.L. and M.L.; formal analysis, S.N.; investigation, S.N.; resources, S.N.; data curation, S.N.; writing—original draft preparation, S.N. and S.C.; writing—review and editing, S.N., S.C. and W.W.; visualization, S.N.; supervision, S.N.; project administration, S.N.; funding acquisition, S.N. All authors have read and agreed to the published version of the manuscript.
Funding
This paper is supported by the Key Research and Development Program of Shaanxi (No.2021SF-519, No.2024GX-YBXM-374).
Data Availability Statement
The data presented in this study are available on request from the corresponding author. The data are not publicly available due to patent protection.
Conflicts of Interest
The authors declare no conflicts of interest.
Nomenclature
| Δ | The horizontal displacement |
| H | The height from the loading point to the bottom of the column |
| R1 | The reaction force of the end of the left beam |
| l | The distance from the beam end to the surface of the U-shaped connector |
| N | Preliminary constant axial load |
| Mp | The plastic moment of the whole section of the beam |
| θp | The value of the maximum plastic rotation |
| My | The yielding moment of the joint |
| Mmax | The maximum moment of the joint |
| Mu | The ultimate moment of the joint |
| θy | The inter-story drift under the yielding moment of the joint |
| θmax | The inter-story drift under the maximum moment of the joint |
| θu | The inter-story drift under the ultimate moment of the joint |
| μ | The rotational ductility coefficient (=θu/θy). |
| Rki | The initial stiffness |
| Nt | The design value of the tensile force of a high-strength bolt |
| ew | The distance from the center of the bolt to the web |
| ef | The distance from the center of the bolt to the flange plate |
| f | The design strength of the end-plate |
| lb | The span of the beam |
| Es | Elastic modulus |
| Ib | The moment of inertia of the beam section |
References
- European Committee for Standardization. Eurocode 3: Design of Steel Structural. Part 1-8: Design of Joints; Wiley: London, UK, 2005. [Google Scholar]
- Wang, J.; Chen, L. Experimental investigation of extended end-plate joints to concrete-filled steel tubular columns. Constr. Steel Res. 2012, 79, 56–70. [Google Scholar] [CrossRef]
- Wang, J.; Zhang, L.; Spencer, B.F. Seismic response of extended end-plate joints to concrete-filled steel tubular columns. Eng. Struct. 2013, 49, 876–892. [Google Scholar] [CrossRef]
- Shi, G.; Shi, Y.; Li, S.; Wang, Y. Cyclic tests of semi-rigid end-plate connection in multi-story steel frames. Build. Struct. 2005, 26, 74. [Google Scholar]
- Shi, Y.J.; Wang, M.; Wang, Y.Q. Analysis on the behavior of steel frame end-plate connections. Eng. Mech. 2011, 28, 51–58. [Google Scholar]
- Zhao, B.D. Extended End-Plate Bolted Connections Behavior Study of Steel Frame Structure. Ph.D. Thesis, Xi’an University of Architecture and Technology, Xi’an, China, 2006. [Google Scholar]
- Ghobarah, A.; Osman, A.; Korol, R.M. Behavior of extended end-plate connections under cyclic loading. Eng. Struct. 1990, 12, 15–27. [Google Scholar] [CrossRef]
- Sumner, E.A.; Murray, T.M. Behavior of extended end-plate moment connections subject to cyclic loading. Struct. Eng. 2002, 128, 501–508. [Google Scholar] [CrossRef]
- Cabrero, J.M.; Bayo, E. The semi-rigid behavior of three-dimensional steel beam-to-column joints subjected to proportional loading. part I: Experimental evaluation. Constr. Steel Res. 2007, 63, 1241–1253. [Google Scholar] [CrossRef]
- Nie, S.F.; Wang, S.; Liu, B. Study on the seismic behavior of weak-axis end-plate joint of reinforced beam to column with U-shaped connector. Prog. Steel Build. Struct. 2023, 25, 38–48. [Google Scholar]
- Lu, L.F.; Liu, Y.; Li, K.S. Finite element analysis on the seismic behavior of DRBS weak-axis connection with box-shaped region. Prog. Steel Build. Struct. 2019, 21, 87–96. [Google Scholar]
- Lu, L.F.; Xu, Y.L.; Zheng, H. Investigation of composite action on seismic performance of weak-axis column bending connections. Constr. Steel Res. 2017, 129, 286–300. [Google Scholar] [CrossRef]
- Wang, L.L. Study on Seismic Behavior and Design Method of Widen Beam-End Flange Weak Axis Connection with Box-Shaped Panel Zone of I-Section Column. Master’s Thesis, Chang’an University, Xi’an, China, 2018. [Google Scholar]
- Tagawa, H.; Gurel, S. Application of steel channels as stiffeners in bolted moment connections. Constr. Steel Res. 2005, 61, 1650–1671. [Google Scholar] [CrossRef]
- Kukreti, A.P.; Shou, F.-F. Eight-bolt endplate connection and its influence on frame behavior. Eng. Struct. 2006, 28, 1487–1493. [Google Scholar] [CrossRef]
- Kim, S.; Kim, S.; Ju, K.Y. Strength evaluation of beam–column connection in the weak axis of H-shaped column. Eng. Struct. 2007, 30, 1699–1710. [Google Scholar] [CrossRef]
- Shim, H.J.; Lee, E.T.; Kim, S.B.; Kim, S.S. Development and Performance Evaluation of Weak-Axis Column Bending Connections for Advanced Constructability. Int. J. Steel Struct. 2014, 14, 369–380. [Google Scholar] [CrossRef]
- Nassiraei, H.; Rezadoost, P. Initial stiffness, ultimate capacity and failure mechanisms of tubular X-joints with external ring or plates at fire conditions. Ships Offshore Struct. 2024, 236, 1–23. [Google Scholar] [CrossRef]
- Rahgozar, N.; Rahgozar, N. Experimental and Numerical Investigation on Flexural Strengthening of Precast Concrete Corbel Connections with Fiber-Reinforced Plastic Sheet. Buildings 2024, 14, 387. [Google Scholar] [CrossRef]
- Nie, S.F.; Wu, Y.F.; Wang, J.Q. Study on seismic properties of weak-axis joint of beam-column with web opening strengthened by casing. Earthq. Resist. Eng. Retrofit. 2019, 41, 22–30. [Google Scholar]
- Nie, S.F.; Ye, M.N.; Wu, Y.F. Seismic behavior of square tube confined steel-reinforced concrete column-RC ring beam joint. Archit. Civ. Eng. 2019, 36, 84–91. [Google Scholar]
- GB 50017-2017; Standard for Design of Steel Structures. China Architecture & Building Press: Beijing, China, 2017.
- Xu, Y.L.; Su, Y.X.; Shang, Y.F. Finite element analysis of rib reinforced weak-axis connector in steel frame. Eng. Mech. 2021, 38, 31–38. [Google Scholar]
- Li, S.F. Bolted end-plate connection of steel structure. J. Build. Struct. 1998, 8, 24–26. [Google Scholar]
- JGJ/T 101-2015; Specification for Seismic Test of Building. China Architecture & Building Press: Beijing, China, 2015.
- Lou, G.B.; Li, G.Q.; Lei, Q. Recent developments in the behavior and design of high-strength bolted end-plate connections(I). Prog. Steel Build. Struct. 2006, 8, 8–21. [Google Scholar]
- Lou, G.B.; Li, G.Q.; Lei, Q. Recent developments in the behavior and design of high-strength bolted end-plate connections(II). Prog. Steel Build. Struct. 2006, 8, 16–23. [Google Scholar]
- ANSI/AISC 341-10; Seismic Provisons for structural steel Buidings. American Institute of Steel Construction: Chicago, IL, USA, 2010.
- GB 51022-2015; Technical Code for Steel Structure of Light-weight Building with Gabled Frames. China Architecture & Building Press: Beijing, China, 2015.
- GB 50011-2016; Code for Seismic Design of Buildings. China Architecture & Building Press: Beijing, China, 2016.


Disclaimer/Publisher’s Note: The statements, opinions and data contained in all publications are solely those of the individual author(s) and contributor(s) and not of MDPI and/or the editor(s). MDPI and/or the editor(s) disclaim responsibility for any injury to people or property resulting from any ideas, methods, instructions or products referred to in the content. |
© 2024 by the authors. Licensee MDPI, Basel, Switzerland. This article is an open access article distributed under the terms and conditions of the Creative Commons Attribution (CC BY) license (https://creativecommons.org/licenses/by/4.0/).