1. Introduction
Concrete and steel-reinforced concrete have been widely utilized in modern civil constructions due to their cost-effectiveness and promising mechanical and physical properties. However, reinforced concrete buildings often face issues like cracking and the rusting of steel inside, which slowly makes the building weaker over time. This means the buildings do not last as long as they should and need more costly repairs. Compared to conventional concretes, engineered cementitious composite (ECC) exhibits higher impact strength, toughness [
1], tensile strength, strain capacity (up to 7%) [
2], and displays strain hardening properties and multi-cracking behavior [
3], etc. Its benefits are mainly due to the bridging effect of fibers. This effect occurs when fibers interact with the cement matrix, bridging cracks and preventing them from spreading as well as avoiding the formation of sudden cracks under loading [
4,
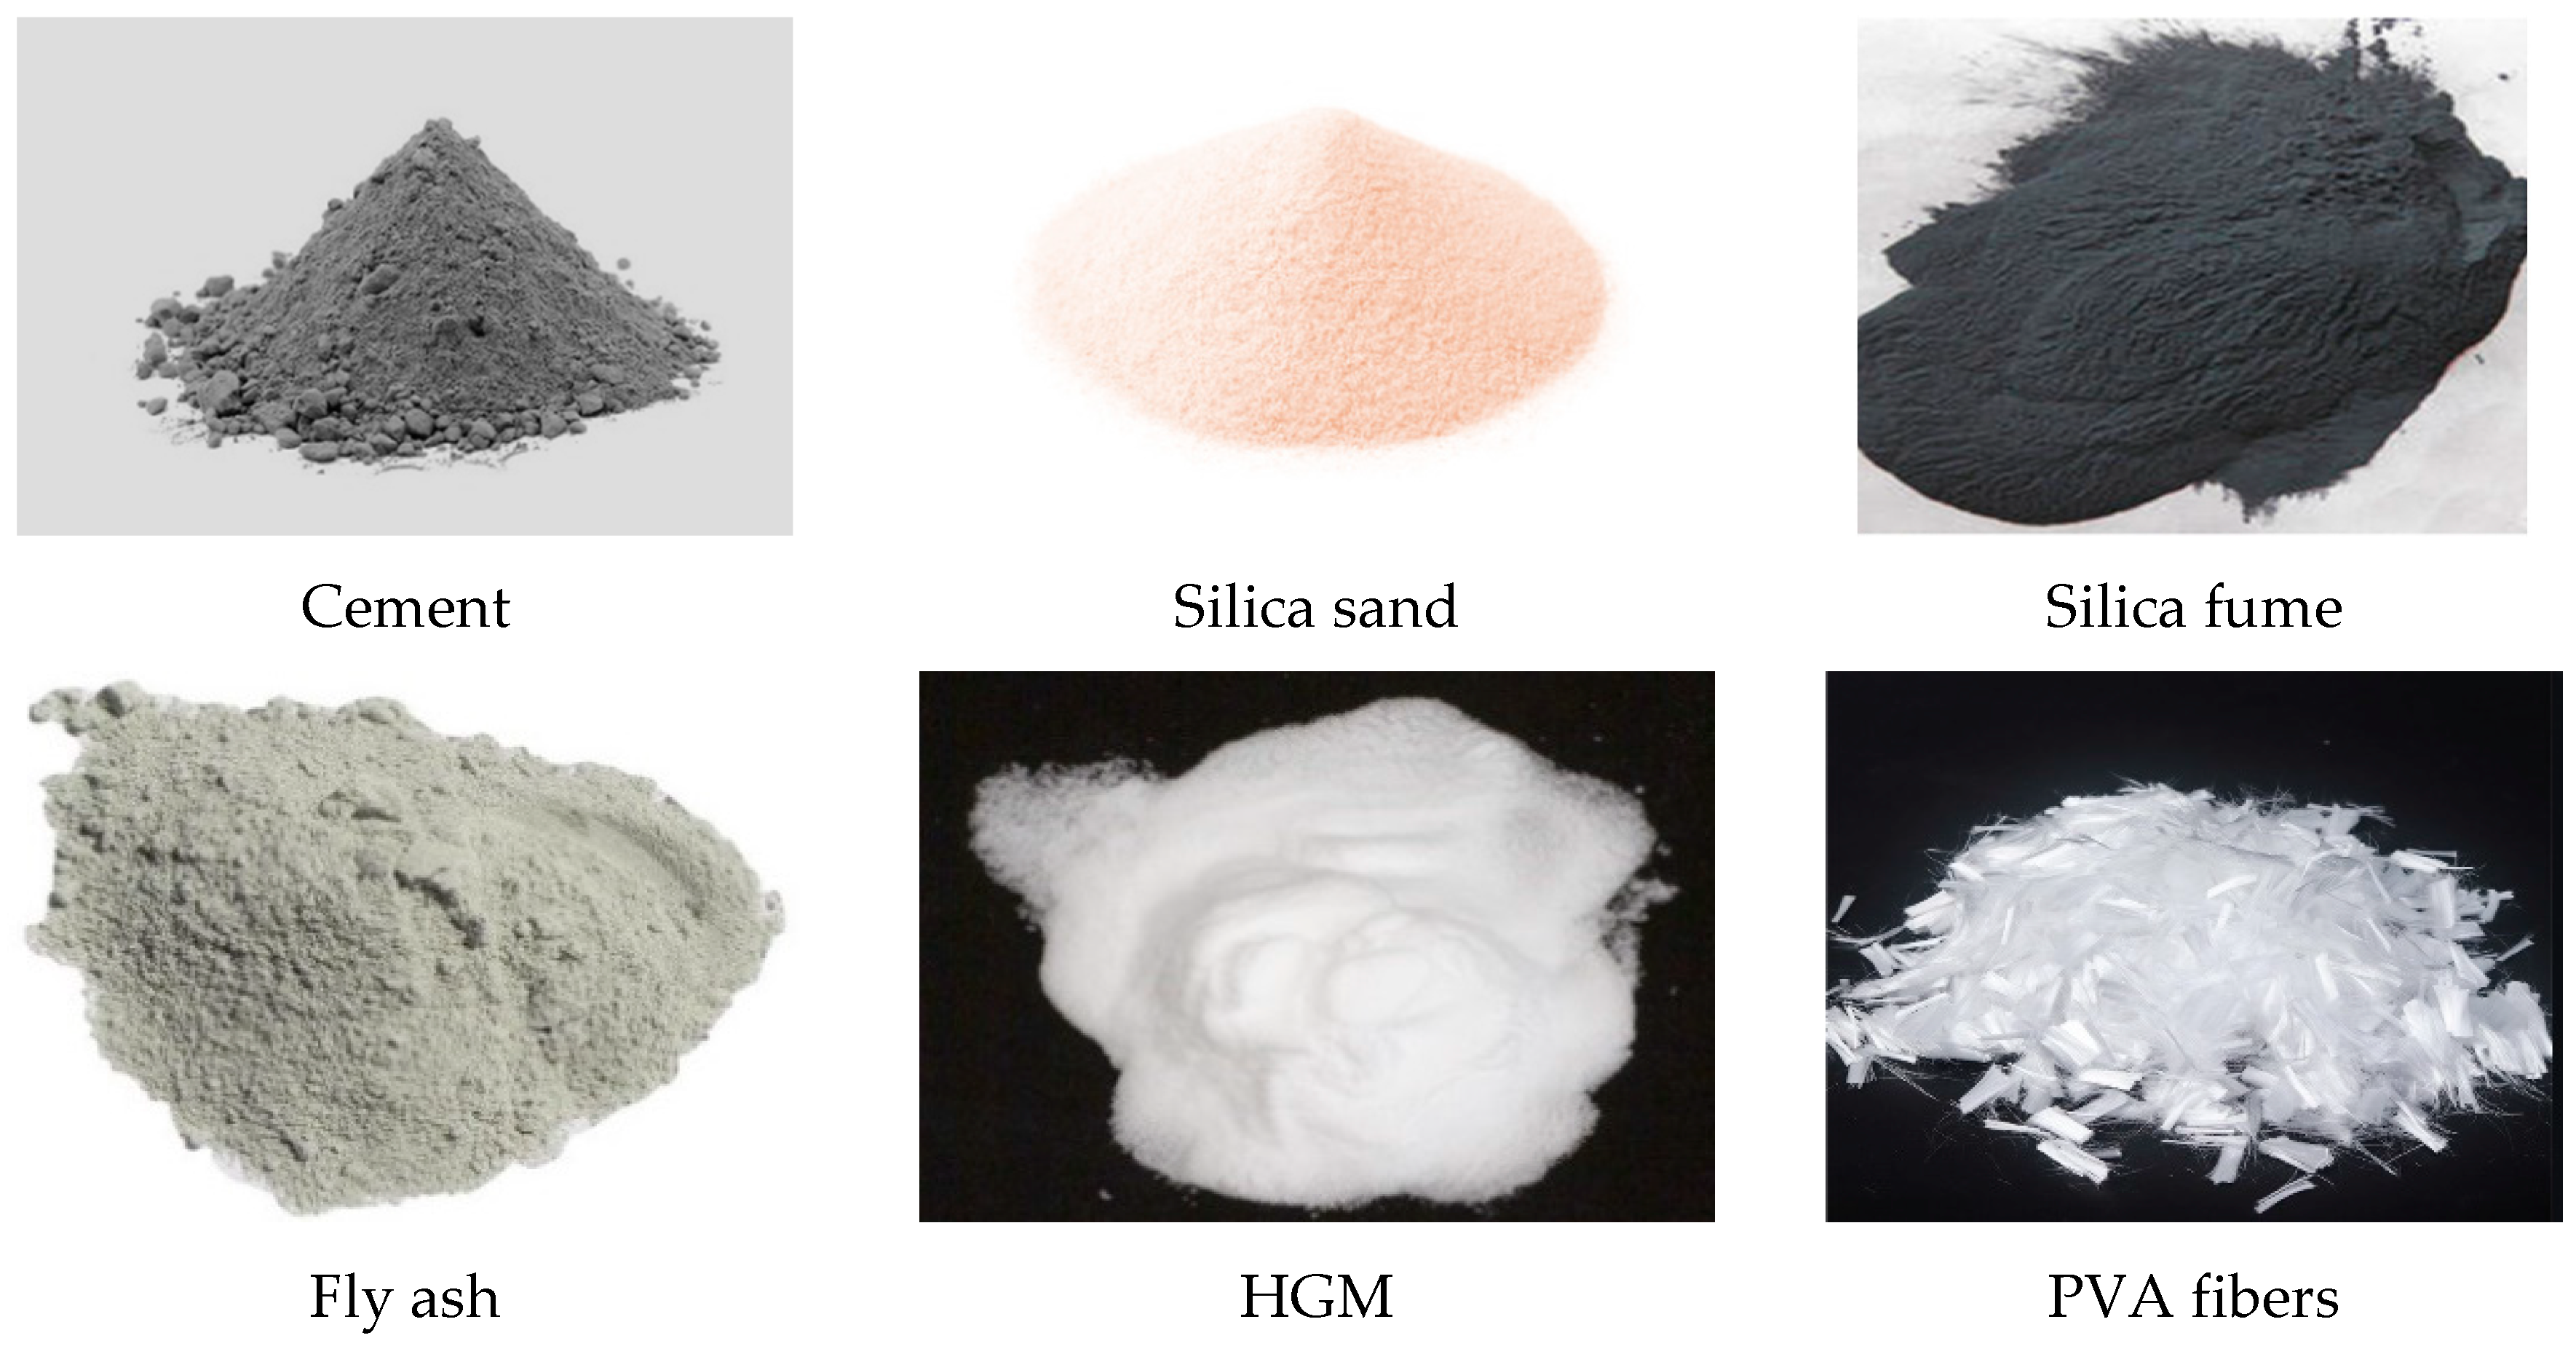
5]. ECC mix design usually involves a small fraction of fibers (less than 2 vol%) to meet comparative mechanical strengths with adequate rheological behaviors. Various types of fibers such as polypropylene (PP), polyethylene (PE), and polyvinyl alcohol (PVA) fibers have been attempted for ECC mix design development. PVA fiber is a common fiber source because of its similar or even higher capability in improving composite properties and better cost-effectiveness vis-à-vis other synthetic fibers [
6].
With the popularity of the concept of sustainable development, engineers have been seeking more sustainable construction materials compared to conventional concretes. Conventional concretes (CCs) provide not only reliable performance over both mechanical strength, durability, and chemical inertness but also more CO
2 emissions either during their service life or cement production. The addition of recycled materials in concrete production has attracted extensive attention over recent years. Hollow glass microspheres (HGMs) as a high-performance, ultra-lightweight and recycled filler can be used to reduce the production cost, enhance mechanical properties, improve composite workability, and minimize the overall cost of construction structures [
7,
8].
Despite ECC’s superiorities over mechanical properties, studies have shown that ECC and LW-ECC experience more shrinkage than conventional concretes [
9]. Drying shrinkage is a time-dependent variable measured as shrinkage strain or volumetric reduction on an unloaded, unrestrained specimen at a constant temperature and is generally encountered in every cementitious material. It is caused by the withdrawal of water from concrete stored in unsaturated air and it is an irreversible deformation [
9]. Drying shrinkage is also always correlated to the strength and serviceability of the concrete structures, as when restrained over time, this non-elastic deformation may displace adjacent structural elements, cause the loss of preliminary tension, and accelerate crack development, thus, leading to serviceability and mechanical problems [
10].
Mechanisms governing shrinkage behavior in ECC differ significantly from that of CC—attributable to the modifications in the composition of the mixture. It is heavily dependent on the type of cement, reinforcement fiber and the mineral and chemical admixtures; however, the influencing factors can be divided into two main categories—intrinsic (characteristics of the composite itself) and extrinsic (properties of the composite’s environment) [
9,
10,
11]. It is known that an increase in aggregate volume, and size significantly reduces the long-term drying shrinkage in ECC, due to the latter’s restraining effects within the mortar. A larger aggregate’s modulus of elasticity provides better compressive restraint resisting shrinkage. Similarly, a greater moist-curing time and lower water-binder ratio reduce the ultimate drying shrinkage of concrete, since it reduces the dry-out rate [
9]. Changes in curing conditions may also induce temperature gradients which influence the drying shrinkage rate, and concrete that is not adequately cured will undergo greater early-day shrinkage.
When subjected to drying, free water held in the largest capillary pores (>50 nm) is most susceptible to loss, followed by the loss of adsorption water from the smaller capillary pores (<50 nm) and later, the gel pores. This evaporation, in particular, can change the orientation and surface energy of the solid phase and induce further shrinkage [
11].
Silica fume (SF), a highly pozzolanic mineral admixture, has been known to have a dominating influence on 28-day shrinkage strain [
12]. The reaction between SF’s active pozzolan constituent, amorphous SiO
2 and Portland cement’s alkali constituents triggers a pore refinement mechanism. As gel pores are emptied at low RH levels, this subsequently reduces the spacing between C-S-H particles and induces further micro-shearing of C-S-H sheets. This contracts the specimen and increases early-age drying shrinkage [
13,
14]. An increase in surface area-to-volume ratio has also been known to increase the drying shrinkage of cementitious members [
15,
16]. Furthermore, polymer-based fibers undisputedly enhance ECC’s strain-hardening characteristics, and control early-age cracking [
17], yet based on fine-aggregate-based ECC studies, there exists no unanimous conclusion regarding fibers controlling shrinkage.
The larger cement-binder content and presence of fine aggregates have demonstrated ECC to possess frequently higher shrinkage strains in comparison to CC. The latter displays an ultimate drying strain of 400–600 µε (under drying conditions of 20o and 50% humidity), at 28d [
9]. Under similar environmental conditions, ECC is more susceptible to shrinkage-induced cracking, assuming no influence from any restraints or external loads. Fine fillers akin to HGMs, introduce voids and demote LW-ECC’s matrix toughness, which is desirable since the energy criterion for characteristic strain-hardening behavior can be met easily [
5,
6]. In addition to deteriorating compressive strength, an increase in HGM concentration may worsen the porosity due to its hollow spherical nature, allowing new spaces for adsorbed water, which may contribute to greater shrinkage strain in the long run [
5].
The following literature explored the drying shrinkage behavior of unloaded fine-aggregate-based ECC. Being a novel area, databases involving both fine-aggregate and lightweight ECC are almost non-existent. In general, codes for lightweight concrete with diverse in requirements, necessitate densities below 1850 kg/m3 to be considered as LW concrete.
Zhang et al. [
18] were able to achieve a low-shrinkage ECC with a strain of 109 µε at 28d, in contrast to their control ECC, which had a strain of 1200 µε. The low-shrinkage ECC used a novel composite cement, while ordinary Portland Cement was used for their control ECC. The new composite only held 33% alkali quicklime (i.e., CaO) per unit weight, in contrast to 66% for CEM I 42.5R Portland cement. The use of low-alkali cement has been known to exhibit lower shrinkage strain [
19] by minimizing the forward extent of the pozzolanic reaction. The rest of the mix material was similar to the present LW-ECC study, in that, silica sand was also used as fine aggregate, and PVA fibers as reinforcement. Uniaxial tensile tests demonstrated increasing tensile load carrying capacity accompanied by multiple cracking; however, a slightly lower tensile strain at 2.61%, compared to the usual 3–7% range for ECC was found.
Yang et al. [
20] studied three admixture effects: expanded admixture (EA), shrinkage-reducing admixture (SRA), and superabsorbent polymer (SAP) on free drying shrinkage in ECCs. The control ECC was similar to the present study and was also composed of cement, fly ash, silica sand as fine aggregate, and superplasticizer. Similarly, PVA fibers were used as reinforcement. The study found that the SRA and EA mixes exhibit the lowest shrinkage strain of 800 µε and 850 µε, respectively, at 28d. This is 45% lower than the control ECC (no admixtures), which achieved a high 1500 µε at 28d. The SRA admixture functions by reducing the capillary tension within the capillary void spaces from the removal of water during ECC’s hardening process. On the other hand, EA composites were able to form ettringite, forcing a volume expansion within the matrix, which offsets the compressive stress following mortar’s contraction, counteracting volume loss, i.e., shrinkage.
Similarly, Mao et al. [
21] were able to investigate fiber content in ECC shrinkage performance. The materials were similar to the present study, except ground Quartz Powder (QP) rather than sand was used as fine aggregates. Partially replacing cement with QP can improve the pore structure and reduce the porosity of ECC. Hence, the inner stresses reduced as the total shrinkage decreased. Shrinkage, maximum crack width and total area of cracks all decreased, compared to the control ECC mix.
This study, therefore, aims to investigate the drying shrinkage behavior of LW-ECC mix designs incorporating various types of HGM. In this study, eight types of HGM with different densities and particle size distribution were incorporated to replace fly ash at 80% and 100% in volume with HGMs. Drying shrinkage was measured from the age of 2 days up to 91 days. The LW-ECC mix design is consistent with those developed by Aslani et al. [
22] and employs consistent specimen preparation and curing conditions; 9 of 17 mixes are classified as lightweight structural concrete according to specifications requiring that their density not exceed 1850 kg/m
3. The remaining eight were classified as ‘ultra LW-ECC’ (ULW-ECC) (densities below 1400 kg/m
3), i.e., they were capable of bearing load; however, they were not suggested as structural concrete. The LW-ECC mixtures in this study exhibited densities ranging from 1600 to 1280 kg/m
3, flexural strengths of 15.4–7.6 MPa, MOE of 25.1–5.8 GPa, and compressive strength of 37.9–7.5 MPa, at 28 days.
3. Results and Discussion
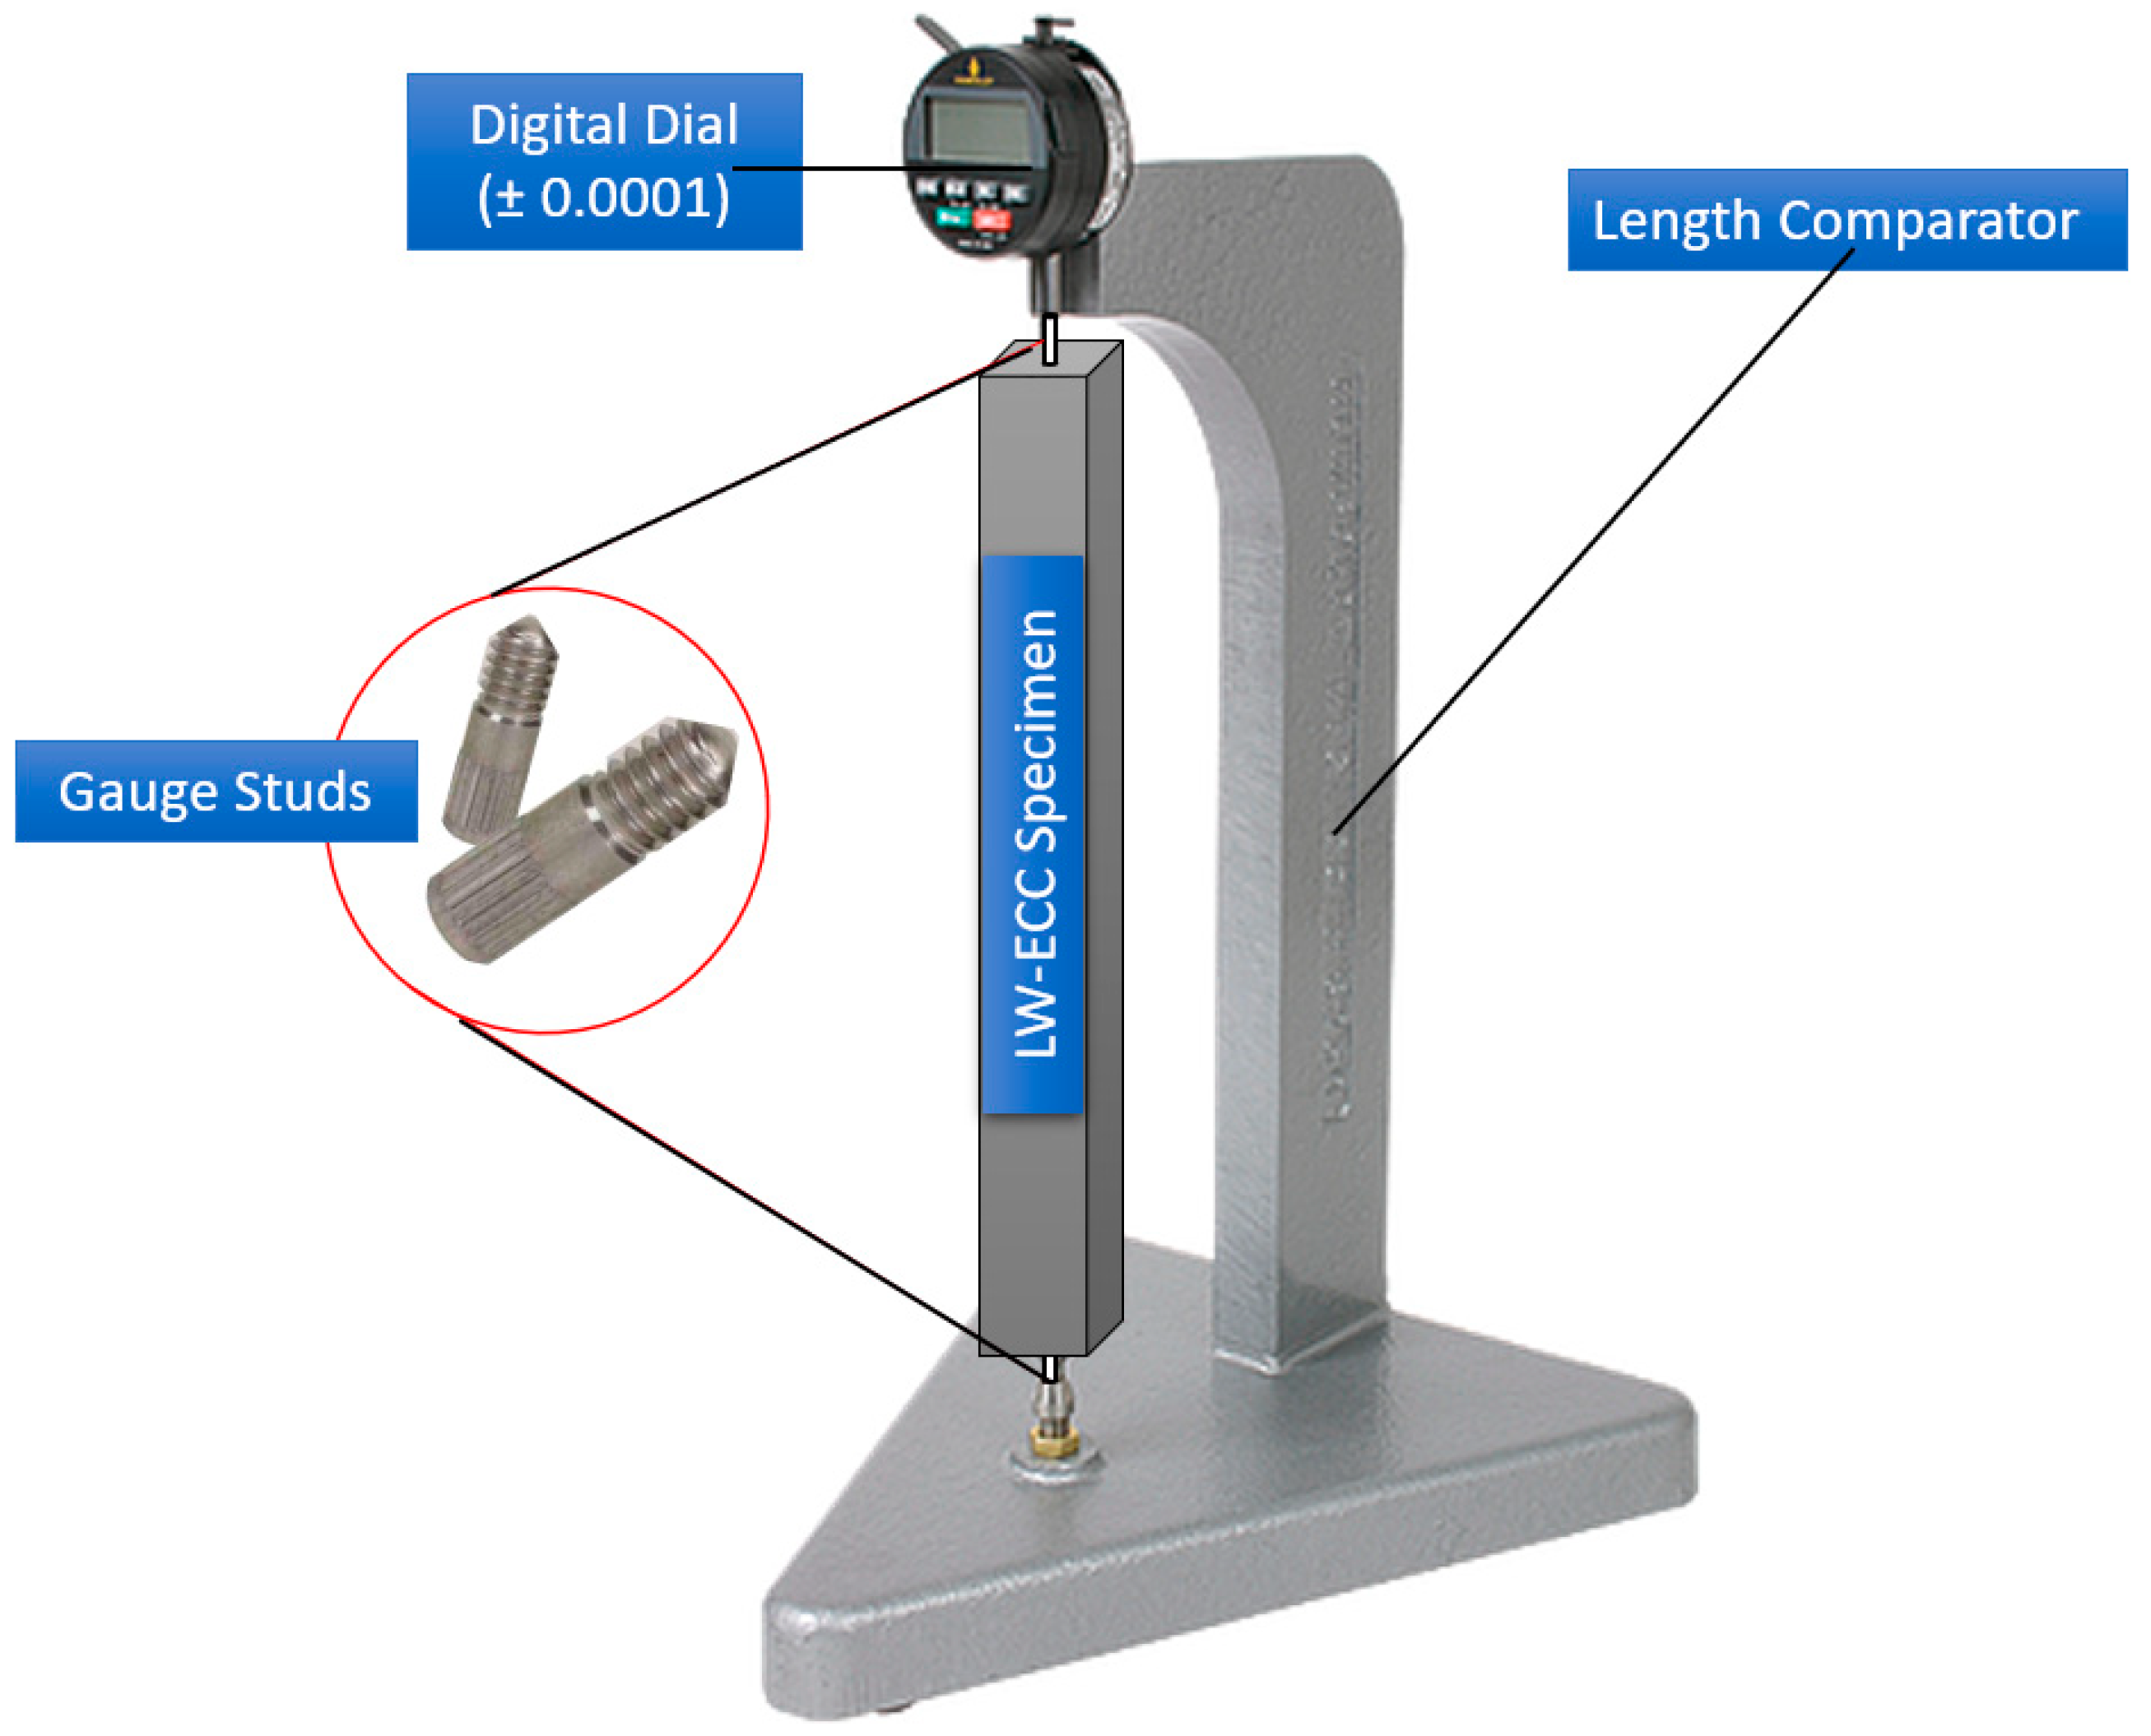
Shrinkage strains of specimens were measured at 2, 3, 7, 14, 21, 28, 35, 42, 49, 56, 63, 70, 77, 84, and 91 days of curing, respectively, (see
Figure 3 and
Table 6). Due to their composition, it must be noted that LW-ECC shrinkage behavior is not just limited to two shrinkage mechanisms, but the most dominant ones during the testing age. Strictly speaking, the measurement of specimens during early ages includes both drying and autogenous or “self-desiccation” shrinkage. This process occurs as water is extracted from capillary pores for the hydration process and is common in early ages. Therefore, in this study, drying shrinkage will be referred to as the sum combination of autogenous and drying shrinkages. Representatives of shrinkage strain are summarised in
Table 6. This study is consistent with Wang et al. [
22] and the mechanical properties of LW-ECC under compression are summarized in
Table 7. More detailed data acquisition can be viewed in the work by Wang et al. [
22].
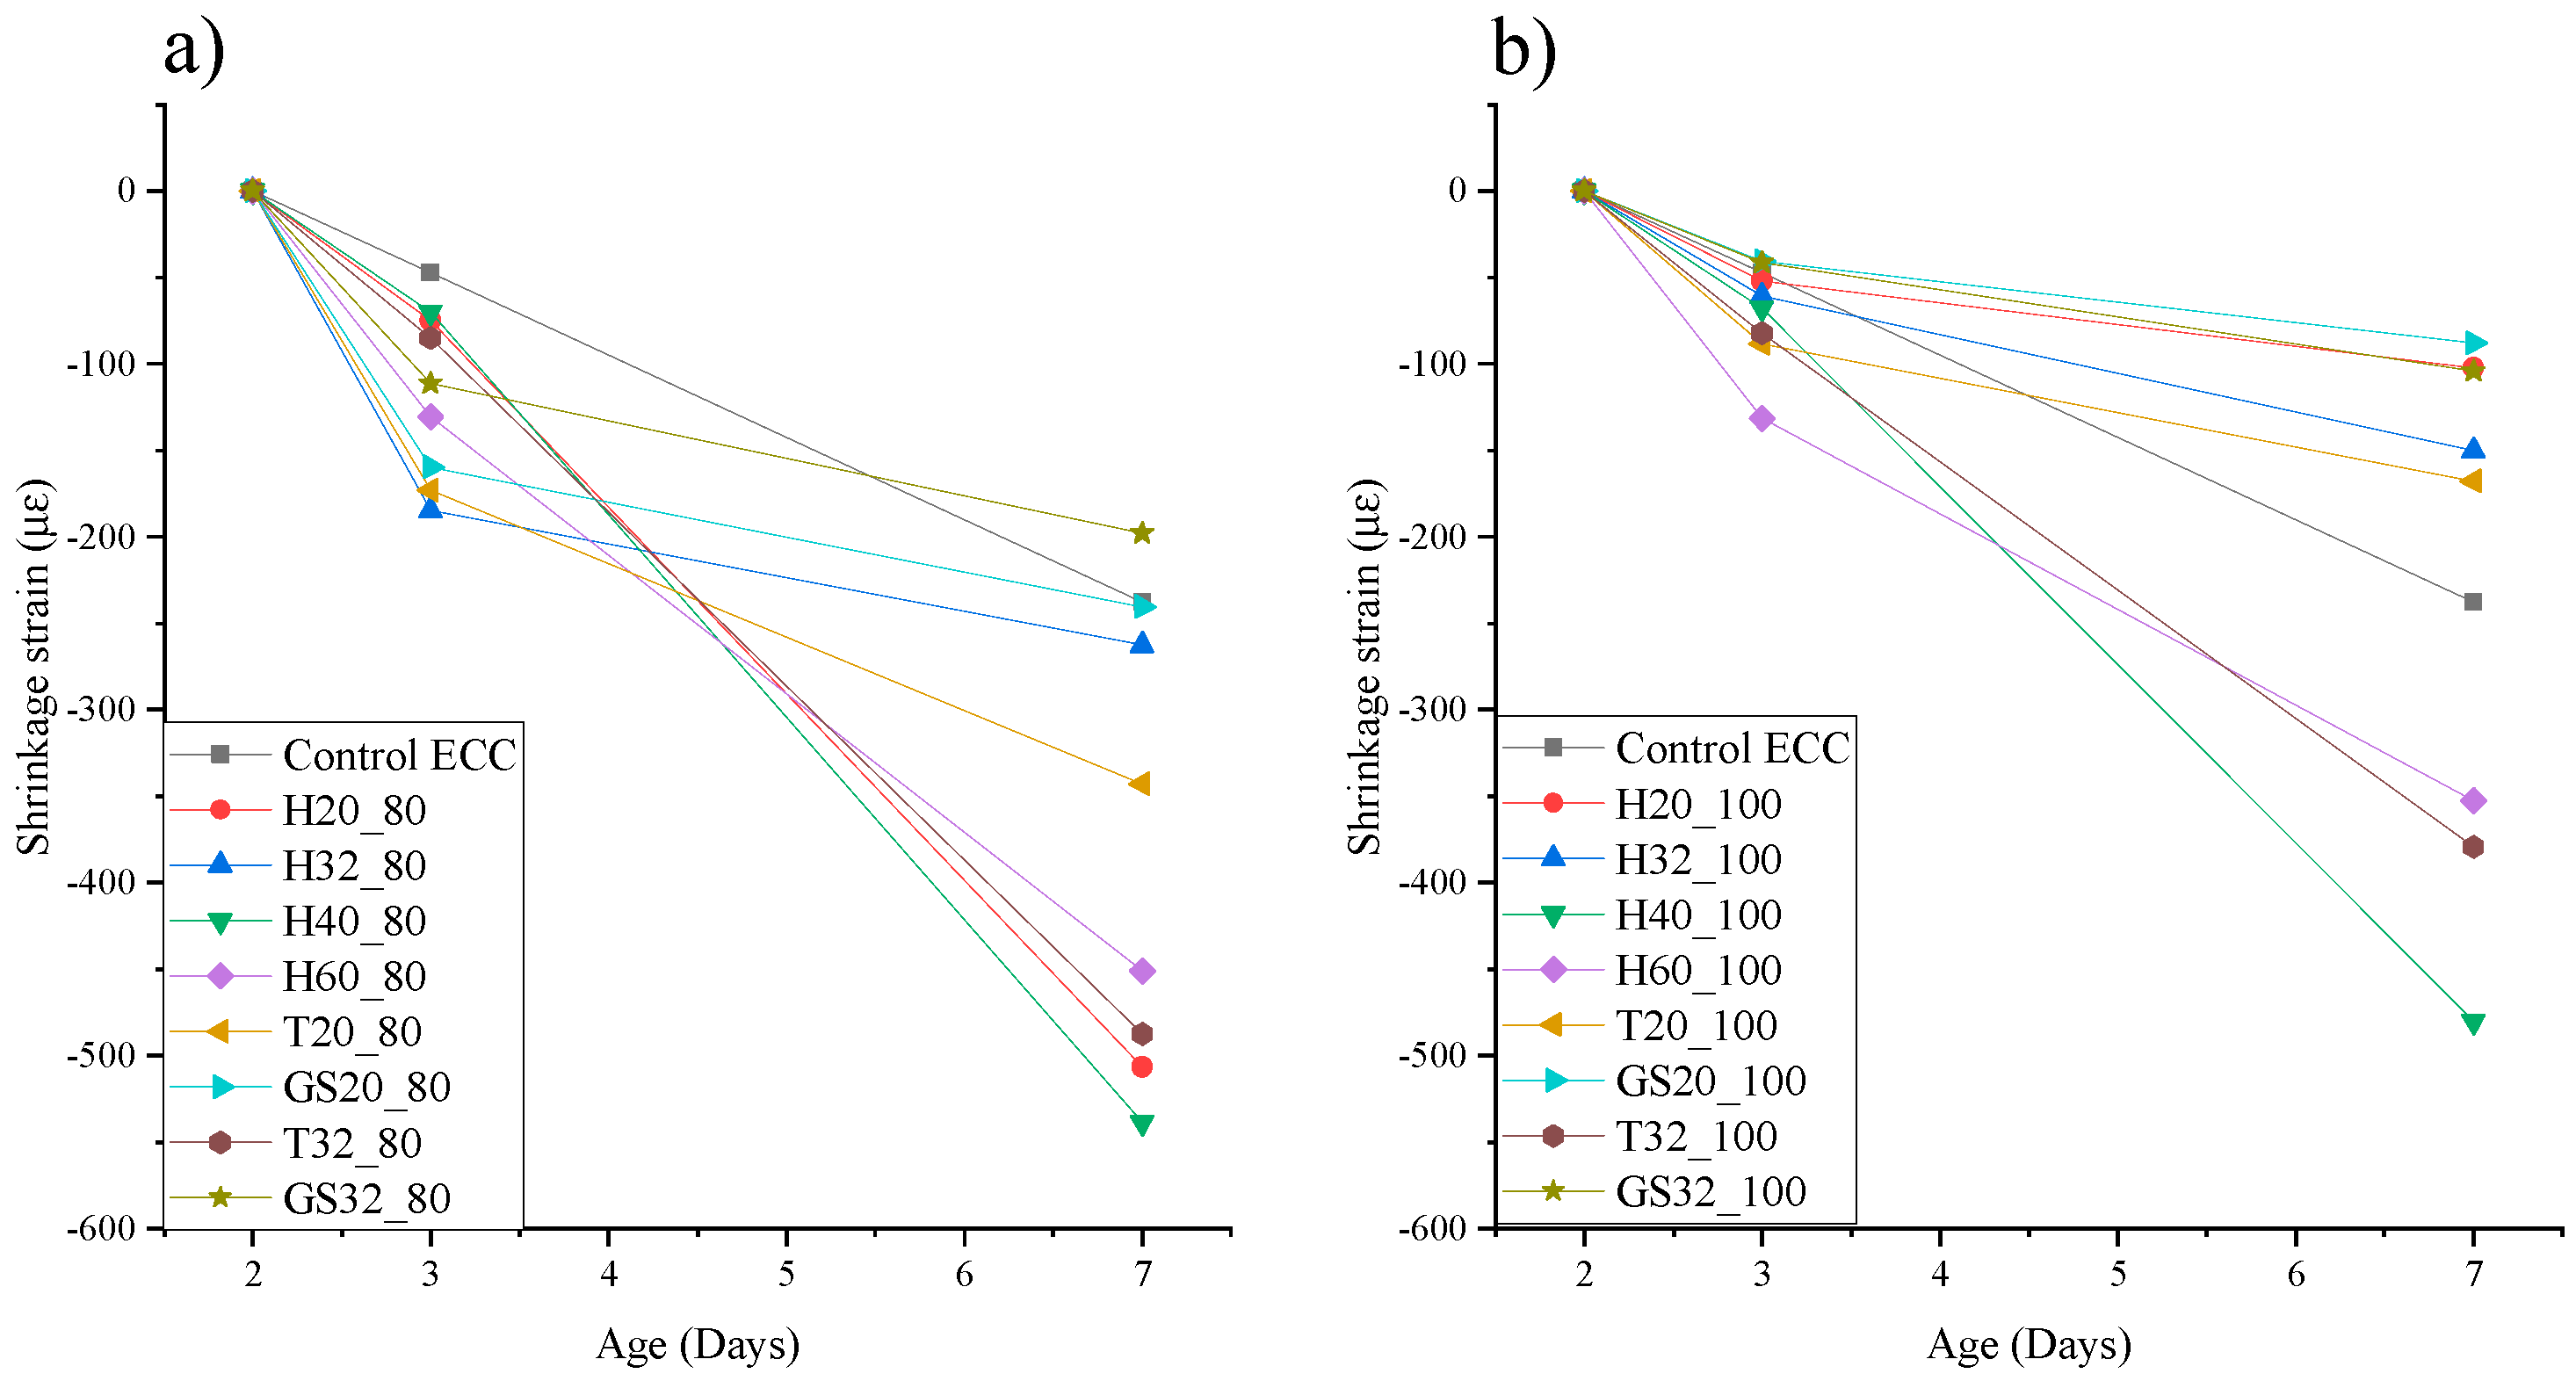
3.1. Shrinkage Behavior from Day 2 to Day 7
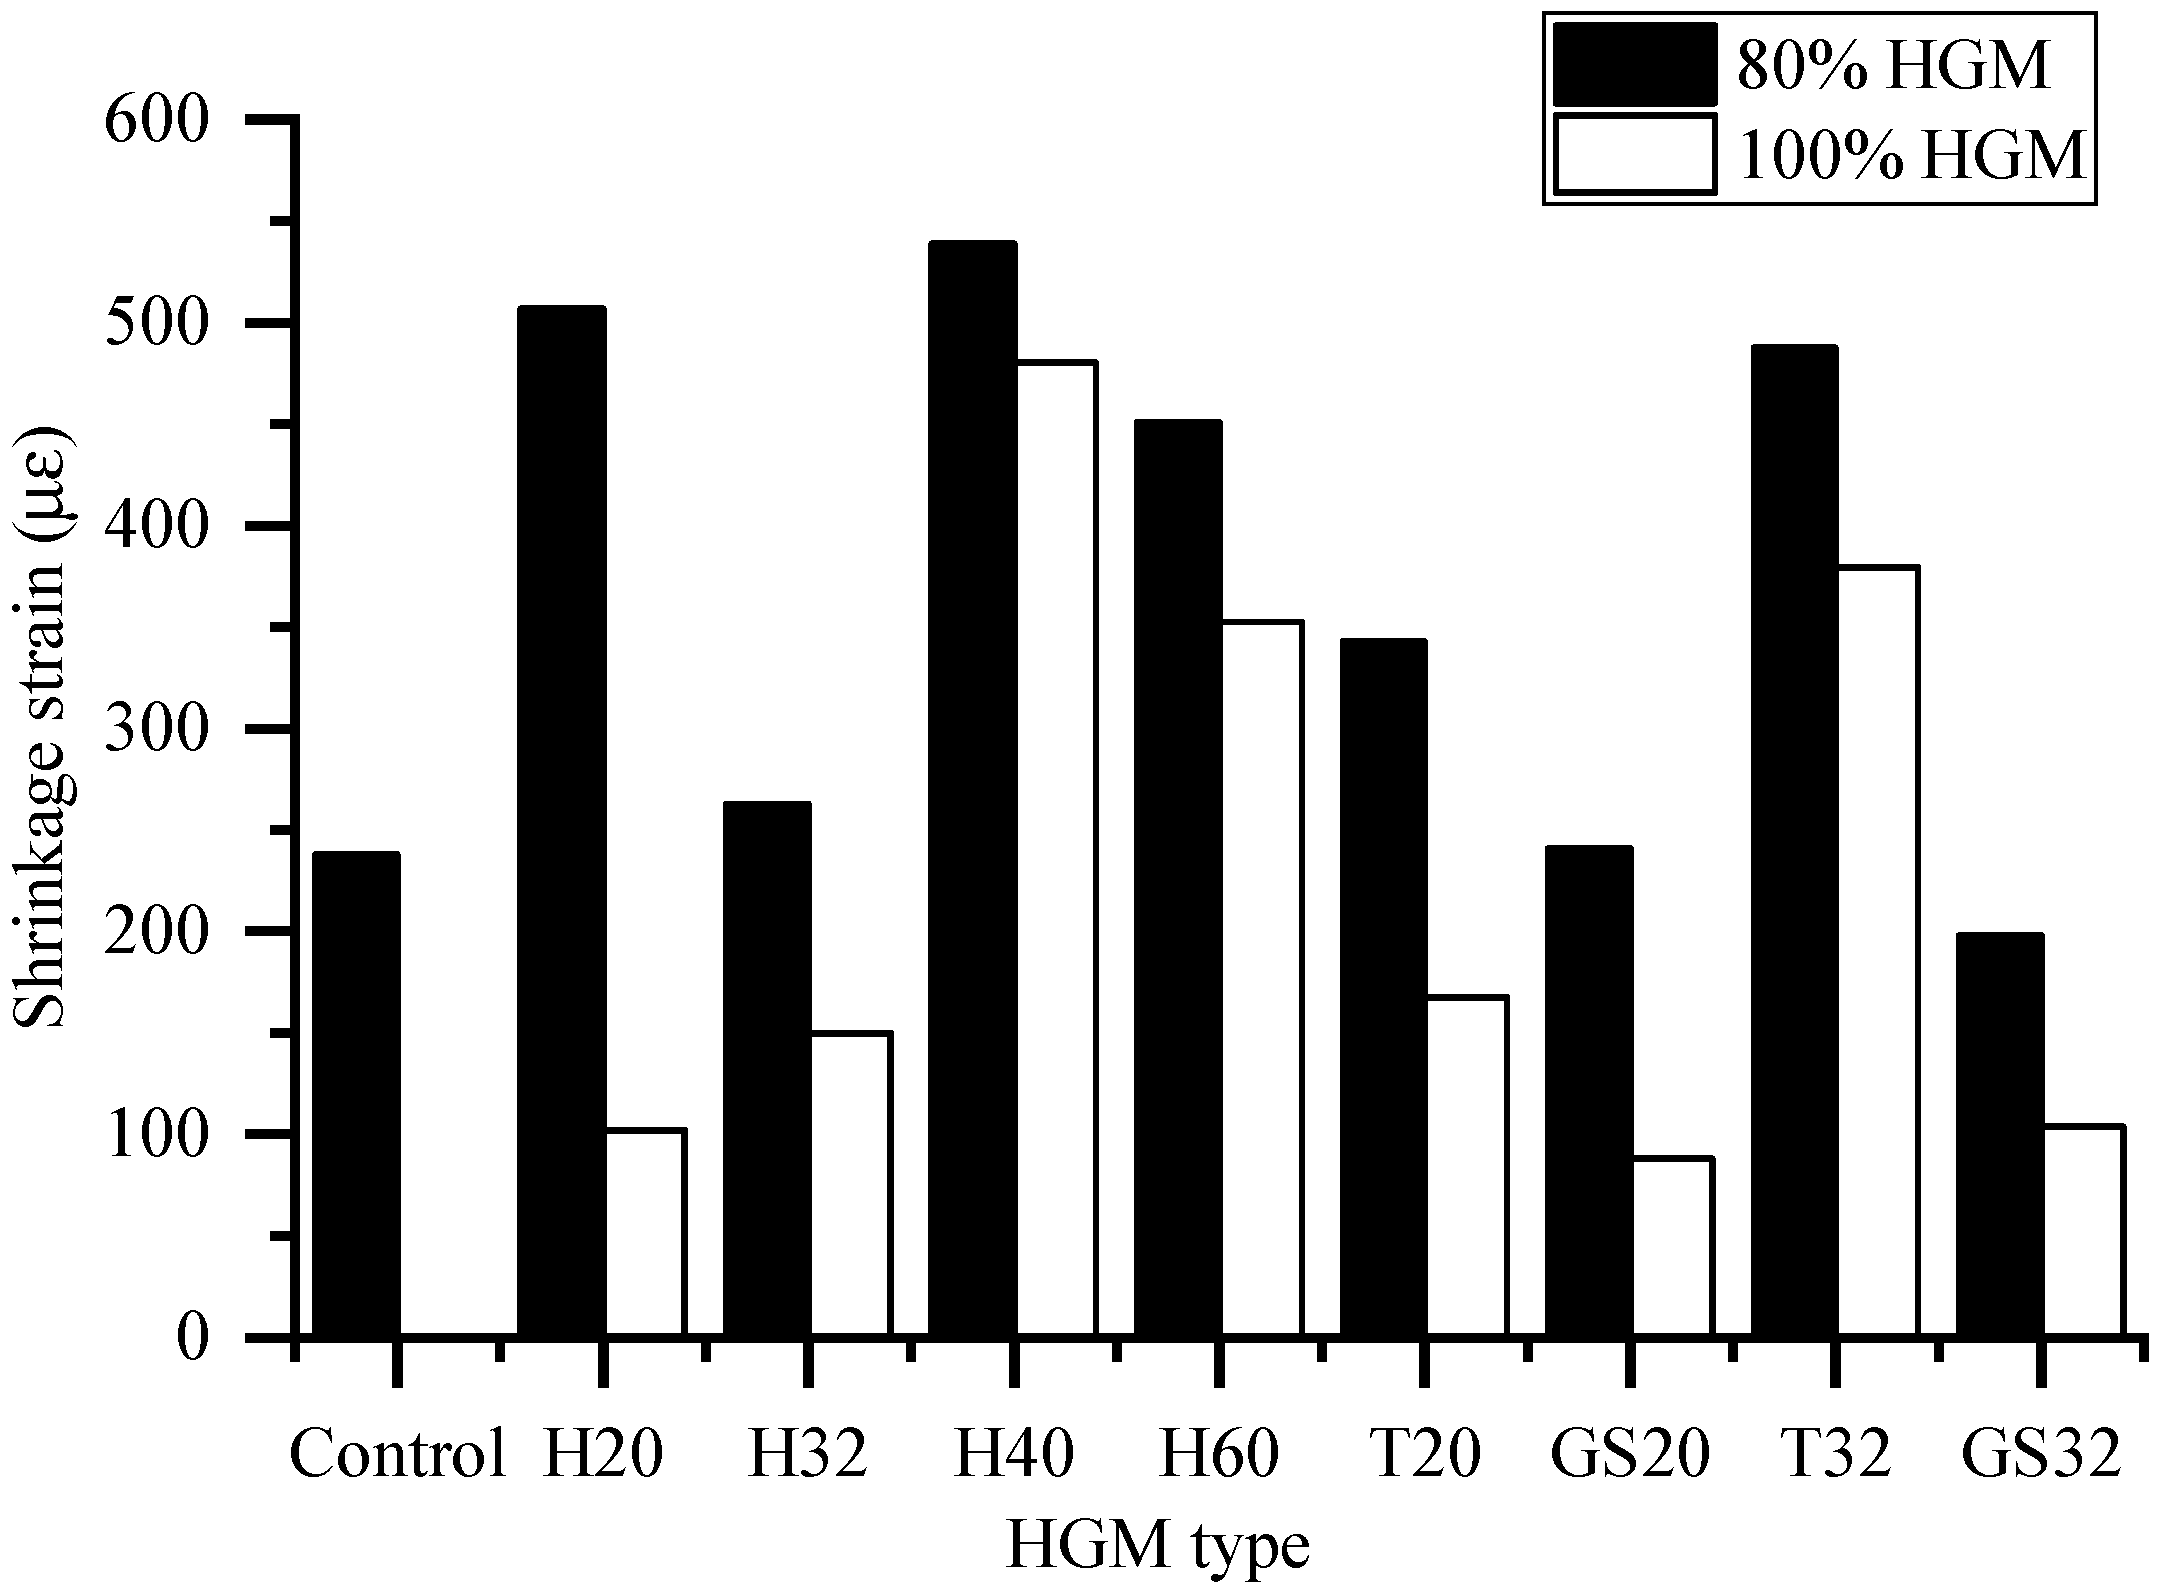
Mixes incorporating 80% HGM generally at 7 days experienced more shrinkage than the control mix and the increase in shrinkage strain varied from 126% (H40) to 1% (GS20) while the mix with GS32 exhibited approximately 17% less than that of the control mix. In contrast, with 100% replacement, mixes incorporating H20, H32, T20, GS20, or GS32 had less shrinkage strain than the control mix and the reduction in strain ranged from 63% (GS20) to 30% (T20). Mixes using H40, H60, and T32 showed higher strains than the control mix at 7 days. In the comparison of 80% and 100% HGM, it can be noticed that mixes with 80% substitution had generally more shrinkage compared to 100% HGM mixes due to a greater rate of shrinkage as shown in
Figure 4. This is complying with the finding from the previous literature that the presence of greater pozzolanic materials can cause undesired early-day deformation.
Pozzolanic reactivity in the early stages is greatly influenced by the specific surface area which is offered by a larger quantity of finer materials. All 80% mixes involve fine SF (comprising 98% SiO
2) and FA (comprising Al
2O
3 and SiO
2) heightening the pozzolanic reactivity alongside alkali quicklime from cement (64% CaO) [
12]. The hydration reaction, albeit at a diminishing rate, still progresses after hardening. When excess water is not available for the unliberated pozzolans for cement hydration, then internal pore water may be demanded. This self-desiccation process is more likely to occur at a lower water-binder ratio (w/b), such as in the case of 80% (0.47), in contrast to the 100% mixes (0.59). The formation of additional cohesive and adhesive solid products resulting from the Ca(OH)
2-SiO
2 reaction can also induce a pore refinement mechanism due to the SF filler effects, inducing greater shrinkage [
12].
The total porosity of a pozzolanic paste is higher than that of the one without (or less) pozzolanic materials. This implies that at early ages, all 80% mixes may have a temporarily larger porosity than the 100% mixes. In one of the earliest shrinkage mechanism theories, Freyssinet used the Kelvin–Laplace equation to propose that the capillary pressure was inversely proportional to pore radii. The equation had the implication that capillary depression is a function of the curvature of the meniscus or the capillary radius. In LWECC, which has a range of pore sizes, as the paste hardens rapidly, the largest pores empty first, accelerating early-day deformation.
At early ages, disjoining pressure arises due to the repulsion between the layers of C-S-H gel by the adsorption of interlayer water. The internal negative capillary under-pressure acts simultaneously with disjoining pressure, contributing to early day shrinkage and the latter is strongly influenced by the particle size. Smaller pores induce a higher capillary under-pressure. Finer cementitious material like SF (50–100 times finer than cement particles) narrows the pore system, implying smaller menisci, thus developing higher pressure values. A greater volume of pore-refining ingredients in 80% HGM, e.g., ultrafine SF and fine HGM, may worsen this scenario, therefore, increasing the strain rate.
The GS20-100% mix showed at 7 days the most desirable shrinkage with 88 μ-strain, even lower than the control-ECC. This was followed by H20-100% and GS32-100%. This shows that the HGMs may hinder the pozzolanic reaction during early ages. The greater the HGM ratio, the slower the early-day shrinkage. As GS-type fillers use a different coating agent and have exhibited lower early-day shrinkages at 7 and 28d (at both 80 and 100% ratios) from the SEM investigations of their microstructure [
22]; it can be implied a different, lesser reactive, chemical reaction occurs for those mixes. H40 revealed the worst shrinkage at both ratios, with 538 and 470 µε, for the 80% and 100% ratios, respectively, (2.3 and 2.0 times larger than control-ECC).
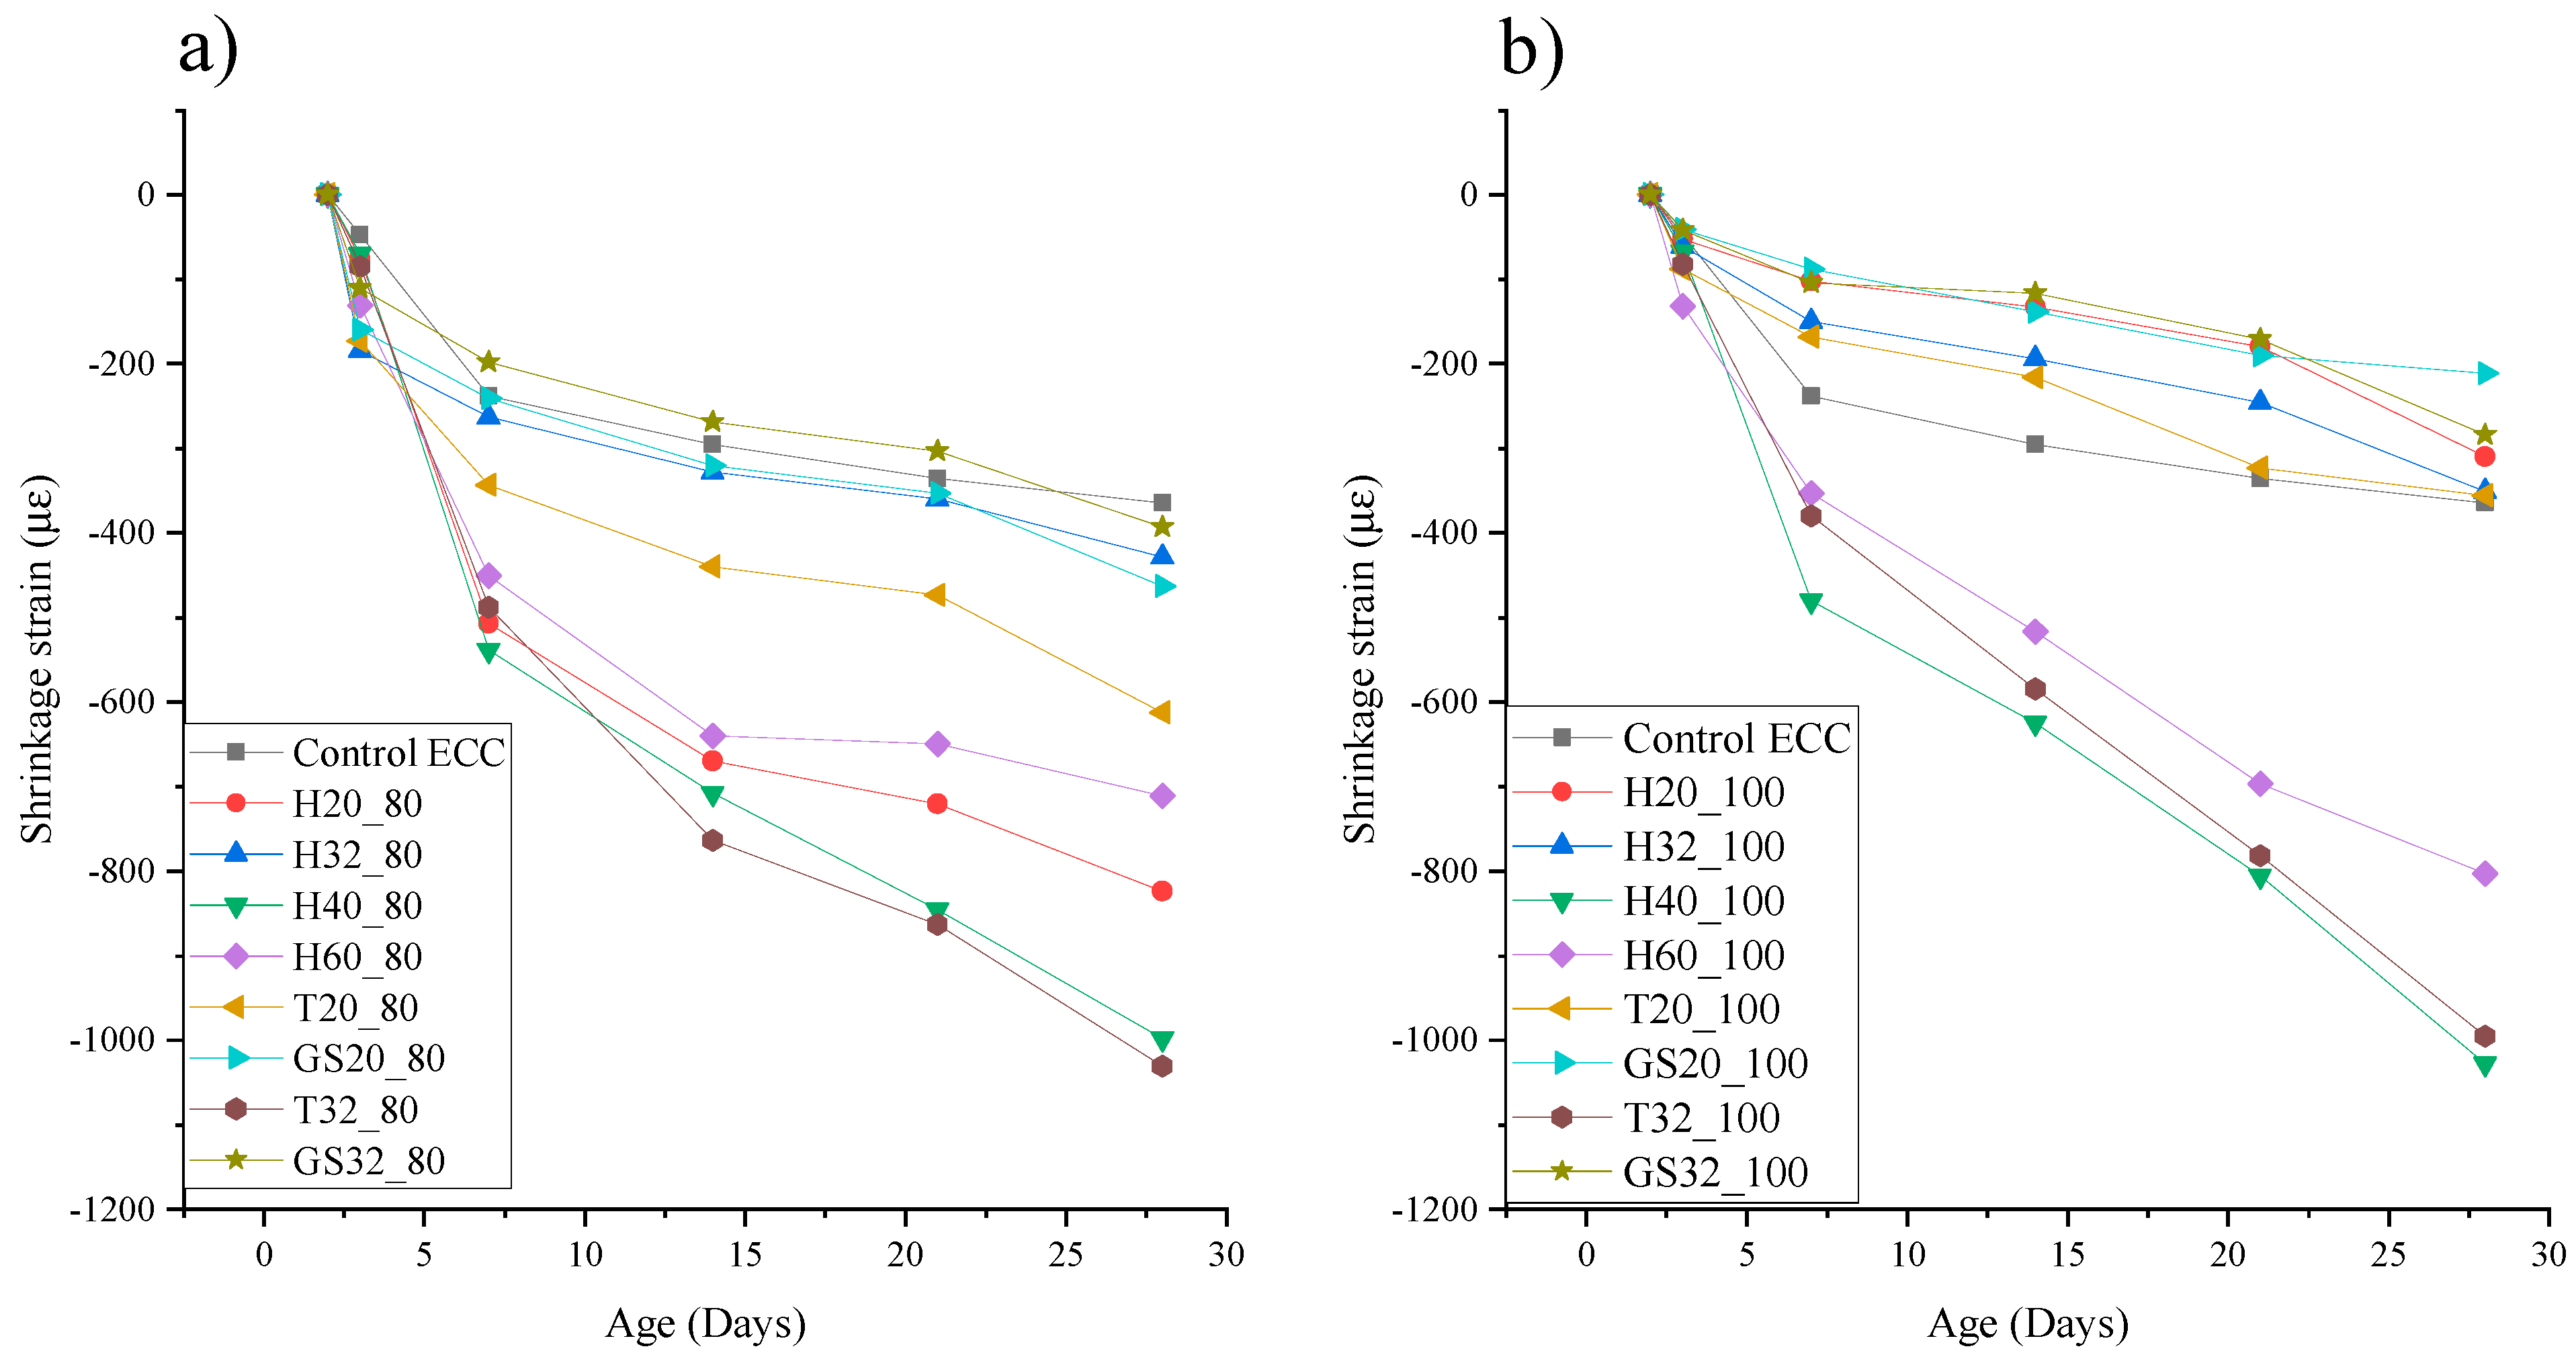
3.2. Shrinkage Behavior at Day 7 to Day 28
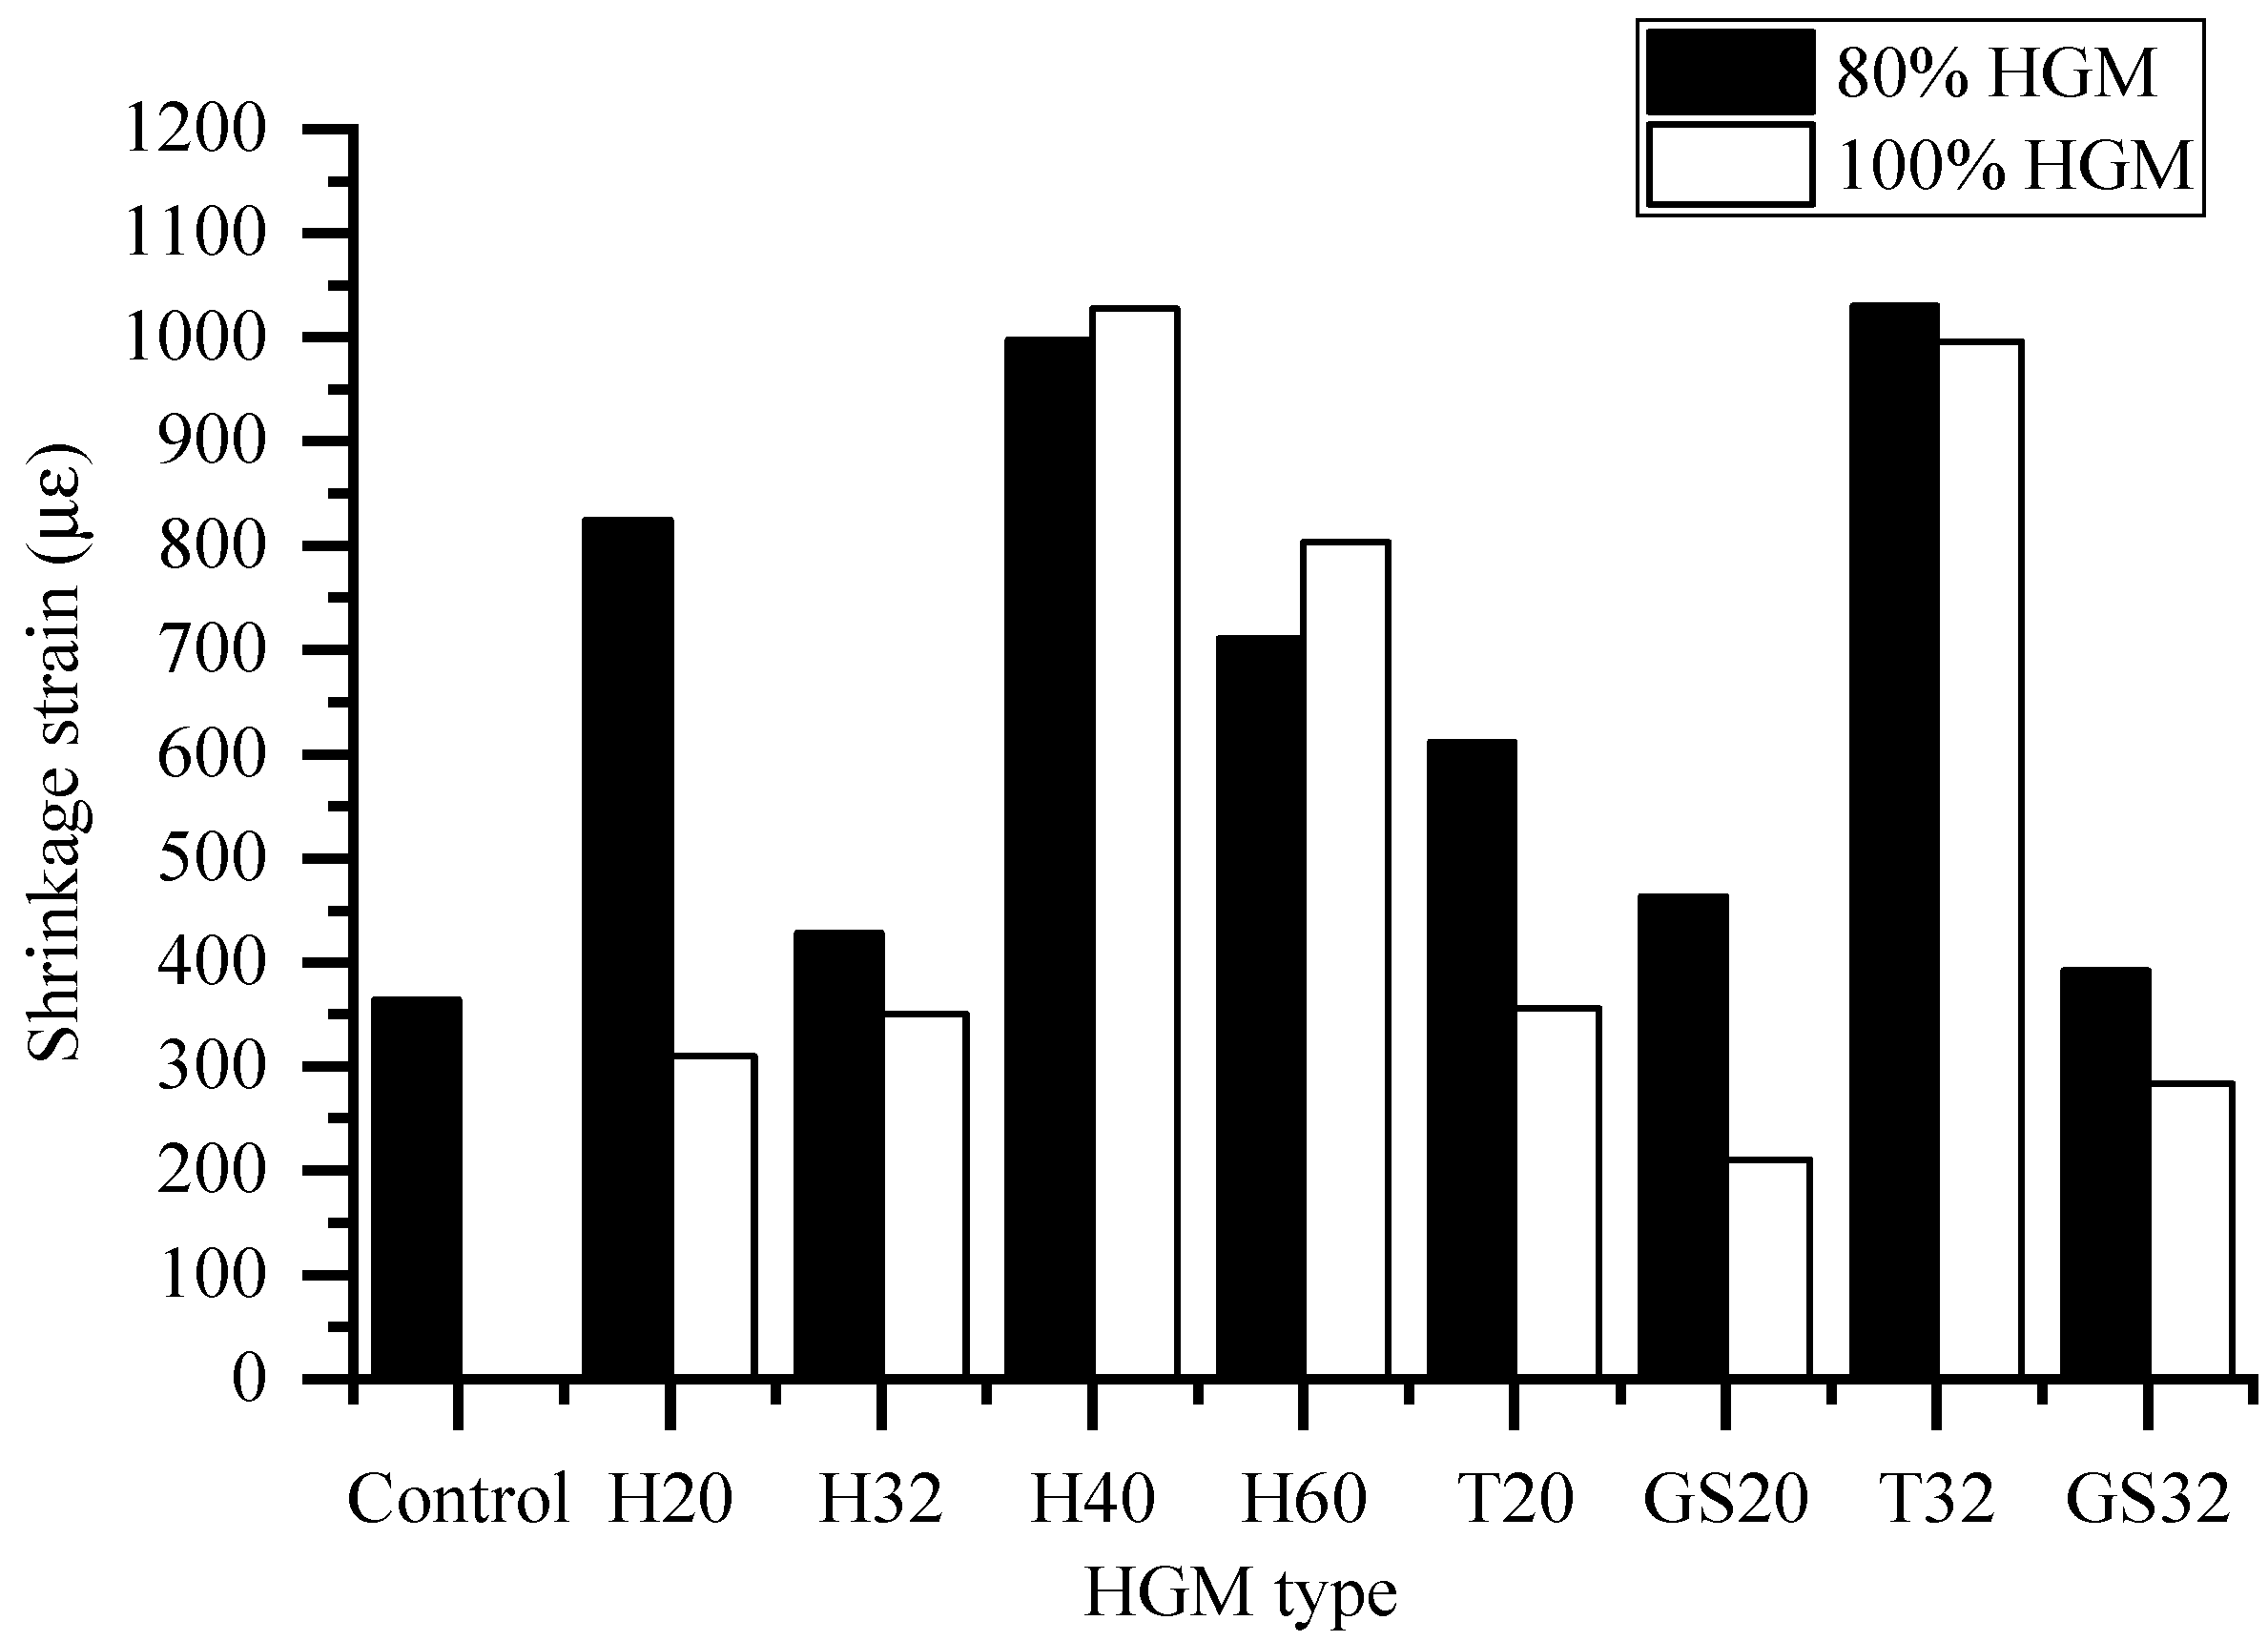
Figure 5 and
Figure 6 represent shrinkage strains measured from day 2 to day 28 and a histogram plot of shrinkage strain measured at 28 days for typicality. Results showed that 28 days signified the end of specimen moist curing, and no unanimous shrinkage relationship amongst 80 and 100% HGM ratios was observed at this age. However, generally, the 80% mixes revealed higher shrinkages attributed to their strong forward extent of the pozzolanic reaction. This is due to the higher reaction (both of pozzolanic, and hydration) within the 80% mixes. Comparing the SEM investigation presented by Wang et al. [
22] of 80 and 100% HGM mixes, under compressive load the lower HGM ratio mixes depicted an even denser and intact microstructure than the full replacement of FA by HGM. In comparison, the former fillers were best able to fill the pores and improve the porosity in terms of their hydration products. The new products included the formation of new C-S-H layers which can reshape the former inter-crystallite pores. This process subsequently decreases the proportion of larger pores. Also, the nano-crystalline structure was generally more ordered in the 80% mixes as opposed to the crumbling structure observed for the 100% mixes [
22]. This may imply that the degree of chemical hydration at this age had been more intense for the 80% and formed more hydrated products to fill pores, resulting in a denser microstructure for those mixes.
The two exceptions were strong fillers: H40 and H60, where the 80% mixes exhibited similar behavior, yet lower strains than the corresponding 100% mixes. Both aforementioned fillers possessed the highest crush strengths: (28 and 55 MPa, respectively), implying they do not easily fracture and scatter themselves between voids [
5,
22]. Hence, the larger proportion of unfractured HGMs remaining intact and hindering moisture withdrawal may be greater in the case of strong fillers. At an optimal replacement ratio, the stronger-shelled HGM types may be able to offer a better compressive restraint, slowing the shrinkage rate in LWECC.
The difference between the three fillers: H, GS and T is simply their applied coating. Negligible calcium content on the HGM-cementitious matrix interface for those mixes showed that, in general, HGM’s contribution to hydration reaction was insignificant [
22]. The strains for the weakest HGM fillers are more sensitive to the HGM replacement ratio, i.e., 80% in contrast to 100%. This can be shown by a larger disparity in the strain magnitudes for H20, T20, and GS20 mixes (between 80 and 100% HGM), whereas similar strain deformations for the stronger HGMs (fillers H60 and H40). Dispersive XRS analysis of HGMs in LW-ECC under failure showed their surface is comprised mainly of silica and oxygen. The denser smaller-sized particles are also less reactive than the HGMs with a larger specific area. We observed some 80% mixes (fillers H60 and H40), even with the presence of both pozzolanic sources, e.g., FA and SF, these smaller-sized HGMs are not influenced by the pozzolan reaction to a great extent.
It was noted both GS fillers at 28 days exhibited considerably lower shrinkages, compared to H and T types. In terms of desirable shrinkages, at an 80% HGM ratio, GS32 exhibited 392 µε (8% larger than control-ECC) and at a 100% ratio, Type GS-20 exhibited 210 µε (42% lower than control-ECC). T32 filler revealed the worst shrinkage for both HGM ratios with 1030 and 995 µε for the 80% and 100% ratios, respectively, (2.8 and 2.7 times larger than control-ECC).
After 7 days, H40, H60 and T32, in particular, offer highly undesirable shrinkage development rates for both HGM ratios. However, H60 (80% HGM) displayed the lowest shrinkage at 91 days. The significant increase in shrinkage development rate immediately after 28 days is evidence that a longer curing time may decelerate LW-ECC’s shrinkage. A more humid environment gives rise to a positive moisture differential, slowing the dry-out rate within the larger pores. Note, all 100% mixes except T32, H40 and H60, exhibited similar 28 days deformation to normal-weight concrete, which has a magnitude of 400–600 µε, under similar testing conditions.
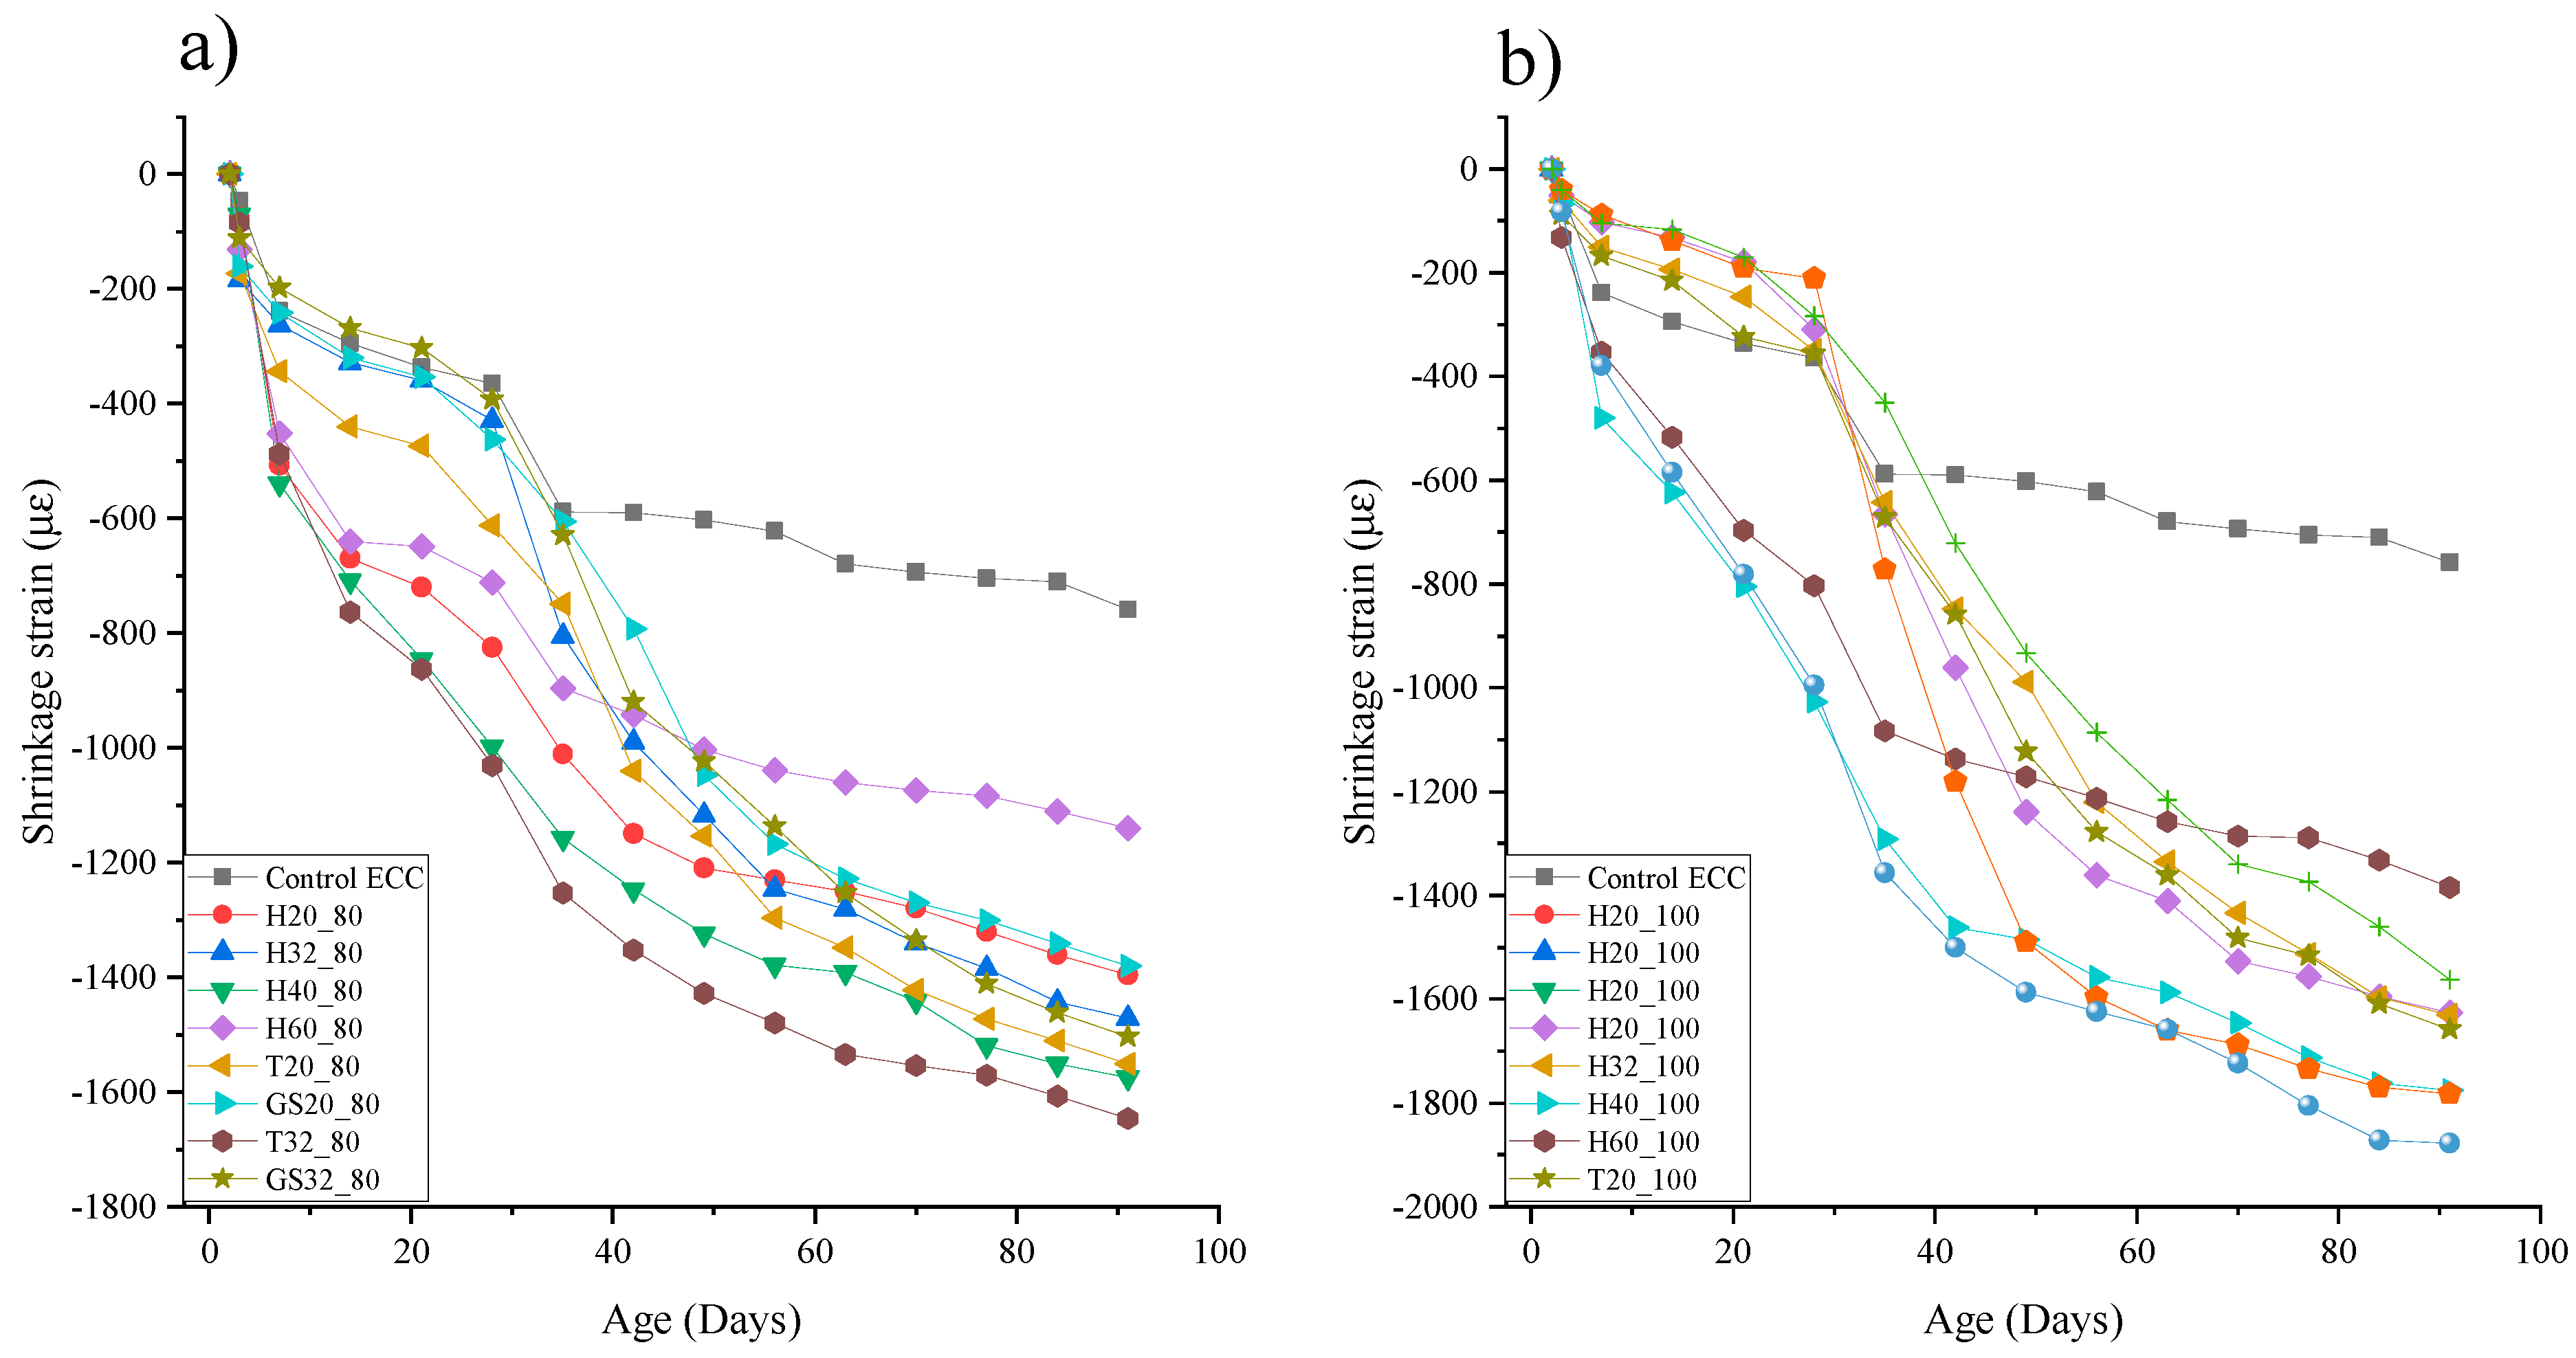
3.3. Shrinkage Behavior from Day 28 to Day 91
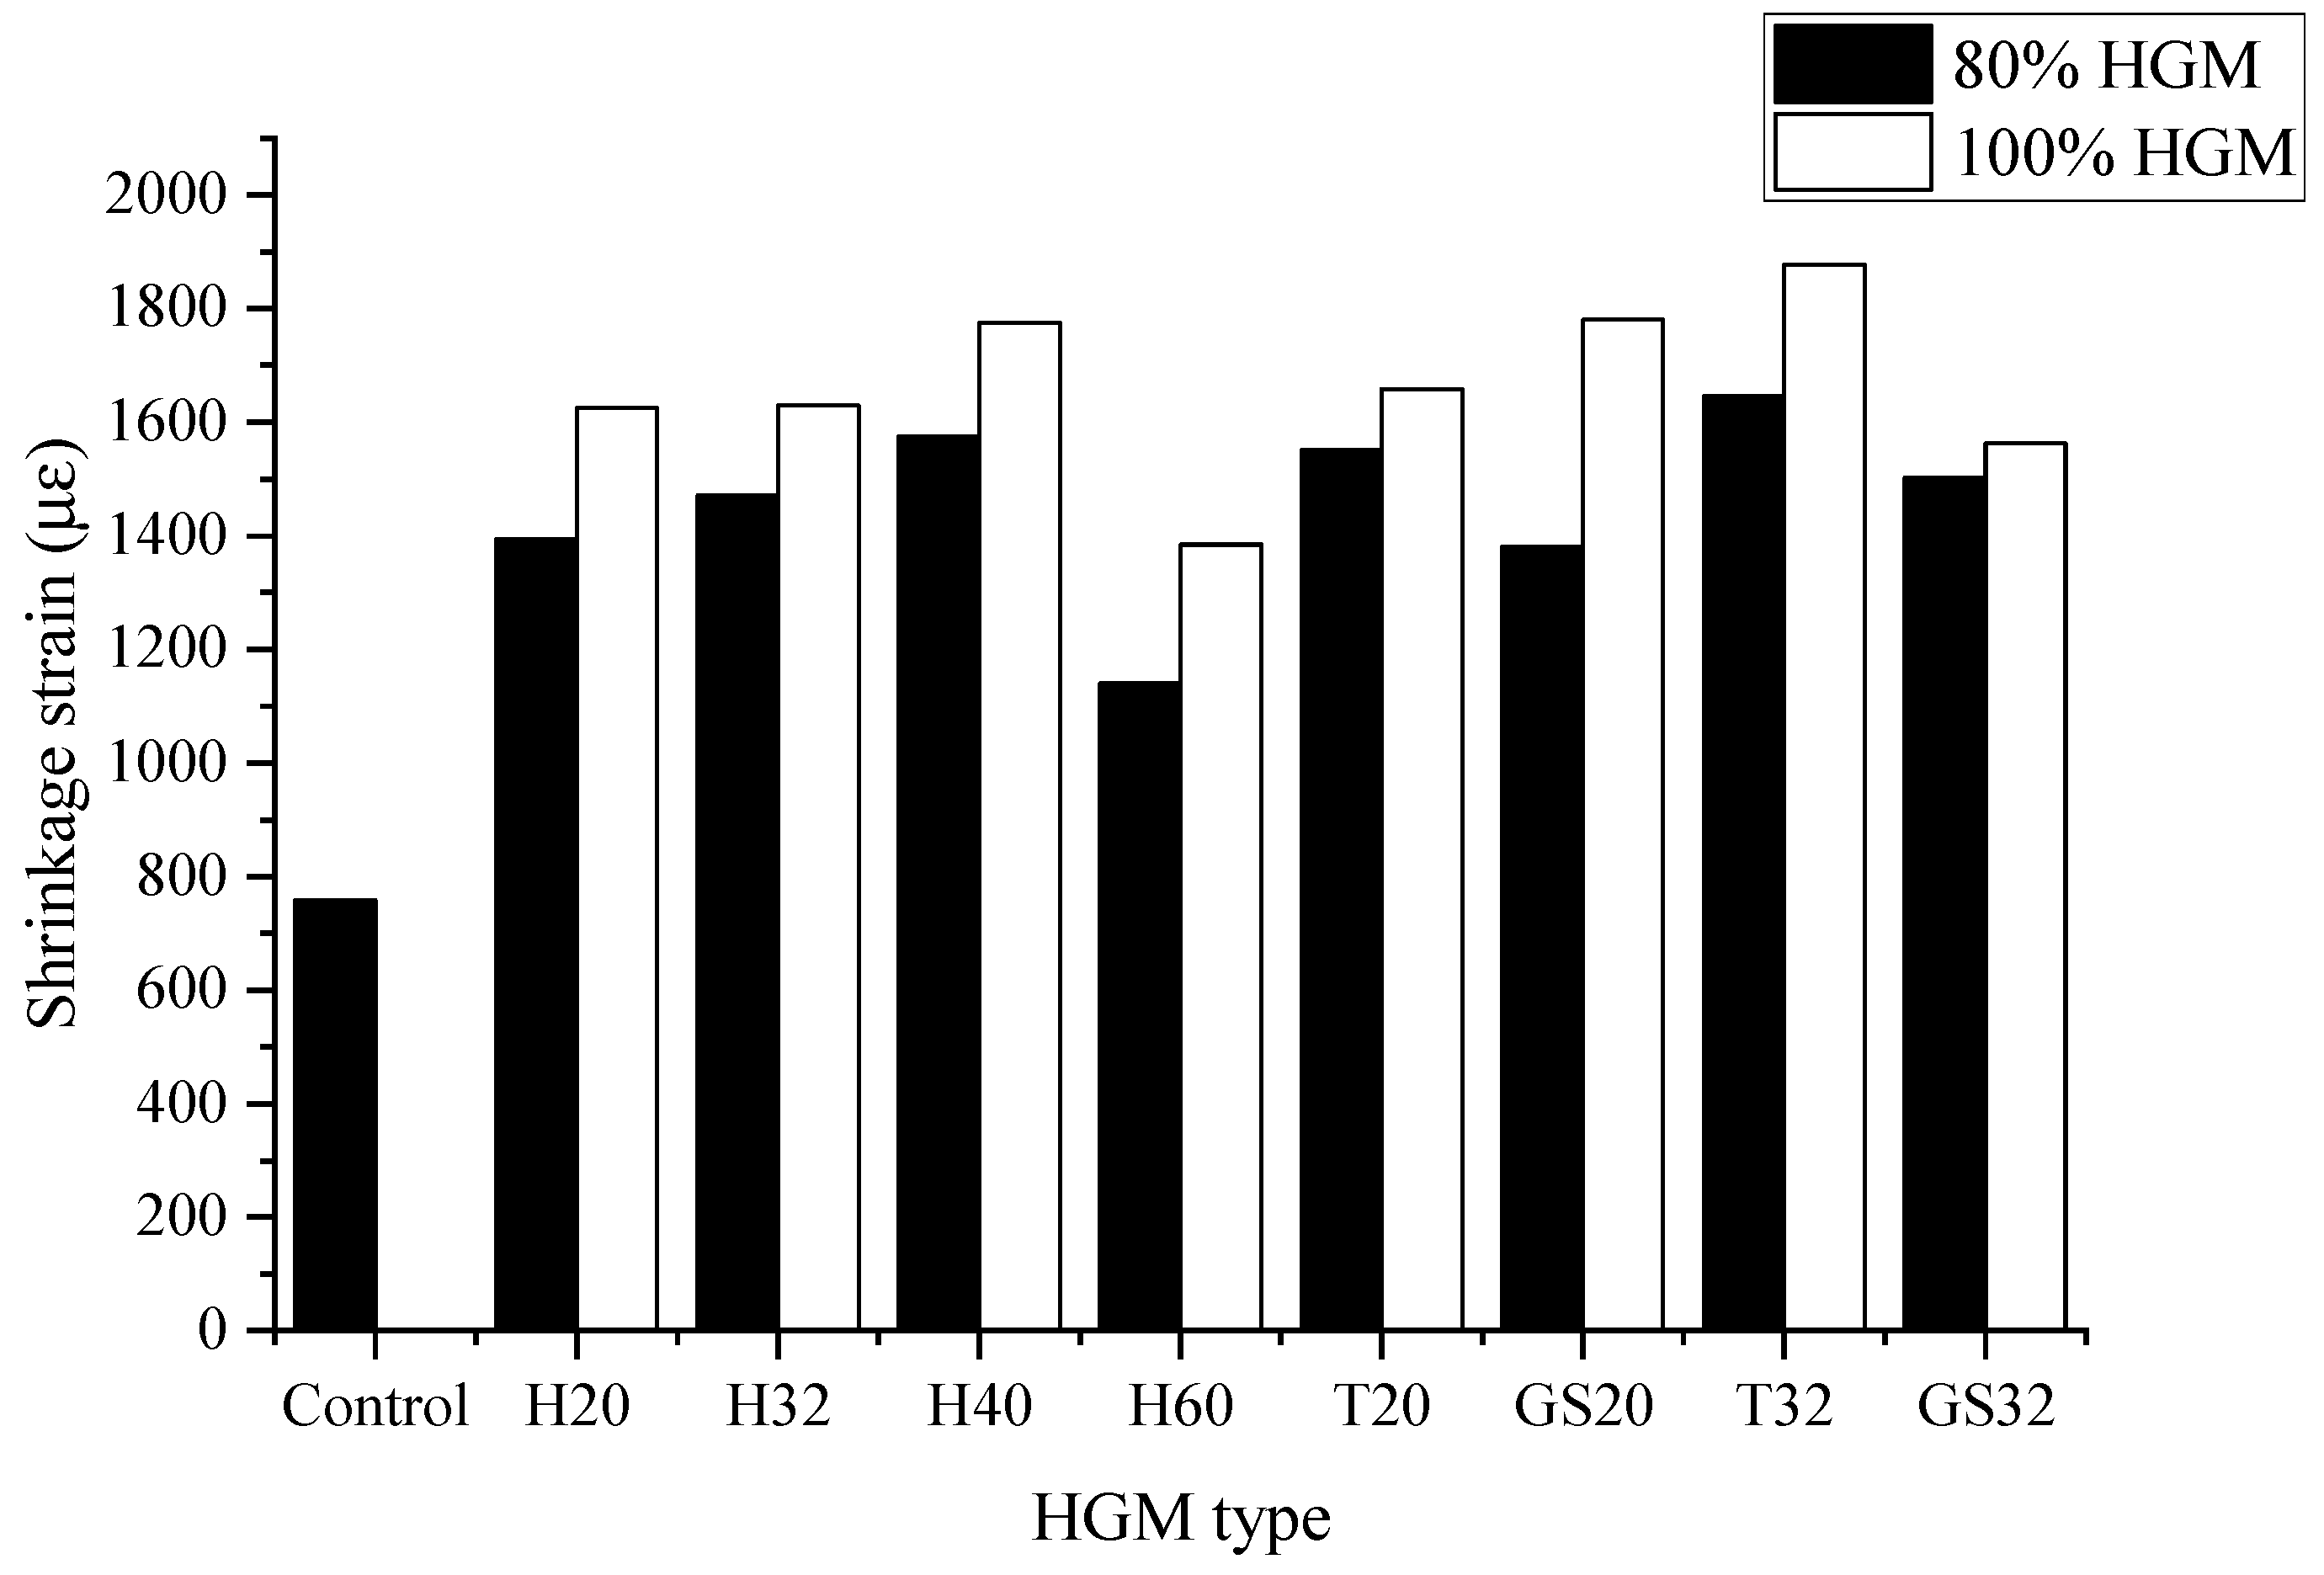
Measured drying shrinkage up to 91 days of LW-ECC in terms of strain-time diagrams of 80% and 100% HGM mixes is shown in
Figure 7; strain magnitudes of both series are presented in
Figure 8. Since PVA fibers are hydrophilic (strong affinity for water molecules) themselves, the synergic hydrophilic effects due to HGM and PVA fibers are greater in the LW-ECC. The absence of any hydrophilic HGMs and a lower effective w/b ratio meant that the control-ECC possessed the lowest ultimate shrinkage as expected, at 758 µε. The effective w/b ratios for the three series of mixes are 0.27, 0.47, and 0.59 for the control mix, 80% HGM and 100% HGM mixes, respectively.
Likewise referring to
Figure 7, all LWECC (comprising HGMs) showed higher shrinkage than control-ECC. Of all the LWECC, HGM-type H60 shows the most desirable shrinkage with 1140 and 1385 µε, for the 80% and 100% HGM ratios, respectively, (1.5 and 1.8 times larger than control-ECC). These results conform to the findings found in the literature [
12] where the increase in fine aggregate content reveals a direct relationship with the ultimate drying shrinkage strain. The behavior can be explained by the restraining effects imparted by the coarse aggregates. The higher stiffness offered due to their volume content and density means they are more difficult to compress, mitigating drying shrinkage.
The increased substitution of HGMs (from 80% to 100% replacement) signified a larger effective w/b ratio. One mechanism can be explained using HGMs hydrophilic behavior. Although HGMs are inert, their hydrophilicity can contribute to greater water retention, post-hydration. In the long run, as this water held by hydrostatic tension exits the small capillary pores in unsaturated air, this can expose a greater void space. This mechanism can induce a greater magnitude ultimate shrinkage strain, hence greater ultimate strain was noted for all 100% mixes, as tabulated by
Figure 8.
Immediately after 28 days, all curves exhibit a sharp increase in shrinkage development rate. The change in curing conditions (wind, relative humidity and temperature) to a more exposed environment induced changes such as a temperature gradient between the interior and the outer surfaces. The rapid drying of the exposed surfaces leads to a risk of increased drying shrinkage. The most susceptible to external dissipation is free water. If not adequately cured, the loss of water may result in plastic shrinkage in the early stages, and later drying shrinkage [
28]. From the viewpoint of shrinkage development rate (from gradients of the
Figure 7 curves), all the mixes displayed similar deformation rates with the exception of H60. After 28d, H60 (for both ratios) displayed notably lower rates of drying shrinkage. Twenty-eight-day SEM results from Wang et al. [
22] had previously revealed excessive HGM content in LW-ECC can worsen the crystalline structure and impede their adequate dispersion, in contrast to the 80% HGM mixes [
22].
In addition, the 100% HGM mixes proved to be inferior during compressive tests due to their lower density and crumbling microstructure, and as anticipated, weaker HGM fillers were more susceptible to crushing. The ensuing damaged HGMs can worsen matrix porosity, potentially increasing their water intake. Both of the aforementioned have negative consequences for shrinkage. A larger percentage of fine HGM (100% HGM mixes) can mean a finer capillary network, implying a greater capillary stress. This is exacerbated in the case of weaker HGMs. More susceptibility to damage can imply the pore sizes become more refined and may induce greater capillary tension. For finer pores (<50 µm) filled with water, the formation of curved menisci induces an internal negative capillary pressure. This pressure can develop a compressive force aggravating the drying shrinkage rate.
T32 displayed the worst ultimate shrinkage at both ratios, with 1645 and 1877 µε, for the 80% and 100% ratios, respectively, (2.1 and 2.5 times larger than control-ECC). Another low dense mix, GS20-100 displayed the second-largest shrinkage rate after 28 days (2.3 times larger than control-ECC).


