Abstract
The aim of this study is to comprehensively evaluate the economic network patterns and their influencing factors of the Guangdong–Hong Kong–Macao Greater Bay Area (GHMGBA) in China, considering population scale, economic development level, and land-resource endowment. By employing a modified gravity model and a social-network method, we quantitatively analyzed urban agglomeration integrity indices, such as network density, edge–core structure, cohesive-subgroup index, and urban individual index (e.g., centrality degree) of this region, encompassing nine cities in Guangdong Province and two special administrative regions. The results revealed significant changes in the economic network patterns within the GHMGBA over time. Furthermore, the quadratic assignment procedure correlation analysis index was used to identify the various factors affecting the strength of the economic interaction. The findings demonstrated an annual increase in the strength of economic interaction between cities and regions within the GHMGBA over the past 20 years, along with the emergence of a polycentric economic development pattern. The results also suggest that the spatial location and level of economic development are key determinants influencing the strength of economic linkages in this area. This study supports the conclusion that deepening exchanges and cooperation among core cities, bolstering economic development in sub-core cities, and facilitating the construction of an integrated regional transportation network will expedite the process of economic integration.
1. Introduction
The term “urban agglomeration” is employed to delineate a distinctive geographical region, distinguished primarily by its substantial urban and metropolitan expansion [1]. The phrase refers to a regional economic complex characterized by active resource circulation, close economic connectivity, and a complex spatial structure formed through the flow of capital, information, and traffic within a specific geographical area [2,3]. The concept entails a central core comprising one or more major urban centers, encompassed by surrounding cities [4]. The era of globalization has given rise to increasingly intricate and diverse connections between cities, where the unrestricted flow of labor, capital, resources, and technology occurs within urban agglomerations [5]. The utilization of complementary advantages fosters regional competitiveness, thereby facilitating common development. As a spatial platform for countries to engage in global trade activities and international division of labor [6], urban agglomerations play a direct role in promoting rational flow [7] and efficient utilization of production factors within their boundaries [8,9].
The urban agglomerations in most developed countries have reached the maturity stage [10], whereas certain Chinese urban agglomerations such as the Beijing–Tianjin–Hebei region [11], Yangtze River Delta [12,13], and Pearl River Delta [14] are still undergoing a growth and expansion phase. To facilitate the high-quality development of urban agglomerations in China, it is imperative to address issues pertaining to spatial structures [15,16], patterns of evolution [17,18], and spatial connection intensity [19]. The modified gravity model provides an effective approach for investigating the intensity and structure of the urban network [20]. This model can also be used to analyze potential economic, population, and resource interdependencies among urban areas [21].
More specifically, the gravity model and locational-entropy index are employed to investigate the economic interconnection and aggregation levels among cities, thereby illustrating the spatial spillover effects of multifunctional urban centers [22]. The proposed model allows for the analysis of regional differentiation and “center–periphery” characteristics in terms of the spatial-linkage degree within the Beijing–Tianjin–Hebei urban agglomeration [23]. Moreover, this model facilitates investigation into the “dual-core” (two cities with the same economic status and not far from each other) spatial pattern [24], and identification of the development stage of urban agglomerations [25].
In addition to examining the internal spatial structure of urban agglomerations, some studies have increasingly focused on investigating economic linkages within themselves [26,27]. After the introduction of the concept of “flow space” by Castells-Quintana and Royuela [28], the investigation of “various flows” has emerged as a novel perspective for investigating urban and regional structures.
The methodology of social network analysis has been extensively employed in the investigation of urban agglomeration, while relevant studies have also examined the economic interdependencies among cities by analyzing the flow of production factors such as capital, passenger transport, and information exchange [29]. These investigations have provided valuable insights into the structural characteristics of urban agglomeration evolution [30,31], urban network structure [32], urban network hierarchy [33], and interconnections between cities [34]. Social network analysis could also be utilized to quantify the connectivity and centrality of urban areas [35], identify primary driving forces [36], and demonstrate the effects and mutual influences among cities [37].
In summary, the spatial pattern of urban agglomerations has emerged as a new research hotspot; however, limited attention has been given to investigating the economic network changes and influencing factors within the Guangdong–Hong Kong–Macao Greater Bay Area (GHMGBA). Theoretical research has revealed that the formation and development of urban agglomerations adhere to the principles of spatial crystal structure combination [38]. This implies that polycentric urban agglomerations typically exhibit characteristics such as gradual growth [39], low compactness [40], and weak centrality [41]. Due to the practical requirements of China’s Belt and Road Initiative, there has been a growing trend of enhanced and extensive economic cooperation among cities within this area, leading to an accelerated process of regional economic integration. In this context, Guangzhou, Shenzhen, Hong Kong, and Macao as a city cluster will collectively spearhead the economic construction in the GHMGBA while forming an innovative alliance for regional economic development with other non-core cities through transportation networks [42]. Based on the previous research, this study employed an improved gravity model to quantify the intensity of economic spatial linkage within the GHMGBA. Moreover, it also examined changes in economic-network characteristics and evolution laws by using indicators such as centrality, network density, core-periphery structure, and cohesive subgroups. Additionally, the Quadratic Assignment Procedure (QAP) was applied to conduct correlation analysis on the primary factors influencing the intensity of economic links in this urban agglomeration.
From a theoretical aspect, the variations in resource endowments, combined with terrain disparities and the immobility of certain economic factors, lead to a pronounced core–periphery disparity among cities across geographical scales within the fabric of urban agglomeration dynamics [43,44]. However, given the inherent nature of spatial externalities, the potential scope of benefits conferred upon individual cities by urban agglomerations typically exceeds the immediate manifestations of their overt advantages, thereby fostering holistic development across various industries within those cities [45]. In the practical process of urban development, is the degree of economic interconnectedness within the GHMGBA steadily increasing? What spatial structural evolutions have taken place? Do cities like Shenzhen and Hong Kong indeed hold central positions within the urban cluster as depicted in the media? And, do subgroups or secondary tiers of urban development exist within the region? These are all critical issues requiring empirical verification in practice.
The primary objective of this study was to offer comprehensive guidance for optimizing the economic spatial-structure system of urban agglomerations, while simultaneously contributing to the advancement of research on urban agglomeration and regional economic networks, thereby facilitating integrated development within this domain. To accomplish these research goals, distinct objectives were formulated. First, the revised gravity model incorporated population and gross domestic product (GDP) data to examine the intensity of economic linkages between different cities, thereby analyzing the level of interaction among various “flow data” within the GHMGBA. Second, this study selected centrality, network density, core–periphery structure, and cohesive subgroup to evaluate the spatial structure and evolution laws of these cities and regions. Third, QAP analysis was utilized to investigate potential determinants influencing regional integration development. Fourth, recommendations were proposed in this paper for promoting regional integration development to enhance communication and cooperation among cities in the GHMGBA.
2. Illustration
2.1. Study Area
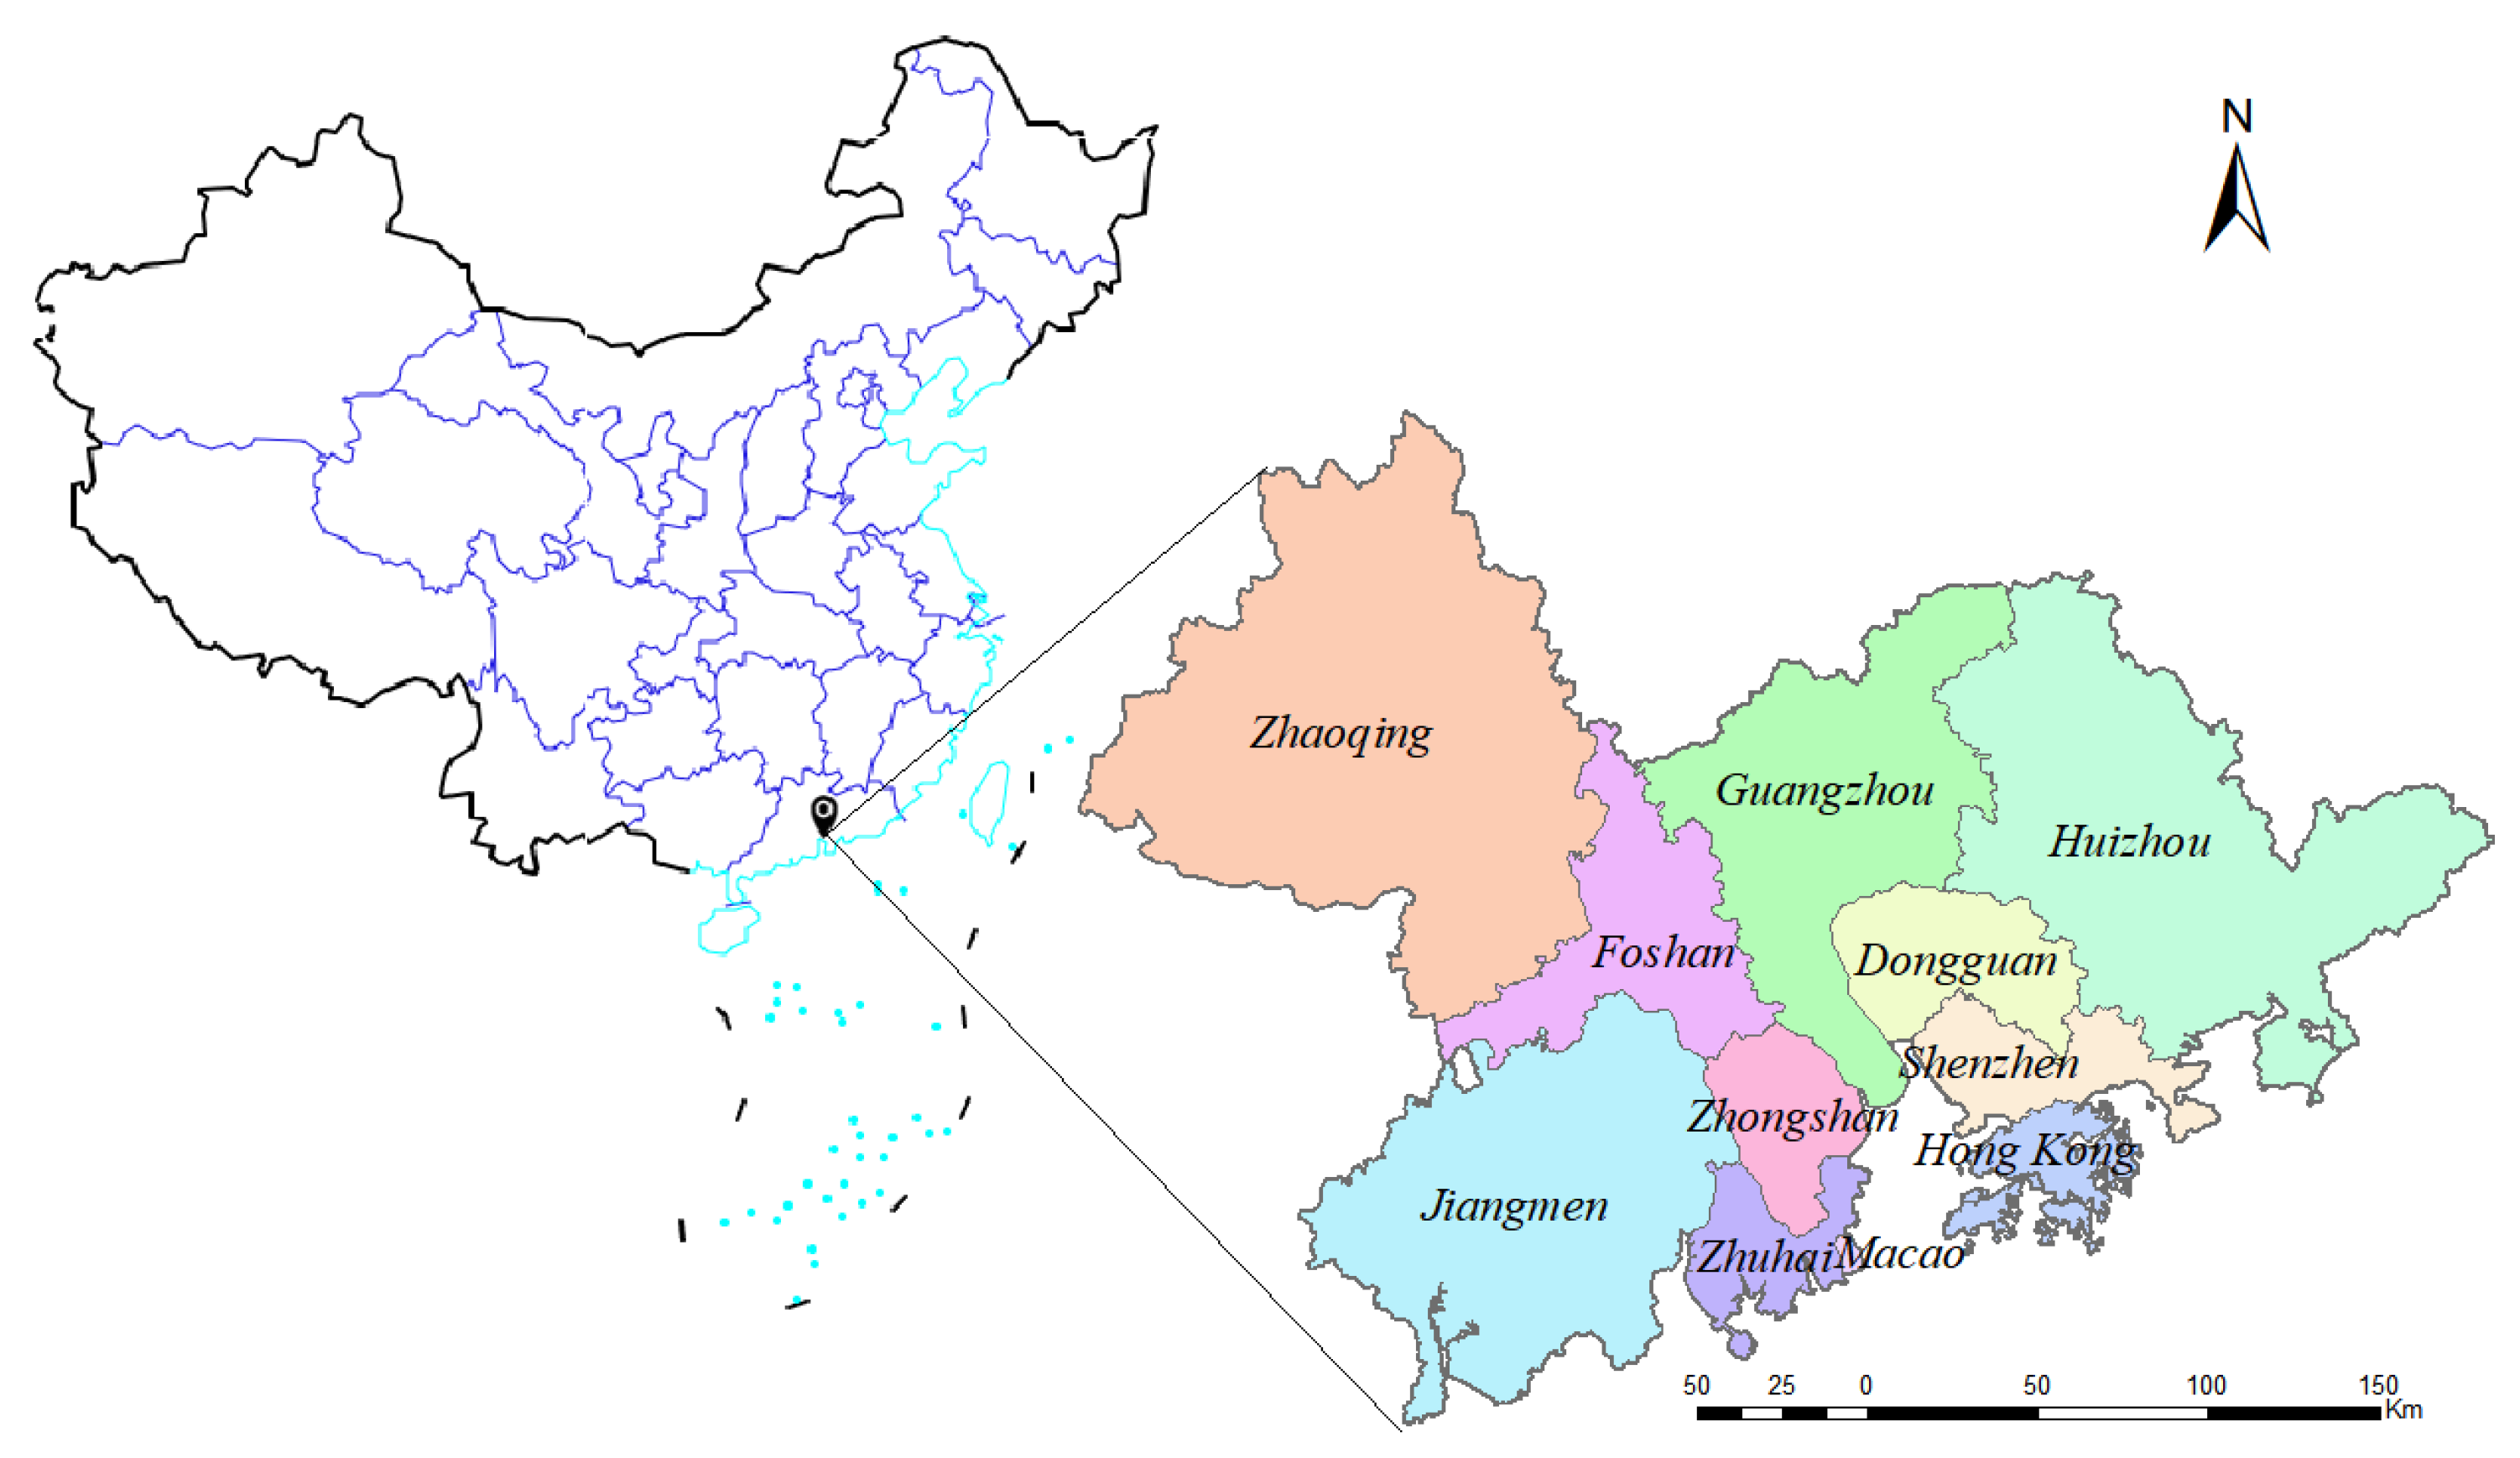
The research scope of this paper focuses on analyzing and discussing the spatial economic linkages among cities and regions in the GHMGBA Development Plan, encompassing the designated spatial areas. This urban agglomeration includes Guangzhou (GZ), Shenzhen (SZ), Zhuhai (ZH), Foshan (FS), Huizhou (HZ), Dongguan (DG), Zhongshan (ZS), Jiangmen (JM), and Zhaoqing (ZQ) in Guangdong Province, as well as Hong Kong Special Administrative Region (HK) and Macao Special Administrative Region (MO). This area under discussion is characterized by its exceptional economic vitality and openness, which occupies a strategically significant position in the global economic landscape. By 2022, the total economic output of the GHMGBA has exceed CNY 13 trillion [46]. The geographical boundaries of this area are visually depicted in Figure 1.
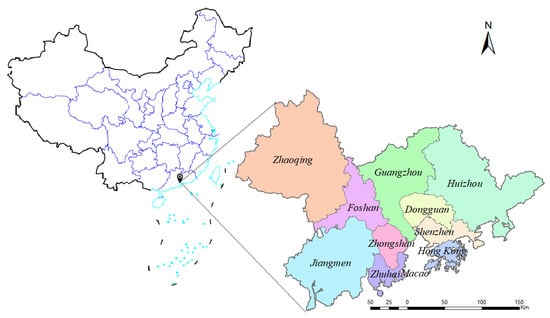
Figure 1.
Geographic location of the Guangdong–Hong Kong–Macao Greater Bay Area (GHMGBA) in China.
2.2. Data Description
The basic research data used in this study comprised cross-sectional data spanning 1999 to 2019, encompassing the social economy, population, and urban areas of cities and regions within the GHMGBA. The data primarily came from references such as the Guangdong Statistical Yearbook, the official website of the Census and Statistics Department of the Hong Kong Special Administrative Region, and the official website of the Census and Statistics Bureau of the Macao Special Administrative Region. Additionally, Baidu Map application was used to measure intercity distances by determining the shortest driving distance between municipal or special administrative region jurisdictions. The data analysis software, Ucinet 6 for windows, was employed for conducting analyses.
2.3. Research Framework
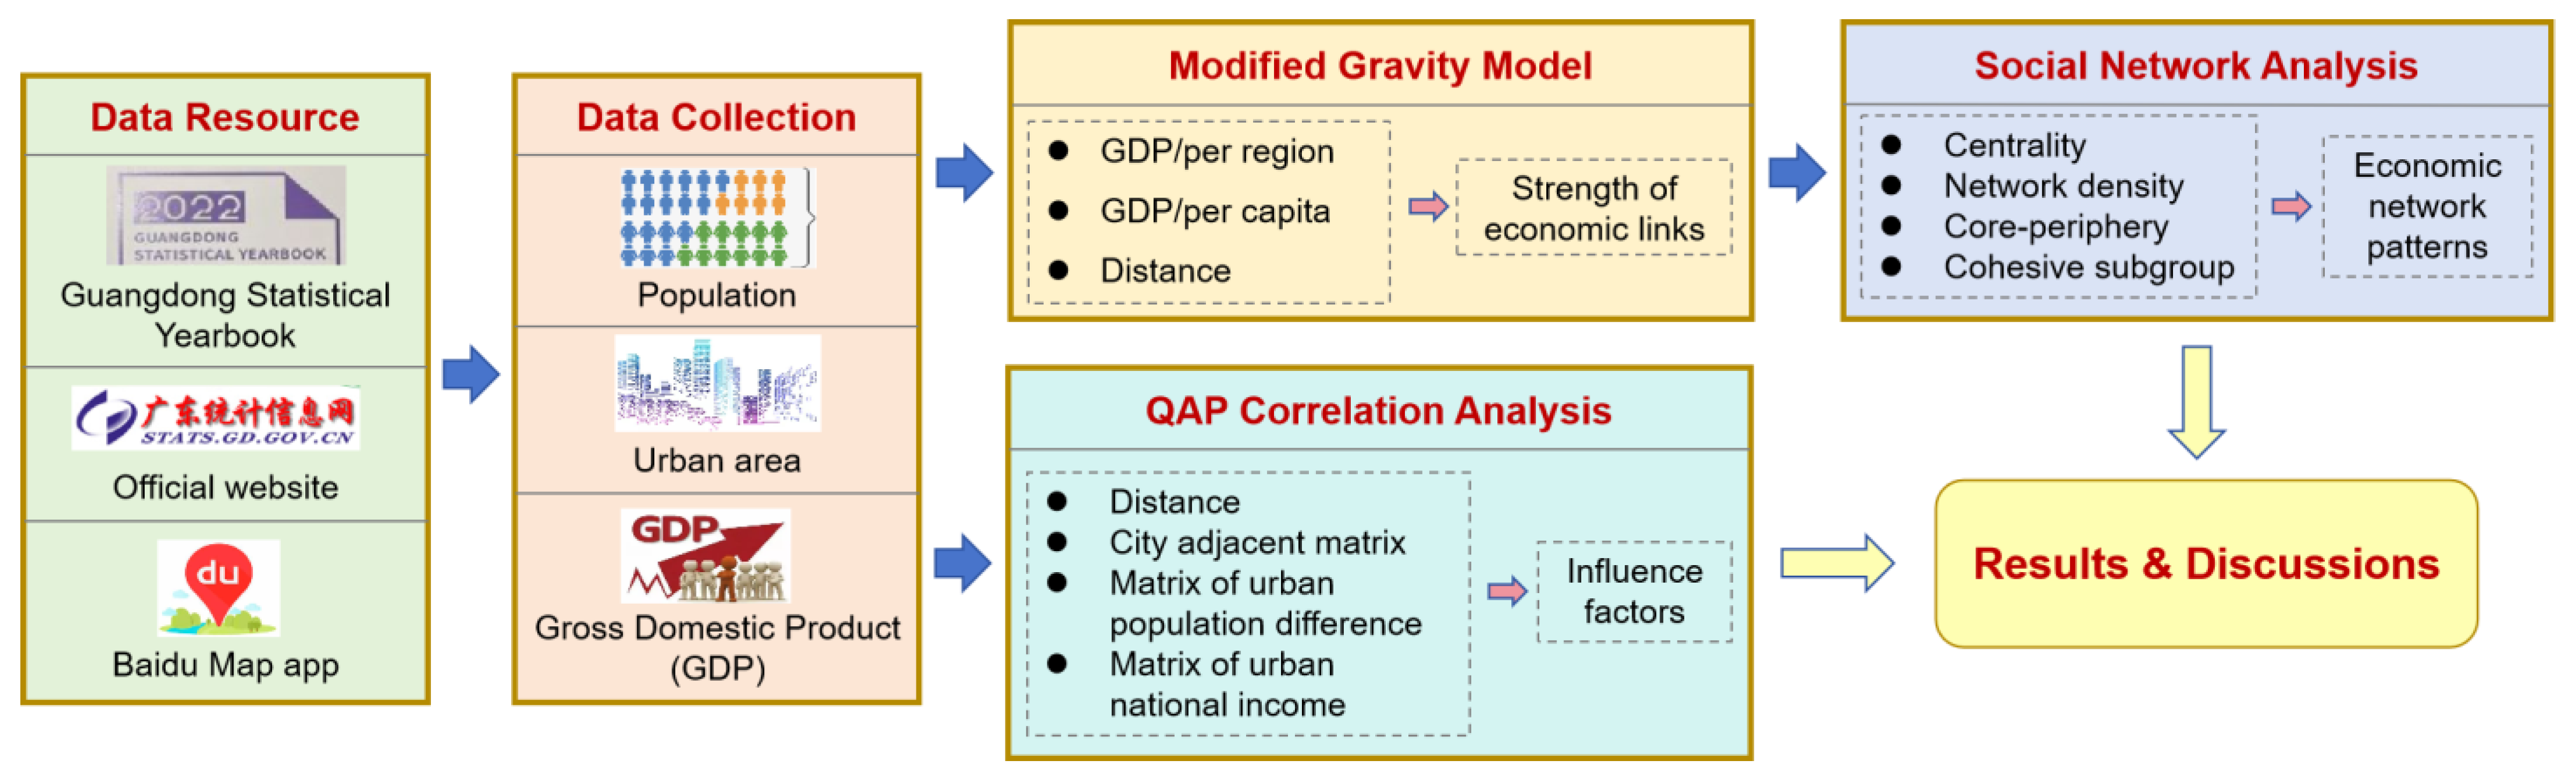
Based on the previous studies mentioned above, this study employed an innovative research framework, as depicted in Figure 2, to examine the robustness of economic connections, centrality, network density, core-periphery structure, and cohesive subgroups and influencing factors within the GHMGBA. The spatial configuration and evolutionary patterns of the GHMGBA were analyzed by using social network analysis and other indicators that rely on the strength of economic links. Moreover, the factors influencing the integration of the GHMGBA were identified using the QAP method, and these sections will be further elaborated upon in subsequent discussions.
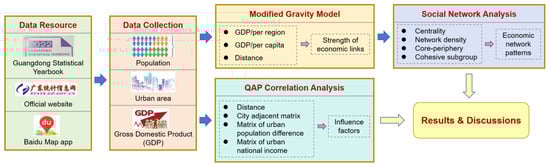
Figure 2.
Research framework.
3. Research Methodology
3.1. Modified Gravity Model for Strength of Economic Links
The gravitational model, originally employed in physics, has been extensively utilized in the investigation of regional space [47]. The current research indicates a positive correlation between interregional connectivity strength and economic development levels, while an inverse relationship is observed with respect to geographical distance [48]. The traditional gravity model mainly utilizes the product of the population and the GDP of two cities as the core index to assess the quality of urban development. This index is used to measure the strength of economic links between the cities. However, due to disparities in economic development levels among cities, the contribution of regional GDP to the strength of economic connections varies. To be more precise, cities with higher levels of economic development have a greater impact on regional economic connectivity due to their advanced industrial systems, abundant resources, and ability to attract external investments. They also contribute significantly to the cohesion of economic relations within the region by generating larger markets and fostering increased trade and financial flows. Conversely, cities with lower levels of economic development may have limited resources, weaker industrial bases, and smaller market sizes, resulting in lesser contributions to regional economic connectivity.
The conventional gravity model, used to analyze economic and social interactions within geographical space, overlooks the size of city, which should be a crucial factor. Previous studies have shown that additional difficulties arise when the scope of the study transitions from individual cities to urban agglomerations, making it necessary to consider the issue of aggregation bias due to the inherent heterogeneity in the size of each city [49]. Moreover, the incorporation of urban land factors is essential in the field of urban agglomeration studies to gain a deeper understanding of the intrinsic characteristics of cities [50]. Consequently, it becomes imperative to enhance the traditional gravity model by incorporating contribution values, referring to the aforementioned city’s size [51]. Thus, in this study, the development quality of two cities is characterized based on the product of GDP per capita and GDP per region, which is used to calculate the economic-impact intensity, in conjunction with the population correction coefficient and the GDP correction coefficient. The use of relative values (e.g., GDP per capita), for variables in gravity models aims to more accurately reflect the notion of mass in gravity models, rather than relying on absolute values commonly used in existing studies. This approach is intended to emphasizes the quality of economic development over quantity.
The economic interconnections within the GHMGBA can be examined by employing the modified gravitational model, as described by the following equations:
where Gi represents the economic-impact intensity of city i; Kij is the influence correction coefficient, which is obtained by multiplying the population correction coefficient and the economic correction coefficient; LGDPi and LGDPj represent the GDP per km2 (CNY 100 million/square kilometer) of city i and city j respectively; PGDPi and PGDPj respectively represent the per capita GDP (CNY/person) of city i and city j; POPi and POPj represent the population (10,000) of city i and city j separately; GDPi and GDPj respectively represent the GDP values (CNY 10,000 yuan) of city i and city j; while Dij is the distance (kilometer) between city i and city j.
3.2. Network Centrality
The flow (including both inflow and outflow) of economic resources could serve as an indicator of the significance of a city or region. Network centrality is an individual metric that reflects the regional economic resource flow status within a network, typically measured by degree centrality and betweenness centrality [52].
The “degree centrality” is employed to quantify the total number of other cities that engage in direct economic relations with a specific city. This index can be further divided into two indicators: point-in degree and point-out degree, both of which represent the cumulative economic interactions, respectively, that a city has the capacity to absorb and emit resources.
The “betweenness centrality” is used to capture the control capacity of a city within the regional economic network, reflecting its influence within the network. A higher value indicates a more prominent central position for the city and a greater impact on other urban agglomerations within its vicinity. This value can be calculated using Equation (3):
where k represents the total number of cities in an urban agglomeration; Pmn denotes the count of shortcuts between cities m and city n; and Pmn(i) represents the count of shortcuts between city m and city n passing through city i.
3.3. Network Density
Network density, which quantifies the level of urban correlation within an urban agglomeration, is defined as the ratio between the actual number of economic correlations and the maximum possible number of economic correlations for each city. Equation (4) is used to calculate network density. A value closer to 1 indicates a higher degree of overall economic activity in the urban agglomeration and a more frequent flow of non-fixed production factors:
where P is the network density; C is the sum of the economic relations existing in each city, which could be measured by the strength of economic linkages listed in Equation (1); and n is the number of cities.
3.4. Core–Periphery Structure and Cohesive Subgroup
The “core–periphery structure” refers to a distinctive arrangement resulting from the flow of production factors between cities within the intricate economic network of an urban agglomeration. This is closely linked in the center and sparsely scattered in the periphery. In this context, the core degree index serves as an evaluative measure to assess the resource concentration capacity of a specific city within the GHMGBA. This index determines the city’s positioning as either a central or a peripheral entity.
The “cohesive subgroup” refers to a subgroup structure that is formed, driven by economic, geographical, and other factors. Analyzing cohesive subgroups reveals relationships between core and non-core cities within the urban agglomeration. This method also enables an exploration of the organizational evolution characteristics within the development space of urban agglomerations and elucidates the formation mechanism of their inner groups. The statement can be further specified as follows: a cohesive subgroup forms when the number of communication channels between closely connected cities exceeds the total number of regional cities.
3.5. Quadratic Assignment Procedure (QAP) Correlation Analysis
The QAP is a non-parametric arrangement test method for a relational data matrix, effectively sidestepping the pitfalls of vector autocorrelation and multicollinearity [53]. Multiple collinear relationships among variables can render ordinary least squares regression invalid. This proposed methodology effectively addresses these challenges. This methodology can identify key drivers that significantly impact system development and has wide applicability in various domains such as socio-economic analysis [54], economic–geographic studies [55], and ecological conservation [56]. This paper considers each city as a distinct participant and, through calculating correlations within their respective data matrices, elucidates the relationship between diverse urban economic systems while examining various factors that influence regional economic development.
4. Results
4.1. Changes in Economic Linkages
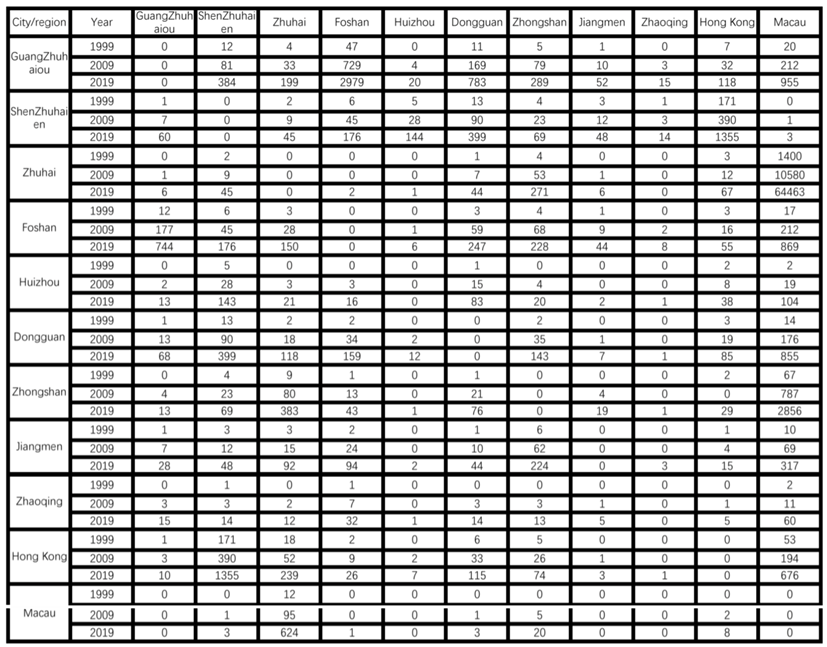
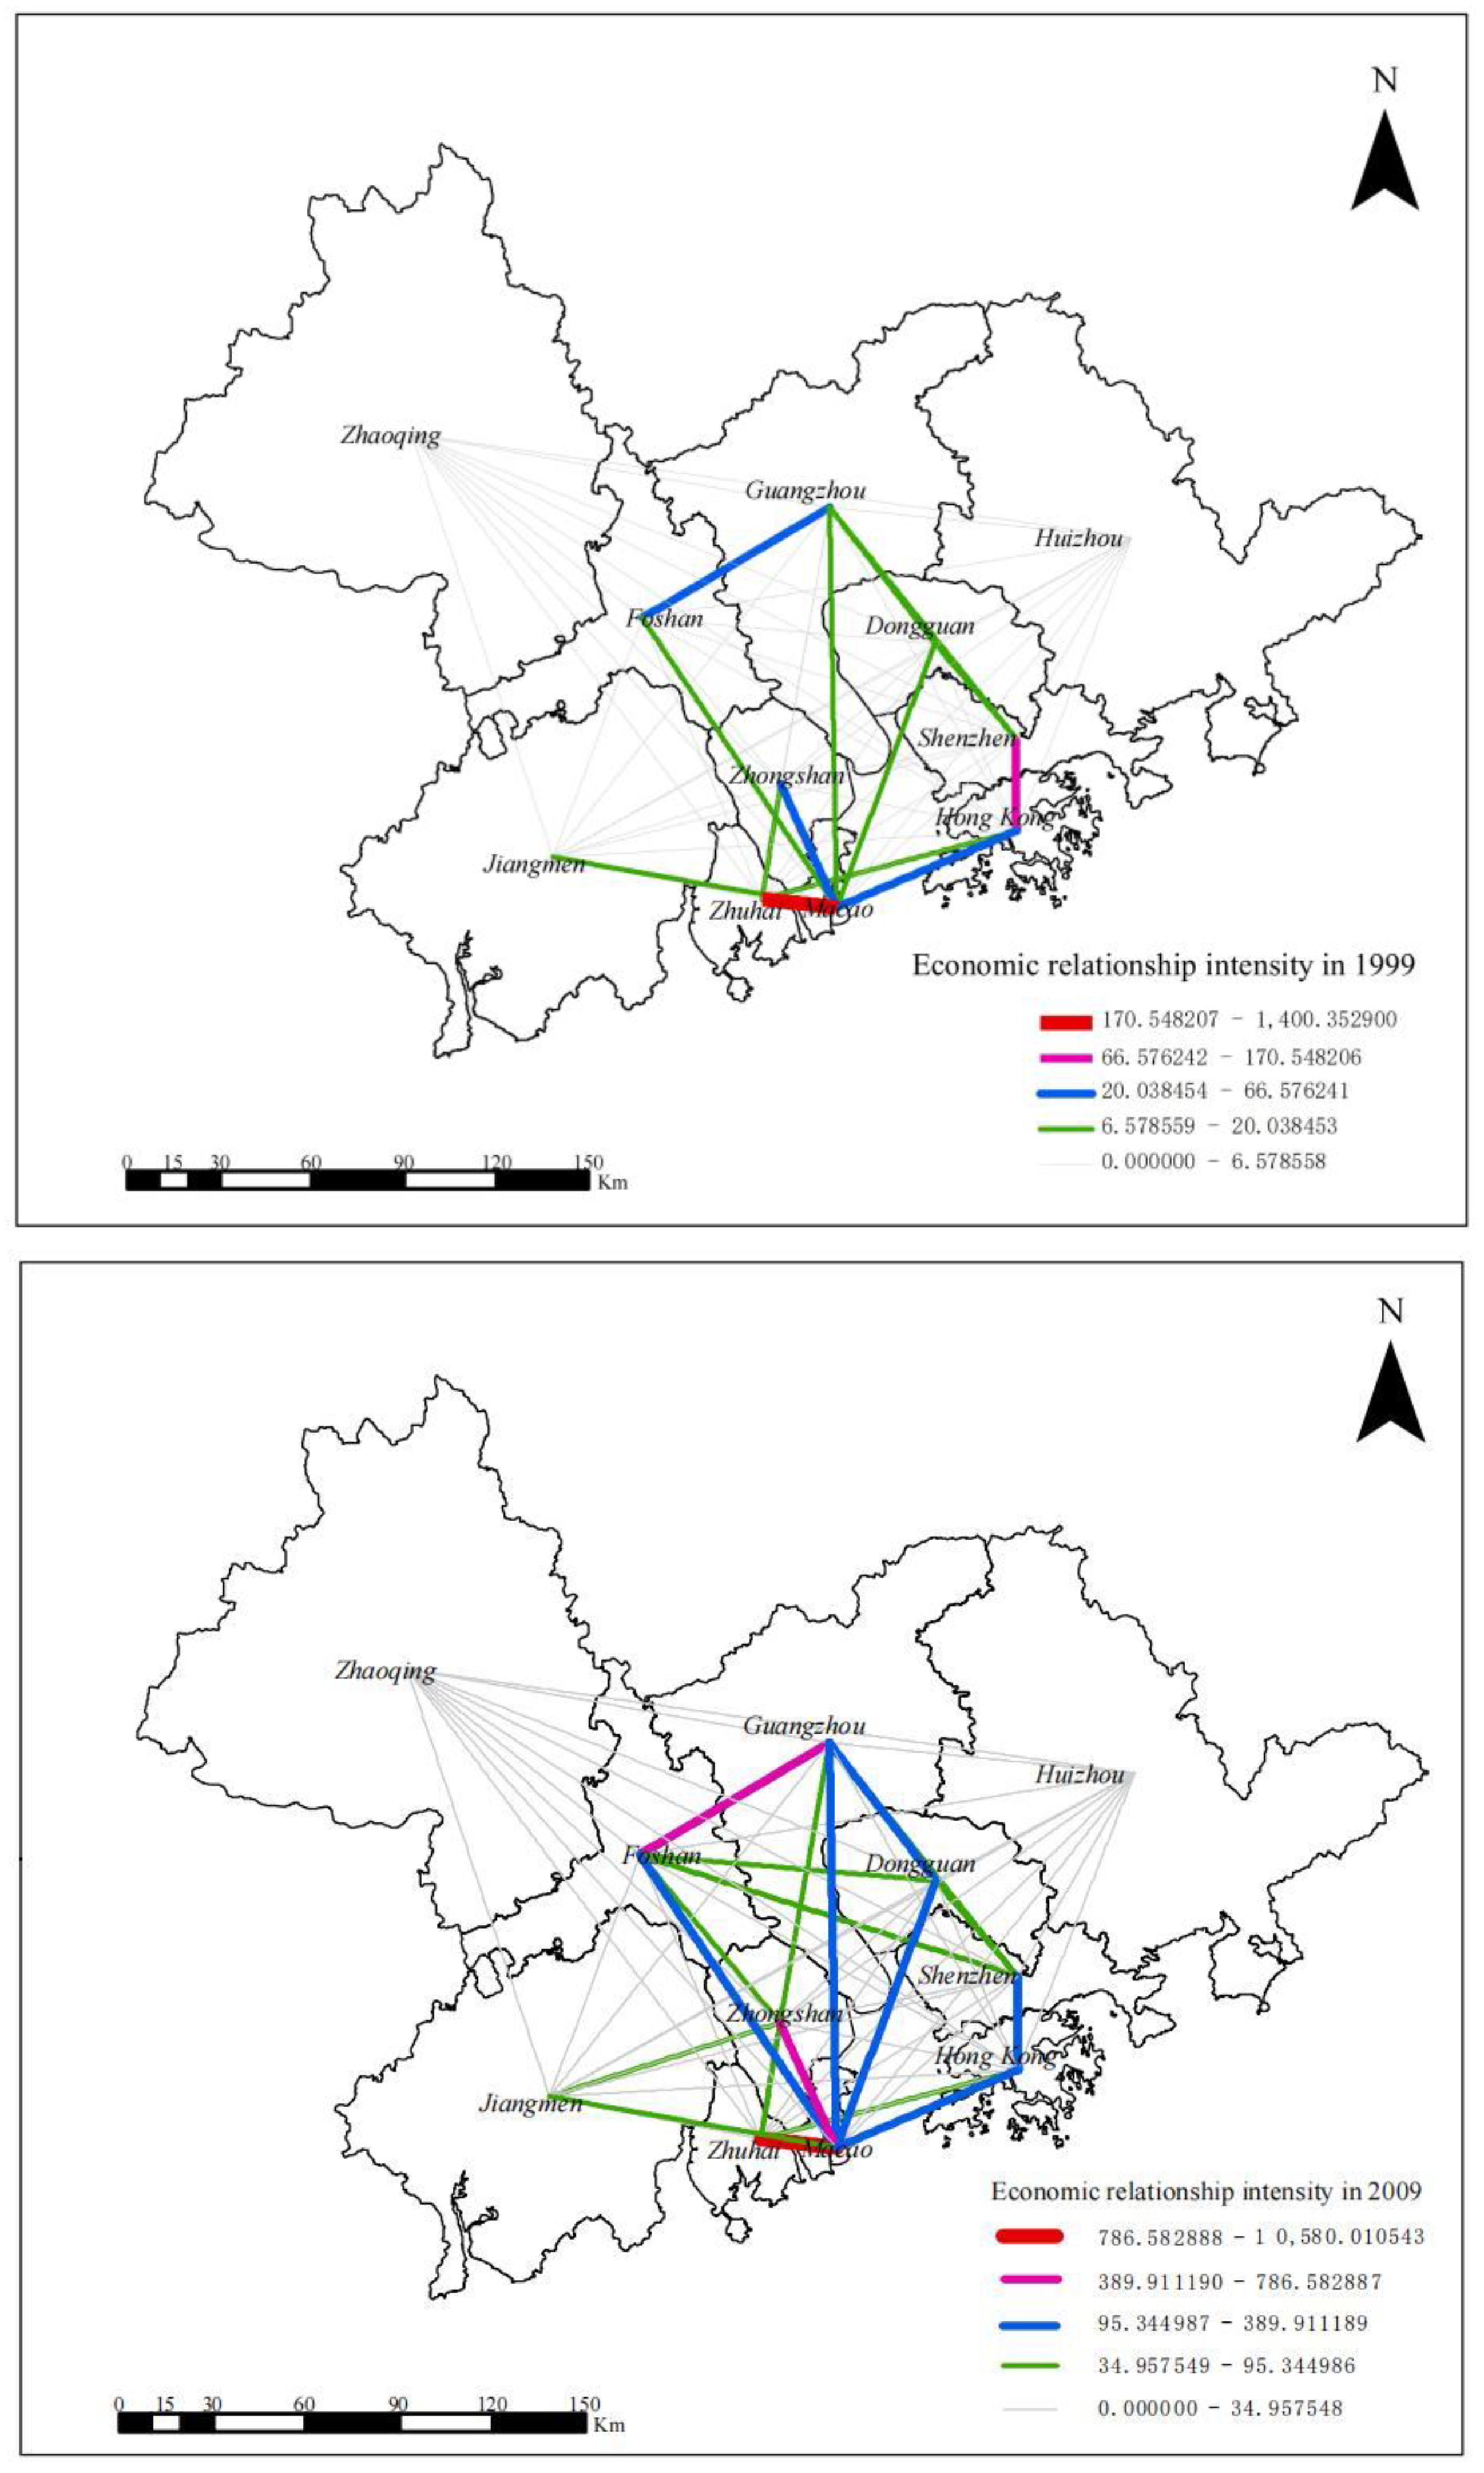
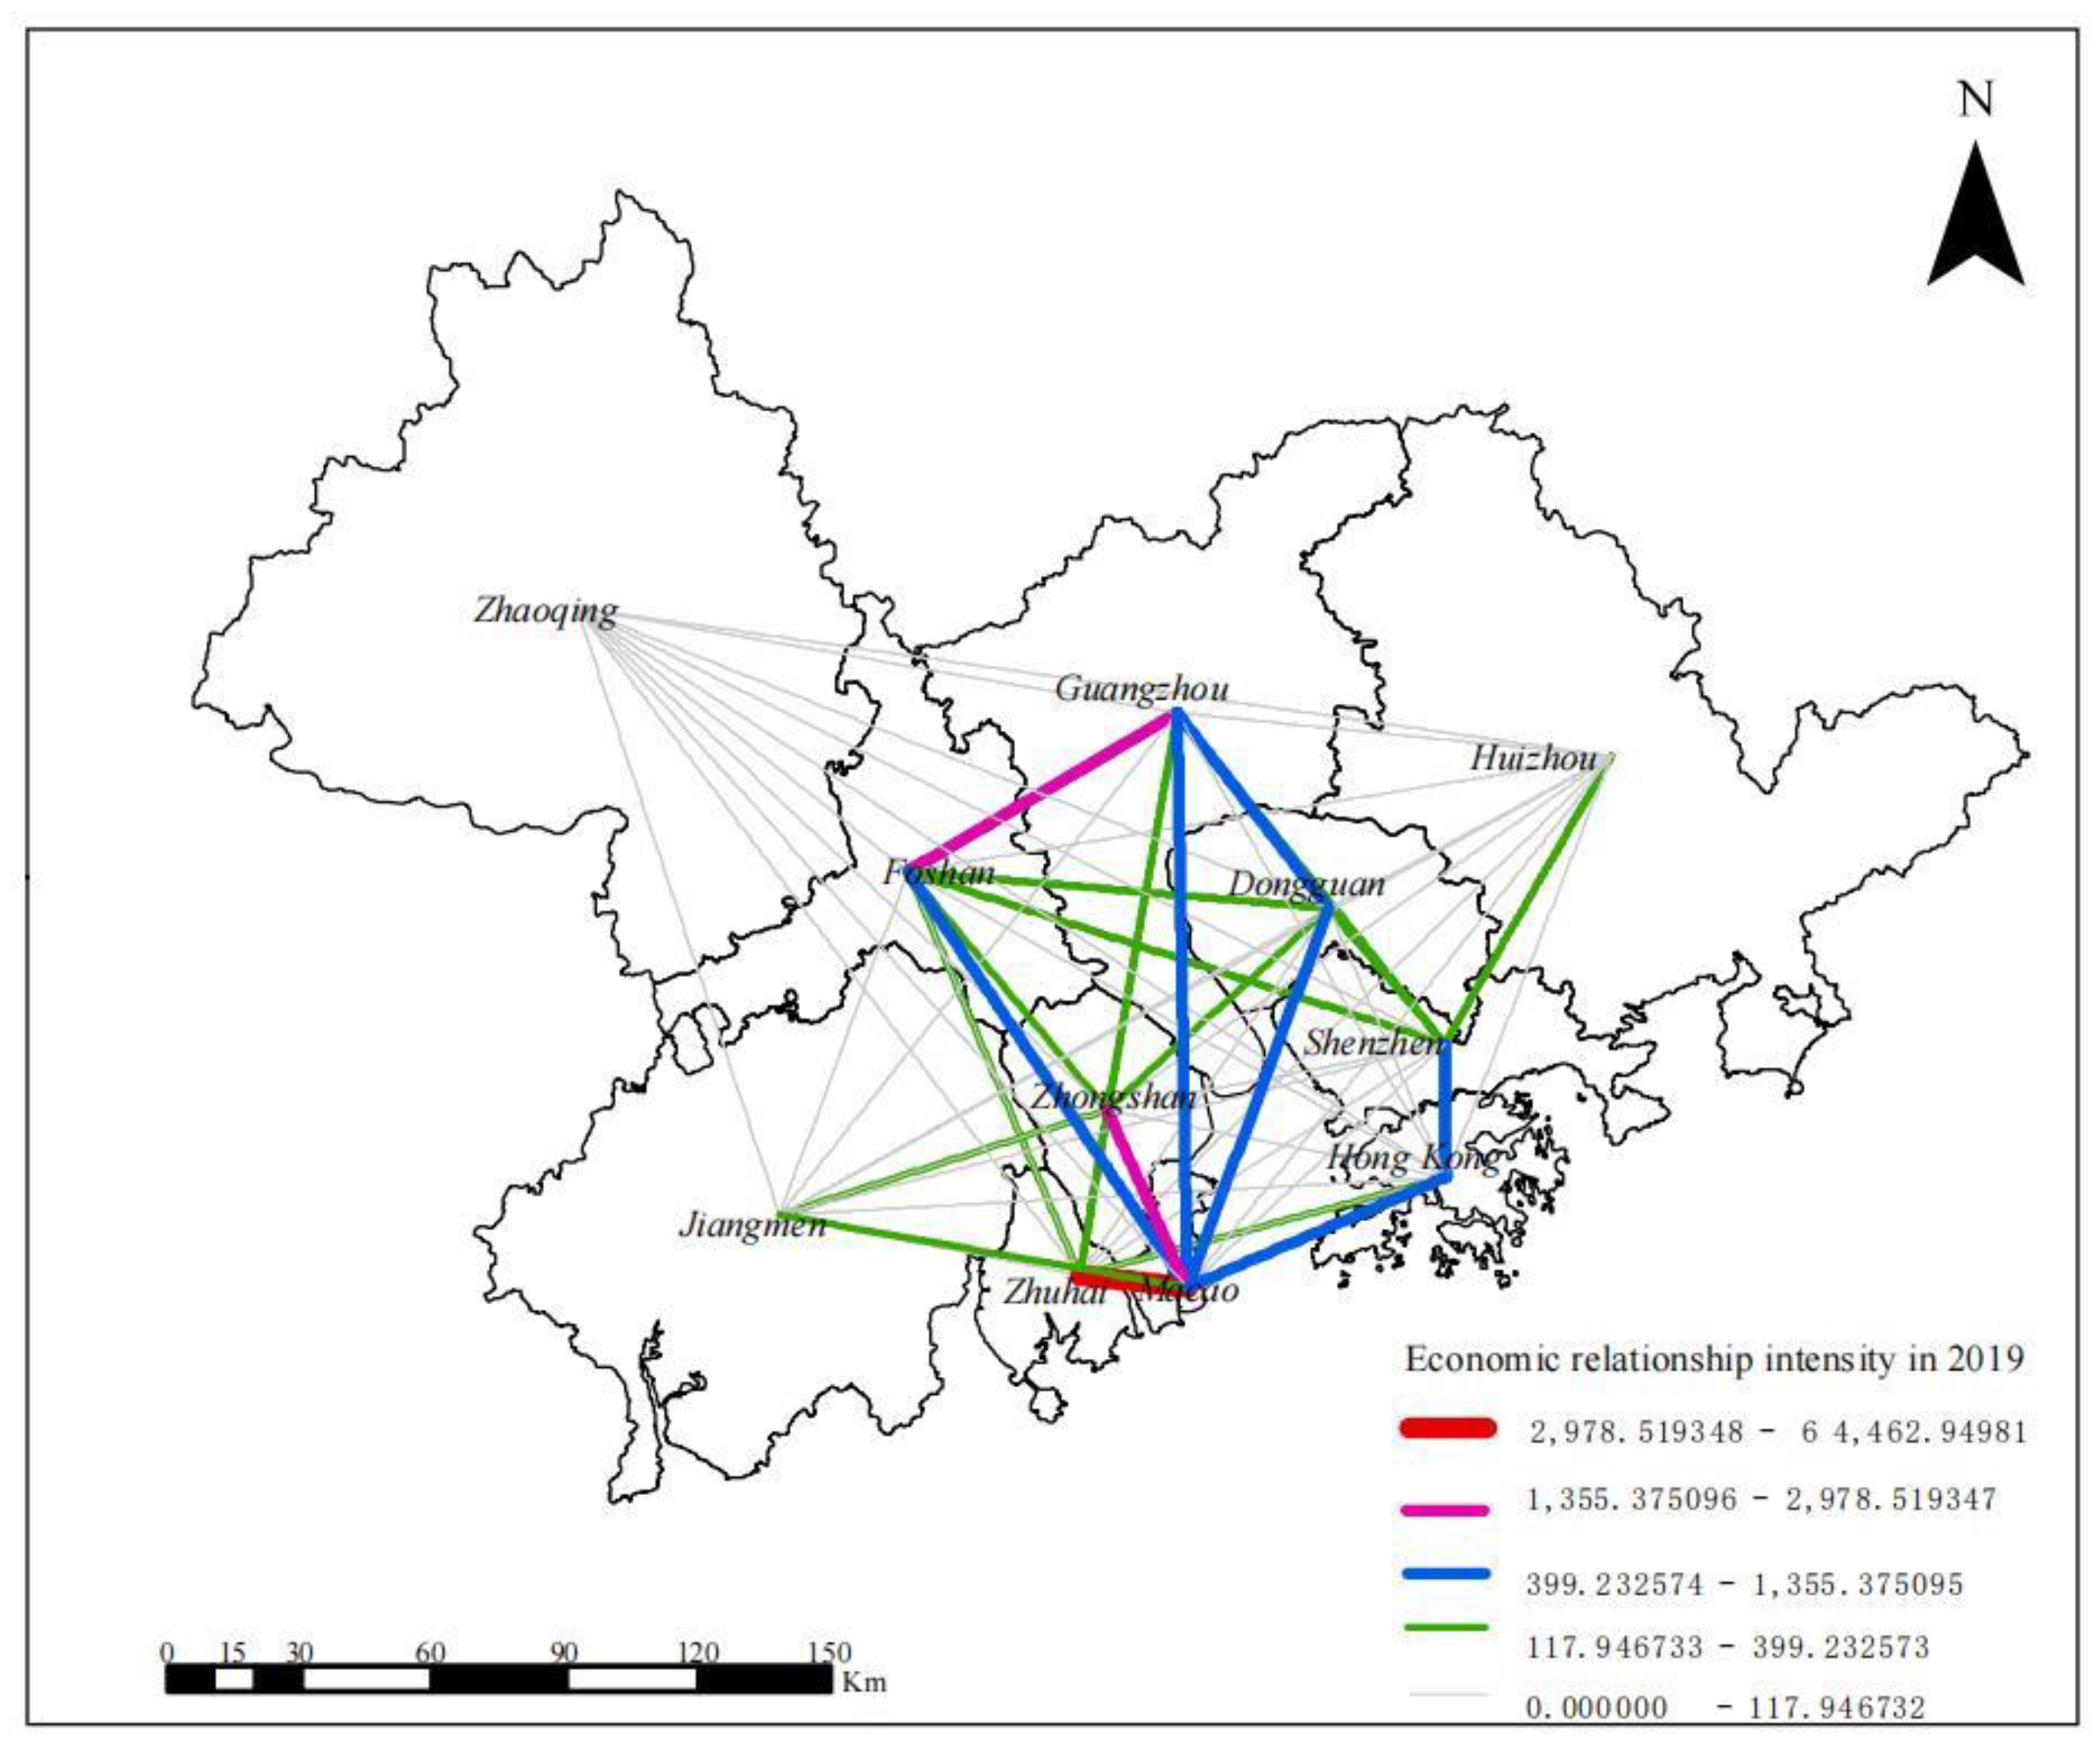
The strength of economic linkages between cities and regions within the GHMGBA was assessed by using a modified gravity model combined with socioeconomic statistics data. Through these calculations, it was observed that there has been a consistent upward trend in economic linkages within this urban agglomeration over the years. The changes in the intensity of economic relationships in this area are illustrated in Figure 3. Moreover, the values of economic linkages between all cities and regions can be obtained in the Appendix A.
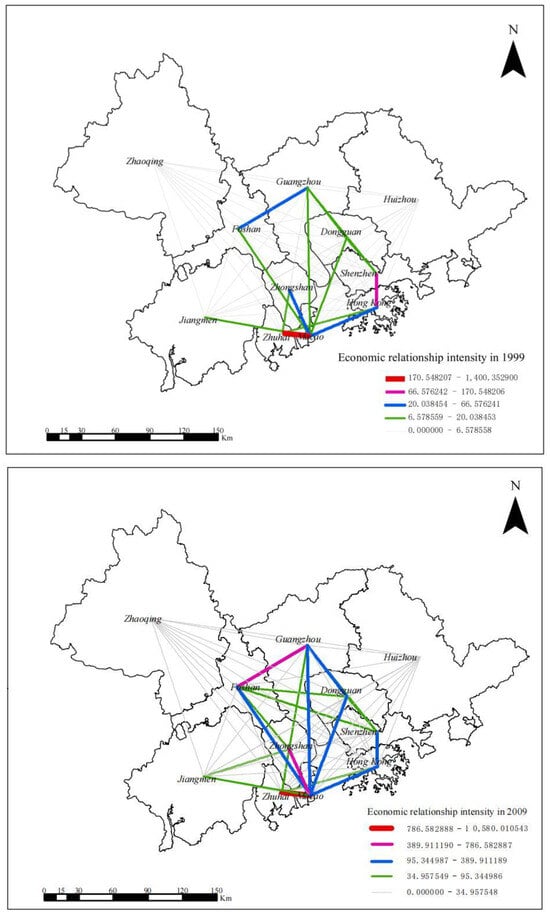
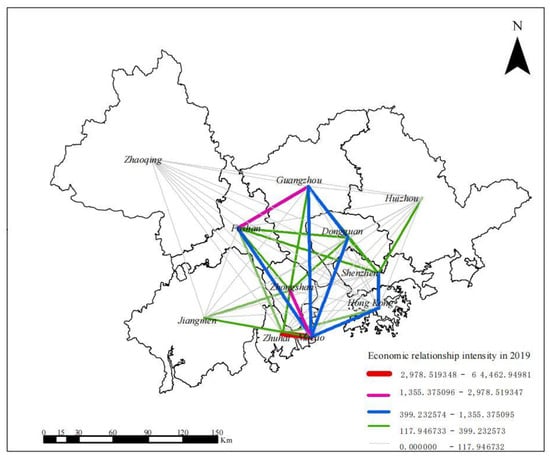
Figure 3.
Changes in economic relationship intensity within the GHMGBA.
The specific findings were as follows: Guangzhou only established economic linkages with Foshan in 1999, because the value of economic linkages between them was larger than that of other cities. Guangzhou gradually strengthened its economic connections with Dongguan, Shenzhen, and Macao over time. By 2019, an integrated economic interaction zone encompassing Guangzhou, Foshan, Dongguan, Shenzhen, and Macao had been formed, as the values of the economic linkages among them were more than 300. Employing the same analytical methodology, we conducted a thorough examination of the fluctuations in economic linkage values among other core cities.
In 1999, Shenzhen primarily showed strong economic linkages with Hong Kong but gradually strengthened its economic connections with Dongguan and Foshan. By 2019, it further enhanced its economic links with Huizhou. Initially, Hong Kong solely possessed strong economic affiliations with Shenzhen in 1999; however, it has subsequently progressively fortified its economic associations with Macao, Zhuhai, and Dongguan. Conversely, throughout this time period, Macao consistently maintained stronger economic connections with Zhuhai.
Furthermore, in addition to the aforementioned cities, we observed that several other urban centers initially established enhanced economic linkages with their neighboring counterparts. More recently, however, these cities have also experienced a steady annual growth in their connections with distant metropolitan areas. A notable example was Zhaoqing, which had virtually no economic linkage with most other cities in 1999. However, by 2019, it had established economic connections with the majority of cities or regions, although these connections remain relatively modest.
4.2. The Economic Function Evolutionary Process
To further investigate the ability of each city to acquire resources and exert influence on other cities or regions within the GHMGBA, the strength of economic linkages was binarized by using Ucinet software. This analysis yielded point-degree centrality and betweenness centrality values for each city or region, as presented in Table 1.

Table 1.
Centrality degree index of the GHMGBA.
The point centrality values demonstrated a consistent upward trend, increasing from 1.45 in 1999 to 4.64 in 2009, and further rising to 7.27 in 2019, a continuous annual increase in the economic influence of cities and regions within the GHMGBA.
The betweenness centrality values, on the other hand, exhibited a dynamic pattern over time. The betweenness centrality values increased from 1.18 in 1999 to 7.09 in 2009, but then decreased to 2.91 in 2019. This observed trend signifies the progressive alignment of economic interconnection among cities or regions.
Drawing upon the meaning of point centrality, there has been a significant enhancement in the capability of every city to both assimilate and disseminate resources. By analyzing fluctuations in betweenness centrality values, it indicated a trend towards standardization in the ability of cities or regions to exert control over shared resources.
Specifically, in 1999, Macao and Shenzhen emerged as the most influential cities or regions in terms of their point-out degree scores, while Guangzhou and Hong Kong demonstrated a strong capacity to integrate regional economic resources based on the point-out degree scores. By employing the same index system, Zhongshan and Zhuhai emerged as new influential cities alongside Macao and Shenzhen in 2009. Meanwhile, Foshan and Dongguan, together with Guangzhou, served as pivotal hubs for resource integration. By 2019, all cities and regions within the GHMGBA demonstrated a high level of importance as indicated by their degree centrality scores, suggesting a relatively balanced economic development across each city or region. Furthermore, within the core cities, such as Guangzhou and Shenzhen, the central role in resource integration has been further strengthened and consolidated, as evident from their point-in degrees. Compared to the growth rate of point centrality in Hong Kong and Macao, those cities displayed a higher indicator value, indicating their superior economic and resource mobility.
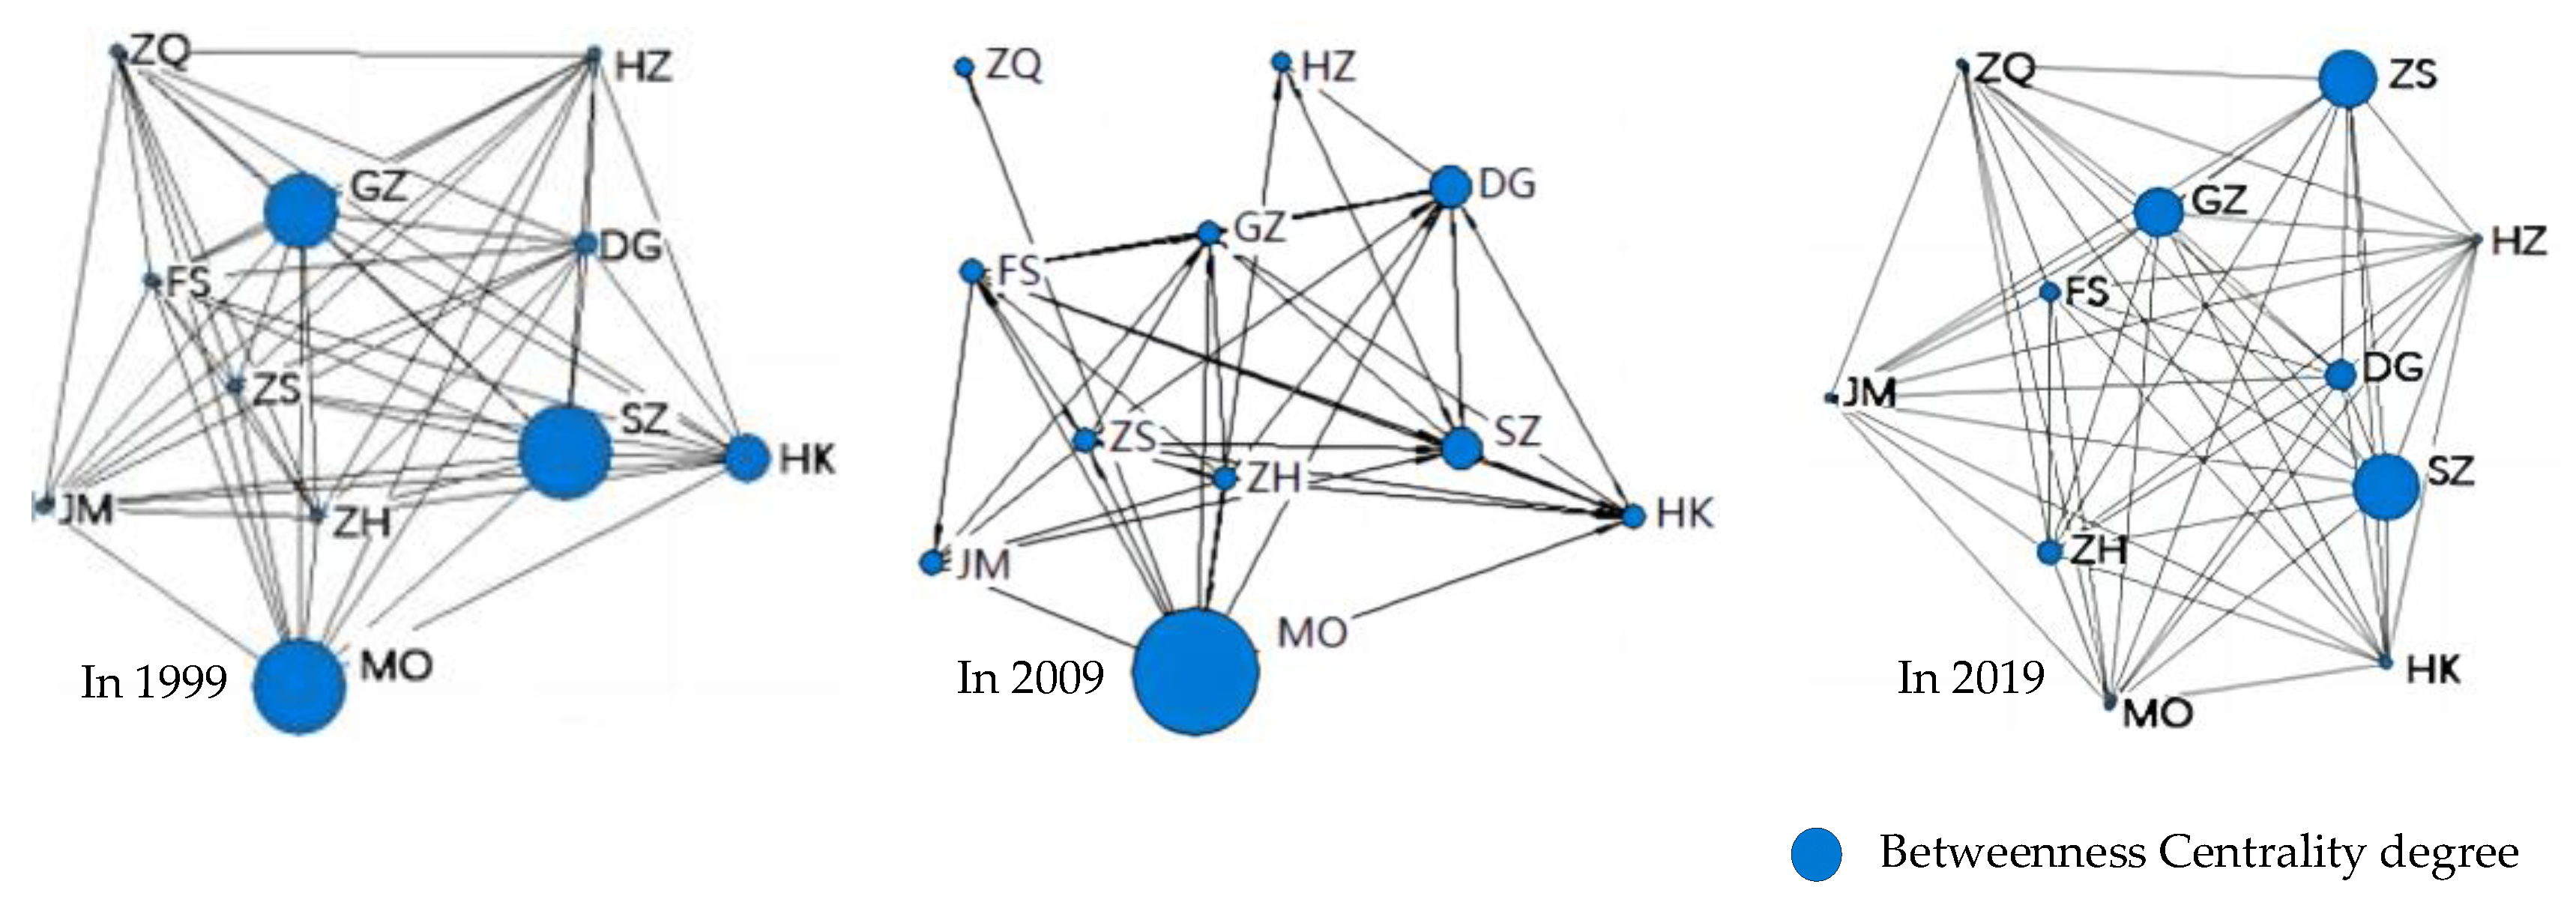
Moreover, the betweenness centrality degree can also serve as an indicator of the core position of cities or regions in resource integration. Based on Figure 4, it can be inferred that intrinsic economic linkages between cities and regions gradually formed from 1999 to 2019, contributing to the development of urban agglomerations. By using this indicator, this finding can further validate the analytical conclusion regarding the point centrality degree.
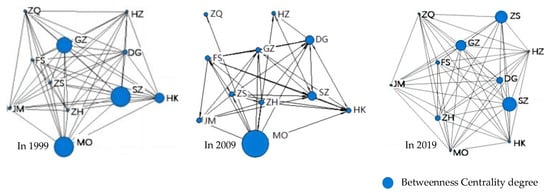
Figure 4.
Comparison of betweenness centrality degrees within GHMGBA.
According to the data presented in Table 1, most cities or regions had a betweenness centrality below 1 in 1999. However, during this period of time, Guangzhou, Shenzhen, Macao, and Hong Kong exhibited substantially elevated levels of betweenness centrality, suggesting their distinct advantages as core hubs. Furthermore, with the exception of Huizhou and Zhaoqing, a significant increase in betweenness centrality levels was observed across most cities or regions within the GHMGBA by 2009, indicating a notable enhancement in their capacity to absorb resources. By 2019, Guangzhou and Shenzhen’s betweenness centrality levels were significantly higher than those of other areas, highlighting their advantageous pivotal roles in regional economic development. Meanwhile, Zhongshan, Dongguan, Zhuhai, and Foshan demonstrated distinct advantages in sub-core positions while the remaining cities or regions consistently maintained non-core positions throughout this period.
4.3. Trend in Regional Integration Capacity
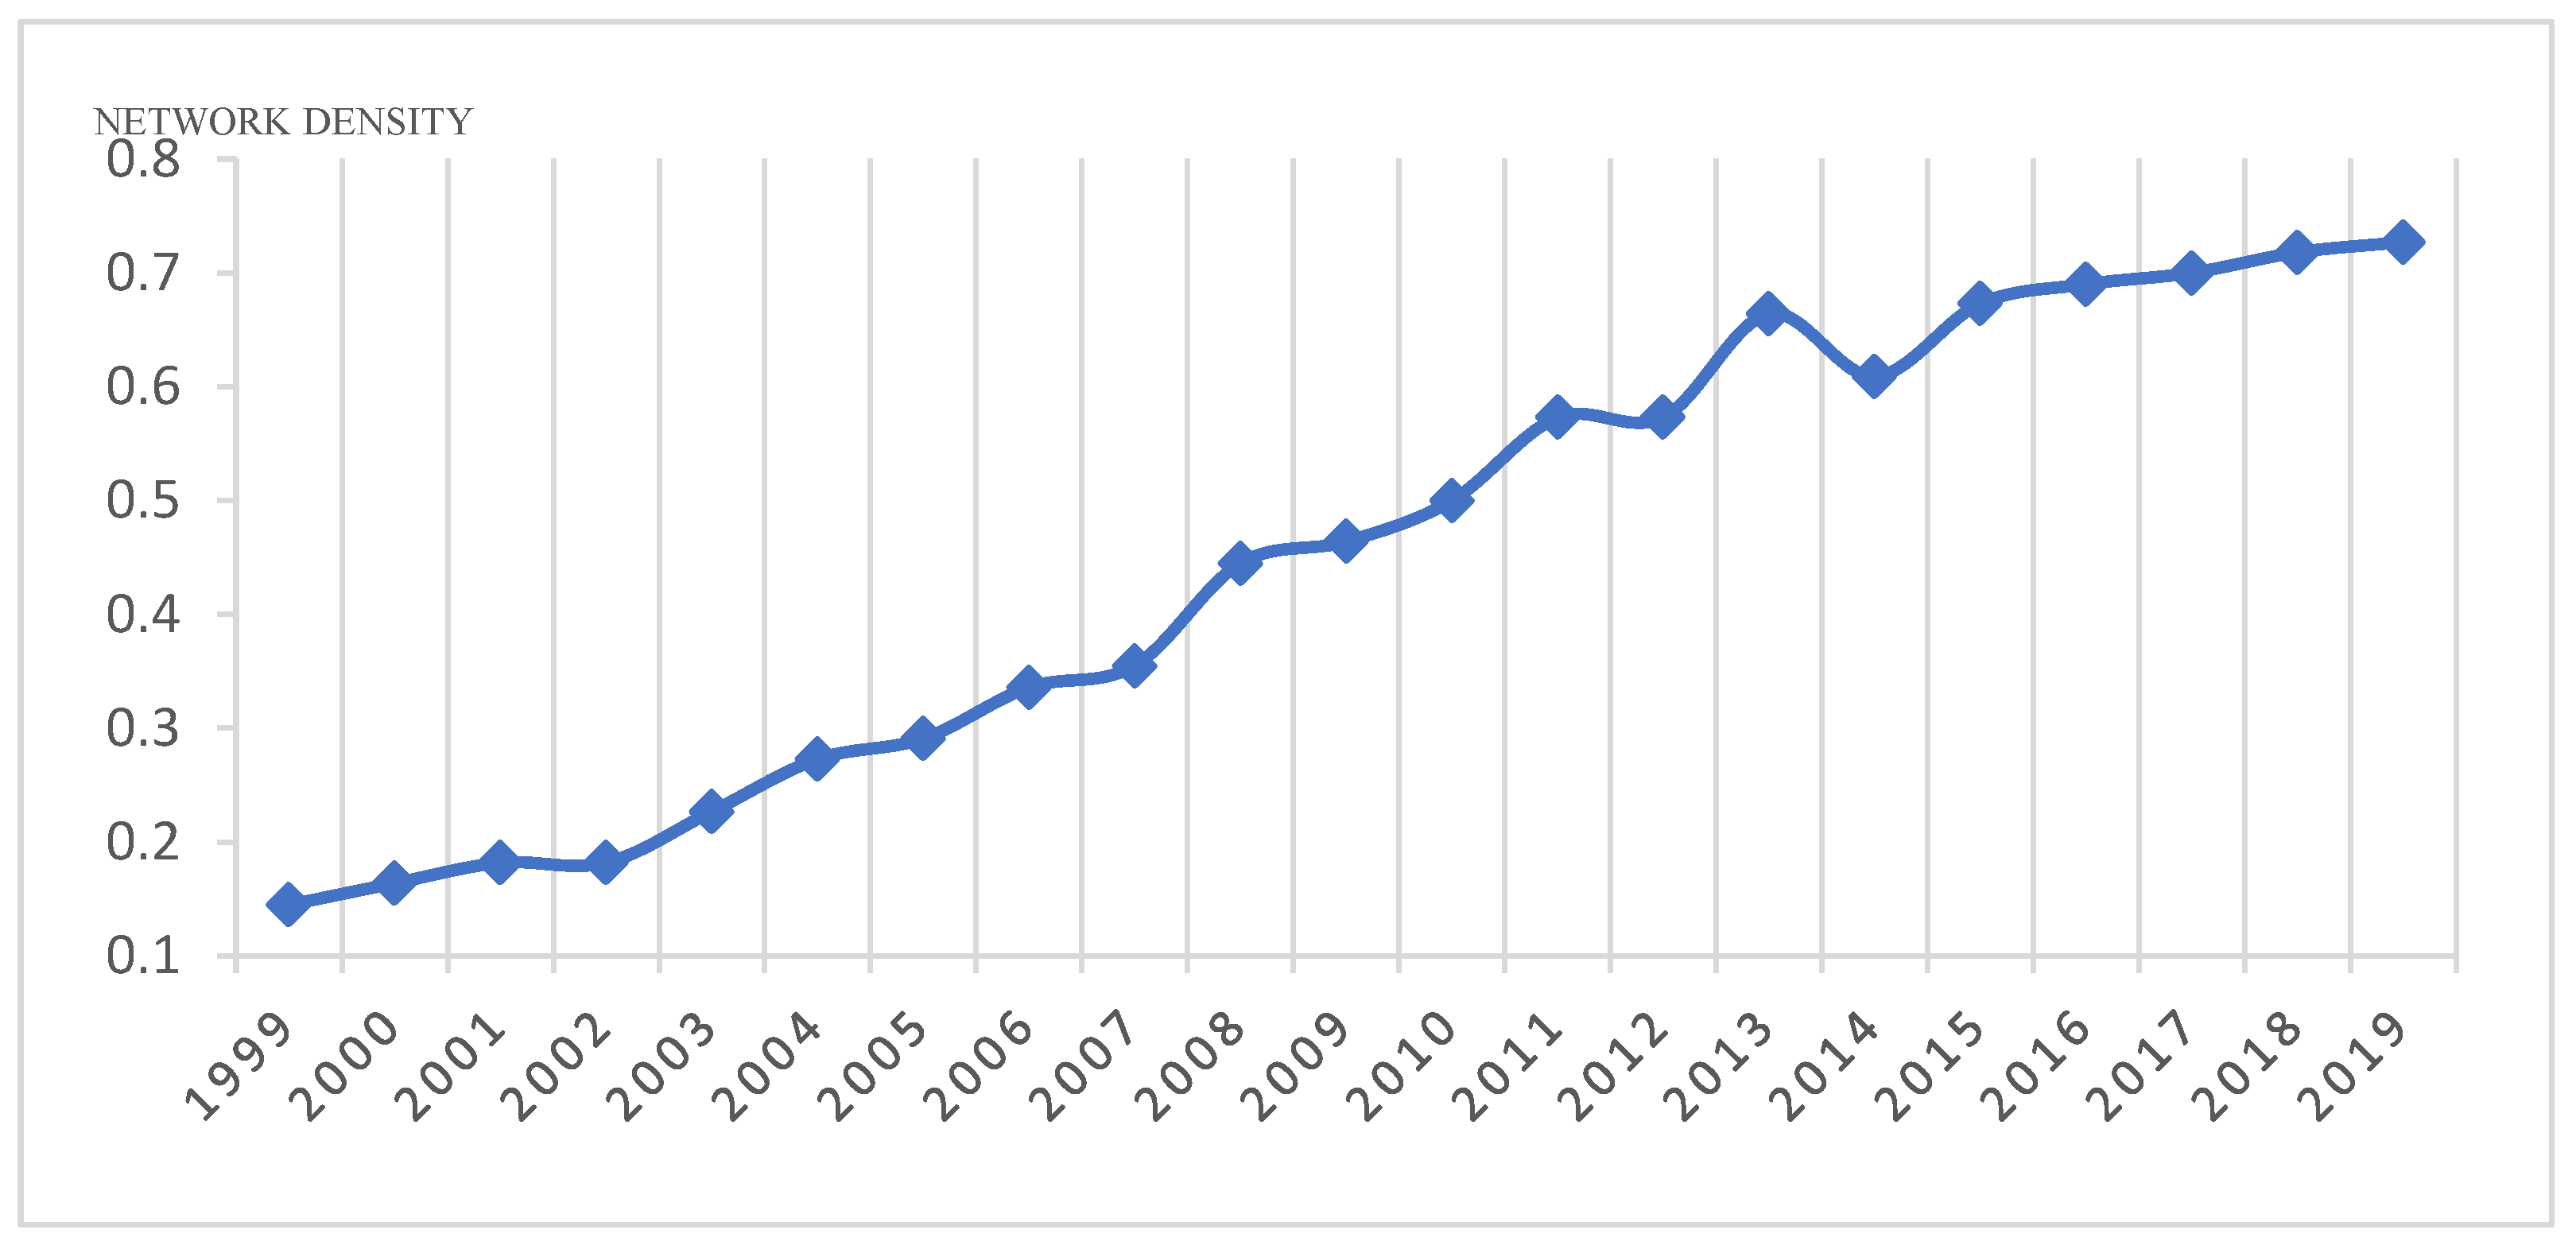
Utilizing the economic-linkage strength matrix of the GHMGBA, a thorough examination of network density was undertaken, revealing a consistent and substantial upward trend from 1999 to 2019 (Figure 5). This index demonstrated a remarkable increase, escalating from 0.145 in 1999 to 0.464 in 2009 and further surging to 0.727 in 2019. The augmentation in network density indicated a deeper integration of urban agglomerations, enabling cities and regions within the GHMGBA to engage in a specialized division of labor based on their respective comparative advantages. This, in turn, fostered the establishment of a highly competitive and optimized labor market, which was crucial for driving economic efficiency at scale.
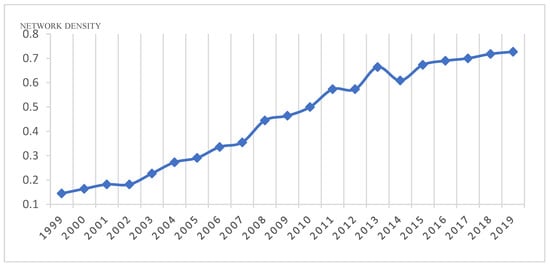
Figure 5.
Changes in network density of the GHMGBA from 1999 to 2019.
These findings strongly provide evidence supporting the conclusion that it has been continuously enhancing its economic scale efficiency, corroborating the accelerating integration process of urban agglomerations.
Based on the average core-degree value, the determination of each city’s position within the core–periphery structure of this urban agglomeration was made by referring to related work [57]. The findings, as presented in Table 2, revealed that, in 1999, a core–periphery structure did not exist within this area. However, as economic interactions between cities and regions intensified, by 2009, this urban agglomeration displayed a certain level of core–periphery structure. Macao, Zhuhai, Zhongshan, and Shenzhen exhibited high core-degrees, indicating their attractiveness for surrounding city resources. Hong Kong, Dongguan, and Foshan occupied a semi-core position, primarily serving as intermediaries for resource exchange. The remaining cities in the area occupied marginal positions, signifying their strong dependence on the core cities or regions. This core–periphery structure persisted through 2019, highlighting the evolving dynamics and hierarchies within the GHMGBA.
Table 2.
Average core-degree value between cities or regions within the GHMGBA in 1999, 2009, and 2019.
More specifically, Macao, Zhuhai, and Zhongshan exhibited high levels of centrality, indicating an enhanced capacity to attract resources from neighboring cities or regions. Guangzhou, Shenzhen, Foshan, Dongguan, and Hong Kong exhibited similar values that suggested their dual roles in resource attraction as well as exportation. In contrast, Jiangmen had relatively low levels of centrality, signifying its primarily peripheral position along with heavy reliance on non-peripheral cities.
4.4. Changes in the Internal Group Structure
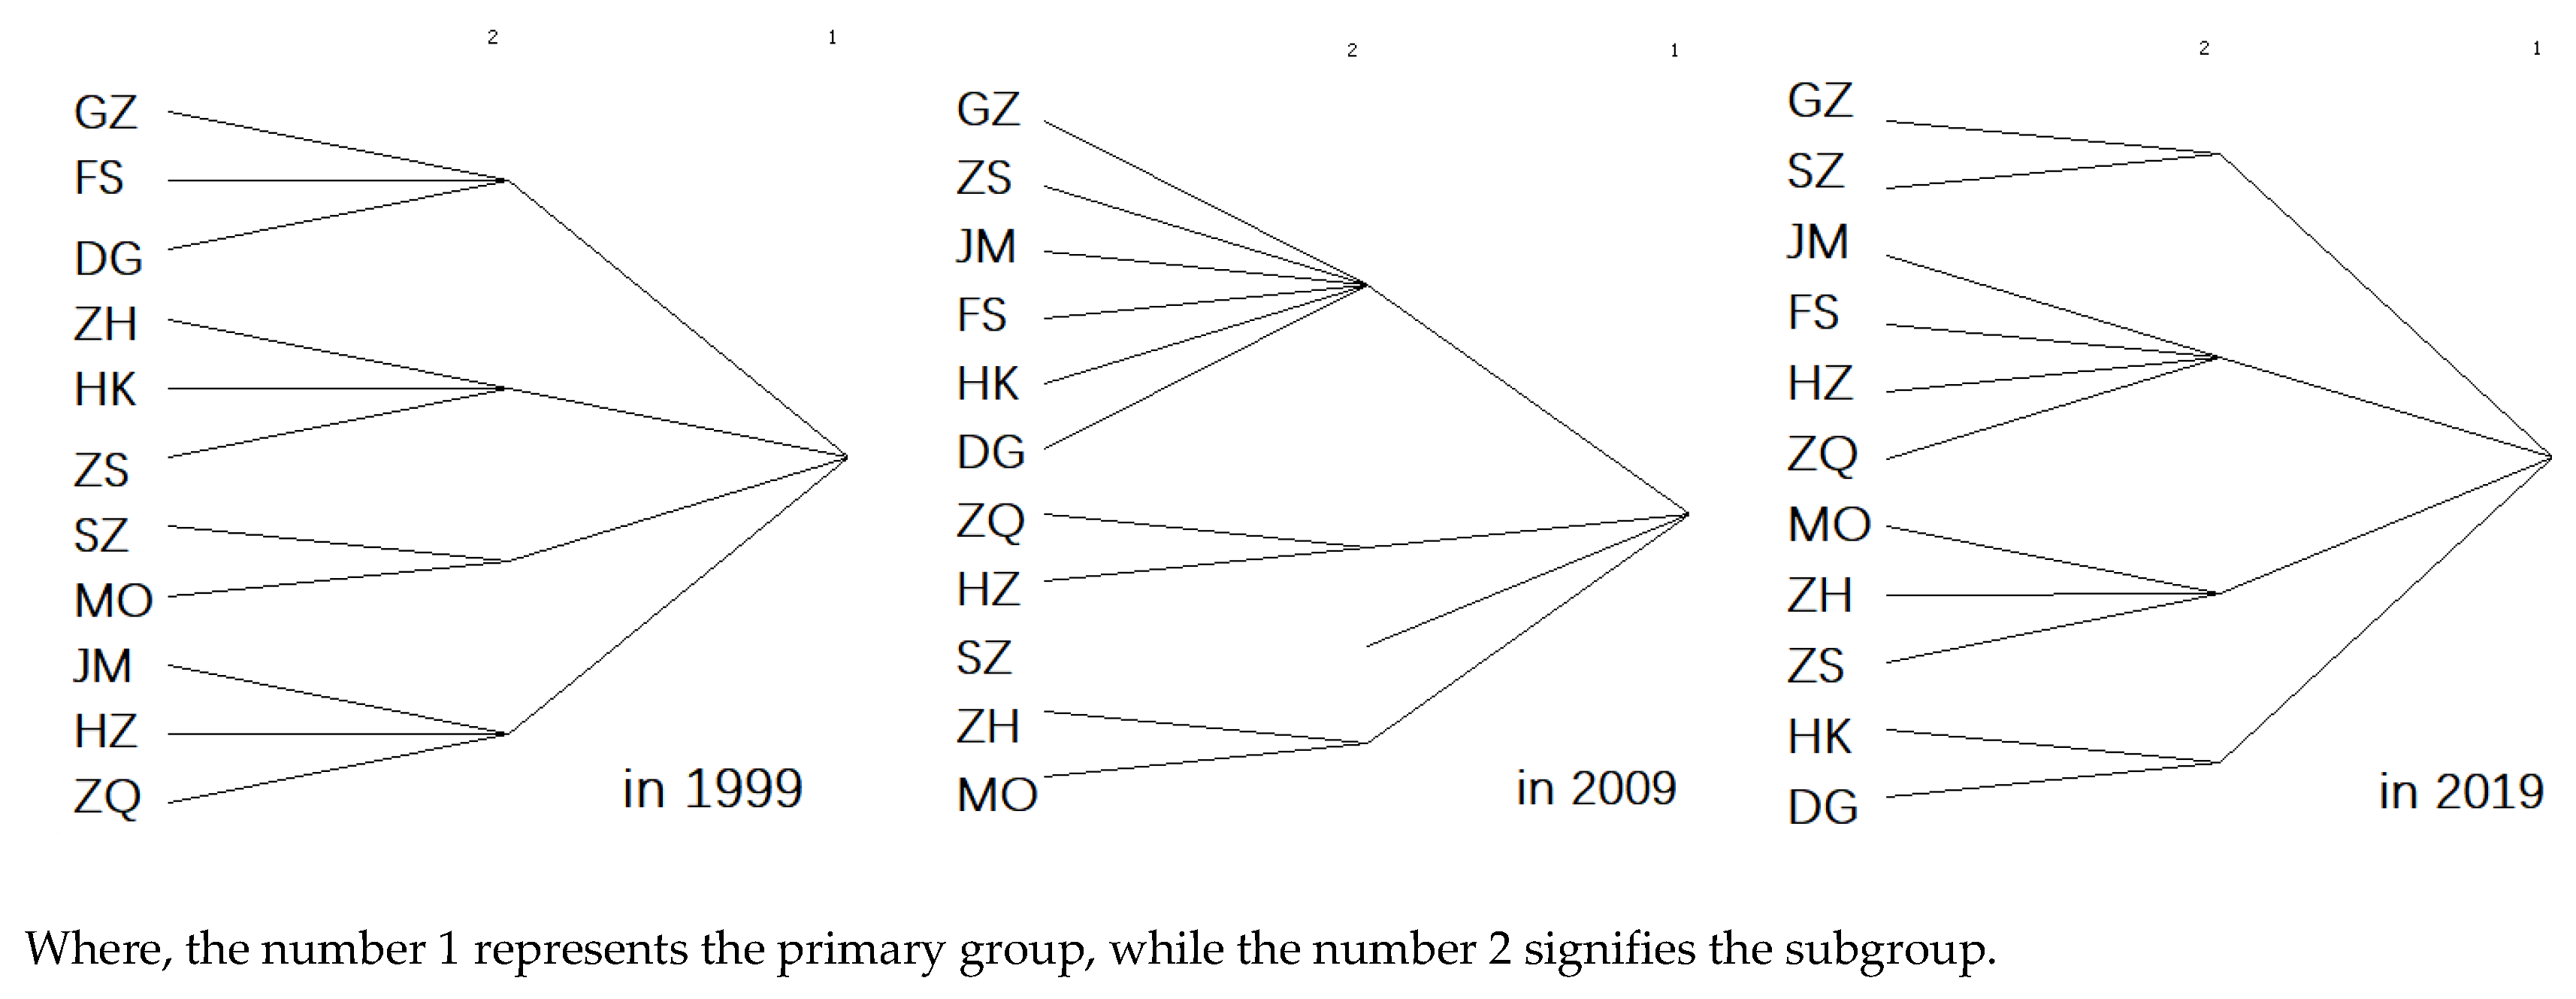
The iterative correlation-convergence method, a technique commonly used for non-overlapping cluster analysis, was employed in this study. The changes in the internal group structure were determined based on the group-density index. These changes are visually represented in Figure 6.
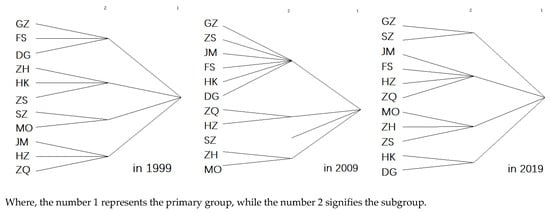
Figure 6.
Subgroups within the GHMGBA in the years 1999, 2009, and 2019.
In 1999, four cohesive subgroups were formed and comprised: (a) Guangzhou, Foshan, and Dongguan; (b) Zhuhai, Hong Kong, and Zhongshan; (c) Shenzhen and Macao; and (d) Huizhou, Jiangmen, and Zhaoqing. Subsequently, notable changes occurred within these subgroups: Shenzhen merged with Huizhou and Zhaoqing to form a new cohesive subgroup; Zhuhai formed a condensed subgroup with Macao; and the remaining cities constituted a distinct subgroup. By 2019, further changes had taken place within the subgroups of the GHMGBA.
The peripheral cities in this area collectively absorbed the resource output from the central cities or regions, fostering economic exchanges and cooperation within cohesive subgroups. This process aligned with the comprehensive development strategy [58]. Over the past two decades, cohesive subgroups have exhibited distinct characteristics. Specifically, Guangzhou and Shenzhen have emerged as regional economic growth poles. By leveraging their capital, information, and other resource advantages, they exerted a strong radiating effect on surrounding areas. Meanwhile, Macao and Zhuhai have established close economic cooperation relations and have become new focal points for regional economic growth.
4.5. Determinants Influencing Economic Integration Development of the GHMGBA
Regional economic linkages are shaped by the spatial and temporal configuration of production factors [59]. In this study, QAP correlation analysis was conducted using the economic-connection-strength matrix of the GHMGBA in 2019, along with the inter-city distance matrix, urban proximity matrix (where adjacent cities are denoted by 1 and nonadjacent cities by 0), urban population difference matrix, and urban national income difference matrix. The results of our analysis are presented in Table 3.
Table 3.
QAP analysis results of economic-linkage strength.
The calculated significant indexes indicate that the intensity of economic linkages was primarily determined by geographic and economic factors, whereas other factors like population exhibited weak correlations. Specifically, inter-city spatial distance emerges as the primary determinant influencing the strength of urban economic linkages. A negative correlation coefficient implies that an increasing geographical distance between cities was associated with a decrease in the strength of their interconnections. Conversely, the proximity of urban geographical space was positively correlated with the strength of urban economic linkage, thus facilitating economic exchanges within the GHMGBA. The condensed subgroups, comprising Guangzhou, Foshan, Zhuhai, and Macao, were all geographically adjacent to each other, further highlighting the importance of spatial proximity. Additionally, the negative coefficient (−0.1187) of the GDP difference matrix indicated that variations in economic development levels across diverse cities and regions will influence intercity economic collaboration. Indeed, the difference in economic development level is one of the important factors affecting the coordinated economic development.
5. Conclusions and Recommendations
5.1. Main Findings
The present study aimed to investigate urban agglomerations by employing the modified gravity model and social network analysis. Specifically, we examined several factors, including economic-contact strength, core–periphery structure, network density, cohesive-subgroup index, and individual indexes such as degree of centrality. Additionally, QAP correlation analysis was utilized to identify various factors influencing the intensity of economic links within this area. Consequently, the following key findings were obtained.
- (1)
- There was a consistent upward trend in the strength of economic linkages within the investigated cities and regions in southern China, particularly focusing on Guangzhou, Shenzhen, Macao, and Zhuhai. Guangzhou and Shenzhen, serving as pivotal economic powerhouses in the Pearl River Delta and beyond, have actively engaged in increasingly frequent economic interactions with their neighboring cities and regions. These interactions have capitalized on their abundant resources in finance, technology, and manufacturing, exerting a substantial radiating influence on adjacent areas and fostering regional economic integration. Simultaneously, Macao and Zhuhai have maintained a high degree of economic interconnectedness. Under the framework of initiatives like the Greater Bay Area Development Plan, they have further enhanced their mutual connections through deepened cooperation and complementary strengths. Other peripheral cities and regions have increasingly strengthened their economic links with these core cities or regions, capitalizing on factors such as industrial transfers from Guangzhou and Shenzhen, access to their technological spillovers, or leveraging the unique policy advantages and international gateway status of Macao and Zhuhai. In this process, certain peripheral cities have the potential to emerge as novel centers for regional economic expansion.
- (2)
- The GHMGBA has undergone a significant transformation, resulting in a novel configuration. This new setup is characterized by core cities taking the lead, with surrounding regions developing in harmony and mutually supporting each other. This structural evolution is exemplified by the increase in network connectivity metrics, indicating heightened interconnectedness among cities within the region. This interconnectedness encompasses various aspects such as transportation networks, information flows, capital circulation, technology exchange, and talent mobility, ultimately forging an integrated regional economy. Concurrently, the average coreness indicators demonstrated an increasing centrality and impact of each city within the region. Notably, core cities have assumed a pivotal role in consolidating cutting-edge resources, spearheading industrial advancement, and providing services to adjacent areas. Furthermore, as cities or regions within this area continued to define their distinct positions and complementary roles, each city could leverage its unique strengths and advantages to emerge as a focal point of growth in specific sectors.
- (3)
- The GHMGBA has emerged as a complex economic landscape, marked by the coexistence and mutual influence of multiple metropolitan centers. The convergence of critical economic indicators among the four core cities—Guangzhou, Shenzhen, Hong Kong, and Macao—are testament to their pivotal roles within the regional economic network. These cities function as resource hubs, efficiently absorbing external resources and channeling developmental momentum to surrounding areas, thereby constituting a bidirectional and interactive cycle of resource flows. Through extensive economic integration and intense inter-city interactions, they have collectively established a multi-layered and diversified socio-economic network. The network fosters a dynamic interplay between competition and collaboration, resulting in synergistic effects that have significantly enhanced the overall competitiveness of the economic system in this area.
- (4)
- Geospatial and economic elements constitute fundamental factors that exert influence on the strength of economic linkages. Geographical space configuration, including location, natural conditions, and resource distribution, directly influenced the advantages of individual cities or regions. These attributes shaped unique industrial structures and economic patterns that defined their roles within regional economic networks. Economic development levels served as another crucial determinant of economic linkage strength. The level of economic development is crucial, as advanced economies attract more foreign investment and quality resources due to their superior productive capacities, mature industrial chains, and higher openness. These cities also stimulated economic growth in neighboring areas through radiation effects. Moreover, innovation capabilities in economically advanced regions enhance their attractiveness for technological research, development, and high-end services, strengthening inter-regional economic connections. Transportation accessibility played a crucial role in connecting geographical space to economic activities, significantly impacting the strength of regional economic linkages. Efficient transportation networks could effectively reduce costs and facilitate the smooth movement of goods, people, and information, thereby strengthening regional economic linkages. Geographic proximity often leads to closer economic connections between neighboring entities. Additionally, the core–periphery structure resulting from variations in economic factors not only highlighted regional economic unevenness but also showcased the dynamic bargaining and collaborative evolution among cities and regions during regional economic integration.
5.2. Policy Recommendations
The findings supported the notion that enhancing exchanges and cooperation among urban agglomerations was a critical strategy for fostering sustainable and steady development. Based on these conclusions, this paper presents the following recommendations.
First and foremost, it is imperative to enhance exchanges and cooperation in this area. Given the pivotal role of core-position areas, they could further facilitate the cross-regional flow and integration of innovative factors such as talent, information, technology, and capital. The degree of economic interdependence between cities was inversely proportional to their physical distance, as demonstrated by Equation (1). Therefore, improving the level of intercity rail transit connectivity can reduce the economic distance and strengthen the economic linkages between cities. Enhancing regional road-network density between cities and regions can strengthen the cohesion of an urban agglomeration’s economic linkages [60], thereby facilitating increased exchange rates of production factors and promoting benefits from economic aggregation. Specifically, infrastructure projects such as the Hong Kong–Zhuhai–Macao Bridge, the Guangzhou–Shenzhen–Hong Kong High-Speed Railway, and the Shenzhen–Zhongshan Bridge have significantly enhanced both maritime and terrestrial transportation within this area [61]. As a result, there has been a continuous improvement in economic interconnectedness among these cities and regions. This will enhance the efficiency of comprehensive resource utilization and play a pivotal role in driving East–West economic growth in this area. Hong Kong and Macao should continue leveraging their international influence to effectively contribute to advanced technology cooperation, international finance, external exchanges, and other domains. Through collaborating with those cities and regions, they can expedite the incubation and cultivation of emerging industries.
Moreover, it is imperative to actively strengthen the economic development of the sub-core cities and fully harness their regional advantages within the economic network. The sub-core cities, namely Foshan, Dongguan, Zhuhai, and Zhongshan, should effectively leverage their geographical proximity to the core cities or regions through collaborative efforts and enhanced regional interactions. Therefore, to enhance resource flow between neighboring cities and regions, it is crucial to not only focus on the construction of high-speed railways and inter-city railways but also reinforce the integration and connectivity among metro lines in major cities and regions. Furthermore, core cities or regions should function as pivotal hubs for this purpose. For instance, Shenzhen has strategically planned multiple cross-regional subways to ensure seamless connections with Dongguan. Foshan, located in close proximity to Guangzhou, has the potential to proactively foster advanced manufacturing clusters and share urban functions, leveraging its strategic geographical position. The strategic location of Dongguan as a transportation hub adjacent to Shenzhen provides unique advantages for its economic growth in this area. Zhuhai and Macao should capitalize on the opportunity presented by the establishment of the Hengqin Guangdong–Macao Deep Cooperation Zone to foster diversified development within their cohesive subgroup’s internal economy through distinctive financial mechanisms, cross-border trade facilitation, and cultural initiatives.
Finally, future policies should prioritize the promotion of coordinated development among them, while concurrently enhancing the core of the urban transportation network. Policies should consistently intensify their support for the development and modernization of transportation networks, which encompasses upgrades to expressways, railways, seaports, and airports. Furthermore, these policies should also ensure the unimpeded mobility of crucial production factors such as human capital, financial resources, and information within the GHMGBA, as they are pivotal for sustaining economic growth and bolstering regional competitiveness.
Consequently, aligning with the strategic urban development blueprint and the spatial configuration framework presented in the Regional Planning and Development Outline, it becomes imperative for all cities and regions to continually enhance their economic development capabilities. This necessitates proactive engagement in collective initiatives aimed at economic construction, leveraging inter-regional cooperation mechanisms, and capitalizing on complementary economic strengths.
Author Contributions
Conceptualization, G.W.; Data curation, G.W. and Z.M.; Investigation, B.Y.; Methodology, R.L. and G.W.; Project administration, R.L.; Resources, Q.W.; Software, Z.M.; Supervision, Q.W.; Visualization, R.L. and Q.W.; Writing—original draft, R.L.; Writing—review & editing, B.Y. All authors have read and agreed to the published version of the manuscript.
Funding
This research was supported by the Ministry of Education of China (MOE) Project of Humanities and Social Sciences (No. 20YJCZH074), Shenzhen Federation of Social Sciences (SFSS) Project of Humanities and Social Sciences (No. SZ2020C012), the Social Science Foundation of Guangdong Province (No. GD24YGL26), the Shenzhen Polytechnic University Research Fund (No. 6024310018K),and the National Natural Science Foundation of China (No. 52078305).
Data Availability Statement
The raw data supporting the conclusions of this article will be made available by the authors on request.
Conflicts of Interest
The authors declare that they have no known competing financial interests or personal relationships that could have appeared to influence the work reported in this paper.
Appendix A
References
- Gottmann, J. Megalopolis or the urbanization of the northeastern seaboard. Econo. Geogr. 1957, 33, 189–200. [Google Scholar] [CrossRef]
- Abed, J.; Kaysi, I. Identifying urban boundaries: Application of remote sensing and geographic information system technologies. Can. J. Civ. Eng. 2003, 30, 992–999. [Google Scholar] [CrossRef]
- He, X.; Zhu, Y.; Chang, P.; Zhou, C. Using tencent user location data to modify night-time light data for delineating urban agglomeration boundaries. Front. Env. Sci. 2022, 10, 860365. [Google Scholar] [CrossRef]
- Fang, C.; Liu, X. Comprehensive measurement for carrying capacity of resources and environment of city clusters in central China. Chin. Geogr. Sci. 2010, 20, 281–288. [Google Scholar] [CrossRef]
- Ye, C.; Zhu, J.; Li, S.; Yang, S.; Chen, M. Assessment and analysis of regional economic collaborative development within an urban agglomeration: Yangtze River Delta as a case study. Habitat Int. 2019, 83, 20–29. [Google Scholar] [CrossRef]
- Jacobs, A.J. The city as the nexus model: Bridging the state, market, societal, and geospatial contexts. Cities 2016, 51, 84–95. [Google Scholar] [CrossRef]
- Qureshi, S.; Haase, D.; Coles, R. The theorized urban gradient method: A conceptual framework for socio-ecological sampling in complex urban agglomerations. Ecol. Indic. 2014, 36, 100–110. [Google Scholar] [CrossRef]
- Cao, Z.; Derudder, B.; Peng, Z. Comparing the physical, functional and knowledge integration of the Yangtze River Delta city-region through the lens of inter-city networks. Cities 2018, 82, 119–126. [Google Scholar] [CrossRef]
- Zhang, W.; Derudder, B.; Wang, J.; Shen, W. Regionalization in the Yangtze River Delta, China, from the perspective of inter-city daily mobility. Reg. Stud. 2018, 52, 528–541. [Google Scholar] [CrossRef]
- Wahnschafft, R.; Wei, F. Urban China: Toward efficient, inclusive, and sustainable urbanization. Nat. Resour. Forum 2015, 39, 151–152. [Google Scholar] [CrossRef]
- Wang, H.; Zhang, B.; Liu, Y.; Liu, Y.; Xu, S.; Zhao, Y.; Chen, Y.; Hong, S. Urban expansion patterns and their driving forces based on the center of gravity-GTWR model: A case study of the Beijing-Tianjin-Hebei urban agglomeration. J. Geogr. Sci. 2020, 30, 297–318. [Google Scholar] [CrossRef]
- Zhou, D.; Zhang, L.; Wang, R. Administrative-hierarchical urban land expansion in China: Urban agglomeration in the Yangtze River Delta. J. Urban Plan. Dev. 2018, 144, 5018018. [Google Scholar] [CrossRef]
- Lu, H.; Zhang, M.; Sun, W.; Li, W. Expansion analysis of Yangtze River Delta urban agglomeration using DMSP/OLS nighttime light imagery for 1993 to 2012. ISPRS Int. J. Geo. Inf. 2018, 7, 52. [Google Scholar] [CrossRef]
- Yan, Y.; Ju, H.; Zhang, S.; Jiang, W. Spatiotemporal patterns and driving forces of urban expansion in coastal areas: A study on urban agglomeration in the Pearl River Delta, China. Sustainability 2020, 12, 191. [Google Scholar] [CrossRef]
- Deng, H.; Li, H. Characteristics of the spatiotemporal changes in urban agglomeration in the Guangdong-Hong Kong-Macao greater bay area, China. J. Urban Plan. Dev. 2021, 147, 4021042. [Google Scholar] [CrossRef]
- Li, T.; Zheng, X.; Zhang, C.; Wang, R.; Liu, J. Mining spatial correlation patterns of the urban functional areas in urban agglomeration: A case study of four typical urban agglomerations in China. Land 2022, 11, 870. [Google Scholar] [CrossRef]
- Li, R.; Li, S.; Xie, Z. Integration development of urban agglomeration in central Liaoning, China, by trajectory gravity model. ISPRS Int. J. Geo. Inf. 2021, 10, 698. [Google Scholar] [CrossRef]
- Wu, J.; Peng, Z.; Zhang, X.; Xu, Y.; Peng, J. Delineating urban hinterland boundaries in the pearl river delta: An approach integrating toponym co-occurrence with field strength model. Cities 2020, 96, 102457. [Google Scholar] [CrossRef]
- Tong, H.; Shi, P.; Luo, J.; Liu, X. The structure and pattern of urban network in the Lanzhou-Xining urban agglomeration. Chin. Geogr. Sci. 2020, 30, 59–74. [Google Scholar] [CrossRef]
- Chai, D.; Zhang, D.; Sun, Y.; Yang, S. Research on the city network structure in the Yellow River basin in China based on two-way time distance gravity model and social network analysis method. Complexity 2020, 6680954. [Google Scholar] [CrossRef]
- Chai, D.; Du, J.; Yu, Z.; Zhang, D. City network mining in China’s Yangtze river economic belt based on “two-way time distance” modified gravity model and social network analysis. Front. Phys. 2022, 10, 1018993. [Google Scholar] [CrossRef]
- Qi, G.; Shi, W.; Lin, K.; Yuen, K.F.; Xiao, Y. Spatial spillover effects of logistics infrastructure on regional development: Evidence from China. Transp. Res. Part A Policy Pract. 2020, 135, 96–114. [Google Scholar] [CrossRef]
- Shen, G. Reverse-fitting the gravity model to inter-city airline passenger flows by an algebraic simplification. J. Transp. Geogr. 2004, 12, 219–234. [Google Scholar] [CrossRef]
- Yang, X.; Derudder, B.; Taylor, P.J.; Ni, P.; Shen, W. Asymmetric global network connectivities in the world city network, 2013. Cities 2017, 60, 84–90. [Google Scholar] [CrossRef]
- Karemera, D.; Oguledo, V.I.; Davis, B. A gravity model analysis of international migration to north America. Appl. Econ. 2000, 32, 1745–1755. [Google Scholar] [CrossRef]
- Muenter, A.; Volgmann, K. Polycentric regions: Proposals for a new typology and terminology. Urban Stud. 2021, 58, 677–695. [Google Scholar] [CrossRef]
- Jun, M. The effects of polycentric evolution on commute times in a polycentric compact city: A case of the Seoul Metropolitan Area. Cities 2020, 98, 102587. [Google Scholar] [CrossRef]
- Castells-Quintana, D.; Royuela, V. Spatially blind policies? Analysing agglomeration economies and European investment bank funding in European neighboring countries. Ann. Reg. Sci. 2018, 60, 569–589. [Google Scholar] [CrossRef]
- Wang, S.; Gao, S.; Wang, Y. Spatial structure of the urban agglomeration based on space of flows: The study of the Pearl River Delta. Geogr. Res. 2019, 38, 1849–1861. [Google Scholar]
- Yang, H.; Dobruszkes, F.; Wang, J.; Dijst, M.; Witte, P. Comparing China’s urban systems in high-speed railway and airline networks. J. Transp. Geogr. 2018, 68, 233–244. [Google Scholar] [CrossRef]
- Zhang, W.; Derudder, B.; Wang, J.; Shen, W.; Witlox, F. Using location-based social media to chart the patterns of people moving between cities: The case of Weibo-users in the Yangtze River Delta. J. Urban Technol. 2016, 23, 91–111. [Google Scholar] [CrossRef]
- Xiong, Y.; Tang, H.; Xu, T. High-speed railway access pattern and spatial overlap characteristics of the Yellow River Basin urban agglomeration. ISPRS Int. J. Geo. Inf. 2023, 12, 3. [Google Scholar] [CrossRef]
- Hanssens, H.; Derudder, B.; Aelst, S.V.; Witlox, F. Assessing the functional polycentricity of the mega-city-region of central Belgium based on advanced producer service transaction links. Reg. Stud. 2014, 48, 1939–1953. [Google Scholar] [CrossRef]
- Alderson, A.S.; Beckfield, J.; Sprague-Jones, J. Intercity relations and globalization: The evolution of the global urban hierarchy, 1981–2007. Urban Stud. 2010, 47, 1899–1923. [Google Scholar] [CrossRef]
- Przesdzink, F.; Herzog, L.M.; Fiebelkorn, F. Combining stakeholder- and social network- analysis to improve regional nature conservation: A case study from Osnabrück, Germany. Environ. Manag. 2022, 69, 271–287. [Google Scholar] [CrossRef] [PubMed]
- Chuang, M.; Chou, W.; Chang, C.; Chou, W. Examining the key drivers for regional revitalization based upon social network analysis: A case study of Badouzi in Taiwan. Mar. Policy 2021, 133, 104754. [Google Scholar] [CrossRef]
- Lu, D.; Tian, Y.; Liu, V.Y.; Zhang, Y. The performance of the smart cities in China: A comparative study by means of self-organizing maps and social networks analysis. Sustainability 2015, 7, 7604–7621. [Google Scholar] [CrossRef]
- Fang, C.; Yu, D. Urban agglomeration: An evolving concept of an emerging phenomenon. Landsc. Urban Plan 2017, 162, 126–136. [Google Scholar] [CrossRef]
- Butsch, C.; Kumar, S.; Wagner, P.D.; Kroll, M.; Kantakumar, L.N.; Bharucha, E.; Schneider, K.; Kraas, F. Growing ‘smart’? Urbanization processes in the Pune urban agglomeration. Sustainability 2017, 9, 2335. [Google Scholar] [CrossRef]
- Jiang, Y.; Zhu, Y.; Tian, Y. Measuring the urban sprawl of a mega-urban agglomeration area based on multi-dimensions with a mechanical equilibrium model: A case study of the Yangtze River Delta, China. Land 2023, 12, 1548. [Google Scholar] [CrossRef]
- Sevtsuk, A. Location and agglomeration: The distribution of retail and food businesses in dense urban environments. J. Plan. Educ. Res. 2014, 34, 374–393. [Google Scholar] [CrossRef]
- Zhang, T.; Sun, B.; Li, W. The economic performance of urban structure: From the perspective of Polycentricity and Monocentricity. Cities 2017, 68, 18–24. [Google Scholar] [CrossRef]
- Goddard, J.B.; Brian, J.L.B.; Frank, E.H. Geographic perspectives on urban systems. Geogr. J. 1971, 137, 103. [Google Scholar] [CrossRef]
- Friedmann, J.R.P. Urbanization, Planning, and National Development; Sage Publications: Beverly Hills, CA, USA, 1972; p. 351. [Google Scholar]
- Smith, T.R.; Papageorgiou, G.J. Spatial externalities and the stability of interacting populations near the center of a large area. J. Regional Sci. 2010, 22, 1–18. [Google Scholar] [CrossRef] [PubMed]
- China National Bureau of Statistics, 2022 China Statistical Yearbook. Available online: https://www.stats.gov.cn/sj/ndsj/2022/indexch.htm (accessed on 30 September 2022).
- Gan, C.; Voda, M.; Wang, K.; Chen, L.; Ye, J. 2021. Spatial network structure of the tourism economy in urban agglomeration: A social network analysis. J. Hosp. Tour. Manag. 2022, 47, 124–133. [Google Scholar] [CrossRef]
- Wang, Y.; An, L.; Chen, H.; Zhao, Y. Spatial correlation and influencing factors of tourism eco-efficiency in the urban agglomeration of the Yangtze River Delta based on social network analysis. Land 2022, 11, 2089. [Google Scholar] [CrossRef]
- Paelinck, J. On aggregation in spatial econometric modelling. J. Geograph. Syst. 2000, 2, 157–165. [Google Scholar] [CrossRef]
- Mulligan, G.F. Agglomeration and central place theory: A review of the literature. Internat. Reg. Sci. Rev. 1984, 9, 1–42. [Google Scholar] [CrossRef]
- Yang, H.; Fu, M.; Wang, L.; Tang, F. Mixed land use evaluation and its impact on housing prices in beijing based on multi-source big data. Land 2021, 10, 1103. [Google Scholar] [CrossRef]
- Burt, R.S.; Martin, K.; Stefano, T. Social network analysis: Foundations and frontiers on advantage. Annu. Rev. psychol 2013, 64, 527–547. [Google Scholar] [CrossRef]
- Singh, J.N.; Mediratta, R.S. Simulation and analysis of quadratic assignment problems (QAP) using ant colony optimization. Arya Bhatta J. Math. Inf. 2022, 12, 25–30. [Google Scholar]
- Cai, M.; Wang, W.; Cui, Y.; Stanley, H.E. Multiplex network analysis of employee performance and employee social relationships. Phys. A 2018, 490, 1–12. [Google Scholar] [CrossRef]
- Marqués-Sánchez, P.; Martínez-Fernández, M.C.; Leirós-Rodríguez, R.; Rodríguez-Nogueira, Ó.; Fernández-Martínez, E.; Benítez-Andrades, J.A. Leadership and contagion by COVID-19 among residence hall students: A social network analysis approach. Soc. Netw. 2023, 73, 80–88. [Google Scholar] [CrossRef] [PubMed]
- Guan, Y.; Bai, J.; Tian, X.; Wang, X.; Wang, C.; Zhang, Y.; Chen, B.; Liu, G. Social network analysis and application for ecosystem service perceptions by stakeholders for coastal wetland conservation. J. Clean. Prod. 2022, 371, 133596. [Google Scholar] [CrossRef]
- Bai, C.; Zhou, L.; Xia, M.; Feng, C. Analysis of the spatial association network structure of China’s transportation carbon emissions and its driving factors. J. Environ. Manag. 2020, 253, 109765. [Google Scholar] [CrossRef] [PubMed]
- Wei, G.; Li, X.; Yu, M.; Lu, G.; Chen, Z. Influence mechanism of transportation integration on industrial agglomeration in urban agglomeration theory-taking the Yangtze River Delta urban agglomeration as an example. Appl. Sci. 2022, 12, 8369. [Google Scholar] [CrossRef]
- Yang, R.; Che, T.; Lai, F. The impacts of production linkages on cross-regional collaborative innovations: The role of inter-regional network capital. Technol. Forecast. Soc. 2021, 170, 120905. [Google Scholar] [CrossRef]
- Zeng, C.; Song, Y.; Cai, D.; Hu, P.; Cui, H.; Yang, J.; Zhang, H. Exploration on the spatial spillover effect of infrastructure network on urbanization: A case study in Wuhan urban agglomeration. Sustain. Cities Soc. 2019, 47, 101476. [Google Scholar] [CrossRef]
- Avgerou, C. The informational city: Information technology economic restructuring and the urban regional process. Eur. J. Inform. Syst. 1991, 1, 76–77. [Google Scholar] [CrossRef]
Disclaimer/Publisher’s Note: The statements, opinions and data contained in all publications are solely those of the individual author(s) and contributor(s) and not of MDPI and/or the editor(s). MDPI and/or the editor(s) disclaim responsibility for any injury to people or property resulting from any ideas, methods, instructions or products referred to in the content. |
© 2024 by the authors. Licensee MDPI, Basel, Switzerland. This article is an open access article distributed under the terms and conditions of the Creative Commons Attribution (CC BY) license (https://creativecommons.org/licenses/by/4.0/).