
Experimental Evaluation of Noise Exposure Effects on Subjective Perceptions and Cognitive Performance
by
 , and
, and
Jie Zhang
1,3,†, 
Liping Pang
2,†,
Chenyuan Yang
2,
Yurong Fan
2,
Bingxu Zhao
1,2 and
Xiaodong Cao
1,2,* 1
Tianmushan Laboratory, Hangzhou 311115, China
2
School of Aeronautic Science and Engineering, Beihang University, Beijing 100191, China
3
Department of Industrial Engineering, Tsinghua University, Beijing 100084, China
*
Author to whom correspondence should be addressed.
†
These authors contributed equally to this work.
Buildings 2024, 14(4), 1100; https://doi.org/10.3390/buildings14041100
Submission received: 11 March 2024
/
Revised: 6 April 2024
/
Accepted: 9 April 2024
/
Published: 15 April 2024
(This article belongs to the Special Issue Effect of Indoor Environment Quality on Human Comfort)
Abstract
:Individuals exposed to elevated noise levels experience heightened emotional intensity, leading to increased cognitive disruption and a higher likelihood of accidents. This study seeks to investigate the impact of noise exposure on human cognitive performance, and the moderating role of emotion. Twelve healthy male college-age students underwent exposure to three noise conditions, each characterized by different sound pressure levels and sharpness. Each condition included an initial acoustic/thermal adaption period lasting approximately 40 min, followed by intermittent questionnaire tests and a battery of computerized cognitive tests. Statistical analysis revealed that reducing noise levels proved advantageous, enhancing perceived sound quality, positive emotions, and auditory perception abilities, while concurrently reducing false alerts and accelerating execution speed. Many of these effects were found to be counteracted by elevated sharpness. Correlation analyses and partial least squares structural equation modeling (PLS-SEM) results suggested that human emotions mediate the relationship between noise exposure and cognitive performance. The potential underlying mechanism suggests that negative feelings towards noise contribute to poor emotional states, subsequently influencing cognitive processes and impairing executive function. The outcomes of this study provide valuable insights into the mechanism of noise exposure and its effects on human cognition and subjective perceptions.
1. Introduction
With the rapid development of economies, industrialization, and urbanization, noise pollution is becoming increasingly serious and has been recognized as a major public health hazard. As estimated in the European Union alone, at least 20% of the urban population are affected by the harmful effects of road traffic noise [1]. This proportion may be higher in many large and populous countries. Therefore, many research studies have been conducted to investigate the effect of noise exposure on humans and how it works [1,2,3,4,5,6,7].
1.1. Noise Exposure and Human Health
As suggested by reports from the World Health Organization (WHO) [1,8] and the European Environment Agency (EEA) [1,9], noise exposure is a major public health threat affecting both physical and mental health. Many studies have focused on the relationship between noise exposure and people’s health [10,11,12,13]. A common health problem is noise-induced hearing loss. As is known, increased noise exposure (via higher sound levels or longer exposure) raises the risk of noise injury, which may compromise hearing or other suprathreshold sound processing abilities [14]. Most people repeatedly exposed to more than 105 dBA will have permanent hearing loss to some extent [15], and pain may even be felt in the ear in the presence of noise with a level above 120 dB [16]. In addition to hearing loss, noise exposure has been implicated in a wide range of major noise-associated non-communicable diseases, including cardiovascular disease, metabolic disease, cancer, and respiratory disease [1]. Hahad et al. reviewed the cerebral consequences of environmental noise exposure in detail, suggesting that noise exposure could be an important but largely unrecognized risk factor for neuropsychiatric outcomes [1,4]. In addition, exposure to noise can also cause sleep disturbances and annoyance, which are proposed as key drivers of noise-associated non-communicable disease onset and progression [1,17].
1.2. Noise Exposure and Human Cognitive Performance
Noise, a well-known stressor, is considered to be cognitively taxing, thus impairing operators’ efficiency in some tasks. In laboratory studies, a psychological test is often used as a tool to measure human cognitive performance and examine noise effects. Monteiro et al. [18] studied the effect of noise type on human attention and memory, finding that alarm sounds impaired performance. Now it is generally accepted that noise containing discernible speech compared to noise containing no discernible speech has been shown to be detrimental to performance [19]. In particular, the immediate serial recall of visually presented verbal items is reliably impaired by task-irrelevant sounds, both in adults and children [20,21,22].
The findings on the effects of a high noise level on cognitive performance showed a disappointing lack of consistency [23]. For working memory ability, Molesworth et al. [5,24,25] found 75 dBA of broadband noise adversely affected performance on a cued-recall and free-recall memory task, but not on a digit span task. Herweg and Bunzeck [7] found 70 dB of continuous white noise decreased working memory accuracy on a visual change detection task when noise was presented during the inter-stimulus delay, but improved the performance of a visual recognition memory task. Schlittmeier et al. [26] reported no significant effects of sound levels between 55 dBA and 35 dBA on recall test performance.
The impact of noise level on human vigilance was also widely investigated due to the high vigilance requirement for operators in automatic human–machine systems. Yang et al. [27] reported that higher noise sound pressure levels impair human vigilance, which was reflected in a lower mean sample entropy of heart rate variability and worse performance on a psychomotor vigilance test. Mohammad et al. [28] found that mental workload and visual/auditory attention were significantly reduced when the participants were exposed to noise at a level of 95 dBA. Similarly, Button et al. [29] indicated that response times to alertness tasks for participants exposed to 95 dBA of noise were significantly longer than for those exposed to 53 dBA of noise. There was also some evidence indicating that these effects occurred at much lower levels. For example, Irgens et al. [30] assessed the attention ability of 84 naval personnel exposed to noise using the Posner cue–target paradigm, and the results showed that the performance of visual attention declined significantly for operators exposed to sound levels >85.2 dBA compared to those exposed to <72.6 dBA. In addition, operators who engage in monotonous and routine work for a long time may be more vigilant when some appropriate noise is introduced [31].
Other cognitive abilities were also assessed in the research on noise effects. For example, Nassiri et al. [32] reported that noise significantly affected speed response, but did not affect error response. Ke et al. [33] revealed the negative correlation between noise and the task execution of 27 subjects. Also, many research studies have discussed the effect of noise on human psychological and physiological responses. For example, Zalejska-Jonsson [34] analyzed the perceived acoustic quality and effect on occupants’ satisfaction of green and conventional residential buildings. Mohammadi et al. [35] reported the dynamic electroencephalogram changes during exposure to noise at different levels of loudness and sharpness. Yu et al. [36] discussed the effect of road and railway sound on psychological and physiological responses in an office environment. It is worth noting that there are many aggravating risk factors of noise-induced health effects, such as age, gender, workload, and exposure duration [37]. Abbasi et al. [38] examined the gender differences in cognitive performance and psychophysiological responses during exposure to noise under tasks with different workloads.
1.3. Research Motivation and Objectives
Current scholars have a relatively consistent view on the impact of noise exposure on human health. However, the studies about the effect of noise on cognitive performance show a disappointing lack of consistency in results, which may be due to various intervening factors, such as test type. The underlying mechanism of the effect of noise on cognitive performance is also not fully understood. Actually, regardless of test type, execution of task can be described using the information processing theory in psychology. Emotion has long been proved to have a significant impact on an individual’s cognition (such as perception, attention, and short memory). Therefore, it is essential to study and explain the effects of noise on human emotion and the cognition process.
Although the most important factor in noise effects is the sound level, according to the literature [18], previous studies showed that noise treatments have further relevant characteristics to consider, instead of only pursuing a reduction of the acoustical energy emitted by a product. So, it is meaningful to study noise effects in the multi-dimensional perspective, such as from the perspective of sound quality, as proposed by Blauert [39,40], referring to the adequacy of a sound in the context of a specific technical goal and/or task [41].
To address the above issues, this study aims to investigate how high intensity noise affects human cognitive performance (especially executive function) and how human emotion moderates this effect. Our research design also offered the opportunity to examine the interaction effect of exposure time, which should be taken into account when people are exposed to an acoustic environment with poor sound quality. This paper attempts to expand the current evidence on the effects of noise on human performance, and helps to provide some practical implications for noise control from a people-centered perspective.
The remainder of this study is organized as follows. Section 2 addresses the research methods and experimental materials used in the study, while Section 3 presents the statistical results on the effects of noise on perceived sound quality, emotions, and cognitive performance. Section 4 discusses these important findings by comparing them with those of previous studies, establishing the PLS-SEM model to explore the potential mechanism of the effects of noise, and emphasizing the limitations of this study. This is followed by the conclusions and practical implications of the study, in Section 5.
2. Materials and Methods
2.1. Study Design
The within-subject design was employed to address the research questions. The noise characteristics and exposure time were the repeated measure factors, with three levels and five levels, respectively. The dependent variables included emotion and perceived sound quality, measured by subjective questionnaires, and the performance metrics of cognitive tests selected based on human information processing. For cognition and emotion, only noise effects were examined, because the corresponding tests were performed once under each noise condition. For the perceived sound quality, the effects of noise, exposure time, and noise × exposure time were examined by analyzing changes between the three exposure conditions and the five sessions (i.e., repeated measurements). The underlying mechanism of noise effects was further explored using partial least squares structural equation modeling (PLS-SEM). The research protocol was approved by the Institute Review Board (IRB) of Beihang University.
2.2. Subjects
A power analysis was performed to estimate the minimum number of subjects that would have to participate in the experiment to achieve significant differences in the dependent variables at the (p < 0.05) level [42]. Assuming a within-subject design with repeated measures, a statistical power of 0.8 in general, an effect size of 0.4, the correlation between measures as 0.5, and a non-sphericity correction of 1, the minimum number of subjects required was estimated with G*power 3.1 software as being twelve people. In addition, it is known that individual characteristics (such as age, sex, and educational background) influence human cognition and mediate the effects of environmental quality on cognitive performance. Therefore, twelve healthy male college-age students aged from 22 to 30 years (average = 23.250, SD = 2.314) were recruited for this study. All of them signed informed consent forms. They reported no known hearing deficit, no color blindness that could cause difficulty with any task stimuli, and no prior experience with any task materials involved in the experiment. The subjects were asked to obtain sufficient sleep and refrain from drinking alcohol or caffeinated beverages before and during the experiments. All of them completed the tests conscientiously, and received compensation after the experiments.
2.3. Materials and Stimuli
2.3.1. Noise Exposure Conditions
The studied noises were recorded at the same industrial workplace, with different values of A-weighted sound pressure level (SPL) and sharpness. The A-weighted SPL reflects the intensity of a sound, and the sharpness is a measure of the high frequency content of a sound. Actually, loudness can also be used to describe the sound intensity, and it has strong correlation with A-weighted SPL. In comparison, the A-weighted SPL was finally chosen because its conclusions may be more comparable with previous studies.
The three conditions were as follows: (1) the noise SPL at the current occupational limit of 85 dBA (referred to as N85-S1); (2) noise exposure with a SPL of 80 dBA (N80-S1); (3) a noise (N75-S2) condition with a SPL of 75 dBA but a twice-higher sharpness than N85-S1 and N80-S1. The analyses between N85-S1 and N80-S1 could reveal the effect of noise from 85 dBA to 80 dBA on human responses. The analyses between N75-S2 and the other conditions could reveal the comprehensive effect caused by both A-weighted SPL and sharpness. During the experiments, the continuous noises were generated using the OS003A omni sound source that was located in front of the seated participant, as shown in Figure 1. An Aihua AWA5636 sound level meter and a Coinv INV9206 acoustic sensor were installed near the participant’s ear to measure the sound signal during experiments. These sensors were calibrated prior to every use with the HS6020 acoustic calibrator. The room acoustics, such as the space typologies and the position of source and receiver, remained unchanged during the experiments [27,43].
To avoid the confounding effect of thermal discomfort on participants, a METREL MI6401 indoor environment quality tester was used during experiments to monitor the air temperature, relative humidity, air velocity, and black global temperature in the working area. The ASHRAE 7-point scale was used to measure the thermal sensations of participants.
The A-weighted SPL perceived by subjects during the experiments was exported directly by the sound level meter, and the sharpness of noise was calculated using the Zwicker method. As shown in Table 1, the actual noise exposures received by subjects during experiments were basically identical to those in the intended design, and the indoor thermal environment was proven to be neutral, whether using the predicted mean vote (PMV) or the subjective ratings. It is worth noting that the PMV was estimated as between −0.5 and 0.5, assuming the metabolic rate of a human body was 90 W/m2 (light manual work) and the clothing insulation of participants was 0.9 (underpants, shirt, trousers, smock, socks, and shoes) [44,45]. Therefore, the effects observed in this study could be primarily attributed to the varying noise exposures rather than to other confounding environmental factors.
2.3.2. Perceived Sound Quality
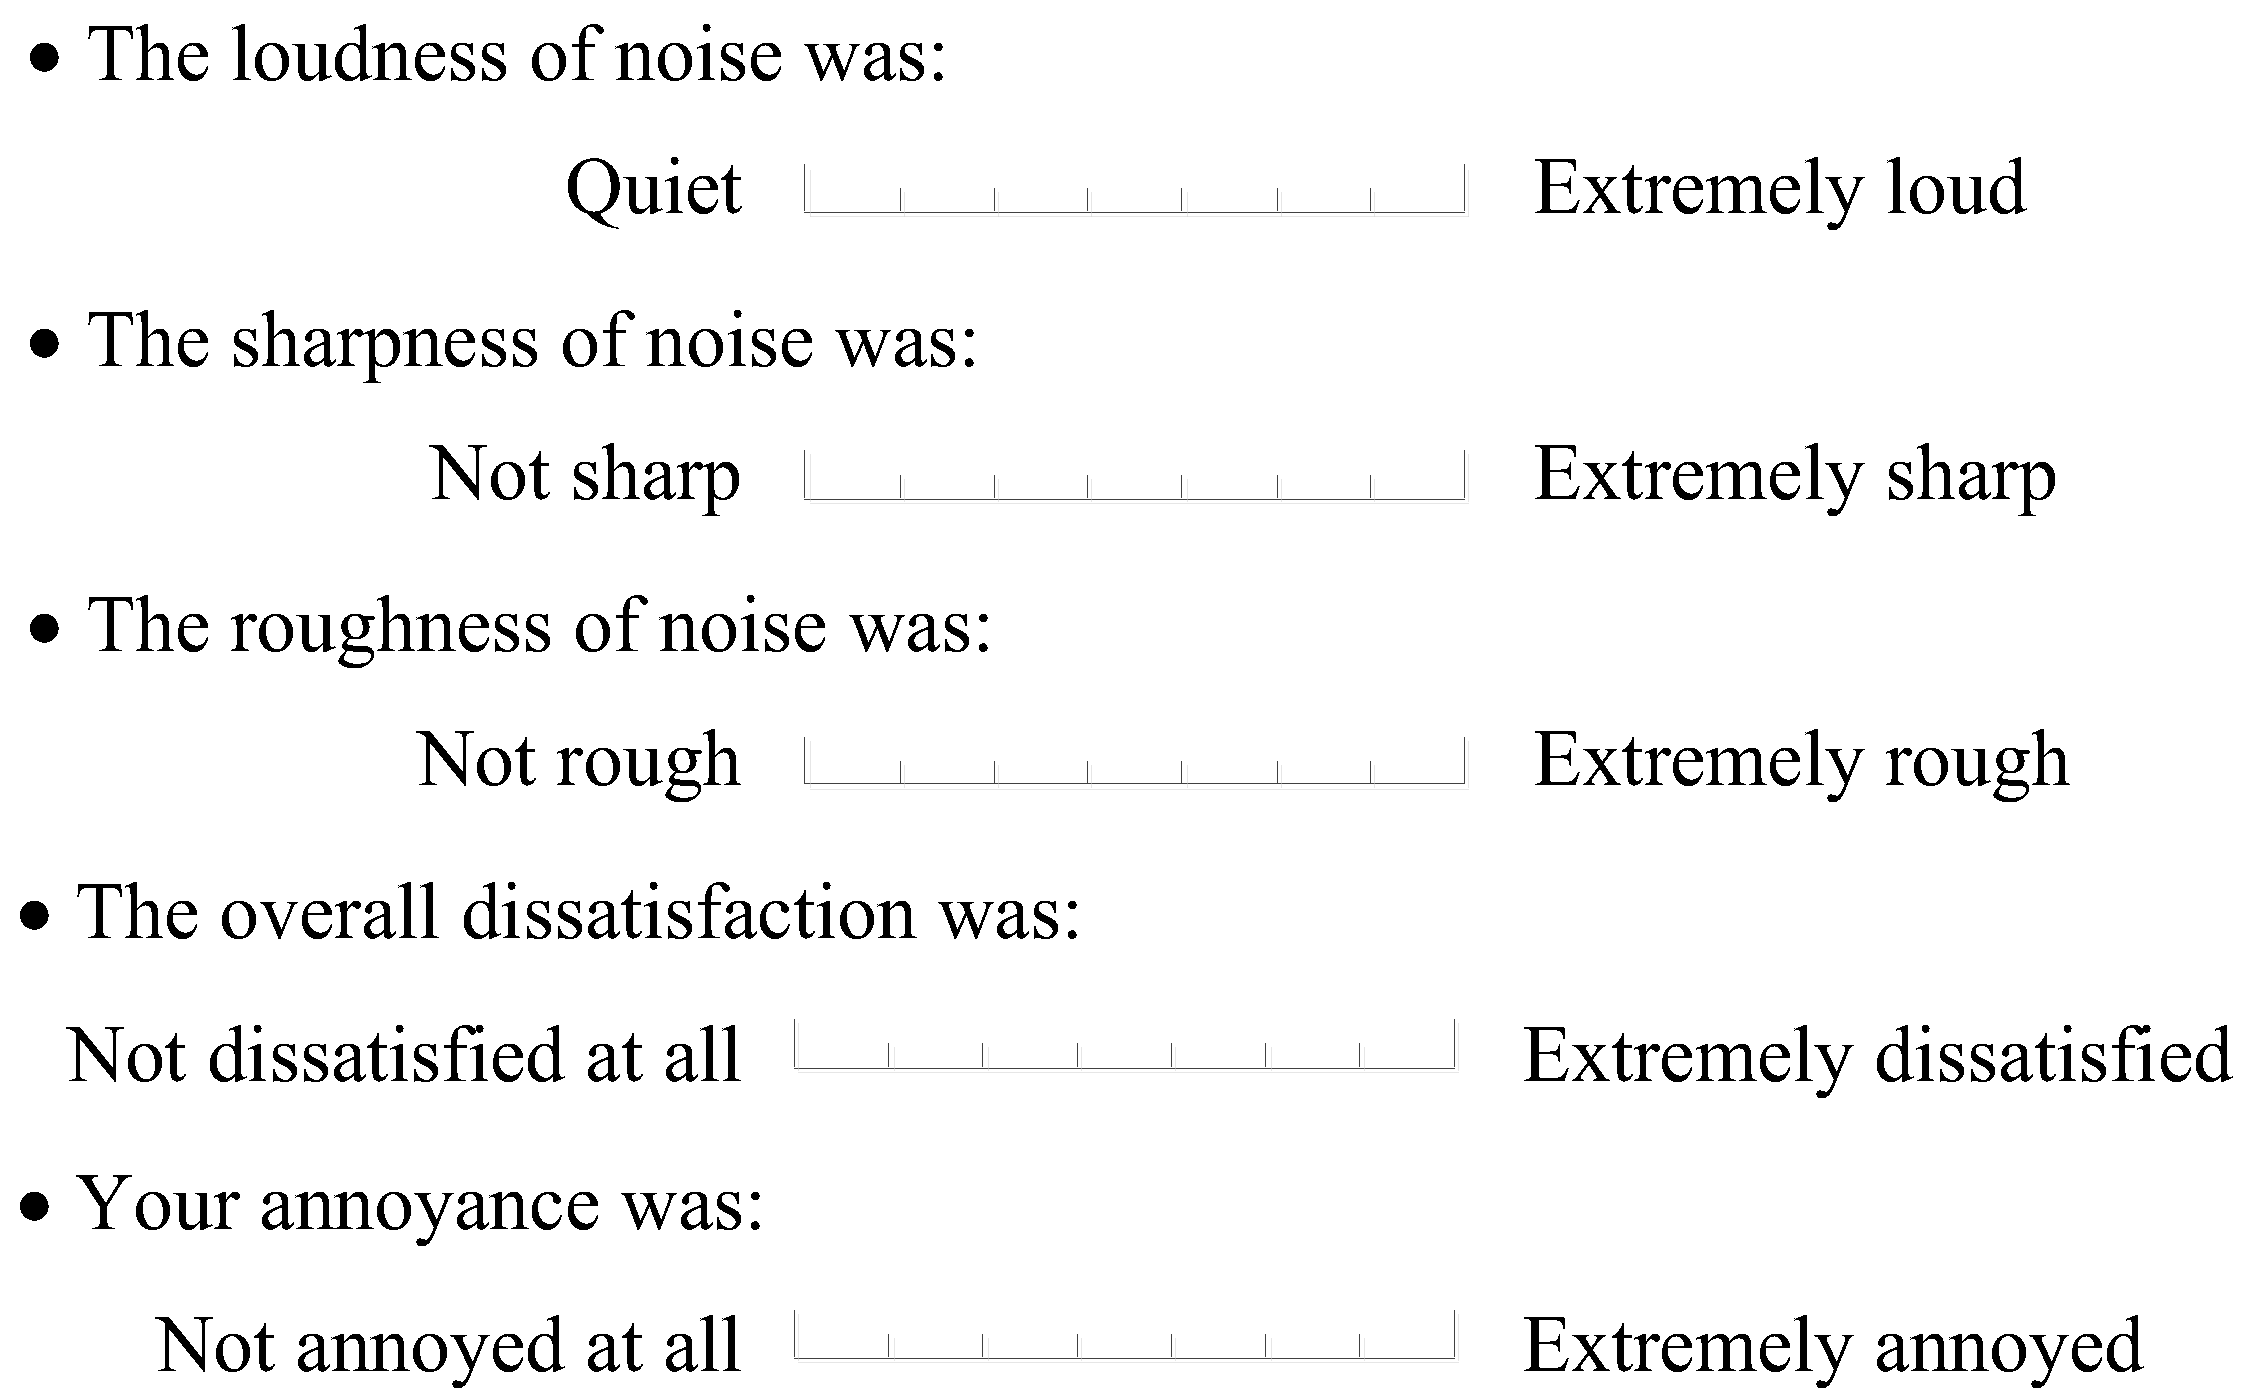
In addition to the objective evaluation method based on the physical characteristics of sound (see Table 1), the subjective evaluation method was also used to measure the sound quality [41]. As shown in Figure 2, the 7-point Likert scale was used in this study to assess the sound quality perceived by subjects during the experiments, including the comprehensive evaluation indices (dissatisfaction and annoyance) and the single evaluation indices (loudness, sharpness, and roughness).
2.3.3. Human Emotions
Each participant’s emotion was measured using the positive and negative affect scale (PANAS) that comprises 20 terms, with ten focusing on a positive emotion and the other ten focusing on a negative emotion. Each term can be rated on a scale of 1 to 5 (1—very slightly or not at all; 2—a little; 3—moderately; 4—quite a bit; 5—extremely) [46,47].
2.3.4. Cognitive Performance
Seven computer-based cognitive tests, summarized in Table 2, were adopted based on the information-processing of the human mind [48]. The details are described as follows.
- (1)
- Perception (auditory tests)
Three auditory tests, namely, the hearing threshold test, the duration discrimination test, and the frequency discrimination test, were adopted to measure the changes in hearing abilities under different noise conditions. In the hearing threshold test, an audible stimulus was played in each trial, and the subjects were asked to press the “1” button on the keyboard when they could hear these stimuli or, otherwise, to press the “0” button. In the duration discrimination test [49] and the frequency discrimination test [50], the subjects would always hear one tone after the other tone, and they had to judge which tone was longer for the former and which tone was higher for the latter. A sound test was performed before the formal tests to make sure that the subjects could hear the audible stimulus clearly, and then the sound volume remained unchanged during the experiments. The thresholds were calculated to evaluate human hearing perception, and the smaller threshold indicated the better hearing.
- (2)
- Attention (psychomotor vigilance task)
In the psychomotor vigilance task (PVT) [47,51], the subjects were asked to look at the fixation point “+” in the center of the screen, and to press the “J” button on the keyboard immediately, when they saw a number. They were asked to respond as soon as possible within 5000 ms, but not before the number appeared; otherwise, an error message would appear. Nine performance metrics were calculated to explore the effects of noise on the human vigilance ability: the reaction times (RTs) from different perspectives; the number of errors of commission and false-alert data; the number of lapses (RTs ≥ 500 ms); the reaction speed, defined as the reciprocal of the average RT; the index of the PVT, defined as the product of reaction speed and the number of correct operations.
- (3)
- Working memory (2-back test)
In the 2-back test [52,53], the subjects would see a sequence of letter stimuli appearing one after another in the center of the computer screen. They had to press the “F” button on the keyboard each time the current letter was exactly the same as the one presented before last or, otherwise, press the “J” button. The accuracy and the average correct RT were calculated to evaluate each subject’s working memory ability.
- (4)
- Mental arithmetic (mental arithmetic test)
In the mental arithmetic test, the subjects were asked to work on arithmetic problems of one or two digits, such as “2–4 + 32/16”, and press the button (from “1” to “4”) corresponding to the correct option. The performance metrics (accuracy and average correct RT) were calculated to explore the effects of noise on human calculation ability.
- (5)
- Executive function (Stroop test)
In the Stroop test [54], the subjects would see words presented in different colors, and they were asked to indicate the color in which each word was printed, while ignoring what the words actually said. They indicated the color of the word by pressing either of the following keys: the “Z” button for red words, or the “/” button for green words. The accuracy and the average correct RT of all trials, the consistent trials, and the inconsistent trials, were calculated to investigate the effects of noise on human execution ability.
2.4. Experimental Procedure
The experiments were conducted from 9 to 28 November 2020, and only from Monday to Saturday. For each subject, three experiment sessions were carried out during a fixed time period (8:00 a.m.–11:10 a.m. or 14:00 p.m.–17:10 p.m.) over three days, each lasting about 190 min. All subjects were blind to the noise conditions. The exposure orders of noise presentation were counterbalanced among the subjects to control for any residual effects of the previous noise condition. The time of day was controlled by testing equivalent numbers of participants in the morning and afternoon. The practice session was conducted for each subject in a natural acoustic environment in the same time period on the day before the first experiment session, during which the subjects were asked to familiarize themselves with the questionnaires and cognitive tasks. Only an experimenter and a subject were in the laboratory room during each experiment session, and they were instructed to remain silent throughout the tests.
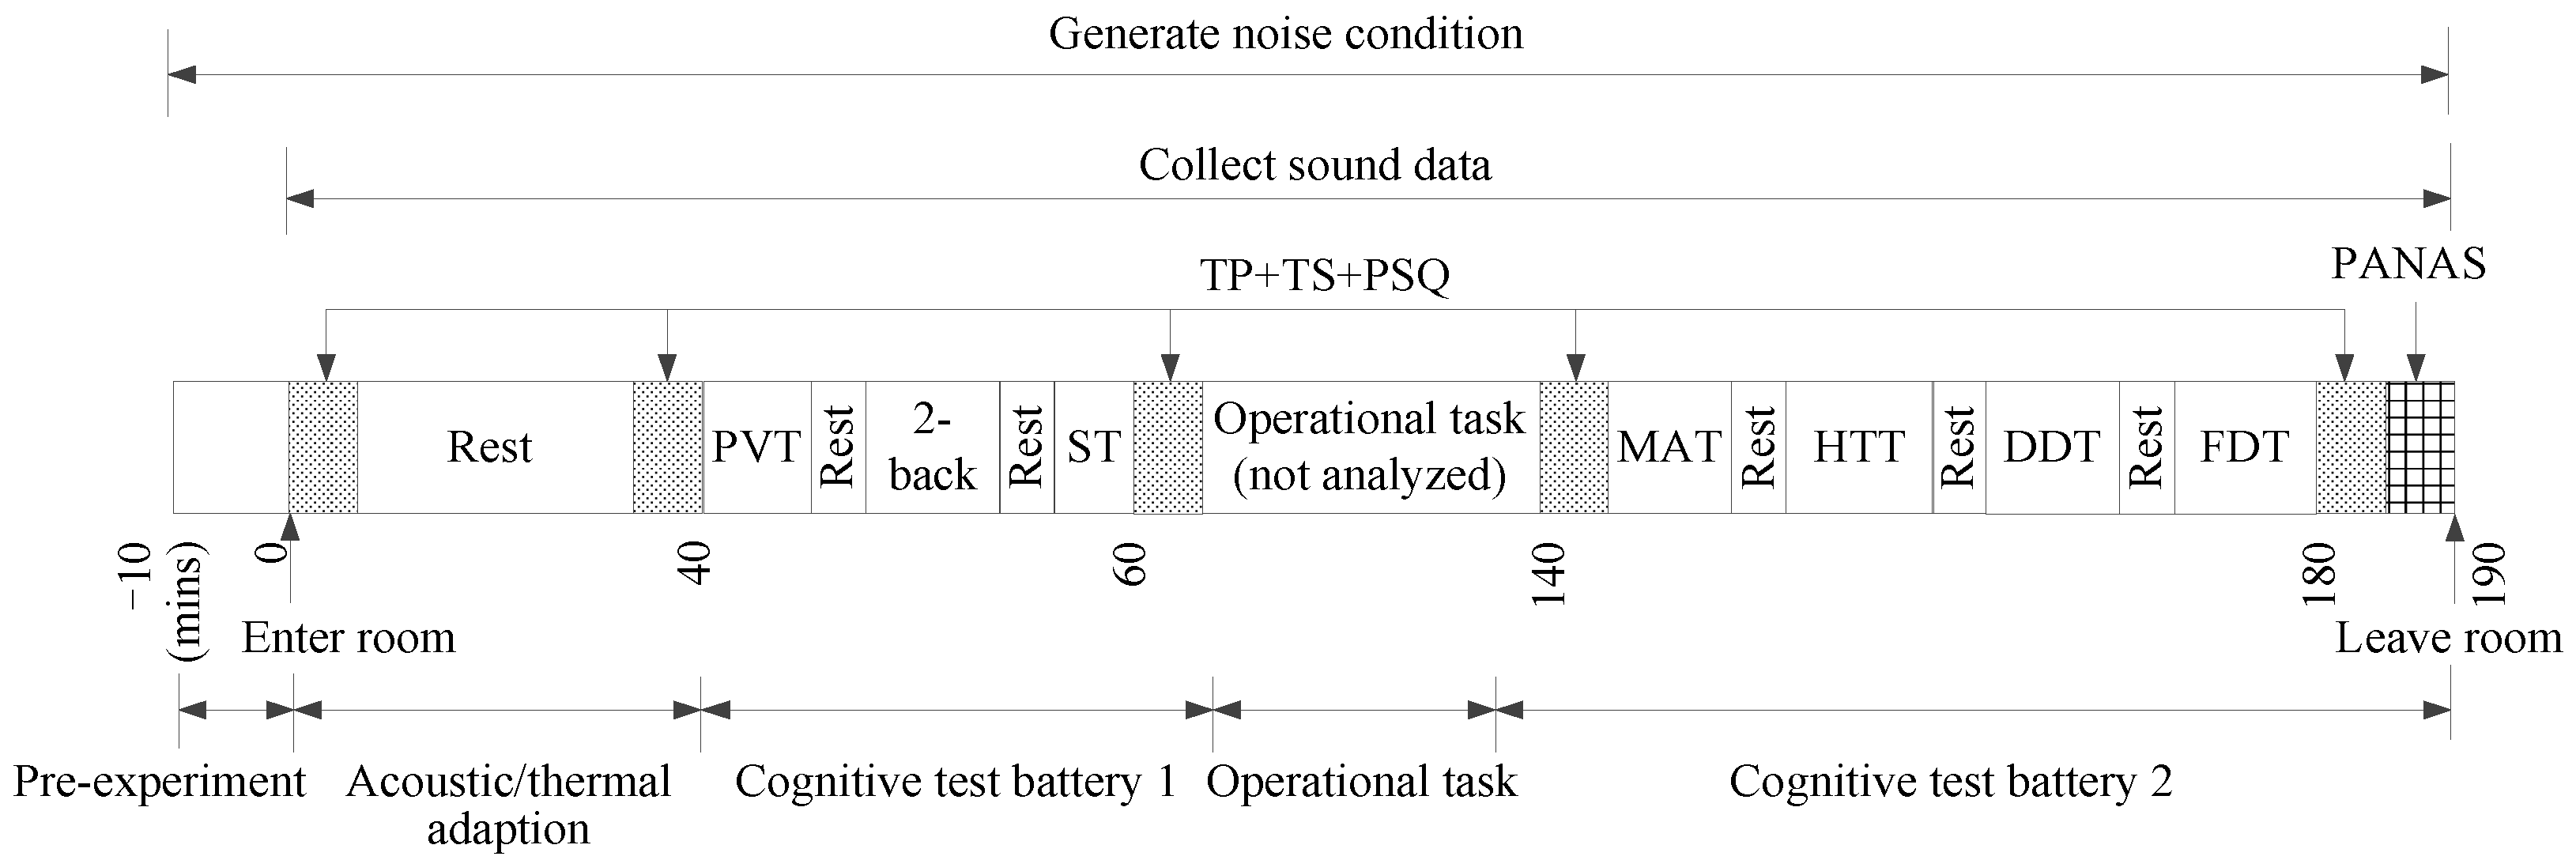
The experimental procedure is shown in Figure 3. As shown, the noise environment had been adjusted to the expected one before the subject entered the experimental room. After entering the room, the subject was instructed to adapt to the acoustic and thermal environment for about 40 min, and then perform the questionnaire and cognitive tests, during which the sound data were recorded in real time. It is worth noting that the thermal environment parameters, thermal sensations, and perceived sound quality were measured at the exposure times of about 0 min (at the beginning of the adaption period, referred to as TP1), 40 min (at the end of the adaption period, referred to as TP2), 60 min (after the first set of cognitive tests, referred to as TP3), 140 min (before the second set of cognitive tests, referred to as TP4), and 180 min (at the end of the experiment session, referred to as TP5), respectively. The PANAS scale was filled in at the end of the experiment session. The computerized cognitive tests were performed in the following sequence: the PVT task, the 2-back task, the Stroop task, the mental arithmetic task, the hearing threshold test, the duration discrimination task, and the frequency discrimination task. Performances in the operational task were analyzed in a previous study [27,43]; these data, however, are not analyzed in this paper.
2.5. Statistical Analysis
Generalized additive mixed effect model (GAMM) analyses [47,48,55,56] and the correlation analyses were performed using the open-source statistical package R version 3.6.1 (R Project for Statistical Computing, Vienna, Austria) to test the relationships between noise exposures and performance metrics, treating the subject as a random effect. In addition, the PLS-SEM method was used with the SmartPLS 3.0 software (SmartPLS GmbH, Bönningstedt, Germany) to explore the underlying mechanism of noise effects. This method does not require the assumption of data distribution and is useful for a dataset with a small sample size, as well as skewness and kurtosis [57]. In this study, bootstrapping was used to determine the efficiency of the proposed structural model. Differences were considered as statistically significant when p < 0.05.
The cognitive tests and the PANAS scale were measured only once under each noise condition. The GAMM models for these data are shown in Equations (1) and (2),
where y is the performance metrics of cognitive tests and the evaluation ratings of the PANAS scale; and are the fixed intercepts; and are the fixed effects of N80-S1 and N75-S2 compared to N85-S1, respectively; is the fixed effect of N75-S2 compared to N80-S1; b and are the random effects of intercept for subjects; and e and are the residuals.
The perceived sound quality was measured at five different exposure times under each noise condition. Therefore, two variables (noise and TP) were involved in the GAMM models, and their main effects and interaction effect were examined, as shown in Equation (3),
where y′ is the subjective ratings of sound quality; β′ is the fixed intercept; f is the function in describing the main and interactive effects of noise and TP; b′ is the random effect of intercept for subjects; and e′ is the residual.
3. Results
3.1. Noise Exposure Effect on Perceived Sound Quality
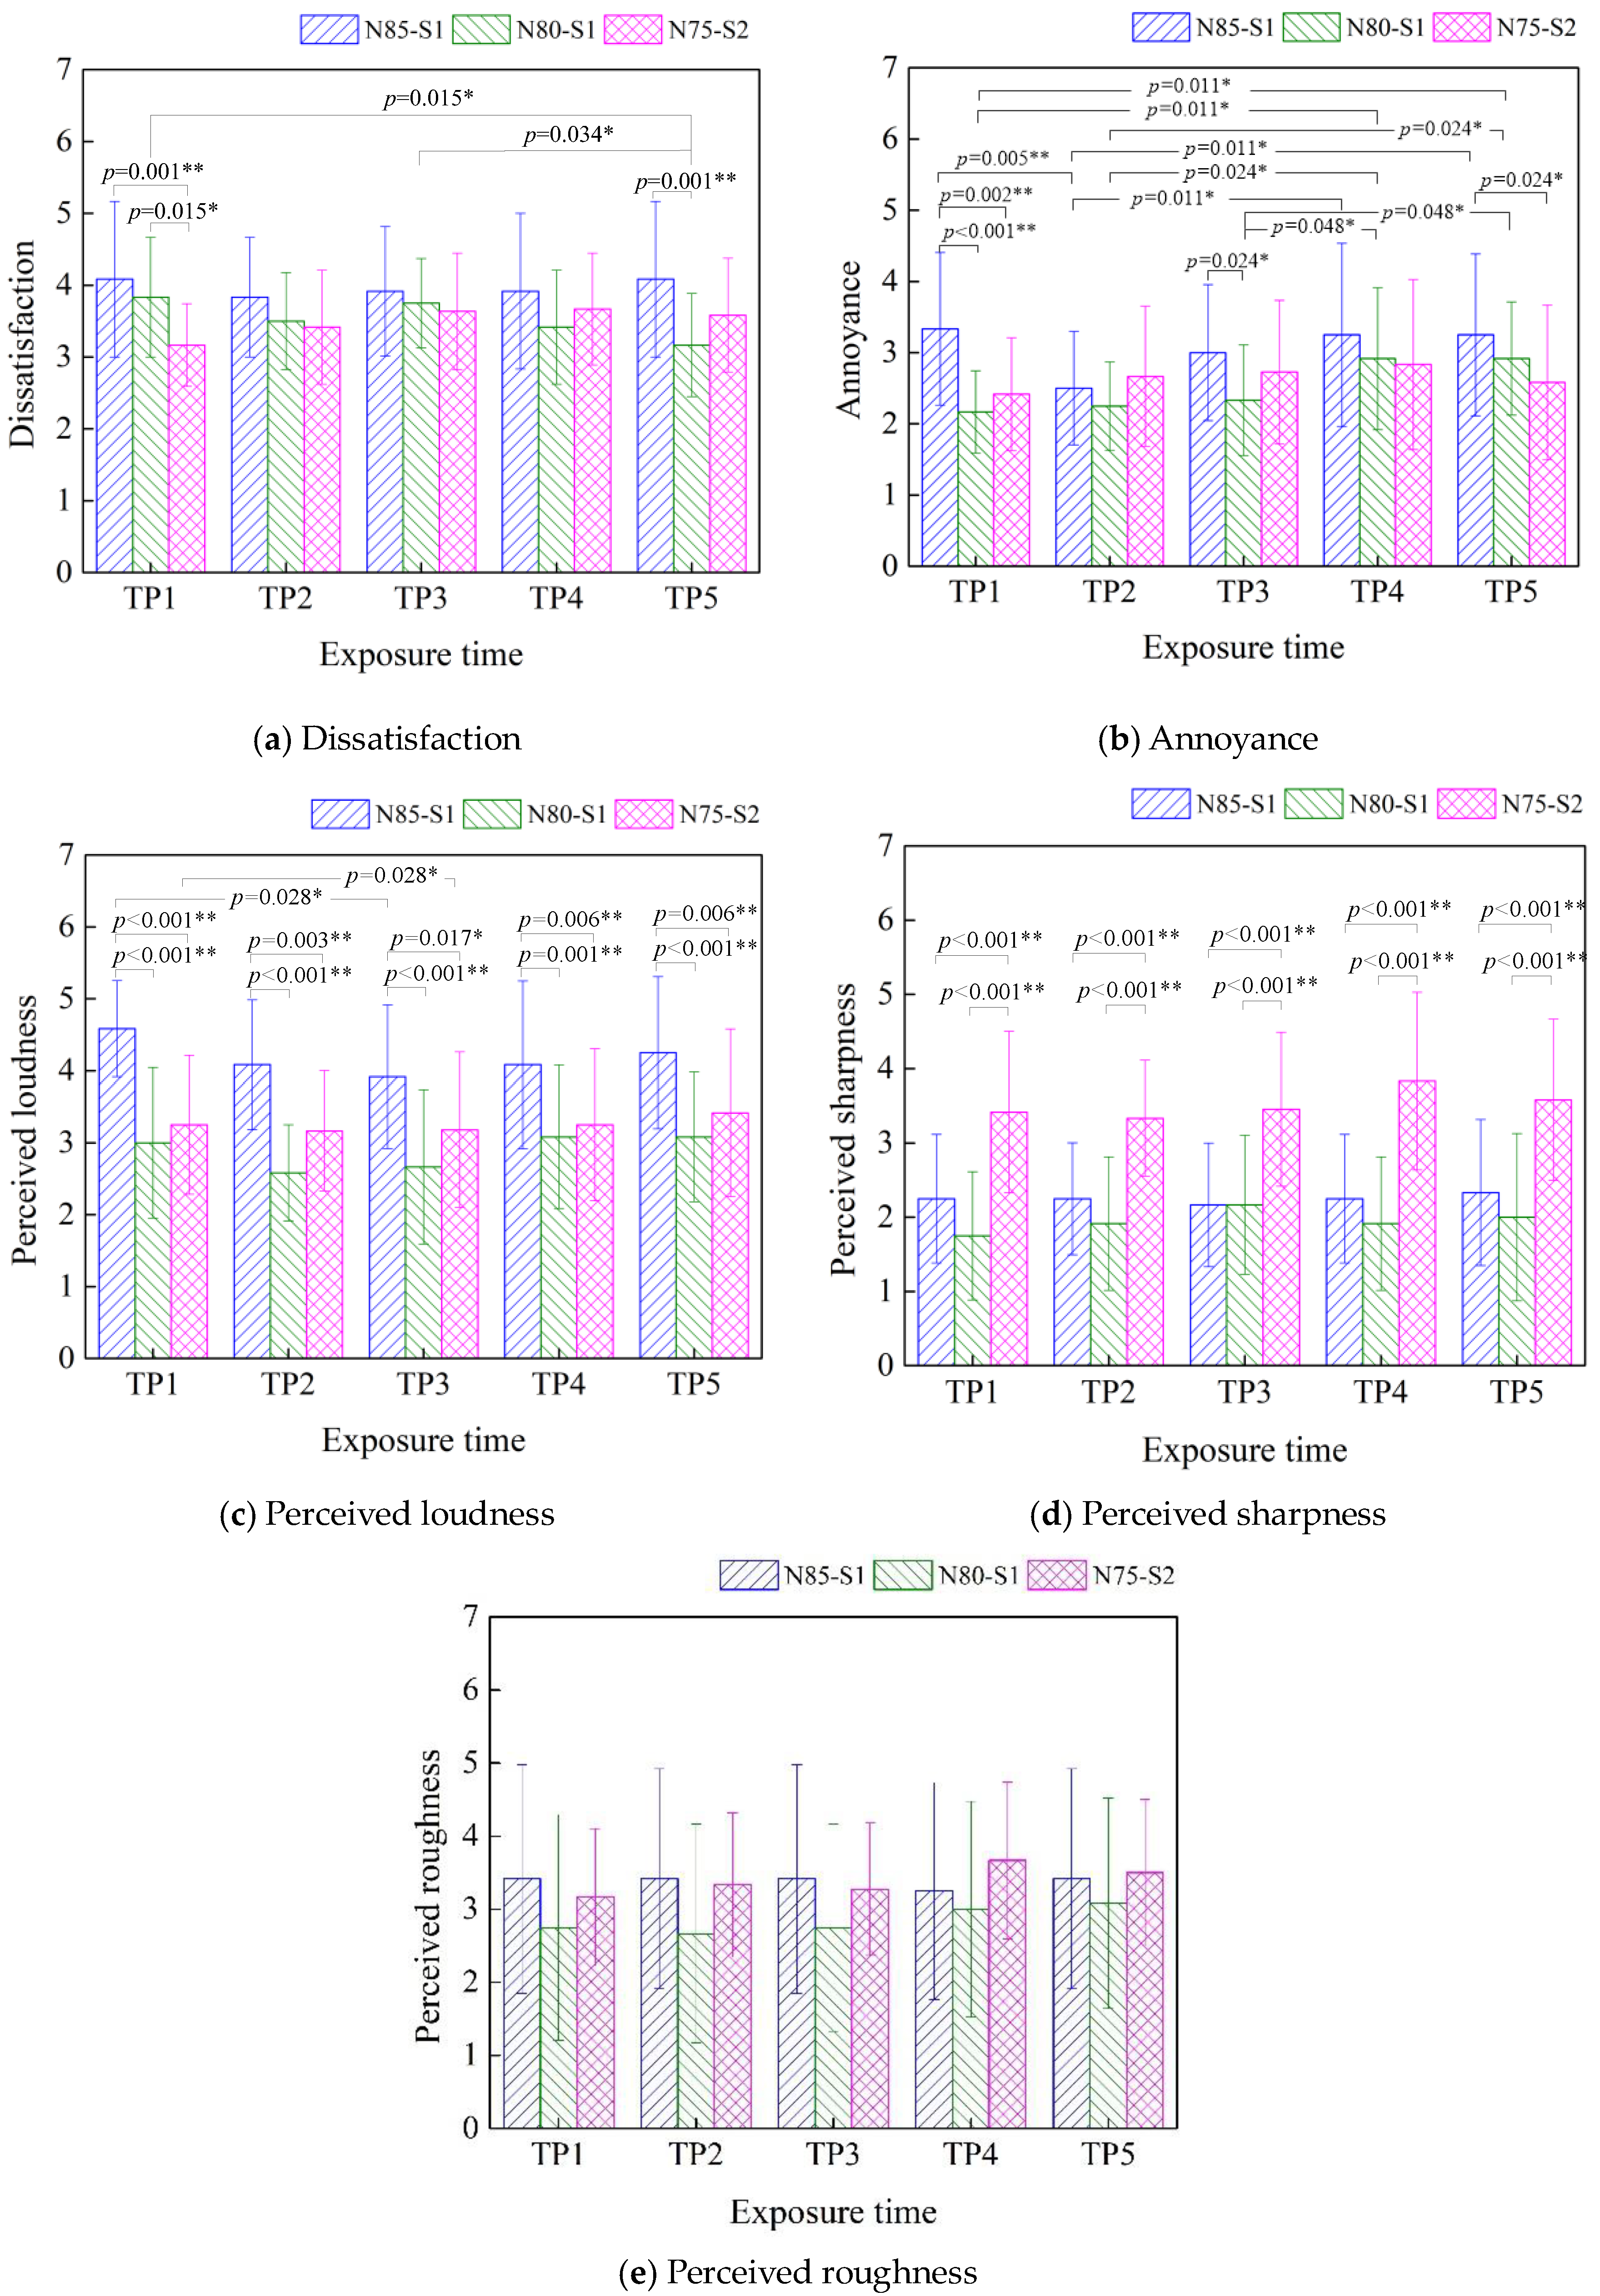
Figure 4 shows the GAMM results for the subjects’ rating of sound quality when they were exposed at different noise conditions and exposure times. Only the significant main effects (p < 0.5) are displayed in Figure 4. The possible interaction effects are not labeled in Figure 4 but can be found in Table A1 (taking N85-S1 and TP1 as references) in Appendix A. The following conclusions can be obtained.
- (1)
- As shown in Figure 4a, the main effect of noise suggested that decreased intensity had a positive effect on reducing subjective dissatisfaction. The main effect of TP suggested that adaption to noisy environments could weaken a subject’s dissatisfaction. The noise × TP interaction effect was observed, reflecting that longer exposure times can exacerbate and even change the effect of noise on a subject’s dissatisfaction. For example, the declined noise level from 85 dBA to 80 dBA had a greater improvement on human dissatisfaction at TP5 compared to TP1 (p = 0.085) and TP3 (p = 0.053). In addition, N80-S1 was rated as more dissatisfying than N75-S2 at the beginning of exposure (TP1), which was mediated by exposure time at TP4 (p = 0.055) and TP5 (p = 0.019), reflecting that the higher sharpness was more likely to cause dissatisfaction when subjects were exposed for a long time.
- (2)
- As shown in Figure 4b, compared to the dissatisfaction, the subject’s annoyance was more sensitive to changes in noise condition. Specifically, the main effect of noise suggested that a lower noise level was rated as less annoying, and the main effect of TP indicated that the subjective annoyance caused by noise was aggravated by the increase in exposure time. In addition, exposure time was observed as moderating the effect of noise on a subject’s annoyance. For example, the decline in annoyance from N85-S1 and N80-S1 to N75-S2 at TP2 (p = 0.010, p = 0.028), and from N85-S1 to N80-S1 at TP4 (p = 0.046) and TP5 (p = 0.046), was smaller than that at TP1.
- (3)
- The effectiveness of the designed noise stimulus could be verified according to the results in Figure 4c–e. As shown in Figure 4c, the subjects were clearly aware of the change in noise intensity of 5 dBA (85 dBA vs. 80 dBA), which was in accordance with expectation. But the changed sharpness of noise affected the perception of noise loudness (80 dBA vs. 75 dBA with higher sharpness). The main effect of TP suggested that adaption to noise loudness occurred with increasing exposure times. As shown in Figure 4d,e, the main effect of noise on a subject’s perceived sharpness, with no obvious effect on perceived roughness, proved the effectiveness of the designed noise stimulus. The main effect of TP was not significant on perceived sharpness. No interaction effects were found. So, it can be inferred that the perceived sharpness of noise was not easily affected by exposure time nor by noise intensity.
In sum, the lower noise level was beneficial in reducing a subject’s dissatisfaction and annoyance, and these effects could be counteracted by sharper noise and longer exposure time.
3.2. Noise Exposure Effect on Emotions
Figure 5 and Table A2 show the GAMM results for the PANAS scores when the subjects were exposed to different noise conditions for about 190 min. It can be seen that more positive and fewer negative emotions were reported when the noise level decreased from 85 dBA to 75 dBA, but only the difference in positive emotion between N85-S1 and N75-S2 was statistically significant. It can be inferred that positive emotions are more sensitive to variations in sound quality than negative emotions, and reduced noise level is beneficial to the improvement of positive emotions.
3.3. Noise Exposure Effect on Cognitive Performance
The detailed GAMM results for cognitive performance are shown in Table A3. Results with a p-value larger than 0.05 but less than 0.1 were also considered when interpreting data, because of the relatively small sample size in this study.
- (1)
- Working memory and mental arithmetic
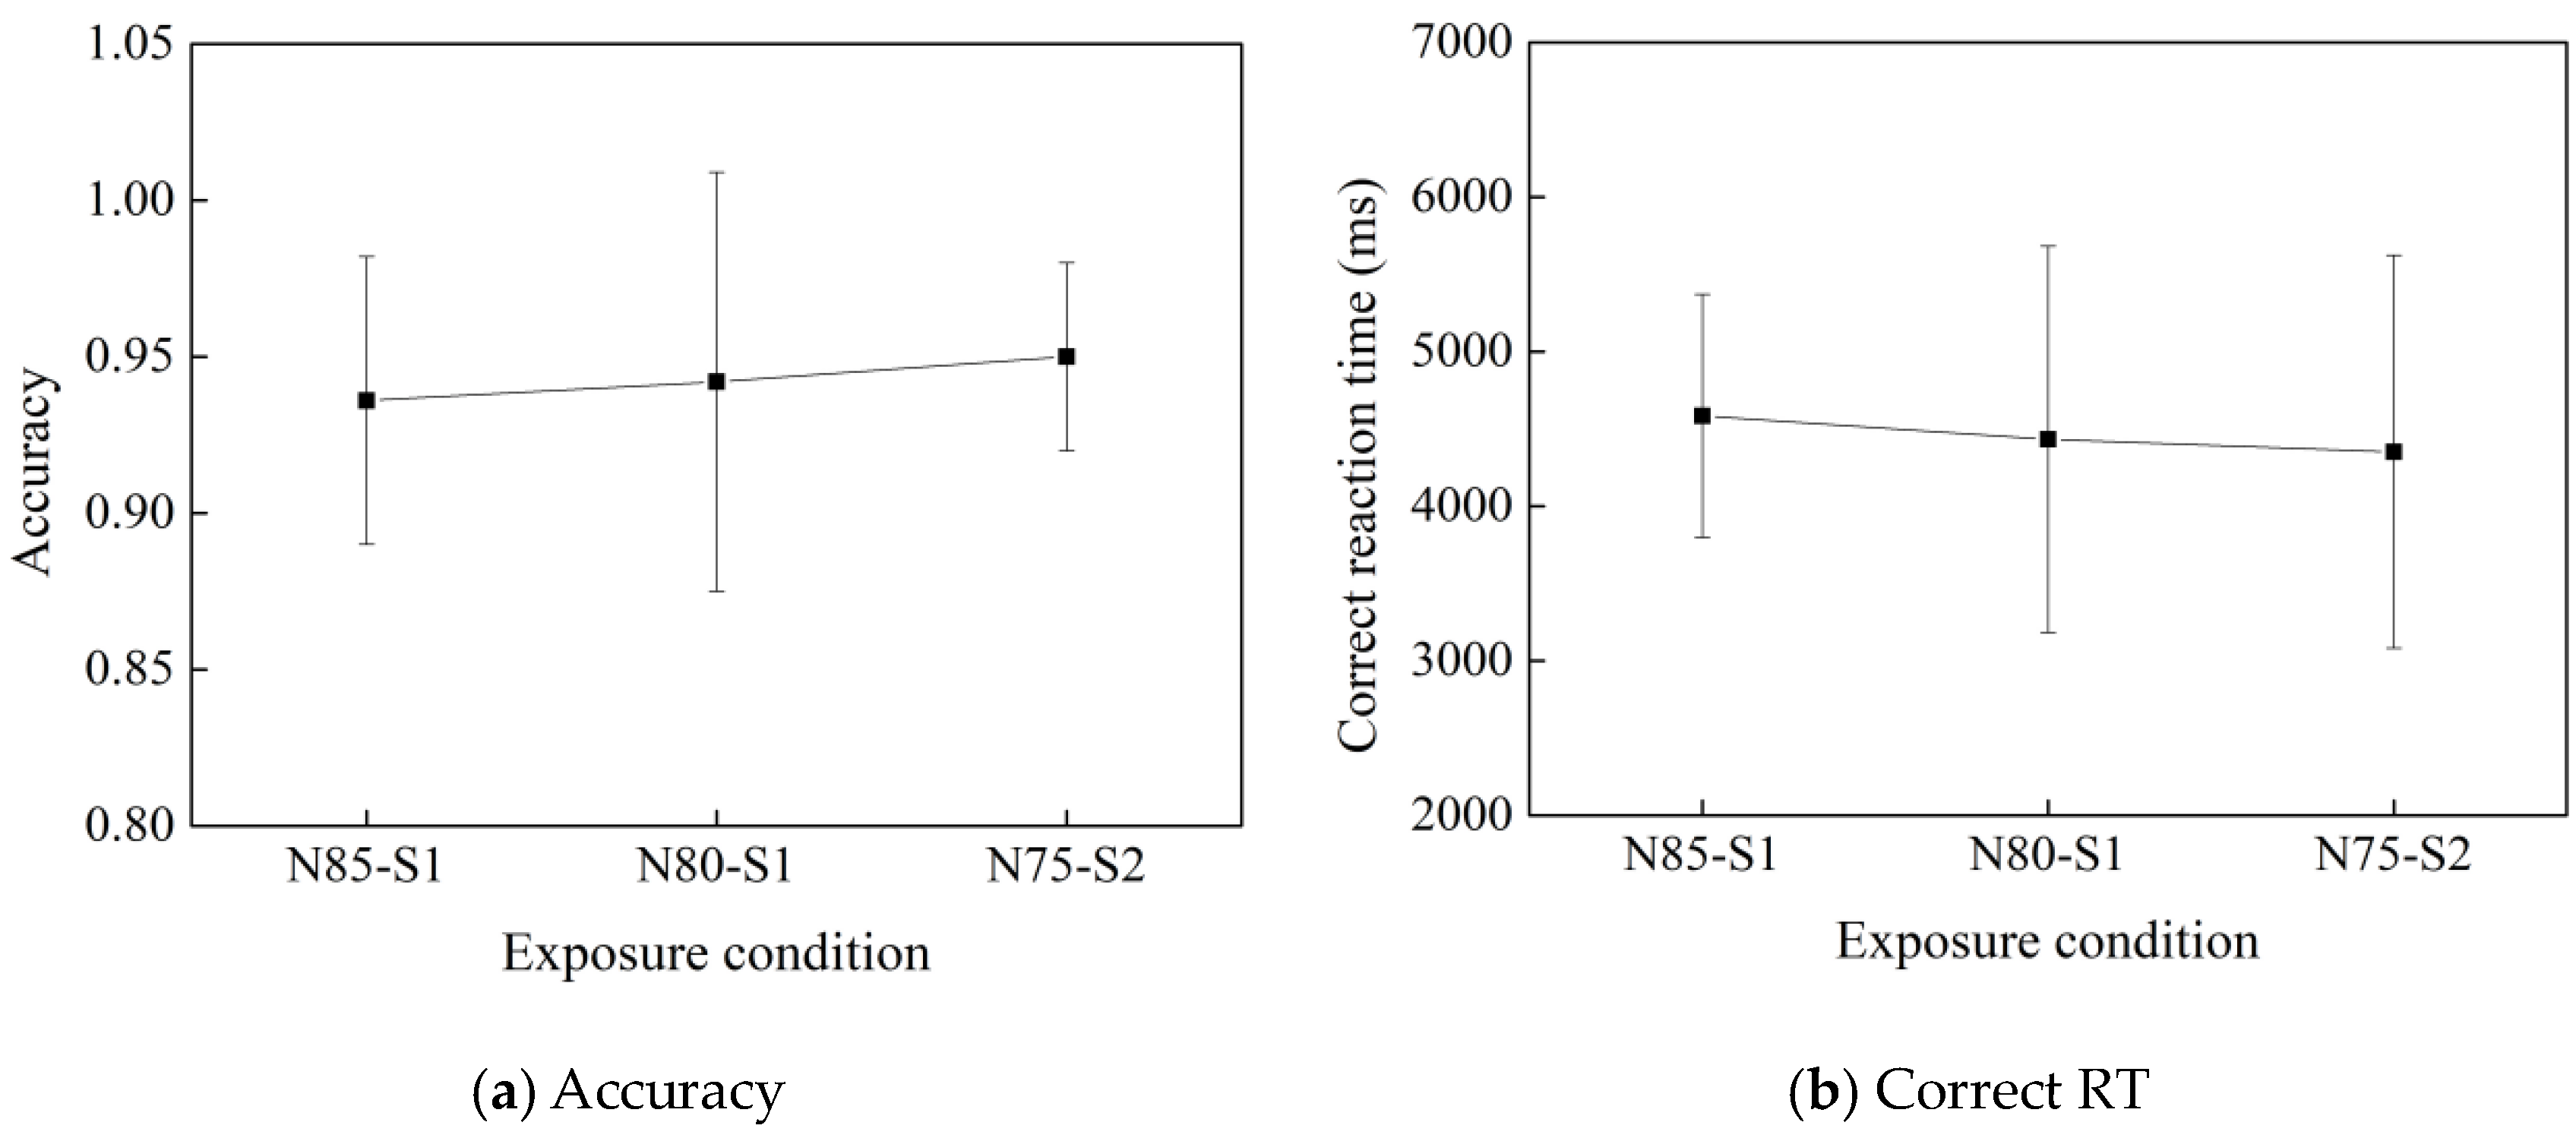
As shown in Figure 6 and Figure 7, no statistically significant differences were observed between the noise conditions in the performance metrics of the 2-back test and the mental arithmetic test, which indicated that short-term memory and the mathematical calculation ability were not affected by the noise investigated in this study.
- (2)
- Hearing perception
Figure 8 depicts the changing trends of the performance metrics of auditory tests under the three noise conditions. As shown, the absolute threshold of hearing declined significantly with the reduced noise level, which was expected because the loudness of perceptible sound stimuli obviously increased when subjects were exposed to noise conditions with higher levels. It can be believed that there was a detrimental effect of elevated noise level on a subject’s hearing sensitivity. Moreover, it was found that the thresholds of duration and frequency discrimination at N85-S1 were higher than those at N80-S1 and N75-S2, with significant or moderately significant differences. No obvious differences were observed between N80-S1 and N75-S2. These results indicated that the decreased noise level from 85 dBA to 80 dBA had a positive effect on improving the subjects’ ability to distinguish the difference in duration and frequency of acoustic stimulus, whereas a further reduction of 5 dBA, but with poor quality, did not promote the further improvement of these abilities.
- (3)
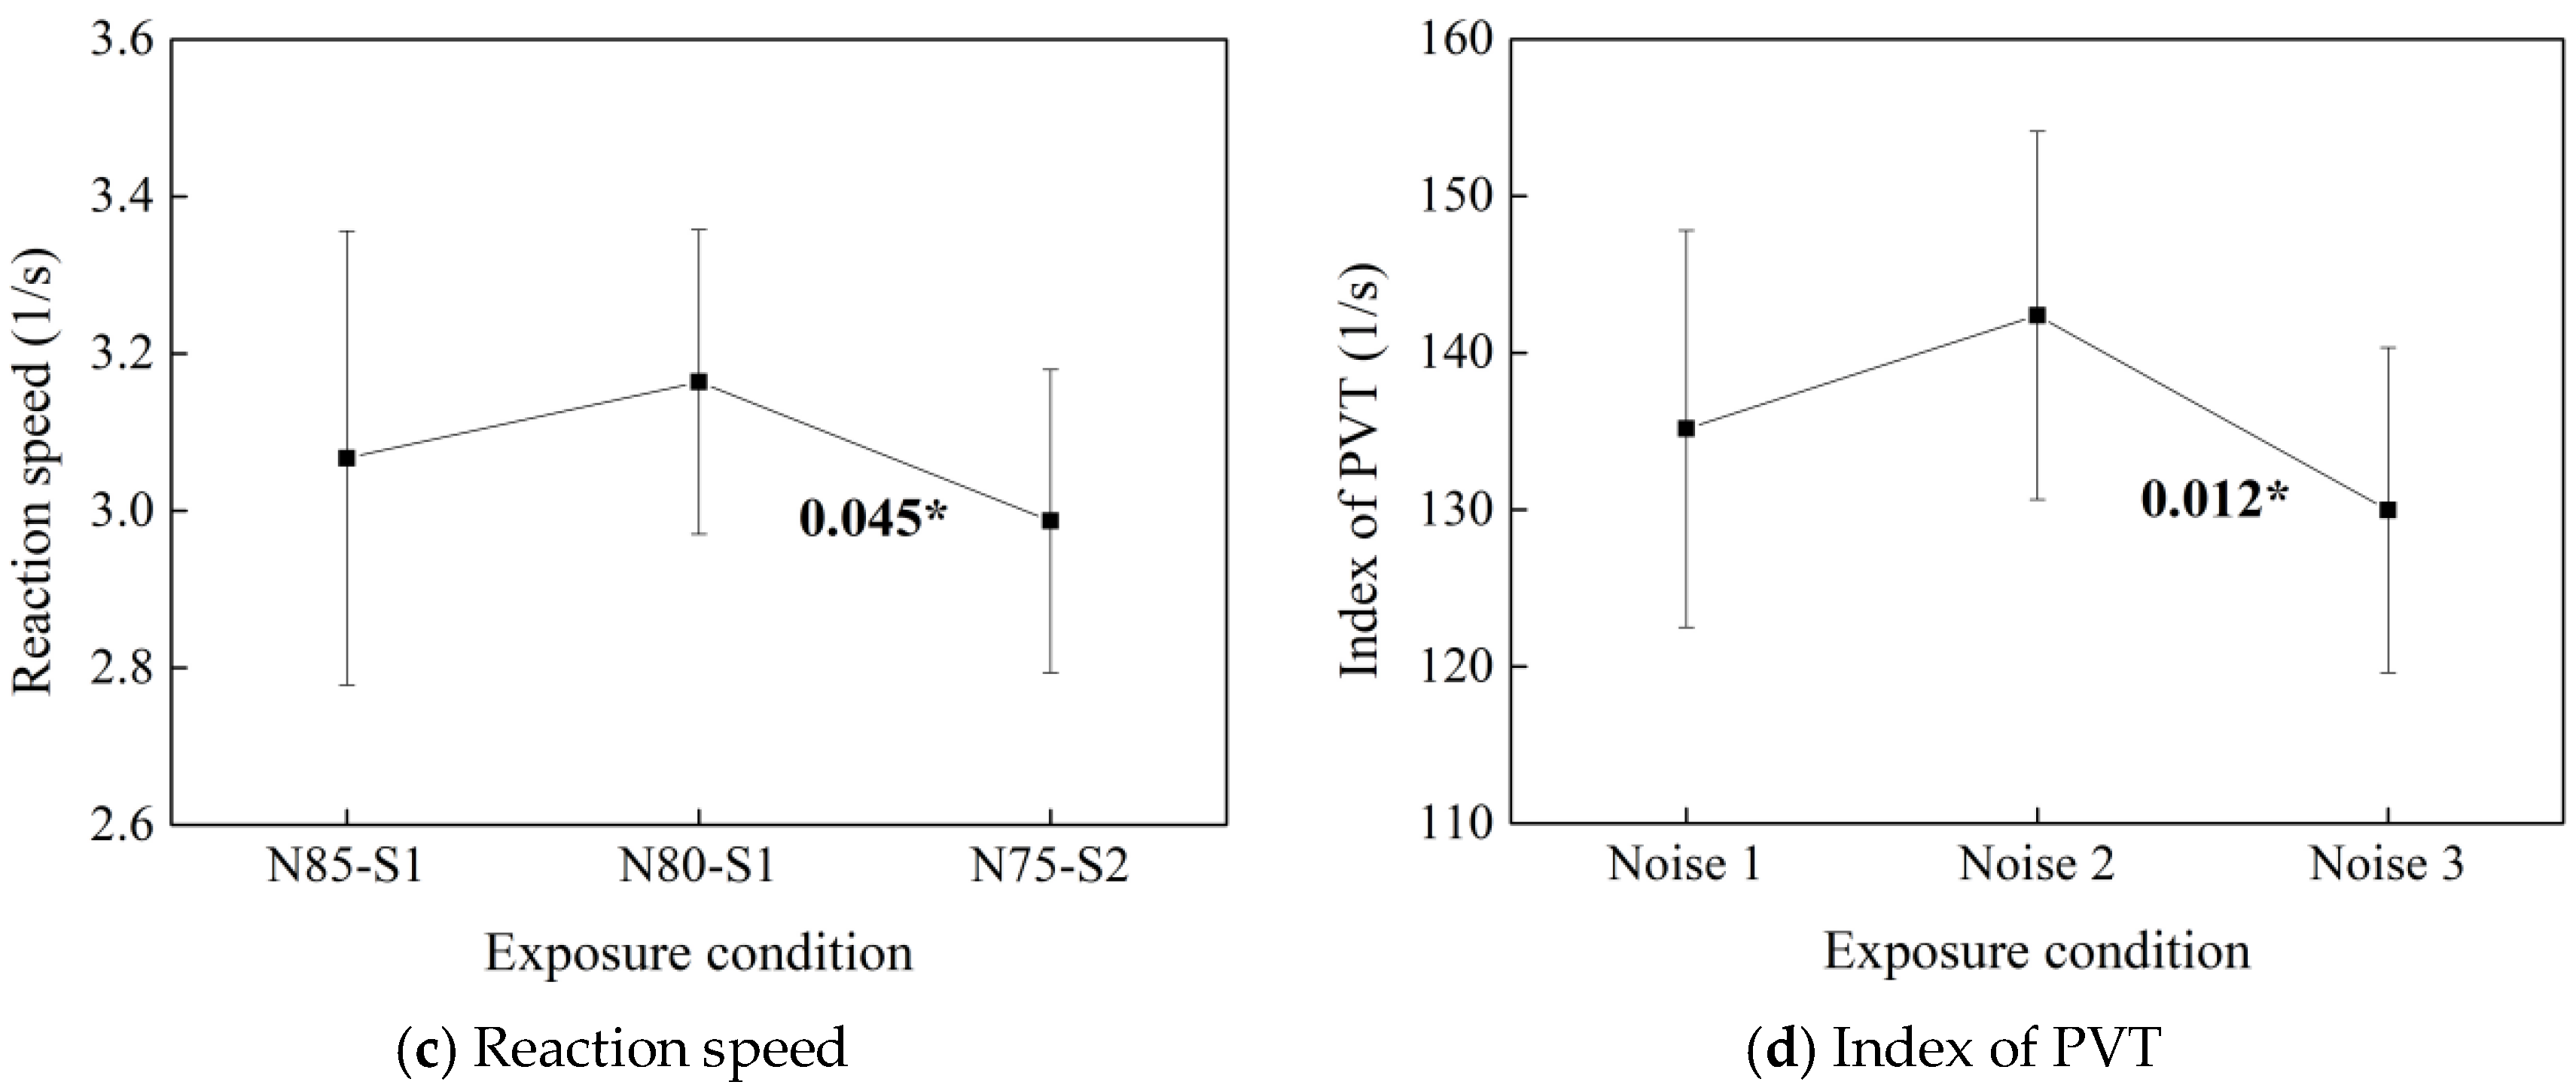
- Attention
As shown in Figure 9, the best PVT performance was found under N80-S1. Specifically, the number of lapses decreased significantly (p = 0.016) and the last 10% RT decreased slightly (p = 0.092) when the noise level changed from 85 dBA to 80 dBA. The first 10% RT, the minimum RT, and the median RT under N80-S1 were significantly lower than those under N75-S2. The reaction speed and the vigilance index were significantly higher than those under N75-S2.
- (4)
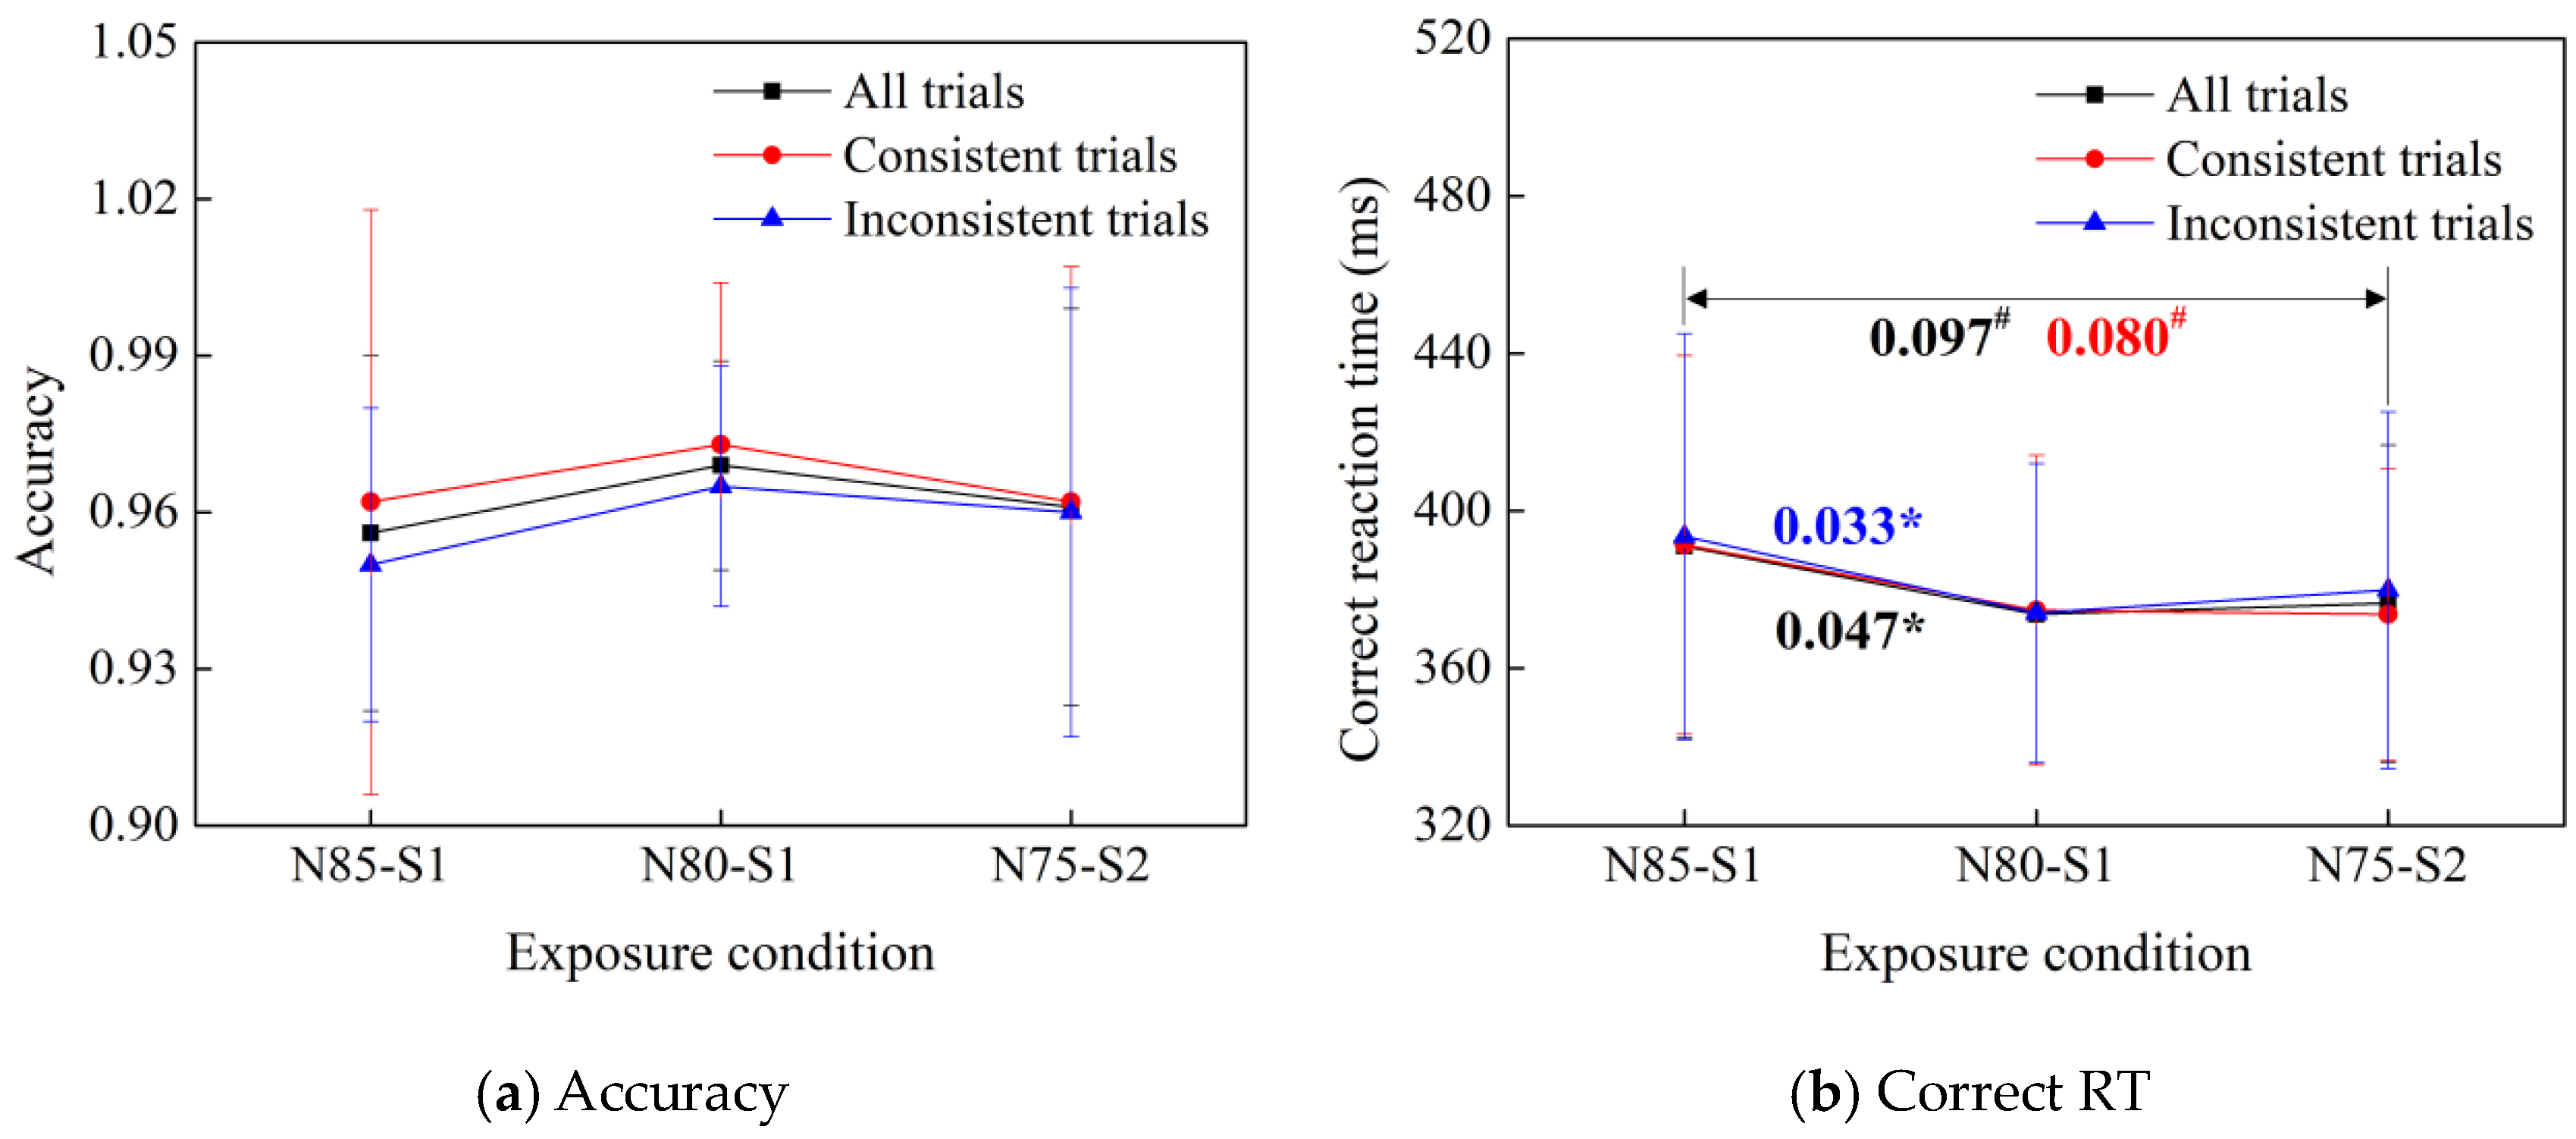
- Executive function
As shown in Figure 10, the correct RT in the Stroop test for all trials and inconsistent trials declined significantly with a reduced noise level from 85 dBA to 80 dBA, and then remained unchanged under the condition with a noise level of 75 dBA but higher sharpness. Thus, it can be inferred that the executive ability of subjects can be improved when they are exposed at a noise condition with a reduced level from 85 dBA to 80 dBA, whereas these abilities are not further improved and may even be impaired when the noise level continues to decrease to 75 dBA but with higher sharpness.
Based on the above results, it can be concluded that both higher noise level and higher sharpness can impair human duration discrimination, frequency discrimination, vigilance level, and execution ability. The reaction speed was more prone to be affected compared to the accuracy. Therefore, in addition to lowering the noise level, a reduction in noise sharpness is also important to improve human cognitive performance.
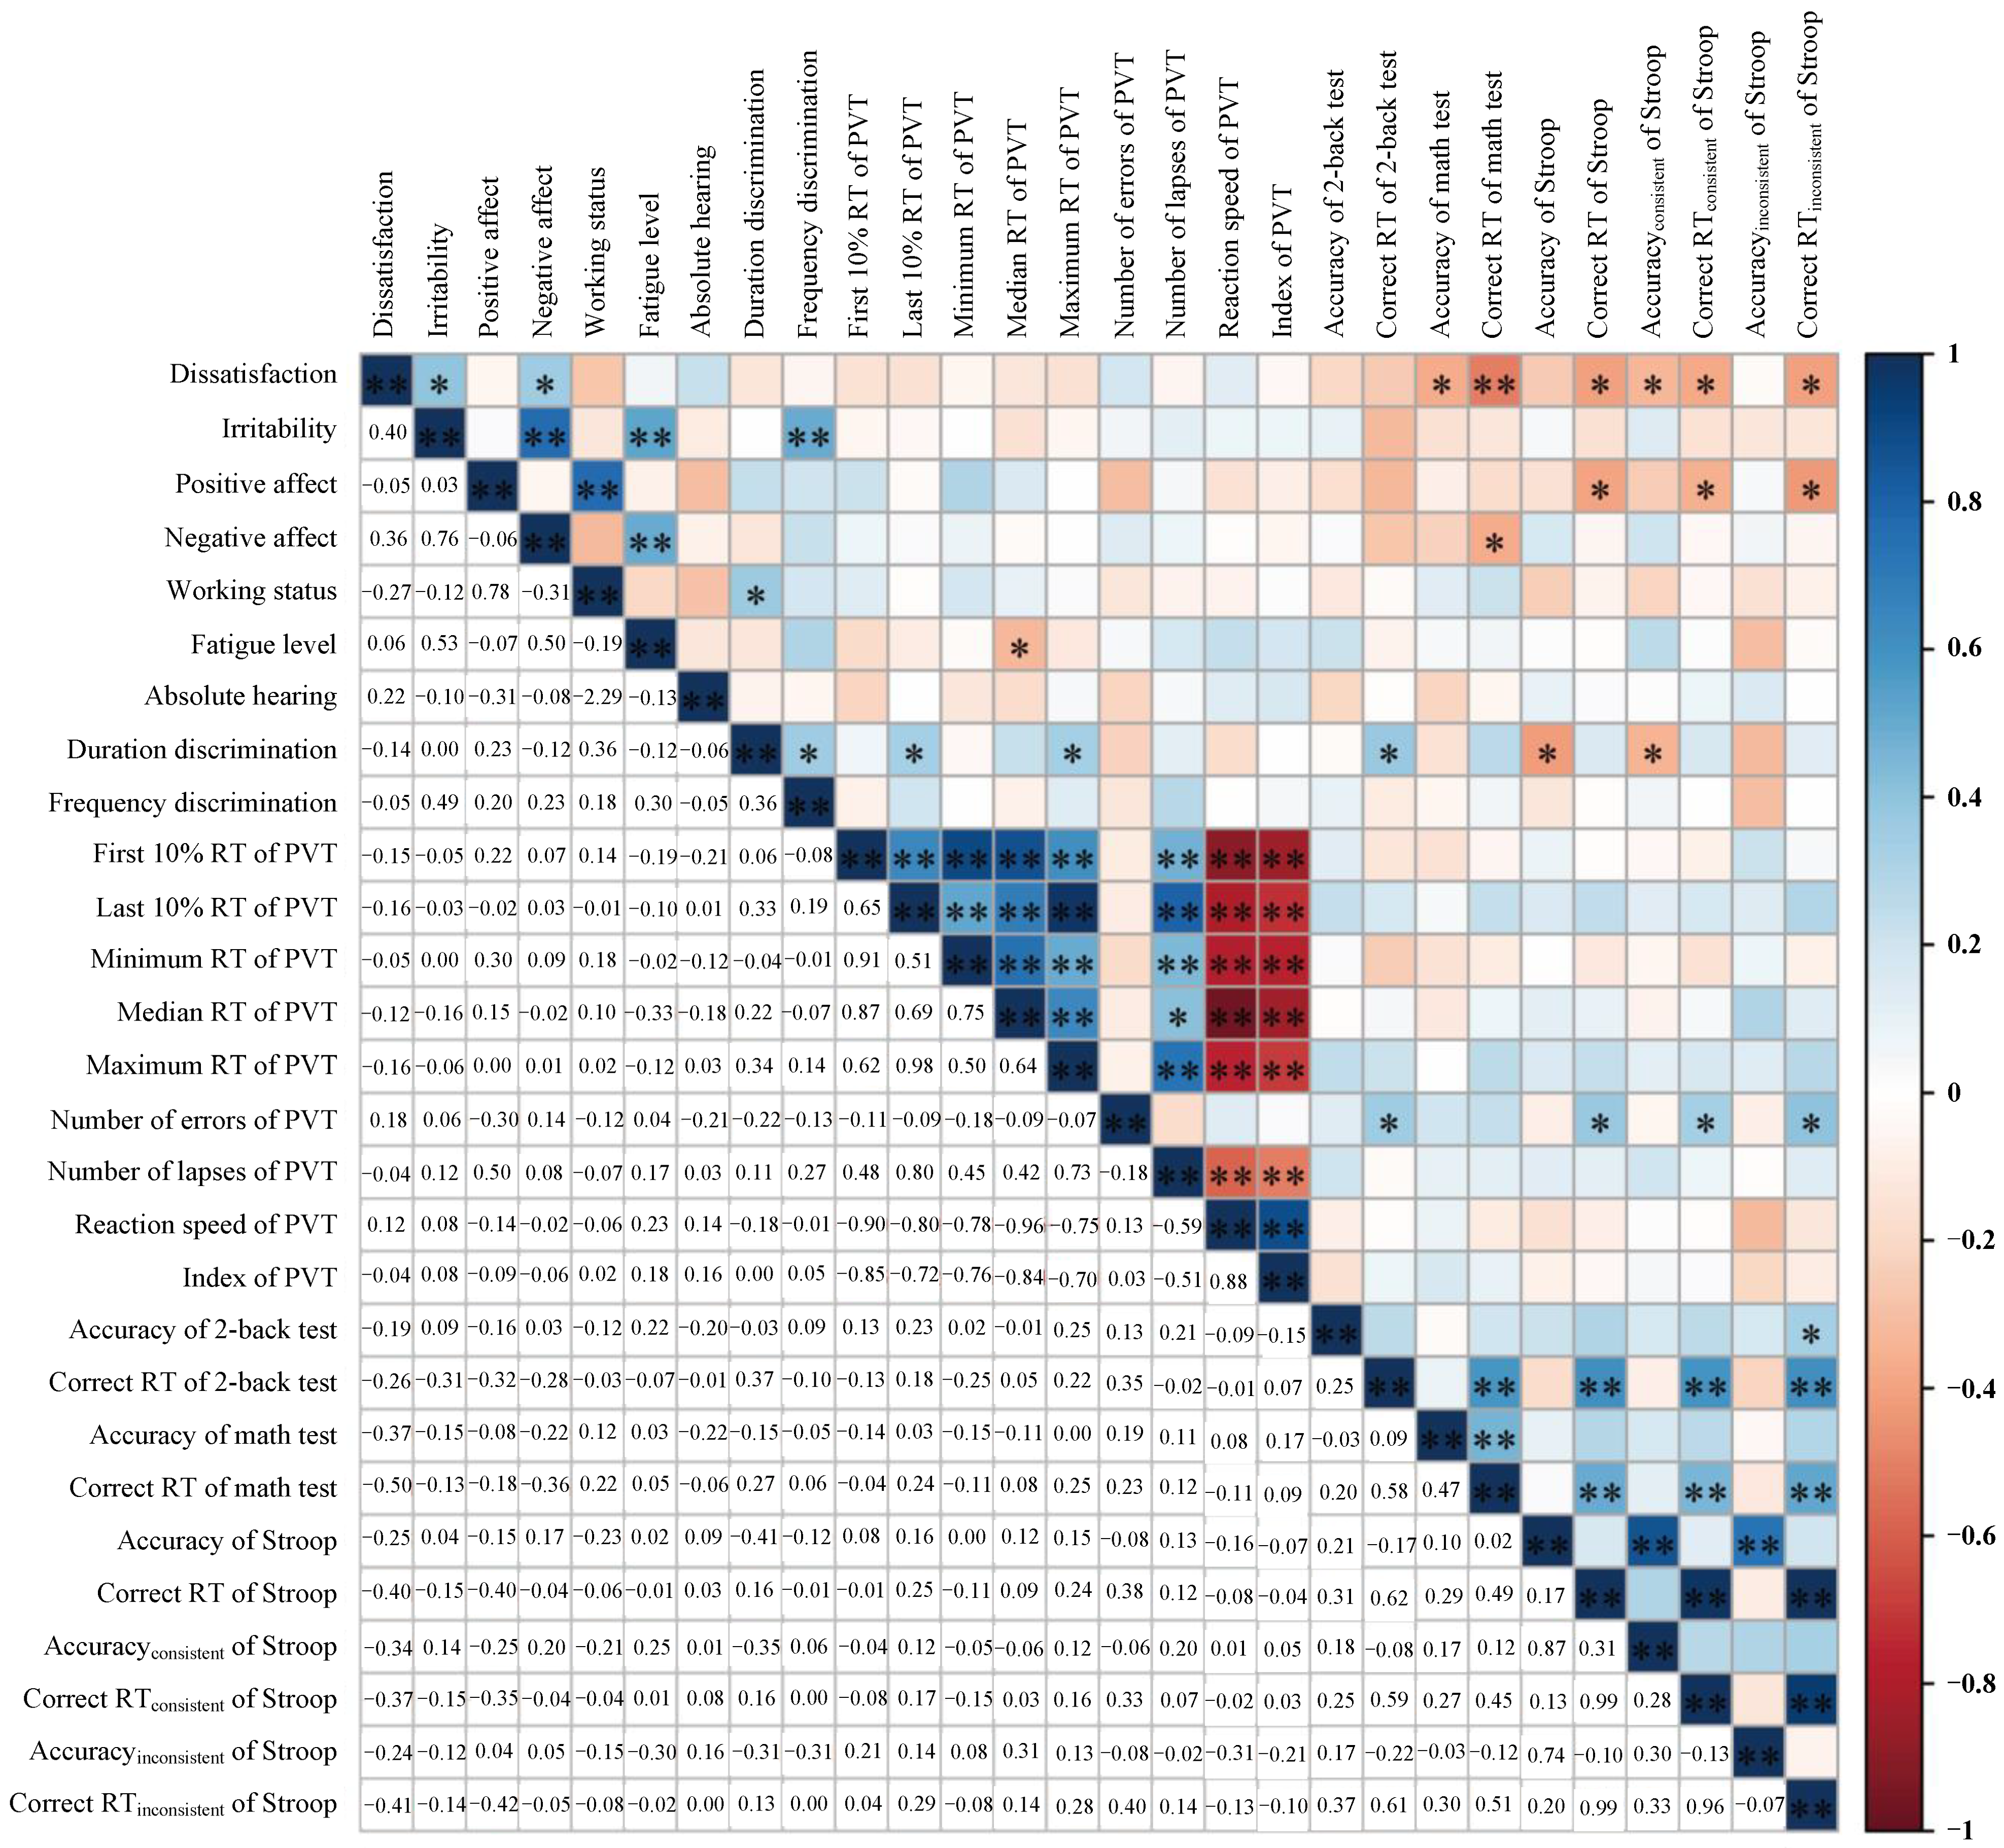
3.4. Correlation Analyses
The correlation between human emotion and cognitive performance was analyzed using the Pearson method (see Figure 11). The subject’s dissatisfaction and annoyance with noise were measured five times under each exposure condition, so the average of the five measurements was used for the correlation analysis. The other parameters were only measured once under each condition, and were directly used for analysis.
Based on Figure 11, the results can be summarized as follows:
- (1)
- The subject’s perceived sound quality (dissatisfaction and annoyance) and negative emotions can be considered as significantly correlated, but are not related to positive emotions.
- (2)
- Cognitive abilities are not independent, and can be considered as significantly correlated with human emotions. For example, dissatisfaction with noise and negative affects had inverse correlations with the performance metrics of several tests, which may be because the subjects tried to finish the tasks quickly at the expense of accuracy when their dissatisfaction or negative emotions increased. The lower ratings on noise annoyance were moderately correlated with an impaired ability to distinguish the frequency differences of sound stimuli. Positive affects were positively correlated with reaction speed in the Stoop test.
Figure 11.
Correlations between the experimental variables. * (p < 0.5), ** (p < 0.01).

4. Discussion
4.1. Comparison with Previous Studies
This study comprehensively investigated the impact of noise exposure on subjects’ subjective perceptions and cognitive performance. The findings reveal that a decrease in noise SPL has a favorable influence, diminishing dissatisfaction and annoyance while concurrently enhancing positive emotions, accelerating execution speed, and improving auditory perception and discrimination abilities. Notably, many of these positive effects could be counteracted by sharper noise, underscoring the dual benefits of reducing SPL and enhancing sound quality in bolstering human performance. Based on previous research, the installation of absorption materials is considered as a good method for noise reduction [58]. However, considering that doubling the amount of absorption material only results in a 3 dB decrease in the intensity of a single voice in an experimental room [59], it can be inferred that designing noise reduction solely to attenuate sound levels may prove cost-ineffective or unfeasible in constrained spaces. Therefore, in addition to reducing noise intensity, the enhancement of sound quality, such as by reducing sharpness, is recommended as a complementary strategy for noise control in buildings.
The impact of noise on subjects’ negative affects, short-term working memory, and mathematical performance was not found to be statistically significant. Actually, there were conflicting results regarding the effects of noise on cognitive function in previous studies. Some studies determined that noise improved cognitive function [60], while others concluded that noise reduced cognitive function [61]. Song et al. [62] found that both noise sensitivity (high sensitivity/low sensitivity) and noise type (quiet/road traffic noise/speech noise) had significant effects on the response time of working memory in college students. However, Stansfeld et al. [63] found no effect of aircraft noise exposure on 2844 children’s sustained attention, working memory, or their delayed recall of orally presented stories. Hygge [63] showed that aircraft and road traffic noise impaired recall performance, while train and speech noise had no effect on recall and recognition. Maria et al. [21] also pointed out that impairments occurred with single-talker speech and non-speech sounds such as tones or instrumental music, but not with continuous broadband noise or babble noise.
In addition, it is worth noting that the detrimental effects of noise on human performance may often occur at moderate or high levels of noise. Sometimes, sound can be stimulating or cause a positive mood change, which might in turn result in an increase in performance [64]. This may be because low-level noise supports a state of wakefulness and mental activation, without which people can become sleepy and inefficient [28,32]. Thus, a certain amount of discomfort, such as distracting noise, may be occasionally introduced to avoid a state of sensory deprivation [32]. The inclusion of a moderate degree of environmental stress was even viewed by Craig [65] as a basic engineering principle.
4.2. Underlying Mechanism Analysis Based on PLS-SEM
The findings directly led us to the confirmatory hypothesis that accounts for the underlying mechanism of the effects of noise on cognitive performance:
H1:
Human cognitive performance would be directly affected by the noise exposure environment, and the effects would be enhanced or weakened in the cognitive process.
H2:
Human emotions would be directly affected by the noise exposure environment, which would also result in a change in cognitive performance.
The proposed hypotheses were verified using the PLS-SEM method based on bootstrapping with 5000 samples. The variables were analyzed after Z-score normalization. Figure 12 shows the path coefficients, statistical significance, and explained variance (R2) of the established structural model. The model met the requirements of construct reliability and convergent validity of measurement models. The standardized root mean square residual (SRMR) was 0.121, the normed fit index (NFI) was 0.700, and the root mean squared residual squared covariance matrix (RMS-theta) was 0.250, which indicated an acceptable fitting ability. It is worth noting that the standardized regression estimates of sound quality to positive emotion were close to significant (p = 0.101), which may be due to the relatively small sample size. The fitting effect would be better with a larger sample size.
According to Figure 12, the results can be summarized as follows:
- (1)
- The poorer sound quality directly resulted in an increase in the hearing threshold and frequency discrimination threshold. These effects, however, had no further impact on the performance of visual tasks (such as the PVT test, 2-back test, and Stroop test, in this study), which may be due to the different perception channels required for various cognitive tests.
- (2)
- The subject’s positive and negative emotions were directly impacted by noise exposure, which further affected the subject’s cognitive performance with different effect paths. The effect of noise on cognitive performance may be transferred to information processing and, ultimately, to executive function.
- (3)
- Overall, these findings may imply a potential underlying mechanism of the effect of noise on cognitive performance, indicating that negative feelings towards noise contribute to poor emotional states, subsequently influencing cognitive processes and impairing executive function.
Previous research studies have discussed the potential mechanism of the effect of noise on human performance. For example, Mohammad et al. [28] reported that the effects of high levels of noise exposure on cognitive performance can be amended to the Poulton arousal model. They stated that noise exposure increases cognitive performance at first. The reason for this is an increase in arousal to reduce the effect of noise on cognitive function. But, gradually, the effect of arousal wears off, and the negative effects of noise exposure on cognitive function begin to show. In other words, no effects of noise were observed on the task performance when the coping strategy of subjects was successful to mediate the potential risks of the unfavorable condition, whereas effects might be found when their coping strategy failed. It may mean that the more complex the task, the greater the probability that the effects of noise would be evidenced. To sum up, the underlying mechanisms proposed above all indicate that noise should be considered to be cognitively taxing, thus limiting residual cognitive resources to attend to or process target stimuli/information [11,66]. These hypotheses, however, have not been comprehensively validated, and the analysis of the impact pathway on various types of human cognitive processes is limited. The findings of this study not only offer partial support for prior research but also illuminate the transmission mechanism linking subjects’ emotions and different cognitive functions under the influence of noise exposure.
4.3. Limitations
This study has certain limitations that should be taken into consideration: (1) The sample size of 12 subjects (each underwent three different experimental conditions) might lead to underpowered statistical results, which should be considered the main limitation of this study. Thus, the findings with p-values modestly higher than 0.05 were also worthy of attention, and a larger sample size would be desirable to validate our findings in future studies. (2) The subjects were limited to healthy college-age male students, which might be insufficient to generalize the results. Accordingly, a larger and mixed population are recommended for involvement in future studies. (3) Only three noise exposure conditions were established due to limited experimental resources. These conditions were formed by varying the levels of two independent variables, which makes it difficult for our findings to fully explain the direct effect of noise sharpness on human responses. Future studies should incorporate additional experimental conditions, encompassing a broader range of SPL and incorporating more sound quality parameters. (4) The mediating variable (emotion) identified through the PLS-SEM analysis can be influenced by various neurological and physiological processes. It is imperative to account for additional latent variables that may impact the hypotheses established for the underlying mechanism of the effect of noise on cognitive performance.
5. Conclusions
This paper sought to explore the impact of noise exposure on human subjective perceptions and cognitive performance, emphasizing the perspective of sound quality. The key findings are as follows:
- (1)
- Reduction in noise SPL is beneficial in diminishing subject dissatisfaction, annoyance, and false alerts, while concurrently enhancing positive emotions, improving auditory perception and discrimination abilities, and accelerating execution speed. Importantly, these effects are largely counteracted by poor sound quality, characterized by increased noise sharpness.
- (2)
- Subjective annoyance exhibits greater sensitivity to changes in noise conditions compared to dissatisfaction, and this intensifies with prolonged exposure.
- (3)
- Significant correlations were observed between human emotions and cognitive abilities, with emotions serving as mediators between noise exposure and cognitive performance. The underlying mechanism suggests that unfavorable feelings towards noise contribute to diminished emotional states, subsequently influencing cognitive processes and impairing executive function.
In summary, these results provide a new understanding of the effect of noise on human cognition and emotion. It is imperative to underscore that noise control designs should not solely focus on reducing sound levels, but also consider enhancements in sound quality.
Author Contributions
Conceptualization, J.Z., L.P. and X.C.; methodology, J.Z.; software, L.P.; validation, X.C.; formal analysis, J.Z. and L.P.; investigation, C.Y.; resources, Y.F.; data curation, B.Z.; writing—original draft preparation, J.Z. and L.P.; writing—review and editing, X.C.; visualization, J.Z.; supervision, L.P.; project administration, L.P.; funding acquisition, X.C. and J.Z. All authors have read and agreed to the published version of the manuscript.
Funding
This research was funded by the National Natural Science Foundation of China (grant number 52008014), the Postdoctoral Fellowship Program of CPSF (grant number GZC20231237), and the Fundamental Research Funds for the Central Universities (grant number YWF-23-SDHK-L-013).
Data Availability Statement
The datasets used or analyzed during this study are available from the corresponding author on reasonable request.
Acknowledgments
We are grateful to Pei Li and Tian He for their technical support, and to all the participants involved in the experiments.
Conflicts of Interest
The authors declare no conflicts of interest.
Appendix A

Table A1.
GAMM results for the effects of noise and exposure time on perceived sound quality, taking N85-S1 and TP1 as references.
Table A1.
GAMM results for the effects of noise and exposure time on perceived sound quality, taking N85-S1 and TP1 as references.
| Condition | Dissatisfaction | Annoying | Perceived Loudness | Perceived Sharpness | Perceived Roughness | |||||
|---|---|---|---|---|---|---|---|---|---|---|
| Estimate | p-Value | Estimate | p-Value | Estimate | p-Value | Estimate | p-Value | Estimate | p-Value | |
| (N85-S1,TP1) | 4.083 | — | 3.333 | — | 4.583 | — | 2.250 | — | 3.417 | — |
| N80-S1 | −0.250 | 0.360 | −1.167 ** | <0.001 | −1.583 ** | <0.001 | −0.500 | 0.062 | −0.667 | 0.114 |
| N75-S2 | −0.917 ** | 0.001 | −0.917 ** | 0.002 | −1.333 ** | <0.001 | 1.167 ** | <0.001 | −0.250 | 0.552 |
| TP2 | −0.250 | 0.360 | −0.833 ** | 0.005 | −0.500 | 0.098 | 0.000 | 1.000 | 0.000 | 1.000 |
| TP3 | −0.167 | 0.541 | −0.333 | 0.257 | −0.667 * | 0.028 | −0.083 | 0.754 | 0.000 | 1.000 |
| TP4 | −0.167 | 0.541 | −0.833 | 0.776 | −0.500 | 0.098 | 0.000 | 1.000 | −0.167 | 0.692 |
| TP5 | 0.000 | 1.000 | −0.833 | 0.776 | −0.333 | 0.268 | 0.083 | 0.754 | 0.000 | 1.000 |
| N80-S1:TP2 | −0.083 | 0.829 | 0.917 * | 0.028 | 0.083 | 0.845 | 0.167 | 0.658 | −0.083 | 0.889 |
| N75-S2:TP2 | 0.500 | 0.196 | 1.083 * | 0.010 | 0.417 | 0.327 | −0.083 | 0.825 | 0.167 | 0.779 |
| N80-S1:TP3 | 0.083 | 0.829 | 0.500 | 0.229 | 0.333 | 0.433 | 0.500 | 0.185 | 0.000 | 1.000 |
| N75-S2:TP3 | 0.594 | 0.129 | 0.600 | 0.154 | 0.590 | 0.171 | 0.071 | 0.852 | 0.060 | 0.921 |
| N80-S1:TP4 | −0.250 | 0.517 | 0.833 * | 0.046 | 0.583 | 0.171 | 0.167 | 0.658 | 0.417 | 0.484 |
| N75-S2:TP4 | 0.667 | 0.085 | 0.500 | 0.229 | 0.500 | 0.240 | 0.417 | 0.269 | 0.667 | 0.263 |
| N80-S1:TP5 | −0.667 | 0.085 | 0.833 * | 0.046 | 0.417 | 0.327 | 0.167 | 0.658 | 0.333 | 0.575 |
| N75-S2:TP5 | 0.417 | 0.281 | 0.250 | 0.547 | 0.500 | 0.240 | 0.083 | 0.825 | 0.333 | 0.575 |
* (p < 0.5), ** (p < 0.01).
Table A2.
GAMM results for the effect of noise on human emotions.
| Tests | Metrics | Condition | Estimate | p-Value | Condition | Estimate | p-Value |
|---|---|---|---|---|---|---|---|
| PANAS scale | Positive affect | Intercept | 21.167 | — | Intercept | 23.750 | — |
| N85-S1 | Reference | N85-S1 | −2.583 | 0.131 | |||
| N80-S1 | 2.583 | 0.131 | N80-S1 | Reference | |||
| N75-S2 | 5.083 ** | 0.005 | N75-S2 | 2.500 | 0.143 | ||
| Negative affect | Intercept | 15.500 | — | Intercept | 14.333 | — | |
| N85-S1 | Reference | N85-S1 | 1.167 | 0.345 | |||
| N80-S1 | −1.167 | 0.345 | N80-S1 | Reference | |||
| N75-S2 | −1.167 | 0.345 | N75-S2 | 0.000 | 1.000 | ||
** (p < 0.01).
Table A3.
GAMM results for the effect of noise on cognitive performance metrics.
| Tests | Metrics | Condition | Estimate | p-Value | Condition | Estimate | p-Value |
|---|---|---|---|---|---|---|---|
| Auditory tests | Absolute threshold of hearing | Intercept | −26.645 | — | Intercept | −32.058 | — |
| N85-S1 | Reference | N85-S1 | 5.412 ** | 0.008 | |||
| N80-S1 | −5.412 ** | 0.008 | N80-S1 | Reference | |||
| N75-S2 | −35.296 ** | <0.001 | N75-S2 | −29.883 ** | <0.001 | ||
| Duration discrimination threshold | Intercept | 319.479 | — | Intercept | 311.612 | — | |
| N85-S1 | Reference | N85-S1 | 7.867 | 0.069 | |||
| N80-S1 | −7.867 | 0.069 | N80-S1 | Reference | |||
| N75-S2 | −12.200 ** | 0.007 | N75-S2 | −4.333 | 0.304 | ||
| Frequency discrimination threshold | Intercept | 1014.648 | — | Intercept | 1006.266 | — | |
| N85-S1 | Reference | N85-S1 | 8.382 * | 0.036 | |||
| N80-S1 | −8.382 * | 0.036 | N80-S1 | Reference | |||
| N75-S2 | −8.383 * | 0.036 | N75-S2 | −0.001 | 1.000 | ||
| 2-back | Accuracy | Intercept | 0.985 | — | Intercept | 0.979 | — |
| N85-S1 | Reference | N85-S1 | 0.006 | 0.385 | |||
| N80-S1 | −0.006 | 0.385 | N80-S1 | Reference | |||
| N75-S2 | 0.006 | 0.385 | N75-S2 | 0.013 | 0.090 | ||
| Correct RT | Intercept | 861.813 | — | Intercept | 881.982 | — | |
| N85-S1 | Reference | N85-S1 | −20.169 | 0.588 | |||
| N80-S1 | 20.169 | 0.588 | N80-S1 | Reference | |||
| N75-S2 | −0.455 | 0.990 | N75-S2 | −20.624 | 0.579 | ||
| PVT | First 10% RT | Intercept | 274.173 | — | Intercept | 265.217 | — |
| N85-S1 | Reference | N85-S1 | 8.956 | 0.223 | |||
| N80-S1 | −8.956 | 0.223 | N80-S1 | Reference | |||
| N75-S2 | 9.998 | 0.175 | N75-S2 | 18.954 * | 0.015 | ||
| Last 10% RT | Intercept | 451.660 | — | Intercept | 416.083 | — | |
| N85-S1 | Reference | N85-S1 | 35.576 | 0.092 | |||
| N80-S1 | −35.576 | 0.092 | N80-S1 | Reference | |||
| N75-S2 | −20.106 | 0.330 | N75-S2 | 15.471 | 0.451 | ||
| Minimum RT | Intercept | 263.417 | — | Intercept | 254.833 | — | |
| N85-S1 | Reference | N85-S1 | 8.583 | 0.202 | |||
| N80-S1 | −8.583 | 0.202 | N80-S1 | Reference | |||
| N75-S2 | 7.250 | 0.279 | N75-S2 | 15.833 * | 0.024 | ||
| Median RT | Intercept | 316.667 | — | Intercept | 308.375 | — | |
| N85-S1 | Reference | N85-S1 | 8.292 | 0.276 | |||
| N80-S1 | −8.292 | 0.276 | N80-S1 | Reference | |||
| N75-S2 | 10.208 | 0.183 | N75-S2 | 18.500 * | 0.021 | ||
| Maximum RT | Intercept | 474.750 | — | Intercept | 444.417 | — | |
| N85-S1 | Reference | N85-S1 | 30.333 | 0.194 | |||
| N80-S1 | −30.333 | 0.194 | N80-S1 | Reference | |||
| N75-S2 | −20.833 | 0.368 | N75-S2 | 9.500 | 0.679 | ||
| Number of errors | Intercept | 0.583 | — | Intercept | 0.333 | — | |
| N85-S1 | Reference | N85-S1 | 0.250 | 0.356 | |||
| N80-S1 | −0.250 | 0.356 | N80-S1 | Reference | |||
| N75-S2 | 0.083 | 0.756 | N75-S2 | 0.333 | 0.222 | ||
| Number of lapses | Intercept | 1.083 | — | Intercept | 0.167 | — | |
| N85-S1 | Reference | N85-S1 | 0.917 * | 0.016 | |||
| N80-S1 | −0.917 * | 0.016 | N80-S1 | Reference | |||
| N75-S2 | −0.583 | 0.110 | N75-S2 | 0.333 | 0.351 | ||
| Reaction speed | Intercept | 3.067 | — | Intercept | 3.164 | — | |
| N85-S1 | Reference | N85-S1 | −0.097 | 0.257 | |||
| N80-S1 | 0.097 | 0.257 | N80-S1 | Reference | |||
| N75-S2 | −0.080 | 0.348 | N75-S2 | −0.177 * | 0.045 | ||
| Index of PVT | Intercept | 135.167 | — | Intercept | 142.391 | — | |
| N85-S1 | Reference | N85-S1 | −7.223 | 0.123 | |||
| N80-S1 | 7.223 | 0.123 | N80-S1 | Reference | |||
| N75-S2 | −5.190 | 0.261 | N75-S2 | −12.413 * | 0.012 | ||
| Math calculation | Accuracy | Intercept | 0.936 | — | Intercept | 0.942 | — |
| N85-S1 | Reference | N85-S1 | −0.006 | 0.758 | |||
| N80-S1 | 0.006 | 0.758 | N80-S1 | Reference | |||
| N75-S2 | 0.014 | 0.443 | N75-S2 | 0.008 | 0.644 | ||
| Correct RT | Intercept | 4583.681 | — | Intercept | 4433.043 | — | |
| N85-S1 | Reference | N85-S1 | 150.638 | 0.421 | |||
| N80-S1 | −150.638 | 0.421 | N80-S1 | Reference | |||
| N75-S2 | −231.408 | 0.221 | N75-S2 | −80.770 | 0.664 | ||
| Stroop | Accuracy | Intercept | 0.956 | — | Intercept | 0.969 | — |
| N85-S1 | Reference | N85-S1 | −0.013 | 0.118 | |||
| N80-S1 | 0.013 | 0.118 | N80-S1 | Reference | |||
| N75-S2 | 0.005 | 0.505 | N75-S2 | −0.007 | 0.353 | ||
| Correct RT | Intercept | 391.000 | — | Intercept | 373.721 | — | |
| N85-S1 | Reference | N85-S1 | 17.278 * | 0.047 | |||
| N80-S1 | −17.278 * | 0.047 | N80-S1 | Reference | |||
| N75-S2 | −14.506 | 0.091 | N75-S2 | 2.772 | 0.739 | ||
| Accuracy for consistent | Intercept | 0.963 | — | Intercept | 0.973 | — | |
| N85-S1 | Reference | N85-S1 | −0.010 | 0.425 | |||
| N80-S1 | 0.010 | 0.425 | N80-S1 | Reference | |||
| N75-S2 | 0.000 | 1.000 | N75-S2 | −0.010 | 0.425 | ||
| Correct RT for consistent | Intercept | 391.295 | — | Intercept | 374.726 | — | |
| N85-S1 | Reference | N85-S1 | 16.570 | 0.097 | |||
| N80-S1 | −16.570 | 0.097 | N80-S1 | Reference | |||
| N75-S2 | −17.595 | 0.080 | N75-S2 | −1.025 | 0.916 | ||
| Accuracy for inconsistent | Intercept | 0.950 | — | Intercept | 0.965 | — | |
| N85-S1 | Reference | N85-S1 | −0.015 | 0.195 | |||
| N80-S1 | 0.015 | 0.195 | N80-S1 | Reference | |||
| N75-S2 | 0.010 | 0.350 | N75-S2 | −0.004 | 0.706 | ||
| Correct RT for inconsistent | Intercept | 393.501 | — | Intercept | 374.080 | — | |
| N85-S1 | Reference | N85-S1 | 19.422 * | 0.033 | |||
| N80-S1 | −19.422 * | 0.033 | N80-S1 | Reference | |||
| N75-S2 | −13.633 | 0.124 | N75-S2 | 5.788 | 0.504 | ||
* (p < 0.5), ** (p < 0.01).
References
- Hahad, O.; Kuntic, M.; Al-Kindi, S.; Kuntic, I.; Gilan, D.; Petrowski, K.; Daiber, A.; Münzel, T. Noise and mental health: Evidence, mechanisms, and consequences. J. Expo. Sci. Environ. Epidemiol. 2024. [Google Scholar] [CrossRef] [PubMed]
- Jafari, Z.; Kolb, B.E.; Mohajerani, M.H. Chronic traffic noise stress accelerates brain impairment and cognitive decline in mice. Exp. Neurol. 2018, 308, 1–12. [Google Scholar] [CrossRef] [PubMed]
- Cheng, Y.; Wang, X.; Yu, Y.; Gu, J.; Zhao, M.; Fu, Q.; Song, Y.L.; Liu, Y. Noise induced depression-like behavior, neuroinflammation and synaptic plasticity impairments: The protective effects of luteolin. Neurochem. Res. 2022, 47, 3318–3330. [Google Scholar] [CrossRef] [PubMed]
- Hahad, O.; Bayo Jimenez, M.T.; Kuntic, M.; Frenis, K.; Steven, S.; Daiber, A.; Muenzel, T. Cerebral consequences of environmental noise exposure. Environ. Int. 2022, 165, 107306. [Google Scholar] [CrossRef] [PubMed]
- Molesworth, B.R.C.; Burgess, M. Improving intelligibility at a safety critical point: In flight cabin safety. Saf. Sci. 2013, 51, 11–16. [Google Scholar] [CrossRef]
- Molesworth, B.R.C.; Burgess, M.; Wilcock, C. Comparison of the effects on memory tasks of babble and broadband noise. Acoust. Aust. 2018, 64, 205–214. [Google Scholar] [CrossRef]
- Herweg, N.A.; Bunzeck, N. Differential effects of white noise in cognitive and perceptual tasks. Front. Psychol. 2015, 6, 1639. [Google Scholar] [CrossRef] [PubMed]
- World Health Organization. Burden of Disease from Environmental Noise: Quantification of Healthy Life Years Lost in Europe; World Health Organization: Geneva, Switzerland, 2011. [Google Scholar]
- European Environment Agency. Noise; European Environment Agency: Copenhagen, Denmark, 2023. [Google Scholar]
- Lo Castro, F.; Iarossi, S.; Brambilla, G.; Mariconte, R.; Diano, M.; Bruzzaniti, V.; Strigari, L.; Raffaele, G.; Giliberti, C. Surveys on Noise in Some Hospital Wards and Self-Reported Reactions from Staff: A Case Study. Buildings 2022, 12, 2077. [Google Scholar] [CrossRef]
- Casla-Herguedas, B.; Romero-Fernández, A.; Carrascal, T.; Navas-Martín, M.A.; Cuerdo-Vilches, T. Noise Perception and Health Effects on Population: A Cross-Sectional Study on COVID-19 Lockdown by Noise Sources for Spanish Dwellings. Buildings 2023, 13, 2224. [Google Scholar] [CrossRef]
- Zajamsek, B.; Hansen, K.L.; Nguyen, P.D.; Lechat, B.; Micic, G.; Catcheside, P. Acceptability of amplitude modulated tonal wind farm noise for sleep: A laboratory study. Appl. Acoust. 2023, 205, 109234. [Google Scholar] [CrossRef]
- Okimiji, O.P.; Okafor, A.T.; Fasona, M.I.; Atoro, T.; Aborisade, M.A.; Simon, J.N. Proliferation of noise pollution: Implication on health and community perception in coastal slums. Appl. Acoust. 2023, 214, 109713. [Google Scholar] [CrossRef]
- Prell, C.G.; Hackett, T.A.; Ramachandran, R. Noise-induced hearing loss and its prevention: Current issues in mammalian hearing. Curr. Opin. Physiol. 2020, 18, 32–36. [Google Scholar] [CrossRef] [PubMed]
- Nathanson, J.A.; Berg, R.E.; Beeson, R. Noise Pollution. Britannica—Animals & Nature, 22 February 2024. [Google Scholar]
- Manohar, S.; Adler, H.J.; Radziwon, K.; Salvi, R. Interaction of Auditory and Pain Pathways: Effects of Stimulus Intensity, Hearing Loss and Opioid Signaling. Hear. Res. 2020, 393, 108012. [Google Scholar] [CrossRef] [PubMed]
- Hahad, O.; Prochaska, J.H.; Daiber, A.; Muenzel, T. Environmental noise-induced effects on stress hormones, oxidative stress, and vascular dysfunction: Key factors in the relationship between cerebrocardiovascular and psychological disorders. Oxid. Med. Cell. Longev. 2019, 2019, 4623109. [Google Scholar] [CrossRef] [PubMed]
- Monteiro, R.; Tomé, D.; Neves, P.; Silva, D.; Rodrigues, M.A. The interactive effect of occupational noise on attention and short-term memory: A pilot study. Noise Health 2018, 20, 190–198. [Google Scholar] [PubMed]
- Kostallari, K.; Parizet, E.; Chevret, P.; Amato, J.; Galy, E. Irrelevant speech effect in open plan offices: Comparison of two models explaining the decrease in performance by speech intelligibility and attempt to reduce inter individual differences of the mental workload by task customization. Appl. Acoust. 2020, 161, 107180. [Google Scholar] [CrossRef]
- Schlittmeier, S.J.; Weißgerber, T.; Kerber, S.; Fastl, H.; Hellbrück, J. Algorithmic modeling of the irrelevant sound effect (ISE) by the hearing sensation fluctuation strength. Atten. Percept. Psychophys. 2012, 74, 194–203. [Google Scholar] [CrossRef] [PubMed]
- Maria, K.; Kirstin, B.; Thomas, L. Does noise affect learning? A short review on noise effects on cognitive performance in children. Front. Psychol. 2013, 4, 578. [Google Scholar]
- Reinten, J.; Braat-Eggen, P.E.; Hornikx, M.; Kort, H.S.; Kohlrausch, A. The indoor sound environment and human task performance: A literature review on the role of room acoustics. Build. Environ. 2017, 123, 315–332. [Google Scholar] [CrossRef]
- Dipayan, D. A Systematic Review of the Effects of Noise Characteristics on Human Mental Performance. In Proceedings of the International Conference of the Indian Society of Ergonomics, Aligarh, India, 8–10 December 2021; pp. 1705–1717. [Google Scholar]
- Molesworth, B.R.C.; Burgess, M.; Zhou, A. The effects of noise on key workplace skills. J. Acoust. Soc. Am. 2015, 138, 2054–2061. [Google Scholar] [CrossRef]
- Molesworth, B.R.C.; Burgess, M.; Koh, S. The relationship between noise and mode of delivery on recognition memory and working memory. Appl. Acoust. 2017, 116, 329–336. [Google Scholar] [CrossRef]
- Schlittmeier, S.J.; Hellbrück, J.; Thaden, R.; Vorländer, M. The impact of background speech varying in intelligibility: Effects on cognitive performance and perceived disturbance. Ergonomics 2008, 51, 719–736. [Google Scholar] [CrossRef] [PubMed]
- Yang, C.Y.; Pang, L.P.; Liang, J.; Cao, X.D.; Fan, Y.R.; Zhang, J. Experimental Investigation of Task Performance and Human Vigilance in Different Noise Environments. Appl. Sci. 2022, 12, 11376. [Google Scholar] [CrossRef]
- Mohammad, J.J.; Reza, K.; Soheila, K.; Farough, M. The Effect of Noise Exposure on Cognitive Performance and Brain Activity Patterns. Open Access Maced. J. Med. Sci. 2019, 7, 2924–2931. [Google Scholar]
- Button, C.D.; Behm, G.D.; Holmes, M.; Mackinnon, N.S. Noise and muscle contraction affecting vigilance task performance. Occup. Ergon. 2004, 4, 157–171. [Google Scholar] [CrossRef]
- Irgens-Hansen, K.; Gundersen, H.; Sunde, E.; Baste, V.; Harris, A.; Bråtveit, M.; Moen, B.E. Noise exposure and cognitive performance: A study on personnel on board Royal Norwegian Navy vessels. Noise Health 2015, 17, 320–327. [Google Scholar] [CrossRef]
- Koelega, H.S.; Brinkman, J. Noise and vigilance: An evaluative review. Hum. Factors 1986, 28, 465–481. [Google Scholar] [CrossRef] [PubMed]
- Nassiri, P.; Monazam, M.; Dehaghi, B.F.; Ghavam, L.I.; Zakerian, S.A.; Azam, K. The effect of noise on human performance: A clinical trial. Int. J. Occup. Environ. Med. 2013, 4, 87–95. [Google Scholar] [PubMed]
- Ke, J.; Du, J.; Luo, X. The effect of noise content and level on cognitive performance measured by electroencephalography (EEG). Autom. Constr. 2021, 130, 103836. [Google Scholar] [CrossRef]
- Zalejska-Jonsson, A. Perceived Acoustic Quality and Effect on Occupants’ Satisfaction in Green and Conventional Residential Buildings. Buildings 2019, 9, 24. [Google Scholar] [CrossRef]
- Mohammadi, Z.; Jafari, M.J.; Khavanin, A.; Jafarpisheh, A.S.; Ameri, A.; Pouyakian, M. Dynamic EEG changes during exposure to noise at different levels of loudness and sharpness. Appl. Acoust. 2024, 216, 109739. [Google Scholar] [CrossRef]
- Yu, B.Y.; Wen, L.J.; Bai, J.; Chai, Y.Y. Effect of Road and Railway Sound on Psychological and Physiological Responses in an Office Environment. Buildings 2022, 12, 6. [Google Scholar] [CrossRef]
- Rostam, G.; Ebrahim, D. The Combined Effects of Occupational Exposure to Noise and Other Risk Factors—A Systematic Review. Noise Health 2019, 21, 125–141. [Google Scholar]
- Abbasi, A.M.; Darvishi, E.; Rodrigues, M.A.; Sayehmiri, K. Gender differences in cognitive performance and psychophysiological responses during noise exposure and different workloads. Appl. Acoust. 2022, 189, 108602. [Google Scholar] [CrossRef]
- Blauert, J. Product-sound design and assessment: An enigmatic issue from the point of view of engineering. In Proceedings of the INTER-NOISE and NOISE-CON Congress and Conference, Yokohama, Japan, 29–31 August 1994. [Google Scholar]
- Blauert, J.; Jekosch, U. Sound quality evaluation—A multilayered problem. Acta Acust. United Acust. 1997, 83, 747–753. [Google Scholar]
- Wang, Y.; Guo, H.; Yang, C. Objective Evaluation Model of Sound Quality. In Vehicle Interior Sound Quality; Springer: Singapore, 2023. [Google Scholar]
- Lan, L.; Lian, Z.W. Application of statistical power analysis-How to determine the right sample size in human health, comfort and productivity research. Build. Environ. 2010, 45, 1202–1213. [Google Scholar] [CrossRef]
- Fan, Y.R.; Liang, J.; Cao, X.D.; Pang, L.P.; Zhang, J. Effects of Noise Exposure and Mental Workload on Physiological Responses during Task Execution. Int. J. Environ. Res. Public Health 2022, 19, 12434. [Google Scholar] [CrossRef] [PubMed]
- ISO/FDIS 7933:2023; Ergonomics of the Thermal Environment—Analytical Determination and Interpretation of Heat Stress Using Calculation of the Predicted Heat Strain. ISO: Geneva, Switzerland, 2023.
- ANSI/ASHRAE 55-2010; Thermal Environmental Conditions for Human Occupancy. American Society of Heating, Refrigerating and Air-Conditioning Engineers (ANSI/ASHRAE): Peachtree Corners, GA, USA, 2010.
- Watson, D.; Clark, L.A.; Tellegen, A. Development and validation of brief measures of positive and negative affect: The PANAS scales. J. Personal. Soc. Psychol. 1988, 54, 1063–1070. [Google Scholar] [CrossRef] [PubMed]
- Pang, L.P.; Zhang, J.; Cao, X.D.; Wang, X.; Liang, J.; Zhang, L.; Guo, L. The effects of carbon dioxide exposure concentrations on human vigilance and sentiment in an enclosed workplace environment. Indoor Air 2021, 31, 467–479. [Google Scholar] [CrossRef]
- Cao, X.D.; Li, P.; Zhang, J.; Pang, L.P. Associations of human cognitive abilities with elevated carbon dioxide concentrations in an enclosed chamber. Atmosphere 2022, 13, 891. [Google Scholar] [CrossRef]
- Erdodi, L.A.; Sagar, S.; Seke, K.; Zuccato, B.G.; Schwartz, E.S.; Roth, R.M. The Stroop test as a measure of performance validity in adults clinically referred for neuropsychological assessment. Psychol. Assess. 2018, 30, 755–766. [Google Scholar] [CrossRef] [PubMed]
- Wittmann, M.; Leland, D.S.; Churan, J.; Paulus, M.P. Impaired time perception and motor timing in simulant-dependent subjects. Drug Alcohol Depend. 2007, 90, 183–192. [Google Scholar] [CrossRef] [PubMed]
- Thomann, J.; Baumann, C.R.; Landolt, H.P.; Werth, E. Psychomotor vigilance task demonstrates impaired vigilance in disorders with excessive daytime sleepiness. J. Clin. Sleep Med. 2014, 10, 1019–1024. [Google Scholar] [CrossRef] [PubMed]
- Jaeggi, S.M.; Studer-Luethi, B.; Buschkuehl, M.; Su, Y.F.; Jonides, J.; Perrig, W.J. The relationship between n-back performance and matrix reasoning—Implications for training and transfer. Intelligence 2010, 38, 625–635. [Google Scholar] [CrossRef]
- Gajewski, P.D.; Hanisch, E.; Falkenstein, M.; Thönes, S.; Wascher, E. What does the n-back task measure as we get older? Relations between working-memory and other cognitive functions across the lifespan. Front. Psychol. 2018, 9, 2208. [Google Scholar] [CrossRef] [PubMed]
- Tse, C.K.; Yu, K.C. The effects of visual cues, blindfold, synesthetic experience, and music training on pure-tone frequency discrimination. Behav. Sci. 2019, 9, 2. [Google Scholar] [CrossRef]
- Zhang, J.; Pang, L.P.; Cao, X.D.; Wanyan, X.R.; Wang, X.; Liang, J.; Zhang, L. The effects of elevated carbon dioxide concentration and mental workload on task performance in an enclosed environmental chamber. Build. Environ. 2020, 178, 106938. [Google Scholar] [CrossRef]
- Zhang, J.; Cao, X.D.; Wang, X.; Pang, L.P.; Liang, J.; Zhang, L. Physiological responses to elevated carbon dioxide concentration and mental workload during performing MATB tasks. Build. Environ. 2021, 195, 107752. [Google Scholar] [CrossRef]
- Choi, H.; Kim, H.; Hong, T.; An, J. Examining the indirect effects of indoor environmental quality on task performance: The mediating roles of physiological response and emotion. Build. Environ. 2023, 236, 110298. [Google Scholar] [CrossRef]
- Mir, M.; Nasirzadeh, F.; Lee, S.H.; Cabrera, D.; Mills, A. Construction noise management: A systematic review and directions for future research. Appl. Acoust. 2022, 197, 108936. [Google Scholar] [CrossRef]
- Nijs, L.; Saher, K.; den Ouden, D. Effect of room absorption on human vocal output in multitalker situations. J. Acoust. Soc. Am. 2008, 123, 803–813. [Google Scholar] [CrossRef] [PubMed]
- Hoskin, R.; Hunter, M.; Woodruff, P. Stress improves selective attention towards emotionally neutral left ear stimuli. Acta Psychol. 2014, 151, 214–221. [Google Scholar] [CrossRef] [PubMed]
- Enmarker, I. The effects of meaningful irrelevant speech and road traffic noise on teachers’ attention, episodic and semantic memory. Scand. J. Psychol. 2010, 45, 393–405. [Google Scholar] [CrossRef] [PubMed]
- Song, C.; Li, H.Q.D.; Ma, H.R.; Han, T.; Wu, J.P. Effects of Noise Type and Noise Sensitivity on Working Memory and Noise Annoyance. Noise Health 2022, 24, 173–181. [Google Scholar] [PubMed]
- Stansfeld, S.A.; Berglund, B.; Clark, C.; Lopez-Barrio, I.; Fischer, P.; Ohrström, E.; Haines, M.M.; Head, J.; Hygge, S.; van Kamp, I.; et al. Aircraft and road traffic noise and children’s cognition and health: A cross-national study. Lancet 2005, 365, 1942–1949. [Google Scholar] [CrossRef]
- Thompson, W.F.; Schellenberg, E.G. Husain arousal, mood, and the Mozart effect. Psychol. Sci. 2001, 12, 248–251. [Google Scholar] [CrossRef]
- Craig, A. Human engineering: The control of vigilance. In Sustained Attention in Human Performance; Warm, J.S., Ed.; Wiley: Chichester, UK, 1984. [Google Scholar]
- Molesworth, B.R.C. Contextual factors impacting on aviation communication. In Aviation English: A Lingua Franca for Pilots and Air Traffic Controllers; Estival, D., Farris, C., Molesworth, B.R.C., Eds.; Routledge: London, UK, 2016. [Google Scholar]
Figure 1.
Schematic diagram of the experimental set-up.
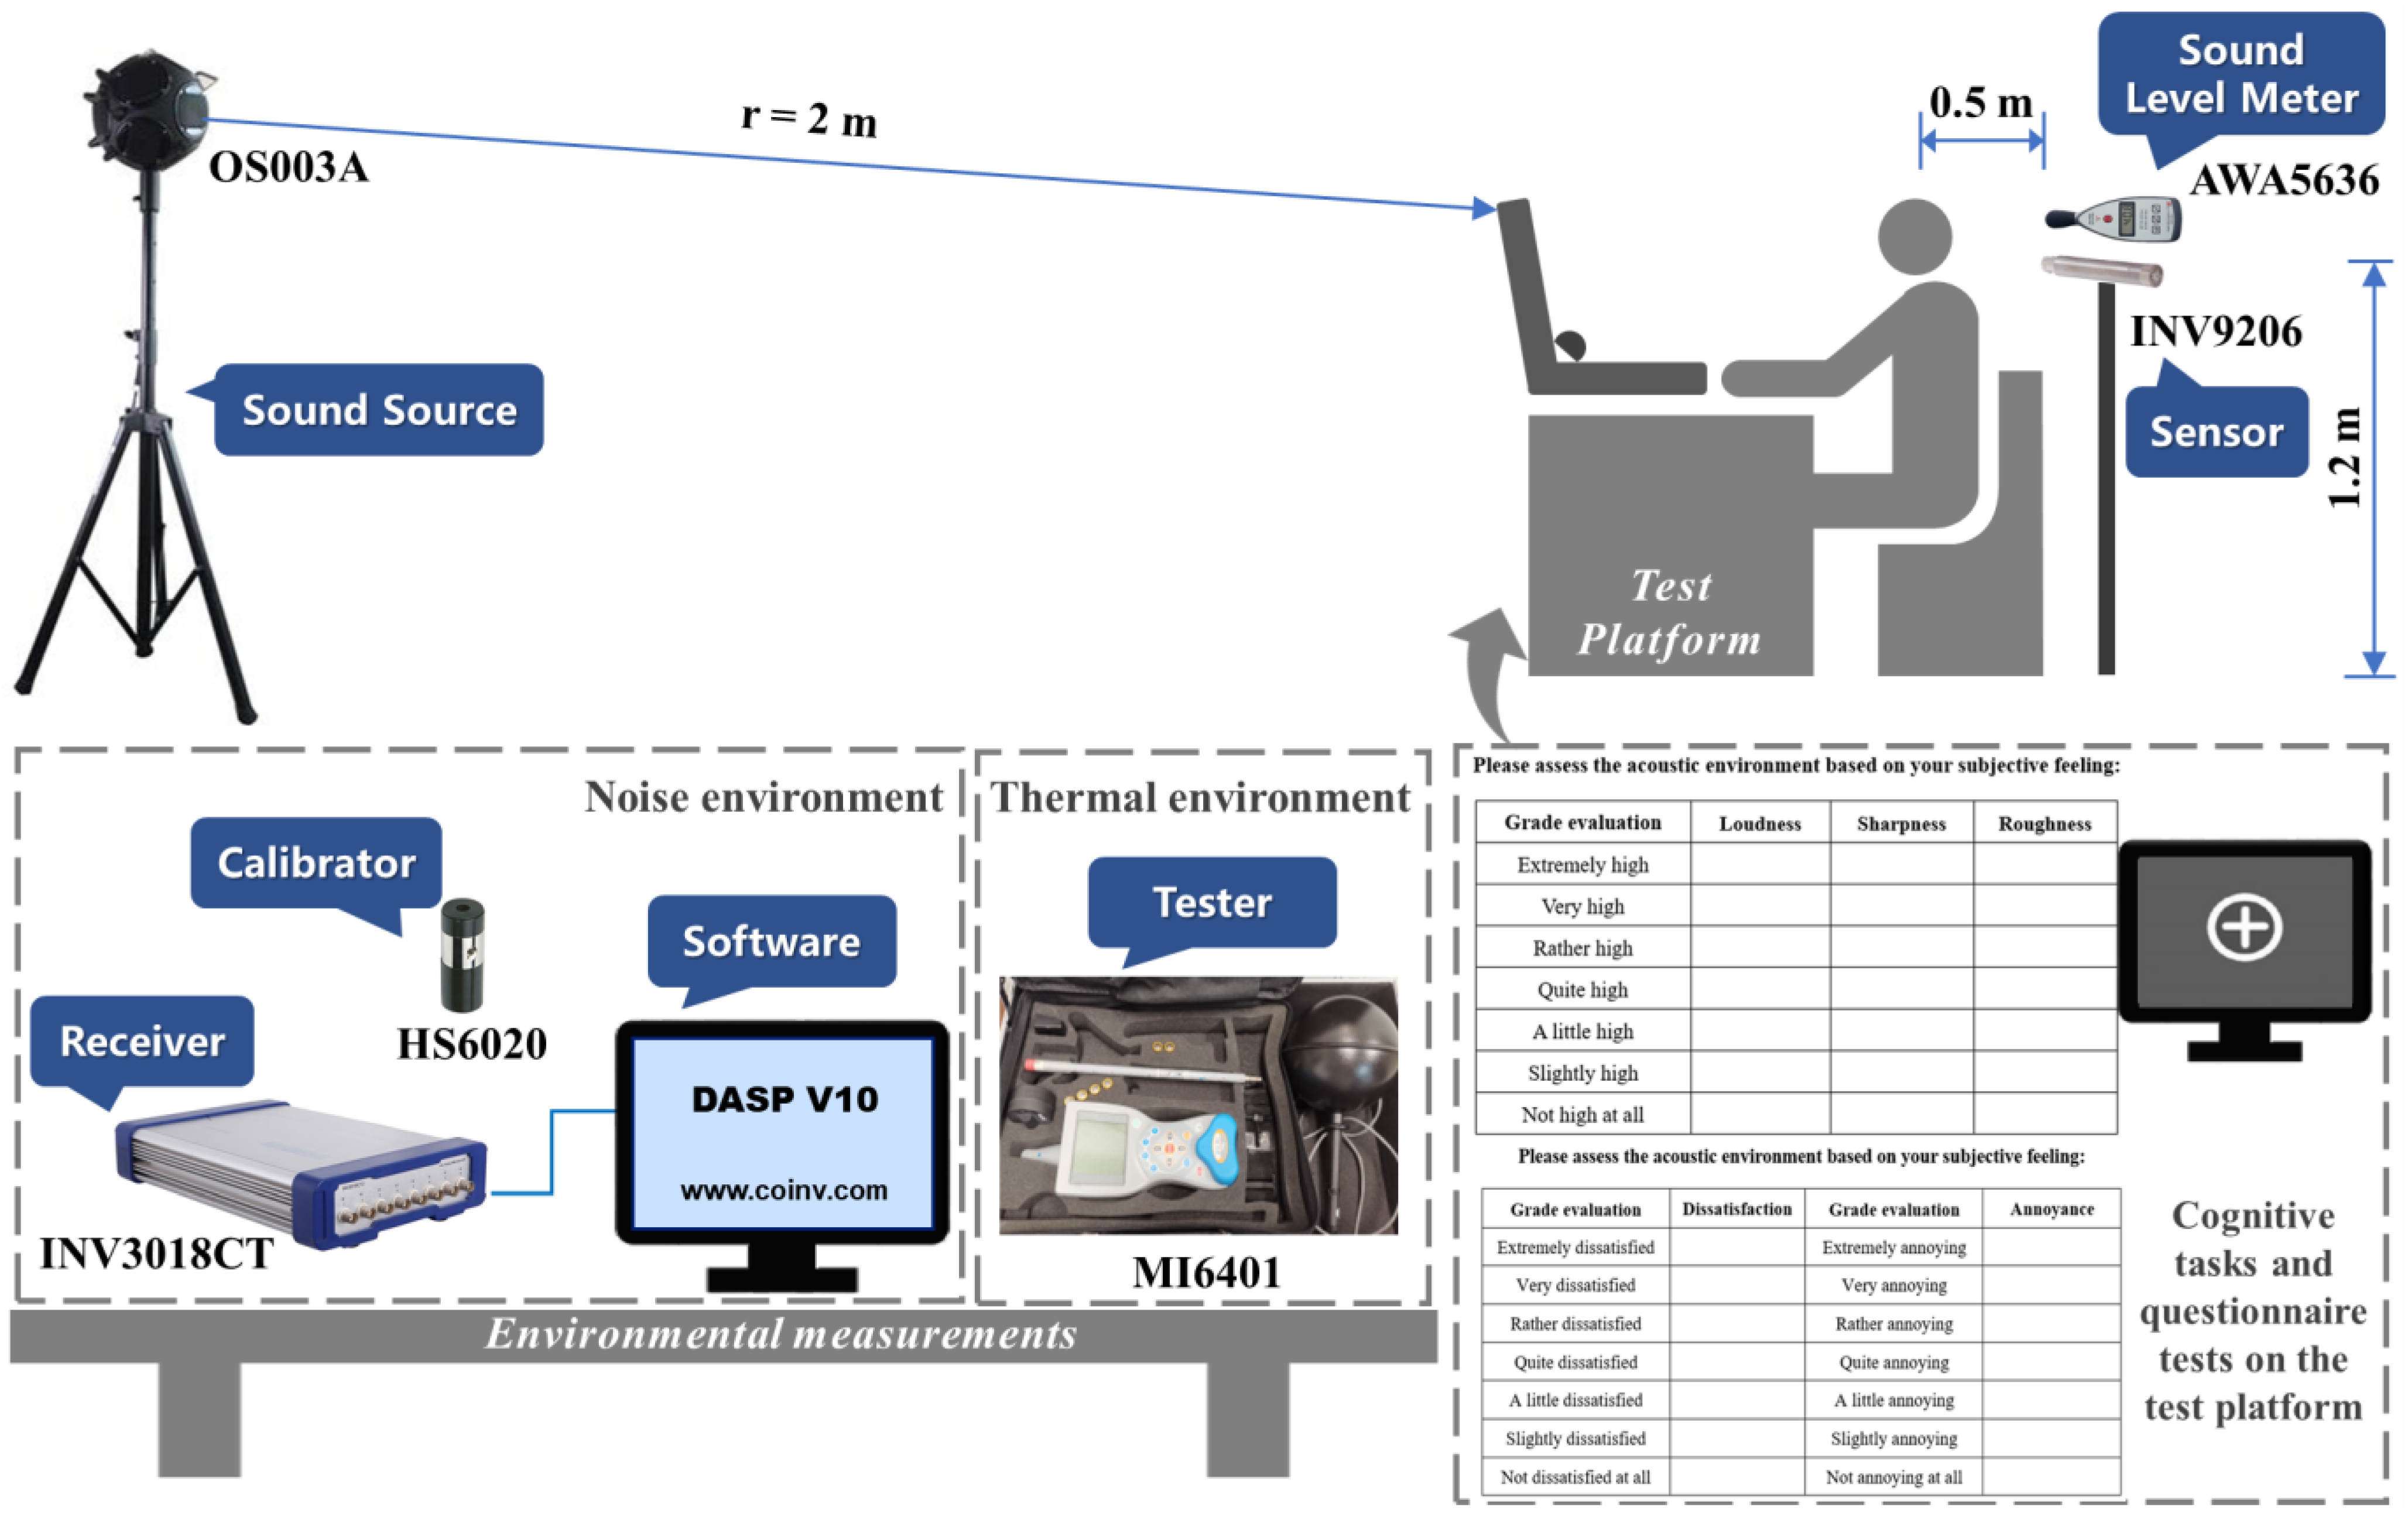
Figure 2.
Questionnaires on subjective perceived sound quality.

Figure 3.
Experimental procedure under each noise exposure condition, where TP/TS/PSQ stand for the measurement of thermal parameters, subjective thermal sensation, and perceived sound quality, respectively; ST/MAT/HTT/DDT/FDT stand for the Stroop test, the mental arithmetic test, the hearing threshold test, the duration discrimination test, and the frequency discrimination test, respectively.

Figure 4.
GAMM results of noise condition and exposure time on perceived sound quality. * (p < 0.05), ** (p < 0.01).
Figure 4.
GAMM results of noise condition and exposure time on perceived sound quality. * (p < 0.05), ** (p < 0.01).

Figure 5.
Changing trend of the PANAS scores with different noise conditions. ** (p < 0.01).
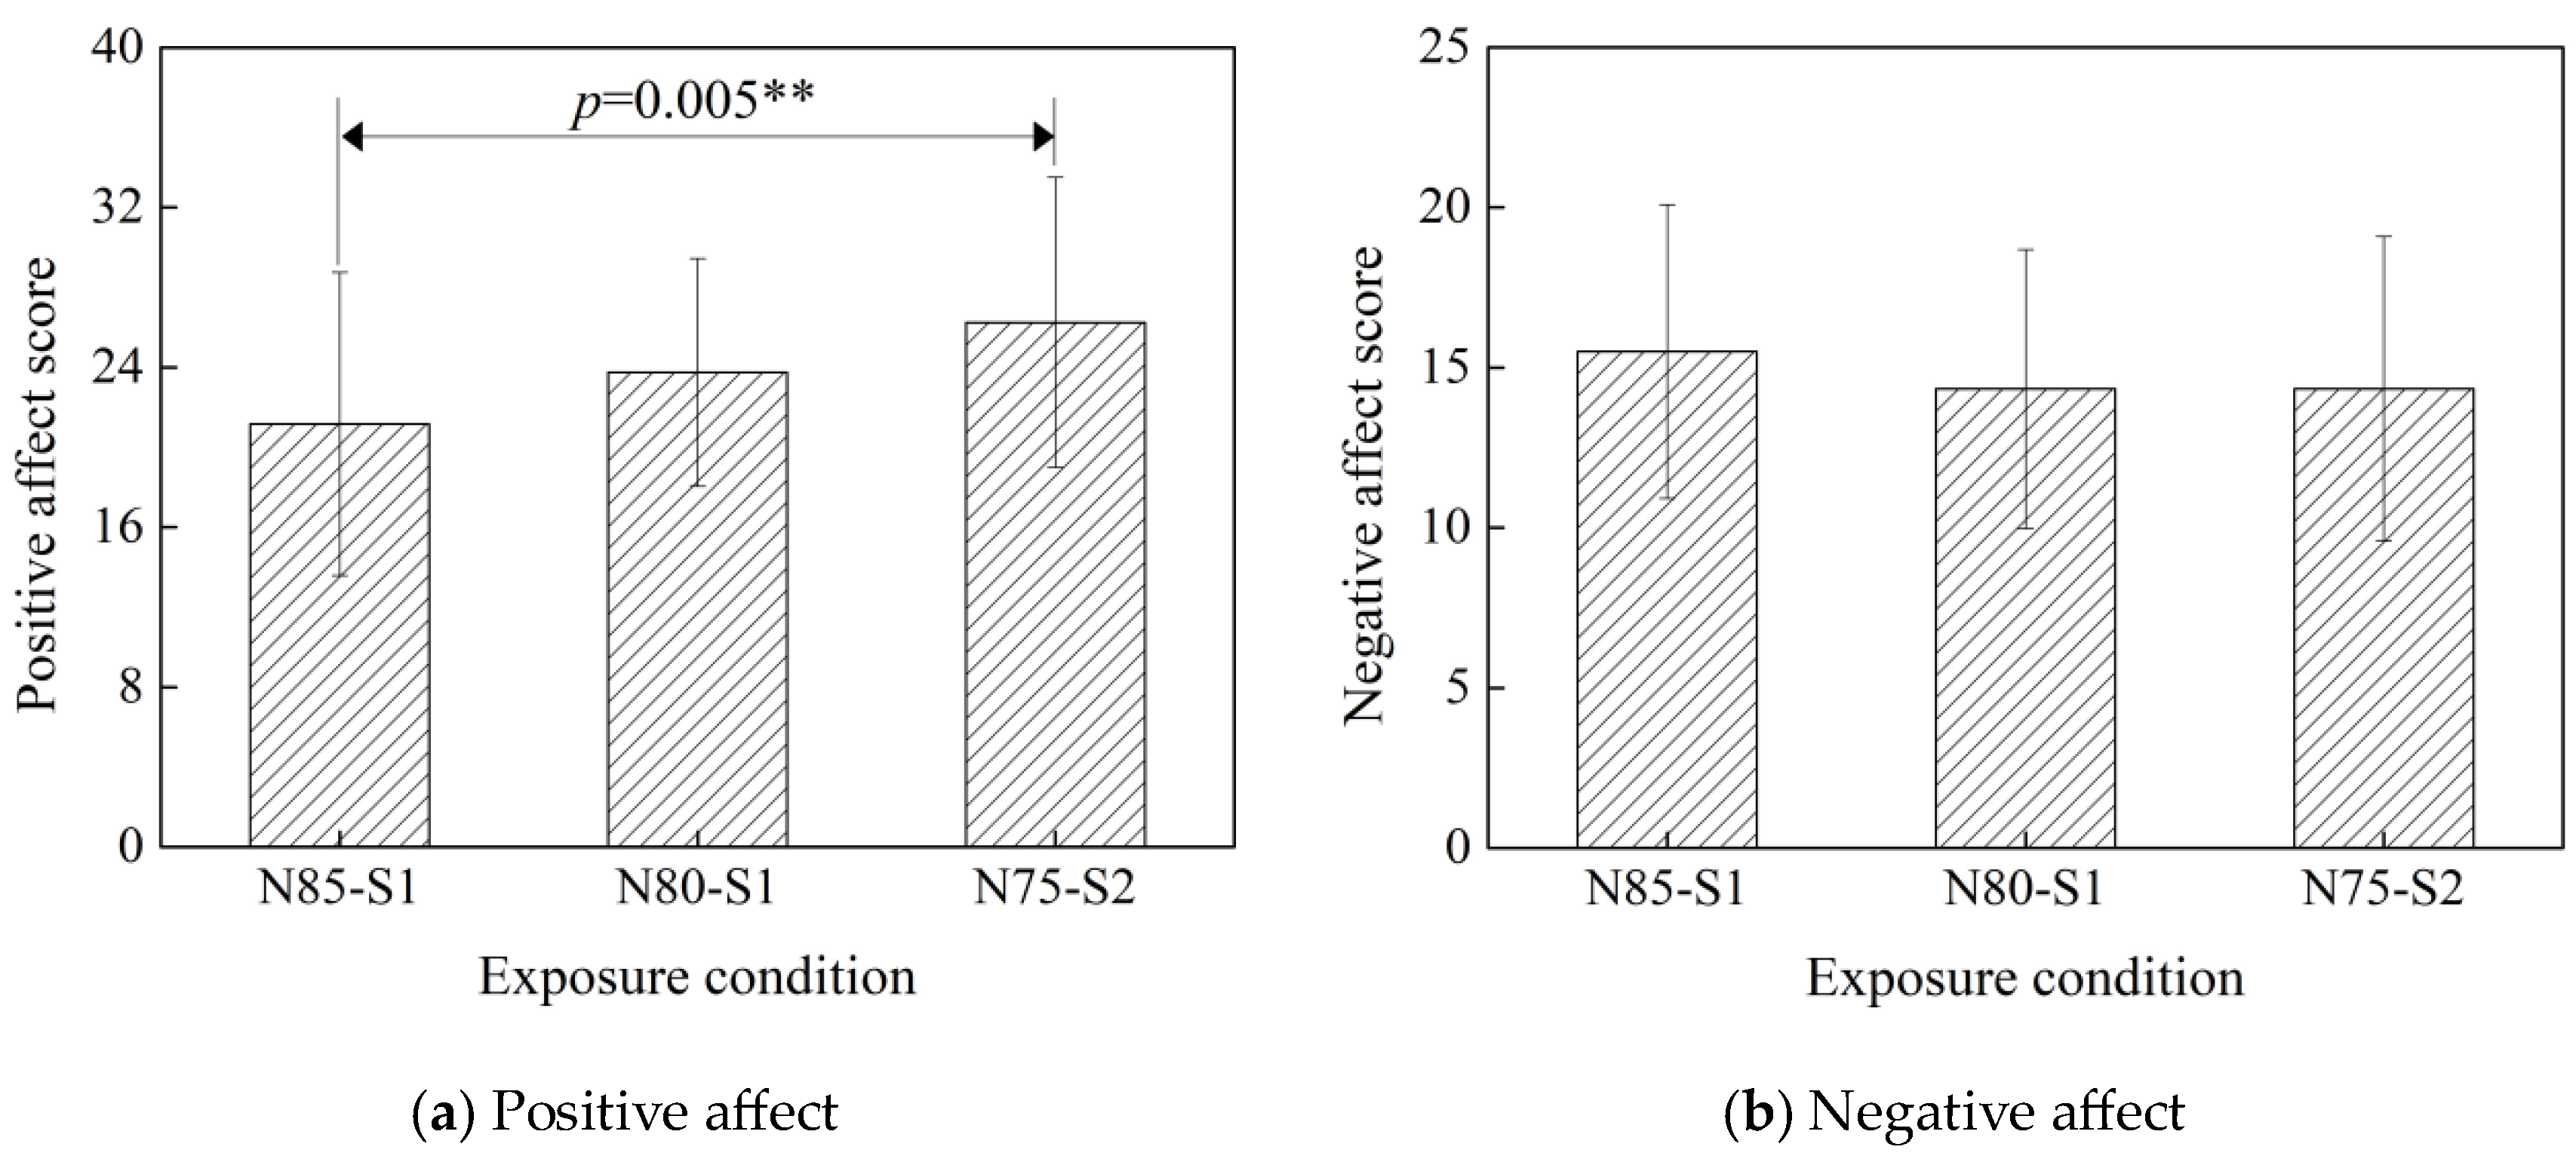
Figure 6.
GAMM results for the effect of noise on the performance metrics of the 2-back test, treating the subject as a random effect.
Figure 6.
GAMM results for the effect of noise on the performance metrics of the 2-back test, treating the subject as a random effect.
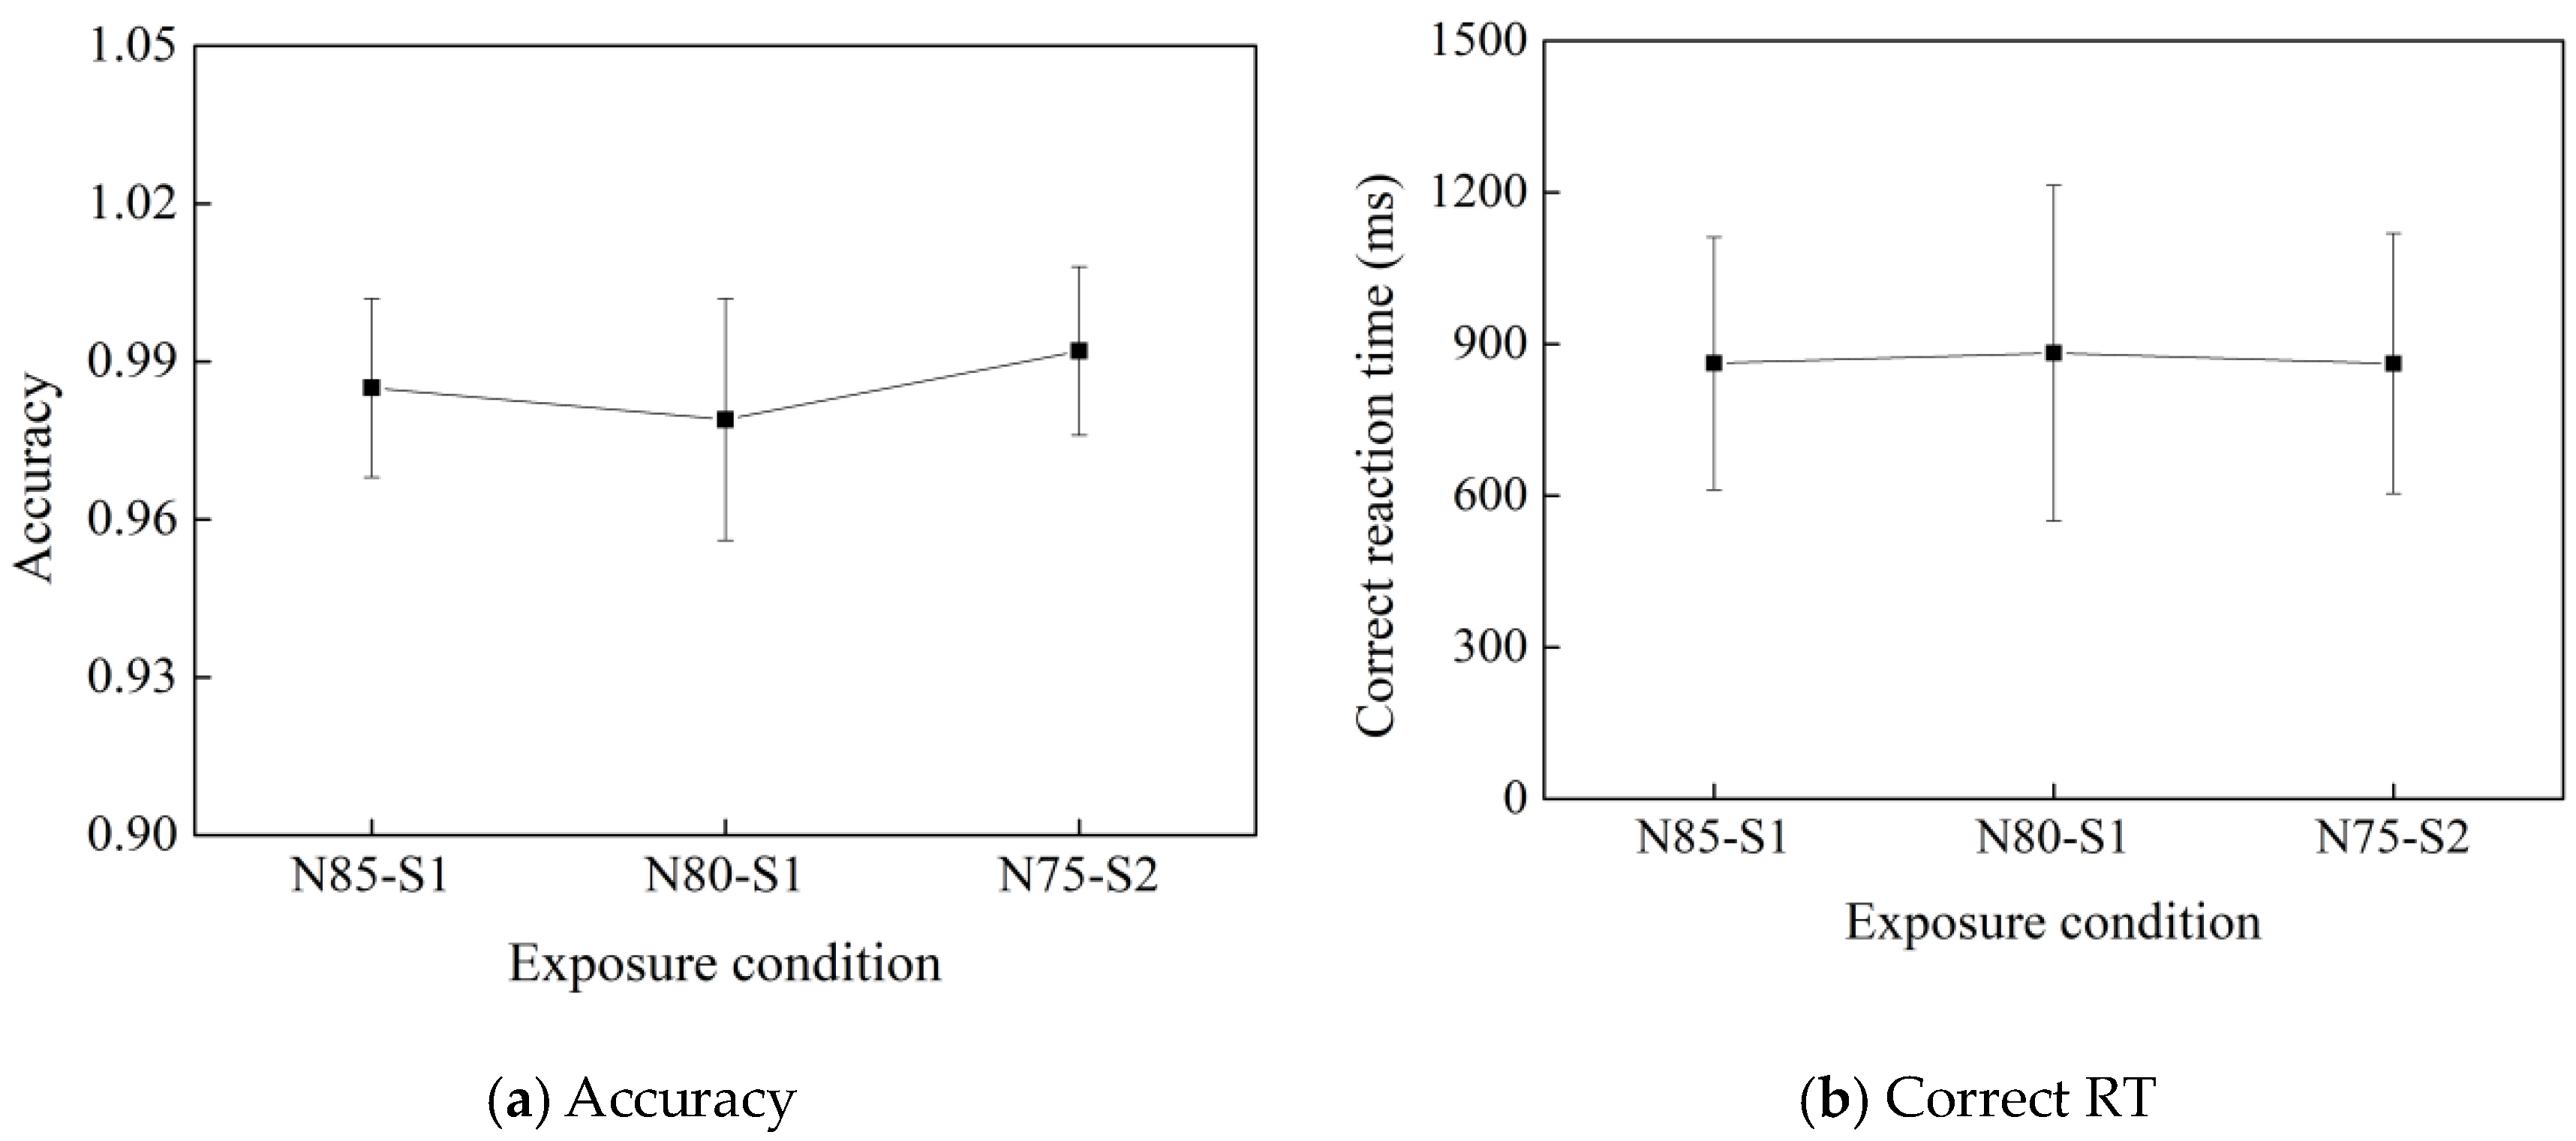
Figure 7.
GAMM results for the effect of noise on the performance metrics of the mental arithmetic test, treating the subject as a random effect.
Figure 7.
GAMM results for the effect of noise on the performance metrics of the mental arithmetic test, treating the subject as a random effect.

Figure 8.
GAMM results for the effect of noise on the thresholds of auditory tests, treating the subject as a random effect. # (p < 0.1), * (p < 0.05), ** (p < 0.01).
Figure 8.
GAMM results for the effect of noise on the thresholds of auditory tests, treating the subject as a random effect. # (p < 0.1), * (p < 0.05), ** (p < 0.01).
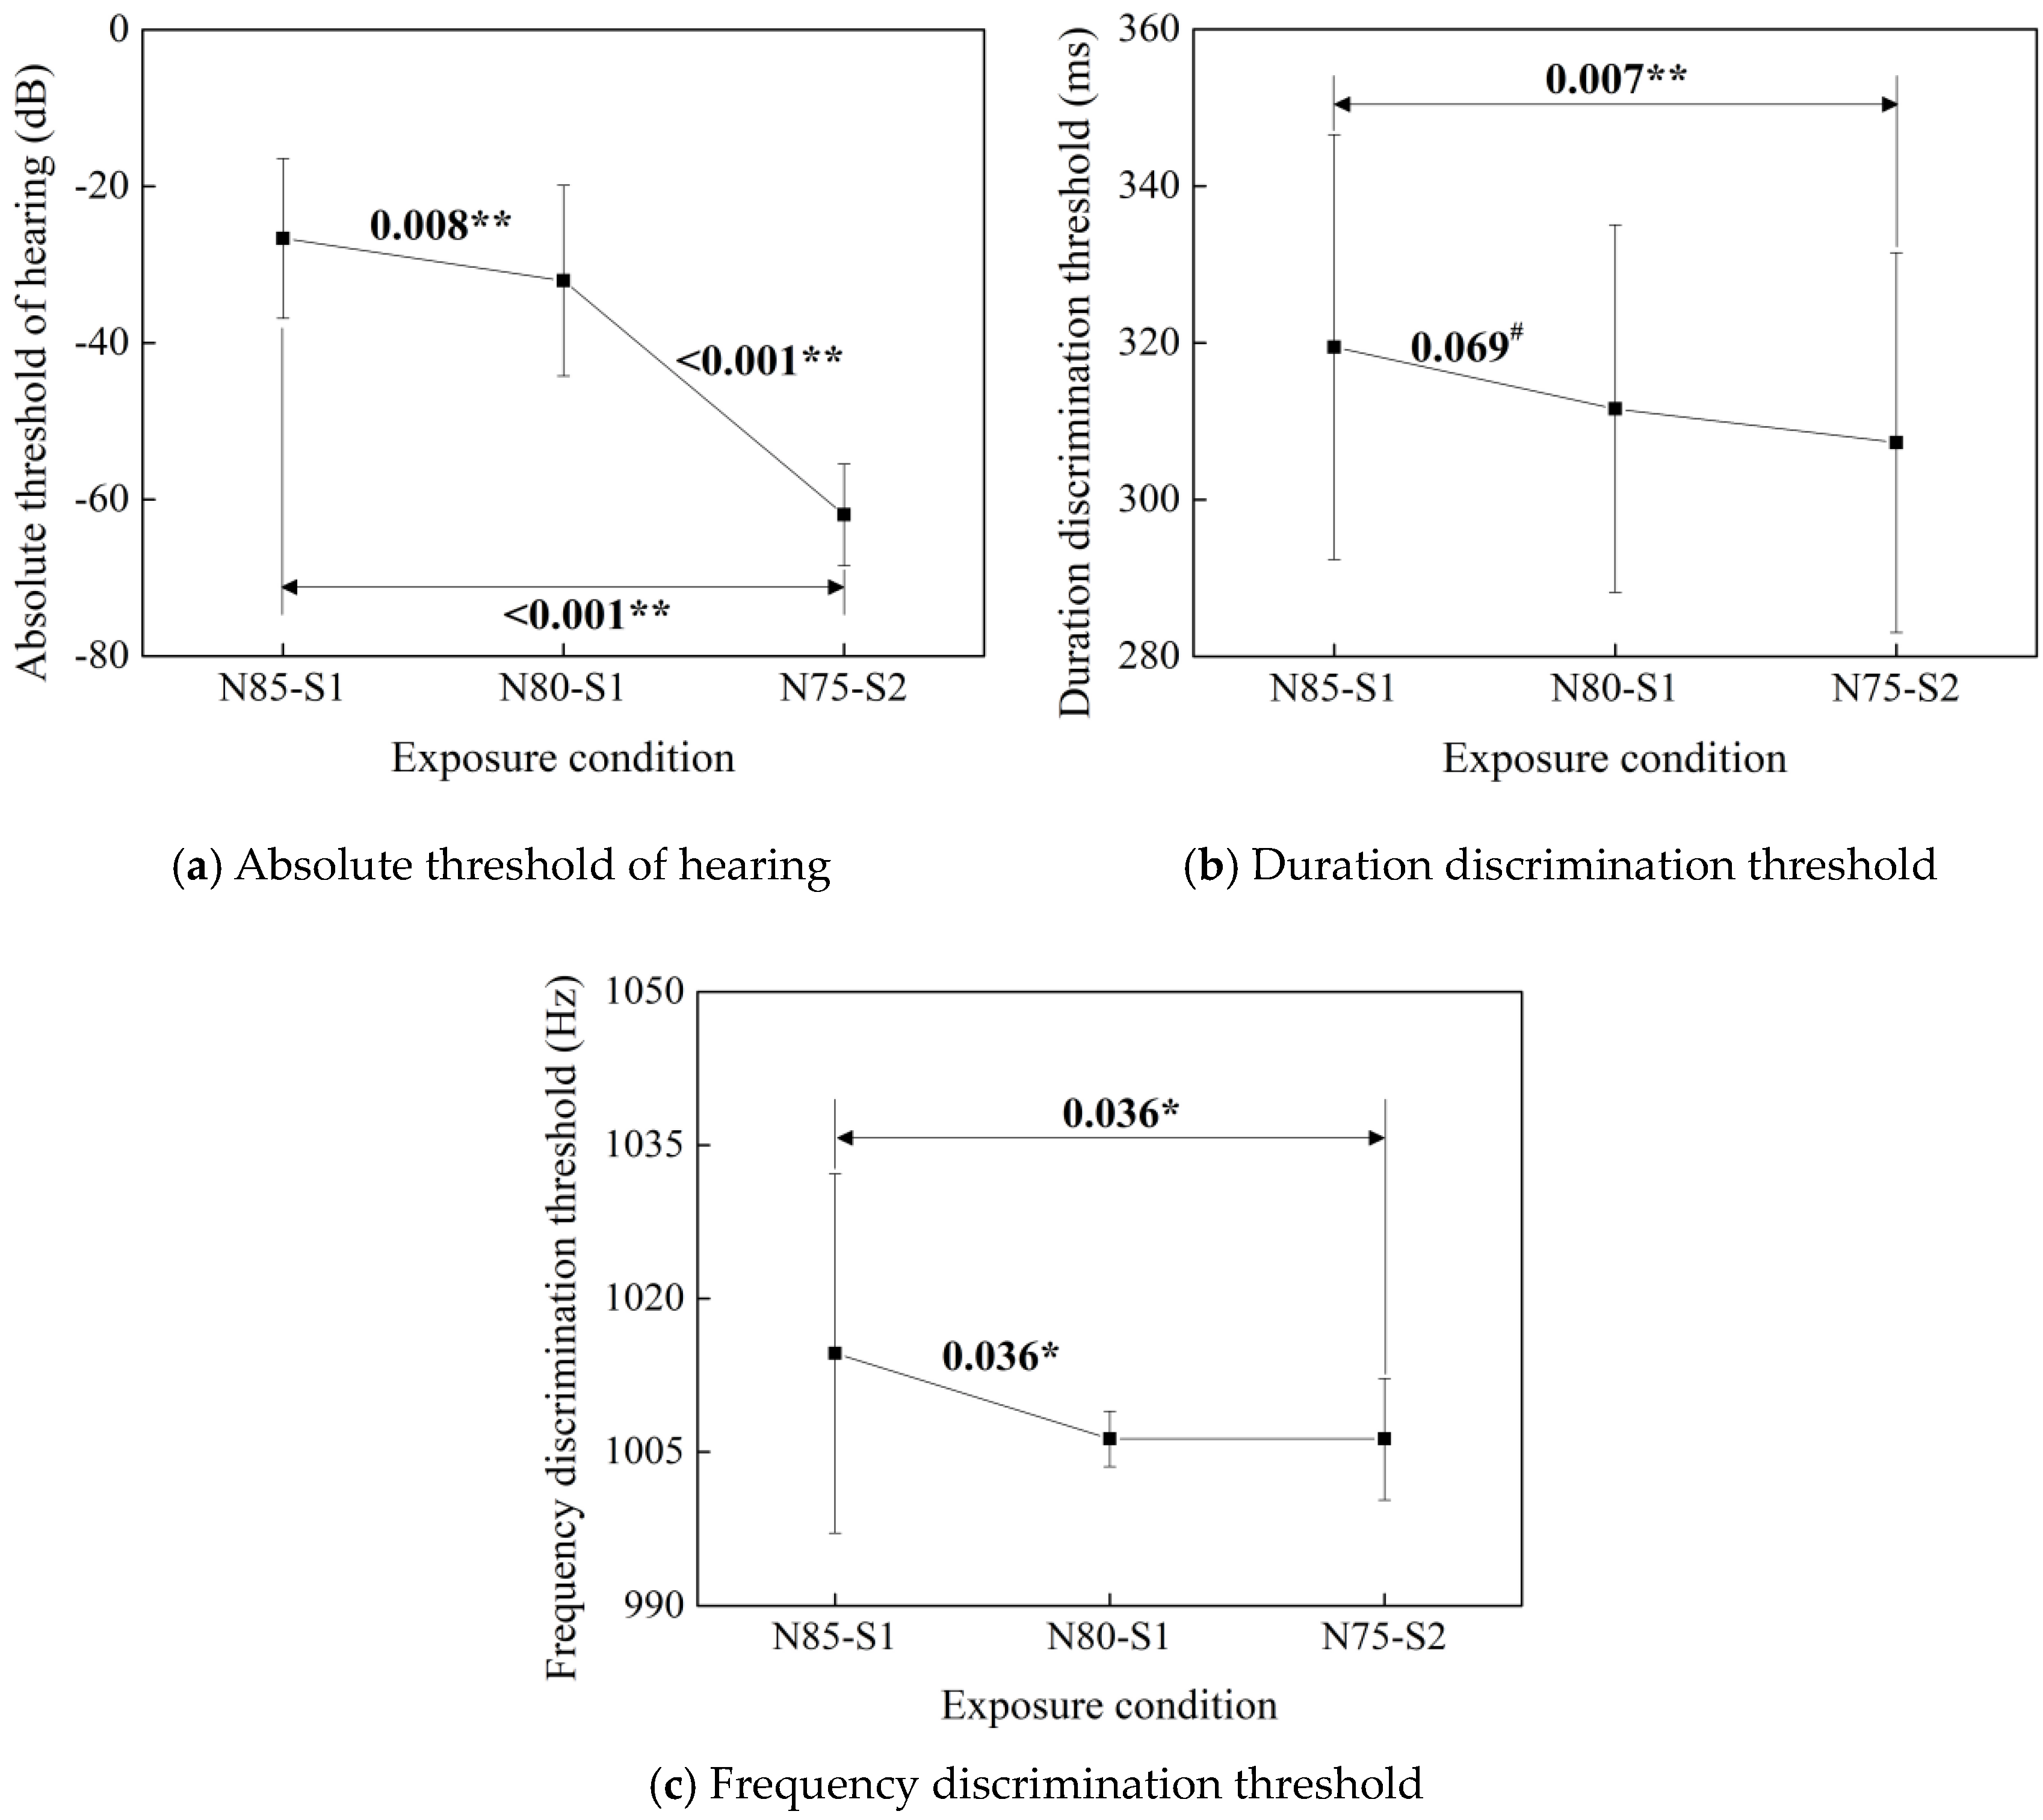
Figure 9.
GAMM results for the effect of noise on the performance metrics of the PVT test, treating the subject as a random effect. # (p < 0.1), * (p < 0.05).
Figure 9.
GAMM results for the effect of noise on the performance metrics of the PVT test, treating the subject as a random effect. # (p < 0.1), * (p < 0.05).
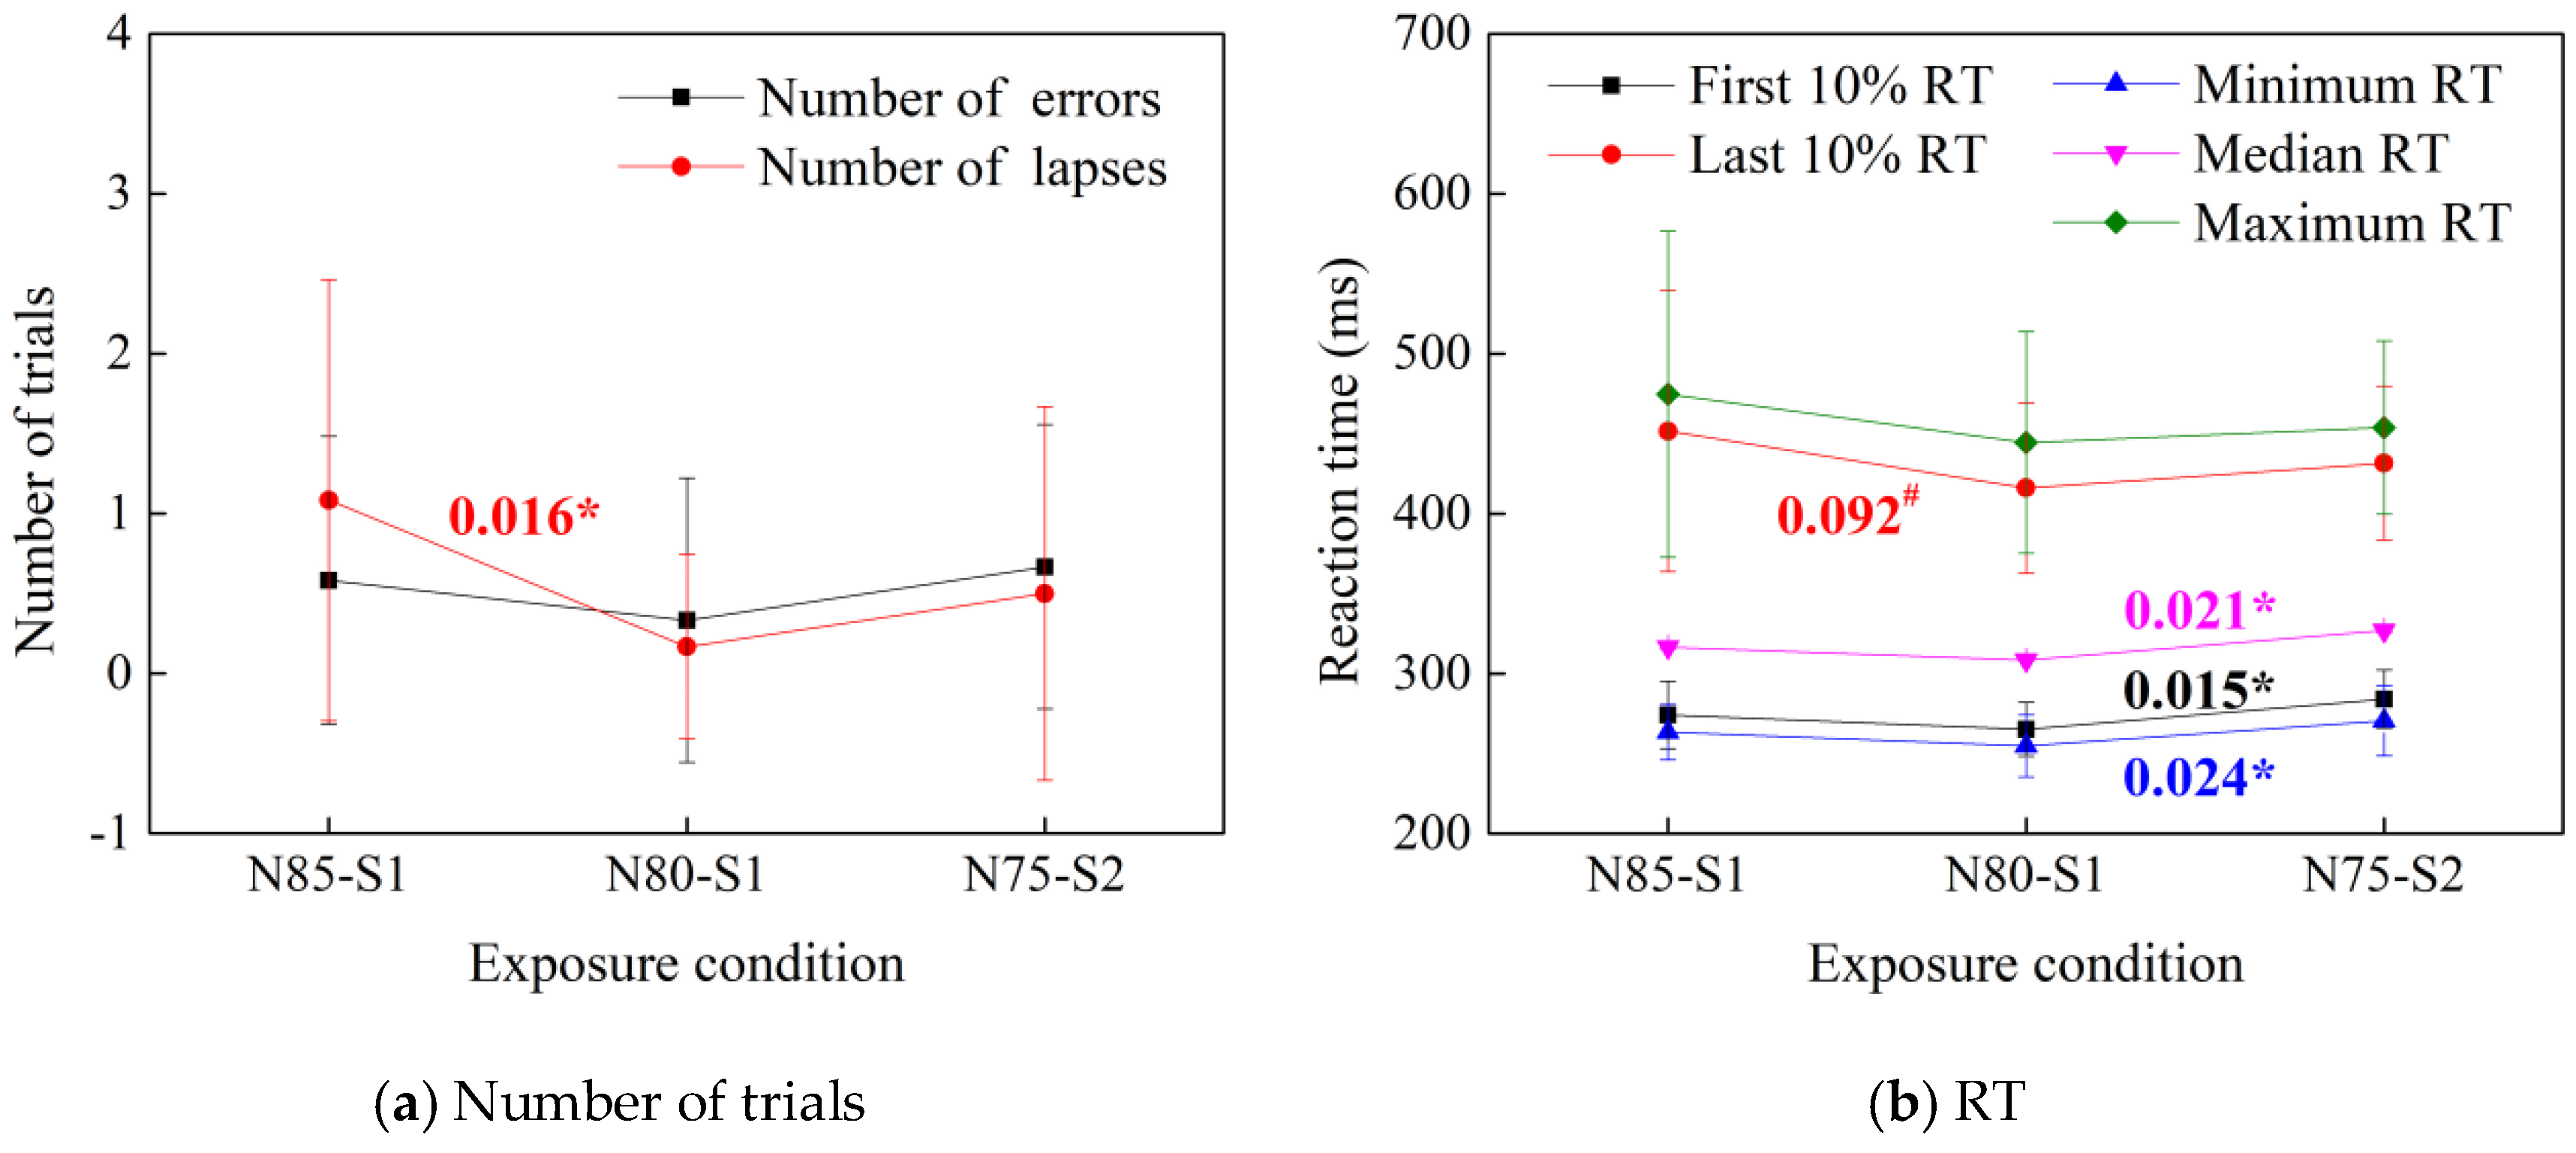

Figure 10.
GAMM results for the effect of noise on the performance metrics of the Stroop test, treating the subject as a random effect. # (p < 0.1), * (p < 0.05).
Figure 10.
GAMM results for the effect of noise on the performance metrics of the Stroop test, treating the subject as a random effect. # (p < 0.1), * (p < 0.05).

Figure 12.
PLS-SEM analysis of variables after Z-score normalization (final revised path model with significant standardized regression estimates). Standardized estimates: SRMR = 0.121, NFI = 0.700, and RMS-theta = 0.250.
Figure 12.
PLS-SEM analysis of variables after Z-score normalization (final revised path model with significant standardized regression estimates). Standardized estimates: SRMR = 0.121, NFI = 0.700, and RMS-theta = 0.250.
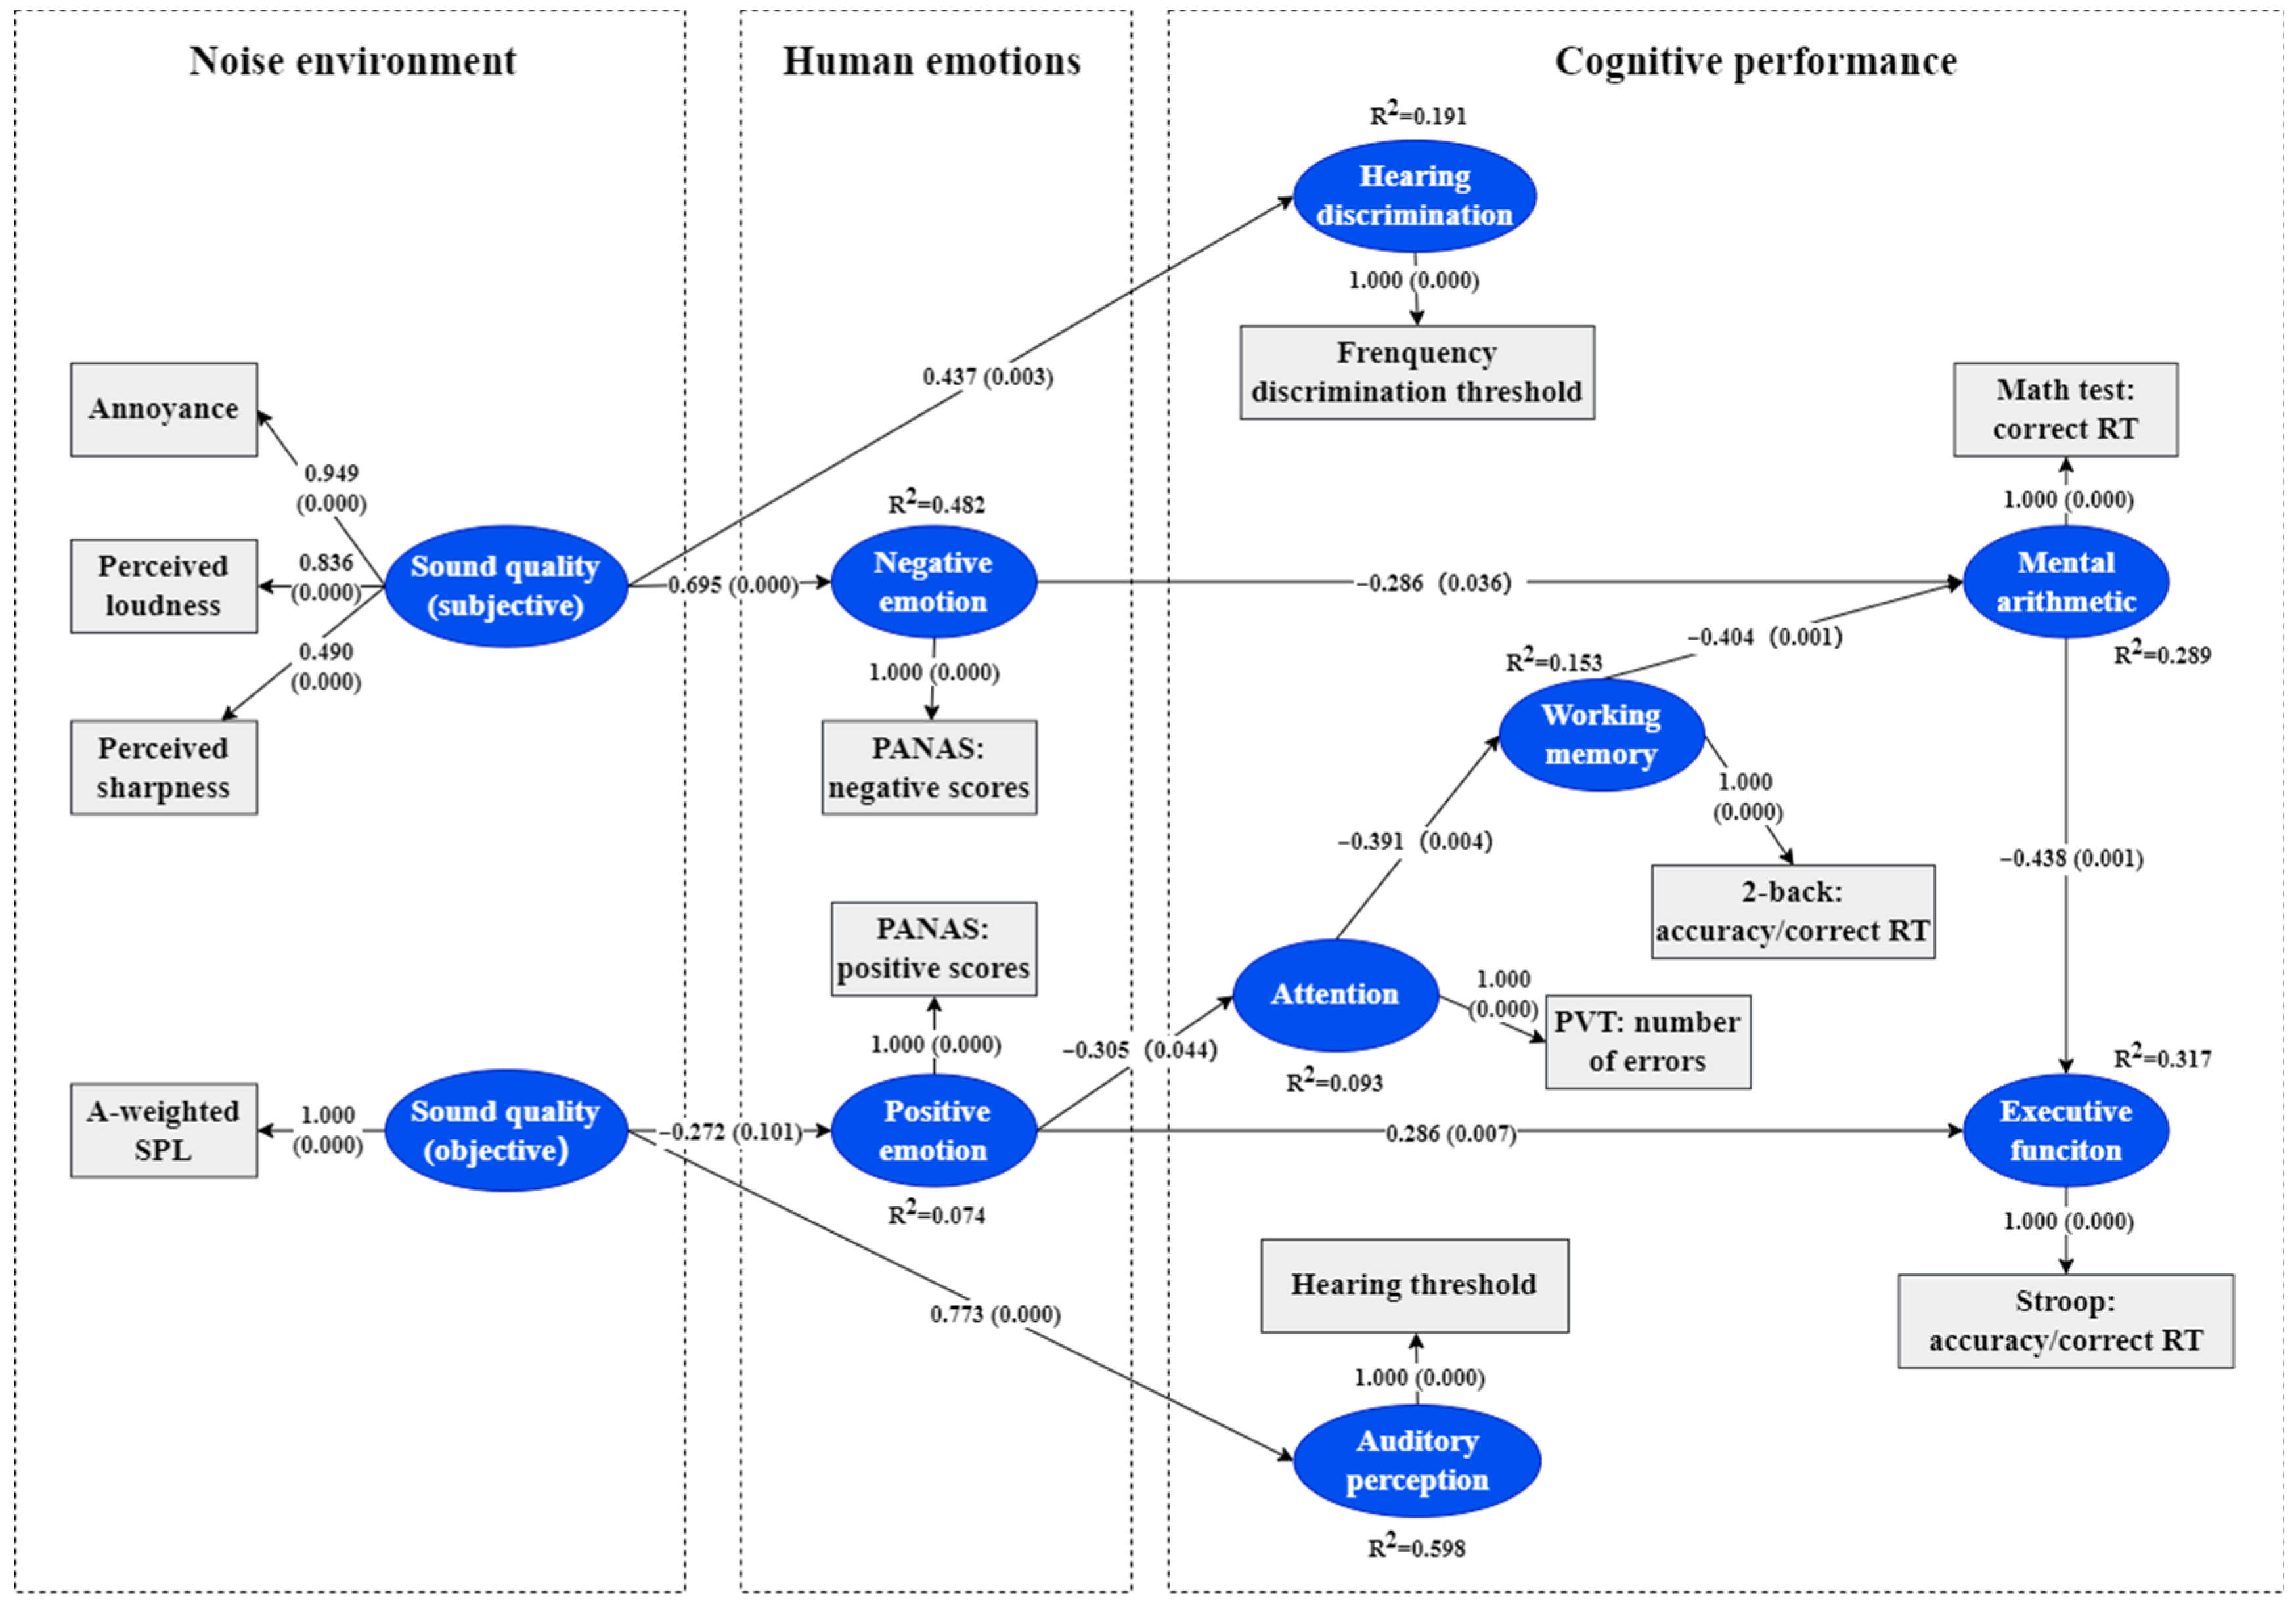
Table 1.
Environment parameters under the three noise conditions.
| Parameters | N85-S1 | N80-S1 | N75-S2 | N85-S1 | N80-S1 | N75-S2 | N85-S1 | |
|---|---|---|---|---|---|---|---|---|
| Acoustic environment | A-weighted SPL (dBA) | 84.235 ± 0.788 | 78.310 ± 0.729 | 74.960 ± 0.809 | 84.235 ± 0.788 | 78.310 ± 0.729 | 74.960 ± 0.809 | 84.235 ± 0.788 |
| Sharpness (acum) | 1.281 ± 0.028 | 1.297 ± 0.027 | 2.418 ± 0.036 | 1.281 ± 0.028 | 1.297 ± 0.027 | 2.418 ± 0.036 | 1.281 ± 0.028 | |
| Thermal environment | Air temperature (°C) | 20.862 ± 0.628 | 21.042 ± 0.641 | 21.077 ± 0.572 | 20.862 ± 0.628 | 21.042 ± 0.641 | 21.077 ± 0.572 | 20.862 ± 0.628 |
| Relative humidity (%) | 26.483 ± 8.143 | 28.957 ± 7.507 | 24.702 ± 5.354 | 26.483 ± 8.143 | 28.957 ± 7.507 | 24.702 ± 5.354 | 26.483 ± 8.143 | |
| Air velocity (m/s) | 0.123 ± 0.005 | 0.126 ± 0.010 | 0.123 ± 0.005 | 0.123 ± 0.005 | 0.126 ± 0.010 | 0.123 ± 0.005 | 0.123 ± 0.005 | |
| Black global temperature (°C) | 21.085 ± 0.567 | 21.243 ± 0.608 | 21.332 ± 0.475 | 21.085 ± 0.567 | 21.243 ± 0.608 | 21.332 ± 0.475 | 21.085 ± 0.567 | |
| Thermal sensation vote | −0.367 ± 0.863 | −0.350 ± 0.820 | −0.271 ± 0.827 | −0.367 ± 0.863 | −0.350 ± 0.820 | −0.271 ± 0.827 | −0.367 ± 0.863 | |
Table 2.
Performance metrics of cognitive tests.
| Cognitive Ability | Test | Performance Metric (Unit) |
|---|---|---|
| Perception | Hearing threshold test Duration discrimination test Frequency discrimination test | Hearing threshold (dB) Duration discrimination threshold (ms) Frequency discrimination threshold (Hz) |
| Attention | PVT test | First 10% RT (ms) Last 10% RT (ms) Minimum RT (ms) Median RT (ms) Maximum RT (ms) Number of errors Number of lapses Reaction speed (1/s) Index of PVT (1/s) |
| Working memory | 2-back test | Accuracy (%) Correct RT (ms) |
| Mental arithmetic | Mental arithmetic test | Accuracy (%) Correct RT (ms) |
| Executive function | Stroop test | Accuracy (%) Correct RT (ms) Accuracy of consistent trials (%) Correct RT of consistent trials (ms) Accuracy of inconsistent trials (%) Correct RT of inconsistent trials (ms) |
Disclaimer/Publisher’s Note: The statements, opinions and data contained in all publications are solely those of the individual author(s) and contributor(s) and not of MDPI and/or the editor(s). MDPI and/or the editor(s) disclaim responsibility for any injury to people or property resulting from any ideas, methods, instructions or products referred to in the content. |
© 2024 by the authors. Licensee MDPI, Basel, Switzerland. This article is an open access article distributed under the terms and conditions of the Creative Commons Attribution (CC BY) license (https://creativecommons.org/licenses/by/4.0/).
Share and Cite
MDPI and ACS Style
Zhang, J.; Pang, L.; Yang, C.; Fan, Y.; Zhao, B.; Cao, X. Experimental Evaluation of Noise Exposure Effects on Subjective Perceptions and Cognitive Performance. Buildings 2024, 14, 1100. https://doi.org/10.3390/buildings14041100
AMA Style
Zhang J, Pang L, Yang C, Fan Y, Zhao B, Cao X. Experimental Evaluation of Noise Exposure Effects on Subjective Perceptions and Cognitive Performance. Buildings. 2024; 14(4):1100. https://doi.org/10.3390/buildings14041100
Chicago/Turabian StyleZhang, Jie, Liping Pang, Chenyuan Yang, Yurong Fan, Bingxu Zhao, and Xiaodong Cao. 2024. "Experimental Evaluation of Noise Exposure Effects on Subjective Perceptions and Cognitive Performance" Buildings 14, no. 4: 1100. https://doi.org/10.3390/buildings14041100
Note that from the first issue of 2016, this journal uses article numbers instead of page numbers. See further details here.